the asia steel import market - latest oil, energy & metals ... · rebar stainless regions...
TRANSCRIPT

The Asia Steel Import Market
2
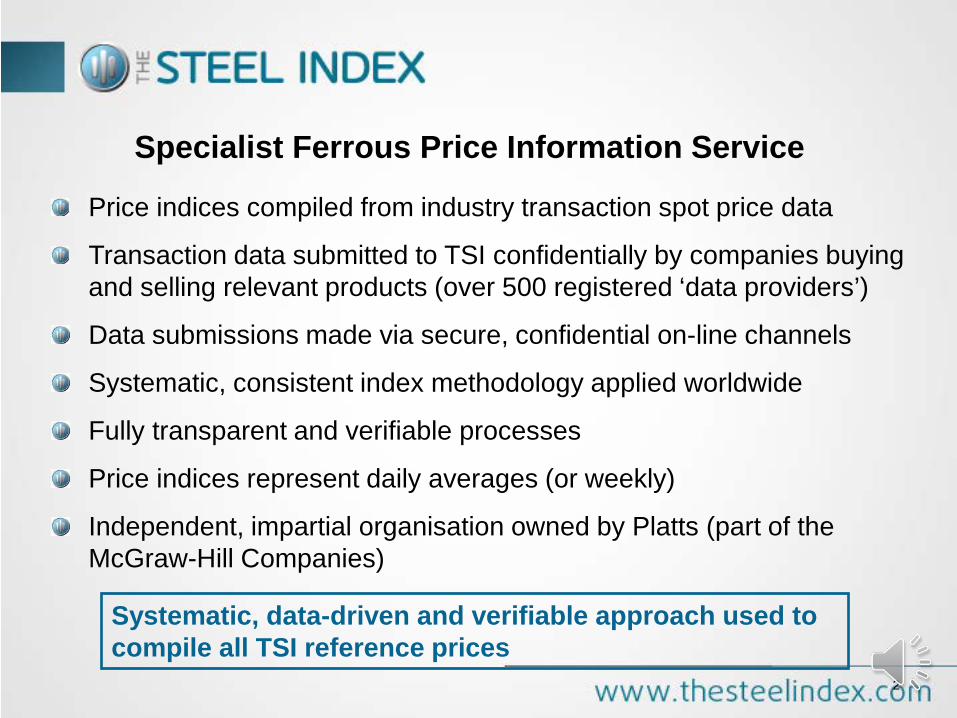
Price indices compiled from industry transaction spot price data
Transaction data submitted to TSI confidentially by companies buying and selling relevant products (over 500 registered ‘data providers’)
Data submissions made via secure, confidential on-line channels
Systematic, consistent index methodology applied worldwide
Fully transparent and verifiable processes
Price indices represent daily averages (or weekly)
Independent, impartial organisation owned by Platts (part of the McGraw-Hill Companies)
Systematic, data-driven and verifiable approach used to compile all TSI reference prices
Specialist Ferrous Price Information Service
/3
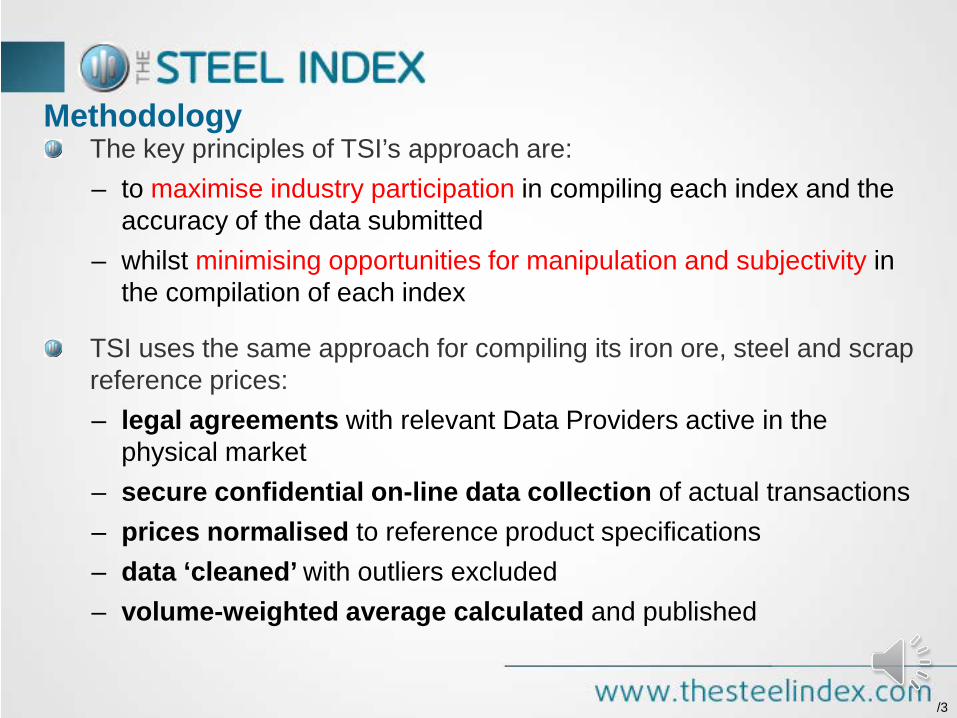
The key principles of TSI’s approach are: – to maximise industry participation in compiling each index and the
accuracy of the data submitted – whilst minimising opportunities for manipulation and subjectivity in
the compilation of each index
TSI uses the same approach for compiling its iron ore, steel and scrap reference prices: – legal agreements with relevant Data Providers active in the
physical market – secure confidential on-line data collection of actual transactions – prices normalised to reference product specifications – data ‘cleaned’ with outliers excluded – volume-weighted average calculated and published
Methodology

CONFIDENTIALITY AGREEMENT
Transaction Data Sample
Step1 Step2
Outliers excluded
Prices Normalized
Publish TSI Reference Prices
Final Data Set
Step3
Volume- weighted averages calculated
Buy/Sell balance
Step4
Submits price data to TSI using secure online system
The Steel Index
Data Provider

Steel Hot rolled coil* Cold rolled coil HDG coil Plate Rebar Stainless Regions covered
USA Asia Northern Europe* Southern Europe* Turkey India (coming soon)
Iron Ore 62% Fe Fines* 58% Fe Fines* 63/63.5% Fe Fines* 62% Fe (2% Al) Fines*
Scrap HMS 1&2 (80:20)* Shredded
Regions covered
Chinese imports*
Regions covered
Turkish imports* USA Indian imports Asia (coming soon)
• Daily Indices Basis for cleared derivatives contracts
: Ferrous Coverage

Presentation Overview 1. Volatility in Steel and Prices 2. Trend on China Crude Steel production 3. China’s Steel Exports Destination
• North Asia • South East Asia

Volatility in Steel and Prices
0
20
40
60
80
100
120
140
160
180
200
400
450
500
550
600
650
700
750
Nov
08
Dec
08Ja
n 09
Feb
09M
ar 0
9Ap
r 09
May
09
Jun
09Ju
l 09
Aug
09Se
p 09
Oct
09
Nov
09
Dec
09Ja
n 10
Feb
10M
ar 1
0Ap
r 10
May
10
Jun
10Ju
l 10
Aug
10Se
p 10
Oct
10
Nov
10
Dec
10Ja
n 11
Feb
11M
ar 1
1Ap
r 11
May
11
Jun
11Ju
l 11
Aug
11Se
p 11
Oct
11
Nov
11
Dec
11Ja
n 12
Feb
12M
ar 1
2Ap
r 12
May
12
Jun
12Ju
l 12
Aug
12Se
p 12
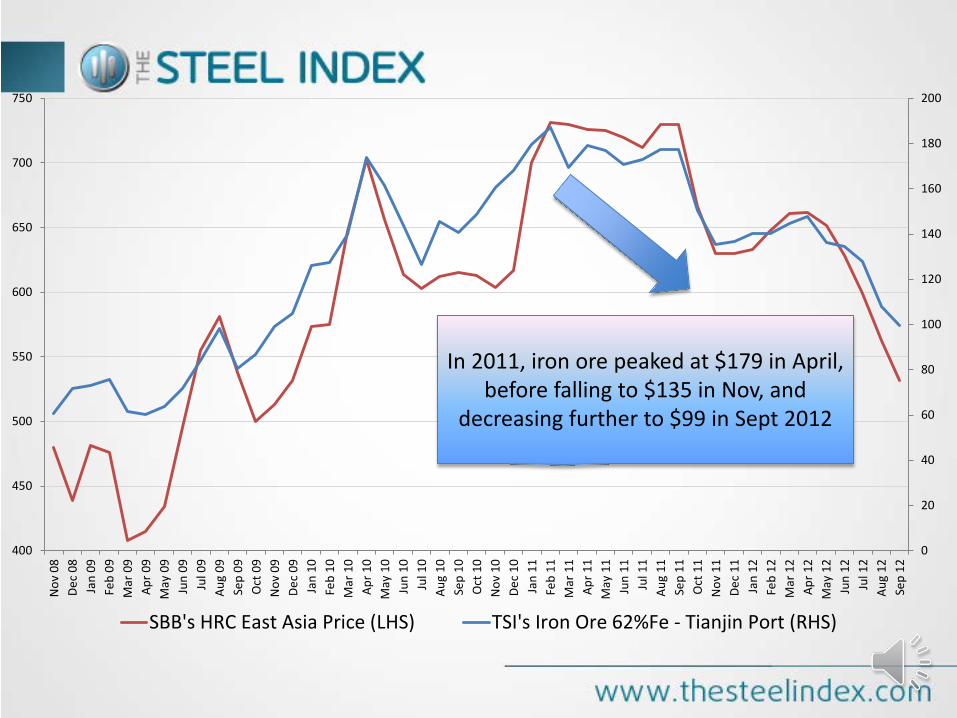
SBB's HRC East Asia Price (LHS) TSI's Iron Ore 62%Fe - Tianjin Port (RHS)
In 2011, iron ore peaked at $179 in April, before falling to $135 in Nov, and
decreasing further to $99 in Sept 2012

Asia’s HRC Price
500
550
600
650
700
750
Sep 11 Oct 11 Nov 11 Dec 11 Jan 12 Feb 12 Mar 12 Apr 12 May 12 Jun 12 Jul 12 Aug 12 Sep 12
SBB's East Asia CFR TSI's Asean Import CFR TSI's Chinese Export FOB

Oversupply of Steel from China?

Source: WSA
Crude Steel Production 2012
0
10,000
20,000
30,000
40,000
50,000
60,000
70,000
Jan Feb Mar Apr May Jun Jul Aug
China India Japan South Korea Taiwan, China
Thousand ton

0
100000
200000
300000
400000
500000
600000
700000
800000
2001 2002 2003 2004 2005 2006 2007 2008 2009 2010 2011
China
China’s Crude Steel Production
Leading to greater oversupply of steel product in the market

China’s Steel Exports Destination

China’s Steel Export Destinations in Jan – Aug 2012
Asia 58%
Middle East 10%
Africa 6%
EU27 7%
Non-EU Europe 2%
Americas 15%
Oceania 2%
Source: SBB
Asia will continue to become China biggest steel export market

0.0
2,000.0
4,000.0
6,000.0
8,000.0
10,000.0
12,000.0
14,000.0
16,000.0
18,000.0
20,000.0
2008 2009 2010 2011 Jan - Aug2012
South East Asia (Asean)South AsiaNorth Asia
China’s Steel Exports
Asia 2010 (thousand ton)
2011 (thousand ton)
% Change
South East Asia (ASEAN) 8284.3 9570 15.53
South Asia 4120.7 3253.1 -21.05
North Asia 11313.8 13496.9 19.30
Thousand ton
Source: SBB
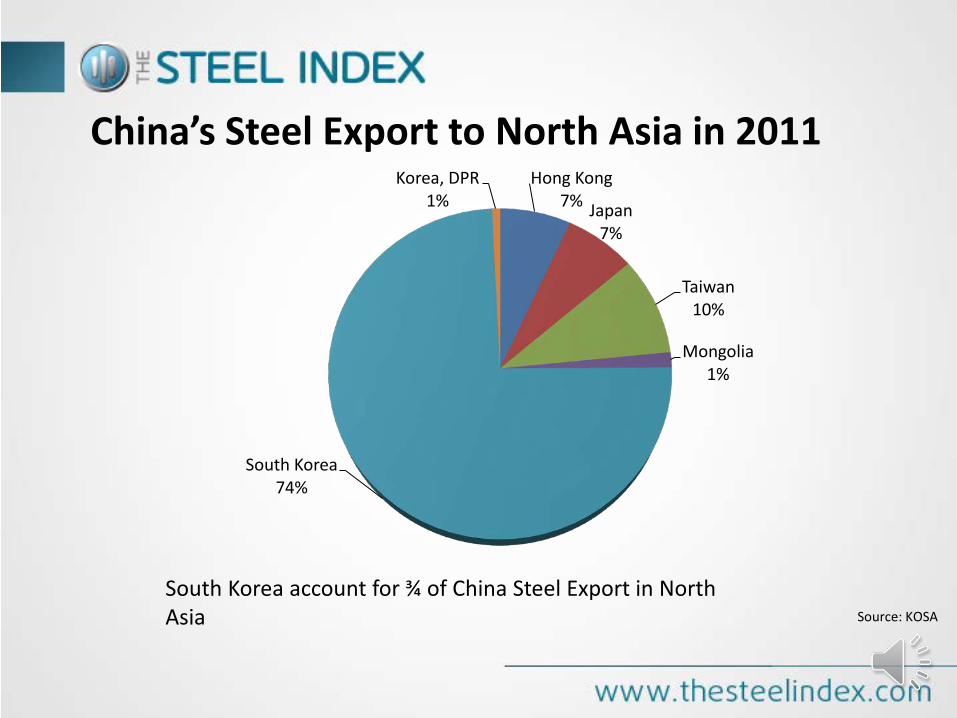
Hong Kong 7% Japan
7%
Taiwan 10%
Mongolia 1%
South Korea 74%
Korea, DPR 1%
China’s Steel Export to North Asia in 2011
Source: KOSA
South Korea account for ¾ of China Steel Export in North Asia

China 46%
Japan 40%
Taiwan 3%
Ukraine 2%
Russia 1%
Brazil 4%
Australia 2%
Mexico 2%
South Korea’s Steel Imports in 2011
Huge demand for Steel Products

South Korea’s Steel Export Volume
0
500
1000
1500
2000
2500
3000
3500
4000
4500
5000
2010 2011
Thousand ton
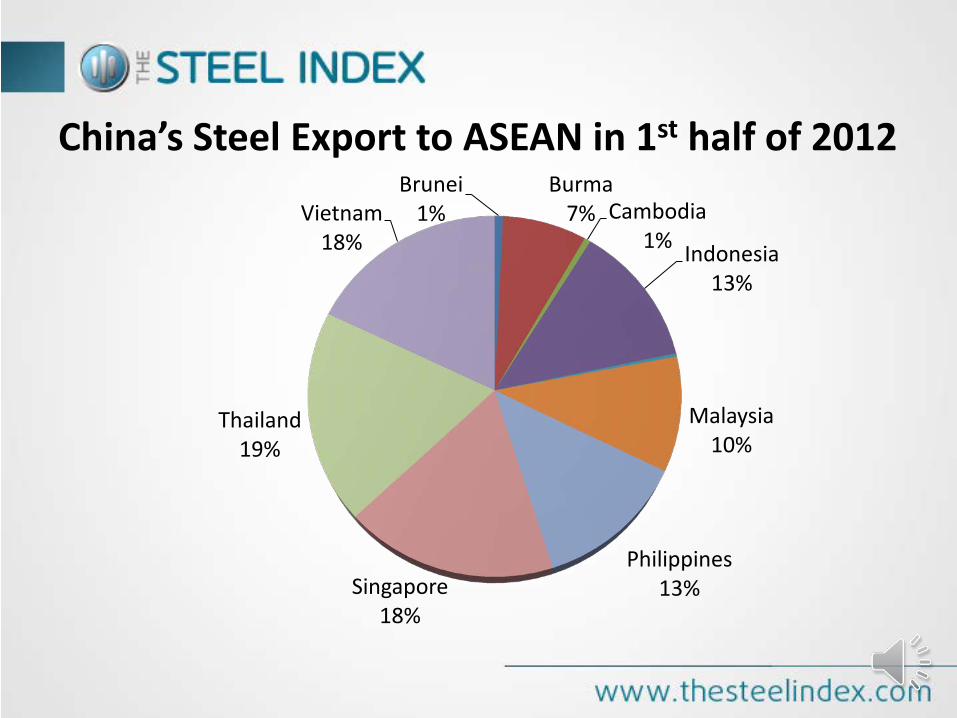
Brunei 1%
Burma 7% Cambodia
1% Indonesia 13%
Malaysia 10%
Philippines 13% Singapore
18%
Thailand 19%
Vietnam 18%
China’s Steel Export to ASEAN in 1st half of 2012

Vietnam’s Import and Export Volume
0
1
2
3
4
5
6
7
8
2010 2011
Import Quantity Export Quantity
Source : VSA

No Company Name Quantity (Metric ton)
1 Posco Vietnam Coil Center 510,678.96 2 Lotus Steel 154,890.95 3 Sun Steel Vietnam 88,809.89 4 Seah Pipe Vietnam 64,756.60 5 Viet Nga Steel 36,626.70 6 Vietnam Steel 35,681.03 7 IPC 29,529.09 8 Nam Kim Steel 25,467.06 9 SMC 21,738.84
10 Hoa Phat Steel 19,299.27
Top 10 Companies importing HRC in Vietnam 2011
Summary • The average TSI ‘s Asean HRC price for year 2012 will be lower than
2011, with the weak demand in the ASEAN Market. • Asia will continue to be the China’s biggest Export market, I forecast
South Korea and Vietnam to be the biggest steel importer in North Asia and South East Asia respectively in the coming years.
• With the recent approval from the Chinese government on the
infrastructure projects, this will achieve sustained and stable growth for China.
Challenges in the Steel Industry
- Raw material and Finished Steel price volatility - Anti Dumping and Protectionism - Exchange rate risk - Pollution to the environment in steel making process - Ability to adjust capacity utilization in respond to changing
market conditions

Why change ferrous pricing mechanisms?
• Companies buying on a spot-basis alone are therefore subject to wide price movement risk.
• The last one year (Sept 2011 –Sept 2012) has seen ASEAN HRC import prices move in a range of US$205/t.
• Some forms of response to these market conditions have been seen: • Vertical integration • Indexing • Derivatives/ Swaps Use
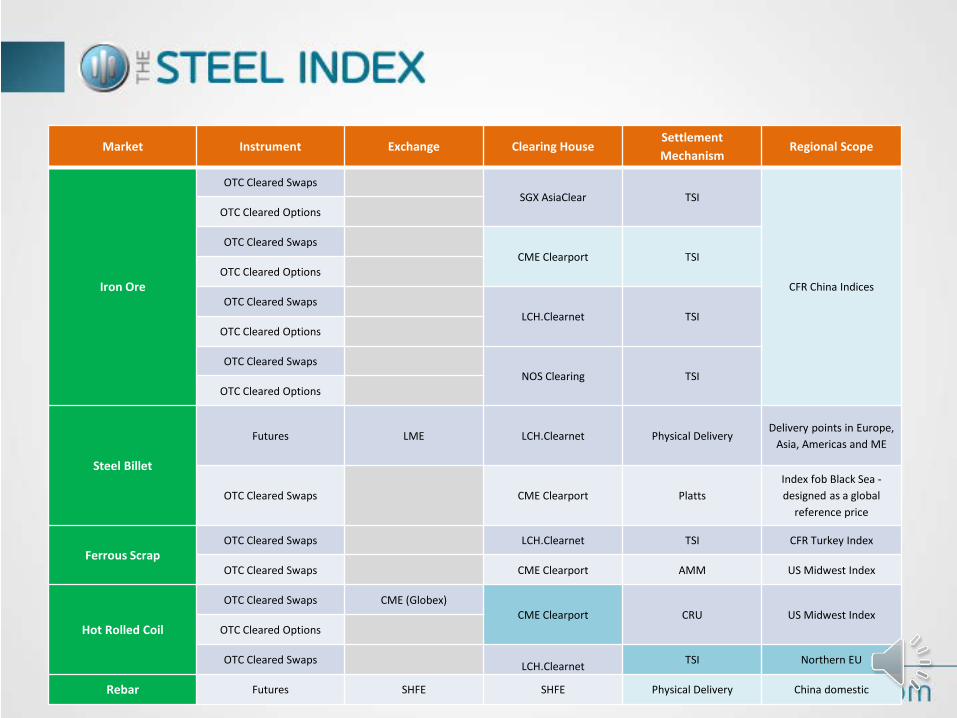
Market Instrument Exchange Clearing House Settlement Mechanism
Regional Scope
Iron Ore
OTC Cleared Swaps SGX AsiaClear TSI
CFR China Indices
OTC Cleared Options
OTC Cleared Swaps CME Clearport TSI
OTC Cleared Options
OTC Cleared Swaps LCH.Clearnet TSI
OTC Cleared Options
OTC Cleared Swaps NOS Clearing TSI
OTC Cleared Options
Steel Billet
Futures LME LCH.Clearnet Physical Delivery Delivery points in Europe,
Asia, Americas and ME
OTC Cleared Swaps CME Clearport Platts Index fob Black Sea - designed as a global
reference price
Ferrous Scrap OTC Cleared Swaps LCH.Clearnet TSI CFR Turkey Index
OTC Cleared Swaps CME Clearport AMM US Midwest Index
Hot Rolled Coil
OTC Cleared Swaps CME (Globex) CME Clearport CRU US Midwest Index
OTC Cleared Options
OTC Cleared Swaps LCH.Clearnet TSI Northern EU
Rebar Futures SHFE SHFE Physical Delivery China domestic

This document does not constitute an offer or solicitation to buy or sell any investment product(s). It does not take into account the specific investment objectives, financial situation or particular needs of any person. Investors should seek advice from a financial adviser before investing in any investment products or adopting any investment strategies. In the event that the investor chooses not to seek advice from a financial adviser, he/she should consider whether the product in question is suitable for him/her. The investment product(s) discussed herein are subject to significant investment risks, including the possible loss of the principal amount invested. Past performance of investment products is not necessarily a guide to future performance.
Unless expressly stated, we do not make any representations nor give any warranties in respect of the information contained in this presentation. To the extent permitted by the applicable law, we hereby exclude all warranties, conditions, representations or duties whatsoever and howsoever arising (whether express or implied) including but not limited to any representations or warranties as to the ownership of intellectual property or other rights in the presentation, or the satisfactory quality, merchantability or fitness for a particular purpose of, any goods or services referred to at any time in this presentation, any express or statutory warranties, and any warranties or duties regarding accuracy, timeliness, completeness, performance, availability, lack of negligence or of workmanlike effort.
To the fullest extent allowed by applicable law, you agree that we will not be liable to you or your business under any circumstances whatsoever (whether in contract, negligence or any other tort, breach of statutory duty or otherwise) for any loss of profits, income, business interruption, loss of business information or for increase in any costs, liabilities or expenses or any other loss whatsoever and however arising directly or indirectly out of or in connection with or relating to the information in this presentation and we shall not be liable for any loss, damages, costs, expenses or other liability which you incur or suffer as a result of your use of the information in this presentation.
We take all such steps as are reasonably necessary to provide information that is accurate and reliable, but exclude to the fullest extent permitted by law any liability for the inaccuracy of the information in this report.
The Steel Index (TSI) used all reasonable endeavours to certify the correctness of the information contained in this presentation.
Without limiting the above, you acknowledge and agree that we shall not be liable for matters beyond our reasonable control including but not limited to information gathered during field visits, third party information presented or the acts of third parties.
You understand and expressly agree that use of the information presented here is at your sole risk, that any content, material and/or data presented or verbalised or otherwise obtained through your use of the information in this presentation is at your own discretion and risk and that you will be solely responsible for any damage to you personally or your company or organization or business associates whatsoever which in any way results from the use, reliance or application of such content material and/or data and/or information.
All INFORMATION PRESENTED IN THIS REPORT IS AGREED TO BE CONFIDENTIAL AND CANNOT BE REPRODUCED WITHOUT THE EXPRESSED PERMISSION OF THE STEEL INDEX Disclaimer