the asset - hsbc€¦ · the market indices cnx nifty and bse sensex were up 5.6% & 6.2% ......
TRANSCRIPT

The Asset
Factsheet October 2017

Index
Fund Manager Commentary
HSBC Equity Fund
HSBC India Opportunities Fund
HSBC Midcap Equity Fund
HSBC Infrastructure Equity Fund
HSBC Tax Saver Equity Fund
HSBC Emerging Markets Fund
HSBC Brazil Fund
HSBC Managed Solutions India - Growth
HSBC Managed Solutions India - Moderate
HSBC Managed Solutions India - Conservative
Fund Managers - Equity
Fund Manager Wise Comparative Performance of Equity Schemes
HSBC Monthly Income Plan
HSBC Dynamic Fund
HSBCAsia Pacific (Ex Japan) Dividend Yield Fund
HSBC Income Fund - Investment Plan
HSBC Income Fund - Short Term Plan
HSBC Cash Fund
HSBC Ultra Short Term Bond Fund
HSBC Flexi Debt Fund
Fund Managers - MIP & Debt
Comparative Performance of Debt Schemes
Section II - How to read Factsheet
HSBC Global Consumer Opportunities Fund
SIP Performance of Equity Schemes
Fund Manager Wise
01
05
06
07
08
09
10
11
12
13
14
15
16
17
20
25
30
31
32
33
34
35
36
37
38
18

-
Amonth of substantial gains for equity indices
Equity markets surged higher in the month of October driven by a string of local reform announcements and stable global cues. Indian
government's announcement of mega recapitalisation package for public sector banks, unveiling of the ambitious road construction plan and
improving macro data indicators buoyed investor sentiments. The market indices CNX Nifty and BSE Sensex were up 5.6% & 6.2%
respectively while the BSE Midcap and Small cap indices outperformed gaining 7.5% & 9.2% respectively for the month.
The big news flow during the month was that of the long awaited recapitalisation plan for Indian Public Sector Banks (PSBs) and came as a
positive surprise on the quantum of recapitalisation envisaged. As per the plan, INR 2.11 tn (about USD 32.5 bn) will be infused into public
sector banks or PSBs spread over the ongoing and upcoming financial year. This recapitalisation package is significantly larger than the
previous commitment from the government and the quantum is greater than the total capital infusion into PSBs over the past decade.
According to the announcement, the Government will infuse INR 1.35 tn (about USD 21 bn) through 'recapitalisation bonds' while banks will
raise another INR 580 bn (about USD 9 bn) from the markets and the rest of the INR 180 bn (about USD 2.5 bn) will come from the existing
budgetary support. This recapitalisation measure is aimed at tackling asset quality and capital adequacy issues at PSBs and in that process
revive economic growth by higher credit offtake through these banks. The exact modalities and timelines of the recapitalisation plan will be
known in due course, along with the likely fiscal impact of this move.
In another key announcement, the Government unveiled a mega road construction plan (coined 'Bharatmala') with the outlay pegged at INR
3.85 tn (about USD 59 bn). The total outlay envisaged for road construction projects stood at about INR 6.92 tn or about USD 107 bn, spread
over five years (including Bharatmala and other road projects). This will involve total construction of 83,677 km (translating to roughly 46 km
per day) of total roads (Bharatmala and other road projects). The funding for these will be done through a mix of Government funds, debt and
private investment.
The quarterly earnings season trends at an aggregate level have been broadly on expected lines so far, while the sector wise trends have
been mixed. However, the key aspect to monitor towards the end of the quarter would be whether the trend of earnings downgrades is close
to bottoming out or not.
FIIs (Foreign Institutional Investors) turned net buyers after seeing net outflows for the past two months. For the month of October 17, FIIs net
bought equities worth about USD 296 mn and the segment has seen net inflows of about USD 5.5 bn so far this calendar year. The Domestic
Institutional Investors (DIIs) on the other hand continued to see net inflows and net bought equities worth about USD 1.55 bn. The MF
segment once again saw a good month of net inflows at about USD 1.53 bn, though the pace of net inflows moderated from the past two-three
months (about USD 2.69 bn of net inflows in Sep-17). The domestic insurers saw marginal net inflows of about USD 15 mn for the month. The
DII segment has seen net inflows of about USD 11.35 bn so far this calendar year, entirely driven by MFs, while Insurers have seen net
outflows during the period.
During its October policy meeting, the European Central Bank (ECB) kept interest rates on hold but announced an extension of the asset
purchase programme by at least 9 months to September’18 and at a reduced monthly purchase quantum of EUR 30 bn. However, the bank
will continue to with its plan to purchase EUR 60 bn per month till December’17. Additionally, ECB maintained its guidance that the size and
duration of the asset purchases could be extended if the outlook becomes less favourable or if financial conditions become inconsistent with
reaching the bank's inflation target. Elsewhere in Japan, Shinzo Abe's Liberal Democratic Party won a simple majority at the lower house of
the Parliament and together with its junior coalition partner retained two-thirds 'super majority' providing room for the Government to pass
reform bills. The coalition victory reduces the uncertainty about the future course of the fiscal and monetary policy decisions in Japan. In the
US, the Senate voted to pass the 2018 budget resolution, bolstering prospects of tax reforms being enacted by year-end, though the exact
modalities of how the actual implementation would be, is still awaited.
External
Global Economic Scenario
Institutional Fund Flows
Fund Manager Commentary
01
Source: Bloomberg; Bombay Stock Exchange (BSE)
Re
turn
s %
0.0%
1.0%
2.0%
3.0%
4.0%
5.0%
6.0%
7.0%
8.0%
9.0%
10.0%
Sensex Nifty BSE200 BSE500 BSE MidCap BSE SmallCap
Indices Performance - Oct 2017

Equity Market Outlook
The announcement of the record capital injection into banks was combined with plans to spend INR 6.92tn on building roads over the next
five years. Both these announcements could be looked through the lens of the Government's efforts to revive economic growth and address
one of the biggest overhangs on the economy ahead of key state elections. Equity markets surged higher on the back of these
announcements, particularly the mega bank recapitalisation plan. The improved capital adequacy of banks is expected to speed up the
resolution of bad loans under the bankruptcy law, as it will put public sector banks in a better position to accept haircuts during the resolution
process. It is expected to increase the propensity of banks to lend, and thereby help higher credit offtake and boost economic growth
prospects.
From an economy perspective, we are seeing some challenges emerge in the form of slow-down in GDP growth and some deterioration in
the margin with respect to other macroeconomic variables. The bank recapitalisation and infrastructure push announced by the government
are to tackle these growth challenges but that will be felt over the medium term. Inflation though manageable is showing signs of hardening,
Current Account Deficit may widen a bit while FY18 fiscal deficit target look stretched in the context of crude price environment, GST
transition and the possibility of some fiscal slippage as we move into an election phase culminating to the general elections in May 2019.
Additionally, the corporate earnings recovery is getting postponed due to GST implementation and also because of the lack of revival in the
investment cycle. While the transitory impact of the GST implementation was expected, the aggregate earnings delivery has remained
subdued in the current year leading to continuous downward revision at an aggregate level. The recovery cycle for corporate India is getting
pushed to 2HFY18 now, with 2QFY18 also likely to see some temporary hiccups related to the GST implementation.
We remain constructive on the India story from a medium to long term perspective, though there are near term challenges as discussed.
Looking ahead, the GST regime will lead to faster formalisation of the economy, broaden the tax base, improve the fiscal situation and
improve the ease of doing business. However, its roll-out will likely bring some challenges as mentioned. Organised sectors and larger
companies will be better equipped to cope with the new system, while the unorganised sector and smaller companies could face initial
hurdles. We believe the situation will likely normalise over the next two quarters or so.
Apart from the near term challenges connected with the GST roll-out, other risks to the market performance are in the form of valuations
trending above historical averages and a weaker than expected delivery in corporate earnings going forward. External news flows related to
geopolitical tensions (the Korean peninsula tensions) and other eco-political events could also influence market performance going forward,
as the recent rally in the markets was supported by strong flows.
September CPI came in at 3.28%, lower than expectations and flat to the previous month owing to a drop in
food inflation to 1.8%. Core inflation, however continues to remain sticky and inched up to 4.6% owing to HRA impact and flow through of
higher fuel prices on the transport sub-index.
WPI inflation moderated to 2.6% vis-à-vis a revised 3.24% in August, with a sharp drop in food inflation
driving the downward trend. Core WPI accelerated to 2.8% v/s 2.5% inAugust, mirroring trends seen in CPI.
August IIP rebound to 4.3% v/s 1.3% in July driven by a restoration in manufacturing output after
GST disruptions. Both capital goods and consumer non-durable goods showed a healthy uptick at 6.9% and 5.5% respectively.
(Consumer Price Index or CPI)
(Wholesale Price Index or WPI)
(Index of Industrial Production or IIP)
RBI's Monetary Policy, Economic Events and Data
Inflation
Fund Manager Commentary
02
Source: Bloomberg; Central Statistical Organization (CSO) India
Source: Bloomberg
Infl
atio
n G
row
th(%
)
0%1%2%3%4%5%6%7%8%9%
Fe
b-1
4
Au
g-1
4
Jan
-15
Jun
-15
De
c-1
5
Ma
y-1
6
Oct
-16
Ap
r-1
7
Se
p-1
7
CPI Inflation (%)
Consumer Price Index (CPI)
Gro
wth
%
-6.0%
-1.0%
4.0%
9.0%
14.0%
Jan/1
3
Jun/1
3
Nov/1
3
Apr/
14
Sep/1
4
Feb/1
5
Jul/15
Dec/1
5
May/1
6
Oct/16
Mar/
17
Aug/1
7
Index of Industrial Production (IIP)* new series data
IIP YoY Growth in % (New Series; base 2011- 12)

Trade deficit
RBI Policy
Trade Deficit narrowed to USD 9 bn in September from USD 11.6 bn in August. Exports witnessed a sharp growth to 25.7% y-o-y in
September from 10.3% in the previous month. Export pick up was broad based including various industries. Imports were marginally lower at
18% y-o-y in September vs 21 % y-o-y inAugust. Reasonable global growth and GST issues now beginning to settle down, are both drivers of
the narrowing of the trade deficit.
RBI policy held on 4 October 2017 continued to maintain its neutral stance and maintained policy rates. RBI continued to focus on higher
inflation, possible fiscal slippage by the center, farm loan waivers by State Governments, Lower Kharif production and higher oil prices are
upside risks to inflation. The MPC voted 5-1 with the lone member favoring a 25 bps cut.
Minutes released later in the month also reflected hawkish commentary. While the members acknowledged slowing growth, they were
uncertain if the same was transitory and if rate cuts would be appropriate at the current juncture to revive growth and private sector capex.
Market continued to trade with a negative bias for the month with fiscal concerns and increase in oil prices, rise in treasury yields and supply
concerns weighing on the markets. Markets also await clarity on the mode through which the government would issue “recapitlisation bonds”
to the market, the tenor, pricing and the tradability/non-tradability of these proposed bonds. 10 year ended the month at 6.87% v/s 6.67% at
the end of the previous month.
State Development Loans or SDL and Corporate Bonds outperformed during the month with spreads of 10 year corporate bonds narrowing
to about 60 bps while secondary market SDLspreads were about 70 bps.
Money market remains positive on liquidity
Liquidity continued to remain positive through the month. However there was some tightening on account of festive season and seasonal
outflow of currency in circulation, overall liquidity continues to remain in a surplus mode. RBI continues to use combination of tools viz. Open
Market Operations or OMOs and reverse repos to absorb the liquidity.
RBI has announced next OMO of INR 10000 Cr which is scheduled on 9 November 2017. RBI is conducting 2 OMOs every month and total
OMOs since July add up to Rs.800 bn.
Market Activity
Markets
Continued supply of G-Sec and SDLs while receding hopes for a rate cut and concerns about fiscal slippages continues to act as pressure
points for yields. Lower demand from PSU banks post cut in Held to Maturity (HTM) in RBI's October policy will also act as a dampener.
However post-sell off, G-sec is attractively valued with 10 year at a term premium of 90 bps over repo-rates with many of these concerns
being factored in the price. Further next two inflation prints should remain reasonable at about 3.3% to 3.4% and about 3.6%-3.9%, despite
some increase in perishable prices. Rising crude prices and government response to them will however need to be watched out for.
We expect 10 year to trade in 6.70% - 6.95% range.
Going Forward
03
Fund Manager Commentary
Source: Bloomberg, for all data except where mentioned otherwise
Rate
%
4.00%
5.00%
6.00%
7.00%
8.00%
9.00%
10.00%
Dec/0
6
Oct/07
Aug/0
8
Jun/0
9
Apr/
10
Feb/1
1
Dec/1
1
Oct/12
Aug/1
3
Jun/1
4
Apr/
15
Feb/1
6
Dec/1
6
Oct/17
Repo Rate Movement
Repo Rate

04
Fund Manager Commentary
Consumer Discretionary
Consumer Staples
Energy
Financials
Healthcare
Industrials
Information Technology
Materials
Telecommunication
Utilities
Sectors HSBCEquityFund #
HSBC IndiaOpportunities
Fund #
HSBCMidcap
Equity Fund
Overweight Underweight Neutral
#The benchmark for HSBC Equity Fund and HSBC India Opportunities Fund have changed w.e.f. 11th November, 2016 as a more suitable benchmarkwas identified which better matched the portfolio strategy. There has been no change to investment management of the scheme.
Review: HSBC Equity Fund
Positive Contributors
Industrials, Materials - being overweight & certain stock (s) selection helped performance
Consumer Discretionary, Healthcare - certain stock (s) selection helped performance
Consumer Staples – being underweight & certain stock (s) selection helped performance
Negative Contributors
Financials - being overweight & certain stock (s) selection hurt performance
Information Technology, Utilities – certain stock (s) selection hurt performance
Telecommunication - being underweight & certain stock (s) selection hurt performance
Energy – being underweight hurt performance
Review: HSBC India Opportunities Fund
Positive Contributors
Materials - being overweight & certain stock (s) selection helped performance
Healthcare – certain stock (s) selection helped performance
Consumer Staples – being underweight & certain stock (s) selection helped performance
Negative Contributors
Financials - being overweight & certain stock (s) selection hurt performance
Industrials, Information Technology- certain stock (s) selection hurt performance
Energy, Telecommunication – being underweight hurt performance
Review: HSBC Midcap Equity Fund
Positive Contributors
Materials – being overweight & certain stock (s) selection helped performance
Financials, Consumer Staples, Energy, Information Technology- certain stock (s) selection helped performance
Healthcare - being underweight & certain stock (s) selection helped performance
Telecommunication – being underweight helped performance
Negative Contributors
Consumer Discretionary - certain stock (s) selection hurt performance
Utilities – being underweight hurt performance
Review: HSBC Dynamic Fund
The cash levels and sector allocation in the fund are likely to change depending on the market conditions and technical factors.
Review: HSBC Monthly Income Plan
Our current exposure is 24.3% in HMIP. Currently it is more biased towards large caps than mid or small caps.

HSBC Equity Fund (HEF)An Open Ended Diversified Equity Scheme
Investment Objective: Aims to generate long term capital growth from an actively managed portfolio of equity and equityrelated securities.
05
FUND DETAILS
Weighted Average Monthly Total Expenses ratios(Annualized)
Portfolio Turnover
Regular 2.46%
Direct Plan 1.69%Excludes GST on Investment Management fees of 0.28% ofTotal NetAssets.
0.90
Asset Allocation
Auto 10.50%
AutoAncillaries 1.64%
Banks 27.63%
Cement 2.68%
Construction Project 5.47%
Consumer Non Durables 4.55%
Ferrous Metals 4.31%
Finance 11.62%
Non - Ferrous Metals 4.95%
Petroleum Products 7.02%
Pharmaceuticals 2.84%
Power 1.35%
Software 8.01%
Transportation 1.86%
Other Equity Investments 1.69%
Reverse Repos/CBLOs 1.40%
Net CurrentAssets 2.48%
Total NetAssets 100.00%
Statistical ratios disclosed as per monthly returns (absolute) forthe last 3 years.
$The benchmark was changed w.e.f. 11th November, 2016 as amore suitable benchmark was identified which better matchedthe portfolio strategy. There has been no change to investmentmanagement of the scheme.
@ Effective from March 1, 2013 for prospective investments.
**Risk free rate: 6.00% (FIMMDA-NSE Mibor) as on Oct 31,2017)
Upon payment of dividend, the NAV per unit falls to the extent of payout and statutory levy, if any. Face value: 10 per unit.`
FUND PORTFOLIO
Auto
Auto Ancillaries
Banks
Cement
Construction Project
Consumer Non Durables
Ferrous Metals
Finance
Non - Ferrous Metals
Petroleum Products
Pharmaceuticals
Power
Software
Transportation
Other Equity Investments 1,130.53 1.69%
Cash Equivalents
CBLO 636.34 0.95%
Reverse Repos 303.81 0.45%
Net Current Assets 1,664.50 2.48%
Total Net Assets as on 31-Oct-2017 66,997.69 100.00%
Maruti Suzuki India 2,873.94 4.29%
Tata Motors 2,142.00 3.20%
Mahindra & Mahindra 2,017.20 3.01%
Motherson Sumi Systems 1,095.60 1.64%
HDFC Bank 6,329.75 9.45%
ICICI Bank 4,801.60 7.17%
IndusInd Bank 2,440.73 3.64%
Yes Bank 2,356.88 3.52%
Kotak Mahindra Bank 1,537.58 2.29%
Axis Bank 1,046.30 1.56%
Dalmia Bharat 1,795.29 2.68%
Larsen & Toubro 3,666.90 5.47%
ITC 2,125.60 3.17%
Britannia Industries 927.90 1.38%
Tata Steel 2,111.40 3.15%
JSW Steel 775.35 1.16%
HDFC 2,134.25 3.19%
Indiabulls Housing Finance 1,866.08 2.79%
Bajaj Finserv 1,503.11 2.24%
SBI Life Insurance Co 827.63 1.24%
LIC Housing Finance 748.38 1.12%
Power Finance Corporation 696.25 1.04%
Vedanta 3,318.50 4.95%
Reliance Industries 4,704.25 7.02%
Aurobindo Pharma 1,900.00 2.84%
NTPC 906.25 1.35%
Infosys 3,226.48 4.82%
HCL Technologies 2,139.50 3.19%
Interglobe Aviation 1,247.85 1.86%
IssuerMarket Value
( in Lacs)`
% to NetAssets
Dividend DeclarationRecord Date / periodof dividend declared
Dividend ( per unit)Non-Institutional
` Dividend ( per unit)Institutional
` NAV ( ) per unit(cum dividend)
`
HSBC Equity Fund - Dividend27-Jun-14 2.50000 2.50000 31.2065
10-Nov-15 3.70000 3.70000 29.4046
27-Jun-14 2.50000 2.50000 31.5845
10-Nov-15 3.70000 3.70000 30.0806
02-Nov-16 3.00000 3.00000 30.0022
HSBC Equity Fund - Dividend - Direct Plan
02-Nov-16 3.00000 3.00000 31.0071
Date of Allotment
BenchmarkNAV (Growth)(as on 31.10.17)Monthly Average AUM(In Lakhs)Fund ManagerSIPMinimumApplication Amount
Exit Load
Standard DeviationBeta (Slope)Sharpe Ratio**
$
@
per unit
Statistical Ratios
10-Dec-02
Nifty 50
197.6178
Neelotpal Sahai
Available
10,000
1,000 p.m.(SIP)
Nil
4.50%
`
`
`
1.0147
0.1272
66,405.40
Investors understand that their principalwill be at Moderately High risk
Riskometer
Mod
erately Moderate
Low
Hig
h
Low
High
LOW HIGH
Moderately
This product is suitable forinvestors who are seeking*:
• To create wealth over longterm
• Investment in equity andequity related securities
HSBC Equity Fund (HEF)
* Investors should consult their financial advisers if in doubt aboutwhether the product is suitable for them.

HSBC India Opportunities Fund (HIOF)
06
FUND DETAILS
Weighted Average Monthly Total Expenses ratios(Annualized)
Portfolio Turnover
Regular 2.57%
Direct Plan 1.71%
Excludes GST on Investment Management fees of 0.20% of TotalNetAssets.
0.48
Asset Allocation
Auto 9.96%
AutoAncillaries 1.15%
Banks 20.93%
Cement 5.38%
Chemicals 1.72%
Construction 3.65%
Construction Project 3.09%
Consumer Durables 1.37%
Consumer Non Durables 2.69%
Ferrous Metals 4.47%
Finance 13.41%
Industrial Products 4.56%
Non - Ferrous Metals 4.20%
Pesticides 1.35%
Petroleum Products 4.76%
Pharmaceuticals 2.56%
Software 4.50%
Telecom - Services 1.57%
Textile Products 2.48%
Other Equity Investments 4.45%
Reverse Repos/CBLOs 1.57%
Net CurrentAssets 0.18%
Total NetAssets 100.00%
Statistical ratios disclosed as per monthly returns forthe last 3 years.
$The benchmark was changed w.e.f. 11th November, 2016 as amore suitable benchmark was identified which better matchedthe portfolio strategy. There has been no change to investmentmanagement of the scheme.
(absolute)
@Effective from March 1, 2013 for prospective investments.
**Risk free rate: % (FIMMDA-NSE Mibor) as on ,2017)
6.00 Oct 31
Upon payment of dividend, the NAV per unit falls to the extent of payout and statutory levy, if any. Face value: 10 per unit.`
FUND PORTFOLIO
Auto
Auto Ancillaries
Banks
Cement
Chemicals
Construction
Construction Project
Consumer Durables
Consumer Non Durables
Ferrous Metals
Finance
Industrial Products
Non - Ferrous Metals
Pesticides
Petroleum Products
Pharmaceuticals
Software
Telecom - Services
Textile Products
Other Equity Investments 2,635.46 4.45%
Cash Equivalents
CBLO 628.28 1.06%
Reverse Repos 299.97 0.51%
Net Current Assets 106.26 0.18%
Total Net Assets as on 31-Oct-2017 59,279.59 100.00%
Tata Motors 2,142.00 3.61%
Eicher Motors 1,934.00 3.26%
Mahindra & Mahindra 1,008.60 1.70%
Maruti Suzuki India 821.13 1.39%
Balkrishna Industries 681.98 1.15%
HDFC Bank 5,425.50 9.15%
ICICI Bank 3,001.00 5.06%
Yes Bank 2,356.88 3.98%
IndusInd Bank 1,627.15 2.74%
Dalmia Bharat 1,496.08 2.52%
JK Cement 1,002.40 1.69%
NCL Industries 695.20 1.17%
Vinati Organics 1,019.90 1.72%
Somany Ceramics 849.10 1.43%
Kajaria Ceramics 680.20 1.15%
Ahluwalia Contracts (India) 635.60 1.07%
Larsen & Toubro 1,833.45 3.09%
Blue Star 811.45 1.37%
ITC 1,594.20 2.69%
Jindal Steel & Power 1,223.25 2.06%
Srikalahasthi Pipes 724.70 1.22%
Tata Steel 703.80 1.19%
Bajaj Finance 2,700.90 4.56%
JM Financial 1,645.50 2.78%
Bharat Financial Inclusion 1,511.33 2.55%
Manappuram Finance 1,411.20 2.38%
ICICI Lombard General Insurance Co 677.00 1.14%
Supreme Industries 1,131.00 1.91%
Astral Poly Technik 952.13 1.61%
Finolex Cables 615.20 1.04%
Vedanta 2,488.88 4.20%
UPL 799.30 1.35%
Reliance Industries 2,822.55 4.76%
Aurobindo Pharma 1,520.00 2.56%
Infosys 1,382.78 2.33%
HCL Technologies 1,283.70 2.17%
Idea Cellular 928.50 1.57%
Arvind 802.10 1.35%
Welspun India 670.00 1.13%
IssuerMarket Value
( in Lacs)`
% to NetAssets
Dividend DeclarationRecord Date / periodof dividend declared
Dividend ( per unit)Non-Institutional
` Dividend ( per unit)Institutional
` NAV ( ) per unit(cum dividend)
`
HSBC India Opportunities Fund - Dividend
HSBC India Opportunities Fund - Dividend Direct Plan
17-Mar-15 2.70000 2.70000 27.0820
10-Nov-15 1.50000 1.50000 21.8624
17-Mar-15 1.50000 1.50000 27.5575
10-Nov-15 1.50000 1.50000 23.4738
24-Mar-17 1.50000 1.50000 25.8408
24-Mar-17 1.50000 1.50000 28.1677
An Open Ended Flexi-Cap Equity Scheme
Investment Objective: Seeks long term capital growth through investments across all market capitalisations, including small,mid and large cap stocks. It aims to be predominantly invested in equity & equity related securities. However it could move asignificant portion of its assets towards fixed income securities if the fund manager becomes negative on equity markets.
Date of Allotment
Benchmark
NAV (Growth)(as on 31 )
Fund Manager
SIP
Minimum
Application Amount
Exit Load
Standard Deviation
Beta (Slope)
Sharpe Ratio**
$
@
per unit
Monthly Average AUM(In Lakhs)
.10.17
Statistical Ratios
24-Feb-04
S&P BSE 200
86.9481
58,646.06
Neelotpal Sahai
Available
10,000
1,000 p.m.(SIP)
Nil
4.91%
1.0838
0.1509
`
`
`
Investors understand that their principalwill be at Moderately High risk
Riskometer
Mod
erately Moderate
Low
Hig
h
Low
High
LOW HIGH
Moderately
This product is suitable forinvestors who are seeking*:
• To create wealth over longterm
• Invests in equity and equityrelated securities acrossmarket capitalisations
HSBC India Opportunities Fund (HIOF)
* Investors should consult their financial advisers if in doubt aboutwhether the product is suitable for them.

HSBC Midcap Equity Fund (HMEF)
This product is suitable for investors who are seeking*:
�
�
�
Overnight liquidity over short term
Investment in Money Market Instruments
Low riskLOW RISK
(BLUE)
Note: Risk is represented as -
*Investors should consult their financial advisers if in doubt whether the product issuitable for them
07
FUND DETAILS
Weighted Average Monthly Total Expenses ratios(Annualized)
Portfolio Turnover
Regular 2.64%
Direct Plan 1.74%
Excludes GST on Investment Management fees of 0.23% ofTotal NetAssets.
0.37
Asset Allocation
Statistical ratios disclosed as per monthly returns forthe last 3 years.
(absolute)
@ Effective from March 1, 2013 for prospective investments.
**Risk free rate: % (FIMMDA-NSE Mibor) as on ,2017)
6.00 Oct 31
Upon payment of dividend, the NAV per unit falls to the extent of payout and statutory levy, if any. Face value: 10 per unit.`
FUND PORTFOLIO
Auto
Auto Ancillaries
Banks
Cement
Chemicals
Construction
Construction Project
Consumer Non Durables
Ferrous Metals
Finance
Industrial Capital Goods
Industrial Products
Media & Entertainment
Minerals/Mining
Petroleum Products
Pharmaceuticals
Power
Software
Textiles - Synthetic
Other Equity Investments 3,311.54 6.06%
Cash Equivalents
CBLO 221.41 0.41%
Reverse Repos 105.71 0.19%
Net Current Assets -209.31 -0.38%
Total Net Assets as on 31-Oct-2017 54,595.27 100.00%
VST Tillers Tractors 1,857.52 3.40%
Apollo Tyres 1,500.60 2.75%
Federal Bank 1,059.23 1.94%
Deccan Cements 1,645.97 3.01%
Vinati Organics 2,816.69 5.16%
Balaji Amines 2,234.74 4.09%
Navin Fluorine International 1,022.15 1.87%
IRB Infrastructure Developers 739.78 1.36%
Ahluwalia Contracts (India) 544.51 1.00%
Power Mech Projects 713.77 1.31%
CCL Products (India) 2,128.43 3.90%
Kaveri Seed Company 1,402.27 2.57%
Apex Frozen Foods 1,234.23 2.26%
Srikalahasthi Pipes 1,251.07 2.29%
Jindal Steel & Power 978.60 1.79%
Motilal Oswal Financial Services 3,013.47 5.52%
Dewan Housing Finance Corporation 2,596.71 4.76%
Bharat Financial Inclusion 2,496.13 4.57%
Manappuram Finance 2,430.29 4.45%
Indiabulls Housing Finance 2,419.68 4.43%
Muthoot Finance 1,544.03 2.83%
JM Financial 1,448.04 2.65%
Cholamandalam Investment & Fin Co. 1,218.89 2.23%
Sanghvi Movers 1,067.21 1.95%
Ramkrishna Forgings 1,488.52 2.73%
Jain Irrigation Systems 742.76 1.36%
KEI Industries 729.93 1.34%
Jagran Prakashan 1,505.81 2.76%
Gujarat Mineral Development Corpor 1,873.44 3.43%
GOCL Corporation 1,436.16 2.63%
Aurobindo Pharma 1,251.07 2.29%
Kalpataru Power Transmission 699.22 1.28%
Sonata Software 1,214.76 2.23%
Sarla Performance Fibers 860.27 1.58%
IssuerMarket Value
( in Lacs)`
% to NetAssets
Dividend DeclarationRecord Date / periodof dividend declared
Dividend ( per unit)Non-Institutional
` Dividend ( per unit)Institutional
` NAV ( ) per unit(cum dividend)
`
HSBC Midcap Equity Fund - Dividend19-Nov-10 2.00 2.00 15.4864
10-Nov-15 2.50 2.50 20.1838
02-Nov-16 1.75 1.75 25.3345
02-Nov-16 1.75 1.75 21.5706
HSBC Midcap Equity Fund - Dividend - Direct Plan
An Open Ended Diversified Equity Scheme
Investment Objective: Seeks to generate long term capital growth from an actively managed portfolio of equity and equityrelated securities primarily being midcap stocks. However, it could move a portion of its assets towards fixed income securitiesif the fund manager becomes negative on the Indian equity markets.
Date of Allotment
Benchmark
NAV (Growth)(as on 31 )
Fund Manager
SIP
Minimum
Application Amount
Exit Load
Standard Deviation
Beta (Slope)
Sharpe Ratio**
per unit
Monthly Average AUM(In Lakhs)
@
.10.17
Statistical Ratios
19-May-05
S&P BSE Midcap
59.5096
52,579.12
Dhiraj Sachdev
Available
10,000
1,000 p.m.(SIP)
Nil
5.98%
1.1318
0.2298
`
`
`
Investors understand that their principalwill be at Moderately High risk
Riskometer
Mod
erately Moderate
Low
Hig
h
Low
High
LOW HIGH
Moderately
This product is suitable forinvestors who are seeking*:• To create wealth over long
term• Invests in predominantly mid
cap equity and equity relatedsecurities
HSBC Midcap Equity Fund (HMEF)
* Investors should consult their financial advisers if in doubt aboutwhether the product is suitable for them.
Auto 3.40%
AutoAncillaries 2.75%
Banks 1.94%
Cement 3.01%
Chemicals 11.12%
Construction 2.36%
Construction Project 1.31%
Consumer Non Durables 8.73%
Ferrous Metals 4.08%
Finance 31.44%
Industrial Capital Goods 1.95%
Industrial Products 5.43%
Media & Entertainment 2.76%
Minerals/Mining 3.43%
Petroleum Products 2.63%
Pharmaceuticals 2.29%
Power 1.28%
Software 2.23%
Textiles - Synthetic 1.58%
Other Equity Investments 6.06%
Reverse Repos/CBLOs 0.60%
Net CurrentAssets -0.38%
Total NetAssets 100.00%

HSBC Infrastructure Equity Fund (HIEF)
This product is suitable for investors who are seeking*:
�
�
�
Overnight liquidity over short term
Investment in Money Market Instruments
Low riskLOW RISK
(BLUE)
Note: Risk is represented as -
*Investors should consult their financial advisers if in doubt whether the product issuitable for them
08
FUND DETAILS
Date of Allotment
Benchmark
NAV (Growth)(as on 31 )
Fund Manager
SIP
Minimum
Application Amount
Exit Load
Standard Deviation
Beta
Sharpe Ratio**
$
@
per unit
Monthly Average AUM(In Lakhs)
(Slope)
.10.17
Statistical Ratios
23-Feb-06
S&P BSE IndiaInfrastructure Index
25.1357
15,380.38
Dhiraj Sachdev
Available
10,000
1,000 p.m.(SIP)
Nil
5.86%
1.0949
0.1524
`
`
`
Weighted Average Monthly Total Expenses ratios(Annualized)
Portfolio Turnover
Regular 2.75%
Direct Plan 1.91%
Excludes GST on Investment Management fees of 0.30% of TotalNetAssets.
0.33
Asset Allocation
Banks 2.47%
Cement 5.61%
Construction 10.74%
Construction Project 2.17%
Ferrous Metals 13.05%
Finance 3.13%
Gas 2.64%
Industrial Capital Goods 9.14%
Industrial Products 10.12%
Minerals/Mining 7.97%
Petroleum Products 12.52%
Power 8.09%
Transportation 7.49%
Other Equity Investments 2.39%
Reverse Repos/CBLOs 1.27%
Net CurrentAssets 1.20%
Total NetAssets 100.00%
Statistical ratios disclosed as per monthly returns forthe last 3 years.
$The benchmark was changed w.e.f. 11th November, 2016 as amore suitable benchmark was identified which better matchedthe portfolio strategy. There has been no change to investmentmanagement of the scheme.
(absolute)
@ Effective from March 1, 2013 for prospective investments.
**Risk free rate: % (FIMMDA-NSE Mibor) as on ,2017)
6.00 Oct 31
Upon payment of dividend, the NAV per unit falls to the extent of payout and statutory levy, if any. Face value: 10 per unit.`
FUND PORTFOLIO
Banks
Cement
Construction
Construction Project
Ferrous Metals
Finance
Gas
Industrial Capital Goods
Industrial Products
Minerals/Mining
Petroleum Products
Power
Transportation
Other Equity Investments 387.24 2.39%
Cash Equivalents
CBLO 140.22 0.86%
Reverse Repos 66.95 0.41%
Net Current Assets 196.57 1.20%
Total Net Assets as on 31-Oct-2017 16,268.39 100.00%
Karnataka Bank 402.19 2.47%
Deccan Cements 912.78 5.61%
KNR Constructions 497.95 3.06%
IRB Infrastructure Developers 485.10 2.98%
Ahluwalia Contracts (India) 394.25 2.42%
NBCC India 371.18 2.28%
Larsen & Toubro 183.35 1.13%
Power Mech Projects 169.29 1.04%
Srikalahasthi Pipes 964.52 5.93%
Jindal Saw 692.64 4.26%
Jindal Steel & Power 464.84 2.86%
Rural Electrification Corporation 509.21 3.13%
Gujarat State Petronet 429.45 2.64%
Voltamp Transformers 645.38 3.97%
Sanghvi Movers 626.54 3.85%
Inox Wind 214.09 1.32%
KEI Industries 1,265.20 7.78%
Schaeffler India 380.19 2.34%
Gujarat Mineral Development Corpor 1,296.44 7.97%
Hindustan Petroleum Corporation 761.27 4.68%
Indian Oil Corporation 641.53 3.94%
GOCL Corporation 634.23 3.90%
PTC India 475.03 2.92%
Power Grid Corporation of India 343.20 2.11%
Reliance Infrastructure 319.25 1.96%
JSW Energy 179.34 1.10%
Adani Ports & Special Economic Zone 933.86 5.74%
Gateway Distriparks 285.15 1.75%
IssuerMarket Value
( in Lacs)`
% to NetAssets
Dividend DeclarationRecord Date / periodof dividend declared
Dividend ( per unit)Non-Institutional
` Dividend ( per unit)Institutional
` NAV ( ) per unit(cum dividend)
`
HSBC Infrastructure Equity Fund Dividend11-May-07 1.00 1.00 12.2390
26-May-08 1.00 1.00 13.7160
An Open Ended Equity Scheme
Investment Objective: Seeks to generate long term capital growth from an actively managed portfolio of equity and equityrelated securities by investing primarily in sectors, areas and themes that play an important role in, and/or benefit from India'sprogress, reform process and economic development.
Investors understand that their principalwill be at High risk
Riskometer
Mod
erately Moderate
Low
Hig
h
Low
High
LOW HIGH
Moderately
This product is suitable forinvestors who are seeking*:
• To create wealth over longterm
• Invests in equity and equityrelated securities, primarily inthemes that play an importantrole in India's economicdevelopment
HSBC Infrastructure Equity Fund (HIEF)
* Investors should consult their financial advisers if in doubt aboutwhether the product is suitable for them.

HSBC Tax Saver Equity Fund (HTSF)
09
FUND DETAILS
Date of Allotment
Benchmark
NAV (Growth)(as on 31 )
Fund Manager
SIP
Minimum
Application Amount
Exit Load
Standard Deviation
Beta (Slope)
Sharpe Ratio**
per unit
Monthly Average AUM(In Lakhs)
@
.10.17
Statistical Ratios
05-Jan-07
S&P BSE 200
37.6242
Aditya Khemani
Available
500
(Lumpsum & SIP)
Nil
4.61%
0.9841
0.1720
`
`
18,662.07
Weighted Average Monthly Total Expenses ratios(Annualized)
Portfolio Turnover
Regular 2.61%
Direct Plan 1.88%
Excludes GST on Investment Management fees of 0.29% of TotalNetAssets.
0.54
Asset Allocation
Auto 9.35%AutoAncillaries 5.12%Banks 27.09%Cement 7.07%Construction 3.45%Construction Project 2.70%Consumer Durables 3.22%Consumer Non Durables 5.80%Finance 5.78%Industrial Products 8.16%Non - Ferrous Metals 2.80%Petroleum Products 2.53%Pharmaceuticals 5.32%Software 2.86%Textile Products 1.55%Textiles - Cotton 1.58%Transportation 1.74%Other Equity Investments 0.94%Reverse Repos/CBLOs 2.01%Net CurrentAssets 0.93%Total NetAssets 100.00%
Statistical ratios disclosed as per monthly returns forthe last 3 years.
(absolute)
@ Effective from March 1, 2013 for prospective investments.
**Risk free rate: % (FIMMDA-NSE Mibor) as on ,2017)
6.00 Oct 31
Upon payment of dividend, the NAV per unit falls to the extent of payout and statutory levy, if any. Face value: 10 per unit.`
FUND PORTFOLIO
Auto
Auto Ancillaries
Banks
Cement
Construction
Construction Project
Consumer Durables
Consumer Non Durables
Finance
Industrial Products
Non - Ferrous Metals
Petroleum Products
Pharmaceuticals
Software
Textile Products
Textiles - Cotton
Transportation
Other Equity Investments 178.28 0.94%
Cash Equivalents
CBLO 258.53 1.36%
Reverse Repos 123.43 0.65%
Net Current Assets 177.20 0.93%
Total Net Assets as on 31-Oct-2017 18,981.27 100.00%
Maruti Suzuki India 1,156.39 6.09%
Tata Motors 335.25 1.77%
Mahindra & Mahindra 282.41 1.49%
MRF 365.32 1.92%
Exide Industries 313.13 1.65%
Amara Raja Batteries 293.83 1.55%
HDFC Bank 1,757.86 9.26%
ICICI Bank 1,450.83 7.64%
IndusInd Bank 1,073.92 5.66%
Federal Bank 574.81 3.03%
DCB Bank 284.72 1.50%
NCL Industries 792.75 4.18%
OCL India 548.31 2.89%
Somany Ceramics 654.80 3.45%
Larsen & Toubro 513.37 2.70%
Blue Star 345.43 1.82%
Crompton Greaves Consumer Electrical 265.38 1.40%
Heritage Foods 507.85 2.68%
United Spirits 357.01 1.88%
ITC 236.20 1.24%
JM Financial 532.17 2.80%
Cholamandalam Investment & Fin Co. 287.80 1.52%
ICICI Lombard General Insurance Co 277.57 1.46%
Nilkamal 478.09 2.52%
Finolex Cables 467.55 2.46%
Astral Poly Technik 407.79 2.15%
Kirloskar Brothers 194.77 1.03%
Vedanta 530.96 2.80%
Reliance Industries 479.83 2.53%
Torrent Pharmaceuticals 368.26 1.94%
Sun Pharmaceutical Industries 368.78 1.94%
Aurobindo Pharma 273.60 1.44%
Infosys 542.05 2.86%
Indian Terrain Fashions 294.97 1.55%
Indo Count Industries 299.38 1.58%
Interglobe Aviation 330.68 1.74%
IssuerMarket Value
( in Lacs)`
% to NetAssets
Dividend DeclarationRecord Date / periodof dividend declared
Dividend ( per unit)Non-Institutional
` Dividend ( per unit)Institutional
` NAV ( ) per unit(cum dividend)
`
HSBC Tax Saver Equity Fund Dividend
HSBC Tax Saver Equity Fund Dividend Direct
17-Mar-15 2.50000 2.50000 23.9029
23-Mar-16 1.50000 1.50000 19.4675
24-Mar-17 1.50000 1.50000 23.9550
24-Mar-17 1.50000 1.50000 23.1073
17-Mar-15 2.50000 2.50000 24.3256
23-Mar-16 1.50000 1.50000 19.9950
An Open Ended Equity Linked Savings Scheme (ELSS)
Investment Objective: Aims to provide long term capital appreciation by investing in a diversified portfolio of equity & equityrelated instruments of companies across various sectors and industries, with no capitalisation bias. The Fund may also investin fixed income securities.
Investors understand that their principalwill be at Moderately High risk
Riskometer
Mod
erately Moderate
Low
Hig
h
Low
High
LOW HIGH
Moderately
This product is suitable forinvestors who are seeking*:• To create wealth over long
term• Invests in equity and equity
related securities with nomarket capitilastion bias
HSBC Tax Saver Equity Fund (HTSF)
* Investors should consult their financial advisers if in doubt aboutwhether the product is suitable for them.
HSBC Dynamic Fund (HDF)
10
FUND DETAILS
Date of Allotment
Benchmark
NAV (Growth)(as on 31 )
Fund Managers
SIP
Minimum
Application Amount
Exit Load
Standard Deviation
Beta (Slope)
Sharpe Ratio**
per unit
Monthly Average AUM(In Lakhs)
@
.10.17
Statistical Ratios
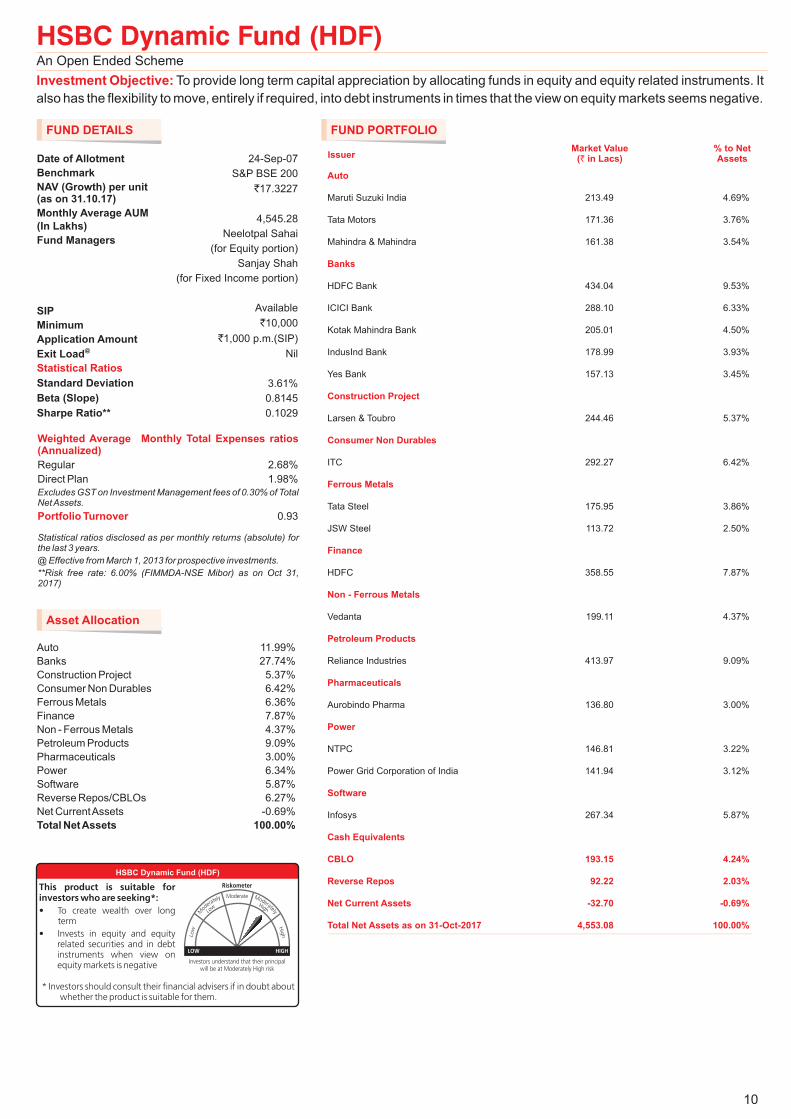
24-Sep-07
S&P BSE 200
17.3227
Neelotpal Sahai
(for Equity portion)
Sanjay Shah
(for Fixed Income portion)
Available
10,000
1,000 p.m.(SIP)
Nil
`
`
`
3.61%
0.8145
0.1029
4,545.28
Weighted Average Monthly Total Expenses ratios(Annualized)
Portfolio Turnover
Regular 2.68%
Direct Plan 1.98%
Excludes GST on Investment Management fees of 0.30% of TotalNetAssets.
0.93
Asset Allocation
Auto 11.99%
Banks 27.74%
Construction Project 5.37%
Consumer Non Durables 6.42%
Ferrous Metals 6.36%
Finance 7.87%
Non - Ferrous Metals 4.37%
Petroleum Products 9.09%
Pharmaceuticals 3.00%
Power 6.34%
Software 5.87%
Reverse Repos/CBLOs 6.27%
Net CurrentAssets -0.69%
Total NetAssets 100.00%
Statistical ratios disclosed as per monthly returns forthe last 3 years.
(absolute)
@ Effective from March 1, 2013 for prospective investments.
**Risk free rate: % (FIMMDA-NSE Mibor) as on ,2017)
6.00 Oct 31
FUND PORTFOLIO
IssuerMarket Value
( in Lacs)`
% to NetAssets
An Open Ended Scheme
Investment Objective: To provide long term capital appreciation by allocating funds in equity and equity related instruments. It
also has the flexibility to move, entirely if required, into debt instruments in times that the view on equity markets seems negative.
Auto
Banks
Construction Project
Consumer Non Durables
Ferrous Metals
Finance
Non - Ferrous Metals
Petroleum Products
Pharmaceuticals
Power
Software
Cash Equivalents
CBLO 193.15 4.24%
Reverse Repos 92.22 2.03%
Net Current Assets -32.70 -0.69%
Total Net Assets as on 31-Oct-2017 4,553.08 100.00%
Maruti Suzuki India 213.49 4.69%
Tata Motors 171.36 3.76%
Mahindra & Mahindra 161.38 3.54%
HDFC Bank 434.04 9.53%
ICICI Bank 288.10 6.33%
Kotak Mahindra Bank 205.01 4.50%
IndusInd Bank 178.99 3.93%
Yes Bank 157.13 3.45%
Larsen & Toubro 244.46 5.37%
ITC 292.27 6.42%
Tata Steel 175.95 3.86%
JSW Steel 113.72 2.50%
HDFC 358.55 7.87%
Vedanta 199.11 4.37%
Reliance Industries 413.97 9.09%
Aurobindo Pharma 136.80 3.00%
NTPC 146.81 3.22%
Power Grid Corporation of India 141.94 3.12%
Infosys 267.34 5.87%
Investors understand that their principalwill be at Moderately High risk
Riskometer
Mod
erately Moderate
Low
Hig
h
Low
High
LOW HIGH
Moderately
This product is suitable forinvestors who are seeking*:
• To create wealth over longterm
• Invests in equity and equityrelated securities and in debtinstruments when view onequity markets is negative
HSBC Dynamic Fund (HDF)
* Investors should consult their financial advisers if in doubt aboutwhether the product is suitable for them.

HSBC Emerging Markets Fund (HEMF)
This product is suitable for investors who are seeking*:
�
�
�
Overnight liquidity over short term
Investment in Money Market Instruments
Low riskLOW RISK
(BLUE)
Note: Risk is represented as -
*Investors should consult their financial advisers if in doubt whether the product issuitable for them
11
FUND DETAILS
Weighted Average Monthly Total Expenses ratios(Annualized)
Regular 2.69%
Direct Plan 1.99%
(inclusive of underlying scheme's expenses)
Excludes GST on Investment Management fees of 0.09% of TotalNetAssets.
Asset Allocation
Overseas Mutual Fund 97.86%
Reverse Repos/CBLOs 3.29%
Net CurrentAssets -1.15%
Total NetAssets 100.00%
Statistical ratios disclosed as per monthly returns forthe last 3 years.
(absolute)
@ Effective from March 1, 2013 for prospective investments.
**Risk free rate: % (FIMMDA-NSE Mibor) as on ,2017)
6.00 Oct 31
Upon payment of dividend, the NAV per unit falls to the extent of payout and statutory levy, if any. Face value: 10 per unit.`
FUND PORTFOLIO
Overseas Mutual Fund
Cash Equivalents
CBLO 21.16 2.23%
Reverse Repos 10.10 1.06%
Net Current Assets -10.97 -1.15%
Total Net Assets as on 31-Oct-2017 949.89 100.00%
HSBC GIF Glob Emerg Mkts Eq S1 Dis 929.61 97.86%
IssuerMarket Value
( in Lacs)`
% to NetAssets
An Open Ended Scheme
Investment Objective: To provide long term capital appreciation by investing in India and in the emerging markets, in equityand equity related instruments, share classes and units/securities issued by overseas mutual funds or unit trusts. The fund mayalso invest a limited proportion in domestic debt and money market instruments.
Date of Allotment
Benchmark
NAV (Growth)(as on 31 )
Fund Manager
SIP
Minimum
Application Amount
Exit Load
Standard Deviation
Beta (Slope)
Sharpe Ratio**
per unit
Monthly Average AUM(In Lakhs)
@
.10.17
Statistical Ratios
17-Mar-08
MSCI EmergingMarkets Index
13.8497
949.48
Ranjithgopal K A(Dedicated fund
manager foroverseas
investments)
Available
10,000
1,000 p.m.(SIP)
Nil
4.11%
1.1560
0.0230
`
`
`
Dividend DeclarationRecord Date / periodof dividend declared
Dividend ( per unit)Non-Institutional
` Dividend ( per unit)Institutional
` NAV ( ) per unit(cum dividend)
`
HSBC - Emerging Market Fund - Dividend
HSBC - Emerging Market Fund - Dividend - Direct Plan27-Jun-14 0.50000 0.50000 11.5335
27-Jun-14 0.50000 0.50000 11.6656
Investors understand that their principalwill be at High risk
Riskometer
Mod
erately Moderate
Low
Hig
h
Low
High
LOW HIGH
Moderately
This product is suitable forinvestors who are seeking*:
• To create wealth over longterm
• Investment in equity andequity related securities ofEmerging economies
HSBC Emerging Markets Fund (HEMF)
* Investors should consult their financial advisers if in doubt aboutwhether the product is suitable for them.

HSBC Asia Pacific (Ex Japan)Dividend Yield Fund (HAPDF)
This product is suitable for investors who are seeking*:
�
�
�
Overnight liquidity over short term
Investment in Money Market Instruments
Low riskLOW RISK
(BLUE)
Note: Risk is represented as -
*Investors should consult their financial advisers if in doubt whether the product issuitable for them
12
FUND DETAILS
Weighted Average Monthly Total Expenses ratios(Annualized)
Regular 2.24%
Direct Plan 1.54%
(inclusive of underlying scheme's expenses)
Excludes GST on Investment Management fees of 0.05% of TotalNetAssets.
Asset Allocation
Overseas Mutual Fund 96.48%
Reverse Repos/CBLOs 3.65%
Net CurrentAssets -0.13%
Total NetAssets 100.00%
@ Effective from March 1, 2013 for prospective investments.
FUND PORTFOLIO
Overseas Mutual Fund
Cash Equivalents
CBLO 18.33 2.47%
Reverse Repos 8.75 1.18%
Net Current Assets -0.94 -0.13%
Total Net Assets as on 31-Oct-2017 742.94 100.00%
HSBC GIF Asia Pacific Ex Japan Eq HD-S9D 716.81 96.48%
IssuerMarket Value
( in Lacs)`
% to NetAssets
An Open Ended Fund of Funds Scheme
Investment Objective: The primary investment objective of the Scheme is to provide long term capital appreciation byinvesting predominantly in units of HSBC Global Investment Funds (HGIF) Asia Pacific Ex Japan Equity High Dividend Fund(HEHDF). The Scheme may also invest a certain proportion of its corpus in money market instruments and / or units of liquidmutual fund schemes, in order to meet liquidity requirements from time to time. However, there is no assurance that theinvestment objective of the Scheme will be achieved.
Date of AllotmentBenchmark
NAV (Growth)(as on 31 )
Fund Manager
SIPMinimumApplication Amount
Exit Load
per unit
Monthly Average AUM(In Lakhs)
@
.10.17
Standard Deviation
Beta (Slope)
Sharpe Ratio**
Statistical Ratios
24-Feb-14
MSCI AC Asia Pacific
ex Japan
Ranjithgopal K A (foroverseas investments),
Sanjay Shah (forinvestments in Indian
Market)
Available
10,000
1,000 p.m.(SIP)
Nil
737.67
`
`
`13.1755
3.33%
0.6750
0.0490
Investors understand that their principalwill be at High risk
RiskometerRiskometer
Mod
erately
Mod
erately ModerateModerate
Low
Low
Hig
hH
igh
Low
Low
HighHigh
LOWLOW HIGHHIGH
Moderately
Moderately
This product is suitable forinvestors who are seeking*:
• To create wealth over longterm
• Investment in equity and equityrelated securities of Asia Pacificcountries (excluding Japan)through fund of funds route
HSBC Asia Pacific (Ex Japan)Dividend Yield Fund (HAPDF)
* Investors should consult their financial advisers if in doubt aboutwhether the product is suitable for them.
Statistical ratios disclosed as per monthly returns forthe last 3 years.
(absolute)
@ Effective from March 1, 2013 for prospective investments.
**Risk free rate: % (FIMMDA-NSE Mibor) as on ,2017)
6.00 Oct 31

HSBC Brazil Fund (HBF)
This product is suitable for investors who are seeking*:
�
�
�
Overnight liquidity over short term
Investment in Money Market Instruments
Low riskLOW RISK
(BLUE)
Note: Risk is represented as -
*Investors should consult their financial advisers if in doubt whether the product issuitable for them
13
FUND DETAILS
Weighted Average Monthly Total Expenses ratios(Annualized)
Regular 2.68%
Direct Plan 1.98%
(inclusive of underlying scheme's expenses)
Excludes GST on Investment Management fees of 0.20% of TotalNetAssets.
Asset Allocation
Overseas Mutual Fund 96.95%
Reverse Repos/CBLOs 2.84%
Net CurrentAssets 0.21%
Total NetAssets 100.00%
Statistical ratios disclosed as per monthly returns forthe last 3 years.
(absolute)
@ Effective from March 1, 2013 for prospective investments.
**Risk free rate: % (FIMMDA-NSE Mibor) as on ,2017)
6.00 Oct 31
FUND PORTFOLIO
Overseas Mutual Fund
Cash Equivalents
CBLO 49.50 1.92%
Reverse Repos 23.63 0.92%
Net Current Assets 5.46 0.21%
Total Net Assets as on 31-Oct-2017 2,577.00 100.00%
HSBC GIF Brazil Equity S3D 2,498.42 96.95%
IssuerMarket Value
( in Lacs)`
% to NetAssets
An Open-Ended Fund of Funds Scheme
Investment Objective: The primary investment objective of the Scheme is to provide long term capital appreciation byinvesting predominantly in units/shares of HSBC Global Investment Funds (HGIF) Brazil Equity Fund. The Scheme may, at thediscretion of the Investment Manager, also invest in the units of other similar overseas mutual fund schemes, which mayconstitute a significant part of its corpus. The Scheme may also invest a certain proportion of its corpus in money marketinstruments and/or units of liquid mutual fund schemes, in order to meet liquidity requirements from time to time.
Date of Allotment
Benchmark
NAV (Growth)(as on 31 )
Fund Manager
SIP
Minimum
Application Amount
Exit Load
Standard Deviation
Beta (Slope)
Sharpe Ratio**
per unit
Monthly Average AUM(In Lakhs)
@
.10.17
Statistical Ratios
06-May-11
MSCI Brazil 10/40 Index
7.5176
2,759.03
Ranjithgopal K A(Dedicated fund
manager for overseasinvestments)
Available
10,000
1,000 p.m.(SIP)
Nil
9.46%
0.8730
-0.0340
`
`
`
Investors understand that their principalwill be at High risk
Riskometer
Mod
erately Moderate
Low
Hig
h
Low
High
LOW HIGH
Moderately
This product is suitable forinvestors who are seeking*:
• To create wealth over longterm
• Invests in equity and equityrelated securities throughfeeder route in Brazilianmarkets
HSBC Brazil Fund (HBF)
* Investors should consult their financial advisers if in doubt aboutwhether the product is suitable for them.

HSBC Managed Solutions India - Growth (HMSG)
This product is suitable for investors who are seeking*:
�
�
�
Overnight liquidity over short term
Investment in Money Market Instruments
Low riskLOW RISK
(BLUE)
Note: Risk is represented as -
*Investors should consult their financial advisers if in doubt whether the product issuitable for them
14
FUND DETAILS
Weighted Average Monthly Total Expenses ratios(Annualized)
Regular 2.23%
Direct Plan 1.96%
(inclusive of underlying scheme's expenses)
Excludes GST on Investment Management fees of 0.00% of TotalNetAssets and of 0.24% on the underlying scheme's in which thefund of fund invests.
Asset Allocation
Mutual Fund 97.61%
Reverse Repos/CBLOs 2.51%
Net CurrentAssets -0.12%
Total NetAssets 100.00%
@ Effective from March 1, 2013 for prospective investments.
FUND PORTFOLIO
Mutual Fund
Cash Equivalents
CBLO 264.56 1.70%
Reverse Repos 126.31 0.81%
Net Current Assets -17.37 -0.12%
Total Net Assets as on 31-Oct-2017 15,592.30 100.00%
HSBC Equity Fund - Growth Direct 9,098.88 58.35%
HSBC Midcap Equity Fund - Growth Direct 3,121.44 20.02%
HSBC Income Fund Short Term - Growth Direct 1,323.38 8.49%
HSBC Income Fund Inv Plan Growth Direct 1,028.50 6.60%
HSBC Flexi Debt Fund Growth Direct 646.60 4.15%
IssuerMarket Value
( in Lacs)`
% to NetAssets
An Open Ended Fund of Funds Scheme
Investment Objective: The objective of the Plan is to provide long term total return primarily by seeking capital appreciationthrough an active asset allocation with diversification commensurate with the risk profile of investments by investingpredominantly in units of equity mutual funds as well as in a basket of debt mutual funds gold exchange traded funds (ETFs) andother ETFs, offshore mutual funds and money market instruments.
Date of Allotment
Benchmark
NAV (Growth)(as on 31 )
Fund Managers
SIP
Minimum
Application Amount
Exit Load
per unit
Monthly Average AUM
(In Lakhs)
@
.10.17
Standard Deviation
Beta (Slope)
Sharpe Ratio**
Statistical Ratios
30-Apr-14
Composite Index constituting80% of S&P BSE 200 Index
and 20% of CRISILBond Index
17.5090
15,215.13
Ranjithgopal K A (DedicatedFund Manager for investments
in foreign securities)
Gautam Bhupal (For managinginvestments in Indian Market –
Equity Portion)
Sanjay Shah (For managinginvestments in Indian Market –
Fixed Income Portion)
Available
5,000
1,000 p.m.(SIP)
Nil
Composite
`
`
`
3.36%
0.9470
0.1720
Investors understand that their principalwill be at Moderately High risk
Riskometer
M
oderately Moderate
Low
Hig
h
Low
High
LOW HIGH
Moderately
This product is suitable forinvestors who are seeking*:
• To create wealth over long term
• Investing predominantly in unitsof equity mutual funds as well asin a basket of debt mutual funds,gold & exchange traded funds,offshore mutual funds andmoney market instruments.
HSBC Managed Solutions India - Growth
* Investors should consult their financial advisers if in doubt aboutwhether the product is suitable for them.
Statistical ratios disclosed as per monthly returns forthe last 3 years.
(absolute)
@ Effective from March 1, 2013 for prospective investments.
**Risk free rate: % (FIMMDA-NSE Mibor) as on ,2017)
6.00 Oct 31

HSBC Managed Solutions India - Moderate (HMSM)
This product is suitable for investors who are seeking*:
�
�
�
Overnight liquidity over short term
Investment in Money Market Instruments
Low riskLOW RISK
(BLUE)
Note: Risk is represented as -
*Investors should consult their financial advisers if in doubt whether the product issuitable for them
15
FUND DETAILS
Weighted Average Monthly Total Expenses ratios(Annualized)
Regular 2.12%
Direct Plan 1.87%
(inclusive of underlying scheme's expenses)
Excludes GST on Investment Management fees of 0.00% of TotalNetAssets and of 0.21% on the underlying scheme's in which thefund of fund invests.
Asset Allocation
Mutual Fund 98.54%
Reverse Repos/CBLOs 1.02%
Net CurrentAssets 0.44%
Total NetAssets 100.00%
FUND PORTFOLIO
Mutual Fund
Cash Equivalents
CBLO 186.24 0.69%
Reverse Repos 88.92 0.33%
Net Current Assets 121.72 0.44%
Total Net Assets as on 31-Oct-2017 27,027.36 100.00%
HSBC Equity Fund - Growth Direct 12,957.26 47.94%
HSBC Midcap Equity Fund - Growth Direct 4,467.23 16.53%
HSBC Income Fund Short Term - Growth Direct 4,112.70 15.22%
HSBC Flexi Debt Fund Growth Direct 4,010.15 14.84%
HSBC Income Fund Inv Plan Growth Direct 1,083.14 4.01%
IssuerMarket Value
( in Lacs)`
% to NetAssets
An Open Ended Fund of Funds Scheme
Investment Objective: The objective of the fund is to provide long term total return aimed at capital appreciation and providingincome through an active asset allocation with diversification commensurate with the risk profile of investments by investing in abasket of debt mutual funds, equity mutual funds, gold ETFs and other ETFs, offshore mutual funds and money marketinstruments.
Date of Allotment
Benchmark
NAV (Growth)(as on 31 )
Fund Managers
SIP
Minimum
Application Amount
Exit Load
per unit
Monthly Average AUM
(In Lakhs)
@
.10.17
Standard Deviation
Beta (Slope)
Sharpe Ratio**
Statistical Ratios
30-Apr-14
CRISIL Balanced FundAggressive
16.5581
26,679.27
Ranjithgopal K A (DedicatedFund Manager for investments
in foreign securities)Gautam Bhupal (For managinginvestments in Indian Market –
Equity Portion)
Sanjay Shah (For managinginvestments in Indian Market –
Fixed Income Portion)
Available
5,000
1,000 p.m.(SIP)
Nil
Index
`
`
`
2.68%
0.9310
0.1920
Investors understand that their principalwill be at Moderately High risk
Riskometer
Mod
erately Moderate
Low
Hig
h
Low
High
LOW HIGH
Moderately
This product is suitable forinvestors who are seeking*:
• To create wealth and provideincome over the long term
• Investments in a basket of debtmutual funds, equity mutualfunds, gold & exchange tradedfunds, offshore mutual fundsand money market instruments.
HSBC Managed Solutions India - Moderate
* Investors should consult their financial advisers if in doubt aboutwhether the product is suitable for them.
Statistical ratios disclosed as per monthly returns forthe last 3 years.
(absolute)
@ Effective from March 1, 2013 for prospective investments.
**Risk free rate: % (FIMMDA-NSE Mibor) as on ,2017)
6.00 Oct 31

HSBC Managed Solutions India - Conservative (HMSC)
This product is suitable for investors who are seeking*:
�
�
�
Overnight liquidity over short term
Investment in Money Market Instruments
Low riskLOW RISK
(BLUE)
Note: Risk is represented as -
*Investors should consult their financial advisers if in doubt whether the product issuitable for them
16
FUND DETAILS
Weighted Average Monthly Total Expenses ratios(Annualized)
Regular 1.62%
Direct Plan 1.37%
(inclusive of underlying scheme's expenses)
Excludes GST on Investment Management fees of 0.04% of TotalNet Assets and of 0.11% on the underlying scheme's in which thefund of fund invests.
Asset Allocation
Mutual Fund 99.16%
Reverse Repos/CBLOs 1.24%
Net CurrentAssets -0.40%
Total NetAssets 100.00%
FUND PORTFOLIO
Mutual Fund
Cash Equivalents
CBLO 287.05 0.84%
Reverse Repos 137.05 0.40%
Net Current Assets -138.38 -0.40%
Total Net Assets as on 31-Oct-2017 34,288.62 100.00%
HSBC Income Fund Short Term - Growth Direct 14,443.93 42.12%
HSBC Flexi Debt Fund Growth Direct 7,794.76 22.73%
L&T Triple Ace Bond Fund Direct Growth 4,604.96 13.43%
HSBC Equity Fund - Growth Direct 3,417.81 9.97%
IDFC Dynamic Bond Fund-Direct Pl-Growth 1,636.05 4.77%
HSBC Income Fund Inv Plan Growth Direct 1,065.78 3.11%
HDFC Income Fund Direct Plan - Growth 1,039.61 3.03%
IssuerMarket Value
( in Lacs)`
% to NetAssets
An Open Ended Fund of Funds Scheme
Investment Objective: The objective of the Plan is to provide long term total return aimed at providing income through an active
asset allocation with diversification commensurate with the risk profile of investments by predominantly investing in units of debt
mutual funds as well as in a basket of equity mutual funds, gold ETFs and other ETFs and money market instruments.
Date of Allotment
Benchmark
NAV (Growth)(as on 31 )
Fund Managers
SIP
Minimum
Application Amount
Exit Load
per unit
Monthly Average AUM(In Lakhs)
@
.10.17
Standard Deviation
Beta (Slope)
Sharpe Ratio**
Statistical Ratios
30-Apr-14
Composite Index constitutingof 90% into CRISIL Composite
Bond Index and 10% of S&PBSE 200 Index
13.8342
Ranjithgopal K A (DedicatedFund Manager for investments
in foreign securities)(For managing
investments in Indian Market –Equity Portion)
Sanjay Shah (For managinginvestments in Indian Market –
Fixed Income Portion)
Available
5,000
1,000 p.m.(SIP)
Ni
`
34,067.67
Gautam Bhupal
`
`
0.89%
0.8620
0.1890
This product is suitable forinvestors who are seeking*:• To create wealth over long term• Investing predominantly in
units of debt mutual funds aswell as in a basket of equitymutual funds, gold & otherexchange traded funds andmoney market instruments.
Investors understand that their principalwill be at Moderate risk
Riskometer
Mod
erately Moderate
Low
Hig
h
Low
High
LOW HIGH
Moderately
HSBC Managed Solutions India - Conservative
* Investors should consult their financial advisers if in doubt aboutwhether the product is suitable for them.
Statistical ratios disclosed as per monthly returns forthe last 3 years.
(absolute)
@ Effective from March 1, 2013 for prospective investments.
**Risk free rate: % (FIMMDA-NSE Mibor) as on ,2017)
6.00 Oct 31

HSBC Global Consumer Opportunities Fund -(HGCOF)
Benefiting from China’sGrowing Consumption Power
17
FUND DETAILS
Weighted Average Monthly Total Expenses ratios(Annualized)
Regular 2.33%
Direct Plan 1.63%
(inclusive of underlying scheme's expenses)
Excludes GST on Investment Management fees of 0.06% of TotalNetAssets.
Asset Allocation
Overseas Mutual Fund 96.67%
Reverse Repos/CBLOs 2.58%
Net CurrentAssets 0.75%
Total NetAssets 100.00%
FUND PORTFOLIO
Overseas Mutual Fund
Cash Equivalents
CBLO 7.70 1.75%
Reverse Repos 3.68 0.83%
Net Current Assets 3.30 0.75%
Total Net Assets as on 31-Oct-2017 440.82 100.00%
HSBC GIF-China Consumer Opp S5 Cap 426.14 96.67%
IssuerMarket Value
( in Lacs)`
% to NetAssets
An Open-Ended Fund of Funds Scheme
Investment Objective: The primary investment objective of the scheme is to provide long term capital appreciation by investing
predominantly in units of HSBC Global Investment Funds (HGIF) China Consumer Opportunities Fund (Underlying scheme).
The Scheme may, also invest a certain proportion of its corpus in money market instruments and / or units of liquid mutual fund
schemes, in order to meet liquidity requirements from time to time.
Date of Allotment
Benchmark
NAV (Growth)(as on 31 )
Fund Managers
SIP
Minimum
Application Amount
Exit Load
per unit
Monthly Average AUM(In Lakhs)
@
.10.17
23-Feb-15
MSCI AC World Index
12.0604
442.50
Ranjithgopal K A (DedicatedFund Manager) & Sanjay Shah
(for investments in IndianMarket)
Available
,000
1,000 p.m.(SIP)
Nil
`
`
`
5
Investors understand that their principalwill be at High risk
Riskometer
M
oderately Moderate
Low
Hig
h
Low
High
LOW HIGH
Moderately
This product is suitable forinvestors who are seeking*:• To create wealth over long term• Investment in equity and equity
related securities around theworld focusing on growingconsumer behaviour of Chinathrough feeder route
HSBC Global Consumer Opportunities Fund - Benefiting fromChina’s Growing Consumption Power (HGCOF)
* Investors should consult their financial advisers if in doubt aboutwhether the product is suitable for them.
@ Effective from March 1, 2013 for prospective investments.

18
HSBC Equity Fund
HSBC India Opportunities Fund
HSBC Midcap Equity Fund
HSBC Infrastructure Equity Fund
HSBC Tax Saver Equity Fund
HSBC Dynamic Fund
HSBC Emerging Markets Fund
HSBC Brazil Fund
HSBC Asia Pacific (Ex Japan) Dividend Yield Fund
HSBC Managed Solutions
HSBC Global Consumer Opportunities Fund -Benefiting from China’s Growing Consumption Power
Neelotpal Sahai (from 27 May 2013)
Neelotpal Sahai (from 27 May 2013)
Dhiraj Sachdev (from 01 December 2009)
Dhiraj Sachdev (from 01 December 2009)
Aditya Khemani (from 24 February 2009)
For Equity portion: Neelotpal Sahai (from 27 May 2013) &For Debt portion: Sanjay Shah (from 14 August 2009)
Ranjithgopal K A (from 27 February 2017)
Ranjithgopal K A (from 27 February 2017)
For overseas investments: &For investment in Indian markets: Sanjay Shah (from 24 February 2014)
Ranjithgopal K A (from 27 February 2017)
For overseas investment : ,For Investments in Indian Market - Equity Portion :
& For Investments in Indian Market - Debt Portion :Sanjay Shah (April 2014)
Gautam Bhupal(from 21 Oct 2015)
Ranjithgopal K A (from 27 February 2017)
For Overseas Market :For Investments in Indian Market - Debt Portion : Sanjay Shah(from 13 February 2015)
Ranjithgopal K A (from 27 February 2017)
Name of Scheme Fund Manager
Fund Manager’s Experience
Dhiraj SachdevSenior Vice President and Fund Manager - EquitiesB.Com., ACA, ACMA, Diploma in Foreign Trade Management (DFTM)
Experience:
Over 20 years experience in Equity Research and Fund Management.
HSBC Asset Management (India) Private LtdSenior Vice President & Fund Manager, from October 2011 to present,Senior Fund Manager from 1 December 2009 to September 2011,Head of Equity-Portfolio Management Services from October 2005 to November 2009
ASK Raymond James Securities India Private LtdPortfolio Manager from October 2003 to September 2005
HDFC Bank LtdSenior Manager Equities from November 1999 to September 2003
DSQ Software LtdBusiness Analyst from June 1999 to November 1999
Probity Research & Services Ltd (India Infoline Ltd)Research Analyst from November 1998 to May 1999
Ford Brothers Capital Services (P) LtdManager Research from July 1996 to Sept 1998
�
�
�
�
�
�
Gautam Bhupal
Vice President & Fund Manager Equities
Post Graduate Diploma in Business Management, CA, CS, B.Com (Hons)
Over 12 years of experience in areas of research and Fund Management.
HSBC Asset Management (India) Private LimitedVice President & Fund Manager, since October 2015 till date.
Fund Manager for PMS Portfolios from July 2008 till June 2015.
UTI Asset Management CompanyEquity Research Analyst from May 2004 till June 2008.
Experience:
�
�
Vice President - Investment Management, from June 2015 to October 2015.
Fund Managers - Equity

This product is suitable for investors who are seeking*:
�
�
�
Overnight liquidity over short term
Investment in Money Market Instruments
Low riskLOW RISK
(BLUE)
Note: Risk is represented as -
*Investors should consult their financial advisers if in doubt whether the product issuitable for them
19
Neelotpal Sahai
Senior Vice President & Fund Manager - Equities
B.Tech, PGDM (IIM Kolkata)
Over 24 years of experience in Research and Fund Management.
HSBC Asset Management (India) Private LtdSenior Fund Manager – Equities from April 2013 onwards.
IDFC Asset Management Company Ltd.Director from February 2006 to April 2013
Motilal Oswal Securities LtdSenior Research Analyst from March 2005 to January 2006
Infosys LtdSenior Project Manager from June 1999 to March 2005
Vickers Ballas Securities LtdAnalyst from September 1998 to June 1999
SBC WarburgAnalyst from May 1997 to May 1998
UTI Securities LtdEquity Analyst from June 1995 to May 1997
Experience:
�
�
�
�
�
�
�
Aditya Khemani
Vice President & Fund Manager - Equities
B.Com. (Hons.), Post Graduate Diploma in Business Management
Over 11 years experience in research.
HSBC Asset Management (India) Private Ltd
Vice President & Fund Manager (Equity), from April 2012 to present,Assistant Fund Manager, Equities from February 2009 to March 2012;Associate Vice President - Investment Management from October 2007 to February 2009.
SBI Funds Management India Private Ltd
Senior Manager - Equity Research from March 2007 to September 2007
Prudential ICICI Asset Management Company India Private Ltd
Assistant Manager - Equity Research from December 2005 to February 2007
Morgan Stanley Advantage Services India Private Ltd
Research Associate from May 2005 to November 2005
Experience:
�
�
�
�
Ranjithgopal K A
Vice President - Equities from March 2016 onwards
Associate Vice President - Investment Management (Analyst) from January 2012 to February 2016
Associate Vice President - Institutional Sales from April 2009 to December 2011
Associate Vice President - Sales & Distribution from May 2006 to April 2009
Vice President - Equities
PGDBM, BA - Economics
Over 10 years of experience in Equity Research & Sales
HSBC Asset Management (India) Private Ltd
Experience:
�
Fund Managers - Equity

20
Funds Managed by Neelotpal Sahai.(Total Schemes Managed 3)
Funds Managed by Neelotpal Sahai.(Total Schemes Managed 3)
HSBC Equity Fund Date of Inception : 10 Dec 02
Scheme Name & Benchmarks 1 Year 3 Years 5 Years SinceInception
HSBC Equity Fund - Growth
(Scheme Benchmark)
(Standard Benchmark)
10,000, if invested in HEF, would have become
10,000, if invested in , would have become
10,000, if invested in , would have become
`
`
`
Nifty 50
S&P BSE Sensex
Nifty 50
S&P BSE Sensex
18.70% 10.63% 14.34% 22.17%
19.77% 7.48% 12.95% 16.48%
18.86% 6.02% 12.40% 16.78%
11,870 13,539 19,545 198,706
11,977 12,416 18,385 97,570
11,886 11,917 17,942 101,391
` ` ` `
` ` ` `
` ` ` `
HSBC India Opportunities Fund
HSBC Dynamic Fund
Date of Inception : 24 Feb 04
Date of Inception : 24 Sep 07
Scheme Name & Benchmarks
Scheme Name & Benchmarks
SinceInception
SinceInception
HSBC India Opportunities Fund - Growth
S&P BSE 200 (Scheme Benchmark)
(Standard Benchmark)
10,000, if invested in HIOF, would have become
10,000, if invested in S&P BSE 200, would have become
10,000, if invested in , would have become
Nifty 50
Nifty 50
`
`
`
HSBC Dynamic Fund - Growth
S&P BSE 200 (Scheme Benchmark)
(Standard Benchmark)
10,000, if invested in HDF, would have become
10,000, if invested in S&P BSE 200, would have become
10,000, if invested in , would have become
Nifty 50
Nifty 50
`
`
`
18.94% 12.81% 19.36% 17.11%
20.74% 10.20% 14.81% 14.24%
19.77% 7.48% 12.95% 13.52%
11,894 14,355 24,226 86,985
12,074 13,383 19,944 61,895
11,977 12,416 18,385 56,765
` ` ` `
` ` ` `
` ` ` `
17.49% 9.10% 11.19% 5.59%
20.74% 10.20% 14.81% 8.08%
19.77% 7.48% 12.95% 7.59%
11,749 12,988 16,997 17,325
12,074 13,383 19,944 21,934
11,977 12,416 18,385 20,959
` ` ` `
` ` ` `
` ` ` `
Past performance may or may not be sustained in the future. Refer note below.
The said Fund is managed by Neelotpal Sahai Effective (27 May 2013)
The said Fund is managed by Neelotpal Sahai Effective (27 May 2013)
The said Fund is managed by Neelotpal Sahai Effective (27 May 2013)
The said Fund is managed by Sanjay Shah Effective (14 August 2009)
Past performance may or may not be sustained in the future. Refer note below.
Funds Managed by Neelotpal Sahai (for Equity portion)Sanjay Shah (for Fixed Income portion)
(Total Schemes Managed 3)Funds Managed by (Total Schemes Managed 10)
Past performance may or may not be sustained in the future. Refer note below.
Returns are of growth option. The returns for the respective periods are provided as on 31st October 2017. Returns above 1 year are Compounded Annualized. Standardbenchmark is prescribed by SEBI and is used for comparison purposes. Returns on 10,000 are point-to-point returns for the specific time period, invested at the start of theperiod. The returns provided above have been rounded off and hence there may be minor differences between point-to-point returns vis-a-vis returns indicated above.Different plans shall have a different expense structure. The performance details provided herein are of other than Direct plan.
`
Scheme count for the total schemes managed by the Fund Managers does not include closed ended scheme.
Fund Manager Wise Comparative Performance of Equity Schemes
1 Year 3 Years 5 Years
1 Year 3 Years 5 Years

21
HSBC Brazil Fund Date of Inception : 06 May 11
Scheme Name & Benchmarks SinceInception
HSBC Brazil Fund - Growth
MSCI Brazil 10/40 Index (Scheme Benchmark)
(Standard Benchmark)
10,000, if invested in HBF, would have become
10,000, if invested in MSCI Brazil 10/40 Index, would have become
10,000, if invested in , would have become
Nifty 50
Nifty 50
`
`
`
0.95% -2.93% -4.17% -4.30%
5.94% -1.90% -4.12% -7.48%
19.77% 7.48% 12.95% 10.04%
10,095 9,146 8,080 7,517
10,594 9,441 8,104 6,033
11,977 12,416 18,385 18,622
` ` ` `
` ` ` `
` ` ` `
Past performance may or may not be sustained in the future. Refer note below
Returns are of growth option. The returns for the respective periods are provided as on 31st October 2017. Returns above 1 year are Compounded Annualized. Standardbenchmark is prescribed by SEBI and is used for comparison purposes. Returns on 10,000 are point-to-point returns for the specific time period, invested at the start of theperiod. The returns provided above have been rounded off and hence there may be minor differences between point-to-point returns vis-a-vis returns indicated above.Different plans shall have a different expense structure. The performance details provided herein are of other than Direct plan.Scheme count for the total schemes managed by the Fund Managers does not include closed ended scheme.
`
Fund Manager Wise Comparative Performance of Equity Schemes
1 Year 3 Years 5 Years
Funds Managed by - Ranjithgopal K A (Total Schemes Managed 7)
Funds Managed by - Ranjithgopal K A (Total Schemes Managed 7)
HSBC Emerging Markets Fund Date of Inception : 17 Mar 08
Scheme Name & Benchmarks SinceInception
HSBC Emerging Markets Fund - Growth
MSCI Emerging Market Index (Scheme Benchmark)
(Standard Benchmark)
10,000, if invested in HMEF, would have become
10,000, if invested in MSCI Emerging Market Index, would have become
10,000, if invested in , would have become
Nifty 50
Nifty 50
`
`
`
21.93% 6.35% 6.56% 3.44%
22.93% 6.85% 6.29% 3.41%
19.77% 7.48% 12.95% 9.01%
12,193 12,030 13,739 13,851
12,293 12,200 13,564 13,810
11,977 12,416 18,385 22,957
` ` ` `
` ` ` `
` ` ` `
Past performance may or may not be sustained in the future. Refer note below.
1 Year 3 Years 5 Years
The said Fund is managed by Ranjithgopal K A Effective (27 February 2017)
The said Fund is managed by Ranjithgopal K A Effective (27 February 2017)
HSBC Asia Pacific (Ex Japan) DividendYield Fund
Date of Inception : 24 Feb 14
Scheme Name & Benchmarks 1 Year 3 Years SinceInception
HSBC Asia Pacific (Ex Japan) Dividend Yield Fund - Growth
MSCI AC Asia Pacific ex Japan (Scheme Benchmark)
(Standard Benchmark)
10,000, if invested in HAPDF, would have become
10,000, if invested in MSCI AC Asia Pacific ex Japan, would have become
10,000, if invested in , would have become
Nifty 50
Nifty 50
`
`
`
20.62% 7.54% 7.77%
24.33% 4.30% 5.13%
19.77% 7.48% 14.95%
12,062 12,438 13,178
12,433 11,346 12,026
11,977 12,416 16,714
` ` `
` ` `
` ` `
Past performance may or may not be sustained in the future. Refer note below.
Funds Managed by Sanjay Shah (for Fixed Income portion) (Total Schemes Managed 10)
Funds Managed by Ranjithgopal K A (For overseas investment) (Total Schemes Managed 7)
The said Fund is managed by Ranjithgopal K A Effective (27 February 2017)
The said Fund is managed by Sanjay Shah Effective (24 February 2014)
The said Fund has been in existence for more than 3 years but less than 5 years

22
HSBC Global Consumer Opportunities Fund -Benefiting from China's Growing Consumption Power
Date of Inception : 24 Feb 15
Scheme Name & BenchmarksScheme Name & BenchmarksScheme Name & Benchmarks 1 Year1 Year1 Year SinceInception
SinceInception
SinceInception
HSBC Global Consumer Opportunities Fund - Benefiting from China'sGrowing Consumption Power - Growth
MSCI AC World Index (Scheme Benchmark)
Nifty 50 (Standard Benchmark)
10,000, if invested in HGCOF, would have become
10,000, if invested in MSCI AC World Index, would have become
10,000, if invested in Nifty 50, would have become
`
`
`
Past performance may or may not be sustained in the future. Refer note below.Past performance may or may not be sustained in the future. Refer note below.Past performance may or may not be sustained in the future. Refer note below.Past performance may or may not be sustained in the future. Refer note below.
27.18% 7.22%
20.83% 5.36%
19.77% 6.37%
12,718 12,063
12,083 11,508
11,977 11,807
` `
` `
` `
Please Note : NAmeans not available.* BSE vide its notification dated April 10, 2015 have notified change in the index composition of S&P BSE Midcap Index. As a result returns for the said benchmark are different when comparedto the historically published returns. The corresponding benchmark returns for inception of the scheme has not been provided, as the historical index data for S&P BSE Midcap Index is availableonly from Sept 16, 2005 whereas the inception date of the scheme is May 19, 2005.
Fund Manager Wise Comparative Performance of Equity Schemes
Funds Managed by - Dhiraj Sachdev (Total Schemes Managed 2)
Funds Managed by - Dhiraj Sachdev (Total Schemes Managed 2)
HSBC Midcap Equity Fund Date of Inception : 19 May 05
Scheme Name & Benchmarks SinceInception
HSBC Midcap Equity Fund - Growth
S&P BSE Midcap (Scheme Benchmark)
(Standard Benchmark)
10,000, if invested in HMEF, would have become
10,000, if invested in S&P BSE Midcap, would have become
10,000, if invested in , would have become
Nifty 50
Nifty 50
`
`
`
*
26.79% 20.58% 25.07% 15.39%
23.06% 19.02% 20.35% NA
19.77% 7.48% 12.95% 14.13%
12,679 17,531 30,600 56,796
12,306 16,859 25,251 NA
11,977 12,416 18,385 49,724
` ` ` `
` ` `
` ` ` `
Past performance may or may not be sustained in the future. Refer note below.
Returns are of growth option. The returns for the respective periods are provided as on . Returns above 1 year are Compounded Annualized. Standard benchmark isprescribed by SEBI and is used for comparison purposes. Returns on 10,000 are point-to-point returns for the specific time period, invested at the start of the period. The returns providedabove have been rounded off and hence there may be minor differences between point-to-point returns vis-a-vis returns indicated above. Different plans shall have a different expensestructure. The performance details provided herein are of other than Direct plan.Scheme count for the total schemes managed by the Fund Managers does not include closed ended scheme.
31st October 2017`
1 Year 3 Years 5 Years
HSBC Infrastructure Equity Fund Date of Inception : 23 Feb 06
Scheme Name & Benchmarks SinceInception
HSBC Infrastructure Equity Fund - Growth
S&P BSE India Infrastructure (Scheme Benchmark)
Nifty 50 (Standard Benchmark)
10,000, if invested in HIEF, would have become
10,000, if invested in S&P BSE India Infrastructure, would have become
10,000, if invested in Nifty 50, would have become
$
`
`
`
34.05% 13.51% 17.06% 8.20%
24.65% 9.40% NA NA
19.77% 7.48% 12.95% 10.96%
13,405 14,624 21,978 13,107
12,465 13,093 NA NA
11,977 12,416 18,385 14,292
` ` ` `
` `
` ` ` `
Past performance may or may not be sustained in the future. Refer note below.
1 Year 3 Years 5 Years
Funds Managed by Sanjay Shah (for Fixed Income portion) (Total Schemes Managed 10)
Funds Managed by Ranjithgopal K A (For overseas investment) (Total Schemes Managed 7)
The said Fund is managed by Ranjithgopal K A Effective (27 February 2017)
The said Fund is managed by Sanjay Shah Effective (13 February 2015)
The said Fund is managed by Dhiraj Sachdev Effective (01 December 2009)
The said Fund is managed by Dhiraj Sachdev Effective (01 December 2009)
The said Fund has been in existence for more than 1 year but less than 3 years
Please Note : NAmeans not available.$The benchmark of the scheme was changed from S&P BSE 200 to S&P BSE India Infrastructure Index with effect from 11th November, 2016 as a more suitable benchmarkwas identified which better matched the portfolio strategy. There has been no change to investment management of the scheme. Since, S&P BSE India Infrastructure Indexwas launched on May 19, 2014 and the historic index data prior to the said date is not available, wherever scheme’s corresponding benchmark returns are not available, thesame has not been provided.

HSBC Managed Solutions - Growth Date of Inception : 30 Apr 14
Scheme Name & Benchmarks 1 Year 3 Years SinceInception
HSBC Managed Solutions - Growth - Growth
Customised Benchmark Index Fund (Scheme Benchmark)*
(Standard Benchmark)Nifty 50
Crisil 10 Year Gilt Index (Standard Benchmark)
10,000, if invested in HMSG, would have become
10,000, if invested in Customised Benchmark Index, would have become
10,000, if invested in Nifty 50, would have become
10,000, if invested in Crisil 10 Year Gilt Index, would have become
`
`
`
`
18.48% 12.98% 17.32%
18.03% 10.14% 15.03%
19.77% 7.48% 13.17%
5.12% 9.43% 10.00%
11,848 14,422 17,517
11,803 13,363 16,347
11,977 12,416 15,439
10,512 13,103 13,973
` ` `
` ` `
` ` `
` ` `
Past performance may or may not be sustained in the future. Refer note below.
*Composite index of S&P BSE 200 (80%) and Crisil Composite Bond Fund Index (20%).
Fund Manager Wise Comparative Performance of Equity Schemes
23
Returns are of growth option. The returns for the respective periods are provided as on 31st October 2017. Returns above 1 year are Compounded Annualized. Standardbenchmark is prescribed by SEBI and is used for comparison purposes. Returns on 10,000 are point-to-point returns for the specific time period, invested at the start of the period.The returns provided above have been rounded off and hence there may be minor differences between point-to-point returns vis-a-vis returns indicated above. Different plansshall have a different expense structure. The performance details provided herein are of other than Direct plan.Scheme count for the total schemes managed by the Fund Managers does not include closed ended scheme.
`
HSBC Tax Saver Equity Fund Date of Inception : 05 Jan 07
Scheme Name & Benchmarks SinceInception
HSBC Tax Saver Equity Fund - Growth
S&P BSE 200 (Scheme Benchmark)
(Standard Benchmark)
10,000, if invested in HTSF, would have become
10,000, if invested in S&P BSE 200, would have become
10,000, if invested in , would have become
Nifty 50
Nifty 50
`
`
`
23.49% 13.54% 19.18% 13.02%
20.74% 10.20% 14.81% 9.72%
19.77% 7.48% 12.95% 9.21%
12,349 14,637 24,049 37,637
12,074 13,383 19,944 27,307
11,977 12,416 18,385 25,952
` ` ` `
` ` ` `
` ` ` `
Funds Managed by - Aditya Khemani (Total Schemes Managed 2)
Past performance may or may not be sustained in the future. Refer note below.
1 Year 3 Years 5 Years
The said Fund is managed by Gautam Bhupal Effective (21 October 2015)
The said Fund is managed by Sanjay Shah Effective (April 2014)
The said Fund is managed by Aditya Khemani Effective (24 February 2009)
The said Fund is managed by Ranjithgopal K A Effective (27 February 2017)
Funds Managed by Gautam Bhupal (for Equity portion)Sanjay Shah (for Fixed Income portion)
(For overseas investment)
(Total Schemes Managed 3)Funds Managed by (Total Schemes Managed 10)Funds Managed by Ranjithgopal K A (Total Schemes Managed 7)
The said Fund has been in existence for more than 3 years but less than 5 years

24
*Composite index of Crisil Composite Bond Fund Index (90%) and S&P BSE 200 (10%).
Fund Manager Wise Comparative Performance of Equity Schemes
Returns are of growth option. The returns for the respective periods are provided as on 31st October 2017. Returns above 1 year are Compounded Annualized. Standardbenchmark is prescribed by SEBI and is used for comparison purposes. Returns on 10,000 are point-to-point returns for the specific time period, invested at the start of the period.The returns provided above have been rounded off and hence there may be minor differences between point-to-point returns vis-a-vis returns indicated above. Different plansshall have a different expense structure. The performance details provided herein are of other than Direct plan.Scheme count for the total schemes managed by the Fund Managers does not include closed ended scheme.
`
Past performance may or may not be sustained in the future. Refer note below.
HSBC Managed Solutions - Moderate - Growth Date of Inception : 30 Apr 14
Scheme Name & Benchmarks 1 Year 3 Years SinceInception
HSBC Managed Solutions - Moderate - Growth
CRISIL Balanced Fund – Aggressive Index (Scheme Benchmark)
Nifty 50 (Standard Benchmark)
Crisil 10 Year Gilt Index (Standard Benchmark)
10,000, if invested in HMSM, would have become
10,000,if investedinCRISILBalancedFund–AggressiveIndex,wouldhavebecome
10,000, if invested in Nifty 50, would have become
10,000, if invested in Crisil 10 Year Gilt Index, would have become
`
`
`
`
16.10% 12.39% 15.47%
15.40% 8.56% 12.52%
19.77% 7.48% 13.17%
5.12% 9.43% 10.00%
11,610 14,197 16,565
11,540 12,794 15,128
11,977 12,416 15,439
10,512 13,103 13,973
` ` `
` ` `
` ` `
` ` `
Funds Managed by Gautam Bhupal (for Equity portion)Sanjay Shah (for Fixed Income portion)
(For overseas investment)
(Total Schemes Managed 3)Funds Managed by (Total Schemes Managed 10)Funds Managed by Ranjithgopal K A (Total Schemes Managed 7)
The said Fund is managed by Gautam Bhupal Effective (21 October 2015)
The said Fund is managed by Sanjay Shah Effective (April 2014)
The said Fund is managed by Ranjithgopal K A Effective (27 February 2017)
Past performance may or may not be sustained in the future. Refer note below.
HSBC Managed Solutions - Conservative - Growth Date of Inception : 30 Apr 14
Scheme Name & Benchmarks 1 Year 3 Years SinceInception
HSBC Managed Solutions - Conservative - Growth
Customised Benchmark Index Fund (Scheme Benchmark)*
Nifty 50 (Standard Benchmark)
Crisil 10 Year Gilt Index (Standard Benchmark)
10,000, if invested in HMSC, would have become
10,000, if invested in Customised Benchmark Index, would have become
10,000, if invested in Nifty 50, would have become
10,000, if invested in Crisil 10 Year Gilt Index, would have become
`
`
`
`
6.91% 8.27% 9.70%
8.54% 9.95% 11.19%
19.77% 7.48% 13.17%
5.12% 9.43% 10.00%
10,691 12,692 13,838
10,854 13,291 14,511
11,977 12,416 15,439
10,512 13,103 13,973
` ` `
` ` `
` ` `
` ` `
Funds Managed by Gautam Bhupal (for Equity portion)Sanjay Shah (for Fixed Income portion)
(For overseas investment)
(Total Schemes Managed 3)Funds Managed by (Total Schemes Managed 10)Funds Managed by Ranjithgopal K A (Total Schemes Managed 7)
The said Fund is managed by Gautam Bhupal Effective (21 October 2015)
The said Fund is managed by Sanjay Shah Effective (April 2014)
The said Fund is managed by Ranjithgopal K A Effective (27 February 2017)
The said Fund has been in existence for more than 3 years but less than 5 years
The said Fund has been in existence for more than 3 years but less than 5 years

25
HSBC Equity Fund
HSBC India Opportunities Fund
HSBC Dynamic Fund
Date of Inception : 10 Dec 02
Date of Inception : 24 Feb 04
Date of Inception : 24 Sep 07
Scheme Name & Benchmarks
Scheme Name & Benchmarks
Scheme Name & Benchmarks
1Year
1Year
1Year
3Years
3Years
3Years
5Years
5Years
5Years
SinceInception
SinceInception
SinceInception
Total amount invested ( )
Market Value as on , 2017 ( )
Scheme Returns (%)
Scheme Benchmark ( )
Scheme Benchmark Returns (%)
Standard Benchmark ( )
Standard Benchmark Returns (%)
`
`
`
`
-
-
-
-
Oct 31
Nifty 50
Nifty 50
S&P BSE Sensex
S&P BSE Sensex
Total amount invested ( )
Scheme Returns (%)
Scheme Benchmark ( )
Scheme Benchmark Returns (%)
Standard Benchmark ( )
Standard Benchmark Returns (%)
`
`
`
Market Value as on
S&P BSE 200 -
S&P BSE 200 -
Nifty 50 -
Nifty 50 -
Oct 31, 2017 ( )`
Total amount invested ( )
Scheme Returns (%)
Scheme Benchmark ( )
Scheme Benchmark Returns (%)
Standard Benchmark ( )
Standard Benchmark Returns (%)
`
`
`
Market Value as on
S&P BSE 200 -
S&P BSE 200 -
Nifty 50 -
Nifty 50 -
Oct 31, 2017 ( )`
120000 360000 600000 1790000
134610 452745 881357 6333711
23.35 15.46 15.37 15.46
135487 437096 831597 5190586
24.80 13.01 13.01 13.15
134832 429538 809630 5125278
23.72 11.81 11.93 13.00
120000 360000 600000 1650000
136603 460661 977024 5082327
26.65 16.68 19.58 15.11
136978 452051 882441 4228083
27.27 15.36 15.42 12.75
135487 437096 831597 3980008
24.80 13.01 13.01 11.96
120000 360000 600000 1220000
133197 435444 823955 1994576
21.03 12.75 12.64 9.34
136978 452051 882441 2339065
27.27 15.36 15.42 12.28
135487 437096 831597 2184821
24.80 13.01 13.01 11.02
The Fund offers flexible and convenient Systematic Investment Plan (SIP) facility. To illustrate the advantages of SIP investments, this is how your investments would havegrown if you had invested say 10,000 systematically on the first Business Day of every month over a period of time in the Growth Option of Respective Scheme.
The returns are calculated by XIRR approach assuming investment of 10,000/- on the 1st working day of every month. XIRR helps in calculating return on investments givenan initial and final value and a series of cash inflows and outflows with correct allowance for the time impact of the transactions. Data as on , 2017.
`
`
October 31
SIP Performance of Equity Schemes
Returns shown for Regular Plan - Growth Option
Past performance may or may not be sustained in the future. Refer note below
Past performance may or may not be sustained in the future. Refer note below
Past performance may or may not be sustained in the future. Refer note below
Returns are of growth option. The returns for the respective periods are provided as on 31st October 2017. Returns above 1 year are Compounded Annualized. Standardbenchmark is prescribed by SEBI and is used for comparison purposes. Returns on 10,000 are point-to-point returns for the specific time period, invested at the start of theperiod. The returns provided above have been rounded off and hence there may be minor differences between point-to-point returns vis-a-vis returns indicated above.Different plans shall have a different expense structure. The performance details provided herein are of other than Direct plan.Scheme count for the total schemes managed by the Fund Managers does not include closed ended scheme.
`

SIP Performance of Equity Schemes
26
HSBC Brazil Fund Date of Inception : 06 May 11
Scheme Name & Benchmarks 1Year
3Years
5Years
SinceInception
Total amount invested ( )
Scheme Returns (%)
Scheme Benchmark ( )
Scheme Benchmark Returns (%)
Standard Benchmark ( )
Standard Benchmark Returns (%)
`
`
`
Market Value as on
MSCI Brazil 10/40 Index -
MSCI Brazil 10/40 Index -
Nifty 50 -
Nifty 50 -
Oct 31, 2017 ( )`
120000 360000 600000 770000
126574 446890 643705 780910
10.34 14.56 2.78 0.43
131424 472624 680385 806911
18.16 18.50 4.97 1.44
135667 437662 849063 1169097
25.13 13.11 13.86 12.84
HSBC Asia Pacific (Ex Japan) Dividend Yield Fund Date of Inception : 24 Feb 14
Scheme Name & Benchmarks 1Year
3Years
5Years
SinceInception
Total amount invested ( )
Scheme Returns (%)
Scheme Benchmark ( )
Scheme Benchmark Returns (%)
Standard Benchmark ( )
Standard Benchmark Returns (%)
`
`
`
Market Value as on
MSCI AC Asia Pacific ex Japan -
MSCI AC Asia Pacific ex Japan -
Nifty 50 -
Nifty 50 -
Oct 31, 2017 ( )`
120000 360000 NA 440000
133826 442768 NA 544380
22.08 13.92 NA 11.63
137732 439599 NA 530434
28.55 13.42 NA 10.19
135625 437621 NA 552100
25.05 13.10 NA 12.42
HSBC Emerging Markets Fund Date of Inception : 17 Mar 08
Scheme Name & Benchmarks 1Year
3Years
5Years
SinceInception
Total amount invested ( )
Scheme Returns (%)
Scheme Benchmark ( )
Scheme Benchmark Returns (%)
Standard Benchmark ( )
Standard Benchmark Returns (%)
`
`
`
Market Value as on
MSCI Emerging Market Index -
MSCI Emerging Market Index -
Nifty 50 -
Nifty 50 -
Oct 31, 2017 ( )`
120000 360000 600000 1150000
135581 445240 746582 1603181
24.98 14.31 8.68 6.76
137979 443338 752367 1577090
28.96 14.01 8.99 6.43
135625 436871 830884 2052809
25.05 12.99 12.99 11.67
The Fund offers flexible and convenient Systematic Investment Plan (SIP) facility. To illustrate the advantages of SIP investments, this is how your investments would havegrown if you had invested say 10,000 systematically on the first Business Day of every month over a period of time in the Growth Option of Respective Scheme.
The returns are calculated by XIRR approach assuming investment of 10,000/- on the 1st working day of every month. XIRR helps in calculating return on investments givenan initial and final value and a series of cash inflows and outflows with correct allowance for the time impact of the transactions. .
`
`
Data as on , 2017October 31
Returns shown for Regular Plan - Growth Option
Past performance may or may not be sustained in the future. Refer note below
Past performance may or may not be sustained in the future. Refer note below
Past performance may or may not be sustained in the future. Refer note below
Returns are of growth option. The returns for the respective periods are provided as on 31st October 2017. Returns above 1 year are Compounded Annualized. Standardbenchmark is prescribed by SEBI and is used for comparison purposes. Returns on 10,000 are point-to-point returns for the specific time period, invested at the start of theperiod. The returns provided above have been rounded off and hence there may be minor differences between point-to-point returns vis-a-vis returns indicated above.Different plans shall have a different expense structure. The performance details provided herein are of other than Direct plan.Scheme count for the total schemes managed by the Fund Managers does not include closed ended scheme.
`

SIP Performance of Equity Schemes
27
HSBC Tax Saver Equity Fund Date of Inception : 05 Jan 07
Scheme Name & Benchmarks 1Year
3Years
5Years
SinceInception
Total amount invested ( )
Scheme Returns (%)
Scheme Benchmark ( )
Scheme Benchmark Returns (%)
Standard Benchmark ( )
Standard Benchmark Returns (%)
`
`
`
Market Value as on
S&P BSE 200 -
S&P BSE 200 -
Nifty 50 -
Nifty 50 -
Oct 31, 2017 ( )`
120000 360000 600000 1300000
138026 474756 990199 3247723
29.01 18.82 20.14 15.99
136978 452051 882441 2557278
27.27 15.36 15.42 11.93
135487 437096 831597 2390144
24.80 13.01 13.01 10.77
HSBC Infrastructure Equity Fund Date of Inception : 23 Feb 06
Scheme Name & Benchmarks 1Year
3Years
5Years
SinceInception
Total amount invested ( )
Scheme Returns (%)
Scheme Benchmark ( )
Scheme Benchmark Returns (%)
Standard Benchmark ( )
Standard Benchmark Returns (%)
`
`
`
Market Value as on
S&P BSE -
S&PBSE -
Nifty 50 -
Nifty 50 -
$
Oct 31
India Infrastructure Index
India Infrastructure Index
, 2017 ( )`
120000 360000 600000 1400000
146786 492144 1058186 2768648
43.88 21.39 22.88 11.12
138705 478873 NA NA
30.15 19.43 NA NA
135487 437382 831882 2694642
24.80 13.06 13.03 20.72
The Fund offers flexible and convenient Systematic Investment Plan (SIP) facility. To illustrate the advantages of SIP investments, this is how your investments would havegrown if you had invested say 10,000 systematically on the first Business Day of every month over a period of time in the Growth Option of Respective Scheme.
The returns are calculated by XIRR approach assuming investment of 10,000/- on the 1st working day of every month. XIRR helps in calculating return on investments givenan initial and final value and a series of cash inflows and outflows with correct allowance for the time impact of the transactions. .
`
`
Data as on , 2017October 31
Returns shown for Regular Plan - Growth Option
Past performance may or may not be sustained in the future. Refer note below
Past performance may or may not be sustained in the future. Refer note below
Returns are of growth option. The returns for the respective periods are provided as on 31st October 2017. Returns above 1 year are Compounded Annualized. Standardbenchmark is prescribed by SEBI and is used for comparison purposes. Returns on 10,000 are point-to-point returns for the specific time period, invested at the start of theperiod. The returns provided above have been rounded off and hence there may be minor differences between point-to-point returns vis-a-vis returns indicated above.Different plans shall have a different expense structure. The performance details provided herein are of other than Direct plan.Scheme count for the total schemes managed by the Fund Managers does not include closed ended scheme.
`
Please Note : “NAmeans not available.$The benchmark of the scheme was changed from S&P BSE 200 to S&P BSE India Infrastructure Index with effect from 11th November, 2016 as a more suitable benchmarkwas identified which better matched the portfolio strategy. There has been no change to investment management of the scheme. Since, S&P BSE India Infrastructure Indexwas launched on May 19, 2014 and the historic index data prior to the said date is not available, wherever scheme’s corresponding benchmark returns are not available, thesame has not been provided.”

SIP Performance of Equity Schemes
28
HSBC Managed Solutions - Growth Date of Inception : 30 Apr 14
Scheme Name & Benchmarks 1Year
3Years
5Years
SinceInception
Total amount invested ( )
Scheme Returns (%)
Scheme Benchmark ( )
Scheme Benchmark Returns (%)
Standard Benchmark ( )
Standard Benchmark Returns (%)
`
`
`
Market Value as on
Customised Benchmark Index* -
Customised Benchmark Index -
Nifty 50 -
Nifty 50 -
Oct 31, 2017 ( )`
120000 360000 NA 420000
134648 458520 NA 551968
23.41 16.36 NA 15.78
134383 444274 NA 532046
23.06 14.12 NA 13.57
135487 437027 NA 519348
24.80 13.01 NA 12.17
HSBC Managed Solutions - Moderate - Growth Date of Inception : 30 Apr 14
Scheme Name & Benchmarks 1Year
3Years
5Years
SinceInception
Total amount invested ( )
Scheme Returns (%)
Scheme Benchmark ( )
SchemeBenchmarkReturns(%)
Standard Benchmark ( )
Standard Benchmark Returns (%)
`
`
`
Market Value as on
CRISIL Balanced Fund – Aggressive Index -
CRISILBalancedFund–AggressiveIndex-
Nifty 50 -
Nifty 50 -
Oct 31, 2017 ( )`
120000 360000 NA 420000
132421 448615 NA 539529
19.76 14.83 NA 14.43
131382 429412 NA 512536
18.06 11.79 NA 11.40
135487 437027 NA 519348
24.80 13.01 NA 12.17
HSBC Midcap Equity Fund Date of Inception : 19 May 05
Scheme Name & Benchmarks 1Year
3Years
5Years
SinceInception
Total amount invested ( )
Scheme Returns (%)
Scheme Benchmark ( )
Scheme Benchmark Returns (%)
Standard Benchmark ( )
Standard Benchmark Returns (%)
`
`
`
Market Value as on
S&P BSE Midcap -
S&P BSE Midcap -
Nifty 50 -
Nifty 50 -
Oct 31, 2017 ( )`
120000 360000 600000 1500000
146085 513123 1240394 4346871
42.67 24.42 29.53 15.86
141656 503107 1087049 NA
35.12 22.99 24.00 NA
135487 437096 831597 3121592
24.80 13.01 13.01 11.09
The Fund offers flexible and convenient Systematic Investment Plan (SIP) facility. To illustrate the advantages of SIP investments, this is how your investments would havegrown if you had invested say 10,000 systematically on the first Business Day of every month over a period of time in the Growth Option of Respective Scheme.
The returns are calculated by XIRR approach assuming investment of 10,000/- on the 1st working day of every month. XIRR helps in calculating return on investments givenan initial and final value and a series of cash inflows and outflows with correct allowance for the time impact of the transactions. .
`
`
Data as on , 2017October 31
Returns shown for Regular Plan - Growth Option
Past performance may or may not be sustained in the future. Refer note below
Past performance may or may not be sustained in the future. Refer note below
*Composite index of S&P BSE200 (80%) and Crisil Composite Bond Fund Index (20%).
Past performance may or may not be sustained in the future. Refer note below
Returns are of growth option. The returns for the respective periods are provided as on 31st October 2017. Returns above 1 year are Compounded Annualized. Standardbenchmark is prescribed by SEBI and is used for comparison purposes. Returns on 10,000 are point-to-point returns for the specific time period, invested at the start of theperiod. The returns provided above have been rounded off and hence there may be minor differences between point-to-point returns vis-a-vis returns indicated above.Different plans shall have a different expense structure. The performance details provided herein are of other than Direct plan.Scheme count for the total schemes managed by the Fund Managers does not include closed ended scheme.
`
Please Note : “NAmeans not available.* BSE vide its notification dated April 10, 2015 have notified change in the index composition of S&P BSE Midcap Index. As a result returns for the said benchmark are different when comparedto the historically published returns. The corresponding benchmark returns for inception of the scheme has not been provided, as the historical index data for S&P BSE Midcap Index is availableonly from Sept 16, 2005 whereas the inception date of the scheme is May 19, 2005.”

SIP Performance of Equity Schemes
29
HSBC Managed Solutions - Conservative - Growth Date of Inception : 30 Apr 14
Scheme Name & Benchmarks 1Year
3Years
5Years
SinceInception
Total amount invested ( )
Scheme Returns (%)
Scheme Benchmark ( )
Scheme Benchmark Returns (%)
Standard Benchmark ( )
Standard Benchmark Returns (%)
`
`
`
Market Value as on
Customised Benchmark Index* -
Customised Benchmark Index -
Nifty 50 -
Nifty 50 -
Oct 31, 2017 ( )`
120000 360000 NA 420000
124078 407938 NA 485131
6.37 8.29 NA 8.20
125302 418347 NA 500686
8.35 9.97 NA 10.01
135487 437027 NA 519348
24.80 13.01 NA 12.17
HSBC Global Consumer Opportunities Fund -Benefiting from China's Growing Consumption Power
Date of Inception : 24 Feb 15
Scheme Name & Benchmarks 1Year
3Years
5Years
SinceInception
Total amount invested ( )
Scheme Returns (%)
Scheme Benchmark ( )
Scheme Benchmark Returns (%)
Standard Benchmark ( )
Standard Benchmark Returns (%)
`
`
`
Market Value as on
MSCI AC World Index -
MSCI AC World Index -
Nifty 50 -
Nifty 50 -
Oct 31, 2017 ( )`
120000 NA NA 320000
137497 NA NA 388225
28.16 NA NA 14.66
132598 NA NA 376018
20.07 NA NA 12.15
135625 NA NA 388653
25.05 NA NA 14.74
The Fund offers flexible and convenient Systematic Investment Plan (SIP) facility. To illustrate the advantages of SIP investments, this is how your investments would havegrown if you had invested say 10,000 systematically on the first Business Day of every month over a period of time in the Growth Option of Respective Scheme.
The returns are calculated by XIRR approach assuming investment of 10,000/- on the 1st working day of every month. XIRR helps in calculating return on investments givenan initial and final value and a series of cash inflows and outflows with correct allowance for the time impact of the transactions. .
`
`
Data as on October 31, 2017
Returns shown for Regular Plan - Growth Option
Past performance may or may not be sustained in the future. Refer note below
Past performance may or may not be sustained in the future. Refer note below
*Composite index of Crisil Composite Bond Fund Index (90%) and S&P BSE200 (10%).
Returns are of growth option. The returns for the respective periods are provided as on 31st October 2017. Returns above 1 year are Compounded Annualized. Standardbenchmark is prescribed by SEBI and is used for comparison purposes. Returns on 10,000 are point-to-point returns for the specific time period, invested at the start of theperiod. The returns provided above have been rounded off and hence there may be minor differences between point-to-point returns vis-a-vis returns indicated above.Different plans shall have a different expense structure. The performance details provided herein are of other than Direct plan.Scheme count for the total schemes managed by the Fund Managers does not include closed ended scheme.
`

HSBC Monthly Income Plan (HMIP)An Open Ended Fund with Regular & Savings Plans. Monthly income is not assured and is subject to availability of distributable surplus.
Investment Objective: Seeks to generate reasonable returns through investments in Debt and Money Market Instruments. Thesecondary objective of the scheme is to invest in equity and equity related instruments to seek capital appreciation.
30
FUND DETAILS
Date of Allotment
Benchmark
NAV (Growth)
(as on 31 )
Average Maturity ofPortfolio
Modified Duration
of Portfolio
Fund Managers
SIPMinimum ApplicationAmountGrowthQuarterly DividendMonthly DividendSIPExit Load
per unit
Monthly Average AUM(In Lakhs)
.10.17
Yield To Maturity*
@
Weighted Average Monthly Total Expenses ratios(Annualized)Regular 2.44%Direct Plan 1.77%Excludes GST on Investment Management fees of 0.20% ofTotal NetAssets.
Asset Allocation
Government Securities 45.01%
Equity 24.30%
Corporate/ PSU Debt 23.51%
Cash Equivalents 7.80%
Net CurrentAssets -0.62%
Total NetAssets 100.00%
@ Effective from March 1, 2013 for prospective investments.
* Based on investedAmount
FUND PORTFOLIO
Corporate/ PSU Debt
EQUITY
Government Securities
Cash EquivalentsCBLO 1,594.08 5.28%Reverse Repos 761.09 2.52%Net Current Assets -182.43 -0.62%Total Net Assets as on 31-Oct-2017 30,189.78 100.00%
Corporate Bonds / Debentures
Equities
Power Grid Corporation of India 1,599.19 5.30% CRISIL AAAIndia Infradebt 1,025.52 3.40% CRISIL AAANational Highways Authority of India 1,003.10 3.32% CRISIL AAABajaj Finance 699.04 2.32% CRISIL AAAPower Finance Corporation 694.43 2.30% CRISIL AAATata Sons 509.16 1.69% CRISIL AAAHDFC 507.16 1.68% CRISIL AAAPower Finance Corporation 504.23 1.67% CARE AAAPower Grid Corporation of India 207.40 0.69% CRISIL AAANABARD 152.18 0.50% CRISIL AAANTPC 142.11 0.47% CRISIL AAAShriram Transport Finance Company 50.24 0.17% CRISIL AA+
HDFC Bank 741.49 2.46%ICICI Bank 581.98 1.93%IndusInd Bank 431.19 1.43%Maruti Suzuki India 379.11 1.26%Hindustan Unilever 301.94 1.00%United Spirits 250.21 0.83%JM Financial 236.58 0.78%MRF 209.23 0.69%Somany Ceramics 208.67 0.69%The Federal Bank 204.54 0.68%Heritage Foods 203.39 0.67%Sun Pharmaceutical Ind 200.70 0.66%NCL Industries 189.60 0.63%OCL India 184.88 0.61%Astral Poly Technik 184.82 0.61%Infosys 184.37 0.61%Nilkamal 176.94 0.59%InterGlobe Aviation 174.70 0.58%Crompton Greaves Cons Electrical 172.50 0.57%Finolex Cables 172.26 0.57%Sun TV Network 171.30 0.57%Exide Industries 167.00 0.55%Torrent Pharmaceuticals 165.08 0.55%Mahindra & Mahindra 161.38 0.53%Gateway Distriparks 153.50 0.51%ICICI Lombard General Insurance Co. 145.56 0.48%Cholamandalam Investment & Fin Co 143.90 0.48%ITC 137.49 0.46%Castrol India 131.97 0.44%Indo Count Industries 121.18 0.40%DCB Bank 115.67 0.38%Amara Raja Batteries 115.43 0.38%Ahluwalia Contracts (India) 92.85 0.31%IPCA Laboratories 86.70 0.29%Aditya Birla Fashion and Retail 36.02 0.12%
8.24% GOVT OF INDIA RED 15-02-2027 2,492.87 8.26% SOVEREIGN7.61% GOVT OF INDIA RED 09-05-2030 1,833.40 6.07% SOVEREIGN6.79% GOVT OF INDIA RED 15-05-2027 1,731.21 5.73% SOVEREIGN7.94% HIMACHAL PRADESH SDL RED 28-02-30 1,635.19 5.42% SOVEREIGN6.68% GOVT OF INDIA RED 17-09-2031 1,515.07 5.02% SOVEREIGN7.55% MADHYA PRADESH SDL 11-10-2027 768.91 2.55% SOVEREIGN8.39% RAJASTHAN SPL SDL RED 15-03-2024 729.21 2.42% SOVEREIGN6.97% GOVT OF INDIA RED 06-09-2026 716.83 2.37% SOVEREIGN6.79% GOVT OF INDIA RED 26-12-2029 663.88 2.20% SOVEREIGN7.51% KARNATAKA SDL 11-10-2027 556.88 1.84% SOVEREIGN7.77% TAMIL NADU SDL RED 22-02-2027 423.89 1.40% SOVEREIGN7.73% GOVT OF INDIA RED 19-12-2034 415.20 1.38% SOVEREIGN8.15% GOVT OF INDIA RED 24-11-2026 106.63 0.35% SOVEREIGN
IssuerMarket Value
( in Lacs)`
% to NetAssets
Dividend DeclarationRecord Date / periodof dividend declared
Dividend ( per unit)Non-Institutional
` Dividend ( per unit)Institutional
` NAV ( ) per unit(cum dividend)
`
HSBC MIP - Monthly Dividend
HSBC MIP - Monthly Dividend - Direct Plan
HSBC MIP - Quarterly Dividend
HSBC MIP - Quarterly Dividend - Direct Plan
28-Aug-17 0.07223 0.06692 13.489725-Sep-17 0.07223 0.06692 13.3669
25-Apr-17 0.07223 0.06692 16.136525-Sep-17 0.07223 0.06692 16.4966
27-Mar-17 0.21668 0.20075 13.557827-Jun-17 0.21668 0.20075 13.7386
27-Mar-17 0.21668 0.20075 14.414727-Jun-17 0.21668 0.20075 14.6449
25-Oct-17 0.07223 0.06692 13.3272
25-Oct-17 0.07223 0.06692 16.4798
25-Sep-17 0.21668 0.20075 13.4921
25-Sep-17 0.21668 0.20075 14.4199
Rating24-Feb-04
CRISIL MIP Blended Index
35.1732
7.59 years
5.18 years
30,177.87
Aditya Khemani(for Equity portion) Sanjay
Shah (for Debt portion)
Available
10,00010,00025,000
1,000 p.m.Nil
`
`
`
`
`
7.22%
Rating Profile
Sovereign 45.01%
Equity 24.30%
AAAand equivalents 23.34%
Reverse Repos/ CBLOs 7.80%
AA+/AA-/AAand equivalents 0.17%
Net CurrentAssets -0.62%
Total NetAssets 100.00%
Upon payment of dividend, the NAV per unit falls to the extent of payout and statutory levy, if any. Face value: 10 per unit.`
Investors understand that their principalwill be at Moderately High risk
Riskometer
Mod
erately Moderate
Low
Hig
h
Low
High
LOW HIGH
Moderately
HSBC Monthly Income Plan (HMIP)
This product is suitable forinvestors who are seeking*:
• Regular Income over mediumterm
• Investment in fixed income(debt and money marketinstruments) as well as equityand equity related securities
* Investors should consult their financial advisers if in doubtabout whether the product is suitable for them.

HSBC Income Fund - Investment Plan (HIF-IP)An Open Ended Income Scheme
Investment Objective: Aims to provide reasonable income through a diversified portfolio of fixed income securities. The AMC'sview of interest rate trends and the nature of the Plans will be reflected in the type and maturities of securities in which the ShortTerm and Investment Plans are invested.
31
FUND DETAILS
Date of Allotment
Benchmark
NAV (Growth)(as on 31 )
Average Maturity ofPortfolio
Modified Duration
of Portfolio
Yield To Maturity*
Fund Manager
SIP
Minimum
Application Amount
Exit Load
per unit
Monthly Average AUM(In Lakhs)
.10.17
@
Weighted Average Monthly Total Expenses ratios(Annualized)Regular 1.84%Direct Plan 1.09%Excludes GST on Investment Management fees of 0.19% ofTotal NetAssets.
Asset Allocation
Government Securities 73.23%
Corporate/ PSU Debt 12.91%
Cash Equivalents 12.57%
Net CurrentAssets 1.29%
Total NetAssets 100.00%
@ Effective from March 1, 2013 for prospective investments.
* Based on invested Amount
FUND PORTFOLIO
Corporate/ PSU Debt
Corporate Bonds / Debentures
Tata Sons 305.49 5.61% CRISIL AAA
Bajaj Finance 199.73 3.66% CRISIL AAA
Power Finance Corporation 198.41 3.64% CRISIL AAA
7.61% GOVT OF INDIA RED 09-05-2030 751.90 13.80% SOVEREIGN
6.79% GOVT OF INDIA RED 15-05-2027 587.02 10.77% SOVEREIGN
6.68% GOVT OF INDIA RED 17-09-2031 543.87 9.98% SOVEREIGN
7.94% HIMACHAL PRADESH SDL RED 28-02-30 408.80 7.50% SOVEREIGN
6.79% GOVT OF INDIA RED 26-12-2029 322.18 5.91% SOVEREIGN
7.73% GOVT OF INDIA RED 19-12-2034 295.83 5.43% SOVEREIGN
7.55% MADHYA PRADESH SDL 11-10-2027 219.69 4.03% SOVEREIGN
8.24% GOVT OF INDIA RED 15-02-2027 213.98 3.93% SOVEREIGN
8.39% RAJASTHAN SPL SDL RED 15-03-2024 208.35 3.82% SOVEREIGN
6.97% GOVT OF INDIA RED 06-09-2026 159.30 2.92% SOVEREIGN
7.51% KARNATAKA SDL 11-10-2027 159.11 2.92% SOVEREIGN
7.77% TAMIL NADU SDL RED 22-02-2027 121.11 2.22% SOVEREIGN
Government Securities
Cash Equivalents
CBLO 463.59 8.51%
Reverse Repos 221.34 4.06%
Net Current Assets 70.39 1.29%
Total Net Assets as on 31-Oct-2017 5,450.07 100.00%
IssuerMarket Value
( in Lacs)`
% to NetAssets
Rating10-Dec-02
CRISIL Composite BondFund Index
27.8643
9.12 years
5.99 years
7.22%
5,473.46
Sanjay Shah
Available
10,000
1,000 p.m.(SIP)
Nil
`
`
`
Rating Profile
Sovereign 73.23%
AAAand equivalents 12.91%
Reverse Repos/ CBLOs 12.57%
Net CurrentAssets 1.29%
Total NetAssets 100.00%Dividend DeclarationRecord Date / periodof dividend declared
Dividend ( per unit)Non-Institutional
` Dividend ( per unit)Institutional
` NAV ( ) per unit(cum dividend)
`
HSBC Income Fund - Investment Plan - Regular Option - Quarterly Dividend
HSBC Income Fund - Investment Plan - Institutional Option - Quarterly Dividend
27-Mar-17 0.14445 0.13383 11.1915
27-Jun-17 0.14445 0.13383 11.2759
25-Sep-17 0.14445 0.13383 11.1079
12-Jun-09 0.11387 0.10598 11.0294
11-Sep-09 0.11387 0.10598 10.9960
11-Dec-09 0.11387 0.10598 11.0973
Upon payment of dividend, the NAV per unit falls to the extent of payout and statutory levy, if any. Face value: 10 per unit.`
Investors understand that their principalwill be at Moderate risk
Riskometer
Mod
erately Moderate
Low
Hig
h
Low
High
LOW HIGH
Moderately
This product is suitable forinvestors who are seeking*:
• Regular Income over longterm
• Investment in diversifiedportfolio of fixed incomesecurities
HSBC Income Fund - Investment Plan (HIF-IP)
* Investors should consult their financial advisers if in doubt aboutwhether the product is suitable for them.

HSBC Income Fund - Short Term Plan (HIF-STP)An Open Ended Income Scheme
Investment Objective:Aims to provide reasonable income through a diversified portfolio of fixed income securities. TheAMC’sview of interest rate trends and the nature of the Plans will be reflected in the type and maturities of securities in which the ShortTerm and Investment Plans are invested.
32
FUND DETAILS
Date of Allotment
Benchmark
NAV (Growth)
(as on 31 )
Average Maturity ofPortfolio
Modified Duration
of Portfolio
Yield To Maturity*
Fund Managers
SIP
Minimum
Application Amount
Exit Load
per unit
Monthly Average AUM(In Lakhs)
.10.17
@
Weighted Average Monthly Total Expenses ratios(Annualized)
Regular 1.25%
Direct Plan 0.30%Excludes on Investment Management fees of 0.05% ofTotal NetAssets.
GST
Asset Allocation
Corporate/ PSU Debt 66.00%
Government Securities 14.03%
Money Market Instruments 13.36%
Cash Equivalents 7.30%
Net CurrentAssets -0.69%
Total NetAssets 100.00%
@ Effective from March 1, 2013 for prospective investments.
* Based on invested Amount
FUND PORTFOLIO
Money Market Instruments
Corporate/ PSU Debt
Government Securities
Cash EquivalentsCBLO 12,285.47 4.94%Reverse Repos 5,865.69 2.36%Net Current Assets -1,718.80 -0.69%Total Net Assets as on 31-Oct-2017 2,48,724.56 100.00%
Certificate of Deposit
Commercial Paper
Corporate Bonds / Debentures
Zero Coupon Bonds
The South Indian Bank 7,453.32 3.00% CARE A1+IndusInd Bank 4,891.92 1.97% CRISIL A1+HDFC Bank 990.59 0.40% CARE A1+
Edelweiss Commodities Services 12,382.51 4.98% CRISIL A1+Edelweiss Commodities Services 7,489.84 3.01% CRISIL A1+
NABARD 12,500.06 5.03% CRISIL AAANabha Power 7,634.09 3.07% [ICRA]AAANabha Power 7,581.44 3.05% [ICRA]AAA(SO)Volkswagen Finance Pvt 5,097.53 2.05% Fitch AAADewan Housing Finance Corporation 5,085.52 2.04% CARE AAADalmia Cements (Bharat) 5,068.41 2.04% [ICRA]AAShriram Transport Finance Company 5,062.31 2.04% CRISIL AA+LIC Housing Finance 5,053.51 2.03% CRISIL AAABajaj Finance 5,035.14 2.02% CRISIL AAAShriram Transport Finance Company 5,032.05 2.02% Fitch AA+Aditya Birla Finance 5,018.44 2.02% [ICRA]AA+Indiabulls Housing Finance 5,016.82 2.02% CARE AAARural Electrification Corporation 5,016.73 2.02% Fitch AAATata Capital Financial Services 5,010.31 2.01% [ICRA]AA+Rural Electrification Corporation 4,983.04 2.00% CARE AAADewan Housing Finance Corporation 4,069.93 1.64% CARE AAACLP Wind Farm India Pvt 4,066.00 1.63% Fitch AACholamandalam Investment & Fin Co 4,010.81 1.61% [ICRA]AAPower Grid Corporation of India 3,198.37 1.29% CRISIL AAAHDFC 3,078.32 1.24% CRISIL AAAPower Finance Corporation 2,577.13 1.04% CRISIL AAAPower Finance Corporation 2,571.60 1.03% CRISIL AAAHDFC 2,532.18 1.02% CRISIL AAAPower Finance Corporation 2,514.58 1.01% CRISIL AAAOrix Leasing & Financial Services 2,508.57 1.01% Fitch AAAPower Finance Corporation 2,493.44 1.00% CRISIL AAARural Electrification Corporation 2,490.96 1.00% CARE AAAPower Finance Corporation 2,480.11 1.00% CRISIL AAAHDFC 2,028.64 0.82% CRISIL AAAIndia Infradebt 1,538.28 0.62% CRISIL AAAPower Finance Corporation 1,022.94 0.41% CRISIL AAAEast North Interconnection Company 1,003.70 0.40% CRISIL AAA (SO)Shriram Transport Finance Company 1,003.66 0.40% CRISIL AA+East North Interconnection Company 1,001.31 0.40% CRISIL AAA (SO)Tata Capital Financial Services 502.38 0.20% CRISIL AA+Cholamandalam Investment & Fin Co 352.89 0.14% [ICRA]AATata Capital Housing Finance 352.71 0.14% CRISIL AA+LIC Housing Finance 352.12 0.14% CARE AAAPower Finance Corporation 325.09 0.13% CRISIL AAARural Electrification Corporation 321.47 0.13% CARE AAAPower Grid Corporation of India 313.93 0.13% CRISIL AAASmall Industries Development Bk of India 243.96 0.10% CARE AAAExport Import Bank of India 161.14 0.06% CRISIL AAASmall Industries Development Bk of India 111.09 0.04% CARE AAAIndian Railway Finance Corporation 99.56 0.04% CRISIL AAANABARD 10.09 0.00% CRISIL AAA
Sundaram BNP Paribas Home Finance 6,786.11 2.73% [ICRA]AA+Sundaram BNP Paribas Home Finance 6,786.11 2.73% [ICRA]AA+JM Financial Products 5,308.89 2.13% CRISIL AAJM Financial Products 5,195.71 2.09% CRISIL AASundaram BNP Paribas Home Finance 2,575.49 1.04% [ICRA]AA+
6.79% GOVT OF INDIA RED 15-05-2027 12,387.13 4.98% SOVEREIGN8.40% UTTAR PRADESH SDL RED 10-03-2020 5,155.86 2.07% SOVEREIGN7.61% GOVT OF INDIA RED 09-05-2030 3,872.80 1.56% SOVEREIGN8.15% GOVT OF INDIA RED 24-11-2026 3,625.25 1.46% SOVEREIGN7.35% GOVT OF INDIA RED 22-06-2024 2,557.00 1.03% SOVEREIGN8.25% UTTAR PRADESH SDL RED 29-03-2020 2,571.45 1.03% SOVEREIGN7.62% GUJARAT SDL RED 01-11-2027 2,506.06 1.01% SOVEREIGN7.51% KARNATAKA SDL 11-10-2027 1,972.63 0.79% SOVEREIGN8.03% UTTAR PRADESH SDL RED 02-06-2020 251.21 0.10% SOVEREIGN
IssuerMarket Value
( in Lacs)`
% to NetAssets
Rating10-Dec-02
CRISIL Short Term BondFund Index
27.9589
2.45 years
1.89 years
7.11%
2,35,287.72
Sanjay Shah &
Kapil Punjabi
Available
10,000
1,000 p.m.(SIP)
Nil
`
`
`
Rating Profile
AAAand equivalents 54.39%
AA+/AA-/AAand equivalents 24.97%
Sovereign 14.03%
Reverse Repos/ CBLOs 7.30%
Net CurrentAssets -0.69%
Total NetAssets 100.00%
Dividend DeclarationRecord Date / periodof dividend declared
Dividend ( per unit)Non-Institutional
` Dividend ( per unit)Institutional
` NAV ( ) per unit(cum dividend)
`
HSBC Income Fund - Short Term Plan - Regular Option - Monthly Dividend
HSBC Income Fund - Short Term Plan - Monthly Dividend - Direct Plan
HSBC Income Fund - Short Term Plan - Institutional Option - Monthly Dividend
HSBC Income Fund - Short Term Plan - Institutional Plus Option - Monthly Dividend
28-Aug-17 0.04789 0.04437 11.261625-Sep-17 0.03946 0.03656 11.2293
26-Dec-16 0.07035 0.06518 11.333525-Jan-17 0.05706 0.05286 11.3524
25-Sep-17 0.14445 0.13383 10.3838
25-Sep-17 0.14445 0.13383 10.4138
25-Oct-17 0.04094 0.03793 11.2220
27-Feb-17 0.04637 0.04296 11.2799
27-Jul-15 0.05814 0.05387 12.0045
30-Dec-11 0.08478 0.07266 10.120027-Jan-12 0.05533 0.04742 10.086624-Feb-12 0.05663 0.04854 10.0881
25-May-15 0.05330 0.04938 12.007825-Jun-15 0.06385 0.05915 11.9934
HSBC Income Fund - Short Term Plan - Quarterly Dividend
HSBC Income Fund - Short Term Plan - Quarterly Dividend- Direct Plan
Upon payment of dividend, the NAV per unit falls to the extent of payout and statutory levy, if any. Face value: 10 per unit.`
Investors understand that their principalwill be at Moderately Low risk
Riskometer
Mod
erately Moderate
Low
Hig
h
Low
High
LOW HIGH
Moderately
This product is suitable forinvestors who are seeking*:
• Regular Income over Mediumterm
• Investment in diversifiedportfolio of fixed incomesecurities
HSBC Income Fund - Short Term Plan (HIF-STP)
* Investors should consult their financial advisers if in doubt aboutwhether the product is suitable for them.
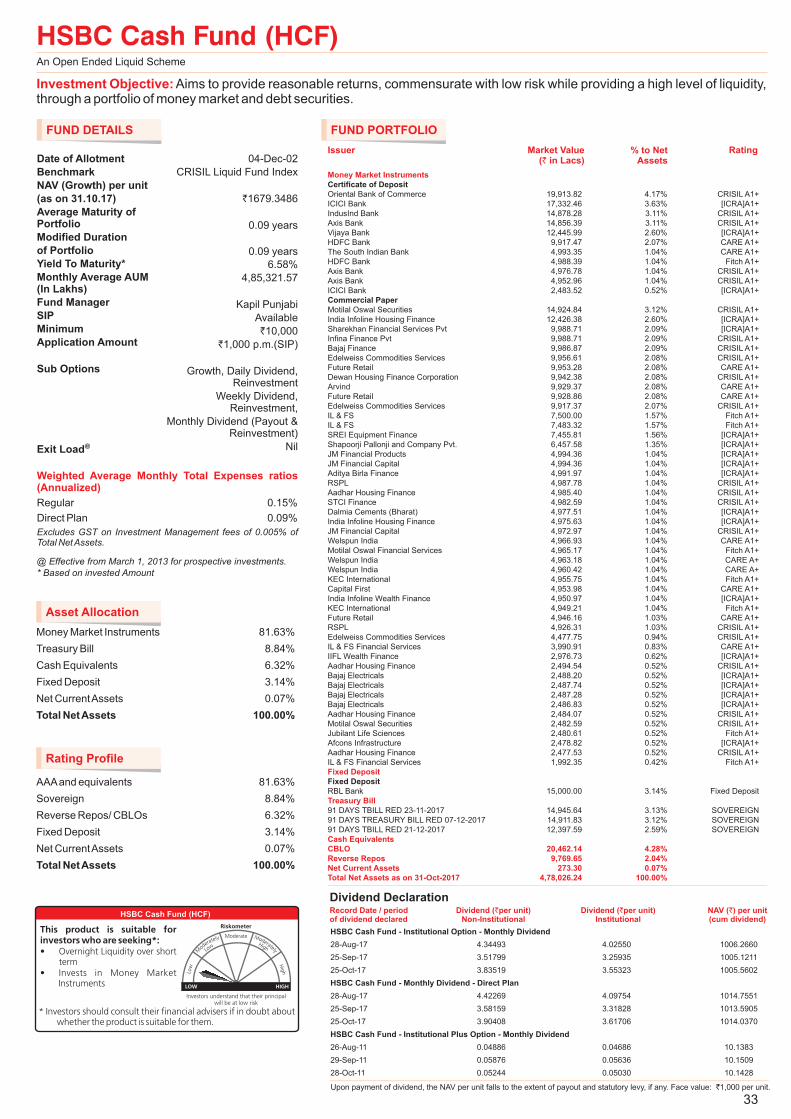
HSBC Cash Fund (HCF)An Open Ended Liquid Scheme
Investment Objective: Aims to provide reasonable returns, commensurate with low risk while providing a high level of liquidity,through a portfolio of money market and debt securities.
FUND DETAILS
Date of Allotment
Benchmark
NAV (Growth)
(as on 31.10 )
Average Maturity ofPortfolio
Modified Duration
of Portfolio
Yield To Maturity*
Fund Manager
SIP
Minimum
Application Amount
Sub Options
Exit Load
per unit
Monthly Average AUM(In Lakhs)
.17
@
Asset Allocation
Money Market Instruments 81.63%
Treasury Bill 8.84%
Cash Equivalents 6.32%
Fixed Deposit 3.14%
Net CurrentAssets 0.07%
Total NetAssets 100.00%
@ Effective from March 1, 2013 for prospective investments.
* Based on invested Amount
FUND PORTFOLIO
Money Market InstrumentsCertificate of Deposit
Commercial Paper
Fixed Deposit
Oriental Bank of Commerce 19,913.82 4.17% CRISIL A1+ICICI Bank 17,332.46 3.63% [ICRA]A1+IndusInd Bank 14,878.28 3.11% CRISIL A1+Axis Bank 14,856.39 3.11% CRISIL A1+Vijaya Bank 12,445.99 2.60% [ICRA]A1+HDFC Bank 9,917.47 2.07% CARE A1+The South Indian Bank 4,993.35 1.04% CARE A1+HDFC Bank 4,988.39 1.04% Fitch A1+Axis Bank 4,976.78 1.04% CRISIL A1+Axis Bank 4,952.96 1.04% CRISIL A1+ICICI Bank 2,483.52 0.52% [ICRA]A1+
Motilal Oswal Securities 14,924.84 3.12% CRISIL A1+India Infoline Housing Finance 12,426.38 2.60% [ICRA]A1+Sharekhan Financial Services Pvt 9,988.71 2.09% [ICRA]A1+Infina Finance Pvt 9,988.71 2.09% CRISIL A1+Bajaj Finance 9,986.87 2.09% CRISIL A1+Edelweiss Commodities Services 9,956.61 2.08% CRISIL A1+Future Retail 9,953.28 2.08% CARE A1+Dewan Housing Finance Corporation 9,942.38 2.08% CRISIL A1+Arvind 9,929.37 2.08% CARE A1+Future Retail 9,928.86 2.08% CARE A1+Edelweiss Commodities Services 9,917.37 2.07% CRISIL A1+IL & FS 7,500.00 1.57% Fitch A1+IL & FS 7,483.32 1.57% Fitch A1+SREI Equipment Finance 7,455.81 1.56% [ICRA]A1+Shapoorji Pallonji and Company Pvt. 6,457.58 1.35% [ICRA]A1+JM Financial Products 4,994.36 1.04% [ICRA]A1+JM Financial Capital 4,994.36 1.04% [ICRA]A1+Aditya Birla Finance 4,991.97 1.04% [ICRA]A1+RSPL 4,987.78 1.04% CRISIL A1+Aadhar Housing Finance 4,985.40 1.04% CRISIL A1+STCI Finance 4,982.59 1.04% CRISIL A1+Dalmia Cements (Bharat) 4,977.51 1.04% [ICRA]A1+India Infoline Housing Finance 4,975.63 1.04% [ICRA]A1+JM Financial Capital 4,972.97 1.04% CRISIL A1+Welspun India 4,966.93 1.04% CARE A1+Motilal Oswal Financial Services 4,965.17 1.04% Fitch A1+Welspun India 4,963.18 1.04% CARE A+Welspun India 4,960.42 1.04% CARE A+KEC International 4,955.75 1.04% Fitch A1+Capital First 4,953.98 1.04% CARE A1+India Infoline Wealth Finance 4,950.97 1.04% [ICRA]A1+KEC International 4,949.21 1.04% Fitch A1+Future Retail 4,946.16 1.03% CARE A1+RSPL 4,926.31 1.03% CRISIL A1+Edelweiss Commodities Services 4,477.75 0.94% CRISIL A1+IL & FS Financial Services 3,990.91 0.83% CARE A1+IIFL Wealth Finance 2,976.73 0.62% [ICRA]A1+Aadhar Housing Finance 2,494.54 0.52% CRISIL A1+Bajaj Electricals 2,488.20 0.52% [ICRA]A1+Bajaj Electricals 2,487.74 0.52% [ICRA]A1+Bajaj Electricals 2,487.28 0.52% [ICRA]A1+Bajaj Electricals 2,486.83 0.52% [ICRA]A1+Aadhar Housing Finance 2,484.07 0.52% CRISIL A1+Motilal Oswal Securities 2,482.59 0.52% CRISIL A1+Jubilant Life Sciences 2,480.61 0.52% Fitch A1+Afcons Infrastructure 2,478.82 0.52% [ICRA]A1+Aadhar Housing Finance 2,477.53 0.52% CRISIL A1+IL & FS Financial Services 1,992.35 0.42% Fitch A1+
RBL Bank 15,000.00 3.14% Fixed Deposit
91 DAYS TBILL RED 23-11-2017 14,945.64 3.13% SOVEREIGN91 DAYS TREASURY BILL RED 07-12-2017 14,911.83 3.12% SOVEREIGN91 DAYS TBILL RED 21-12-2017 12,397.59 2.59% SOVEREIGN
Fixed Deposit
Treasury Bill
Cash EquivalentsCBLO 20,462.14 4.28%Reverse Repos 9,769.65 2.04%Net Current Assets 273.30 0.07%Total Net Assets as on 31-Oct-2017 4,78,026.24 100.00%
Issuer Market Value( in Lacs)`
% to NetAssets
Rating04-Dec-02
CRISIL Liquid Fund Index
1679.3486
0.09 years
0.09 years6.58%
4,85,321.57
Kapil Punjabi
Available
10,000
1,000 p.m.(SIP)
Growth, Daily Dividend,Reinvestment
Weekly Dividend,Reinvestment,
Monthly Dividend (Payout &Reinvestment)
Nil
`
`
`
Rating Profile
AAAand equivalents 81.63%
Sovereign 8.84%
Reverse Repos/ CBLOs 6.32%
Fixed Deposit 3.14%
Net CurrentAssets 0.07%
Total NetAssets 100.00%
Dividend DeclarationRecord Date / periodof dividend declared
Dividend ( per unit)Non-Institutional
` Dividend ( per unit)Institutional
` NAV ( ) per unit(cum dividend)
`
HSBC Cash Fund - Institutional Option - Monthly Dividend
HSBC Cash Fund - Monthly Dividend - Direct Plan
HSBC Cash Fund - Institutional Plus Option - Monthly Dividend
28-Aug-17 4.34493 4.02550 1006.2660
25-Sep-17 3.51799 3.25935 1005.1211
28-Aug-17 4.42269 4.09754 1014.7551
25-Sep-17 3.58159 3.31828 1013.5905
25-Oct-17 3.83519 3.55323 1005.5602
25-Oct-17 3.90408 3.61706 1014.0370
26-Aug-11 0.04886 0.04686 10.1383
29-Sep-11 0.05876 0.05636 10.1509
28-Oct-11 0.05244 0.05030 10.1428
Upon payment of dividend, the NAV per unit falls to the extent of payout and statutory levy, if any. Face value: 1,000 per unit.`
Weighted Average Monthly Total Expenses ratios(Annualized)
Regular 0.15%
Direct Plan 0.09%
Excludes on Investment Management fees of 0.005% ofTotal NetAssets.
GST
33
Investors understand that their principalwill be at low risk
Riskometer
M
oderately Moderate
Low
Hig
h
Low
High
LOW HIGH
Moderately
This product is suitable forinvestors who are seeking*:• Overnight Liquidity over short
term• Invests in Money Market
Instruments
HSBC Cash Fund (HCF)
* Investors should consult their financial advisers if in doubt aboutwhether the product is suitable for them.

HSBC Ultra Short Term Bond Fund (HUSBF)An Open Ended Debt Scheme
Investment Objective: Seeks to provide liquidity and reasonable returns by investing primarily in a mix of short term debt andmoney market instruments.
34
FUND DETAILS
Date of AllotmentBenchmark
NAV (Growth)(as on 31 )Average Maturity ofPortfolioModified Durationof PortfolioYield To Maturity*
Fund Managers
SIPMinimum ApplicationAmountSub Options
Exit Load
per unit
Monthly Average AUM(In Lakhs)
.10.17
@
Asset Allocation
Corporate/ PSU Debt 60.24%
Money Market Instruments 35.88%
Cash Equivalents 2.07%
Net CurrentAssets 1.81%
Total NetAssets 100.00%
@ Effective from March 1, 2013 for prospective investments.
** Composite index of CRISIL Liquid Fund Index(90%) andCRISIL Short Term Bond Fund Index(10%).
* Based on invested Amount
FUND PORTFOLIO
Money Market Instruments
Certificate of Deposit
Commercial Paper
Corporate Bonds / Debentures
Zero Coupon Bonds
NABARD 2,453.23 4.14% CRISIL A1+
IDFC Bank 2,449.86 4.13% [ICRA]A1+
HDFC Bank 1,485.89 2.51% CARE A1+
JK Lakshmi Cement 4,974.61 8.40% CARE A1+
Edelweiss Commodities Services 4,960.06 8.37% CRISIL A1+
Afcons Infrastructure 2,477.02 4.18% [ICRA]A1+
JM Financial Capital 2,459.85 4.15% CRISIL A1+
Rural Electrification Corporation 4,018.42 6.78% CARE AAA
Dewan Housing Finance Corporation 3,561.19 6.01% CARE AAA
Power Finance Corporation 2,577.13 4.35% CRISIL AAA
Cholamandalam Investment & Fin Co 2,525.40 4.26% [ICRA]AA
Power Finance Corporation 2,521.15 4.26% CARE AAA
CLP Wind Farm India Pvt 2,519.58 4.25% Fitch AA
Aditya Birla Finance 2,509.22 4.24% [ICRA]AA+
Indiabulls Housing Finance 2,508.41 4.23% CARE AAA
NABARD 2,500.01 4.22% CRISIL AAA
Tata Capital Financial Services 2,009.52 3.39% CRISIL AA+
Power Finance Corporation 1,534.41 2.59% CRISIL AAA
Shriram Transport Finance Company 1,505.49 2.54% CRISIL AA+
HDFC 1,002.86 1.69% CRISIL AAA
Cholamandalam Investment & Fin Co 1,002.70 1.69% [ICRA]AA
East North Interconnection Company 754.29 1.27% CRISIL AAA (SO)
JM Financial Products 2,646.35 4.47% CRISIL AA
Corporate/ PSU Debt
Cash Equivalents
CBLO 830.62 1.40%
Reverse Repos 396.58 0.67%
Net Current Assets 1,064.95 1.81%
Total Net Assets as on 31-Oct-2017 59,248.77 100.00%
IssuerMarket Value
( in Lacs)`
% to NetAssets
Rating17-Oct-06
CustomisedBenchmark Index**
14.9137
0.87 years
0.77 years7.01%
59,366.52
Kapil Punjabi
Available10,000
1,000 p.m.(SIP)Growth, Daily Dividend,
ReinvestmentWeekly Dividend,
ReinvestmentMonthly Dividend (Payout &
Reinvestment)
Nil
`
`
`
Rating Profile
AAAand equivalents 71.28%
AA+/AA-/AAand equivalents 24.84%
Reverse Repos/ CBLOs 2.07%
Net CurrentAssets 1.81%
Total NetAssets 100.00%
Dividend Declaration
Record Date / periodof dividend declared
Dividend ( per unit)Non-Institutional
` Dividend ( per unit)Institutional
` NAV ( ) per unit(cum dividend)
`
HSBC Ultra Short Term Bond Fund - Institutional Option - Monthly Dividend
HSBC Ultra Short Term Bond Fund - Monthly Dividend - Direct Plan
HSBC Ultra Short Term Bond Fund - Institutional Plus Option - Monthly Dividend
28-Aug-17 0.04382 0.04059 10.1875
25-Sep-17 0.03136 0.02905 10.1702
28-Aug-17 0.05026 0.04656 10.3993
25-Sep-17 0.03627 0.03361 10.3799
25-Oct-17 0.04314 0.03997 10.3894
25-Oct-17 0.03745 0.03470 10.1786
28-Jan-11 0.04829 0.04501 10.3821
25-Feb-11 0.04125 0.03845 10.3741
25-Mar-11 0.05214 0.04859 10.3865
Upon payment of dividend, the NAV per unit falls to the extent of payout and statutory levy, if any. Face value: 10 per unit.`
Weighted Average Monthly Total Expenses ratios(Annualized)
Regular 1.00%
Direct Plan 0.20%
Excludes GST on Investment Management fees of 0.04% of TotalNetAssets.
Investors understand that their principalwill be at Moderately Low risk
Riskometer
Modera
tely Moderate
Low
Hig
h
Low
High
LOW HIGH
Moderately
This product is suitable forinvestors who are seeking*:• Liquidity over short term• Investment in Debt / Money
Market Instruments
HSBC Ultra Short Term Bond Fund (HUSBF)
* Investors should consult their financial advisers if in doubt aboutwhether the product is suitable for them.
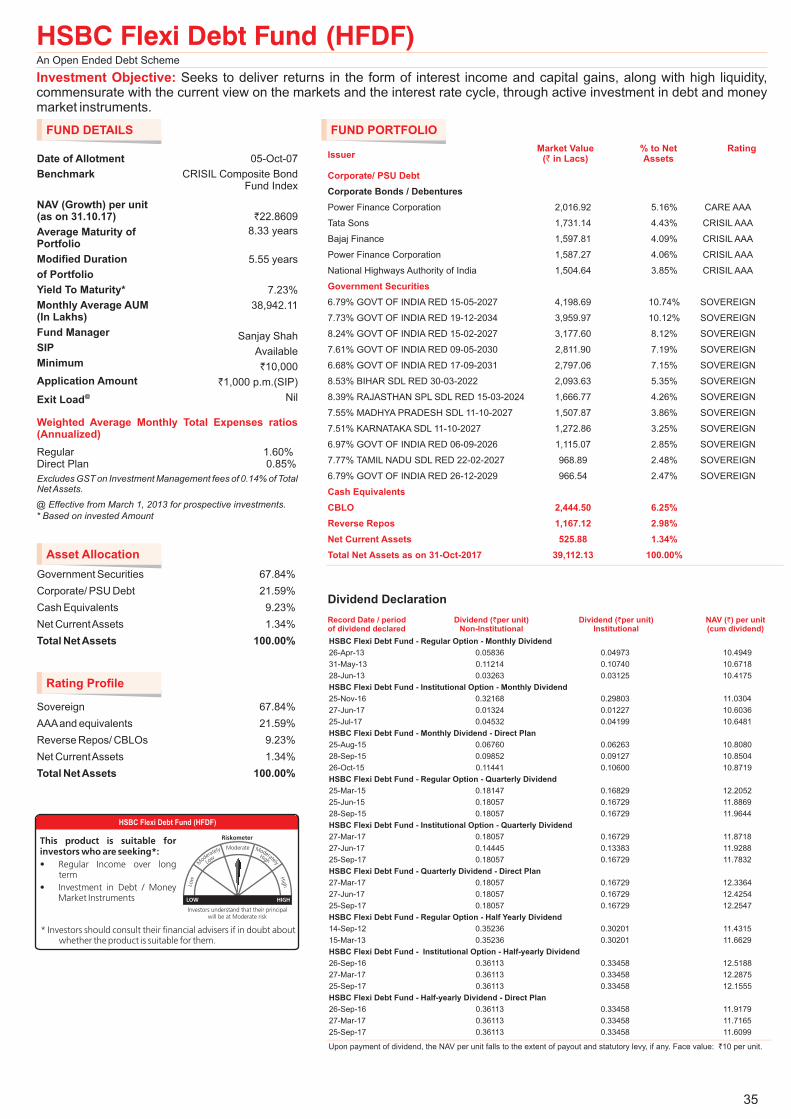
HSBC Flexi Debt Fund (HFDF)An Open Ended Debt Scheme
Investment Objective: Seeks to deliver returns in the form of interest income and capital gains, along with high liquidity,commensurate with the current view on the markets and the interest rate cycle, through active investment in debt and moneymarket instruments.
35
FUND DETAILS
Date of Allotment
Benchmark
NAV (Growth)(as on 31 )
Average Maturity ofPortfolio
Modified Duration
of Portfolio
Yield To Maturity*
Fund Manager
SIP
Minimum
Application Amount
Exit Load
per unit
Monthly Average AUM(In Lakhs)
.10.17
@
Asset Allocation
Government Securities 67.84%
Corporate/ PSU Debt 21.59%
Cash Equivalents 9.23%
Net CurrentAssets 1.34%
Total NetAssets 100.00%
@ Effective from March 1, 2013 for prospective investments.
* Based on invested Amount
FUND PORTFOLIO
Corporate/ PSU Debt
Corporate Bonds / Debentures
Power Finance Corporation 2,016.92 5.16% CARE AAA
Tata Sons 1,731.14 4.43% CRISIL AAA
Bajaj Finance 1,597.81 4.09% CRISIL AAA
Power Finance Corporation 1,587.27 4.06% CRISIL AAA
National Highways Authority of India 1,504.64 3.85% CRISIL AAA
6.79% GOVT OF INDIA RED 15-05-2027 4,198.69 10.74% SOVEREIGN
7.73% GOVT OF INDIA RED 19-12-2034 3,959.97 10.12% SOVEREIGN
8.24% GOVT OF INDIA RED 15-02-2027 3,177.60 8.12% SOVEREIGN
7.61% GOVT OF INDIA RED 09-05-2030 2,811.90 7.19% SOVEREIGN
6.68% GOVT OF INDIA RED 17-09-2031 2,797.06 7.15% SOVEREIGN
8.53% BIHAR SDL RED 30-03-2022 2,093.63 5.35% SOVEREIGN
8.39% RAJASTHAN SPL SDL RED 15-03-2024 1,666.77 4.26% SOVEREIGN
7.55% MADHYA PRADESH SDL 11-10-2027 1,507.87 3.86% SOVEREIGN
7.51% KARNATAKA SDL 11-10-2027 1,272.86 3.25% SOVEREIGN
6.97% GOVT OF INDIA RED 06-09-2026 1,115.07 2.85% SOVEREIGN
7.77% TAMIL NADU SDL RED 22-02-2027 968.89 2.48% SOVEREIGN
6.79% GOVT OF INDIA RED 26-12-2029 966.54 2.47% SOVEREIGN
Government Securities
Cash Equivalents
CBLO 2,444.50 6.25%
Reverse Repos 1,167.12 2.98%
Net Current Assets 525.88 1.34%
Total Net Assets as on 31-Oct-2017 39,112.13 100.00%
IssuerMarket Value
( in Lacs)`
% to NetAssets
Rating05-Oct-07
CRISIL Composite BondFund Index
22.8609
8.33 years
5.55 years
7.23%
38,942.11
Sanjay Shah
Available
10,000
1,000 p.m.(SIP)
Nil
`
`
`
Rating Profile
Sovereign 67.84%
AAAand equivalents 21.59%
Reverse Repos/ CBLOs 9.23%
Net CurrentAssets 1.34%
Total NetAssets 100.00%
Dividend Declaration
Record Date / periodof dividend declared
Dividend ( per unit)Non-Institutional
` Dividend ( per unit)Institutional
` NAV ( ) per unit(cum dividend)
`
HSBC Flexi Debt Fund - Regular Option - Monthly Dividend
HSBC Flexi Debt Fund - Institutional Option - Monthly Dividend
HSBC Flexi Debt Fund - Monthly Dividend - Direct Plan
HSBC Flexi Debt Fund - Regular Option - Quarterly Dividend
HSBC Flexi Debt Fund - Institutional Option - Quarterly Dividend
HSBC Flexi Debt Fund - Quarterly Dividend - Direct Plan
HSBC Flexi Debt Fund - Regular Option - Half Yearly Dividend
HSBC Flexi Debt Fund - Institutional Option - Half-yearly Dividend
HSBC Flexi Debt Fund - Half-yearly Dividend - Direct Plan
26-Apr-13 0.05836 0.04973 10.4949
31-May-13 0.11214 0.10740 10.6718
28-Jun-13 0.03263 0.03125 10.4175
25-Nov-16 0.32168 0.29803 11.0304
27-Jun-17 0.01324 0.01227 10.6036
25-Jun-15 0.18057 0.16729 11.8869
28-Sep-15 0.18057 0.16729 11.9644
27-Mar-17 0.18057 0.16729 11.8718
27-Jun-17 0.14445 0.13383 11.9288
27-Mar-17 0.18057 0.16729 12.3364
27-Jun-17 0.18057 0.16729 12.4254
15-Mar-13 0.35236 0.30201 11.6629
26-Sep-16 0.36113 0.33458 12.5188
27-Mar-17 0.36113 0.33458 12.2875
25-Sep-17 0.36113 0.33458 12.1555
26-Sep-16 0.36113 0.33458 11.9179
27-Mar-17 0.36113 0.33458 11.7165
25-Jul-17 0.04532 0.04199 10.6481
25-Aug-15 0.06760 0.06263 10.8080
28-Sep-15 0.09852 0.09127 10.8504
26-Oct-15 0.11441 0.10600 10.8719
25-Mar-15 0.18147 0.16829 12.2052
25-Sep-17 0.36113 0.33458 11.6099
25-Sep-17 0.18057 0.16729 11.7832
25-Sep-17 0.18057 0.16729 12.2547
14-Sep-12 0.35236 0.30201 11.4315
Upon payment of dividend, the NAV per unit falls to the extent of payout and statutory levy, if any. Face value: 10 per unit.`
Weighted Average Monthly Total Expenses ratios(Annualized)
Regular 1.60%Direct Plan 0.85%
Excludes on Investment Management fees of 0.14% of TotalNetAssets.
GST
Investors understand that their principalwill be at Moderate risk
Riskometer
Mod
erately Moderate
Low
Hig
h
Low
High
LOW HIGH
Moderately
This product is suitable forinvestors who are seeking*:
• Regular Income over longterm
• Investment in Debt / MoneyMarket Instruments
HSBC Flexi Debt Fund (HFDF)
* Investors should consult their financial advisers if in doubt aboutwhether the product is suitable for them.

36
HSBC Monthly Income Plan
HSBC Income Fund - Investment Plan
HSBC Income Fund - Short Term Plan
HSBC Cash Fund
HSBC Ultra Short Term Bond Fund
HSBC Flexi Debt Fund
For Debt portion: Sanjay Shah (from 14 August 2009) & ForEquity portion: Aditya Khemani (from 24 February 2009)
Sanjay Shah (from 09 January 2009)
Sanjay Shah (from 09 January 2009) & Kapil Punjabi (from 23 December 2016)
Kapil Punjabi (from 14 March 2014)
Kapil Punjabi (from 18 October 2014)
Sanjay Shah (from 09 January 2009)
Name of Scheme Fund Manager
Fund Manager’s Experience
Sanjay ShahSenior Vice President Head - Fixed IncomeB. Com, A.C.A., Post Graduate Diploma in Management
Experience:
Over 18 years of experience in research and fund management
HSBC Asset Management (India) Private Ltd
Senior Vice President & Head – Fixed Income from November 2012 to present,
Vice President & Fund Manager, Fixed Income since December 2008 till November 2012.
FIL Fund Management Private Ltd
Credit Analyst from September 2008 to December 2008
Lehman Brothers Structured Financial Services Private LtdVice President, Convertible Products from September 2006 to September 2008
Rabo India Finance Private LtdSenior Manager – Credit Risk from July 2004 to September 2006
ICICI Bank LtdManager, Credit Risk from January 2003 to June 2004
SBI Funds Management Private LtdChief Manager, Debt Funds from June 1999 to January 2003
�
�
�
�
�
�
Kapil Punjabi
Vice President & Fund Manager - Fixed Income
B.M.S, M.M.S (Mumbai University)
Experience:
Over 11 years of experience in research and Fund Management
HSBC Asset Management (India) Private Ltd.Vice President & Fund Manager - Fixed Income from March 04, 2014 onwards.
Taurus Asset Management Company LimitedFund Manager Fixed Income from June 07, 2012 to February 27, 2014.
Edelweiss Asset Management LimitedFund Manager Fixed Income from December 05, 2009 to June 06, 2012.
Edelweiss Securities LimitedManager - Investments from October 2007 to November 2009
Trans Market Group Research (India) Private LimitedResearch Analyst and Proprietary Trader from May 2006 to October 2007.
�
�
�
�
�

Funds Managed by Sanjay Shah (for Debt portion) (Total Schemes Managed 10)Aditya Khemani (for Equity portion) (Total Schemes Managed 2)Funds Managed by
HSBC Monthly Income Plan Date of Inception : 24 Feb 04
Scheme Name & Benchmarks SinceInception
HSBC Monthly Income Plan - Growth
Crisil MIP Blended Index (Scheme Benchmark)
Crisil 1 Year T-Bill Index (Standard Benchmark)
Crisil 10 Year Gilt Index (Standard Benchmark)
10,000, if invested in HMIP, would have become
10,000, if invested in Crisil MIP Blended Index, would have become
10,000, if invested in Crisil 1 Year T-Bill Index, would have become
10,000, if invested in Crisil 10 Year Gilt Index, would have become
`
`
`
`
7.55% 8.43% 10.09% 9.62%
9.07% 9.68% 9.93% 8.16%
5.91% 7.30% 7.23% 5.98%
5.12% 9.43% 7.89% 5.68%
10,755 12,749 16,175 35,182
10,907 13,195 16,057 29,290
10,591 12,354 14,176 22,140
10,512 13,103 14,619 21,313
` ` ` `
` ` ` `
` ` ` `
` ` ` `
Past performance may or may not be sustained in the future. Refer note below.
Returns are of growth option. The returns for the respective periods are provided as on 31 October 2017. Returns above 1 year are CompoundedAnnualized.Standard benchmark is prescribed by SEBI and is used for comparison purposes. Returns on 10,000 are point-to-point returns for the specific time period,invested at the start of the period. The returns provided above have been rounded off and hence there may be minor differences between point-to-pointreturns vis-a-vis returns indicated above. Different plans shall have a different expense structure. The performance details provided herein are of other thanDirect plan.Scheme count for the total schemes managed by the Fund Managers does not include closed ended scheme.
`
Fund Manager Wise Comparative Performance of Debt Schemes
37
1 Year 3 Years 5 Years
Funds Managed by - Sanjay Shah (Total Schemes Managed 10)
Funds Managed by - Sanjay Shah (Total Schemes Managed 10)
The said Fund is managed by Effective (14 August 2009)Sanjay Shah
The said Fund is managed by Effective (09 January 2009)Sanjay Shah
The said Fund is managed by Effective (09 January 2009)Sanjay Shah
The said Fund is managed by Effective (24 February 2009)Aditya Khemani
Past performance may or may not be sustained in the future. Refer note below.
HSBC Income Fund - Investment Plan Date of Inception : 10 Dec 02
Scheme Name & Benchmarks SinceInception
HSBC Income Fund - Investment Plan - Growth
Crisil Composite Bond Fund Index (Scheme Benchmark)
Crisil 10 Year Gilt Index (Standard Benchmark)
10,000, if invested in HIF - IP, would have become
10,000, if invested in Crisil Composite Bond Fund Index, would have become
10,000, if invested in Crisil 10 Year Gilt Index, would have become
`
`
`
3.66% 7.56% 7.50% 7.12%
7.18% 9.92% 9.25% 6.90%
5.12% 9.43% 7.89% 6.19%
10,366 12,442 14,354 27,869
10,718 13,281 15,562 27,026
10,512 13,103 14,619 24,489
` ` ` `
` ` ` `
` ` ` `
1 Year 3 Years 5 Years
HSBC Flexi Debt Fund Date of Inception: 05 Oct 07
Scheme Name & Benchmarks SinceInception
HSBC Flexi Debt Fund - Growth
Crisil Composite Bond Fund Index (Scheme Benchmark)
Crisil 10 Year Gilt Index (Standard Benchmark)
10,000, if invested in HFDF, would have become
10,000, if invested in Crisil Composite Bond Fund Index, would have become
10,000, if invested in Crisil 10 Year Gilt Index, would have become
`
`
`
4.64% 8.03% 8.08% 8.56%
7.18% 9.92% 9.25% 8.00%
5.12% 9.43% 7.89% 7.05%
10,464 12,609 14,747 22,882
10,718 13,281 15,562 21,734
10,512 13,103 14,619 19,877
` ` ` `
` ` ` `
` ` ` `
Past performance may or may not be sustained in the future. Refer note below.
1 Year 3 Years 5 Years

Fund Manager Wise Comparative Performance of Debt Schemes
38
Past performance may or may not be sustained in the future. Refer note below.
Funds Managed by Sanjay Shah (Total Schemes Managed 10)
Funds Managed by Kapil Punjabi (Total Schemes Managed 3)
HSBC Income Fund - STP Date of Inception : 10 Dec 02
Scheme Name & Benchmarks SinceInception
HSBC Income Fund - S T P - Growth
Crisil Short Term Bond Fund Index (Scheme Benchmark)
Crisil 1 Year T-Bill Index (Standard Benchmark)
10,000, if invested in HIF -ST, would have become
10,000, if invested in Crisil Short Term Bond Fund Index, would have become
10,000, if invested in Crisil 1 Year T-Bill Index, would have become
`
`
`
6.62% 7.87% 8.06% 7.14%
7.29% 8.68% 8.87% 7.19%
5.91% 7.30% 7.23% 5.93%
10,662 12,552 14,733 27,964
10,729 12,836 15,292 28,144
10,591 12,354 14,176 23,584
` ` ` `
` ` ` `
` ` ` `
1 Year 3 Years 5 Years
@ Pursuant to SEBI circular dated Sept 13, 2012, certain Plans / Options within the schemes have been discontinued to comply with a single plan structure. Since there was nocontinuous NAV history available for the surviving Plan prior to 19 May 2011, returns since the said date have been considered for calculating performance. The inception date ofHSBC Cash Fund however is 4 December 2002.
The returns for the respective periods are provided as on 2017. Returns above 1 year are Compounded Annualized. Standard benchmark is prescribed by SEBI and isused for comparison purposes. Returns on 10,000 are point-to-point returns for the specific time period, invested at the start of the period. The returns provided above have beenrounded off and hence there may be minor differences between point-to-point returns vis-a-vis returns indicated above. Different plans shall have a different expense structure. Theperformance details provided herein are of other than Direct plan.Scheme count for the total schemes managed by the Fund Managers does not include closed ended scheme.
31 October`
* Composite index of CRISILLiquid Fund Index (90%) and CRISILShort Term Bond Fund Index (10%).
$ Pursuant to SEBI circular dated Sept. 13, 2012, certain Plans / Options within the schemes have been discontinued to comply with a single plan structure.Since there was nocontinuous NAV history available for the surviving Plan prior to 1 October 2012, returns since the said date have been considered for calculating performance. The inception date ofHSBC Ultra Short Term Bond Fund however is 17 October 2006.
HSBC Cash Fund@ Date of Inception: 04 Dec 02
Scheme Name & Benchmarks 1 Year 3 Years 5 Years SinceInception
HSBC Cash Fund - Growth
Crisil Liquid Fund Index (SchemeBenchmark)
Crisil 91 Day T-Bill Index (StandardBenchmark)
`
`
`
10,000, if invested in HCF, would havebecome
10,000, if invested in Crisil Liquid FundIndex, would have become
10,000, if invested in Crisil 91 Day T-BillIndex, would have become
HSBC Ultra Short Term Bond Fund$ Date of Inception :17 Oct 06
Scheme Name & Benchmarks SinceInception
HSBC Ultra Short Term Bond Fund - Growth
Customised Benchmark Index Fund (Scheme Benchmark)*
Crisil 1 Year T-Bill Index (Standard Benchmark)
10,000, if invested in HUSTBF, would have become
10,000, if invested in Customised Benchmark Index, would have become
10,000, if invested in Crisil 1 Year T-Bill Index, would have become
`
`
`
6.73% 7.61% 8.18%
6.77% 7.68% 8.23%
5.91% 7.30% 7.22%
10,673 12,462 14,917
10,677 12,486 14,952
10,591 12,354 14,256
` ` `
` ` `
` ` `
Past performance may or may not be sustained in the future. Refer note below.
Last 7 Daysas on 31Oct 2017
Last 15 Daysas on 31Oct 2017
Last 30 Daysas on 31Oct 2017
6.34% 6.35% 6.37% 6.70% 7.63% 8.25% 8.36%
6.06% 6.22% 6.30% 6.71% 7.57% 8.17% 8.23%
6.02% 6.00% 6.01% 6.31% 7.25% 7.81% 7.85%
10,012 10,026 10,052 10,670 12,468 14,863 16,797
10,012 10,026 10,052 10,671 12,447 14,807 16,672
10,012 10,025 10,049 10,631 12,338 14,562 16,293
` ` ` ` ` ` `
` ` ` ` ` ` `
` ` ` ` ` ` `
Past performance may or may not be sustained in the future. Refer note below.
Funds Managed by - Kapil Punjabi (Total Schemes Managed 3)
Funds Managed by - Kapil Punjabi (Total Schemes Managed 3)
1 Year 3 Years
The said Fund is managed by Effective (09 January 2009)Sanjay Shah
The said Fund is managed by Effective (23 December 2016)Kapil Punjabi
The said Fund is managed by Effective (18 October 2014)Kapil Punjabi
The said Fund has been in existence for more than 1 year but less than 5 years
The said Fund is managed by Effective (14 March 2014)Kapil Punjabi

Fund Manager
ApplicationAmount for Fresh Subscription
MinimumAdditionalAmount
Yield to Maturity
SIP
NAV
Benchmark
Entry Load
Exit Load
Modified Duration
Standard Deviation
Sharpe Ratio
Beta
AUM
Holdings
Nature of Scheme
Rating Profile
An employee of the asset management company such as a mutual fund or life insurer, who manages investments of the scheme. He isusually part of a larger team of fund managers and research analysts.
This is the minimum investment amount for a new investor in a mutual fund scheme,
This is the minimum investment amount for an existing investor in a mutual fund scheme.
The Yield to Maturity or the YTM is the rate of return anticipated on a bond if held until maturity. YTM is expressed as an annual rate. The YTMfactors in the bond's current market price, par value, coupon interest rate and time to maturity.
SIP or systematic investment plan works on the principle of making periodic investments of a fixed sum. It works similar to a recurring bankdeposit. For instance, an investor may opt for an SIP that invests 500 every 15 of the month in an equity fund for a period of three years.
The NAV or the net asset value is the total asset value per unit of the mutual fund after deducting all related and permissible expenses. TheNAV is calculated at the end of every business day. It is the value at which the investor enters or exits the mutual fund.
Agroup of securities, usually a market index, whose performance is used as a standard or benchmark to measure investment performance ofmutual funds, among other investments. Some typical benchmarks include the Nifty, Sensex, BSE200, BSE500, 10-Year Gsec.
Amutual fund may have a sales charge or load at the time of entry and/or exit to compensate the distributor/agent. Entry load is charged at thetime an investor purchases the units of a mutual fund. The entry load is added to the prevailing NAV at the time of investment. For instance, ifthe NAV is 100 and the entry load is 1%, the investor will enter the fund at 101.
Exit load is charged at the time an investor redeems the units of a mutual fund. The exit load is deducted from the prevailing NAV at the time ofredemption. For instance, if the NAV is Rs 100 and the exit load is 1%, the redemption price would be 99 per unit.
Modified duration is the price sensitivity and the percentage change in price for a unit change in yield.
Standard deviation is a statistical measure of the range of an investment's performance. When a mutual fund has a high standard deviation,its means its range of performance is wide, implying greater volatility.
The Sharpe Ratio, named after its founder, the Nobel Laureate William Sharpe, is a measure of risk-adjusted returns. It is calculated usingstandard deviation and excess return to determine reward per unit of risk.
Beta is a measure of an investment's volatility vis-a-vis the market. Beta of less than 1 means that the security will be less volatile than themarket.Abeta of greater than 1 implies that the security's price will be more volatile than the market.
AUM or assets under management refers to the recent I updated cumulative market value of investments managed by a mutual fund or anyinvestment firm.
The holdings or the portfolio is a mutual fund's latest or updated reported statement of investments/securities. These are usually displayed interms of percentage to net assets or the rupee value or both. The objective is to give investors an idea of where their money is being investedby the fund manager.
The investment objective and underlying investments determine the nature of the mutual fund scheme. For instance, a mutual fund that aimsat generating capital appreciation by investing in stock markets is an equity fund or growth fund. Likewise, a mutual fund that aims at capitalpreservation by investing in debt markets is a debt fund or income fund. Each of these categories may have sub-categories.
Mutual funds invest in securities after evaluating their creditworthiness as disclosed by the ratings. A depiction of the mutual fund in variousinvestments based on their ratings becomes the rating profile of the fund. Typically, this is a feature of debt funds.
`
`
th
`
`
Note: SEBI, vide circular dated June 30, 2009 has abolished entry loan and mandated that the upfront commission to distributors will be paid by the investor directly to thedistributor, based on his assessment of various factors including the services rendered by the distributor.
Section II - How to read Factsheet
39

All returns have been sourced from MutualFundsIndia Explorer software unless otherwise stated. With regard to equity
schemes (including the equity component of MIPs), Fund performance is calculated on a total return basis (i.e. it includes
dividends re-invested) while the benchmark is calculated on a price return basis (i.e. it does not consider dividends re-
invested).
This document has been prepared by HSBCAsset Management (India) Private Ltd (HSBC) for information purposes only and
should not be construed as an offer or solicitation of an offer for purchase of any of the funds of HSBC Mutual Fund. All
information contained in this document (including that sourced from third parties), is obtained from sources HSBC, the third
party believes to be reliable but which it has not independently verified and HSBC, the third party makes no guarantee,
representation or warranty and accepts no responsibility or liability as to the accuracy or completeness of such information.
The information and opinions contained within the document are based upon publicly available information and rates of
taxation applicable at the time of publication, which are subject to change from time to time. Expressions of opinion are those of
HSBC only and are subject to change without notice. It does not have regard to specific investment objectives, financial
situation and the particular needs of any specific person who may receive this document. Investors should seek financial
advice regarding the appropriateness of investing in any securities or investment strategies that may have been discussed or
recommended in this report and should understand that the views regarding future prospects may or may not be realized.
Neither this document nor the units of HSBC Mutual Fund have been registered in any jurisdiction. The distribution of this
document in certain jurisdictions may be restricted or totally prohibited and accordingly, persons who come into possession of
this document are required to inform themselves about, and to observe, any such restrictions. Mutual fund investments are
subject to market risks. Please read the Scheme Information Document carefully before investing.
Investors should not invest in the Scheme solely based on the information provided in this document and should read the
Combined Scheme Information Document and, Statement of Additional Information of the Fund for details. This document
does not constitute an offering document.
No part of this publication may be reproduced, stored in a retrieval system, or transmitted, on any form or by any means,
electronic, mechanical, photocopying, recording, or otherwise, without the prior written permission of HSBC Asset
Management (India) Private Ltd.
1800-200-2434 OR +91 44 39923900 to connect to our customer care centre.
022-49146254
Mutual Fund investments are subject to market risks, read all scheme related documents carefully.
HSBCAsset Management (India) Private Limited,
16, V.N. Road, Fort, Mumbai-400001
Tel. :
Fax : Email : Website :
HSBC Mutual Fund Investor Service Centres :
Ahmedabad :
Bengaluru :
Chennai :
Hyderabad :
Kolkata :
Mumbai :
New Delhi :
Pune :
Mardia Plaza, CG. Road,Ahmedabad - 380 006.
No. 7, HSBC Centre, M.G. Road, Bengaluru - 560 001.
No. 13, Rajaji Salai, 2nd Floor, Chennai -600 001.
6-3-1107 & 1108, Rajbhavan Road, Somajiguda, Hyderabad - 50082.
31 BBD Bagh, Dalhousie Square, Kolkata - 700001.
16, V.N. Road, Fort, Mumbai - 400 001.
3rd Floor, East Tower, Birla Tower, 25, Barakhamba Road, New Delhi - 110 001.
AmarAvinash Corporate City, Sector No. 11, Bund Garden Road, Pune - 411011.
Chandigarh: SCO 1, Sector 9 D, Chandigarh-160017.
[email protected] www.assetmanagement.hsbc.com/in
Statutory Details & Disclaimers