the author(s) shown below used federal funds provided by ... · document title: medicaid benefits...
TRANSCRIPT

The author(s) shown below used Federal funds provided by the U.S. Department of Justice and prepared the following final report: Document Title: Medicaid Benefits and Recidivism of Mentally Ill
Persons Released from Jail Author(s): Joseph P. Morrissey Document No.: 214169 Date Received: May 2006 Award Number: 2004M-051 This report has not been published by the U.S. Department of Justice. To provide better customer service, NCJRS has made this Federally-funded grant final report available electronically in addition to traditional paper copies.
Opinions or points of view expressed are those
of the author(s) and do not necessarily reflect the official position or policies of the U.S.
Department of Justice.

Medicaid Benefits and Recidivism of Mentally Ill Persons
Released from Jail
Joseph P. Morrissey, Ph.D. Cecil G. Sheps Center for Health Services Research
University of North Carolina at Chapel Hill CB# 7590, 725 Martin Luther King Jr. Blvd
Chapel Hill, NC 27599-7590 Ph: 919-966-5829 Fax: 919-966-1634
Report Prepared for
Justice Systems Research Division Office of Research and Evaluation
National Institute of Justice Washington, DC
Revised: December 8, 2004
i
This document is a research report submitted to the U.S. Department of Justice. This report has not been published by the Department. Opinions or points of view expressed are those of the author(s)
and do not necessarily reflect the official position or policies of the U.S. Department of Justice.
EXECUTIVE SUMMARY
Does having Medicaid benefits at time of release from jail help detainees who have a
severe mental illness avoid returning to jail in the following year? This question is addressed in
this report with data on three years of jail detentions in King County, WA (N= 5,189) and
Pinellas County, FL (N= 2,419). In both counties, detainees with severe mental illness who had
Medicaid upon release had about 16% fewer detentions on average (avg. = 1.9 and 2.1) over
the following 12 months than those detainees with severe mental illness who did not have
Medicaid at release (avg. = 2.3 and 2.5, p< .05 and .001). Those with Medicaid at release in
King County also spent more time in the community prior to their next detention (avg. = 102 vs.
93 days, p< .001), but there was no significant difference between Medicaid groups for Pinellas
County (avg. = 110-111 days). The large majority of subsequent detentions in both counties
were for minor, non-violent offenses (about 70%); having or not-having Medicaid did not affect
this trend.
This study used administrative data to identify cohorts of jail detainees who had severe
mental illness and who were enrolled on Medicaid at some point in time during the three-year
study interval. No special interventions were used to increase Medicaid enrollment while in jail
or service use once released to the community. Rather, the goal of the study was to find out
what happens on an everyday basis under usual circumstances in two large urban public mental
health systems. The specific question of interest was: “Do people with severe mental illness
who have Medicaid benefits when released from jail have fewer, later, and less serious jail
detentions in the following year than persons with severe mental illness who did not have
Medicaid benefits at the time of jail release.”
In Pinellas County, files from Medicaid and the county jail were linked to identify all persons
with a severe mental illness who were detained in jail between September 1998 and August
2000; upon release, each individual was then followed in the administrative data for a 12-month
period to identify service use and reincarcerations. In King County, county mental health records
ii
This document is a research report submitted to the U.S. Department of Justice. This report has not been published by the Department. Opinions or points of view expressed are those of the author(s)
and do not necessarily reflect the official position or policies of the U.S. Department of Justice.

were used to identify persons with a severe mental illness between January 1996 and
December 1998. These files were then linked to Medicaid enrollment and to jail detention files to
identify a comparable cohort of individuals with a severe mental illness who were released from
jail during the study interval. These individuals were also followed in the administrative data
base for 12 months to identify subsequent detentions.
An individual’s Medicaid insurance status can fluctuate on and off even when they are living
in the community. By selecting only those individuals with severe mental illness who had been
enrolled on Medicaid at some point during the study interval, the study design controlled for
Medicaid eligibility and allowed us to compare the subsequent experiences of two groups—
those who were enrolled on Medicaid at the time of release and those who were not. To deal
with enrollment fluctuations, the effects of Medicaid were assessed in two ways—Medicaid
status at release (yes/no) and Medicaid rate indicating the proportion of days until next
detention that the person was on Medicaid.
Three outcomes related to jail recividism over the 12 months following release were
examined—how many detentions, how soon, and how serious—using total detentions rather
than persons as the unit of analysis. Multivariate analyses were conducted with the Medicaid
rate variable to isolate the effects of Medicaid rate and receipt of outpatient mental health and
substance abuse services following release. These analyses used generalized estimating
equations (GEE) and hazard models (survival analysis) that corrected parameter estimates and
standard errors for repeated events within persons.
Odds ratios (OR) from multivariate analyses suggest that, in both counties, the combination
of benefits and services helps to keep people functioning in the community longer (how soon)
than those without any or with fewer days of benefits and service use (OR= .33 to .83, p< .001).
However, Medicaid benefits alone are not enough to keep people with severe mental illness out
of jails (how many). Furthermore, given the preponderance of minor offenses (70%) committed
by these individuals, Medicaid rate and/or service receipt did not affect the odds of committing a
iii
This document is a research report submitted to the U.S. Department of Justice. This report has not been published by the Department. Opinions or points of view expressed are those of the author(s)
and do not necessarily reflect the official position or policies of the U.S. Department of Justice.

lesser offense (how serious) at next detention. These multivariate results controlled for group by
county variations in age, race, gender, dual mental health and substance abuse diagnoses, and
SSI/disability status.
Overall, the findings indicate that keeping detainees with severe mental illness on Medicaid
can benefit the criminal justice system as well as the mental health system. Individuals who had
Medicaid at release (or who had Medicaid for a greater number of days prior to next arrest)
accessed more services and had more days in the community. But Medicaid benefits alone
were not enough to keep people with severe mental illness out of jail. The implications are that,
in addition to ensuring that individuals with severe mental illness have Medicaid, breaking the
cycle of jail recividism for detainees with severe mental illness will require access to effective
treatments, stable housing, employment, and other community supports that promote recovery
and increase opportunities for successful community living. Further research is needed to
assess the effectiveness of these more comprehensive interventions for persons with severe
mental illness when they are released from jail.
These conclusions must be tempered by acknowledging that the findings are based on
events in only two communities. Results may vary for other communities if jail stays for
detainees with severe mental illness consistently exceed the thirty-day Medicaid cut-off and if,
as a result, Medicaid benefits are suspended at much higher rates. Differences in the availability
and accessibility of post-release services for jail detainees, especially of evidenced-based
services for persons with severe mental illness, could also lead to higher rates of service use
and lower rates of reincarceration than those reported here. However, there are no national data
currently available on such events and the two communities studied have service configurations
that are typical for other large urban areas in the US.
Also, the findings reported here only pertain to individuals with severe mental illness in jail
who are Medicaid eligible. These findings might not apply to the many mentally ill individuals in
jail who have a less serious psychiatric diagnosis or to those persons who might receive a
iv
This document is a research report submitted to the U.S. Department of Justice. This report has not been published by the Department. Opinions or points of view expressed are those of the author(s)
and do not necessarily reflect the official position or policies of the U.S. Department of Justice.

diagnosis representing severe mental illness if seen by a psychiatrist, but who were either not
enrolled in Medicaid or not known to the public mental health system at the time of this study.
Caution must also be exercised in drawing conclusions about state prison populations from
the jail data reported here. What is generalizable to mentally ill prisoners from these data is that
having Medicaid on the day of release will likely help them obtain needed services in the
community just as they helped the jail detainees in this study. Moreover, state prisoners with
severe mental illness need access to equally intensive evidence-based treatments as do jail
detainees. What is not generalizable to prisons is the high rate of Medicaid enrollment at
release for detainees with severe mental illness. Prisons are long stay institutions (the average
length of incarceration for prisoners is over five years) so 100% of those who enter prison with
Medicaid lose it before they are released. The same is true for SSI benefits and other
entitlements. Jails, in contrast, are short stay institutions. Detainees in this study only spent an
average of 16-32 days in jail so virtually all those with severe mental illness who had Medicaid
at jail entry (about 65-78% in the two counties) also had it upon release.
The implication is that, if prisoners with severe mental illness are to have Medicaid and other
benefits at release, then special efforts extending over many months are needed to assist
prisoners to re-enroll in entitlement programs. In contrast, jail stays for persons with severe
mental illness are so much shorter that most detainees do not lose Medicaid or SSI while in jail.
This suggests that the need for the type of special benefit assistance programs that several
states are now introducing is much greater in prisons than in jails.
Currently, there are no published data available about the recividism of prisoners with
severe mental illness who either have or do not have Medicaid and other benefits. Further
research is needed to evaluate the success of current prison-based benefit assistance
programs for prisoners who have severe mental illness. Studies along the lines presented in this
report could establish whether benefit assistance programs result in high rates of Medicaid
v
This document is a research report submitted to the U.S. Department of Justice. This report has not been published by the Department. Opinions or points of view expressed are those of the author(s)
and do not necessarily reflect the official position or policies of the U.S. Department of Justice.

enrollment at release, greater use of community-based services following release, and lower
rates of recividism.
Whether talking about jails or prisons, however, it’s the quality of treatment services
received in the community by persons with a severe mental illness that’s likely to make a
difference in their functioning and avoidance of recividism. Simply diverting people with severe
mental illness to everyday or generic mental health services in the community is unlikely to have
a positive impact on their ability to live in the community free of criminal justice entanglements
(Steadman and Naples, 2004). Generic services are not intensive enough nor are they attuned
enough to the multiple comorbidities of this population. What’s needed is diversion to intensive
services such as assertive community treatment or dual diagnosis treatment teams that have an
evidence base and proven track record of being successful in treating persons with severe
mental illness.
Evidence-based treatments that promote recovery and increase opportunities for successful
community living offer the best hope for people with a severe mental illness whether they are
released from prisons or jails. However, solid research data backing up this assessment for
people with severe mental illness in jails or other correctional settings are not currently
available. Responding to this gap in the current knowledge base should be a high priority for
both the mental health and criminal justice research communities.
vi
This document is a research report submitted to the U.S. Department of Justice. This report has not been published by the Department. Opinions or points of view expressed are those of the author(s)
and do not necessarily reflect the official position or policies of the U.S. Department of Justice.

ACKNOWLEDGEMENTS
The work for this report was carried out by a research team based at UNC-Chapel Hill
(Joseph Morrissey, Gary Cuddeback, Chunyuan Liu) with collaboration from investigators at
Columbia University (Alison Cuellar), Policy Research Associates, Inc. (Henry Steadman), and
the University of South Florida (Becky Larsen, Diane Haynes). This research was supported by
grant funding from the John D. and Catherine T. MacArthur Foundation’s Mental Health Policy
Research Network, the National Institute of Mental Health (MH63883), and the National Institute
of Justice. For assistance in assembling the administrative data for this study we are indebted
to the Pinellas County Data Collaborative; the Pinellas County Mental Health and Substance
Abuse Leadership Group; the King County Division of Mental Health, Chemical Abuse and
Dependency Services; the King County Department of Adult and Juvenile Detention; the King
County Department of Public Health; the Washington State Division of Mental Health, Medical
Assistance Administration, and Alcohol and Substance Abuse of the Washington State
Department of Social and Health Services; and the Washington State Department of Health’s
Center for Health Statistics.
vii
This document is a research report submitted to the U.S. Department of Justice. This report has not been published by the Department. Opinions or points of view expressed are those of the author(s)
and do not necessarily reflect the official position or policies of the U.S. Department of Justice.

List of Figures and Tables
Figures
1. Three-Year Study Periods Consisting of a 24-Month Enumerat12-Month Detention-Specific Follow-Up Period in King County Pinellas County (1998-01)
Text Tables
Page
ion Period and a 5 (1996-98) and
1. Year 2000 Population and Jail Characteristics for King County and Pinellas 4 County
2. Patterns of Re-enrollment and Dis-enrollment in Medicaid for Releasees with a 8 Severe Mental Illness: King County (1996-98) and Pinellas County (1998-2001)
3. Demographic and Diagnosis Profiles of Jail Releasees with a Severe Mental 12 Illness in King County (1996-98) and Pinellas County (1998-01) by Medicaid Status at Time of Release
4. Post-Release Outpatient Service Days and Service Rates for Releasees with a 13 Severe Mental Illness in King County (1996-1998) and Pinellas County (19982001) by Medicaid Status at Time of Release
5. Characteristics of Jail Detentions with a Severe Mental Illness in King County 15 (1996-98) and Pinellas County (1998-01) by Medicaid Status at Time of Release
6. Odds Ratios from Full Effects and Net Effects Multivariate Models of How Often, 18 How Soon, and How Serious the Next Detention(s) over 12-month Follow Up Were for Releasees with Severe Mental Illness in King County (1996-98) and Pinellas County (1998-01)
Appendix Tables
A1. Demographics and Diagnoses by Crime Status (Violent and Non-Violent) For 24 Jail Detentions with a Severe Mental Illness, King County (1996-98) and Pinellas County (1998-01)
A2. Demographics and Diagnoses by Crime Status (Felony and Non-Felony) For Jail 25 Detentions with a Severe Mental Illness, King County (1996-98) and Pinellas County (1998-01)
A3. Predictors of Frequency of Subsequent Detentions in 365 Days Post Jail 26 Release for Persons with a Severe Mental Illness, King County (1996-98)
viii
This document is a research report submitted to the U.S. Department of Justice. This report has not been published by the Department. Opinions or points of view expressed are those of the author(s)
and do not necessarily reflect the official position or policies of the U.S. Department of Justice.

List of Figures and Tables – continued Page
A4. Predictors of Frequency of Subsequent Detentions in 365 Days Post Jail 27Release for Persons with a Severe Mental Illness, Pinellas County (1998-01)
A5. Predictors of Time to Next Detention for Jail Releasees with Severe Mental 28Illness, King County (1996-98)
A6. Predictors of Time to Next Detention for Jail Releasees with Severe Mental 29Illness, Pinellas County (1998-01)
A7. Predictors of Felony/Non-Felony Next Crime for Jail Releasees with Severe 30Mental Illness, King County (1996-98)
A8. Predictors of Felony/Non-Felony Next Crime for Jail Releasees with Severe 31Mental Illness, Pinellas County (1996-98)
A.9. Predictors of Violent/Non-Violent Next Crime for Jail Releasees with Severe 32Mental Illness, King County (1998-01)
A10. Predictors of Violent/Non-Violent Next Crime for Jail Releasees with Severe 33Mental Illness, Pinellas County (1998-01)
ix
This document is a research report submitted to the U.S. Department of Justice. This report has not been published by the Department. Opinions or points of view expressed are those of the author(s)
and do not necessarily reflect the official position or policies of the U.S. Department of Justice.

CONTENTS
Page
Executive Summary i
Acknowledgements vi
List of Figures and Tables vii
Introduction 1
Methods 4
Study Sites 4
Design 5
Subjects and Data Sources 6
Measures 7
Data Analyses 10
Results 11
Medicaid Status at Time of Release 11
Medicaid Rate during 12-Month Follow-up Period 16
Discussion 18
Limitations 19
Conclusions 21
Appendix 23
References 34
x
This document is a research report submitted to the U.S. Department of Justice. This report has not been published by the Department. Opinions or points of view expressed are those of the author(s)
and do not necessarily reflect the official position or policies of the U.S. Department of Justice.

INTRODUCTION
Current best estimates1 suggest about 8% of all jail detainees have a severe mental illness
(Teplin, 1990; Teplin, Abram, & McClleland, 1996; New Freedom Commission, 2004). With over
13 million annual admissions to US jails this means that about 1 million bookings of persons
with severe mental illness occur at our nation’s local jails each year. Given the sizeable overlap
in the caseloads of jails and the mental health service system, one would anticipate that there
would be a common goal of keeping mentally ill people out of jail, a sense of shared
responsibility for delivering mental health treatment to these persons whether in or out of jail,
and a mutual interest in promoting the mental health and public safety of the communities in
which these individuals live.
The reality in most communities, however, is that each of these systems operates
independently of the other. As a result, it is not uncommon for local, state, and national policies
to contain incompatible incentives—they are intended to improve one system, but end up having
negative consequences for the other.
A case in point is the national program sponsored by the Social Security Administration
(SSA) in which jails can receive up to $400 dollars per case to report inmates who have
Supplemental Security Income (SSI) or Social Security Disability Income (SSDI) while
incarcerated (Bazelon Center, 2001). The goal here is to suspend or terminate benefits to
prevent inappropriate monthly income assistance payments to individuals while incarcerated.
1 A widely cited figure for the prevalence of mentally ill persons in jail is 16%, based on a study by Ditton (1999). The Ditton estimate comes from interviews conducted with a representative sample of inmates in local jails in 1996. Respondents were asked if they have a mental or emotional condition and whether they had ever received treatment for a mental or emotional problem, other than treatment related to drug or alcohol abuse. This method is not a reliable way of counting cases of severe mental illness and it is likely biased towards an over-estimate of the true prevalence rate. In contrast, the 8% figure cited in the text is based on Teplin’s research on admissions to the Cook County Department of Corrections (Chicago jail) in the early 1980s that used rigorous epidemiological methods and a standardized psychiatric rating scale to identify detainees with a diagnosable psychiatric illness. The 8% figure is a weighted estimate that adjusts for the differences in the Teplin study between males and females who scored positive on symptom profiles associated with severe mental illness.
1
This document is a research report submitted to the U.S. Department of Justice. This report has not been published by the Department. Opinions or points of view expressed are those of the author(s)
and do not necessarily reflect the official position or policies of the U.S. Department of Justice.

This program can be financially rewarding both to SSA and to local jails, but it works to the
disadvantage of mentally ill detainees/inmates when released from jail. The reason is that
Medicaid (via SSI) and Medicare (via SSDI) are linked with these Federal disability income
programs so that, if disability payments are suspended or terminated, so are these health care
benefits. Without any insurance coverage, particularly low income individuals lack the
resources to pay for needed services. Without insurance, they may be deterred from seeking
services or have more difficulty locating providers willing to treat their mental illness.
As the subcommittee report from the New Freedom Commission on Mental Health (2004)
points out, most persons with SMI who end up in jail are poor, uninsured, and homeless. They
often have co-occurring substance abuse disorders. Many continually cycle through the mental
health, substance abuse, and criminal justice systems. Absent health benefits upon release, it
may be very difficult for persons with SMI to obtain needed health care in a timely way.
Recently, a number of efforts have been made to enhance collaboration between jails and
mental health providers. Some have taken the form of primers informing members of the
criminal justice community (Council of State Governments, 2004) or mental health community
(Messaro, 2004) about how the other system operates and how collaboration can be improved.
Others have focused on successful partnerships between the criminal justice and mental health
systems (Haimowitz, 2004; New Freedom Commission, 2004). SAMHSA’s Center for Mental
Health Services has sponsored the National GAINS Center for technical assistance to the
justice community about co-occurring substance abuse and mental disorders and the TAPA
Center for a national evaluation of the Targeted Capacity Expansion Program for jail diversion
(Policy Research Associates, 2004). In addition, several federal agencies under the lead of the
National Institute of Justice are sponsoring a Serious and Violent Offender Re-entry Initiative
(SVORI) in 68 sites around the country aimed at developing service models and practices that
ease transition of violent offenders from prisons and jails to the community. Several of these
sites are offering specialized services to mentally ill offenders (Lattimore et al., 2004).
2
This document is a research report submitted to the U.S. Department of Justice. This report has not been published by the Department. Opinions or points of view expressed are those of the author(s)
and do not necessarily reflect the official position or policies of the U.S. Department of Justice.

Recognizing the absence of empirical evidence about the role of benefits in promoting
access to mental health services following release from jail, the MacArthur Foundation’s Mental
Health Policy Research Network in collaboration with investigators at the University of North
Carolina at Chapel Hill, Policy Research Associates, Inc., and the University of South Florida
undertook a study of this issue in two large urban jurisdictions (Morrissey et al., 2004). Findings
indicated that detainees with SMI who had Medicaid upon release from the King County
(Seattle) or Pinellas County (Clearwater/St. Petersburg) jails were able to access services
quicker and significantly more often in the 90-days post release than did released individuals
with SMI who were not on Medicaid.
These findings strongly suggest that efforts to disrupt Medicaid benefits while a person with
severe mental illness is jailed are shortsighted. Disruptions can delay access to services at a
time when people are at their neediest and services can help them adjust to community living.
But these findings are silent as to whether there is any gain that accrues to the jail or wider
criminal justice system if persons with severe mental illness retain their benefits while
incarcerated. Following release, would they stay out of jail longer while committing fewer and
less serious offenses?
There has been some research on recidivism of mentally ill offenders (Solomon et al. 1994;
Ventura et al., 1998), but there are no empirical studies in the literature evaluating the effects of
benefits and services on jail recidivism for persons with severe mental illness. This report
addresses this issue by examining the subsequent arrest and jail detention experiences of two
cohorts of persons with severe mental illness over a 12-month period, one cohort released from
the King County jail and the other from the Pinellas County jail. The following three questions
are addressed:
1. How many: Do persons with severe mental illness who are released from jail on
Medicaid have fewer jail detentions in the next 12-months than released persons with
severe mental illness who are not on Medicaid?
3
This document is a research report submitted to the U.S. Department of Justice. This report has not been published by the Department. Opinions or points of view expressed are those of the author(s)
and do not necessarily reflect the official position or policies of the U.S. Department of Justice.

2. How fast: Do persons with severe mental illness who are released from jail on Medicaid
have a longer time to jail detention in the next 12-months than released persons with
severe mental illness who are not on Medicaid?
3. How serious: If persons with severe mental illness who are released from jail on
Medicaid are detained in jail during the next 12-months, do they have less serious
charges than released persons with severe mental illness who are not on Medicaid?
METHODS
Study Sites
The study was carried out in Pinellas County (Clearwater/St. Petersburg), Florida and King
County (Seattle), Washington. These sites were selected because of the availability of
administrative data that could be linked across Medicaid, jails, and mental health agency
records.
Table 1: Year 2000 Population and Jail Characteristics for King County and Pinellas County
i Ki Pi lll l i
ili
i ic/ ii
il il l il i
il i i
Ind cator ng County ne as County Tota County Popu at on 1,737,034 921,482 % Wh te 75.7 87.3 % B ack 5.4 9.1 % As an 10.8 2.1 % H span Lat no 5.5 4.7 Med an Income $53,157 $37,111 Average Da y Ja Census 2,953 2,504 Tota Ja Book ngs 60,992 44,395 Ja ncarcerat on rate per 100,000 3,510 4,818
As shown in Table 1, the population of King County in 2000 was nearly twice as large as
Pinellas County and it had a 43% higher median income. The population of both counties was
mostly white although Pinellas had a somewhat larger black population, fewer Asians, and
about the same percent Hispanic/Latino population as King County. According to Bureau of
Justice Statistics reports (Beck & Karberg, 2001), the Pinellas County jail in 2000 ranked 33rd
4
This document is a research report submitted to the U.S. Department of Justice. This report has not been published by the Department. Opinions or points of view expressed are those of the author(s)
and do not necessarily reflect the official position or policies of the U.S. Department of Justice.

and the King County jail 34th on the list of largest jail jurisdictions in the US. The average daily
jail census was about 18% larger, and the total number of jail bookings was about 37% larger, in
King County than in Pinellas County. However, the incarceration rate per 100,000 was 37%
greater in Pinellas County.
Design
This study used administrative data in a prospective cohort design (see Figure 1) to identify
jail detainees who had severe mental illness and who were enrolled on Medicaid at some point
in time during the three-year study interval. No special interventions were used to increase
Medicaid enrollment while in jail or service use once released to the community. Rather, the
goal of the study was to find out what happens under usual or everyday circumstances in two
large urban public mental health systems.
Figure 1. Three-Year Study Periods Consisting of a 24-Month Enumeration Period and a 12-Month Detention-Specific Follow-Up Period in King County and Pinellas County
lli
ii
ii
lli
DEC 31 1997
DEC 31 1998
SEPT 30
2000
SEPT 30
2001
JAN 1 1996
Fo ow-up Per od
2-Year Study
Enumerat on Per od
2-Year Study Enumerat on
Per od
Fo ow-up Per od
King County
Pinellas County
OCT 1 1998
5
This document is a research report submitted to the U.S. Department of Justice. This report has not been published by the Department. Opinions or points of view expressed are those of the author(s)
and do not necessarily reflect the official position or policies of the U.S. Department of Justice.

All jail releases of persons with severe mental illness in each county over a two-year period
were included in the study. In King County the two-year period was January 1, 1996 through
December 31, 1997; in Pinellas County it was October 1, 1998 through September 30, 2000.
Releases (duplicated count) were treated as the unit of analysis.
Jail detention files were scanned during these two intervals to determine if any of the
releasees were re-admitted to the jail, and if so, the date and charges for each subsequent jail
detention were noted. Each repeated detention that occurred during the two-year study period
for each county was followed in the jail files for 12-months. To address study questions, two
subgroups were compared within each county cohort: (1) those releasees with severe mental
illness who had Medicaid on the day of jail discharge and (2) those releasees with severe
mental illness who did not have Medicaid on the day of jail discharge. Importantly, all of the
study subjects were enrolled in Medicaid at some time during the two-year study interval.
Releasees in the not-Medicaid group were those who either lost enrollment or had not yet been
enrolled on the date of their jail release. The sampling design thereby controls for Medicaid
eligibility and assures that the two groups within each county are roughly comparable on
disability status and financial need. One confirmation of this comparability is that 76-79 percent
of the study subjects (unduplicated count) in both groups in each county were on Supplemental
Security Income (SSI) at some time during the study interval.
Subjects and Data Sources
A total of 2,419 releases involving 1,210 persons were identified in Pinellas County; the
corresponding numbers were 5,189 releases and 2,095 persons in King County. A common
logic was followed at each site to identify study subjects, but data sources and linkage
procedures varied somewhat. For Pinellas County, Medicaid claims files during the study
interval were searched to identify all individuals with a diagnosis of severe mental illness
6
This document is a research report submitted to the U.S. Department of Justice. This report has not been published by the Department. Opinions or points of view expressed are those of the author(s)
and do not necessarily reflect the official position or policies of the U.S. Department of Justice.

identified by way of DSM-IV codes for four primary or secondary conditions: Schizophrenia
(295), Affective Disorders (296, excluding 296.2), Delusional Disorder (297.10), and Psychotic
Disorder Not Otherwise Specified (NOS) (298.9). Then the list of Medicaid enrollees with severe
mental illness was linked to a detention file from the Pinellas County Jail for the same time
interval to identify those who had been booked into jail.
For King County, we had access to Medicaid enrollment files, but not to claims data. So
persons with a diagnosis of severe mental illness during the study interval were identified from
county mental health user files. Next, this list was linked to the Medicaid enrollment files to
identify persons with severe mental illness who were on Medicaid during the study interval.
Finally, the list of persons with severe mental illness who were Medicaid enrolled at some time
during the study interval were linked with a detention file from the King County Jail to identify
those who had one or more jail stays over the two-year study period.
The study protocol was reviewed for human subject’s protection by Institutional Review
Boards at the University of North Carolina at Chapel Hill, the State of Washington’s Department
of Social and Human Services, and the University of South Florida.
Measures
Three demographic variables were available for analysis: race, age, and gender. For race,
two dichotomous variables were used: black (coded 0 for non-black and 1 for black) and other
(coded 0 for non-other and 1 for other) with white as the reference group. Gender was coded 0
for female and 1 for male. For age, three dichotomous variables were used, each coded 0 for no
and 1 for yes: 18 to 25, 36 to 45, and 46 to 64. The group of individuals ages 26 to 35 was used
as the reference category.
Dual mental health/substance abuse diagnoses (coded 0 for no and 1 for yes) and SSI
disability status (coded 0 for no and 1 for yes) were also examined. Substance abuse was
identified by DSM-IV diagnoses (codes 303.90, 304.0, and 305.0). We used receipt of SSI at
7
This document is a research report submitted to the U.S. Department of Justice. This report has not been published by the Department. Opinions or points of view expressed are those of the author(s)
and do not necessarily reflect the official position or policies of the U.S. Department of Justice.
any point during the study interval as a severity marker to confirm that the recorded diagnoses
were associated with severe mental illness.
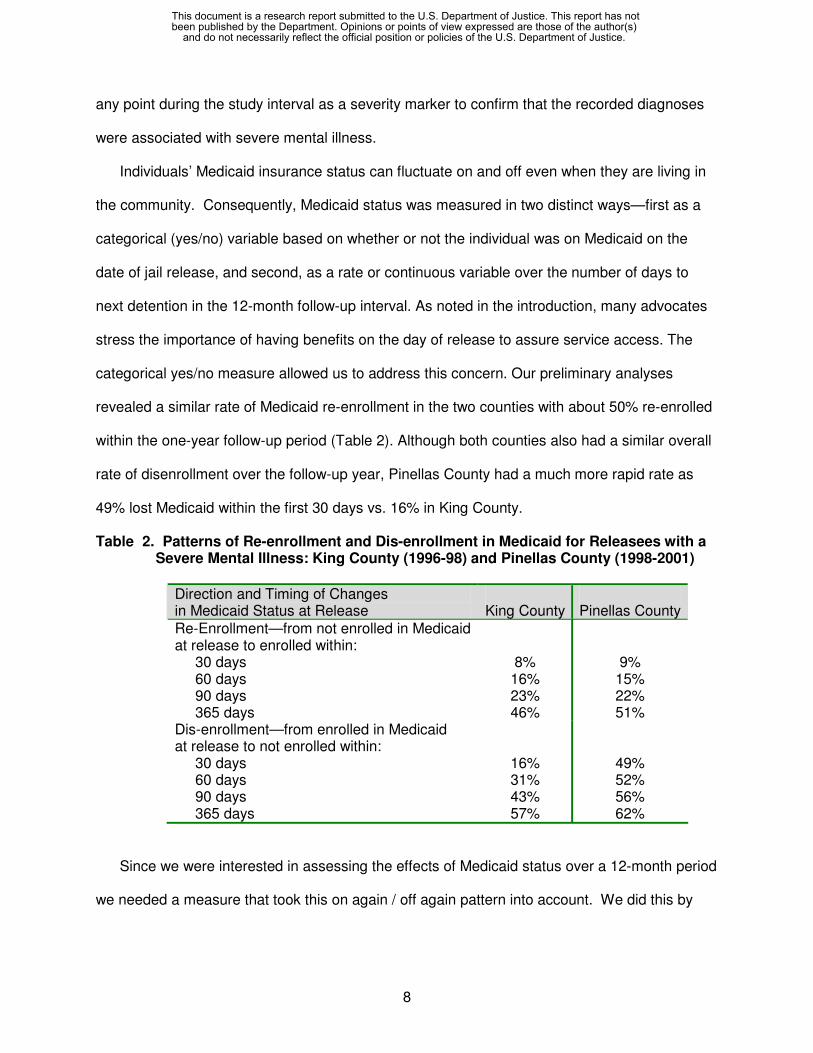
Individuals’ Medicaid insurance status can fluctuate on and off even when they are living in
the community. Consequently, Medicaid status was measured in two distinct ways—first as a
categorical (yes/no) variable based on whether or not the individual was on Medicaid on the
date of jail release, and second, as a rate or continuous variable over the number of days to
next detention in the 12-month follow-up interval. As noted in the introduction, many advocates
stress the importance of having benefits on the day of release to assure service access. The
categorical yes/no measure allowed us to address this concern. Our preliminary analyses
revealed a similar rate of Medicaid re-enrollment in the two counties with about 50% re-enrolled
within the one-year follow-up period (Table 2). Although both counties also had a similar overall
rate of disenrollment over the follow-up year, Pinellas County had a much more rapid rate as
49% lost Medicaid within the first 30 days vs. 16% in King County.
Table 2. Patterns of Re-enrollment and Dis-enrollment in Medicaid for Releasees with a Severe Mental Illness: King County (1996-98) and Pinellas County (1998-2001)
Di i imii i i l Ki Pi ll
ll ll i i id l ll i i
Di ll ll i i id l ll i i
rect on and T ng of Changes n Med ca d Status at Re ease ng County ne as County Re-Enro ment—from not enro ed n Med caat re ease to enro ed w th n:
30 days 8% 9% 60 days 16% 15% 90 days 23% 22% 365 days 46% 51%
s-enro ment—from enro ed n Med caat re ease to not enro ed w th n:
30 days 16% 49% 60 days 31% 52% 90 days 43% 56% 365 days 57% 62%
Since we were interested in assessing the effects of Medicaid status over a 12-month period
we needed a measure that took this on again / off again pattern into account. We did this by
8
This document is a research report submitted to the U.S. Department of Justice. This report has not been published by the Department. Opinions or points of view expressed are those of the author(s)
and do not necessarily reflect the official position or policies of the U.S. Department of Justice.

creating a continuous measure or rate for Medicaid that indicates the number of days enrolled in
Medicaid until next arrest (if any) divided by the number of days until next arrest.
The primary function of Medicaid insurance is to improve access to health care for enrollees.
There is a subset of providers of care who are considered “safety net” providers willing to treat
individuals who do not have the means to pay for services. Consequently, in addition to
measuring Medicaid status, we also measured the amount of services each individual received
post-release. By sequentially controlling for Medicaid enrollment and then for services received
we were able to assess whether the primary benefit of Medicaid was in obtaining services or
perhaps obtaining a higher caliber service.
Service rates were also used to measure post-release outpatient mental health and
outpatient substance abuse service days. The outpatient mental health service rate was
calculated as the number of outpatient service days received divided by the number of days
eligible for outpatient services. Eligible days were discounted by days spent in jail or hospital.
This rate was categorized into Low, Medium, and High categories based upon the frequency
distributions for mental health and substance abuse services in each county. This variable was
computed in three different ways: until next arrest, 90 days post-release, and 365 days post-
release. (In preliminary analyses, the King County frequency distribution was applied to the
Pinellas data to see if a uniform LMH categorization would facilitate comparisons between
counties. The multivariate results indicated no significant differences, so county-specific
categorization was retained in the final analyses.)
Due to the low rate of use of outpatient substance abuse services, a dichotomous variable
was created. This was coded 1 for any services received in the time until next arrest (or 365
days post-release) and 0 for no services received during those time periods.
Three measures were created for subsequent detentions—first, the number of detentions
(coded 0 for none, 1 for one or two, and 2 for three or more); second, the time-to-first-detention
(if any) during the follow-up period (coded as number of days ranging from 0 to 365); and third,
9
This document is a research report submitted to the U.S. Department of Justice. This report has not been published by the Department. Opinions or points of view expressed are those of the author(s)
and do not necessarily reflect the official position or policies of the U.S. Department of Justice.
the seriousness of offense coded separately as a felony and as a violent offense (each coded 0
for no and 1 for yes). Offenses in each county were first coded according to state codes and
then into National Crime Index Codes. In instances were multiple offenses/charges were listed,
the most serious offense was used.
Data Analyses
All data analyses were carried out at the detention-level with 2,419 detentions recorded for
Pinellas County and 5,189 detentions for King County. Bivariate analyses using the categorical
Medicaid measure and multivariate analyses using the Medicaid rate measure are reported. All
statistical analyses were implemented using SAS/STAT 9.1 (SAS Institute, 2004).
Generalized Estimating Equations (GEE) were used to model the frequency of subsequent
jail detentions (how often?) and seriousness of next offense (how serious?). GEE’s sandwich
estimating techniques were used to correct for downward bias among the standard errors and to
accommodate multiple observations within subjects. Preliminary analyses also explored a
negative binominal count model to analyze the number of subsequent offenses, but there were
no significant differences from the GEE results reported here with offenses categorized as 0, 1
2, 3 or more.
Survival analysis was used to address days to next detention (how soon?). To correct for
the dependence of multiple observations for a single individual, a WLW (Wei, Lin, and
Weissfeld, 1989) hazard model was used. This model provides dependence-corrected
coefficient estimates and standard errors.
The policy variables of interest in these multivariate analyses are Medicaid rate and service
use rates. We wanted to isolate the effects on subsequent detentions that can be uniquely
attributed to having Medicaid and avoid attributing to this variable effects that can be more
parsimoniously explained by demographic, clinical, and disability variables. We did this in four
sequential steps for each of three outcomes—number of subsequent detentions, time to next
10
This document is a research report submitted to the U.S. Department of Justice. This report has not been published by the Department. Opinions or points of view expressed are those of the author(s)
and do not necessarily reflect the official position or policies of the U.S. Department of Justice.
detention, and seriousness of next charge: first, introducing demographic (age, race, gender)
and clinical variables (dual MH/SA diagnoses) as an initial set of controls (Model 1); second,
then introducing the SSI variable to assess its direct effects controlling for the demographic and
clinical variables (Model 2); third, then introducing the Medicaid rate variable to assess its direct
effects when controlling for the other demographic, clinical, and disability variables in the model
(Model 3); and fourth, then introducing the mental health and substance abuse variables to
assess their net effects on the outcomes when controlling for all of the other variables in the
model (Model 4). Summary findings from these analyses are presented in the Results section
(below) with detailed tables placed in the Appendix.
A number of other robustness tests were conducted to assess the sensitivity of findings to
particular subgroupings. Separate analyses were run on misdemeanors (yes/no), SSI (yes/no),
295 diagnoses (yes/no), and 296 diagnoses (yes/no). None of these partitions had a significant
effect on the overall findings presented below.
RESULTS
Medicaid Status at Time of Release
The first issue we addressed was the relationship between having Medicaid at the time of
release from jail and the likelihood of receiving services and of jail recividism. Two-thirds of the
releasees with severe mental illness in King County (65%) and over three-fourths of releasees
with severe mental illness in Pinellas County (78%) had Medicaid on the day they left jail (Table
3).
There are some notable similarities and differences between counties in demographic,
diagnosis, and disability characteristics of the Medicaid and not-Medicaid groups (Table 3).
Irrespective of Medicaid status, in both counties the majority of the releasees with severe mental
illness were white, male, and in their mid-30s, with a diagnosis of schizophrenia or mood
disorder. However, there were proportionately more blacks and more individuals with a dual
11
This document is a research report submitted to the U.S. Department of Justice. This report has not been published by the Department. Opinions or points of view expressed are those of the author(s)
and do not necessarily reflect the official position or policies of the U.S. Department of Justice.

mental health/substance abuse disorder in King County, and proportionately more whites and
more women in the Pinellas County study group. Within county, the not-Medicaid category on
average tended to be slightly younger, more white, and male.
Table 3: Demographic and Diagnosis Profiles of Jail Releasees with a Severe Mental Illness in King County (1996-98) and Pinellas County (1998-01) by Medicaid Status at Time of Release
Ki( )
Pi ll( )
i i ii ili i l
i id
( )
i id
( )
i id
( )
i id
( )
i ( ) ( ) ( ) ( ) Bl ( ) ( ) ( ) ( )
( ) ( ) ( ) ( )
le ( ) ( ) ( ) ( ) le ( ) ( ) ( ) ( )
( ) ( ) ( ) ( ) Di i
i ia ( ) ( ) ( ) ( ) i ( ) ( ) ( ) ( )
l i l Di ( ) ( ) ( ) (4) i i ( ) ( ) ( ) ( )
l / i is ( ) ( ) ( ) ( ) i ili ( ) ( ) ( ) ( )
ng County N = 5,189
ne as County N = 2,419
Demograph c, D agnos s, and D sab ty Var ab es
Med ca65% 3346
No Med ca35% 1843
Med ca78% 1877
No Med ca22% 542
Race Wh te 57% 1905 64% 1173 67% 1256 73% 398
ack 39% 1294 31% 567 23% 430 19% 104Other 4% 147 6% 103 10% 191 7% 40
Gender Ma 64% 2141 73% 1352 57% 1070 61% 333Fema 36% 1205 27% 491 42% 807 39% 209
Age (M (SD)) 35 8.9 34 9.3 36 9.5 35 9.1agnos s* Sch zophren 40% 1332 32% 585 46% 867 40% 214Mood D sorder 64% 2142 66% 1208 71% 1341 65% 351De us ona sorder 1% 40 1% 25 <1% 10 1% Psychot c D sorder NOS 10% 328 15% 280 14% 270 10% 53Dua MH SA D agnos 58% 1928 57% 1048 42% 791 38% 207
SSI d sab ty 71% 2,362 43% 798 84% 1,582 68% 369Note: * Percentages are greater than 100% due to multiple diagnoses. Sample sizes are in parentheses following percentages except for age which lists average and standard deviation.
The diagnosis distribution indicates that mood disorder was the predominate diagnosis (64
71%) for both groups in each county. About half of the sample had a diagnosis associated with
other psychoses (schizophrenia and psychotic disorder NOS). The two groups in King County
(about 58%) had a much higher rate of dual mental health and substance abuse diagnoses than
Pinellas County (about 40%). The majority (approximately 70%) of the releasees in both King
and Pinellas counties met SSI disability criteria at some point during the three-year study
interval.
12
This document is a research report submitted to the U.S. Department of Justice. This report has not been published by the Department. Opinions or points of view expressed are those of the author(s)
and do not necessarily reflect the official position or policies of the U.S. Department of Justice.

With regard to service use (Table 4), there is a clear advantage for those who had Medicaid
at the time of jail release in King County, but not in Pinellas County. In King County, releasees
with Medicaid received significantly more total days (46 vs. 28) of outpatient services and used
mental health services at twice the rate (10% vs. 5%) as those who did not have Medicaid at
release. The overall rates of substance abuse services were extremely low (less than 1% on
average), but the Medicaid advantage for releasees in King County is evident even though
substance abuse is not a covered benefit in the Washington State Medicaid program.
Table 4: Post-Release Outpatient Service Days and Service Rates for Releasees with a Severe Mental Illness in King County (1996-1998) and Pinellas County (19982001) by Medicaid Status at Time of Release
Ki( )
Pi ll( )
i i id
( )
i id
( )
i id
( )
i id
( )
l i ( ) ( ) ( ) ( )
i
i l l i
ng County N = 5,189
ne as County N = 2,419
Serv ce Use Med ca65% 3346
No Med ca35% 1843
Med ca78% 1877
No Med ca22% 542
Tota Serv ce Days (M (SD)) 46 61.1 29 47.4 *** 18 38.5 19 48.0
Substance Abuse Serv ce Rate 0.73% 0.55% * .27% .25%
Outpat ent Menta Hea th Serv ce Rate 10% 5% *** 6.0% 5%
Note: * p < .05, ** p < .01, *** p < .001 testing differences between Medicaid and non-Medicaid groups within each county.
In Pinellas County, the amount and rate of service use is basically the same for both groups
indicating that there is no significant advantage favoring those released with Medicaid. Both
groups on average, received around 18 total days of service, used outpatient mental health
services at a 5-6% rate over the course of the follow-up year, and a small fractional rate of
13
This document is a research report submitted to the U.S. Department of Justice. This report has not been published by the Department. Opinions or points of view expressed are those of the author(s)
and do not necessarily reflect the official position or policies of the U.S. Department of Justice.

substance abuse services at less than 1%. These average rates of use for both groups in
Pinellas County are about half as large as the corresponding rates in King County.
Table 5 presents the relevant data about the core question in this study: Does having
Medicaid upon release lead to reductions in subsequent jail detentions for persons with severe
mental illness? Data are presented for the three outcomes of interest—the number, timing, and
seriousness of subsequent detentions—for two groups of releasees in each county who had
severe mental illness: (1) those with Medicaid at release and (2) those without Medicaid at
release.
Overall, about 70% of the releasees with severe mental illness in King County and 60% of
those in Pinellas County were detained at least once during the 12-month follow-up period.
However, in both counties, those released on Medicaid (1.9 and 2.1, respectively) had
significantly fewer detentions on average during the following year than did those not on
Medicaid (2.3 and 2.5, respectively; p< .05 - .001). This statistical difference means that, on
average, detainees with severe mental illness who had Medicaid at release had about 16%
fewer detentions in the following year than did detainees with severe mental illness who didn’t
have Medicaid benefits on the day of release from jail.
Differences between King and Pinellas counties also are evident in time to next detention
(Table 5). In King County, releasees with severe mental illness who had Medicaid at release
remained in the community 10 days longer on average (102 vs. 93 days) than those who did not
have Medicaid at release (p<.01). This Medicaid advantage results in a 3-5% difference at each
of the 30, 60, 90, 365 time intervals (p< .001-.05). In Pinellas County, the difference between
groups in total days in the community (110 vs.111) is not statistically significant. However, at
365 days there is a small statistically significant difference in the percent detained (71% vs.
66%) that favors those released with Medicaid (p< .05).
With regard to seriousness of next offense (Table 5), the large majority of offenses in each
county were for minor, non-violent crimes. Only 31-35% of the offenses are felonies and only
14
This document is a research report submitted to the U.S. Department of Justice. This report has not been published by the Department. Opinions or points of view expressed are those of the author(s)
and do not necessarily reflect the official position or policies of the U.S. Department of Justice.

18-23% is associated with a violent crime. Having Medicaid at release does not lead to an
advantage in having less serious charges at next detention. The demographic and diagnosis
profiles of offense types were consistent within Medicaid groups (see Appendix Tables A1 and
A2).
Table 5. Characteristics of Jail Detentions with a Severe Mental Illness in King County (1996-98) and Pinellas County (1998-01) by Medicaid Status at Time of Release
Ki( )
Pi ll( )
ii i
i id
( )
i id
( )
i id
( )
i id
( )
i
( ) ( ) ( ) ( )*
Ti iWi iWi iWi iWi i
( ) ( ) ( ) ( )
i
Violl
i il i ( ) ( ) ( ) ( )*
ng County N = 5,189
ne as County N = 2,419
Detent on Character st cs
Med ca65% 3,346
No Med ca35% 1,843
Med ca78% 1,877
No Med ca22% 542
Number of Subsequent Detent ons
None 32% 29% 43% 40% One or two 40% 38% 42% 40% Three or more 28% 33% 16% 20% Average (M, SD) 1.9 2.26 2.3 2.63 *** 2.1 2.78 2.5 3.05
me to Next Detent on th n 30 days 21% 24%** 16% 17% th n 60 days 32% 36%** 25% 25% th n 90 days 39% 44%*** 32% 33% th n 365 days 68% 71%* 66% 71%*
Average days (M, SD) 102 95.2 93 92.2 ** 110 99.3 111 100.4
Ser ousness of Subsequent Offense
ent 18% 18% 23% 22% Fe ony 31% 33% 35% 33%
Days n Ja for Subsequent Detent ons (M, SD) 17 32.1 20 38.4 ** 25 46.2 32 70.4Note: * p < .05, ** p < .01, *** p < .001 testing differences between Medicaid and non-Medicaid
groups within each county.
Finally, the Medicaid advantage reappears in the average length of incarceration for those
who were detained during the follow-up period (Table 5). Here, the advantage occurs in both
counties. In King County, detainees with a severe mental illness who were on Medicaid at
15
This document is a research report submitted to the U.S. Department of Justice. This report has not been published by the Department. Opinions or points of view expressed are those of the author(s)
and do not necessarily reflect the official position or policies of the U.S. Department of Justice.

release spent three fewer days in jail (17 vs. 20, p< .01) on average than those without
Medicaid at release. In Pinellas County, there was a seven-day advantage (25 vs. 32 days, p<
.01) favoring those who were on Medicaid at release.
These length of incarcerations help to explain why the rates of Medicaid at release are so
high in these two counties (65% in King and 78% in Pinellas, see Table 5). The Social Security
Administration (SSA) has a 30-day rule for suspension of SSI benefits for individuals in jails and
other public institutions (Bazelon Center, 2001). Most adult males with severe mental illness
who have Medicaid qualify through SSA disability provisions which authorize Medicaid coverage
for all SSI recipients. With the exception of the not-Medicaid group in Pinellas County, the
average length of jail stay for these cohorts does not exceed this cut-off point.
Consequently, only a very small percentage of the detainees who had a severe mental
illness lost their Medicaid enrollment while they were in jail. Those who did lose their Medicaid
benefits in both counties were a relatively small number of outliers who stayed in jail for many
months. Otherwise, detainees with severe mental illness who entered jail with Medicaid also
exited jail with their Medicaid benefits intact.
Medicaid Rate and Subsequent Detentions
We now turn to the multivariate analyses that treat Medicaid as a continuous variable
measuring the proportion of days on Medicaid prior to the next detention (if any) that occurred
within the 12-month follow-up period. These multivariate analyses allow us to control for other
variables in assessing the effects of Medicaid on the likelihood of subsequent detentions for
releasees with severe mental illness.
To simplify the presentation of these findings we use odds ratios to identify variables that
are making a significant contribution to each of the three primary questions of interest about
subsequent detentions—how many, how often, and how serious. An odds ratio (OR) is readily
interpretable—a value of 1.0 means that the variable has no effect on the odds of an outcome
16
This document is a research report submitted to the U.S. Department of Justice. This report has not been published by the Department. Opinions or points of view expressed are those of the author(s)
and do not necessarily reflect the official position or policies of the U.S. Department of Justice.

event occurring, a value less than 1.0 means that the variable decreases the odds of an event
occurring, and a value greater than 1.0 means that the variable increases the odds of an event
occurring. The magnitude of the effect is greater the further the odds ratio is away from 1.0 in
either direction.
We follow the logic of the sequential analysis (described in Methods section above) to
isolate the full and net effects of the Medicaid policy variable. The full effects of Medicaid are
estimated after controlling for other demographic, diagnosis, and disability variables (see
Models 2 and 3 in Appendix Table A3-A10). The net (unique) effects of Medicaid are estimated
after controlling for the mental health and substance abuse service variables as well as the
demographics, diagnosis, and disability variables (see Model 4 in Appendix Tables A3-A10).
The full effects in Table 6 indicate that, after controlling for the three Ds (demographics,
diagnosis, and disability), the Medicaid rate variable decreases the odds on three of the four
outcomes in King County. In other words, these results suggest that having more days on
Medicaid during the follow-up year led to fewer detentions, more days in the community prior to
next detention, and non-felony charges upon next detention. The odds ratio for violent offenses
in King County is in the same direction, but it’s not significant. For Pinellas County, the full
effects Medicaid rate variable only has a significant reduction for the timing of next offense (how
soon); the other odds ratios are not significant.
In the net effects model for King County, the Medicaid rate variable continues to exert a
strong influence in decreasing the odds for subsequent detentions (how often). But for days in
the community (how soon) and seriousness of charges (felony), the effect sizes for the Medicaid
variable remain relatively stable but are no longer statistically significant. Here, the effect of
Medicaid appears to be in the individual’s greater access to services. Higher rates of mental
health and substance abuse service use led to more days in the community prior to next
detention (ORs= .53 and .83, p< .001) and higher rates of mental health service use decreased
17
This document is a research report submitted to the U.S. Department of Justice. This report has not been published by the Department. Opinions or points of view expressed are those of the author(s)
and do not necessarily reflect the official position or policies of the U.S. Department of Justice.

the odds of having felony charges (OR= .79, p< .05). Contrary to expectations, mental health
service use increased the odds of having a violent next offense (OR= 1.32, p< .05).
Table 6. Odds Ratios from Full Effects and Net Effects Multivariate Models of How Often, How Soon, and How Serious the Next Detention(s) over 12-month Follow Up Were for Releasees with Severe Mental Illness in King County (1996-98) and Pinellas County (1998-01)
Ki a/ Pi ll a/
i ii
l Viol l Violll b/
i i
b/
i iiii
ng County ne as County How Ser ous? How Ser ous?
Pred ctor How Often?
How Soon? Fe ony ent
How Often?
How Soon? Fe ony ent
Fu effects Med ca d Rate .57*** .86* .84* .95 .91 .84* 1.32 1.30
Net Effects Med ca d Rate .56*** .93 .84 .94 .85 1.08 1.35 1.26 MH Serv ce Rate (M) .95 .53*** .79* 1.16 1.36* .33*** .84 .94 MH Serv ce Rate (H) 1.17 .83*** 1.13 1.32* 1.25 .56*** .91 1.21 SA Serv ce Rate .86 .61*** 1.03 .94 1.2 .98 1.04 1.04
Note: * p < .05, ** p < .01, *** p < .001 testing differences from 1.0 (no effect) for each predictor variable within each county.
a/ Odds ratios for ‘how soon’ are based on only those individuals who had a subsequent detention, whereas the odds ratios for ‘how often’ and ‘how serious’ are based on the total sample (those with and without subsequent detentions). b/ All odds ratios control for race, gender, age, dual MH/SA diagnosis, and SSI/disability.
In Pinellas County, the Medicaid rate variable only has a significant main effect on days in
the community (OR= .84, p< .05). Similar to King County, high rates of mental health service
use led to more community days (ORs= .33 and .56, p< .001). One anomaly in the Pinellas
County results is that the number of detentions (how often) was greater for those who used
mental health services. There were no significant effects for Medicaid rate or any of the service
variables on violent offenses in Pinellas County.
DISCUSSION
The overall findings reported here provide clear evidence that Medicaid benefits have
positive effects both for the mental health and for the criminal justice systems. Although the
18
This document is a research report submitted to the U.S. Department of Justice. This report has not been published by the Department. Opinions or points of view expressed are those of the author(s)
and do not necessarily reflect the official position or policies of the U.S. Department of Justice.
findings for King and Pinellas counties do not align perfectly they do agree that, while the
combination of Medicaid benefits and service use does not prevent jail recividism, they do help
to keep people with severe mental illness out of jail for longer periods of time than those who
either don’t have benefits or have them for fewer days. Our earlier report documented mental
health system gains from having persons with severe mental illness on Medicaid following jail
release (Morrissey et al., 2004). The findings reported in this paper show that jails gain from
having mentally ill offenders on Medicaid as well. Strategies where both systems can work
together to have offenders with severe mental illness access and retain Medicaid would work to
the advantage of both systems.
Another important finding that is consistent across these two counties is that people with a
severe mental illness commit mostly minor crimes. Nearly 70% of the offenses that led to jail
detention of people with a severe mental illness were for non-violent misdemeanors. This
number is much more reliable than other reports in the literature as it is based on population
data from two large urban counties over a three-year time period. It underscores the fact that
public perceptions of mentally ill persons as dangerous and violence-prone are grossly
exaggerated and misleading (Swanson et al., 1990; Steadman et al., 1998).
What’s troubling in these data is the fact that about 70% of the cohort of people with severe
mental illness in these two counties were re-arrested and detained in jail at least once and 17
30% for three or more times during a 12-month follow-up period. These findings confirm the
revolving door experience that many people with severe mental illness have with jails on a
regular basis. In one instance, we found an individual with severe mental illness who had been
admitted to the county jail 52 times in a single year!
Limitations
These observations must be tempered by acknowledging that the findings are based on
events in only two communities. Results may vary for other communities if jail stays for
19
This document is a research report submitted to the U.S. Department of Justice. This report has not been published by the Department. Opinions or points of view expressed are those of the author(s)
and do not necessarily reflect the official position or policies of the U.S. Department of Justice.

detainees with severe mental illness consistently exceed the thirty-day Medicaid cut-off and if,
as a result, Medicaid benefits are suspended at a higher rate. Differences in the availability and
accessibility of post-release services for jail detainees, especially of evidenced-based services
for persons with severe mental illness, could also lead to higher rates of service use and lower
rates of reincarceration than those reported here. However, there are no national data available
on such events and the two communities studied have service configurations that are typical for
other large urban areas in the US. So these findings are the best estimates now available.
Another limitation is that the findings reported here only pertain to individuals with severe
mental illness in jail who are Medicaid eligible. They might not apply to the many mentally ill
individuals in jail who have a less serious psychiatric diagnosis or to those persons who might
receive a diagnosis representing severe mental illness if seen by a psychiatrist, but who were
either not enrolled in Medicaid or not known to the public mental health system at the time of
this study.
Caution must also be exercised in drawing conclusions about state prison populations from
the jail data reported here. What is generalizable to mentally ill prisoners from these data is that
having Medicaid on the day of release will likely help them obtain needed services in the
community just as they helped the jail detainees in this study. Moreover, state prisoners with
severe mental illness need access to equally intensive evidence-based treatments as do jail
detainees. What is not generalizable to prisons is the high rate of Medicaid enrollment at
release for detainees with severe mental illness. Prisons are long stay institutions (the average
length of incarceration for prisoners is over five years) so 100% of those who enter prison with
Medicaid lose it before they are released. The same is true for SSI benefits and other
entitlements. Jails, in contrast, are short stay institutions. Detainees in this study only spent an
average of 16-32 days in jail so virtually all those with severe mental illness who had Medicaid
at jail entry (about 65-78% in the two counties) also had it upon release.
20
This document is a research report submitted to the U.S. Department of Justice. This report has not been published by the Department. Opinions or points of view expressed are those of the author(s)
and do not necessarily reflect the official position or policies of the U.S. Department of Justice.

Conclusions
One implication of the above discussion is that, if prisoners with severe mental illness are to
have Medicaid and other benefits at release, then special efforts extending over many months
are needed to assist prisoners to re-enroll in entitlement programs. In contrast, jail stays for
persons with severe mental illness are so much shorter that most detainees do not lose
Medicaid or SSI while in jail. This suggests that the need for the type of special benefit
assistance programs that several states are now introducing is much greater in prisons than in
jails.
Currently, there are no published data available about the recividism of prisoners with
severe mental illness who either have or do not have Medicaid and other benefits. Further
research is needed to evaluate the success of current prison-based benefit assistance
programs for prisoners who have severe mental illness. Studies along the lines presented in this
report could establish whether benefit assistance programs result in high rates of Medicaid
enrollment at release, greater use of community-based services following release, and lower
rates of recividism.
Whether talking about jails or prisons, however, it’s the quality of treatment services
received by persons with a severe mental illness that’s likely to make a difference in their
functioning and avoidance of recividism. Simply diverting people with severe mental illness to
everyday or generic mental health services in the community is unlikely to have a positive
impact on their ability to live in the community free of criminal justice involvements (Steadman
and Naples, 2004). Generic services are not intensive enough nor are they attuned enough to
the multiple comorbidities of this population. What’s needed is diversion to intensive services
such as assertive community treatment or dual diagnosis treatment teams that have an
evidence base and proven track record of being successful in treating persons with severe
mental illness.
21
This document is a research report submitted to the U.S. Department of Justice. This report has not been published by the Department. Opinions or points of view expressed are those of the author(s)
and do not necessarily reflect the official position or policies of the U.S. Department of Justice.

Evidence-based treatments that promote recovery and increase opportunities for successful
community living offer the best hope for people with a severe mental illness whether they are
released from prisons or jails. However, solid research data backing up this assessment for
people with severe mental illness in jails or other correctional settings are not currently
available. Responding to this gap in the current knowledge base should be a high priority both
for the mental health and criminal justice research communities.
22
This document is a research report submitted to the U.S. Department of Justice. This report has not been published by the Department. Opinions or points of view expressed are those of the author(s)
and do not necessarily reflect the official position or policies of the U.S. Department of Justice.

APPENDIX TABLES
23
This document is a research report submitted to the U.S. Department of Justice. This report has not been published by the Department. Opinions or points of view expressed are those of the author(s)
and do not necessarily reflect the official position or policies of the U.S. Department of Justice.

Table A1: Demographics and Diagnoses by Crime Status (Violent and Non-Violent) For Jail Detentions with a Severe Mental Illness in King County (1996-98) and Pinellas County (1998-01)
Ki( )
Pi ll( )
i Viol iol Viol iolDi i i l
( ) ( ) ( ) ( )
iBl
le le
( ) ( ) ( ) ( ) Di i
i ia i
l i l Dii i
l / i is
ng County N = 5,189
ne as County N = 2,419
Demograph c and ent Non-V ent ent Non-V ent agnos s Var ab es 18.0%
93482.0% 4255
22.9% 555
77.1% 1864
Race Wh te 58.1% 59.6% 63.2% 69.9%
ack 35.1% 36.0% 26.7% 20.7% Other 6.8% 4.4% 10.1% 9.4%
Gender Ma 67.2% 67.3% 63.1% 56.5% Fema 32.8% 32.7% 36.9% 43.5%
Age (M(SD)) 34.7 9.1
34.9 9.0
36.1 9.4
34.3 9.7
agnos s* Sch zophren 42.6% 35.7% 49.4% 43.3% Mood d sorders 60.4% 65.5% 66.1% 71.1% De us ona sorders 1.5% 1.2% 0.7% 0.5% Psychot c D sorder NOS 13.8% 11.3% 13.3% 13.4% Dua MH SA D agnos 49.7% 59.0% 33.2% 43.8%
Note: * Percentages are greater than 100% due to overlap.
24
This document is a research report submitted to the U.S. Department of Justice. This report has not been published by the Department. Opinions or points of view expressed are those of the author(s)
and do not necessarily reflect the official position or policies of the U.S. Department of Justice.

Table A2. Demographics and Diagnoses by Crime Status (Felony and Non-Felony) For Jail Detentions with a Severe Mental Illness in King County (1996-98) and Pinellas County (1998-01)
Ki( )
Pi ll( )
i l l l lDi i i l
( ) ( ) ( ) ( )
iBl
le le
) ( ) ( ) ( ) Di i
i ia i
l i l Dii i
l Di i
ng County N = 5,189
ne as County N = 2,419
Demograph c and Fe ony Non-Fe ony Fe ony Non-Fe ony agnos s Var ab es 31.5%
163668.5% 3553
34.1% 826
65.9% 1593
Race Wh te 56.3% 60.7% 61.7% 71.8%
ack 38.3% 34.7% 28.5% 18.8% Other 5.4% 4.6% 9.8% 9.4%
Gender Ma 71.6% 65.3% 56.3% 58.9% Fema 28.4% 34.7% 43.7% 41.1%
Age (M(SD)) 34.9 (9.1
34.8 9.0
34.5 8.8
36.4 9.7
agnos s* Sch zophren 40.3% 35.4% 43.7% 45.2% Mood d sorders 61.9% 65.8% 67.0% 71.5% De us ona sorders 1.6% 1.1% .7% .5% Psychot c D sorder NOS 13.6% 10.8% 9.0% 15.6% Dua agnos s. 59.5% 56.4% 38.5% 42.7%
Note: * Percentages are greater than 100% due to overlap.
25
This document is a research report submitted to the U.S. Department of Justice. This report has not been published by the Department. Opinions or points of view expressed are those of the author(s)
and do not necessarily reflect the official position or policies of the U.S. Department of Justice.

A3: Predictors of Frequency of Subsequent Detentions within 365 Days Post Jail Release for Persons with a Severe Mental Illness, King County (1996-98): Full Sample (N = 5,189)
l 1 l 2 l 3 l 4 i i l B B B B
Mode Mode Mode ModePred ctor Var ab es SE B OR SE B OR SE B OR SE B OR
Black vs. White 0.58 0.11 1.79*** 0.58 0.11 1.79*** 0.61 0.11 1.84*** 0.61 0.11 1.84*** Other Race vs. White 0.04 0.22 1.04 0.04 0.22 1.04 0.03 0.21 1.03 0.02 0.21 1.02 Male vs. Female 0.03 0.11 1.03 0.02 0.11 1.02 -0.04 0.11 0.96 -0.05 0.11 0.95 Age 18_25 vs. 26_35 0.14 0.14 1.15 0.15 0.14 1.16 0.11 0.14 1.12 0.10 0.14 1.11 Age 36_45 vs. 26_35 -0.15 0.12 0.86 -0.16 0.12 0.85 -0.15 0.12 0.86 -0.17 0.11 0.84 Age 46_64 vs. 26_35 Dual Diagnosis vs. SMI1Only
-0.30 0.53
0.16 0.10
0.74 1.70***
-0.31 0.53
0.16 0.10
0.73 1.70***
-0.31 0.53
0.16 0.10
0.73 1.70***
-0.33 0.54
0.16 0.10
0.72* 1.72***
SSI 0.10 0.12 1.11 0.25 0.12 1.28** 0.20 0.12 1.28 Medicaid Rate -0.57 0.13 0.57*** -0.58 0.13 0.56*** Outpatient Substance Abuse -0.15 0.12 0.86 Outpatient Mental Health (M) -0.05 0.09 0.95 Outpatient Mental Heath (H) 0.16 0.11 1.17 Note: * p < .05, ** p < .01, *** p < .001 testing differences from 1.0 (no effect) for each predictor variable within each county. The full sample in these analyses includes releases that had subsequent detentions in the one-year follow-up period and releases that did not have subsequent detentions in the one-year follow-up period. 1SMI= severe mental illness.
26
This document is a research report submitted to the U.S. Department of Justice. This report has not been published by the Department. Opinions or points of view expressed are those of the author(s)
and do not necessarily reflect the official position or policies of the U.S. Department of Justice.

A4: Predictors of Frequency of Subsequent Detentions within 365 Days Post Jail Release for Persons with a Severe Mental Illness, Pinellas County (1998-01): Full Sample (N = 2,419)
l 1 l 2 l 3 l 4 i i l B B B B
Mode Mode Mode ModePred ctor Var ab es SE B OR SE B OR SE B OR SE B OR
Black vs. White 0.19 0.15 1.21 0.20 0.15 1.22 0.20 0.15 1.22 0.22 0.15 1.25 Other Race vs. White -0.12 0.20 0.89 -0.10 0.21 0.90 -0.10 0.21 0.90 -0.09 0.21 0.91 Male vs. Female 0.42 0.12 1.52*** 0.44 0.12 1.55*** 0.44 0.13 1.55*** 0.43 0.13 1.54*** Age 18_25 vs. 26_35 -0.13 0.18 0.88 -0.14 0.19 0.87 -0.13 0.19 0.88 -0.12 0.19 0.89 Age 36_45 vs. 26_35 -0.34 0.14 0.71* -0.34 0.15 0.71* -0.34 0.15 0.71* -0.34 0.15 0.71* Age 46_64 vs. 26_35 -0.63 0.21 0.53** -0.62 0.21 0.54** -0.62 0.21 0.54** -0.66 0.22 0.52** Dual Diagnosis vs. SMI Only 0.66 0.13 1.93*** 0.67 0.13 1.95*** 0.67 0.13 1.95*** 0.60 0.14 1.82*** SSI -0.10 0.16 0.90 -0.08 0.17 0.92 -0.08 0.17 0.92 Medicaid Rate -0.09 0.18 0.91 -0.16 0.18 0.85 Outpatient Substance Abuse 0.20 0.18 1.22 Outpatient Mental Health (M) 0.31 0.14 1.36* Outpatient Mental Heath (H) 0.22 0.14 1.25 Note: * p < .05, ** p < .01, *** p < .001 testing differences from 1.0 (no effect) for each predictor variable within each county. The full sample in these analyses include releases that had subsequent detentions in the one-year follow-up period and releases that did not have subsequent detentions in the one-year follow-up period.
27
This document is a research report submitted to the U.S. Department of Justice. This report has not been published by the Department. Opinions or points of view expressed are those of the author(s)
and do not necessarily reflect the official position or policies of the U.S. Department of Justice.

A5: Predictors of Time to Subsequent Detention for Jail Releasees with Severe Mental Illness in King County (1996-98): Detained Sample Only (N = 3,579)
l 1 l 2 l 3 l 4 i i l B B B B
Mode Mode Mode ModePred ctor Var ab es SE B OR SE B OR SE B OR SE B OR
Black vs. White 0.07 0.04 1.07 0.07 0.04 1.07 0.08 0.04 1.08 0.07 0.04 1.07 Other Race vs. White 0.26 0.08 1.30*** 0.26 0.08 1.30*** 0.25 0.08 1.28*** 0.23 0.09 1.26** Male vs. Female -0.02 0.04 0.98 -0.02 0.04 0.98 -0.04 0.04 0.96 -0.06 0.04 0.94 Age 18_25 vs. 26_35 0.05 0.05 1.05 0.05 0.05 1.05 0.05 0.06 1.05 0.01 0.06 1.01 Age 36_45 vs. 26_35 -0.05 0.05 0.95 -0.03 0.05 0.97 -0.04 0.05 0.96 -0.06 0.05 0.94 Age 46_64 vs. 26_35 0.03 0.06 1.03 0.01 0.06 1.01 0.00 0.06 1.00 0.01 0.06 1.01 Dual Diagnosis vs. SMI Only 0.03 0.04 1.03 0.03 0.04 1.03 0.03 0.04 1.03 0.03 0.04 1.03 SSI 0.05 0.05 1.05 0.09 0.05 1.09 0.09 0.05 1.09 Medicaid Rate -0.15 0.05 0.86* -0.07 0.05 0.93 Outpatient Substance Abuse -0.50 0.06 0.61*** Outpatient Mental Health (M) -0.63 0.04 0.53*** Outpatient Mental Heath (H) -0.19 0.05 0.83*** Note: * p < .05, ** p < .01, *** p < .001 testing differences from 1.0 (no effect) for each predictor variable within each county. The detained sample in these analyses contains only those releases that had a subsequent detention. Releases that did not have a subsequent detention in the one-year follow-up period were excluded from these analyses.
28
This document is a research report submitted to the U.S. Department of Justice. This report has not been published by the Department. Opinions or points of view expressed are those of the author(s)
and do not necessarily reflect the official position or policies of the U.S. Department of Justice.

A6: Predictors of Time to Subsequent Detentions for Jail Releasees with Severe Mental Illness in Pinellas County (1998-01): Detained Sample Only (N = 1,398)
l 1 l 2 l 3 l 4 i i l B B B B
Mode Mode Mode ModePred ctor Var ab es SE B OR SE B OR SE B OR SE B OR
Black vs. White -0.04 0.07 0.96 -0.05 0.07 0.95 -0.05 0.07 0.95 -0.10 0.08 0.90 Other Race vs. White 0.05 0.08 1.05 -0.01 0.08 0.99 -0.02 0.08 0.98 -0.01 0.09 0.99 Male vs. Female 0.09 0.06 1.09 0.05 0.06 1.05 0.02 0.07 1.02 0.07 0.07 1.07 Age 18_25 vs. 26_35 -0.24 0.09 0.79** -0.24 0.09 0.79** -0.23 0.09 0.79** -0.25 0.09 0.78** Age 36_45 vs. 26_35 -0.12 0.07 0.89 -0.13 0.07 0.88 -0.11 0.07 0.90 -0.00 0.08 1.00 Age 46_64 vs. 26_35 -0.01 0.11 0.99 0.05 0.11 1.05 0.07 0.11 1.07 0.11 0.12 1.12 Dual Diagnosis vs. SMI Only -0.02 0.06 0.98 -0.03 0.06 0.97 -0.01 0.06 0.99 0.05 0.07 1.05 SSI 0.16 0.09 1.17* 0.25 0.09 1.28** 0.29 0.09 1.34** Medicaid Rate -0.18 0.08 0.84* 0.08 0.09 1.08 Outpatient Substance Abuse -0.02 0.11 0.98 Outpatient Mental Health (M) -1.10 0.11 0.33*** Outpatient Mental Heath (H) -0.58 0.13 0.56*** Note: * p < .05, ** p < .01, *** p < .001 testing differences from 1.0 (no effect) for each predictor variable within each county. The detained sample in these analyses contains only those releases that had a subsequent detention. Releases that did not have a subsequent detention in the one-year follow-up period were excluded from these analyses.
29
This document is a research report submitted to the U.S. Department of Justice. This report has not been published by the Department. Opinions or points of view expressed are those of the author(s)
and do not necessarily reflect the official position or policies of the U.S. Department of Justice.

A7: Predictors of Felony/Non-Felony Subsequent Detentions for Persons with Severe Mental Illness in King County (1996-98): Detained Sample Only (N = 3,579)
l 1 l 2 l 3 l 4 i i l B B B B
Mode Mode Mode ModePred ctor Var ab es SE B OR SE B OR SE B OR SE B OR
Black vs. White 0.19 0.09 1.21** 0.18 0.10 1.20* 0.20 0.10 1.22* 0.20 0.10 1.22* Other Race vs. White 0.36 0.21 1.43* 0.35 0.21 1.42 0.35 0.21 1.42 0.35 0.21 1.42 Male vs. Female 0.32 0.10 1.38*** 0.30 0.10 1.35** 0.29 0.11 1.34 0.29 0.11 1.34** Age 18_25 vs. 26_35 -0.19 0.13 0.83 -0.18 0.13 0.84 -0.19 0.13 0.83 -0.19 0.13 0.83 Age 36_45 vs. 26_35 -0.16 0.11 0.85 -0.18 0.11 0.84 -0.17 0.11 0.84 -0.19 0.11 0.83 Age 46_64 vs. 26_35 -0.05 0.15 0.95 -0.07 0.15 0.93 -0.08 0.15 0.92 -0.09 0.15 0.91 Dual Diagnosis vs. SMI Only 0.13 0.09 1.14 0.13 0.09 1.14 0.13 0.09 1.14 0.11 0.09 1.12 SSI 0.20 0.12 1.22 0.25 0.12 1.28** 0.23 0.12 1.26* Medicaid Rate -0.17 0.10 0.84* -0.18 0.10 0.84 Outpatient Substance Abuse 0.03 0.16 1.03 Outpatient Mental Health (M) -0.23 0.11 0.79* Outpatient Mental Heath (H) 0.12 0.11 1.13 Note: * p < .05, ** p < .01, *** p < .001 testing differences from 1.0 (no effect) for each predictor variable within each county. The detained sample in these analyses contains only those releases that had a subsequent detention. Releases that did not have a subsequent detention in the one-year follow-up period were excluded from these analyses.
30
This document is a research report submitted to the U.S. Department of Justice. This report has not been published by the Department. Opinions or points of view expressed are those of the author(s)
and do not necessarily reflect the official position or policies of the U.S. Department of Justice.

A8: Predictors of Felony/Non-Felony Subsequent Detentions for Persons with Severe Mental Illness in Pinellas County (1998-01): Detained Sample Only (N = 1,398)
l 1 l 2 l 3 l 4 i i l B B B B
Mode Mode Mode ModePred ctor Var ab es SE B OR SE B OR SE B OR SE B OR
Black vs. White 0.61 0.20 1.84** 0.60 0.20 1.82** 0.60 0.20 1.82** 0.59 0.20 1.80** Other Race vs. White 0.11 0.25 1.12 0.09 0.25 1.09 0.09 0.25 1.09 0.08 0.25 1.08 Male vs. Female -0.11 0.16 0.90 -0.14 0.17 0.87 -0.11 0.17 0.90 -0.12 0.17 0.89 Age 18_25 vs. 26_35 0.01 0.25 1.01 0.01 0.25 1.01 0.02 0.25 1.02 -0.02 0.26 0.98 Age 36_45 vs. 26_35 -0.16 0.20 0.85 -0.17 0.20 0.84 -0.19 0.20 0.83 -0.17 0.20 0.84 Age 46_64 vs. 26_35 -0.92 0.29 0.40*** -0.91 0.29 0.40*** -0.95 0.29 0.39*** -0.95 0.29 0.39*** Dual Diagnosis vs. SMI Only -0.30 0.17 0.74 -0.30 0.17 0.74 -0.31 0.17 0.73 -0.31 0.17 0.73 SSI 0.10 0.21 1.11 0.04 0.21 1.04 0.05 0.21 1.05 Medicaid Rate 0.28 0.21 1.32 0.30 0.22 1.35 Outpatient Substance Abuse 0.04 0.31 1.04 Outpatient Mental Health (M) -0.18 0.30 0.84 Outpatient Mental Heath (H) -0.09 0.34 0.91 Note: * p < .05, ** p < .01, *** p < .001 testing differences from 1.0 (no effect) for each predictor variable within each county. The detained sample in these analyses contains only those releases that had a subsequent detention. Releases that did not have a subsequent detention in the one-year follow-up period were excluded from these analyses.
31
This document is a research report submitted to the U.S. Department of Justice. This report has not been published by the Department. Opinions or points of view expressed are those of the author(s)
and do not necessarily reflect the official position or policies of the U.S. Department of Justice.

A9: Predictors of Violent/Non-Violent Subsequent Detentions for Jail Releasees with Severe Mental Illness in King County (1996-98): Detained Sample Only (N = 3,579)
l 1 l 2 l 3 l 4 i i l B B B B
Mode Mode Mode ModePred ctor Var ab es SE B OR SE B OR SE B OR SE B OR
Black vs. White 0.08 0.12 1.08 0.08 0.13 1.08 0.08 0.13 1.08 0.09 0.13 1.09 Other Race vs. White 0.38 0.26 1.46 0.38 0.26 1.46 0.38 0.26 1.46 0.39 0.26 1.48 Male vs. Female 0.24 0.14 1.27 0.23 0.14 1.26 0.22 0.16 1.25 0.22 0.15 1.25 Age 18_25 vs. 26_35 -0.01 0.16 0.99 -0.00 0.16 1.00 -0.01 0.16 0.99 0.00 0.16 1.00 Age 36_45 vs. 26_35 -0.03 0.15 0.97 -0.04 0.15 0.96 -0.04 0.15 0.96 -0.06 0.15 0.94 Age 46_64 vs. 26_35 -0.09 0.19 0.91 -0.22 0.20 0.80 -0.22 0.20 0.80 -0.23 0.20 0.79 Dual Diagnosis vs. SMI Only -0.22 0.12 0.80 -0.22 0.12 0.80 -0.22 0.12 0.80 -0.22 0.12 0.80 SSI 0.17 0.16 1.19 0.18 0.16 1.20 0.14 0.16 1.15 Medicaid Rate -0.05 0.13 0.95 -0.11 0.13 0.90 Outpatient Substance Abuse -0.06 0.22 0.94 Outpatient Mental Health (M) 0.15 0.13 1.16 Outpatient Mental Heath (H) 0.28 0.14 1.32* Note: * p < .05, ** p < .01, *** p < .001 testing differences from 1.0 (no effect) for each predictor variable within each county. The detained sample in these analyses contains only those releases that had a subsequent detention. Releases that did not have a subsequent detention in the one-year follow-up period were excluded from these analyses.
32
This document is a research report submitted to the U.S. Department of Justice. This report has not been published by the Department. Opinions or points of view expressed are those of the author(s)
and do not necessarily reflect the official position or policies of the U.S. Department of Justice.

A10: Predictors of Violent/Non-Violent Subsequent Detentions for Jail Releasees with Severe Mental Illness in Pinellas County (1998-01): Detained Sample Only (N = 1,398)
l 1 l 2 l 3 l 4 i i l B B B B
Mode Mode Mode ModePred ctor Var ab es SE B OR SE B OR SE B OR SE B OR
Black vs. White 0.49 0.25 1.63* 0.51 0.24 1.67* 0.51 0.24 1.67* 0.48 0.25 1.62* Other Race vs. White 0.18 0.31 1.20 0.23 0.31 1.26 0.23 0.31 1.26 0.23 0.31 1.26 Male vs. Female 0.41 0.21 1.51* 0.47 0.21 1.60* 0.50 0.22 1.65* 0.47 0.22 1.60* Age 18_25 vs. 26_35 -0.07 0.29 0.93 -0.07 0.29 0.93 -0.10 0.30 0.90 -0.10 0.30 0.90 Age 36_45 vs. 26_35 -0.58 0.24 0.56* -0.57 0.24 0.57* -0.59 0.24 0.55** -0.59 0.24 0.55** Age 46_64 vs. 26_35 -0.61 0.31 0.54* -0.63 0.32 0.53* -0.66 0.32 0.52* -0.67 0.33 0.51* Dual Diagnosis vs. SMI Only -0.59 0.21 0.55** -0.58 0.21 0.56** -0.58 0.21 0.56** -0.60 0.21 0.55** SSI -0.23 0.26 0.79 -0.28 0.26 0.76 -0.31 0.26 0.73 Medicaid Rate 0.26 0.24 1.30 0.23 0.25 1.26 Outpatient Substance Abuse 0.04 0.39 1.04 Outpatient Mental Health (M) -0.06 0.39 0.94 Outpatient Mental Heath (H) 0.19 0.43 1.21 Note: * p < .05, ** p < .01, *** p < .001 testing differences from 1.0 (no effect) for each predictor variable within each county. The detained sample in these analyses contains only those releases that had a subsequent detention. Releases that did not have a subsequent detention in the one-year follow-up period were excluded from these analyses.
33
This document is a research report submitted to the U.S. Department of Justice. This report has not been published by the Department. Opinions or points of view expressed are those of the author(s)
and do not necessarily reflect the official position or policies of the U.S. Department of Justice.

REFERENCES
Bazelon Center (2001), Finding the Key to Successful Transition from Jail to Community. Washington. DC: Judge David L. Bazelon Center for Mental Health Law.
Beck A, Karberg J (2001). Prison and Jail Inmates at Midyear 2000. Washington, DC: Bureau of Justice Statistics Bulletin, U.S. Department of Justice.
Council of State Governments (2004). Access to Benefits for Offenders with Mental Illness Leaving State Prisons: Sate and Federal Policy Forum. New York: Council of State Governments September 13-14, 2004.
Ditton P (1999). Mental Health and Treatment of Inmates and Probationers. Bureau of Justice Statistics: Special Report; NCJ 174463, U.S. Department of Justice.
Drake RE, Mueser KT, Brunette MF, McHugo GJ (2004). “A review of treatments for people with severe mental illnesses and co-occurring substance use disorders.” Psychiatric Rehabilitation Journal 27(4):360-74.
Haimowitz S (2004). “Slowing the revolving door: Community reentry of offenders with mental illness.” Psychiatric Services 55:373-75.
Lattimore P, Brumbaugh S, Visher C, Lindquist C, Winterfield L, Salas M, Zweig J. (2004). National Portrait of SVORI: Severe and Violent Offender Re-Entry Initiative. Research Triangle Park, NC: RTI International.
Messaro J (2004). Working with People with Mental Illness Involved in the Criminal Justice System: What Mental Health Service Providers Need to Know (2nd. Ed.) Delmar, NY: Technical Assistance and Policy Analysis Center for Jail Diversion.
Morrissey J, Steadman H, Dalton K, Cuellar A, Stiles P, Cuddeback G (2004). Medicaid enrollment and mental health service use by mentally ill persons following jail release. Chapel Hill, NC: Cecil G. Sheps Center for Health Services Research, University of North Carolina at Chapel Hill.
Mueser KT, Torrey WC, Lynde D, Singer P, Drake RE (2003). “Implementing evidence-based practices for people with severe mental illness.” Behavior Modification 27(3):387-411.
Mueser KT, Clark RE, Haines M, Drake RE, McHugo GJ, Bond GR, Essock SM, Becker DR, Wolfe R, Swain K (2004). “The Hartford study of supported employment for persons with severe mental illness.” J Consulting Clinical Psychology 72(3):479-90.
New Freedom Commission on Mental Health (2003). Achieving the Promise: Transforming Mental Health Care in America. Final Report. DHHS Pub. No. SMA-03-3832. Rockville, MD
New Freedom Commission on Mental Health (2004). Subcommittee on Criminal Justice: Background Paper. DHHS Pub. No. 8MA-04-3880.
34
This document is a research report submitted to the U.S. Department of Justice. This report has not been published by the Department. Opinions or points of view expressed are those of the author(s)
and do not necessarily reflect the official position or policies of the U.S. Department of Justice.

Phillips SD, Burns BJ, Edgar ER, Mueser KT, Linkins KW, Rosenheck RA, Drake RE, McDonel Herr EC (2001). “Moving assertive community treatment into standard practice.” Psychiatric Services 52(6):771-9.
Policy Research Associates (2004). TAPA Center for Jail Diversion, A Branch of the National GAINS Center at http://gainscenter.samhsa.gov.
SAS (2004). SAS/STAT® 9.1. Cary, NC: SAS Institute, Inc.
Solomon P, Draine J, Meyerson A (1994). “Jail recidivism and receipt of community mental health services.” Hospital and Community Psychiatry 45:8, August 1994.
Steadman HJ, Morris SM, Dennis DL (1995). “The diversion of mentally ill persons from jails to community-based services: A profile of programs.” American Journal of Public Health 85(12):1630-1635, 1995.
Steadman HJ, Mulvey EP, Monahan J, Robbins PC, Appelbaum PS, Grisso T, Roth LH, Silver E (1998). “Violence by people discharged from acute psychiatric inpatient facilities and by others in the same neighborhoods.” Archives of General Psychiatry 55(5):393-401
Steadman HJ, Deane M.W, Morrissey JP, Westcott ML, Salasin S, Shapiro S (1999). “A SAMHSA research initiative assessing the effectiveness of jail diversion programs for mentally ill persons.” Psychiatric Services 50:1620-1623.
Steadman HJ, Naples M (2004). “Assessing the effectiveness of jail diversion programs for persons with serious mental illness and co-occurring substance use disorders.” Delmar, NY: Policy Research Associates.
Swanson JW, Holzer CE, Ganju VK, et al. (1990). “Violence and psychiatric disorder in the community: Evidence from the Epidemiologic Catchment Area surveys.” Hospital and Community Psychiatry 41:761-770.
Teplin LA (1990). “The prevalence of severe mental disorder among urban male detainees: comparison with the epidemiologic catchment area program.” American Journal of Public Health 80:663-669.
Teplin LA, Abram KM, McClelland GM (1996). “The prevalence of psychiatric disorder among incarcerated women: Pretrial jail detainees.” Archives of General Psychiatry 53:505-512.
Ventura LA, Cassel CA, Jacoby JE, Huang B (1998). “Case management and recidivism of mentally ill persons released from jail.” Psychiatric Services 49:10, October 1998.
Wei LJ, Lin DY, Weissfeld L (1989). “Regression analysis of multivariate incomplete failure time data by modeling marginal distributions.” Journal of the American Statistical Association 84:1065–1073.
35
This document is a research report submitted to the U.S. Department of Justice. This report has not been published by the Department. Opinions or points of view expressed are those of the author(s)
and do not necessarily reflect the official position or policies of the U.S. Department of Justice.