the bangladesh floods of 1984 in historical context
TRANSCRIPT

REPORTS AND COMMENT
The Bangladesh floods of 1984 in historical context
Roger Montgomery *
USAID/APO San Francisco CA 96346 U.S.A.
INTRODUCTION
Three serious floods occurred in rapid succession in Bangladesh during 1984. In some areas flooding occurred on each of the three occasions. However, in other areas, the floods had separate and distinct effects, unfortunately hitting particular rice crops at just the worst time. The May flood affected eastern regions causing flash floods to descend from the Indian hills, running through areas such as Comilla, Feni, Kishoreganj, Tangail, Srimangel, Kulaura and Sylhet. The June-July flood was a combination of excessive rainfall and river flooding affecting mainly areas near the banks of the combined Jamuna-Padma (Brahma- putra-Ganges) such as Faridpur, Jessore, Barisal, Rangpur and Tangail.
The most recent floods of early and mid September hit the major surplus-producing Transplanted Aman growing areas of Rangpur, Dinajpur, Kurigram, Bogra, Pabna, Rajshahi and Dhaka as well as lesser areas (from the viewpoint of T. Aman) such as Sylhet. Kushtia and Tangail.
In rapid succession Bangladesh suffered flood losses to the four rice crops of the year: Boro (harvested in May/June), Aus (harvested in August/September), deep- water long-duration Broadcast Aman (harvested in October/ November) and short season Transplanted Aman (harvested in November/December). Last year (1983) Boro provided 2490 of all rice produced, Aus 2270, Broadcast Aman 10% and Transplanted Aman 44%. The T. Aman crop is the largest single crop of the year.
It is clear that these losses mean serious hardship and deprivation for the farmers and farm laborers who depended upon them for their food supplies in the coming
* The views presented here do not represent the official views of the government of the United States of America, but are strictly the private views of the author.
months and employment opportunities during the growing period. It is not clear however that flood losses always are synonymous with overall loss of a particular crop. Many other factors determine the aggregate size of a crop: total planted area, level of use of yield raising inputs such as fertilizer, High Yielding Varieties (HYV) seed, and so on. For certain crops, (B. Aman in particular) flood losses are highly correlated with overall size of the crop when final estimates are made. But for other crops, flood losses are surpisingly uncorrelated with overall size of the crop. This is because for farms located away from the flood zone, the crop is benefitted by the heavy rain. Overall the aggregate crop production appears to be more influenced by the rains and by the other factors mentioned above.
What follows is a crop by crop discussion of the flood losses of 1984 and an attempt to put these losses into context. For each crop there will be: (a) a discussion of the initial estimates of loss; (b) an historical perspective, comparing this year’s loss with other large losses and a consideration of whether those particular losses meant an overall decrease in production of the crop under consideration for that year; (c) a discussion of overall variability in production of the crop, using a widely employed measure, the standard deviation of estimate from trend line (technically called the Standard Error of Estimate, although not the usual definition of the word “error”); and (d) a discussion of variability in harvested area of the crop and its determinants (relative prices or profitability of alternative crops) and how these relate or disassociate flood losses from overall production losses.
It must be remembered throughout the following discussion that the losses of production to date are real and that farmers and landless laborers in those affected areas have been severely affected. This document should not be viewed as detracting from the magnitude of their loss and the need for concerted efforts to improve the food situation.
1. BORO RICE CROP PRODUCTION, 1984
(a) Initial estimates of flood damage to the Boro crop were that more than 300,000 tons were lost. According to the government’s estimates, 372,869 metric tons were destroy- ed. Methods of estimation were the usual: field teams visited each district and queried knowledgeable agricultural officials regarding the area flooded either partially or entirely. The estimates of areas partially flooded were converted in an equivalent of entirely flooded area. The sum of the area entirely flooded plus equivalent was then multiplied by the expected yield to get an estimate of production lost.
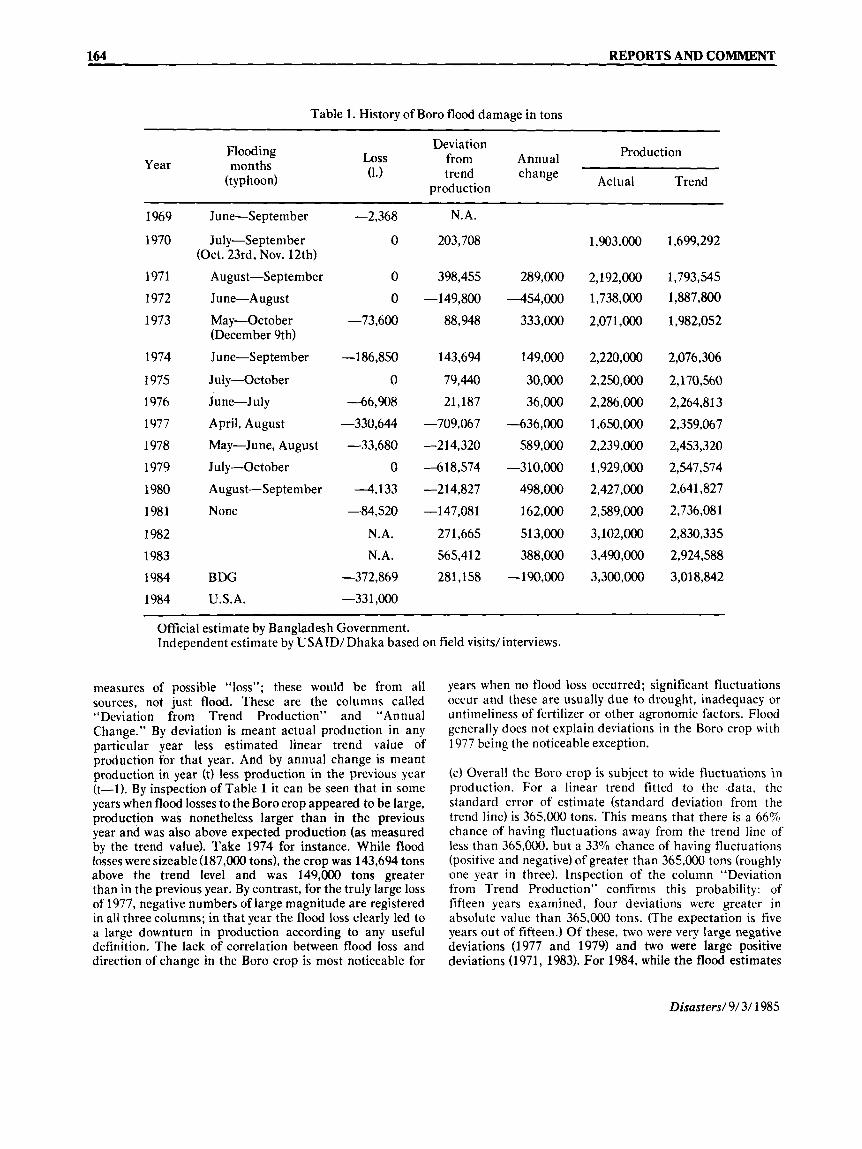
(b) The Boro crop is usually insulated from flood loss as Table 1 shows; only on two occasions in recent history have flood losses exceeded one hundred thousand tons (1974 when 186,850 tons were lost and 1977 when 330,644 tons were destroyed). This is because the Boro crop is an offseason crop which is usually harvested before the possibility of flood damage. Table 1 includes two other
Disasters/ 9/ 3/ 1985 163
164 REPORTS AND COMMENT
Table 1. History of Boro flood damage in tons
Flooding Year months
(typhoon)
Deviation Loss from Annual Production
change Actual Trend (1.) trend production
1969
1970
1971
1972
1973
1974
1975
1976
1977
1978
1979
1980
1981
1982
1983
1984
1984
June-September
July-September (Oct. 23rd, Nov. 12th)
August-September
June-August
May-October (December 9th)
June-September
July-October
June-July
April, August
May-June, August
July-October
August-September
None
BDG
U.S.A.
-2,368
0
0
0
-73,600
-186,850
0
4 6 , 9 0 8
-330,644
-33,680
0
4 , 1 3 3
4 4 , 5 2 0
N.A.
N.A. -372,869
-331 ,000
N.A.
203,708
398,455
-149,800
88,948
143,694
79,440
21,187
-709,067
-214,320
-618,574
-214,827
-147,081
271,665
565,412
281,158
289,000
-454,000
333,000
149,000
30,000
36,000
-636,000
589,000
-310,000
498,000
162,000
513,000
388,000
-190,000
1,903,000
2,192,000 1,738,000
2,071,000
2,220,000
2,250,000
2,286, 000 1,650,000
2,239,000
1,929,000
2,427,000
2,589,000
3,102,000
3,490,000
3,300,000
1,699,292
1,793,545 1,887,800
1,982,052
2,076,306
2,170,560
2,264,813
2,359,067
2,453,320
2,547,574 2,641,827
2,736,081
2,830,335
2,924,588
3,018,842
Official estimate by Bangladesh Government. Independent estimate by USAID/Dhaka based on field visits/interviews.
measures of possible “loss”; these would be from all sources, not just flood. These are the columns called “Deviation from Trend Production” and “Annual Change.” By deviation is meant actual production in any particular year less estimated linear trend value of production for that year. And by annual change is meant production in year (t) less production in the previous year (t-1). By inspection of Table 1 it can be seen that in some years when flood losses to the Boro crop appeared to be large, production was nonetheless larger than in the previous year and was also above expected production (as measured by the trend value). Take 1974 for instance. While flood losses were sizeable (187,000 tons), the crop was 143,694 tons above the trend level and was 149,000 tons greater than in the previous year. By contrast, for the truly large loss of 1977, negative numbers of large magnitude are registered in all three columns; in that year the flood loss clearly led to a large downturn in production according to any useful definition. The lack of correlation between flood loss and direction of change in the Boro crop is most noticeable for
years when no flood loss occurred; significant fluctuations occur and these are usually due to drought, inadequacy or untimeliness of fertilizer or other agronomic factors. Flood generally does not explain deviations in the Boro crop with 1977 being the noticeable exception.
(c) Overall the Boro crop is subject to wide fluctuations in production. For a linear trend fitted to the data, the standard error of estimate (standard deviation from the trend line) is 365,000 tons. This means that there is a 66% chance of having fluctuations away from the trend line of less than 365,000, but a 33% chance of having fluctuations (positive and negative) of greater than 365,000 tons (roughly one year in three). Inspection of the column “Deviation from Trend Production” confirms this probability: of fifteen years examined, four deviations were greater in absolute value than 365,000 tons. (The expectation is five years out of fifteen.) Of these, two were very large negative deviations (1977 and 1979) and two were large positive deviations (1971, 1983). For 1984, while the flood estimates
Disasters/ 9/ 3/ 1985

REPORTS AND COMMENT 165
of both BDG and USAID showed large flood losses, nonetheless the Boro crop for this year was the second highest record production, and the crop was 281,158 tons above the trend of production.
(d) The Boro crop is undergoing rapid expansion of planted and harvested area, but it is growing in a rather smooth way. When harvested area data are fitted to a linear trend, the fit is rather good (r squared = 0.62) and the standard error of estimate is only 258,000 acres (or about 10% of the mean acreage). In the last several years, Boro acreage has accelerated and risen far above trend expectation of acreage: in 1982/1983 the trend expectation was 3,167,000 acres whereas actual harvested area was 3,542,000 acres. And for the recently harvested flood damaged 1984 crop, expected area (according to trend) was 3,243,000 acres whereas in fact harvested area was actually 3,670,000 acres.
2. AUS RICE CROP PRODUCTION, 1984
(a) Unlike the Boro crop, Aus rice appears to be affected by flood almost every year. Flood losses of the Aus crop are
also among the most difficult to link with aggregate production. Moreover, the Aus crop is the most stagnant in terms of area and production, with wide fluctuations away from the trend line in both cases. Initial estimates of Aus flood losses this year were 475,100 tons, but this may be revised downwards when final figures are available. Nonetheless, the loss was substantial.
(b) Table 2 puts this estimate of loss into perspective. Twice in recent years flood losses have been of the same order of magnitude as the 1984 estimates of Aus flood loss: in 1974 an estimated 613,000 tons were destroyed, and in 1976, 351,400 tons were lost. Also in several other years flood destroyed more than 100,000 tons: in 1970 194,000 tons and in 1973 almost 200,000 tons were lost to floods. Inspection of Table 2 leads to some startling findings however. In 1970 despite severe flood losses, production was 168,000 tons above the trend. In 1973 when flood losses reached 200,000 tons, the Aus crop was 529,000 tons larger than in the previous year. In the disastrous loss of 1974, production was still higher than in the previous year. And in 1976, production was still above the trend expectation. There seems to be literally no sensible correlation between
Table 2. History of Aus flood damage in tons
Flooding
(typhoon) Year months
Productio- Deviation Loss from Annual 'I1 _ _ _ _
Actual Trend (1.) trend change production
1969
1970
1971
1972 1973
1974 1975
1976
1977
1978 1979
1980 1981 1982 1983 1984 1984
June-September
July-Septem ber (23rd Oct., 12th Nov.)
August-September
June-August
May-October (9th December)
June-September
July-October
June-July
April, August
May-June, August July-October August-September
None
BDG U.S.A.
-33,143 -194,278
-55,864 -73,395
-199,590
-613,040 4 7 , 6 2 3
-351,390
-18,403
-65,157 -13,504 -29,732 -53,700
N.A. N.A.
4 7 5 , 1 0 5
-308,000
276,675
168,207
-395,261
-504,729 -1 7,196
-1,664
327,868 67,400
118,932 261,464
-259,004 127,529 67,061
-1 74,407 -62,875
N.A.
-67,000
-522,000
-68,000
529,000
57,000 371,000
-219,000
93,000
184,000 -479,000
428,000 -19,000
-200,000 153,000
2,930,000
2,863,000
2,341,000
2,273,000 2,802,000
2,859,000 3,230,000
3,011,000
3,104,000 3,288,000 2,809, 000 3,237,000 3,218,000 3,018,000 3,171,000
2,653,325
2,694,793
2,736,261 2,777,729
2,819,196
2,860,664 2,902,132
2,943,600
2,985,068
3,026,536 3,068,004 3,109,471 3,150,939 3,192,407 3,233,875
Disasters/ 9/3/ 1985
166 REPORTS AND COMMENT
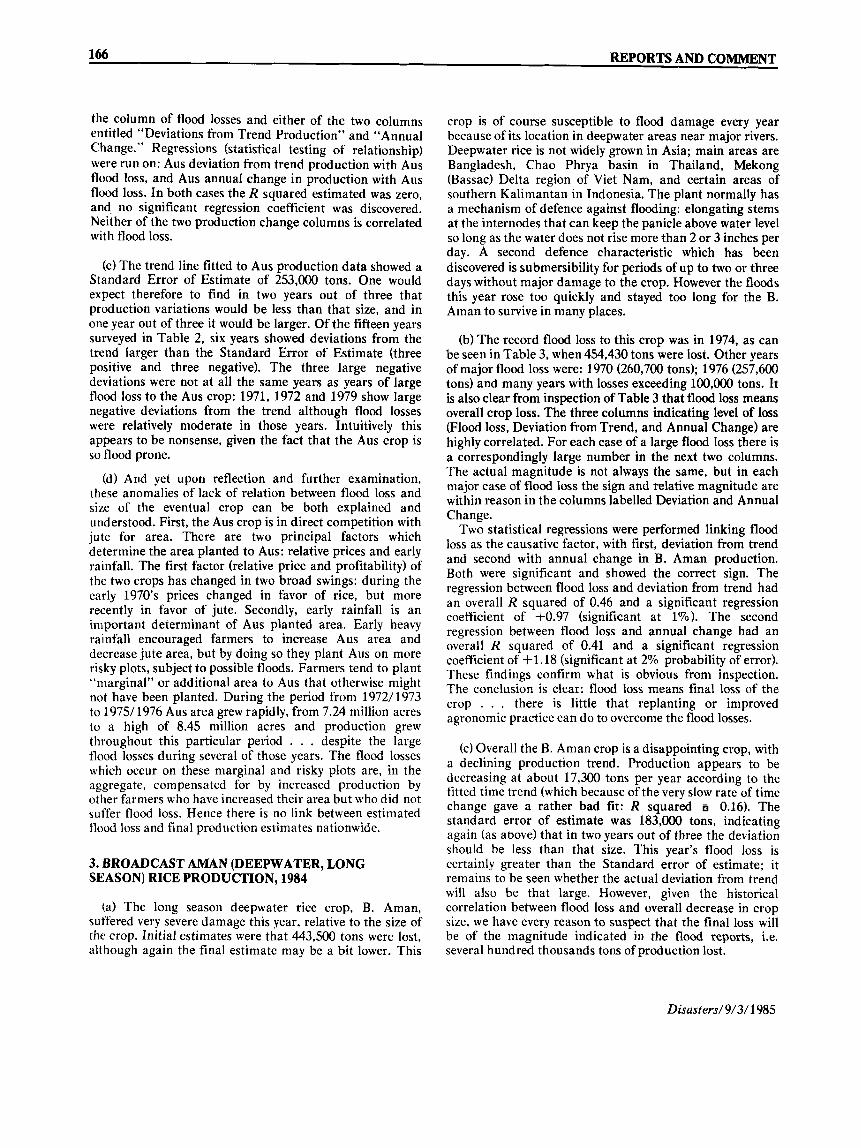
the column of flood losses and either of the two columns entitled “Deviations from Trend Production” and “Annual Change.” Regressions (statistical testing of relationship) were run on: Aus deviation from trend production with Aus flood loss, and Aus annual change in production with Aus flood loss. In both cases the R squared estimated was zero, and, no significant regression coefficient was discovered. Neither of the two production change columns is correlated with flood loss.
(c) The trend line fitted to Aus production data showed a Standard Error of Estimate of 253,000 tons. One would expect therefore to find in two years out of three that production variations would be less than that size, and in one year out of three it would be larger. Of the fifteen years surveyed in Table 2, six years showed deviations from the trend larger than the Standard Error of Estimate (three positive and three negative). The three large negative deviations were not at all the same years as years of large flood loss to the Aus crop: 1971, 1972 and 1979 show large negative deviations from the trend although flood losses were relatively moderate in those years. Intuitively this appears to be nonsense, given the fact that the Aus crop is so flood prone.
(d) And yet upon reflection and further examination, these anomalies of lack of relation between flood loss and size of the eventual crop can be both explained and understood. First, the Aus crop is in direct competition with jute for area. There are two principal factors which determine the area planted to Aus: relative prices and early rainfall. The first factor (relative price and profitability) of the two crops has changed in two broad swings: during the early 1970’s prices changed in favor of rice, but more recently in favor of jute. Secondly, early rainfall is an important determinant of Aus planted area. Early heavy rainfall encouraged farmers to increase Aus area and decrease jute area, but by doing so they plant Aus on more risky plots, subject to possible floods. Farmers tend to plant “marginal” or additional area to Aus that otherwise might not have been planted. During the period from 1972/1973 to 1 9 7 3 1976 Aus area grew rapidly, from 7.24 million acres to a high of 8.45 million acres and production grew throughout this particular period . . . despite the large flood losses during several of those years. The flood losses which occur on these marginal and risky plots are, in the aggregate, compensated for by increased production by other farmers who have increased their area but who did not suffer flood loss. Hence there is no link between estimated flood loss and final production estimates nationwide.
3. BROADCAST AMAN (DEEPWATER, LONG SEASON) RICE PRODUCTION, 1984
(a) The long season deepwater rice crop, B. Aman, suffered very severe damage this year, relative to the size of the crop. Initial estimates were that 443,500 tons were lost, although again the final estimate may be a bit lower. This
crop is of course susceptible to flood damage every year because of its location in deepwater areas near major rivers. Deepwater rice is not widely grown in Asia; main areas are Bangladesh, Chao Phrya basin in Thailand, Mekong (Bassac) Delta region of Wet Nam, and certain areas of southern Kalimantan in Indonesia. The plant normally has a mechanism of defence against flooding: elongating stems at the internodes that can keep the panicle above water level so long as the water does not rise more than 2 or 3 inches per day. A second defence characteristic which has been discovered is submersibility for periods of up to two or three days without major damage to the crop. However the floods this year rose too quickly and stayed too long for the B. Aman to survive in many places.
(b) The record flood loss to this crop was in 1974, as can be seen in Table 3, when 454,430 tons were lost. Other years of major flood loss were: 1970 (260,700 tons); 1976 (257,600 tons) and many years with losses exceeding 100,OOO tons. It is also clear from inspection of Table 3 that flood loss means overall crop loss. The three columns indicating level of loss (Flood loss, Deviation from Trend, and Annual Change) are highly correlated. For each case of a large flood loss there is a correspondingly large number in the next two columns. The actual magnitude is not always the same, but in each major case of flood loss the sign and relative magnitude are within reason in the columns labelled Deviation and Annual Change.
Two statistical regressions were performed linking flood loss as the causative factor, with first, deviation from trend and second with annual change in B. Aman production. Both were significant and showed the correct sign. The regression between flood loss and deviation from trend had an overall R squared of 0.46 and a significant regression coefficient of +0.97 (significant at 170). The second regression between flood loss and annual change had an overall R squared of 0.41 and a significant regression coefficient of +l. 18 (significant at 2% probability of error). These findings confirm what is obvious from inspection. The conclusion is clear: flood loss means final loss of the crop . . . there is little that replanting or improved agronomic practice can do to overcome the flood losses.
(c) Overall the B. Aman crop is a disappointing crop, with a declining production trend. Production appears to be decreasing at about 17,300 tons per year according to the fitted time trend (which because of the very slow rate of time change gave a rather bad fit: R squared 0.16). The standard error of estimate was 183,000 tons, indicating again (as above) that in two years out of three the deviation should be less than that size. This year’s flood loss is certainly greater than the Standard error of estimate; it remains to be seen whether the actual deviation from trend will also be that large. However, given the historical correlation between flood loss and overall decrease in crop size, we have every reason to suspect that the final loss will be of the magnitude indicated in the flood reports, i.e. several hundred thousands tons of production lost.
Disasters/9/3/1985

REPORTS AND COMMENT 167
Table 3. History of Broadcast Aman flood damage in tons
Deviation Production Flooding Loss from Annual (1.) trend change
(typhoon) production Trend Actual
Year months
1969 1970
1971 1972 1973
1974 1975
1976 1977 1978 1979 1980 1981 1982
1983 1984
1984
June-September -74,530 July-September -260,716
August-September -1 98,043 (23rd Oct., 12th Nov.)
June-August -162,320
May-October -176,395 (9th December)
June-September -454,430 July-October -15,435
June-July -257,574 April, August -12,364 May-June, August -26,532 July-October -13,982
August-September -1 36,642 None -20,675
N.A.
N.A.
BDG 4 4 3 , 5 0 0 U.S.A. -3 75,700
439,458
-75,245
-1 83,949 -131,652 -41,356
-345,060
171,237 -27,467
11 1,830 95,126
-78,577 -36,281
29,015 41,312
31,608
N.A.
-532,000
-126,000 35,000 73,000
-321,000
499,000 -216,000
122,000 -34,000
-191 ,000
25,000 48,000
-5,000 -27,000 N.A.
2,165,000
1,633,000
1,507,000 1,542,000 1,615,000
1,294,000
1,793,000 1,577,000 1,699,000 1,665,000 1,474,000
1,499,000 1,547,000 1,542,000
1,515,000 N.A.
1,725,542
1,708,245
1,690,949
1,673,652 1,656,356
1,639,060 1,621,763
1,604,467 1,587,170 1,569,874 1,552,577 1,535,281 131 7,985
1,500,688
1,483,392 1,448,799
(d) Little useful information could be derived by examining fluctuations in planted or harvested area. There are few trade-offs at the margin; almost no crop can be substituted for deepwater B. Aman because of the nature of the water depth expected and tolerated. We will pass instead directly to consideration of the Transplanted Aman crop.
4. TRANSPLANTED AMAN RICE CROP, 1984
(a) Early estimates of both flood loss and production are still very tentative. Initial indications are that between 450,000 and 850,000 tons were lost. To put these numbers into context, they may be compared with the trend expectation of production, which was 6,384,500 tons. The loss is therefore between 6 and 12% of what might have been produced. These early estimates are now being revised as new information is developed, on the enormity of the damage done by extremely heavy rains in mid-September.
I n many regions of Bangladesh, September monthly rainfall records were broken: Rangpur received 237% of normal (72 cni instead of 31 cm); Tangail 231% of normal
(49 cni compared with 21 cm); Dhaka got 217% of normal (51 cni as against 24 cm); and in Sylhet an enormous two day rain caused the monthly total to reach 121 cm (about 4 ft of rain) as contrasted with the monthly norm of 65 cm. The rain during a one and a half day period (16/17th September) in Sylhet was 26 in.
(b) Never have flood damages been so severe to the Transplanted Aman crop as in 1984. In the past, the major damage which has occurred has been typhoon (hurricane) damage, not flood. The disastrous typhoons of 12th/ 13th November 1970 and 9th December 1973 were true destroyers. The 1970 typhoon caused the total combined flood/typhoon loss of T. Aman crop to be as large as 848.000 tons, and the 1973 typhoon led to a combined flood/typhoon loss of 400,000 tons. However, by itself, flood damage during the normal May-September monsoon season has never resulted in a loss greater than 210,000 tons (in 1970. the flood T. Aman loss was 207,779 tons).
Even during the most memorable flood year of the recent era, 1974, when there were successive flood losses to the Boro, Aus and B. Anian crops, damage done to the T.
Disasters/9/3/ 1985

168 REPORTS AND COMMENT
Aman crop was relatively light by comparison; only 78,930 tons of T. Aman were lost while damage to the other three crops had been in the range of 200,000 to 600,000 tons each.
In contrast to the data presented for B. Aman, where flood loss usually meant overall loss to the crop, in the case of T. Aman, large flood losses seem (in many cases but not all) to be related to increased T. Aman production, certainly a surprising result. The reason is that while some farmers with fields in lower lying areas suffer, the increased rainfall benefits farmers with plots in slightly higher elevations. In Bangladesh even a few feet can mean “high” or “low” fields.
Inspection of Table 4 shows the following: in 1973 despite flood and typhoon losses the T. Aman crop was still much above trend, and much greater than in the previous year; also in 1%9 and 1980 despite large flood losses, production was above the trend, and in the latter case, greater than T. Aman production the previous year. In fact, for once a corollary seems to present itself: years with very little flood loss are often (but not always) bad years for T. Aman. Examples of this would be 1971,1972,1978 and 1981. Flood losses were small in each of those years, and yet the crop was below trend expectation and/or the previous year’s crop.
The years 1978 and 1981 are known to have been drought years during critical growing stages of the T. Aman crop and this is reflected in the data.
A testable hypothesis might be: Years of high flood loss result in above average production. The test of this hypothesis is again a set of regressions between (causative factor) flood loss and (dependent variables) deviation from trend or annual change. These regressions were performed. One produced results giving the correct sign, but the fit was not terribly significant, while the other produced more inconclusive results. In the first case (deviation from trend regressed on flood loss) the regression coefficient was -3.4 (significant only at the 20% level) and with an overall low R squared (0.16). The second regression (between flood loss and annual change produced results of no significance (unacceptably low R squared, insignificant coefficient). The hypothesis cannot really be accepted because of the low level of significance of the results; this reaffirms what is generally known; that there are indeed many agronomic factors other than rainfall which determine final levels of production.
Therefore, to put this year’s T. Aman flood loss into context one can safely surmise the following: (i) it is generally drought years, not flood years, that cause major
Table 4. History of Transplanted Aman flood damage in tons
Flooding Year months
(typhoon)
Deviation Productio,, Loss from Annual change trend
production
- Actual Trend ..-1
1969 1970
1971
1972 1973
1974 1975 1976 1977 1978 1979 1980 1981 1982 1983 1984 1984
June-September
Jul y-September (23rd Oct., 12th Nov)
August-September
June-August
May-October (9th December)
June-September
July-October
June-July
April, August May-June, August July-October
August-September None
BDG U.S.A.
-108,101 -207,779 (-848,023)
-31,137 -8,725
-128,075 (-400,465) -107,290
-9,662 -5,979
-45,112 -5,766
-32,996 -1 14,547
0 N.A.
N.A.
-855,000 4 4 9 , 7 0 0
572,517 -69,233
-295,983 -574,733
328,517
-185,233 225,017 166,267 424,517
-1,335,233 258,017 632,267
-293,483 -36,233
183,017 N.A.
N.A.
-506,000
-91,000 -143,000
1,039,000
-378,000 546,000 77,000
394,000 -1,624,000
1,729,000 510,000
-790,000 393,000 355,000 N.A.
4,785,000
4,279,000
4,188,000 4,045,000
5,084,000
4,706,000 5,252,000 5,329,000 5,723,000 4,099,000 5,828,000 6,338,000 5,548,000 5,941,000 6,2%,000
N.A.
4,212,483 4,348,233
4,483,983 4,619,733
4,755,483
4,891,233 5,026,983 5,162,733 5,298,483 5,434,233 5,569,983 5,705,733 5,841,483 5,977,233 6,112,983 6,384,483
Disasters/ 9/3/ 1985
REPORTS AND COMMENT 169
negative deviations in final production of T. Aman - there is a good chance that other regions benefitted from the heavy rains; (ii) seldom has flood damage ever been terribly severe to the T. Aman crop, and yet (iii) if the flood damage is as large as some have estimated for 1984, it is an unprecedented event, one which examination of the historical record does little to explain, in terms of the likely final impact on total production of T. Aman.
(c) turning to overall variability of the T. Aman crop, the standard error of estimate is 520,454 tons, i.e. a chance of only one in three of having a deviation from the trend larger than that size. Of fifteen years’ data, only fodr have exceeded this number in absolute terms: (i) 1969, plus 572,517 tons; (ii) 1972, minus 574,733 tons; (iii) 1978, minus 1,335,233 tons; and (iv) 1980, plus 632,267 tons. The two years of extraordinary crop shortfall (large negative deviation from trend), 1972 and 1978 were not years of flood, but of drought.
(d) Variation in planted/harvested area was not investigated separately for B. and T. Aman. However aggregate Aman area was investigated and found to have been much more variable during the early 1970’s than in later periods. Very wide swings in Aman area occurred in 1969/1970, 1971/1972 and 1974/1975, but since 1976, Aman area has grown very smoothly at about 63,600 acres per year with little deviation from the trend.
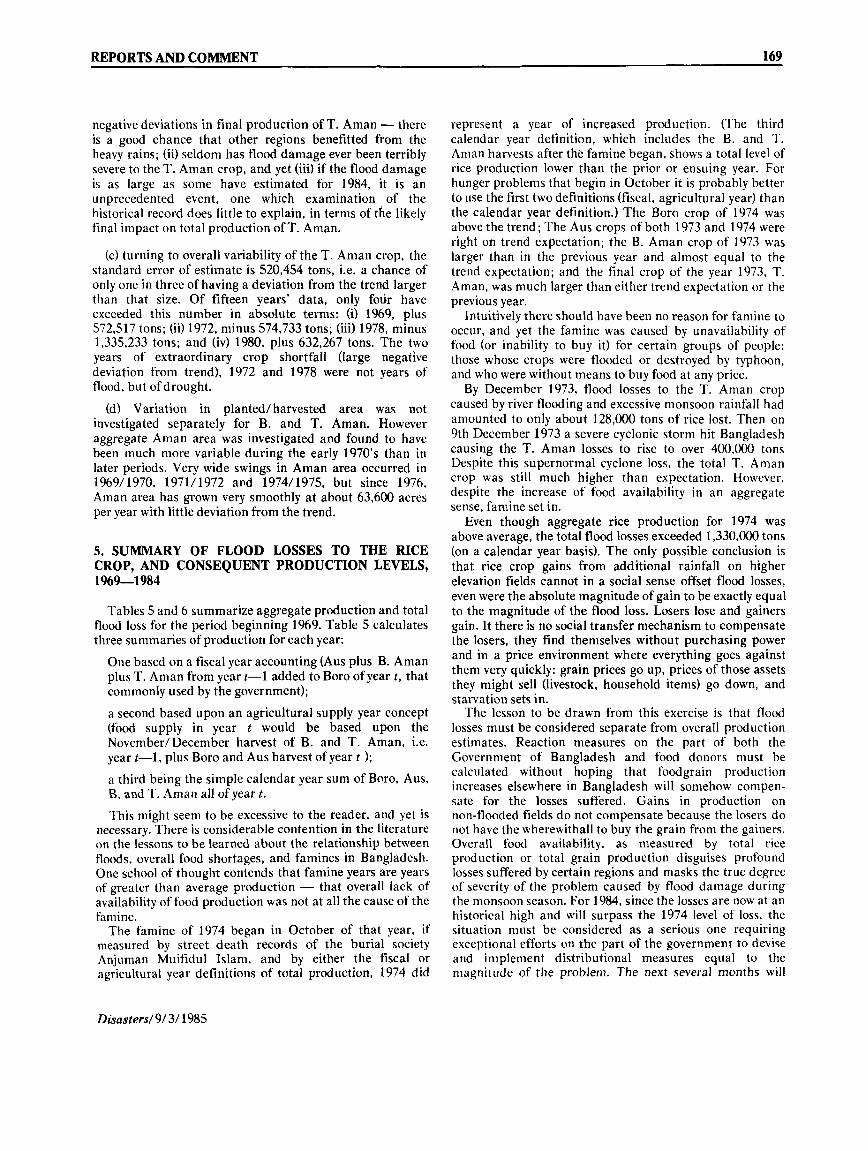
5. SUMMARY OF FLOOD LOSSES TO THE RICE CROP, AND CONSEQUENT PRODUCTION LEVELS, 1969-1984
Tables 5 and 6 summarize aggregate production and total flood loss for the period beginning 1969. Table 5 calculates three summaries of production for each year:
One based on a fiscal year accounting (Aus plus B. Aman plus T. Aman from year t-1 added to Boro of year t , that commonly used by the government);
a second based upon an agricultural supply year concept (food supply in year t would be based upon the November/December harvest of B. and T. Aman, i.e. year t-1, plus Boro and Aus harvest of year t 1; a third being the simple calendar year sum of Boro, Aus, B. and T. Aman all of year t .
This might seem to be excessive to the reader, and yet is necessary. There is considerable contention in the literature on the lessons to be learned about the relationship between floods, overall food shortages, and famines in Bangladesh. One school of thought contends that famine years are years of greater than average production - that overall lack of availability of food production was not at all the cause of the famine.
The famine of 1974 began in October of that year, if measured by street death records of the burial society Anjuman Muifidul Islam, and by either the fiscal or agricultural year definitions of total production, 1974 did
represent a year of increased production. (The third calendar year definition, which includes the B. and T. Aman harvests after the famine began, shows a total level of rice production lower than the prior or ensuing year. For hunger problems that begin in October it is probably better to use the first two definitions (fiscal, agricultural year) than the calendar year definition.) The Boro crop of 1974 was above the trend; The Aus crops of both 1973 and 1974 were right on trend expectation; the B. Aman crop of 1973 was larger than in the previous year and almost equal to the trend expectation; and the final crop of the year 1973, T. Aman, was much larger than either trend expectation or the previous year.
Intuitively there should have been no reason for famine to occur, and yet the famine was caused by unavailability of food (or inability to buy it) for certain groups of people: those whose crops were flooded or destroyed by typhoon, and who were without means to buy food at any price.
By December 1973, flood losses to the T. Aman crop caused by river flooding and excessive monsoon rainfall had amounted to only about 128,000 tons of rice lost. Then on 9th December 1973 a severe cyclonic storm hit Bangladesh causing the T. Aman losses to rise to over 400,000 tons Despite this supernormal cyclone loss, the total T. Aman crop was still much higher than expectation. However, despite the increase of food availability in an aggregate sense, famine set in.
Even though aggregate rice production for 1974 was above average, the total flood losses exceeded 1,330,000 tons (on a calendar year basis). The only possible conclusion is that rice crop gains from additional rainfall on higher elevation fields cannot in a social sense offset flood losses, even were the absolute magnitude of gain to be exactly equal to the magnitude of the flood loss. Losers lose and gainers gain. It there is no social transfer mechanism to compensate the losers, they find themselves without purchasing power and in a price environment where everything goes against them very quickly: grain prices go up, prices of those assets they might sell (livestock, household items) go down, and starvation sets in.
The lesson to be drawn from this exercise is that flood losses must be considered separate from overall production estimates. Reaction measures on the part of both the Government of Bangladesh and food donors must be calculated without hoping that foodgrain production increases elsewhere in Bangladesh will somehow compen- sate for the losses suffered. Gains in production on non-flooded fields do not compensate because the losers do not have the wherewithall to buy the grain from the gainers. Overall food availability, as measured by total rice production or total grain production disguises profound losses suffered by certain regions and masks the true degree of severity of the problem caused by flood damage during the monsoon season. For 1984, since the losses are now at an historical high and will surpass the 1974 level of loss, the situation must be considered as a serious one requiring exceptional efforts on the part of the government to devise and implement distributional measures equal to the magnitude of the problem. The next several months will
Disasters/ 9/ 3/ 1985

Tab
le 5.
His
tory
of r
ice
crop
pro
duct
ion
in B
angl
ades
h, in
tons
Ann
ual p
rodu
ctio
n, b
y de
fini
tion
Floo
ding
Pr
oduc
tion,
by
seas
on
(typh
oon)
B
oro
Aus
B
. Am
an
T. A
man
ye
ar
year
ye
ar
Yea
r m
onth
s Fi
scal
A
gric
ultu
ral
Cal
enda
r
1969
1970
J une
-Sep
t em
ber
July
-Sep
tem
ber
(Oct
ober
, Nov
embe
r)
Aug
ust-S
epte
mbe
r
June
-Aug
ust
May
-Oct
ober
(9
th D
ecem
ber)
June
-Sep
tem
ber
(24th N
ovem
ber)
Ju
ly-O
ctob
er
J u ne
-J ul
y
Apr
il. A
ugus
t
May
-Jun
e, A
ugus
t
July
-Oct
ober
A
ugus
t-Sep
teni
be
r N
one
2,930,000
2,863,000
2,165,000
1,633,000
4,785,000
4,279,000
N.A
.
10,678,000
1,903,000
11,783,000
11,716,000
1971
I972
1973
2,192,000
1,738,000
2,071 ,000
2,341,000
2,273,000
2,802,000
1,507,000
1,542,000
1,615,000
4,188,000
4,045,000
5,084,000
10,967,000
9,774,000
9,931 ,000
10,445,000
9,706,000
10,460,000
10,228,000
9,598, 000
11,572,oOO
1974
0
1975
1976
1977
1978
1979
I980
1981
1982
1983
1984
CI 4
2,220,000
2,859,000
1,294,000
4,706,000
11,721 ,000
11,778,000
1 1,079,000
2,250,000
2,286,000
1,650,000
2,239,000
1,929,000
2,427,000
2,589,000
3,102,000
3,490,000
3,300,000
3,230,000
3,011 ,000
3,104,000
3,288,000
2,809,000
3,237,000
3,218,000
3,018,000
3,171 ,000
N.A
.
1,793,000
1,577,000
1,699,000
1,665,000
1,474,000
1,499,000
1,547,000
1,542,000
1,515,000
N.A.
5,252,000
5,329,000
5,723,000
4,099,000
5,828,000
6,338,000
5,548,000
5,941,000
6,296,000
N.A
.
1 1,109,OOo
12,561 ,000
1 1,567,OOo
12,765,000
10,981,000
12,538,000
13,663,000
13,415,000
13,991 ,000
14,282,000
11,480,000
12,342,000
11,660,OOO
12,949,000
10,502,000
12,966,000
1 3,644 ,000
13,215,000
14,144,000
N.A
.
12,52S,OOO
1 2,203, 000
12,176,000
1 1,291 ,000
12,040,000
13,501,000
12,902,000
13,603,000
14,472,000
N.A
.
b
n a*
w
Not
e: F
isca
l yea
r pro
duct
ion,
for y
ear t
= A
us (t-l),
B. a
nd T
. Am
an (t-l),
plus
Bor
o (t
).
Agr
icul
tura
l yea
r pro
duct
ion,
for y
ear t
= B
. and
T. A
man
(t-1)
plus
Aus
, Bor
o (t
) C
alen
dar y
ear p
rodu
ctio
n, fo
r yea
r t =
sum
of B
oro,
Aus
, B. A
man
, T. A
man
.
- 9 \ e Y 8z C
cn

REPORTS AND COMMENT 171
Table 6. Total flood loss during monsoon season, by year, in tons
Total
loss T. Aman four season Boro Aus B. Aman
1969 1970
1971
1972 1974
1974
1975 1976 1977
1978 1979
1980 1981 1982 1983 1984
1984
June-September
July-September (October, November)
August-September
June-August
May-October (9th December)
June-September
July-October
Ju ne-July
April, August
May-June, August
July-October
August-September
None
B.D.G.
U.S.A.
-2,368
0
0
0
-73,600
-186,850
0
-66,908 -330,644
-33,680 0
4 , 1 3 3 -84,520
N.A. N.A.
-372,869
-331 ,000
-33,143 -194,278
-55,864 -73,395
-199,590
-6 13,040
-67,623
-351,390 -18,403 -65,154 -13,504 -29,732
-53,700
N.A.
N.A.
-475,105
-308,000
-74,530
-260,716
-198,043 -162,320
-176,395
454,430
-15,435
-257,574 -12,364 -26,532 -13,982
-136,642
-20,675 N.A.
N.A.
-443,500
-375,700
-1 08,101 -207,779 (-848,023)
-31,137
-8,725
(-400,465) -128,075
-107,290
-9,662
-5,979 4 5 , 1 1 2
-5,766 -32,996
-1 14,547
0 N.A.
N.A.
-855,Ooo
4 4 9 , 7 0 0
-2 18,142
-662,773
-285,044 -244,440
-577,660
-1,361,610
-92,720 -681,851 4 0 6 , 5 2 3 -1 31,132
-60,482 -285,054
-158,895
-2,146,474
-1,464,400
allow us to see to what extent the challenge can be met. Famine can, should and must be averted. Gains in Aman rice crop production of the crop to be harvested during the next two months can only partially offset and moderate the severity of the problem.
POSTSCRLPT
This report was completed by late January 1985, and the author departed from Bangladesh in March. As of the time of departure there were no signs of famine. The government’s response to the widespread flooding was the necessary one: first assure adequate reserves by appealing to the international donor community for additional grants of grain and by direct international purchases on a timely basis. The U.S. government provided two supplemental allocations within a short period of time, the first for three million dollars and the second for seventeen million dollars’ worth of grain. These supplemental Title I11 allocations allowed for the purchase of more than 200,000 tons of wheat and rice. Also the U.S. stepped up the timetable for its regular Title 111 allocation so that the necessary documents
were signed and orders placed for 1985 grain shipments to Bangladesh in the first week of the fiscal year. The World Food program responded quickly with a very large additional grant of grain also. The Canadian government undertook early programming of its next year’s grain commitment to permit the grain to arrive in Bangladesh at the first possible moment.
However, the most important step the government undertook was to make a very dramatic direct purchase from Thailand. As early as June 1984 it was clear to the then Food Minister, Retired Air Vice Marshal A.G. Mahmood and his secretary, Mohammed Ali that donor responses would be too slow given the nature of clearances/ authorizations from home offices and the competition for grain by African countries facing severe drought. Therefore the Minister and the Secretary flew to Burma and Thailand and bought, in the space of less than one week, almost half a million tons of rice (30,000 from Burma, 425,000 from Thailand). The cost to the government can be estimated at approximately one quarter of a billion U.S. dollars (cash and short term credits). While the burden is onerous it demonstrates a point that food policy planners have been making repeatedly. It is not possible to hold domestic food
Disasters/9/3/ 1985

172 REPORTS AND COMMENT
Table 7. Rainfall, September 1984, monsoon season 1984, compared to 1974 (all rainfall information is in mm. 25.4mm = 1 in.)
Excess Excess Sept. monsoon
84/ 74 Sept. Sept. Excess Monsoon Monsoon Sept. Monsoon 84/74 Monsoon
1974 (%) ( 7 0 1 1974
Station normal 1984 (in%) average 1984
Dinajpur
Rangpur
Bogra
Pabna
Rajsh'i
Jessore
Khulna
Barisal
Kushtia My'Sing
Dhaka
Faridpr
Ja ni a1 pr
Tangail
Sylhet
Coniilla
C'Gong
Average
299
305 275
235
221
188 223 312
200 34 1
236
245
253 21 1 655 337 306
285
469
746 366
3 23
304 183
134 195
352 319 523
3 10 414
488 1.205
256 119
394
57
145 33
37
38 -3
-40 -38
76 -6
122
27
64 131
84 -24
- 6 1
38
N.A.
1,461 1,184
N.A.
995 1,046
1,170 1,385 N.A.
1,504 1,255
1,125 N.A. N.A. 1,417 1,523
2,669
1,395
N.A.
2,470 1,400
N.A.
1,118
1,029 1,531
1,577 N.A. 1,175
2,224
1,573 N.A.
N.A. 2,822 1,695 2,578
1,766
69
18
12 -2
31 14
-22 77
40
99 11
-3
27
N.A.
490 132
227 262
323
577 36 1
N.A. N.A.
226 N.A. N.A. N.A.
479
437 372
353
N.A.
2,135
1,240 985
1,408 1,236
2,101 1,510 N.A. N.A.
1,552
1,434 N.A. N.A.
3,560
1,966 3,136
1,736
52
177 42
16 -43 -77
- 4 6
131
152 -41 - 6 8
12
16
13
-21
-17 -27
4
43
10
-21 -14
-18
2
Average rainfall from 1st June until 20th September (the monsoon season). Rainfall from 1st June 1984 until 20th September 1984.
stocks against any level of emergency. . . there will always exist some levels of severity of loss (events that occur with low probability) in anticipation of which it is not cost effective to hold food stocks and manage them successfully. In such emergencies, the prudent policy is also to hold cash (and good will of donors) and undertake external procurement in a timely fashion. What is needed of course is sufficient liquid balances (difficult for Bangladesh) and to have an early warning system in place which will allow sufficient lead time for procurement, shipping, offloading and internal distribution within Bangladesh.
In 1984, the government of Bangladesh did have sufficient early warning and did procure, ship and
distribute in time. This combined with domestically held stocks (which never fell below the danger level of 500,OOO tons) allowed the government to channel this additional grain through already existing programmes, albeit at vastly increased levels: additional Food for Work, Vulnerable Group Feeding Programs, Gratuitous Relief and the most important, Open Market Sales of grain in a success€ul effort to put a lid on prices and discourage speculatory hoarding. All of these the government did in 1984, in stark contrast to 1974. The best evidence that these measures worked is that while Western newspapers were filled with dramatic photographs of starving women and children in 1984 . . . they were in Ethiopia and Sudan, not Bangladesh.
Disasters/ 9/3/ 1985