the basic goal: to create stock-holder value/shareholders wealth agency relationships:...
TRANSCRIPT
The basic goal: to create stock-holder value/shareholders wealth
Agency relationships:1. Stockholders versus managers2. Stockholders versus creditors
CHAPTER 1An Overview of Financial Management

What is an agency relationship?
An agency relationship arises whenever one or more individuals, called principals,
(1) hires another individual or organization, called an agent, to perform some service and
(2) then delegates decision-making authority to that agent.
If you are the only employee, and only your money is invested in the business, would any agencyproblems exist?
No… agency problem would exist. whenever the manager of a firm owns less than 100 percent of the firm’s common stock, or the firm borrows. You own 100 percent of the firm.
If you needed additional capital to buy computer inventory or to develop software, might that lead to agency problems?
Acquiring outside capital could lead to agency problems.
Would it matter if the new capital came in the form of an unsecured bank loan, a bank loan secured by your inventory of computers, or from new stockholders?
Agency problems are less for secured than for unsecured debt, and different between stockholders and creditors.
There are 2 potential agency conflicts:
Conflicts between stockholders and managers.
Conflicts between stockholders and creditors.

Would potential agency problems increase or decrease if you expanded operations to other campuses?
Increase. You could not physically be at all locations at the same time. Consequently, you would have to delegate decision-making authority to others.
If you were a bank lending officer looking at the situation, what actions might make a loan feasible?
Creditors can protect themselves by
(1) having the loan secured and
(2) placing restrictive covenants in debt agreements. They can also charge a higher than normal interest rate to compensate for risk.
As the founder-owner-president of the company, what actions might mitigate your agency problems if you expanded beyond your home campus?
1. Structuring compensation packages to attract and retain able managers whose interests are aligned with yours.
(More…)
2. Threat of firing.
3. Increase “monitoring” costs by making frequent visits to “off campus” locations.
Would going public in an IPO increase or decrease agency problems?
By going public through an IPO, your firm would bring in new shareholders. This would:increase agency problems, especially if you sell most of your stock and buy a yacht.You could minimize potential agency problems by staying on as CEO and running the company.
Why might you want to (1) inflate your reported earnings or (2) use off balance sheet financing to make your financial position look stronger?
A manager might inflate a firm's reported earnings or make its debt appear to be lower if he or she wanted the firm to look good temporarily. For example just prior to exercising stock options or raising more debt.
(More…)
If the firm is publicly traded, the stock price will probably drop once it is revealed that fraud has taken place. If private, banks may be unwilling to lend to it, and investors may be unwilling to invest more money.
What are the potential consequences of inflating earnings or hiding debt?
“Reasonable” annual salary to meet living expenses
Cash (or stock) bonus Options to buy stock or actual shares of
stock to reward long-term performance Tie bonus/options to EVA
What kind of compensation program might you use to minimize agency problems?
Is it easy for someone with technical skills and no understanding of financial management to move higher and higher in management?
No. Investors are forcing managers to focus on value maximization. Successful firms (those who maximize shareholder value) will not continue to promote individuals who lack an understanding of financial management.

Why might someone interviewing for an entry level job have a better shot at getting a good job if he or she had a good grasp of financial management?
Managers want to hire people who can make decisions with the broader goal of corporate value maximization in mind because investors are forcing top managers to focus on value maximization.
(More…)
Balance sheet Income statement Statement of cash flows Personal taxes Corporate taxes
CHAPTER 3Accounting for Financial Management
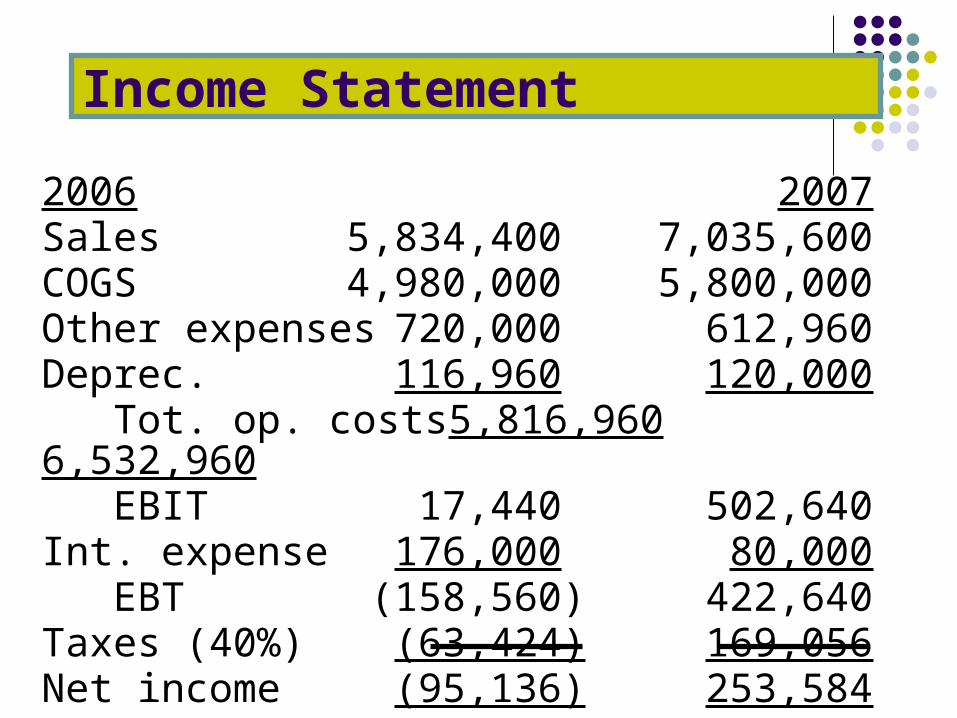
Income Statement 2006 2007Sales 5,834,400 7,035,600COGS 4,980,000 5,800,000Other expenses 720,000 612,960Deprec. 116,960 120,000 Tot. op. costs 5,816,960 6,532,960 EBIT 17,440 502,640Int. expense 176,000 80,000 EBT (158,560) 422,640Taxes (40%) (63,424) 169,056Net income (95,136) 253,584
What happened to sales and net income?
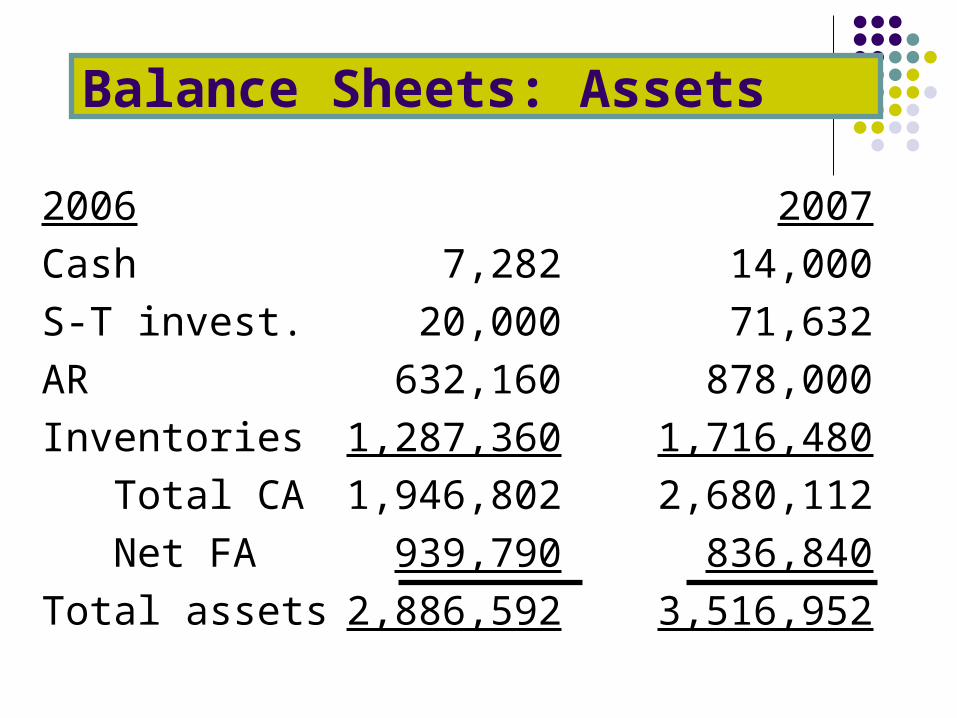
Balance Sheets: Assets 2006 2007
Cash 7,282 14,000
S-T invest. 20,000 71,632
AR 632,160 878,000
Inventories 1,287,360 1,716,480
Total CA 1,946,802 2,680,112
Net FA 939,790 836,840
Total assets 2,886,592 3,516,952
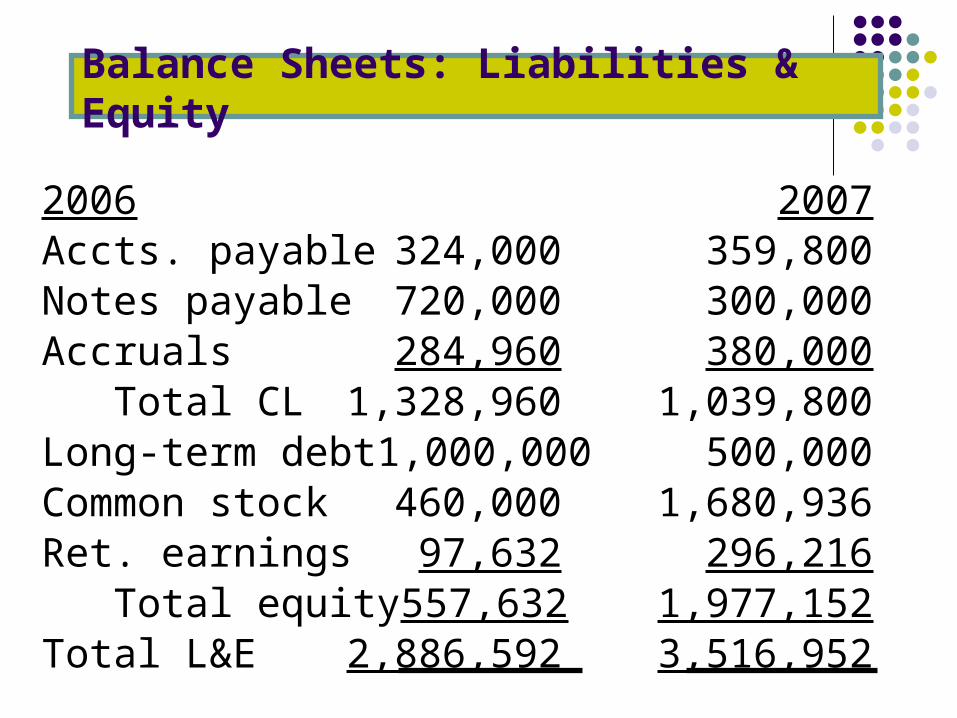
Balance Sheets: Liabilities & Equity
2006 2007Accts. payable 324,000 359,800Notes payable 720,000 300,000Accruals 284,960 380,000 Total CL 1,328,960 1,039,800Long-term debt 1,000,000 500,000Common stock 460,000 1,680,936Ret. earnings 97,632 296,216 Total equity 557,632 1,977,152Total L&E 2,886,592 3,516,952
1. What effect did the expansion have on the asset section of the balance sheet?
2. What effect did the expansion have on liabilities & equity?

Statement of Retained Earnings: 2007
Balance of ret. earnings,
12/31/2002 203,768
Add: Net income, 2003 (95,136)
Less: Dividends paid, 2003(11,000)
Balance of ret. earnings,
12/31/2003 97,632
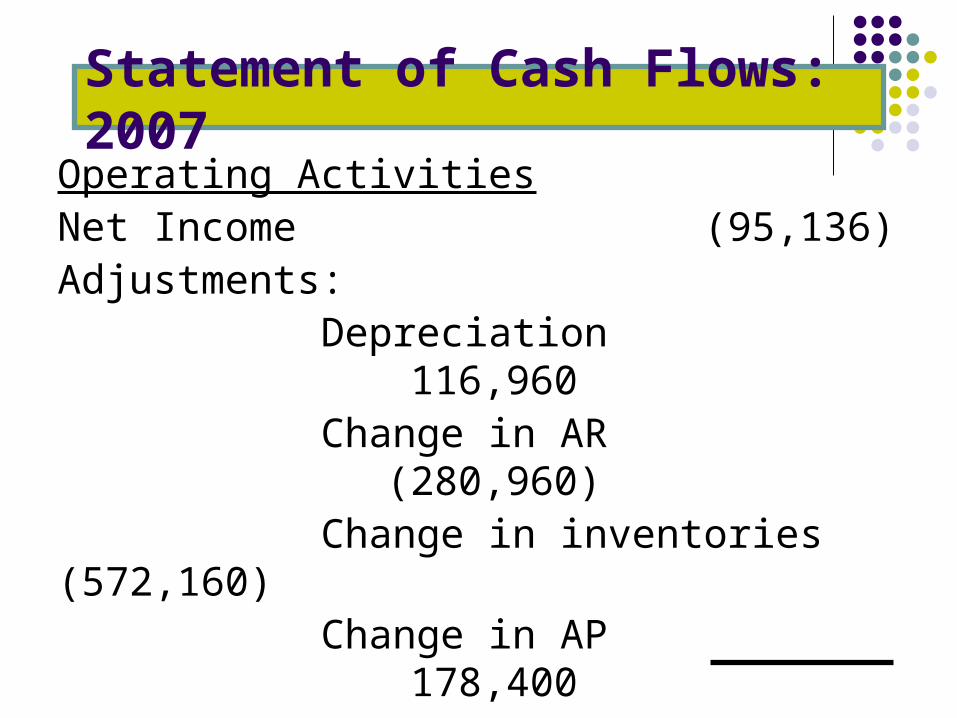
Statement of Cash Flows: 2007Operating ActivitiesNet Income (95,136)Adjustments: Depreciation 116,960 Change in AR (280,960) Change in inventories(572,160) Change in AP 178,400 Change in accruals 148,960 Net cash provided by ops. (503,936)
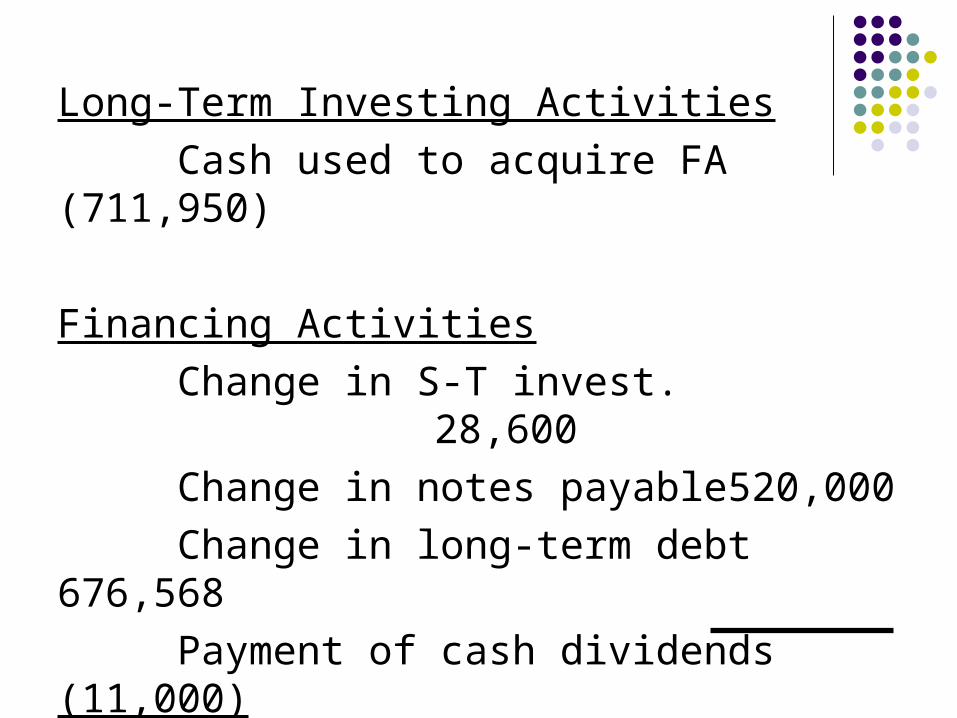
Long-Term Investing Activities
Cash used to acquire FA(711,950)
Financing Activities
Change in S-T invest. 28,600
Change in notes payable520,000
Change in long-term debt676,568
Payment of cash dividends(11,000)
Net cash provided by fin. act.1,214,168
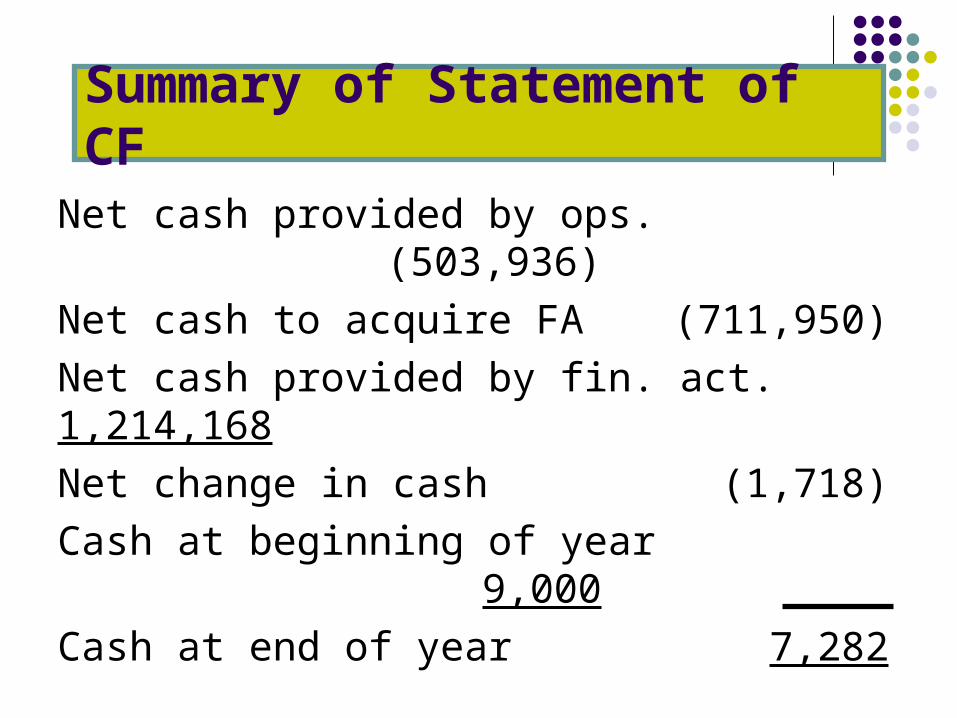
Summary of Statement of CF
Net cash provided by ops. (503,936)
Net cash to acquire FA (711,950)
Net cash provided by fin. act.1,214,168
Net change in cash (1,718)
Cash at beginning of year 9,000
Cash at end of year 7,282
What can you conclude from the statement of cash flows?
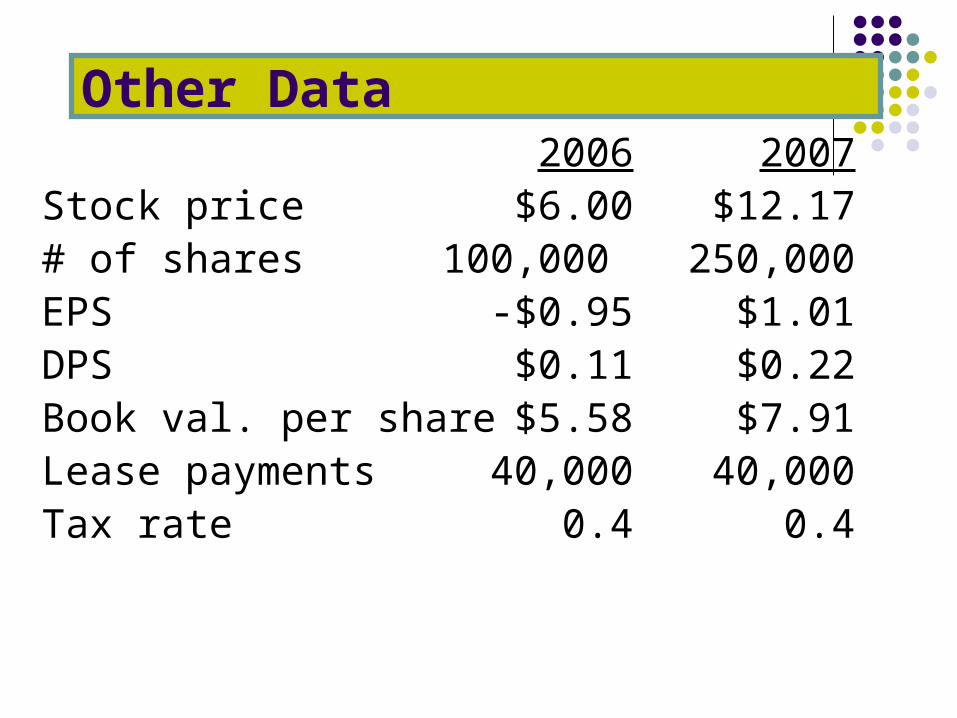
Other Data2006 2007
Stock price $6.00 $12.17# of shares 100,000 250,000EPS -$0.95 $1.01DPS $0.11 $0.22Book val. per share $5.58 $7.91Lease payments 40,000 40,000Tax rate 0.4 0.4
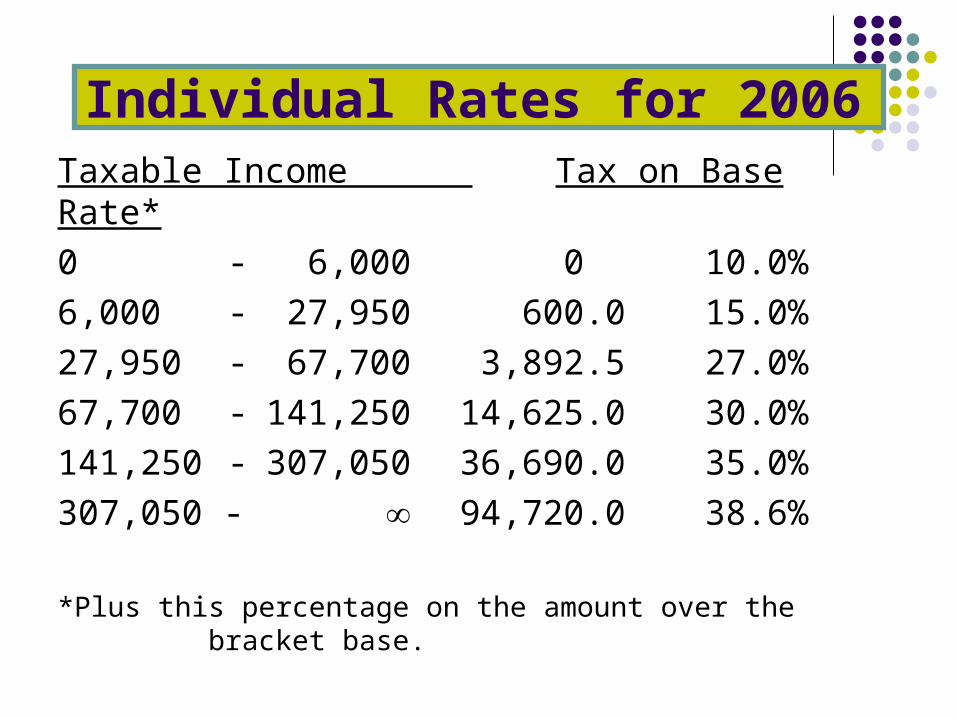
Individual Rates for 2006Taxable Income Tax on Base Rate*
0 - 6,000 0 10.0%
6,000 - 27,950 600.0 15.0%
27,950 - 67,700 3,892.5 27.0%
67,700 - 141,250 14,625.0 30.0%
141,250 - 307,050 36,690.0 35.0%
307,050 - 94,720.0 38.6%
*Plus this percentage on the amount over the bracket base.
Ratio analysis
Du Pont system
Effects of improving ratios
Limitations of ratio analysis
Qualitative factors
CHAPTER 13 Analysis of Financial Statements
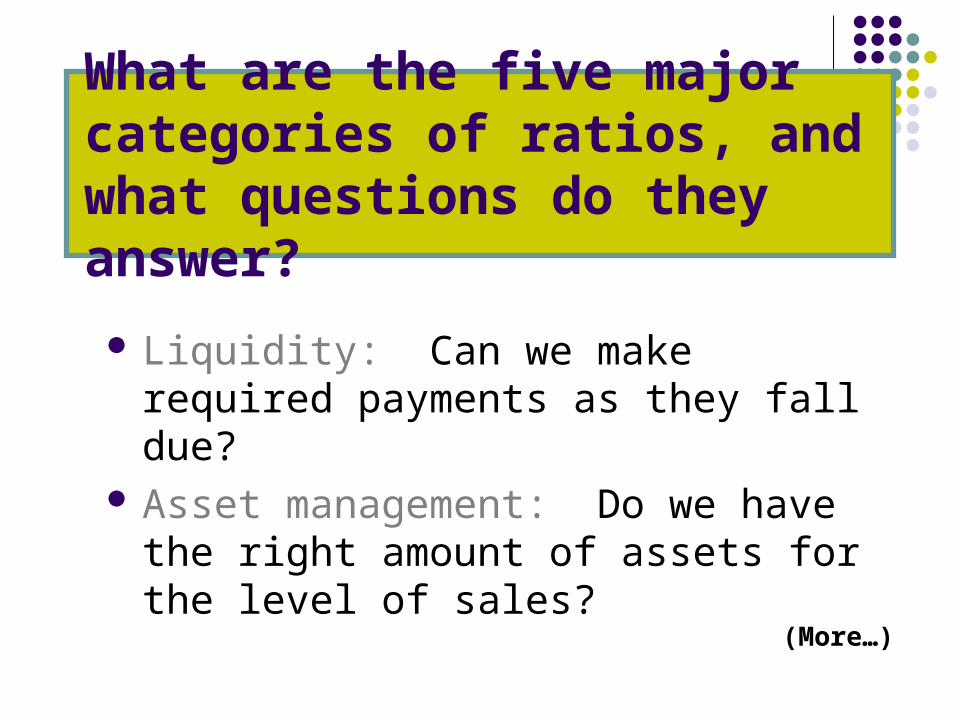
Liquidity: Can we make required payments as they fall due?
Asset management: Do we have the right amount of assets for the level of sales?
What are the five major categories of ratios, and what questions do they answer?
(More…)
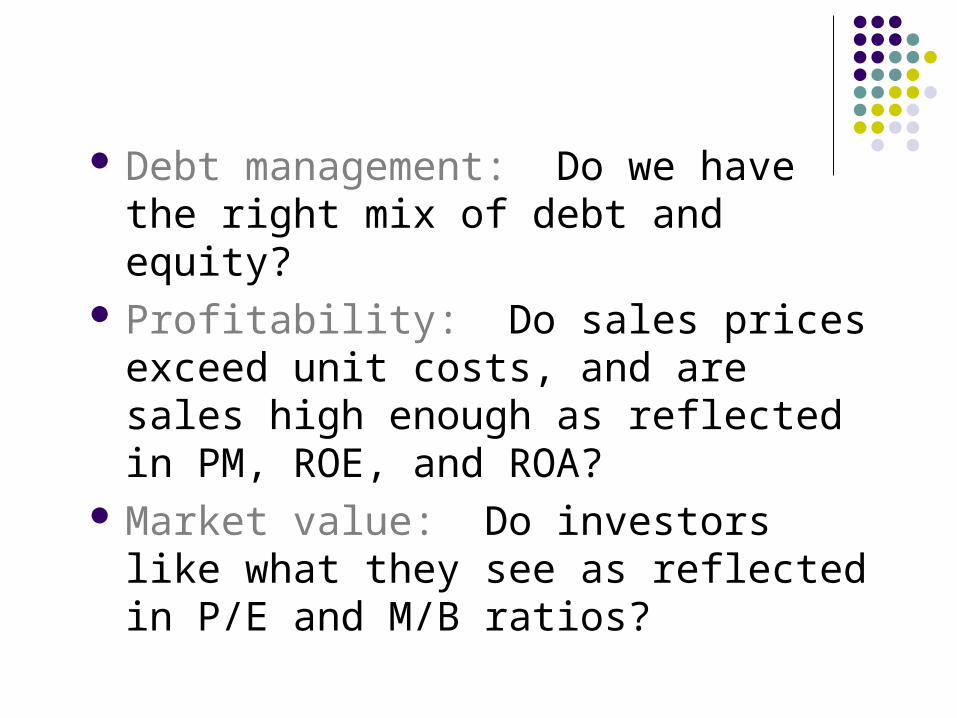
Debt management: Do we have the right mix of debt and equity?
Profitability: Do sales prices exceed unit costs, and are sales high enough as reflected in PM, ROE, and ROA?
Market value: Do investors like what they see as reflected in P/E and M/B ratios?
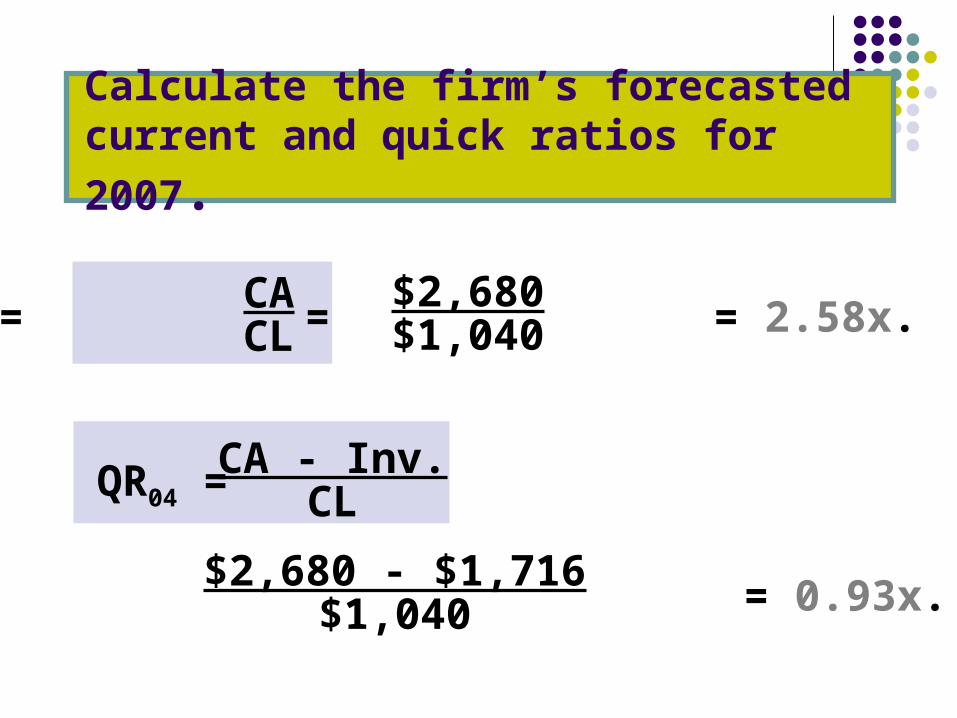
Calculate the firm’s forecasted current
and quick ratios for 2007.
CR04 = = = 2.58x.
QR04 =
= = 0.93x.
CACL
$2,680$1,040
$2,680 - $1,716$1,040
CA - Inv.CL
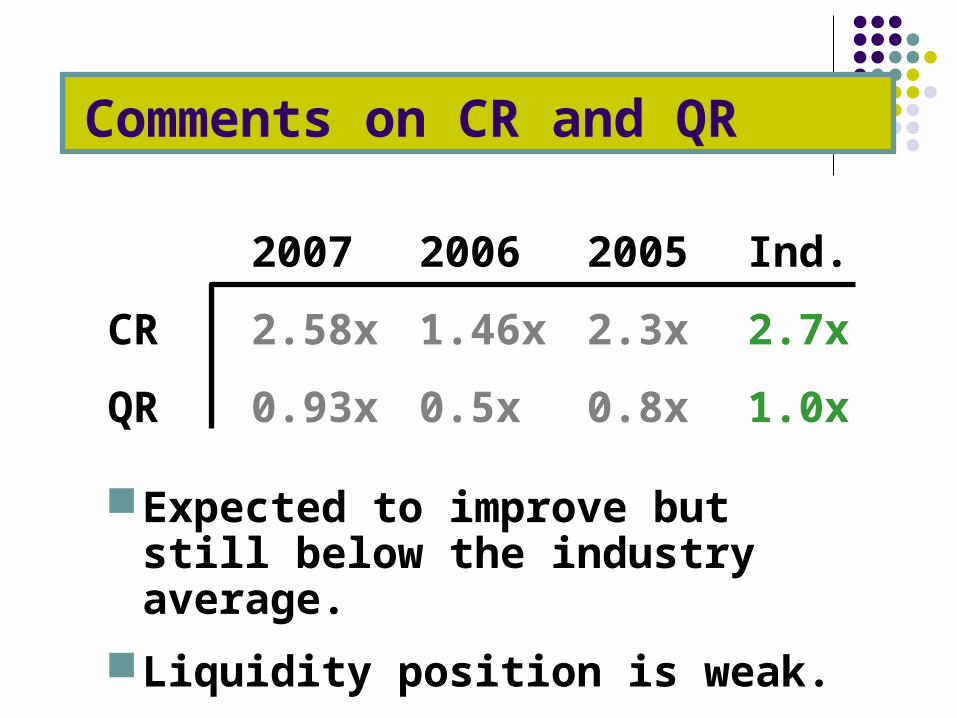
Expected to improve but still below the industry average.
Liquidity position is weak.
Comments on CR and QR
2007 2006 2005 Ind.
CR 2.58x 1.46x 2.3x 2.7x
QR 0.93x 0.5x 0.8x 1.0x
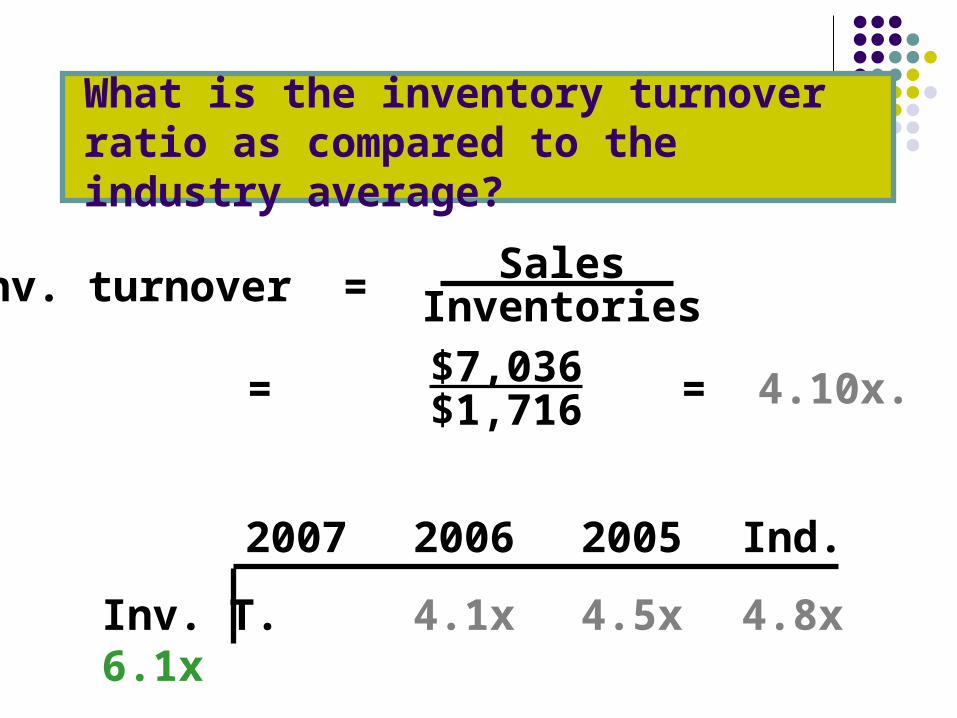
What is the inventory turnover ratio as compared to the industry average?
Inv. turnover =
= = 4.10x.
SalesInventories
$7,036$1,716
2007 2006 2005 Ind.
Inv. T. 4.1x 4.5x 4.8x 6.1x
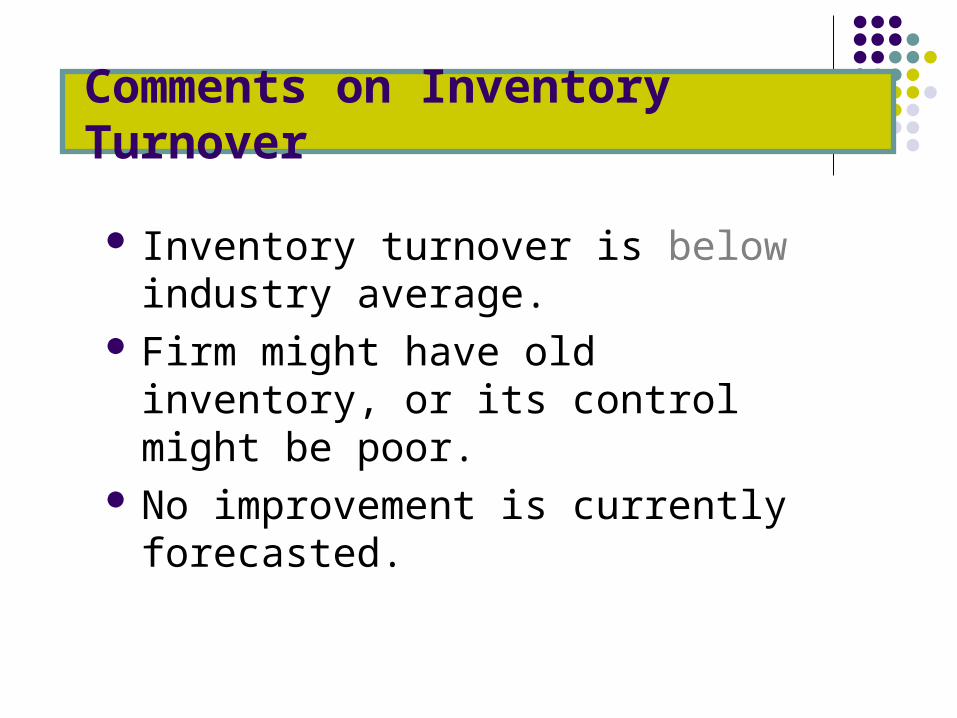
Inventory turnover is below industry average.
Firm might have old inventory, or its control might be poor.
No improvement is currently forecasted.
Comments on Inventory Turnover
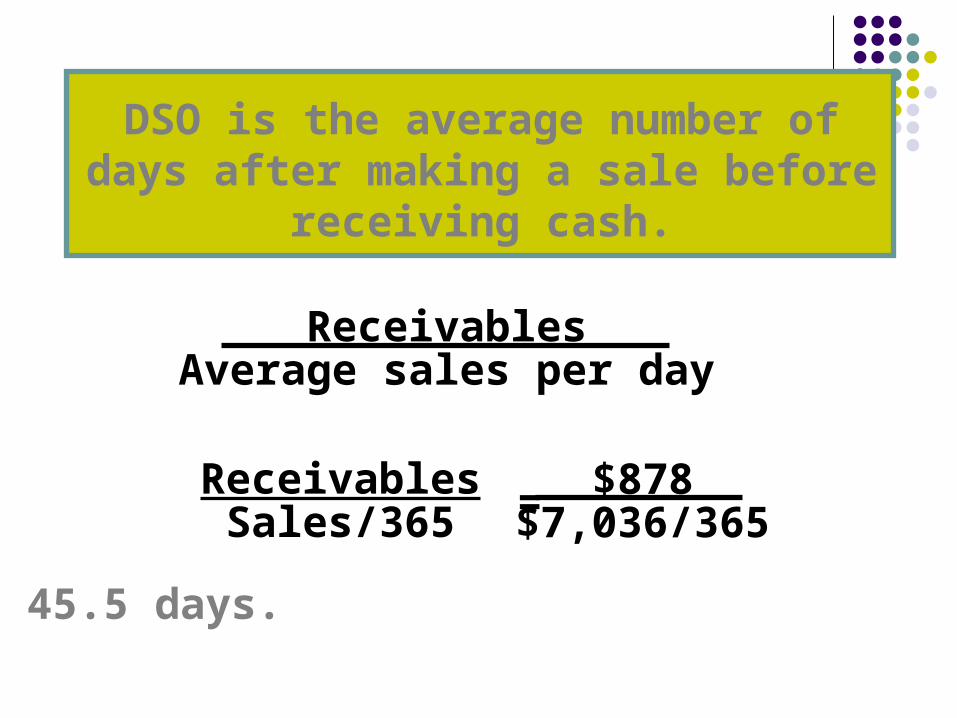
ReceivablesAverage sales per day
DSO is the average number of days after making a sale before receiving
cash.
DSO =
= =
= 45.5 days.
ReceivablesSales/365
$878$7,036/365
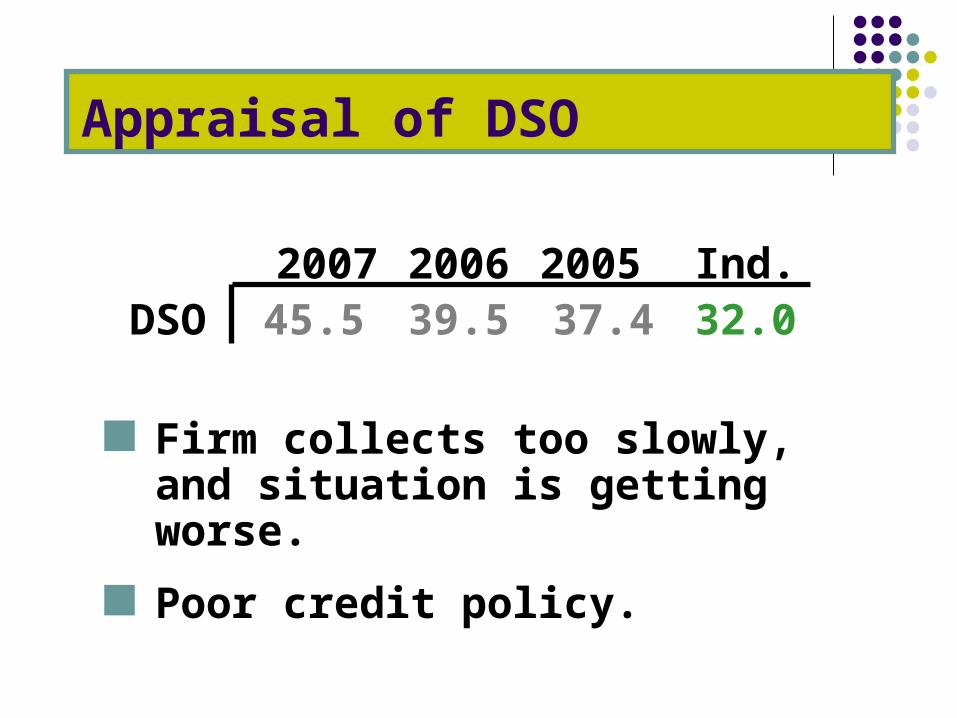
Appraisal of DSO
Firm collects too slowly, and situation is getting worse.
Poor credit policy.
2007 2006 2005 Ind.DSO 45.5 39.5 37.4 32.0
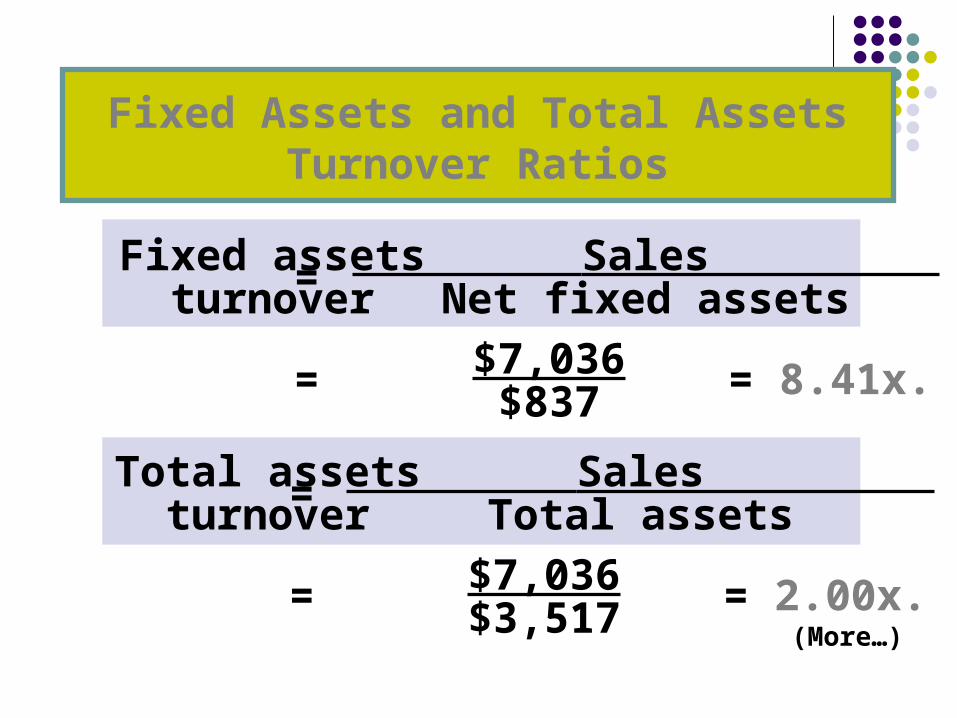
Fixed Assets and Total AssetsTurnover Ratios
Fixed assetsturnover
Sales Net fixed assets=
= = 8.41x.$7,036$837
Total assetsturnover
Sales Total assets=
= = 2.00x.$7,036$3,517 (More…)
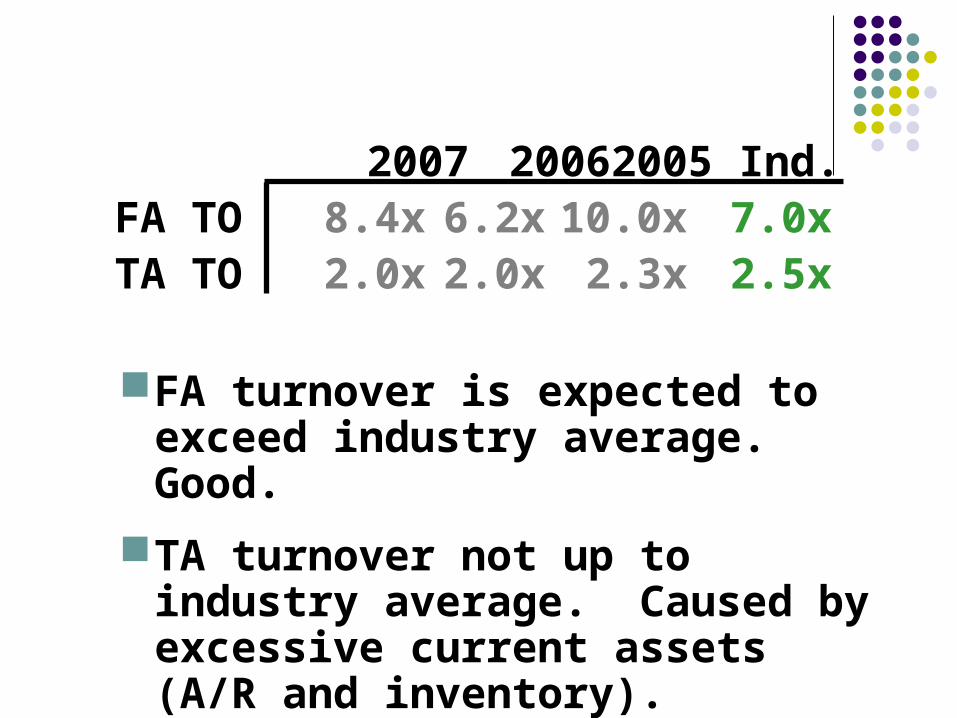
FA turnover is expected to exceed industry average. Good.
TA turnover not up to industry average. Caused by excessive current assets (A/R and inventory).
2007 20062005 Ind.FA TO 8.4x 6.2x 10.0x 7.0xTA TO 2.0x 2.0x 2.3x 2.5x
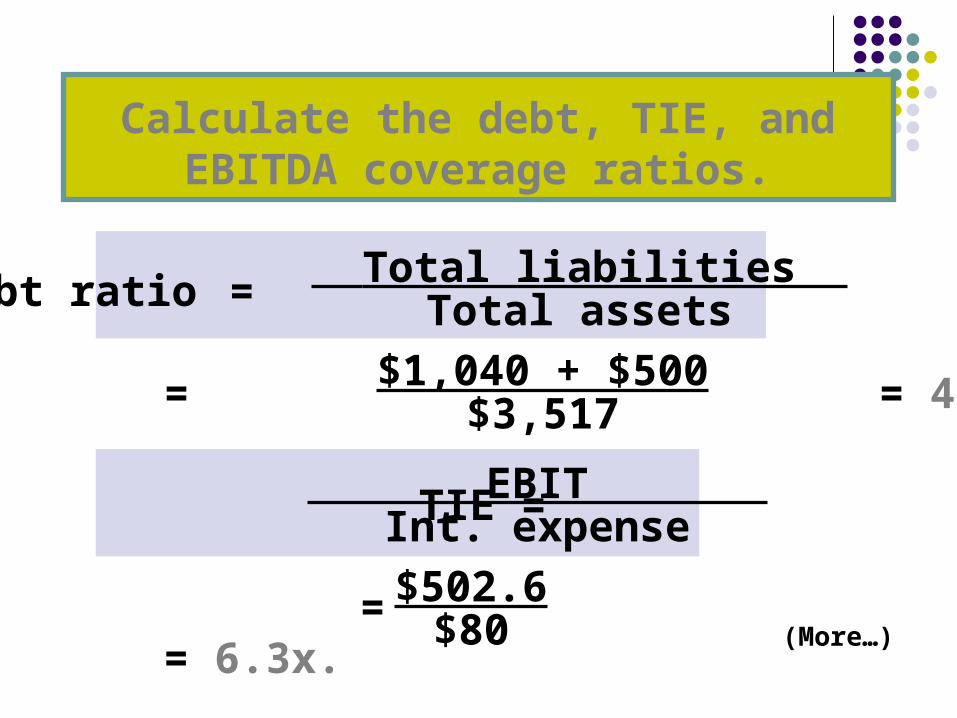
Total liabilities Total assetsDebt ratio =
= = 43.8%.$1,040 + $500$3,517
EBIT Int. expense TIE =
= = 6.3x.$502.6$80
Calculate the debt, TIE, and EBITDA coverage ratios.
(More…)
All three ratios reflect use of debt, but focus on different aspects.
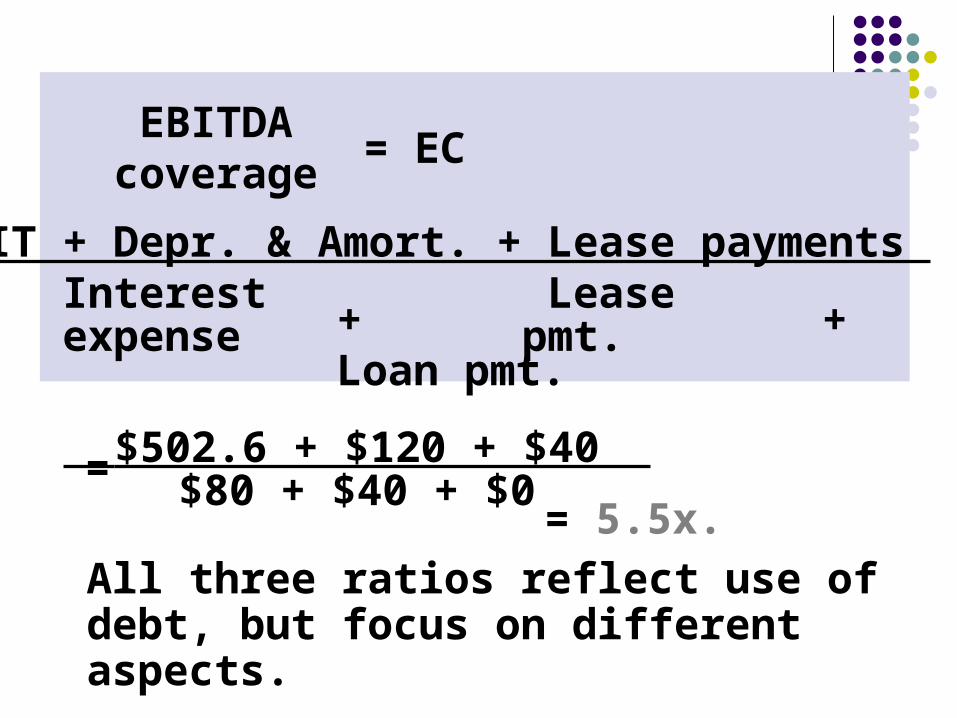
EBITDAcoverage
= EC
= = 5.5x.
EBIT + Depr. & Amort. + Lease payments Interest Lease expense pmt. + + Loan pmt.
$502.6 + $120 + $40 $80 + $40 + $0
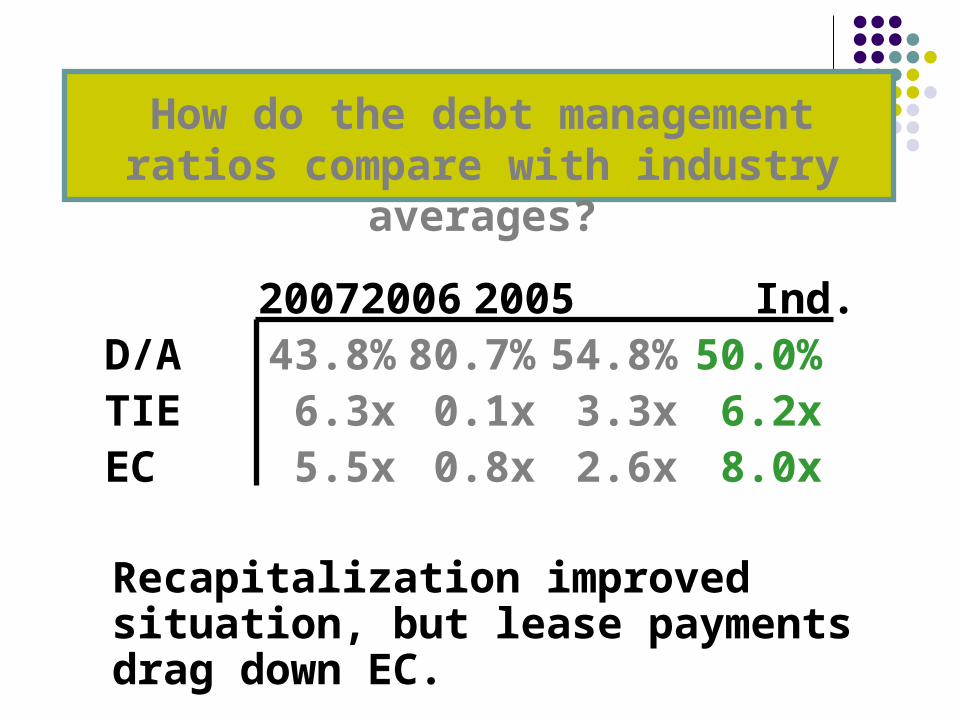
Recapitalization improved situation, but lease payments drag down EC.
How do the debt management ratios compare with industry averages?
2007 2006 2005 Ind.D/A 43.8% 80.7% 54.8% 50.0%TIE 6.3x 0.1x 3.3x 6.2xEC 5.5x 0.8x 2.6x 8.0x
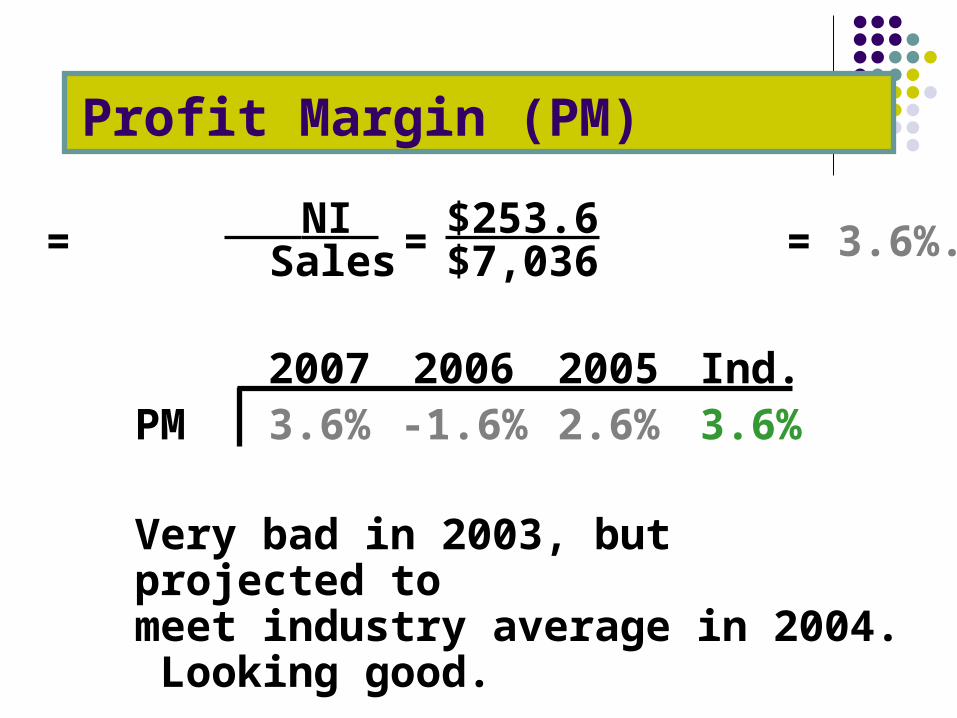
Very bad in 2003, but projected to meet industry average in 2004. Looking good.
Profit Margin (PM)
2007 2006 2005 Ind.PM 3.6% -1.6% 2.6% 3.6%
PM = = = 3.6%. NI Sales
$253.6$7,036
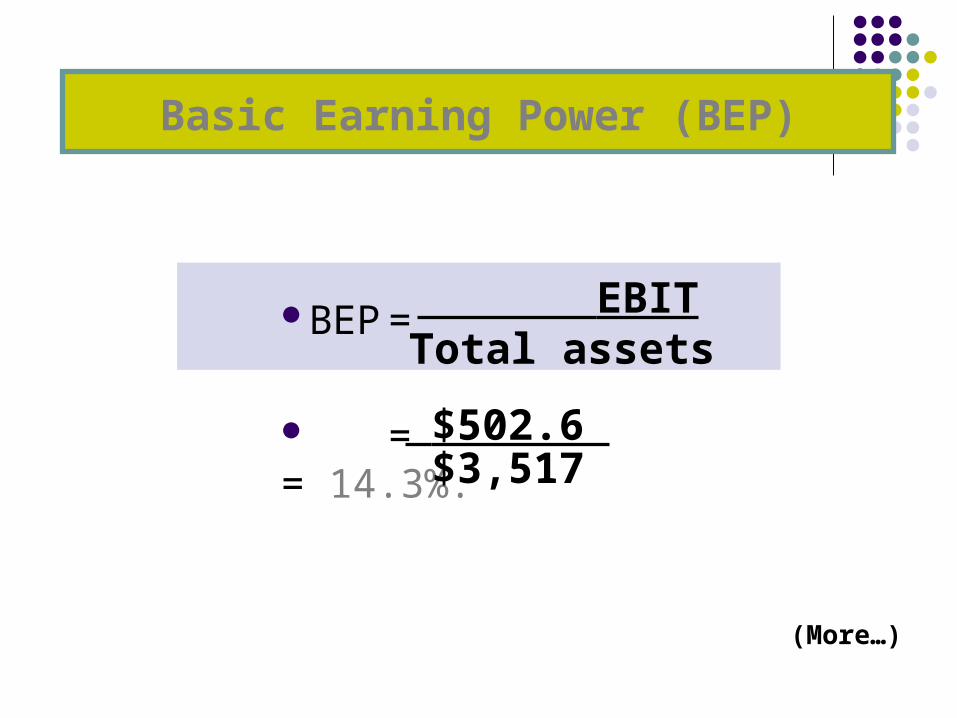
BEP =
= = 14.3%.
Basic Earning Power (BEP)
EBITTotal assets
$502.6 $3,517
(More…)
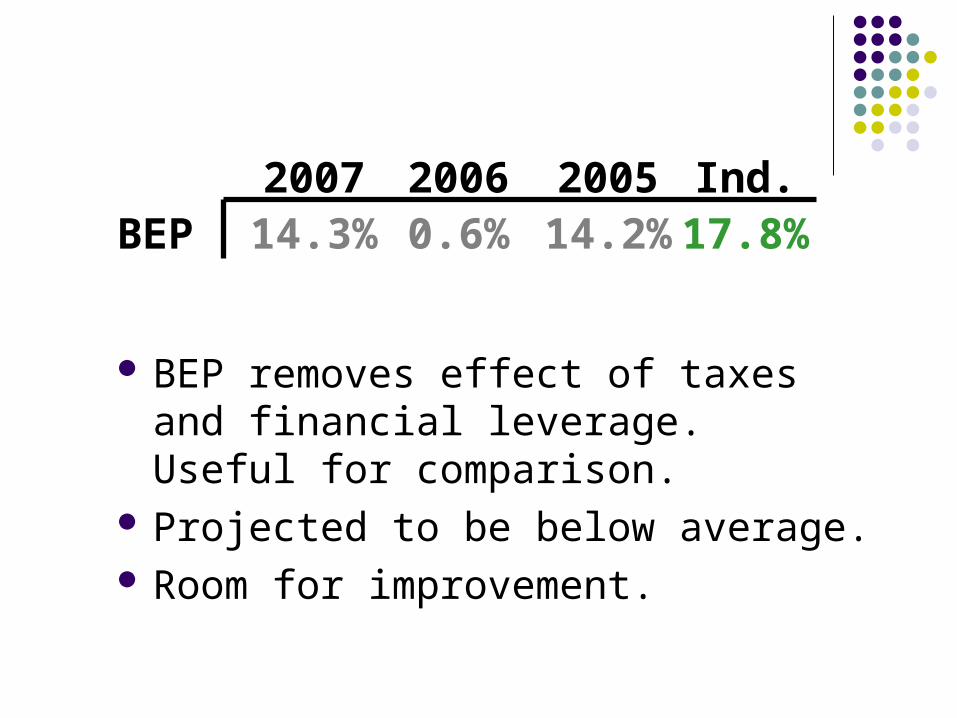
BEP removes effect of taxes and financial leverage. Useful for comparison.
Projected to be below average. Room for improvement.
2007 2006 2005 Ind.BEP 14.3% 0.6% 14.2% 17.8%
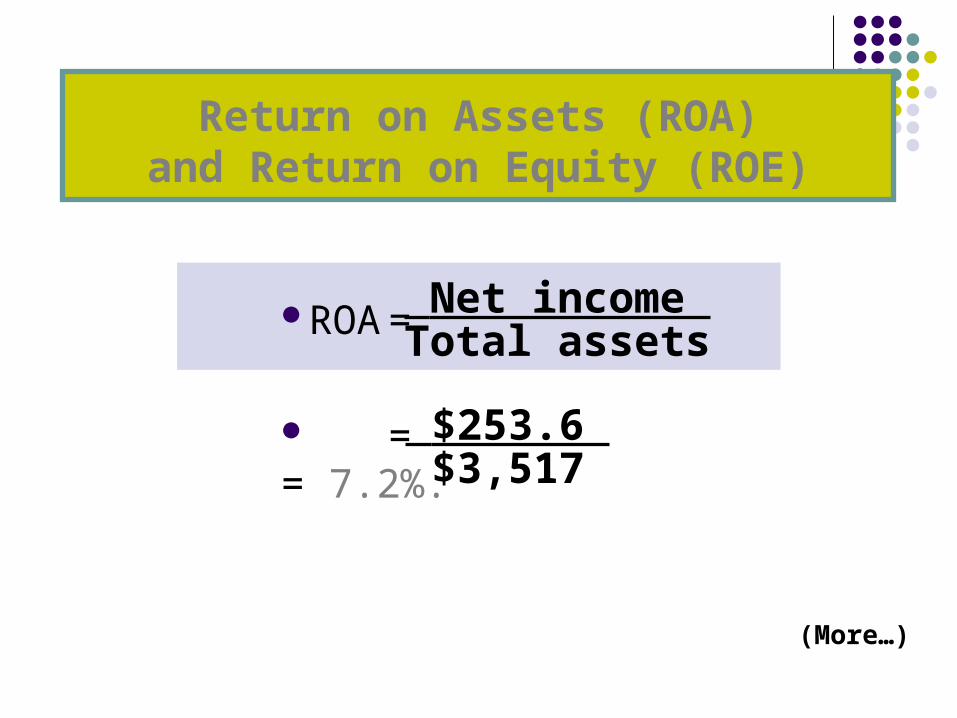
Return on Assets (ROA)and Return on Equity (ROE)
ROA =
= = 7.2%.
Net income Total assets
$253.6 $3,517
(More…)
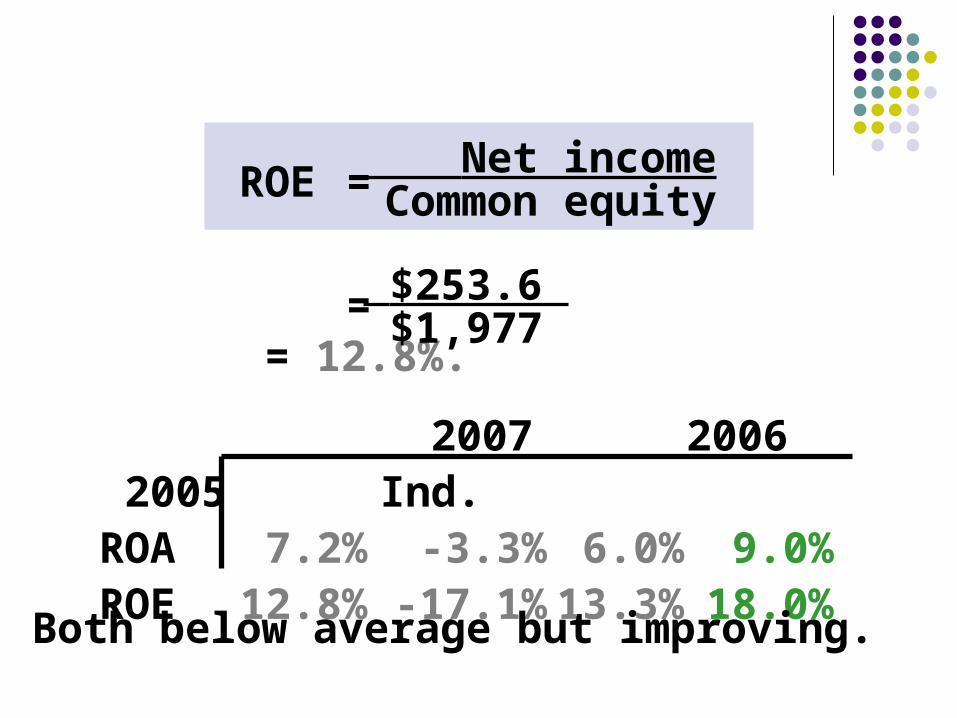
ROE =
= = 12.8%.
Net incomeCommon equity
$253.6 $1,977
2007 2006 2005 Ind.ROA 7.2% -3.3% 6.0% 9.0%ROE 12.8% -17.1% 13.3% 18.0%
Both below average but improving.
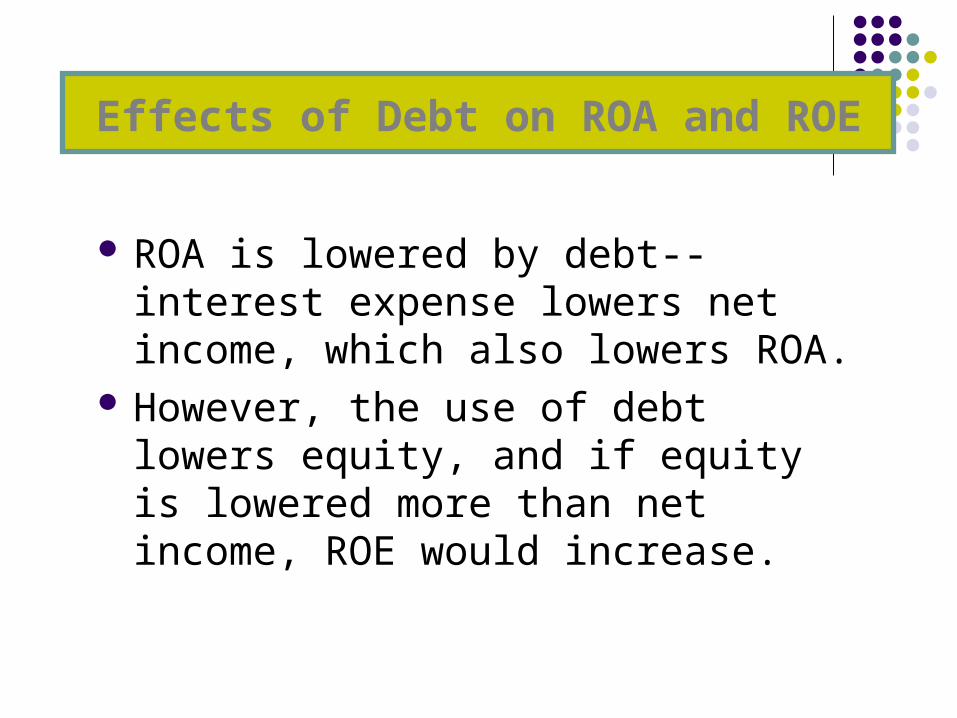
ROA is lowered by debt--interest expense lowers net income, which also lowers ROA.
However, the use of debt lowers equity, and if equity is lowered more than net income, ROE would increase.
Effects of Debt on ROA and ROE
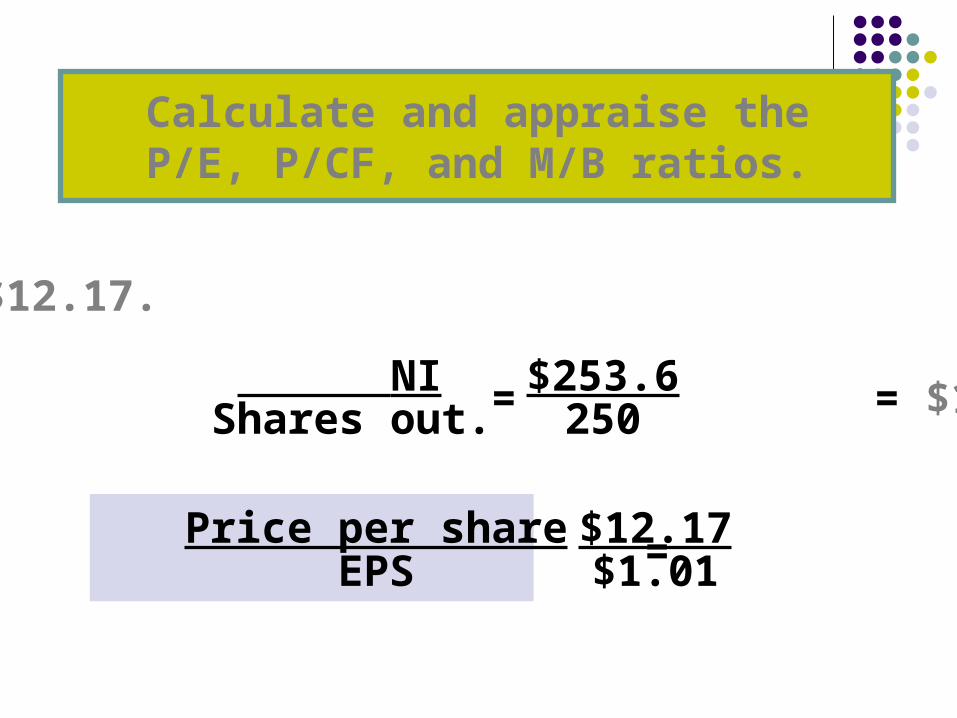
Calculate and appraise theP/E, P/CF, and M/B ratios.
Price = $12.17.
EPS = = = $1.01.
P/E = = = 12x.
NIShares out.
$253.6250
Price per shareEPS
$12.17$1.01
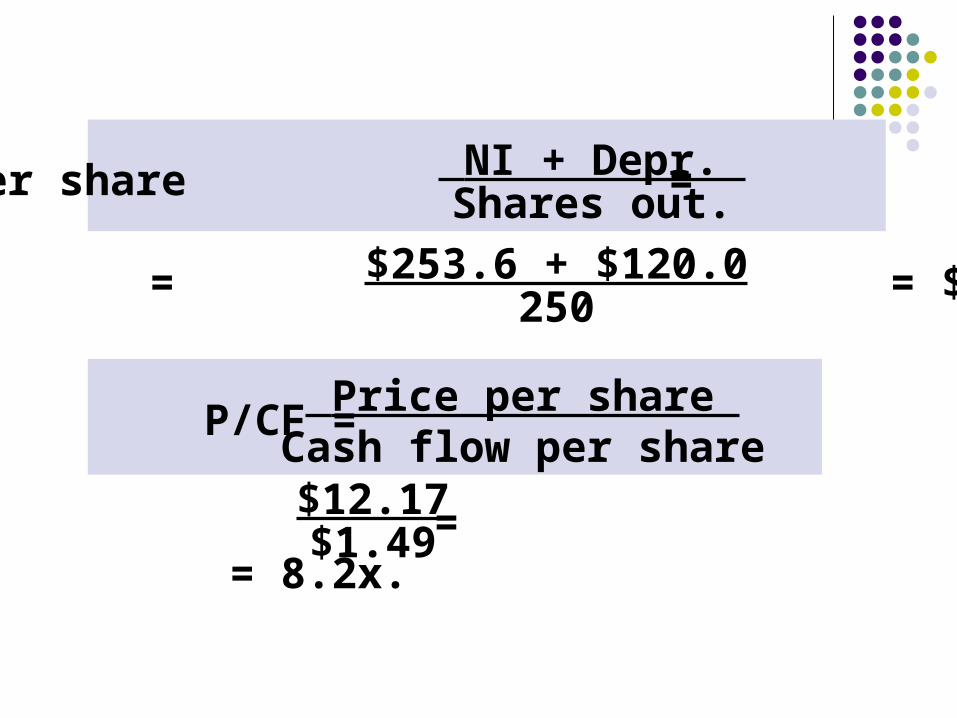
NI + Depr. Shares out.CF per share =
= = $1.49.$253.6 + $120.0250
Price per share Cash flow per share
P/CF =
= = 8.2x.$12.17$1.49
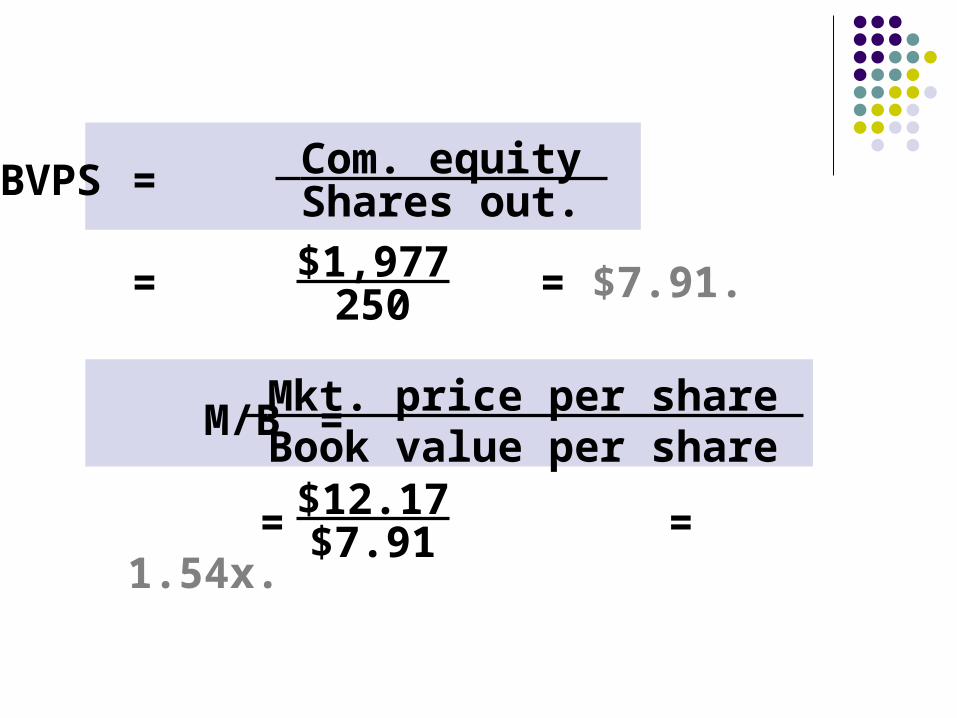
Com. equity Shares out.BVPS =
= = $7.91.$1,977250
Mkt. price per share Book value per share
M/B =
= = 1.54x.$12.17$7.91
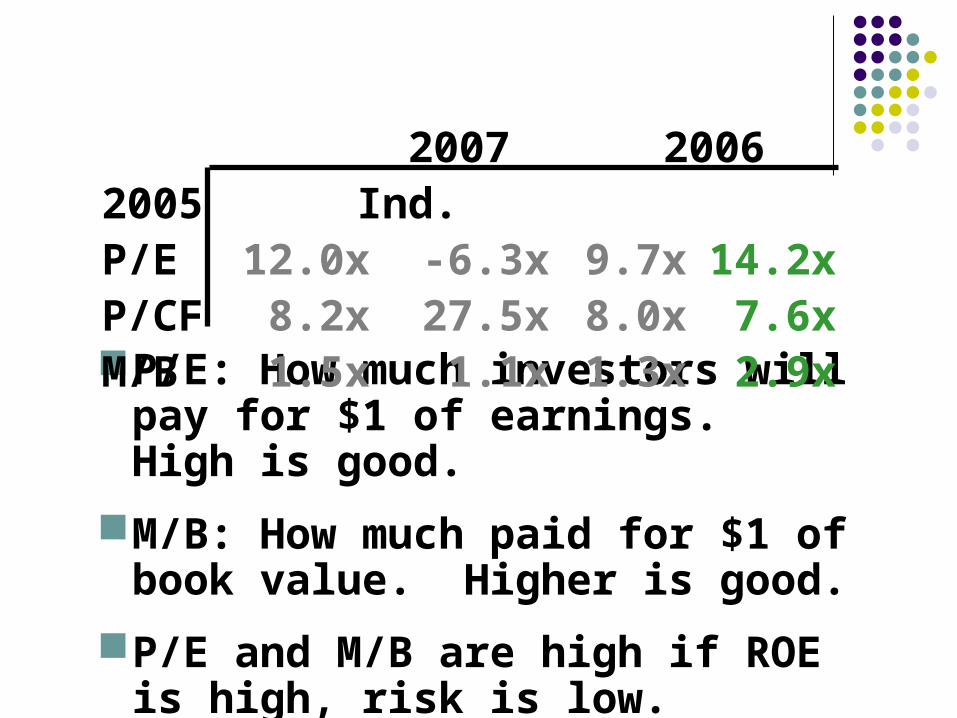
P/E: How much investors will pay for $1 of earnings. High is good.
M/B: How much paid for $1 of book value. Higher is good.
P/E and M/B are high if ROE is high, risk is low.
2007 2006 2005 Ind.P/E 12.0x -6.3x 9.7x 14.2xP/CF 8.2x 27.5x 8.0x 7.6xM/B 1.5x 1.1x 1.3x 2.9x
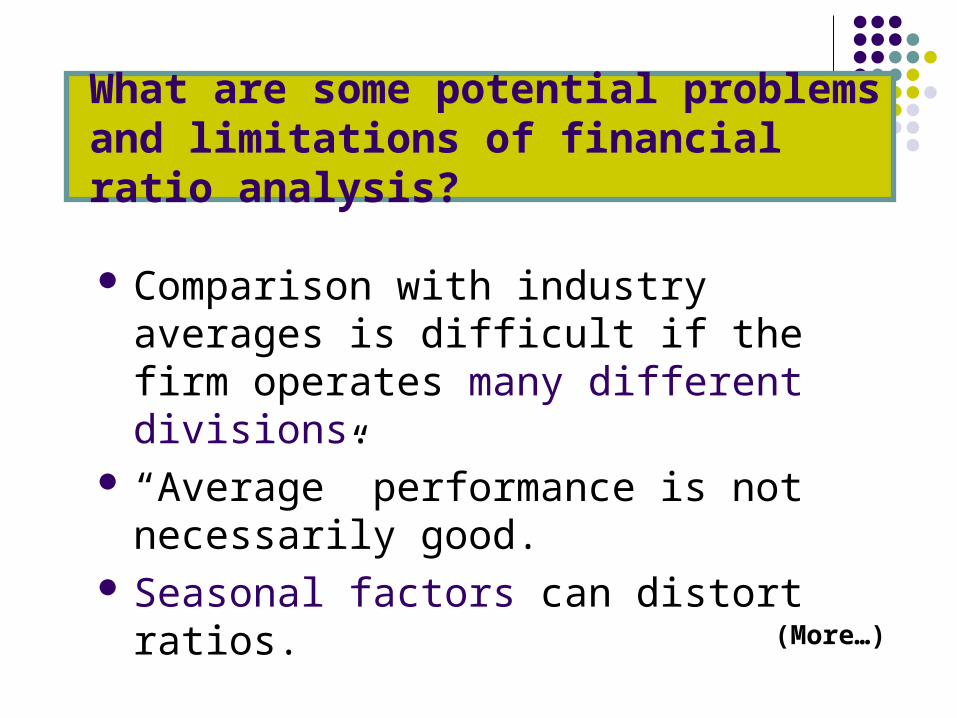
What are some potential problems and limitations of financial ratio analysis?
Comparison with industry averages is difficult if the firm operates many different divisions.
“Average” performance is not necessarily good.
Seasonal factors can distort ratios.
(More…)
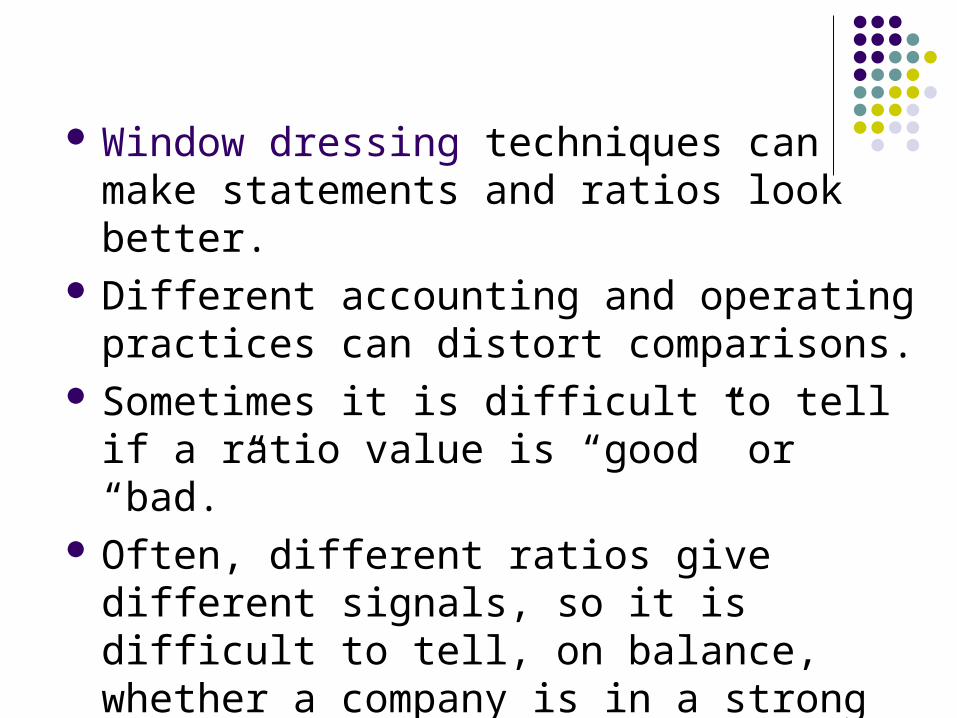
Window dressing techniques can make statements and ratios look better.
Different accounting and operating practices can distort comparisons.
Sometimes it is difficult to tell if a ratio value is “good” or “bad.”
Often, different ratios give different signals, so it is difficult to tell, on balance, whether a company is in a strong or weak financial condition.
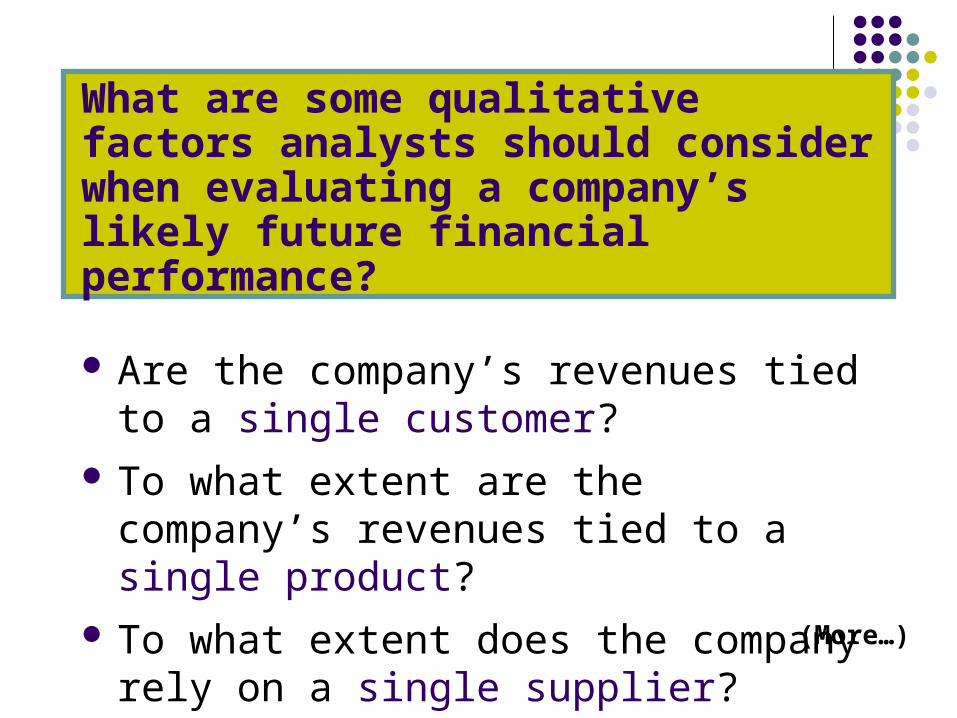
What are some qualitative factors analysts should consider when evaluating a company’s likely future financial performance?
Are the company’s revenues tied to a single customer?
To what extent are the company’s revenues tied to a single product?
To what extent does the company rely on a single supplier? (More…)
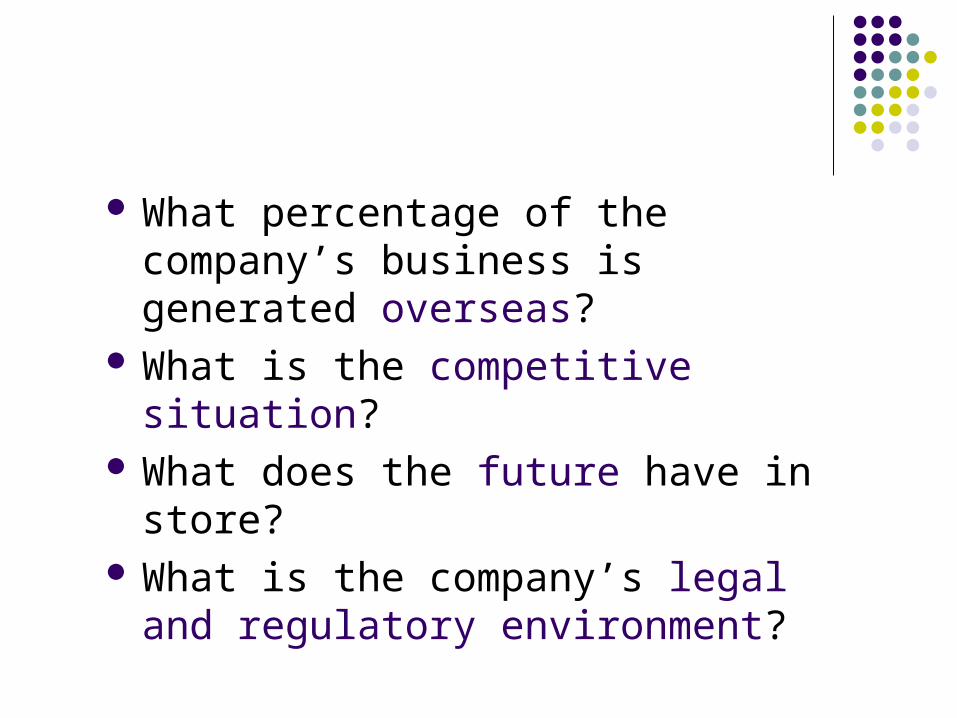
What percentage of the company’s business is generated overseas?
What is the competitive situation? What does the future have in store? What is the company’s legal and
regulatory environment?
CHAPTER 4 Risk and Return: Part I
Basic return concepts Basic risk concepts Stand-alone risk Portfolio (market) risk Risk and return: CAPM/SML
What are investment returns?
Investment returns measure the financial results of an investment.
Returns may be historical or prospective (anticipated).
Returns can be expressed in:
Dollar terms.
Percentage terms.
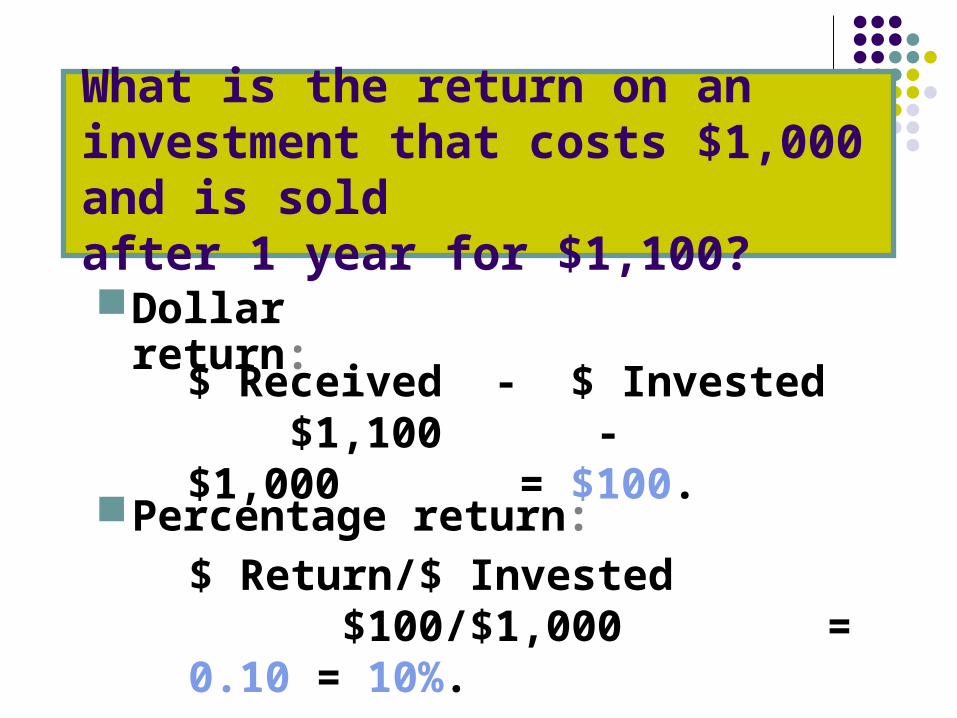
What is the return on an investment that costs $1,000 and is soldafter 1 year for $1,100?
Dollar return:
Percentage return:
$ Received - $ Invested $1,100 - $1,000 = $100.
$ Return/$ Invested $100/$1,000 = 0.10 = 10%.
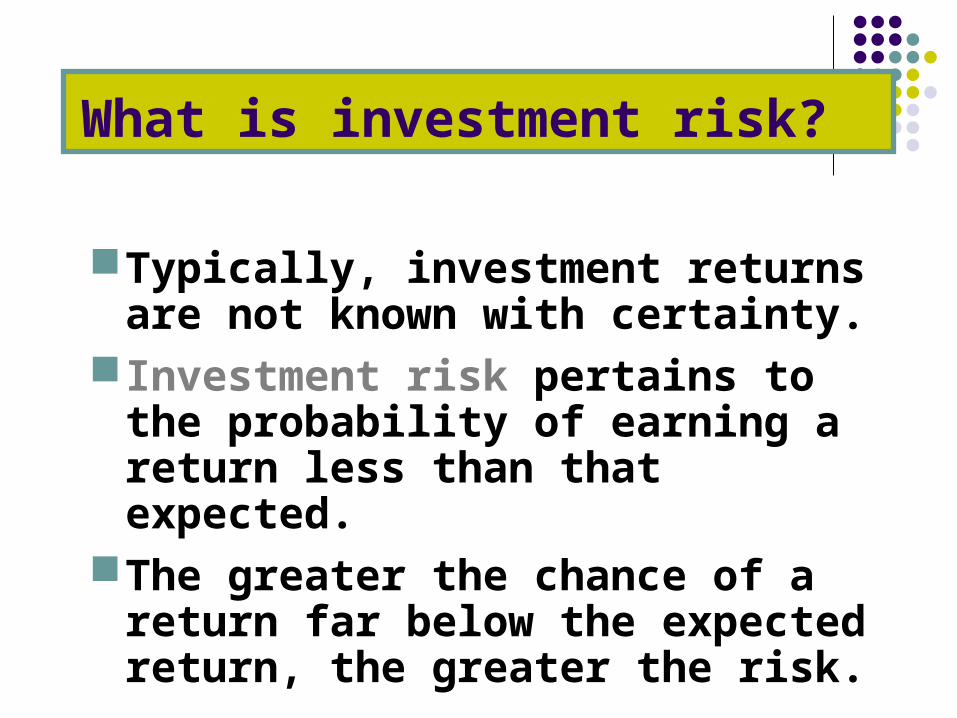
What is investment risk?
Typically, investment returns are not known with certainty.
Investment risk pertains to the probability of earning a return less than that expected.
The greater the chance of a return far below the expected return, the greater the risk.
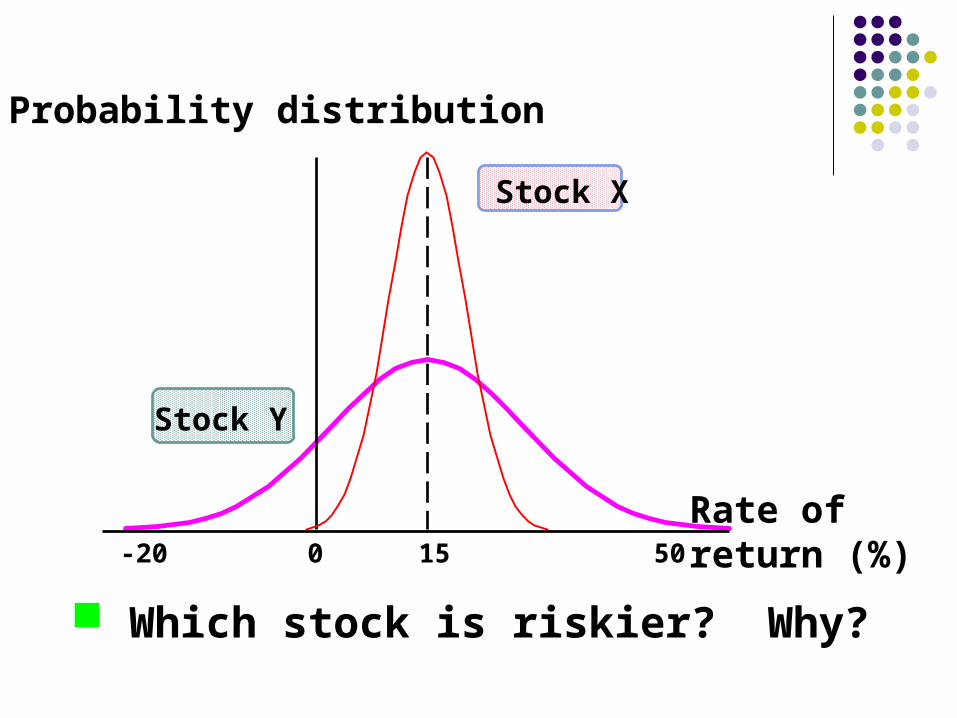
Probability distribution
Rate ofreturn (%) 50150-20
Stock X
Stock Y
Which stock is riskier? Why?
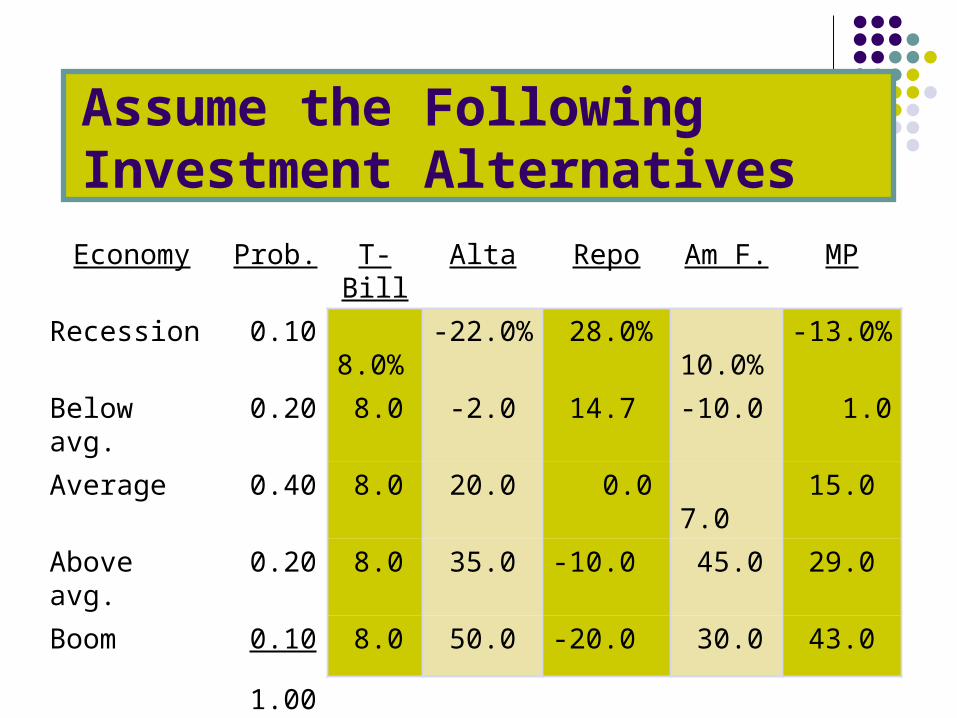
Assume the FollowingInvestment Alternatives
Economy Prob. T-Bill Alta Repo Am F. MP
Recession 0.10 8.0% -22.0% 28.0% 10.0% -13.0%
Below avg. 0.20 8.0 -2.0 14.7 -10.0 1.0
Average 0.40 8.0 20.0 0.0 7.0 15.0
Above avg. 0.20 8.0 35.0 -10.0 45.0 29.0
Boom 0.10 8.0 50.0 -20.0 30.0 43.0
1.00
What is unique about the T-bill return?
The T-bill will return 8% regardless of the state of the economy.
Is the T-bill riskless? Explain.
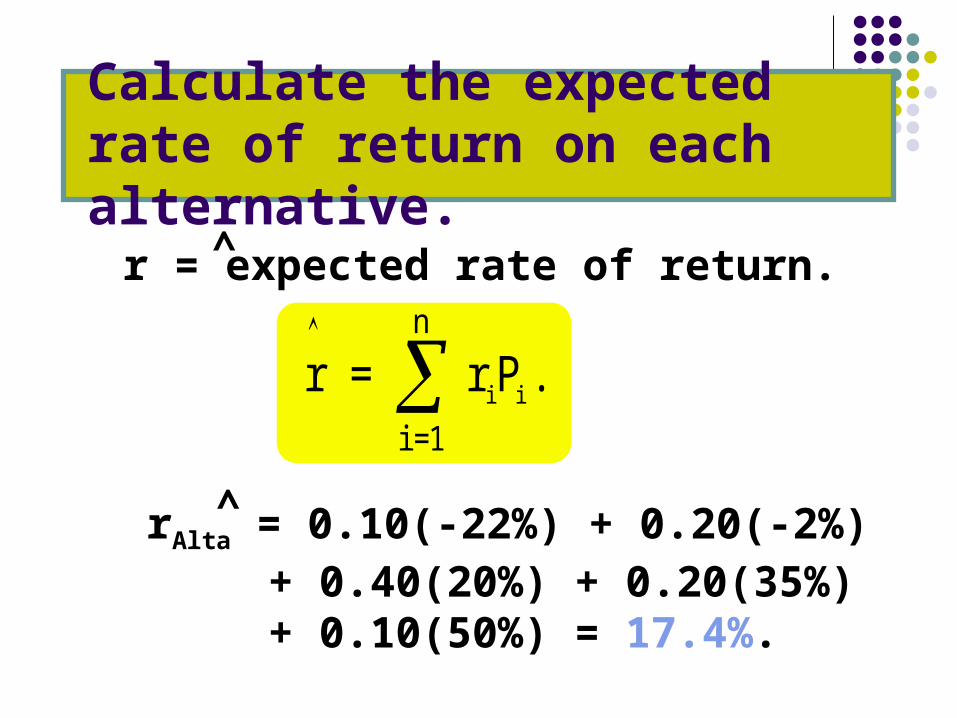
Calculate the expected rate of return on each alternative.
. n
1=iiiPr = r
r = expected rate of return.
rAlta = 0.10(-22%) + 0.20(-2%) + 0.40(20%) + 0.20(35%) + 0.10(50%) = 17.4%.
^
^
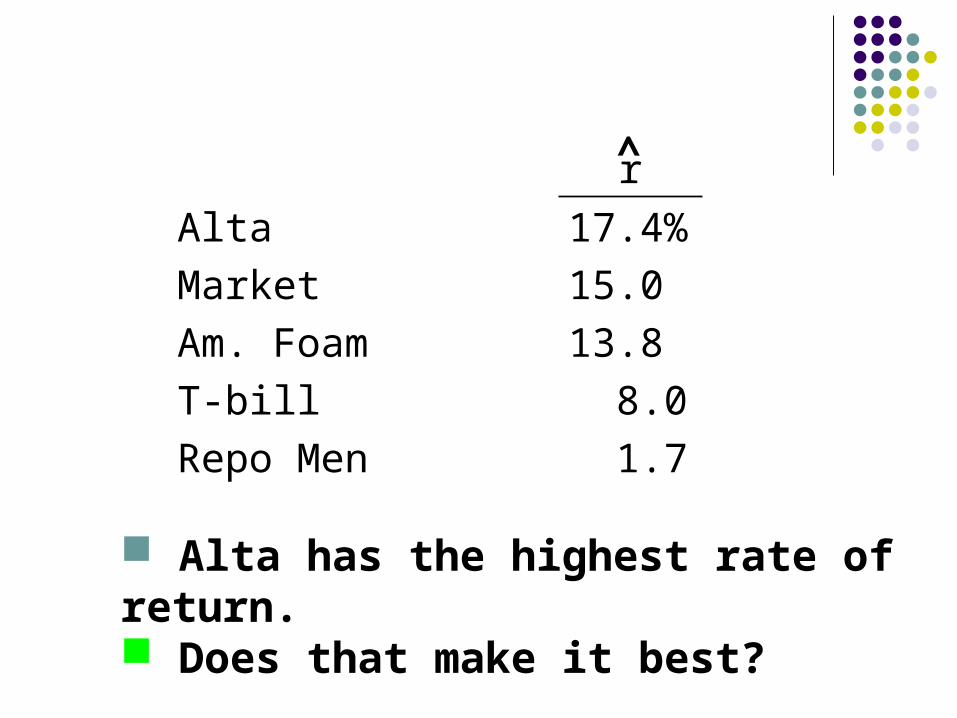
Alta has the highest rate of return. Does that make it best?
r
Alta 17.4%
Market 15.0
Am. Foam 13.8
T-bill 8.0
Repo Men 1.7
^
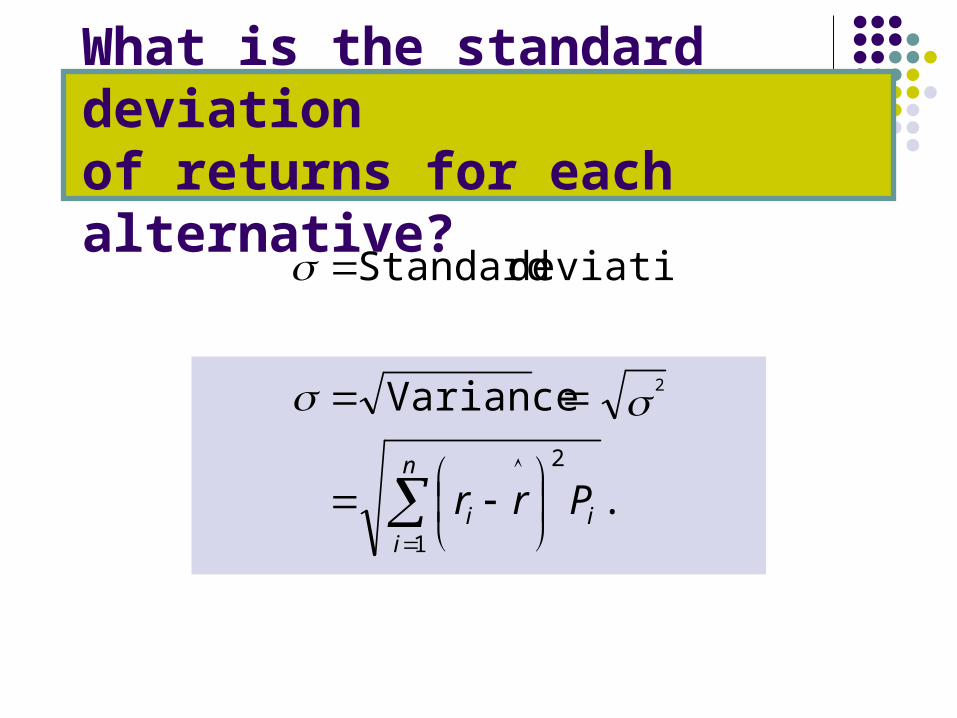
What is the standard deviationof returns for each alternative?
.
Variance
deviation Standard
1
2
2
n
iii Prr
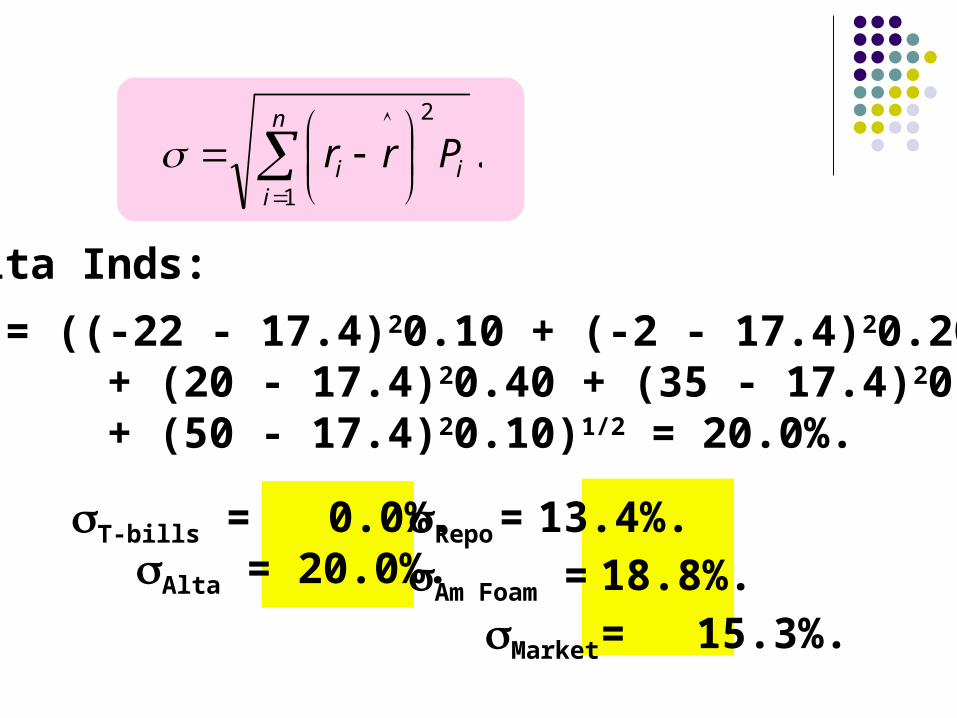
T-bills = 0.0%.Alta = 20.0%.
Repo= 13.4%.Am Foam = 18.8%. Market = 15.3%.
.1
2
n
iii Prr
Alta Inds:
= ((-22 - 17.4)20.10 + (-2 - 17.4)20.20 + (20 - 17.4)20.40 + (35 - 17.4)20.20 + (50 - 17.4)20.10)1/2 = 20.0%.
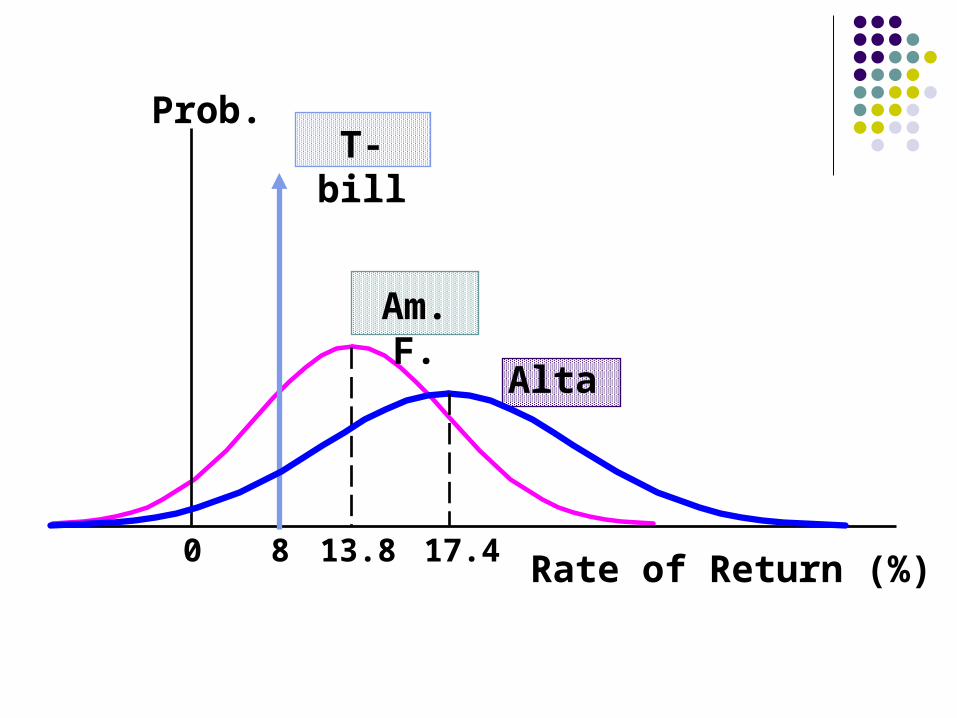
Prob.
Rate of Return (%)
T-bill
Am. F.
Alta
0 8 13.8 17.4
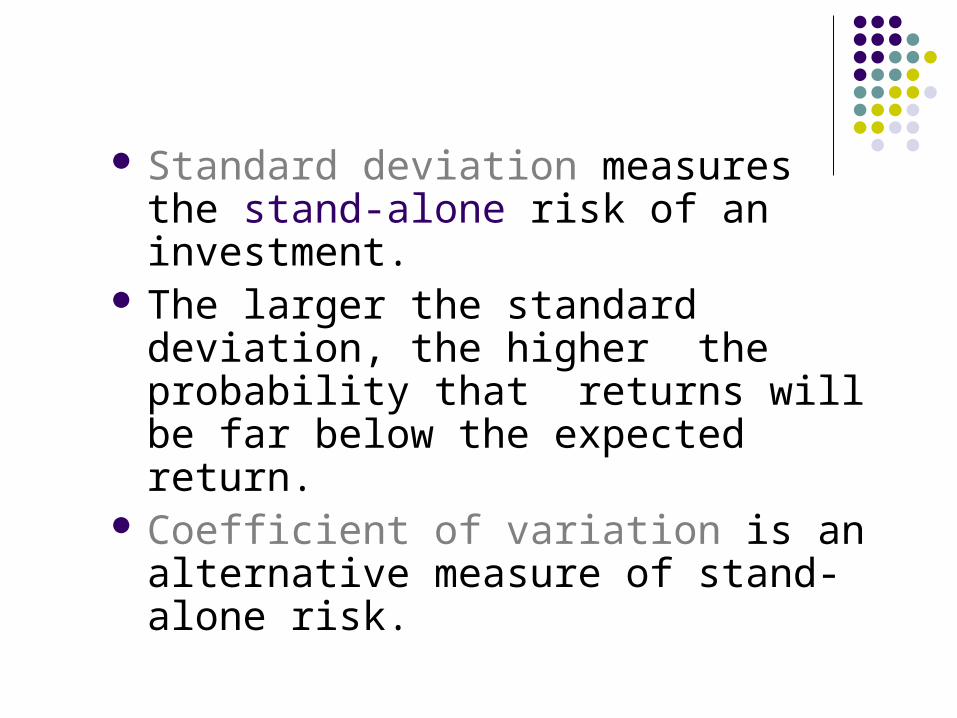
Standard deviation measures the stand-alone risk of an investment.
The larger the standard deviation, the higher the probability that returns will be far below the expected return.
Coefficient of variation is an alternative measure of stand-alone risk.
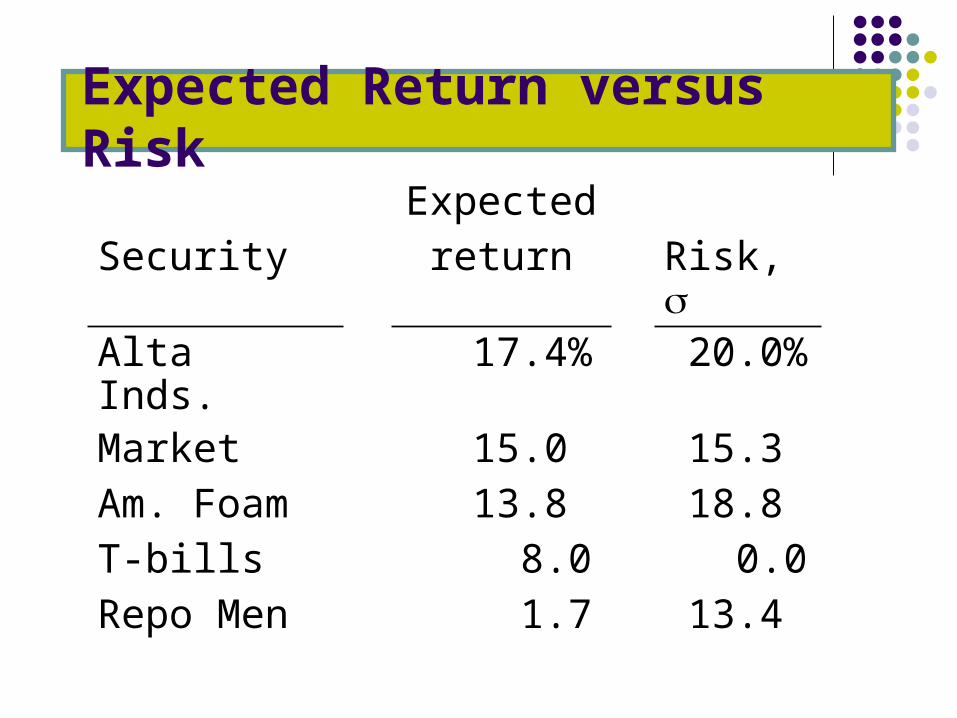
Expected Return versus Risk
Expected
Security return Risk, Alta Inds. 17.4% 20.0%
Market 15.0 15.3
Am. Foam 13.8 18.8
T-bills 8.0 0.0
Repo Men
1.7 13.4
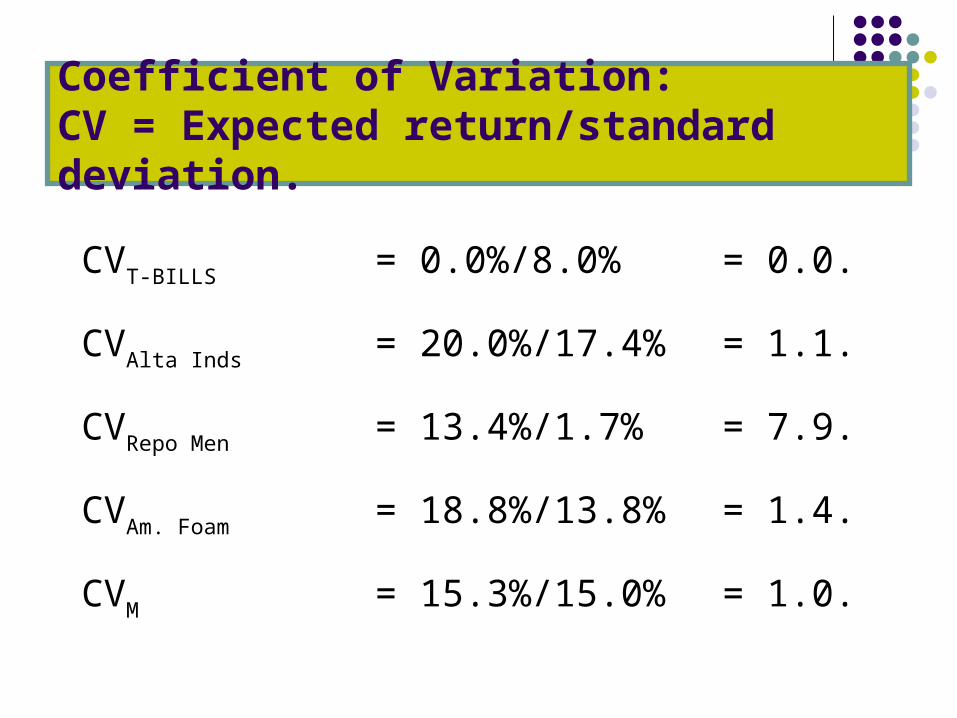
Coefficient of Variation:CV = Expected return/standard deviation.
CVT-BILLS = 0.0%/8.0% = 0.0.
CVAlta Inds = 20.0%/17.4% = 1.1.
CVRepo Men = 13.4%/1.7% = 7.9.
CVAm. Foam = 18.8%/13.8% = 1.4.
CVM = 15.3%/15.0% = 1.0.
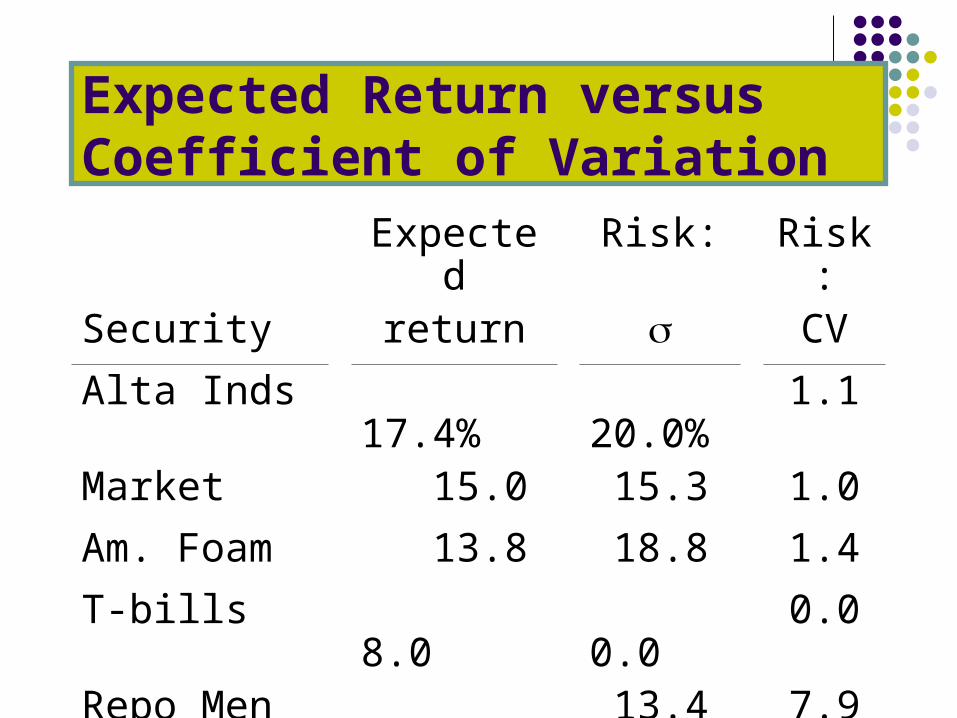
Expected Return versus Coefficient of Variation
Expected Risk: Risk:
Security return CV
Alta Inds 17.4% 20.0% 1.1
Market 15.0 15.3 1.0
Am. Foam 13.8 18.8 1.4
T-bills 8.0 0.0 0.0
Repo Men
1.7 13.4 7.9
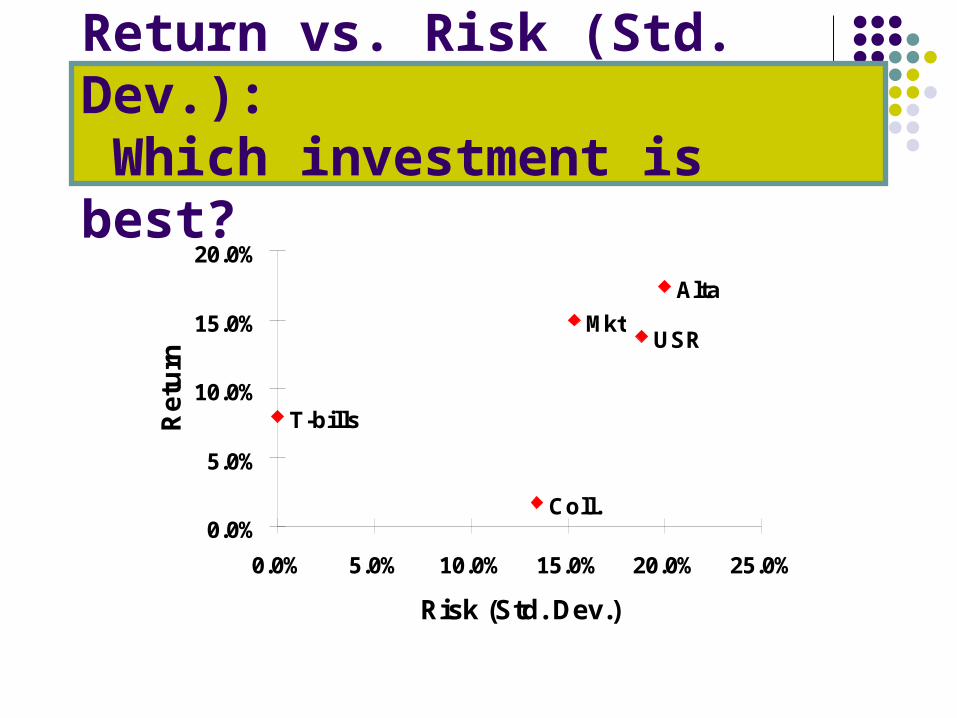
T-bills
Coll.
MktUSR
Alta
0.0%
5.0%
10.0%
15.0%
20.0%
0.0% 5.0% 10.0% 15.0% 20.0% 25.0%
Risk (Std. Dev.)
Re
turn
Return vs. Risk (Std. Dev.): Which investment is best?
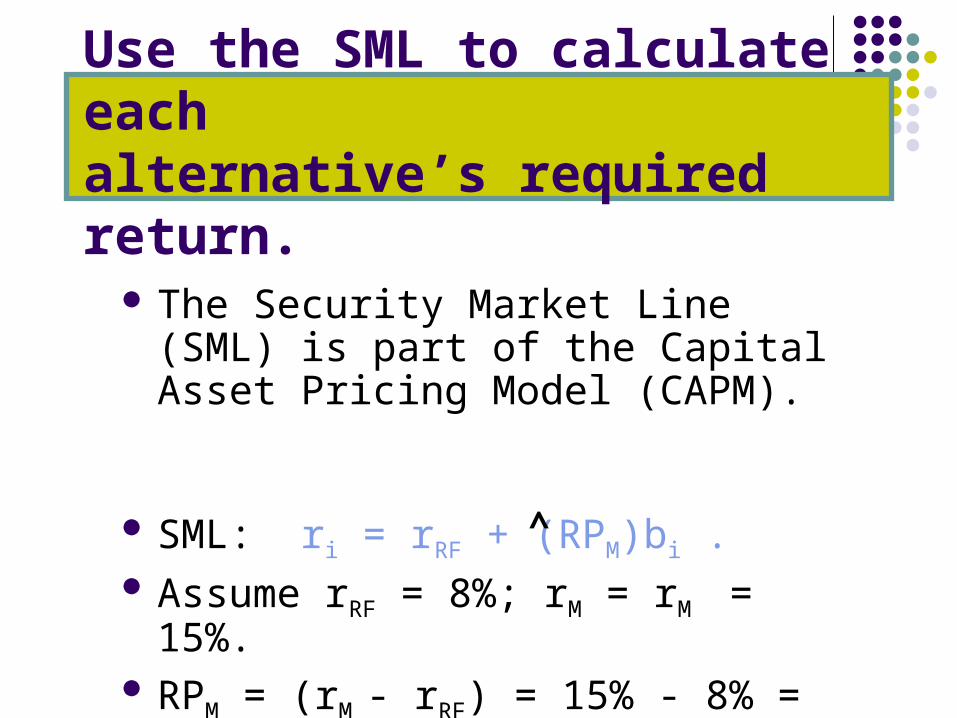
Use the SML to calculate eachalternative’s required return.
The Security Market Line (SML) is part of the Capital Asset Pricing Model (CAPM).
SML: ri = rRF + (RPM)bi . Assume rRF = 8%; rM = rM = 15%. RPM = (rM - rRF) = 15% - 8% = 7%.
^
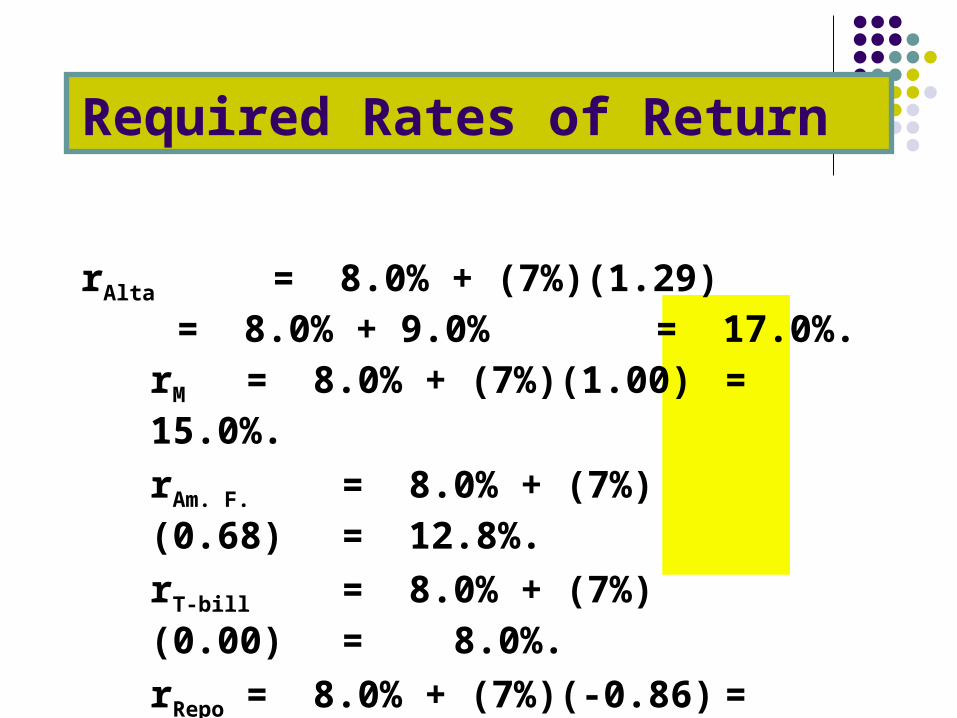
Required Rates of Return
rAlta = 8.0% + (7%)(1.29)= 8.0% + 9.0% = 17.0%.
rM = 8.0% + (7%)(1.00) = 15.0%.
rAm. F. = 8.0% + (7%)(0.68) = 12.8%.
rT-bill = 8.0% + (7%)(0.00) = 8.0%.
rRepo = 8.0% + (7%)(-0.86) = 2.0%.
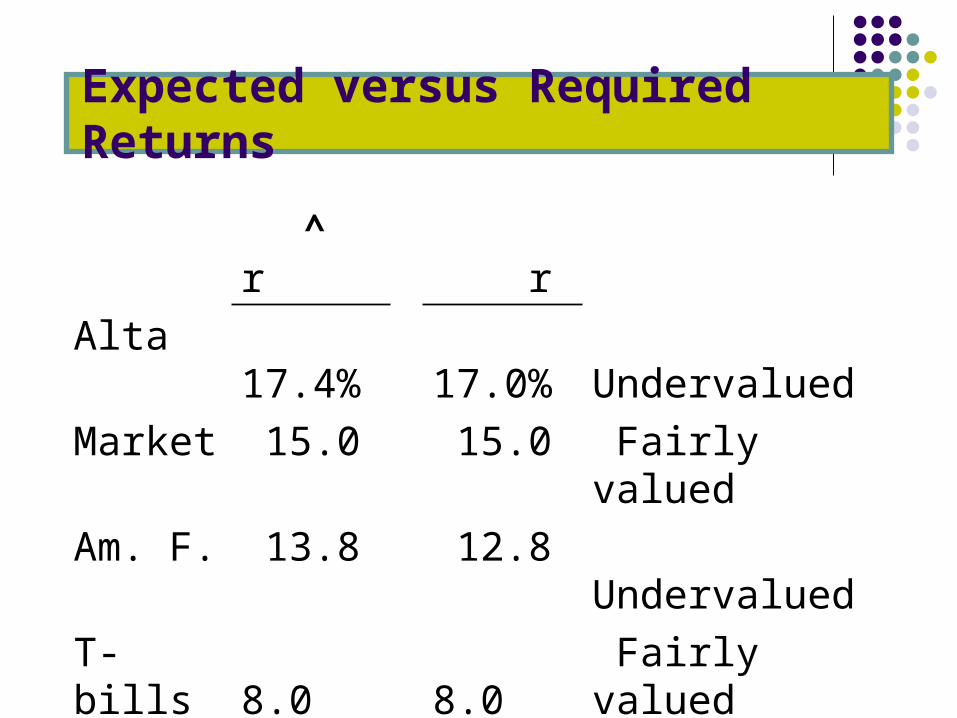
Expected versus Required Returns
^ r r
Alta 17.4% 17.0% Undervalued
Market 15.0 15.0 Fairly valued
Am. F. 13.8 12.8 Undervalued
T-bills 8.0 8.0 Fairly valued
Repo 1.7 2.0 Overvalued
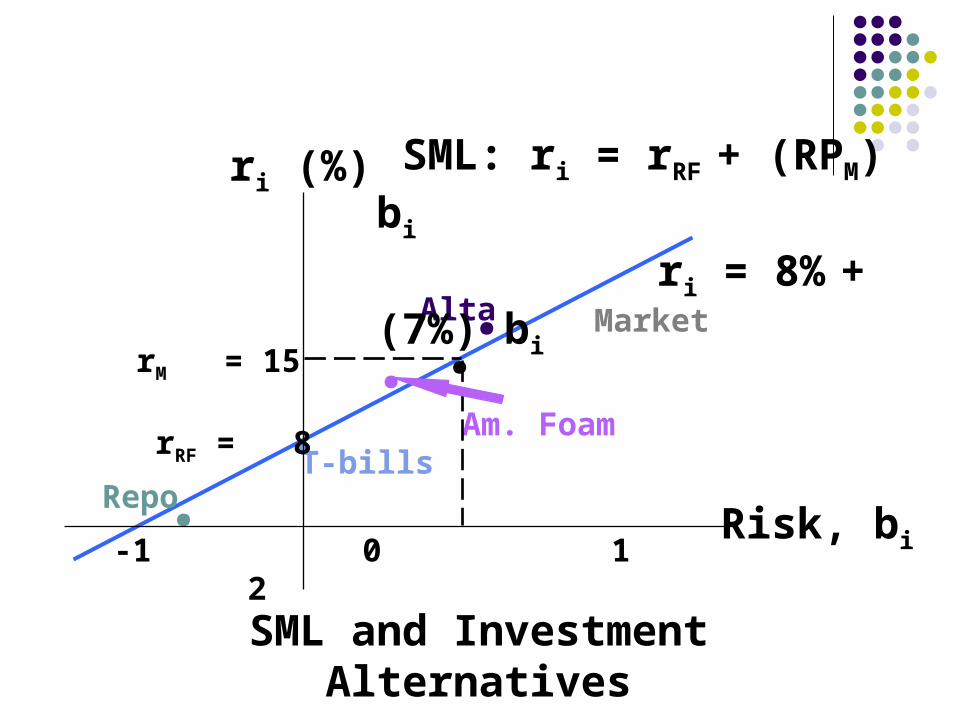
..Repo
.Alta
T-bills
.Am. Foam
rM = 15
rRF = 8
-1 0 1 2
.
SML: ri = rRF + (RPM) bi
ri = 8% + (7%) bi
ri (%)
Risk, bi
SML and Investment Alternatives
Market
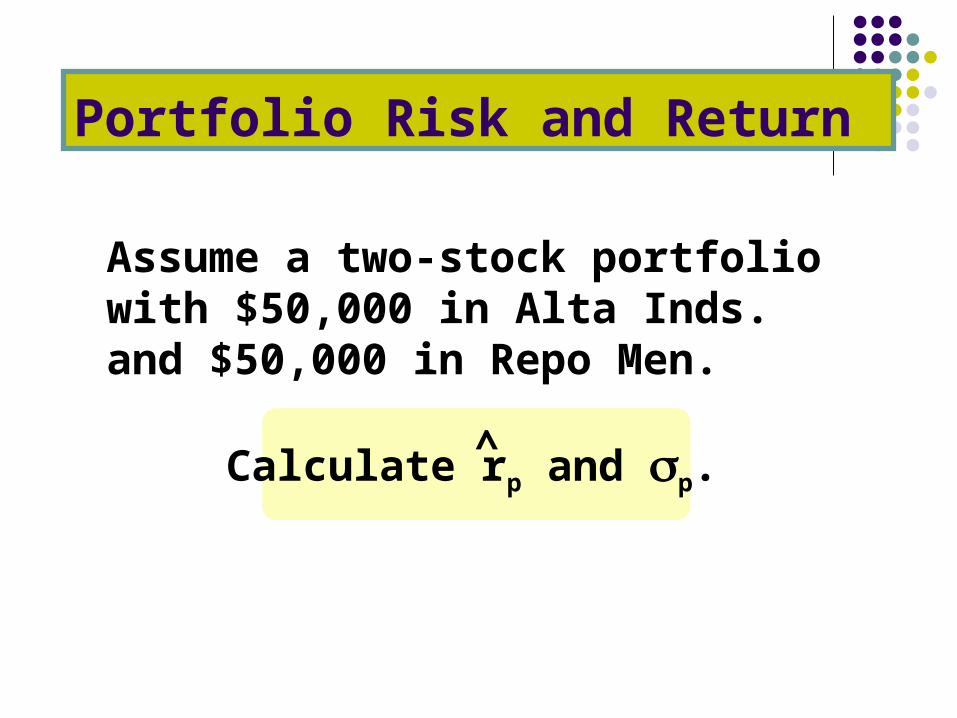
Portfolio Risk and Return
Assume a two-stock portfolio with $50,000 in Alta Inds. and $50,000 in Repo Men.
Calculate rp and p.^
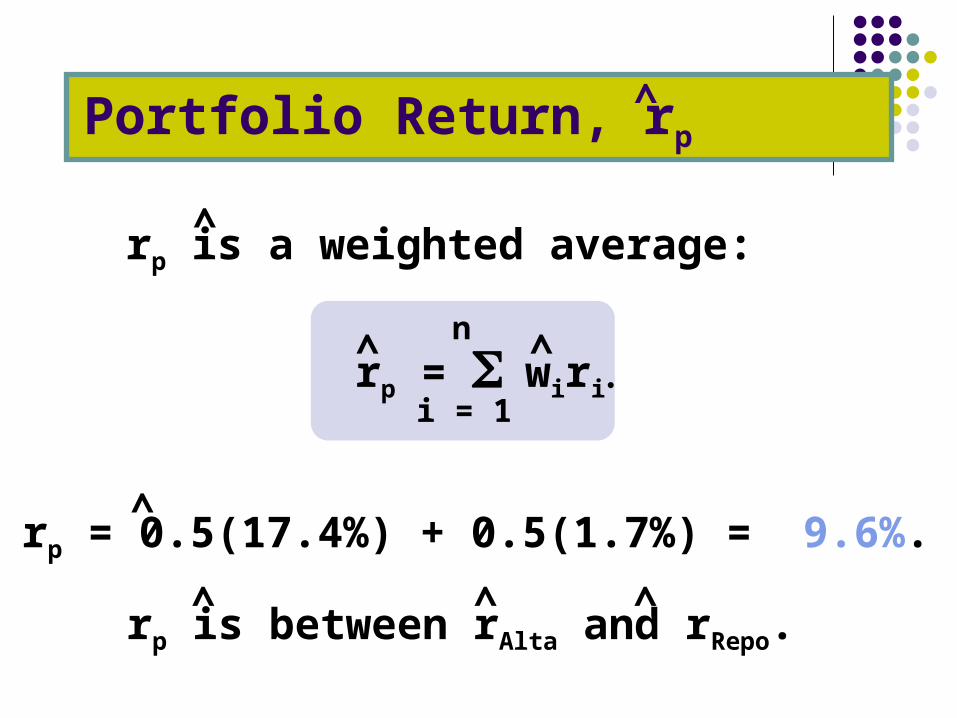
Portfolio Return, rp
rp is a weighted average:
rp = 0.5(17.4%) + 0.5(1.7%) = 9.6%.
rp is between rAlta and rRepo.
^
^
^
^
^ ^
^ ^
rp = wirin
i = 1
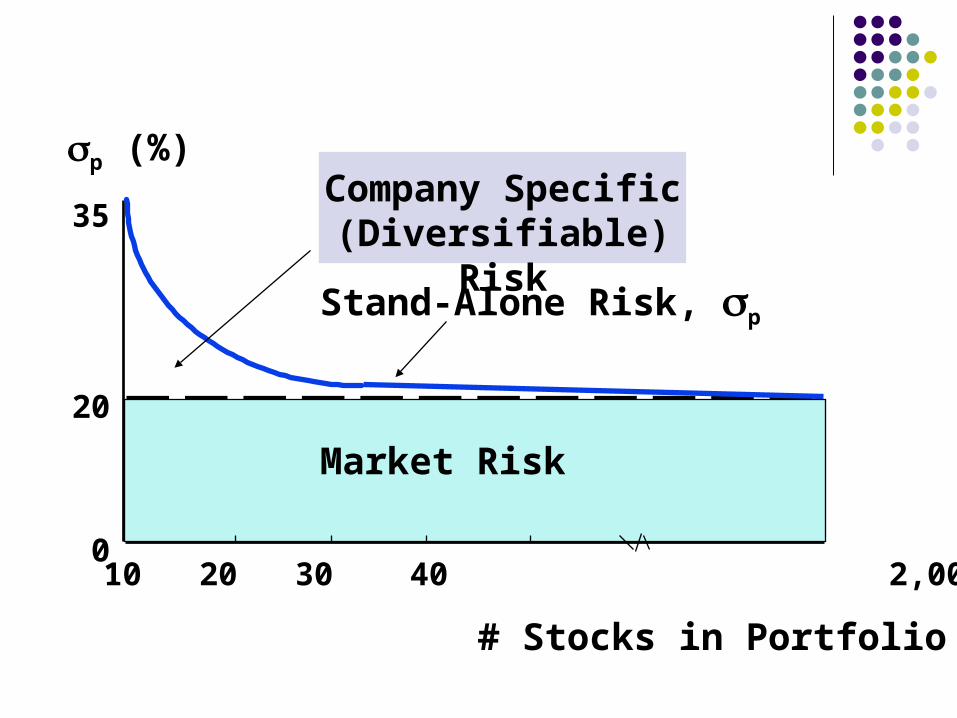
# Stocks in Portfolio
10 20 30 40 2,000+
Company Specific (Diversifiable) Risk
Market Risk
20
0
Stand-Alone Risk, p
p (%)
35
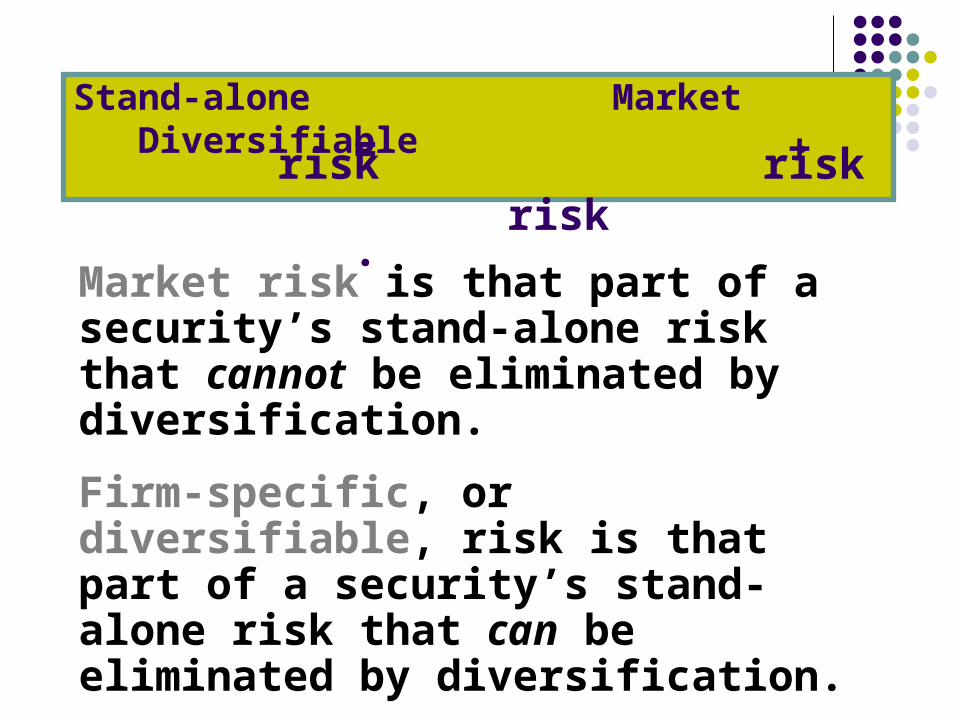
Stand-alone Market Diversifiable
Market risk is that part of a security’s stand-alone risk that cannot be eliminated by diversification.
Firm-specific, or diversifiable, risk is that part of a security’s stand-alone risk that can be eliminated by diversification.
risk risk risk
= + .
Conclusions
As more stocks are added, each new stock has a smaller risk-reducing impact on the portfolio.
p falls very slowly after about 40 stocks are included. The lower limit for p is about 20% = M .
By forming well-diversified portfolios, investors can eliminate about half the riskiness of owning a single stock.
Market risk, which is relevant for stocks held in well-diversified portfolios, is defined as the contribution of a security to the overall riskiness of the portfolio.
It is measured by a stock’s beta coefficient. For stock i, its beta is:
bi = (iM i) / M
How is market risk measured for individual securities?
How are betas calculated?
In addition to measuring a stock’s contribution of risk to a portfolio, beta also which measures the stock’s volatility relative to the market.
Using a Regression to Estimate Beta
Run a regression with returns on the stock in question plotted on the Y axis and returns on the market portfolio plotted on the X axis.
The slope of the regression line, which measures relative volatility, is defined as the stock’s beta coefficient, or b.
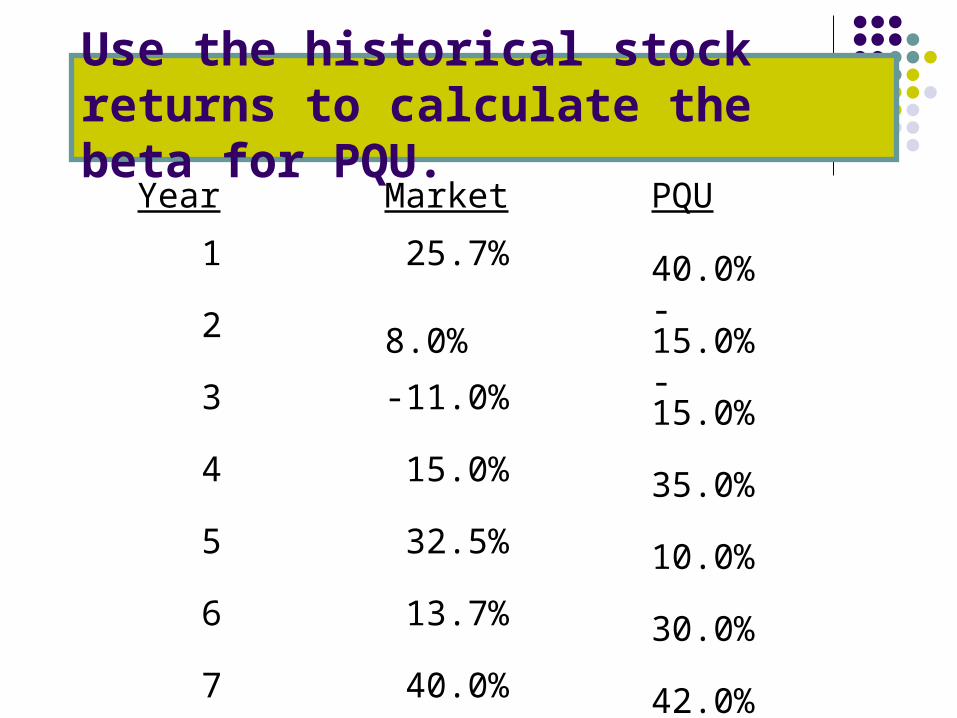
Use the historical stock returns to calculate the beta for PQU.
Year Market PQU
1 25.7% 40.0%
2 8.0% -15.0%
3 -11.0% -15.0%
4 15.0% 35.0%
5 32.5% 10.0%
6 13.7% 30.0%
7 40.0% 42.0%
8 10.0% -10.0%
9 -10.8% -25.0%
10 -13.1% 25.0%
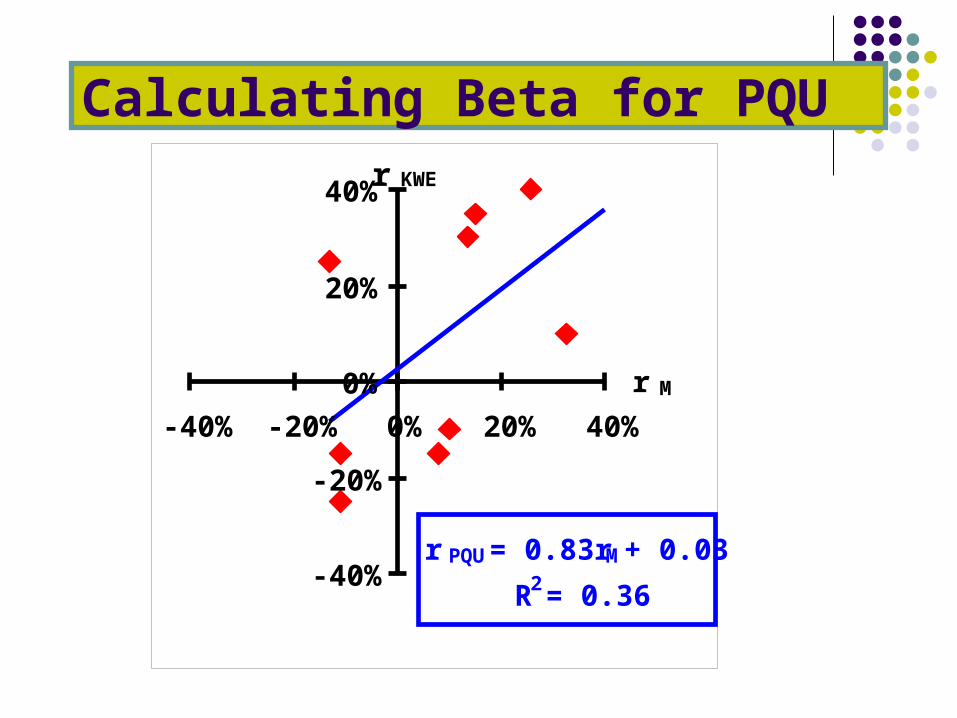
Calculating Beta for PQU
r PQU = 0.83r M + 0.03
R2 = 0.36-40%
-20%
0%
20%
40%
-40% -20% 0% 20% 40%
r M
r KWE
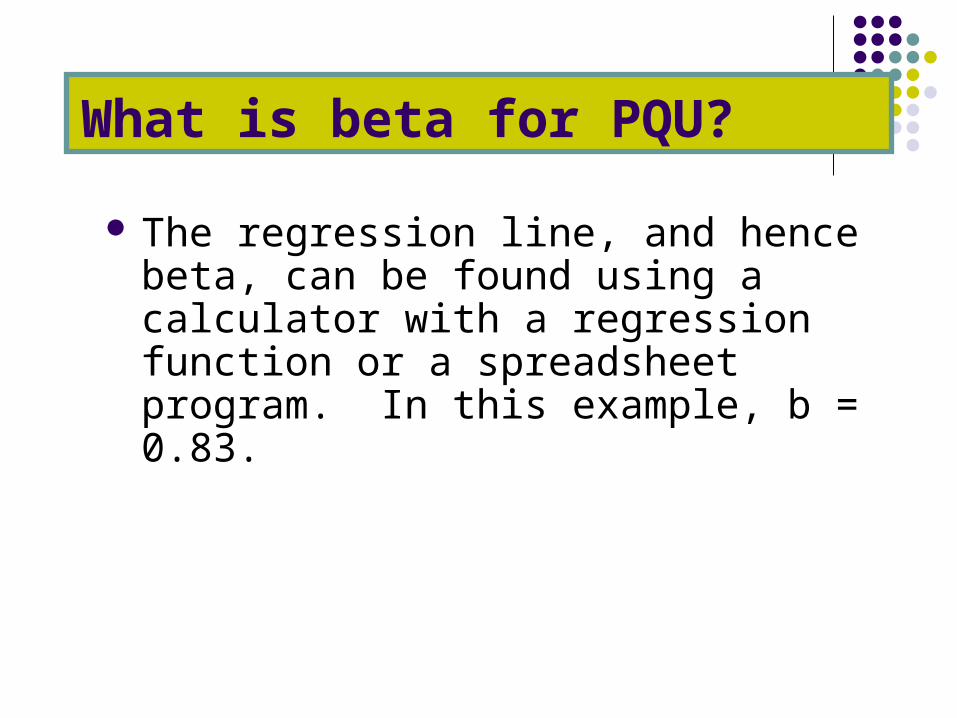
What is beta for PQU?
The regression line, and hence beta, can be found using a calculator with a regression function or a spreadsheet program. In this example, b = 0.83.
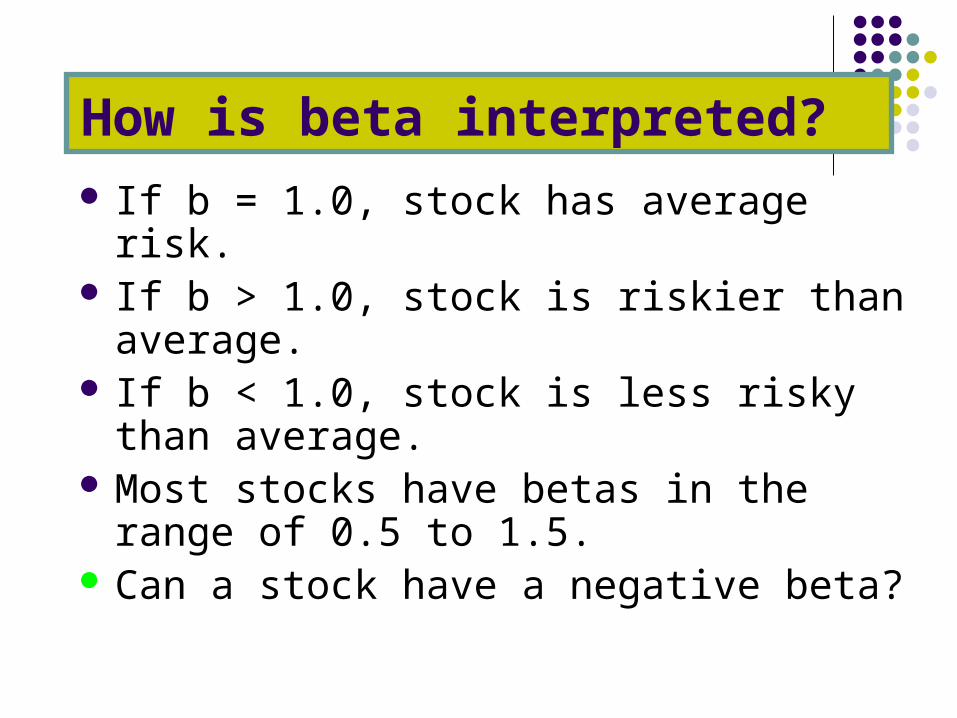
If b = 1.0, stock has average risk. If b > 1.0, stock is riskier than average. If b < 1.0, stock is less risky than average. Most stocks have betas in the range of 0.5 to
1.5. Can a stock have a negative beta?
How is beta interpreted?
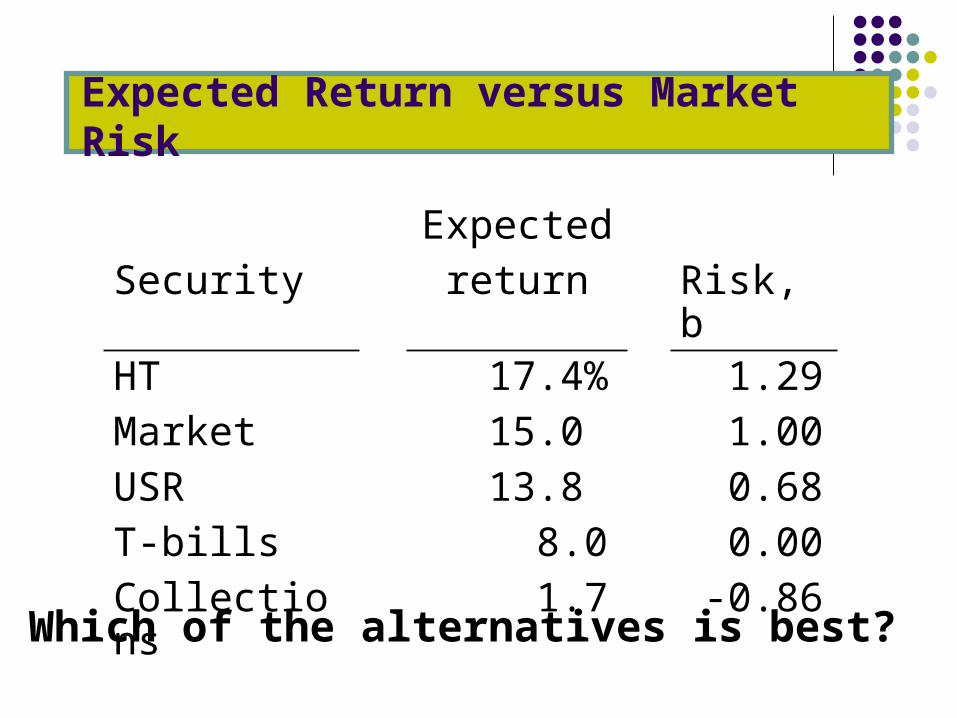
Expected Return versus Market Risk
Which of the alternatives is best?
Expected
Security return Risk, b
HT 17.4% 1.29
Market 15.0 1.00
USR 13.8 0.68
T-bills 8.0 0.00
Collections
1.7 -0.86
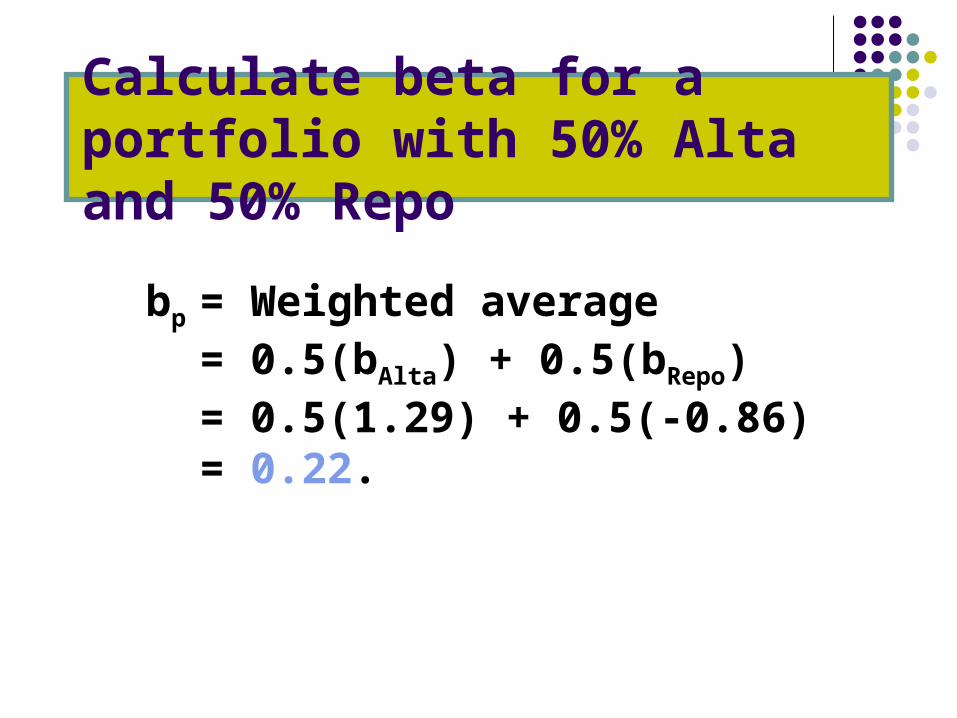
Calculate beta for a portfolio with 50% Alta and 50% Repo
bp = Weighted average= 0.5(bAlta) + 0.5(bRepo)= 0.5(1.29) + 0.5(-0.86)= 0.22.
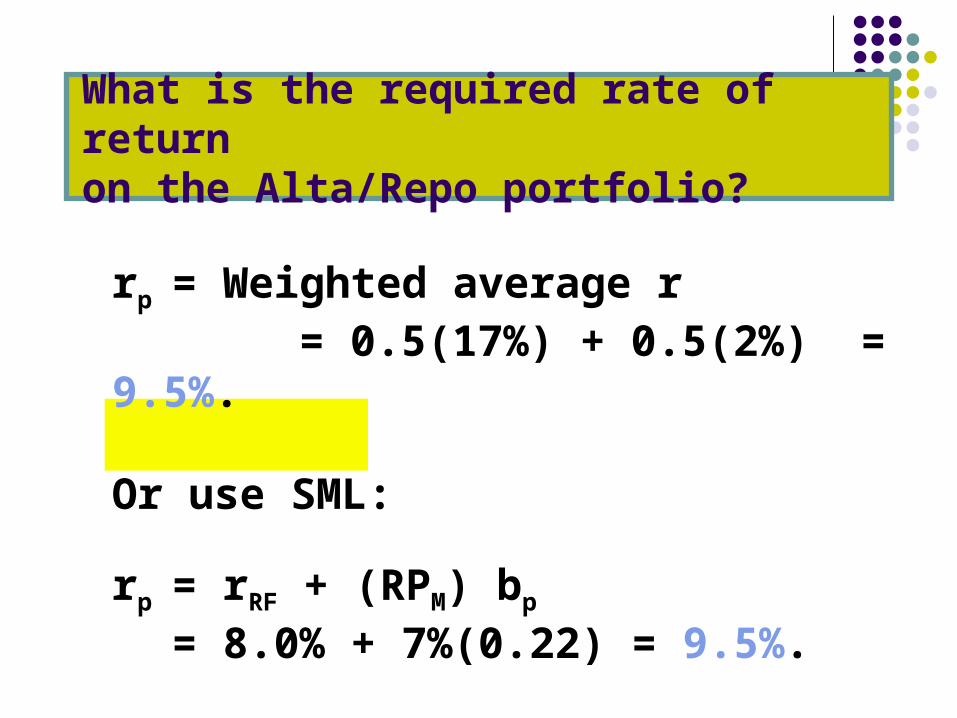
What is the required rate of returnon the Alta/Repo portfolio?
rp = Weighted average r = 0.5(17%) + 0.5(2%) = 9.5%.
Or use SML:
rp = rRF + (RPM) bp
= 8.0% + 7%(0.22) = 9.5%.
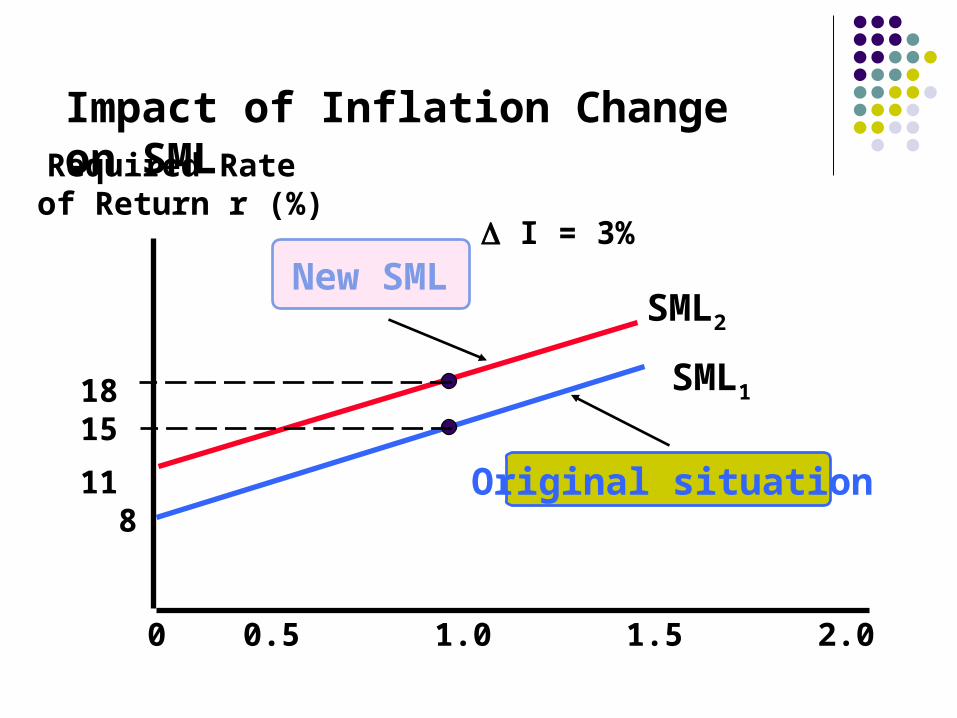
SML1
Original situation
Required Rate of Return r (%)
SML2
0 0.5 1.0 1.5 2.0
1815
11 8
New SML I = 3%
Impact of Inflation Change on SML
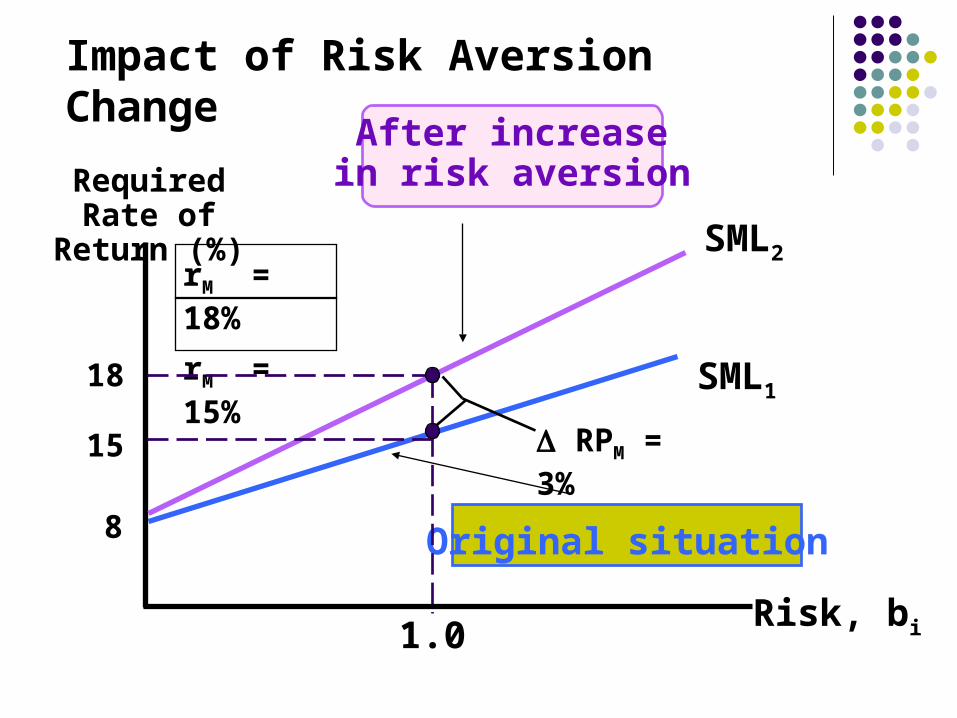
rM = 18%
rM = 15%
SML1
Original situation
Required Rate of Return (%)
SML2
After increasein risk aversion
Risk, bi
18
15
8
1.0
RPM = 3%
Impact of Risk Aversion Change
Has the CAPM been completely confirmed or refuted through empirical tests?
No. The statistical tests have problems that make empirical verification or rejection virtually impossible. Investors’ required returns are based on future
risk, but betas are calculated with historical data.
Investors may be concerned about both stand-alone and market risk.
FUTURE VALUE PRESENT VALUE ANUITY PERPETUITIES COMPOUNDING DISCOUNTING
CHAPTER 2Time Value of Money
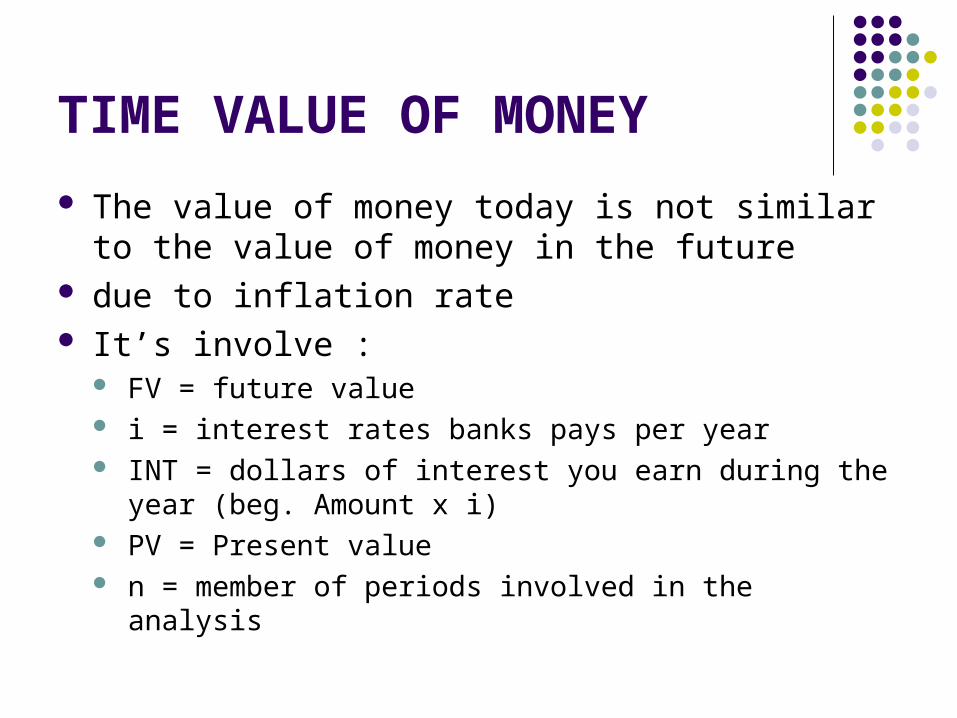
TIME VALUE OF MONEY
The value of money today is not similar to the value of money in the future
due to inflation rate It’s involve :
FV = future value i = interest rates banks pays per year INT = dollars of interest you earn during the year (beg.
Amount x i) PV = Present value n = member of periods involved in the analysis
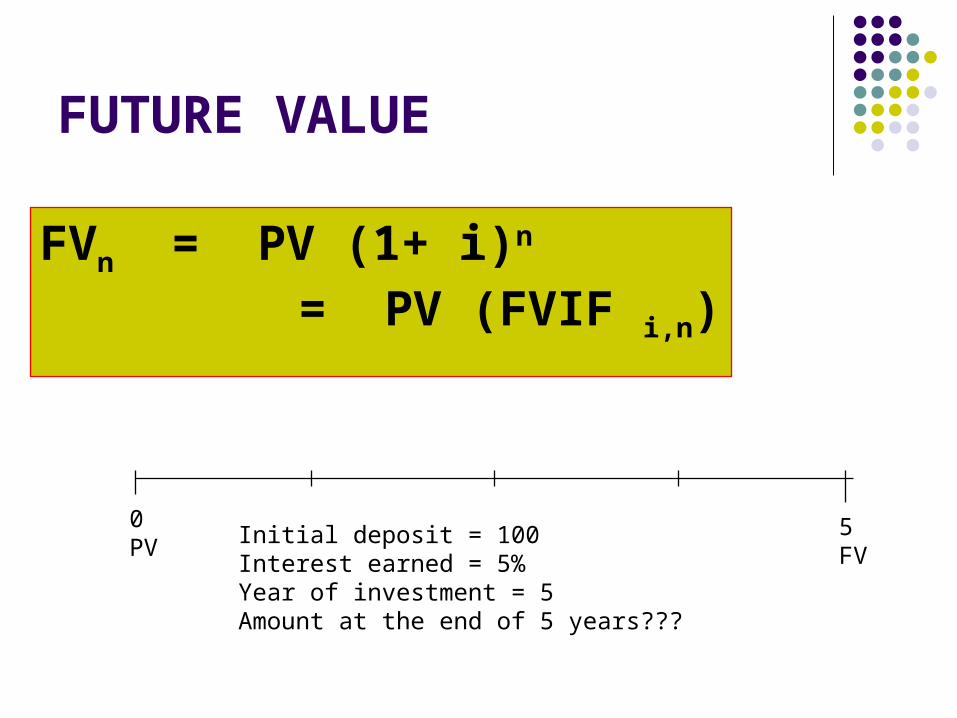
FUTURE VALUE
Initial deposit = 100Interest earned = 5%Year of investment = 5Amount at the end of 5 years???
0PV
5FV
FVn = PV (1+ i)n
= PV (FVIF i,n)
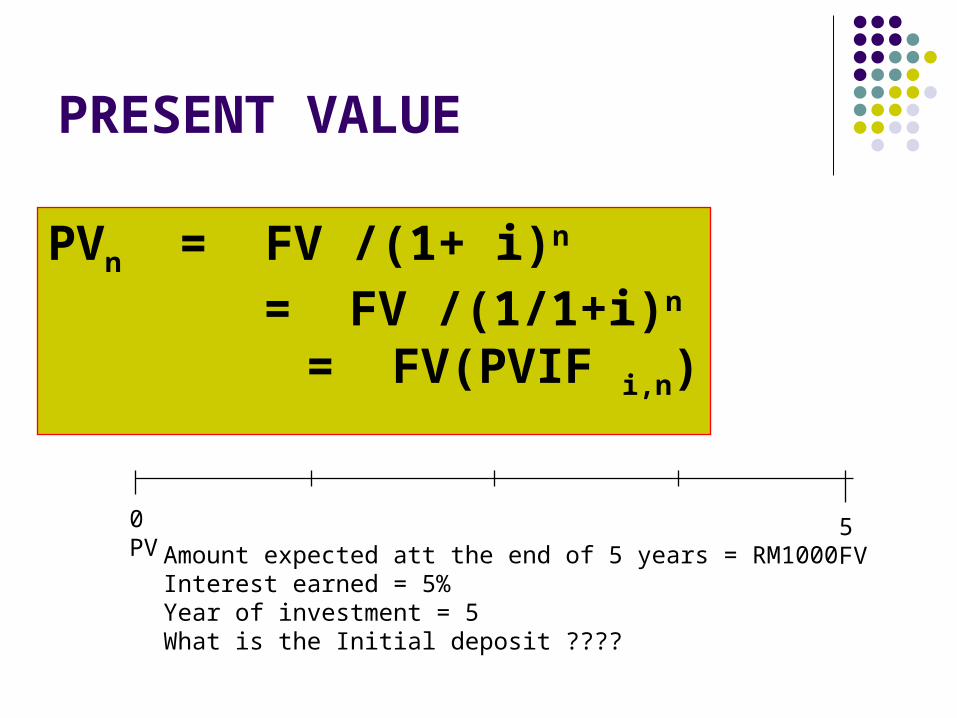
PRESENT VALUE
Amount expected att the end of 5 years = RM1000Interest earned = 5%Year of investment = 5What is the Initial deposit ????
0PV
5FV
PVn = FV /(1+ i)n
= FV /(1/1+i)n
= FV(PVIF i,n)
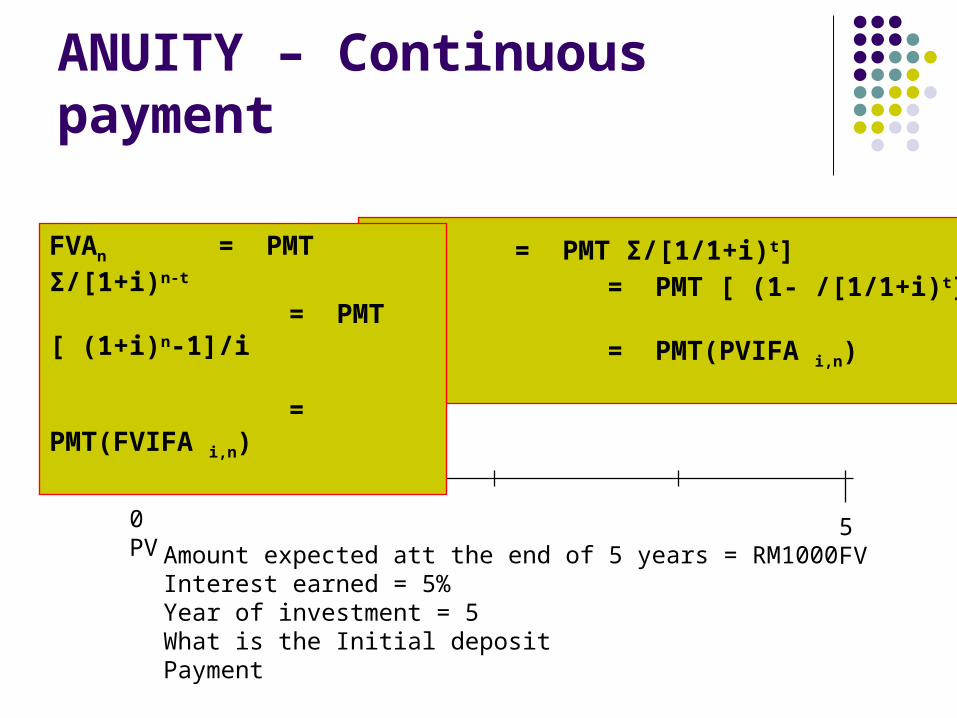
ANUITY – Continuous payment
Amount expected att the end of 5 years = RM1000Interest earned = 5%Year of investment = 5What is the Initial deposit Payment
0PV
5FV
PVAn = PMT Σ/[1/1+i)t] = PMT [ (1- /[1/1+i)t]/i
= PMT(PVIFA i,n)
FVAn = PMT Σ/[1+i)n-t
= PMT [ (1+i)n-1]/i
= PMT(FVIFA i,n)
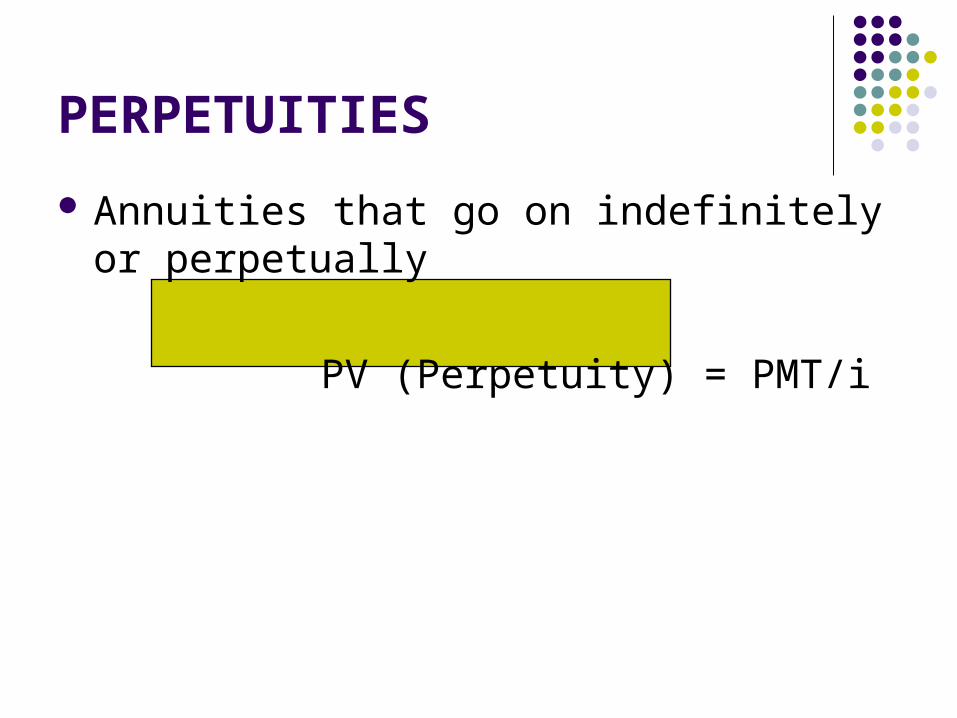
PERPETUITIES
Annuities that go on indefinitely or perpetually
PV (Perpetuity) = PMT/i