(the basics garland science )m. j. mcpherson, s. g. moller-pcr (the basics (garland science))-taylor...
TRANSCRIPT


PCRSecond Edition


PCRSecond Edition
Michael J. McPhersonInstitute of Molecular and Cellular Biology, Faculty of Biological Sciences,University of Leeds, Leeds, UK
and
Simon Geir MøllerFaculty of Science and TechnologyDepartment of Mathematics and Natural SciencesUniversity of StavangerN-4036 StavangerNorway

Published by:Taylor & Francis Group
In US: 270 Madison AvenueNew York, N Y 10016
In UK: 4 Park Square, Milton ParkAbingdon, OX14 4RN
© 2006 by Taylor & Francis Group
First published 2000; Second edition published 2006
ISBN: 0-4153-5547-8 (Print edition)
This book contains information obtained from authentic and highly regarded sources. Reprinted material isquoted with permission, and sources are indicated. A wide variety of references are listed. Reasonableefforts have been made to publish reliable data and information, but the author and the publisher cannotassume responsibility for the validity of all materials or for the consequences of their use.
All rights reserved. No part of this book may be reprinted, reproduced, transmitted, or utilized in any formby any electronic, mechanical, or other means, now known or hereafter invented, including photocopying,microfilming, and recording, or in any information storage or retrieval system, without written permissionfrom the publishers.
A catalog record for this book is available from the British Library.____________________________________________________________________Library of Congress Cataloging-in-Publication data has been applied for.
Editor: Elizabeth OwenEditorial Assistant: Kirsty Lyons Production Editor: Karin HendersonTypeset by: Phoenix Photosetting, Chatham, Kent,UKPrinted by: MPG BOOKS Limited, Bodmin, Cornwall, UK
Taylor & Francis Groupis the Academic Division of Informa UK Limited Visit our web site at http://www.garlandscience.com
This edition published in the Taylor & Francis e-Library, 2006.
“To purchase your own copy of this or any of Taylor & Francis or Routledge’scollection of thousands of eBooks please go to www.eBookstore.tandf.co.uk.”
ISBN 0-203-00267-9 Master e-book ISBN

Contents
Abbreviations ixPreface xi
Chapter 1 An Introduction to PCR 11.1 Introduction: PCR, a ‘DNA photocopier’ 11.2 PCR involves DNA synthesis 11.3 PCR is controlled by heating and cooling 31.4 PCR applications and gene cloning 51.5 History of PCR 6
Chapter 2 Understanding PCR 92.1 How does PCR work? 92.2 PCR: a molecular perspective 112.3 The kinetics of PCR 152.4 Getting started 182.5 Post-PCR analysis 18Protocol 2.1: Basic PCR 20
Chapter 3 Reagents and Instrumentation 233.1 Technical advances in PCR 233.2 Reagents 233.3 PCR buffers 233.4 Nucleotides 253.5 Modified nucleotides 253.6 PCR premixes 263.7 Oligonucleotide primers 263.8 DNA polymerases for PCR 363.9 Early PCR experiments 373.10 Thermostable DNA polymerases 373.11 Properties of Taq DNA polymerase 373.12 Thermostable proofreading DNA polymerases 433.13 Tth DNA polymerase has reverse transcriptase activity 463.14 Red and green polymerases and reagents 473.15 Polymerase mixtures: high-fidelity, long-range and RT-PCRs 483.16 Nucleic acid templates 513.17 Mineral oil 543.18 Plasticware and disposables 543.19 Automation of PCR and thermal cyclers 55Protocol 3.1: Phosphorylation of the 5′-end of an oligonucleotide 63

Chapter 4 Optimization of PCR 654.1 Introduction 654.2 Improving specificity of PCR 654.3 Template DNA preparation and inhibitors of PCR 754.4 Nested PCR improves PCR sensitivity 764.5 Contamination problems 764.6 Preventing contamination 804.7 Troubleshooting guide 82
Chapter 5 Analysis, Sequencing and In Vitro Expression of PCR Products 875.1 Introduction 875.2 Analysis of PCR products 875.3 Verification of initial amplification product 895.4 Direct DNA sequencing of PCR products 935.5 Direct labeling of PCR products and homogenous assays 1015.6 In vitro expression of PCR product 103Protocol 5.1: Cycle sequencing – Applied Biosystems Big Dye terminators 108
Chapter 6 Purification and Cloning of PCR Products 1116.1 Introduction 1116.2 Purification of PCR products 1116.3 Introduction to cloning of PCR products 1156.4 Approaches to cloning PCR products 1176.5 Confirmation of cloned PCR fragments 131Protocol 6.1: Blunt-end polishing of PCR fragments 134Protocol 6.2: PCR screening of bacterial colonies or cultures 135
Chapter 7 PCR Mutagenesis 1377.1 Introduction 1377.2 Inverse PCR mutagenesis 1387.3 Unique sites elimination 1447.4 Splicing by overlap extension (SOEing) 1447.5 Point mutations 1507.6 Deletions and insertions 1517.7 Deletion mutagenesis 1517.8 Insertion mutagenesis 1517.9 Random mutagenesis 1577.10 PCR misincorporation procedures 1597.11 Recombination strategies 1607.12 RACHITT 1667.13 Gene synthesis 166Protocol 7.1: Inverse PCR mutagenesis 171Protocol 7.2: Quikchange mutagenesis of plasmid DNA 173Protocol 7.3: Splicing by overlap extension (SOEing) 175Protocol 7.4: ‘Sticky-feet’ mutagenesis 177
vi Contents

Protocol 7.5: DNA shuffling 179Protocol 7.6: Gene synthesis 182
Chapter 8 Analysis of Gene Expression 1858.1 Introduction 1858.2 Reverse transcriptase PCR (RT-PCR) 1858.3 Semi-quantitative and quantitative RT-PCR 1898.4 One-tube RT-PCR 1948.5 Differential display 1948.6 PCR in a cell: in situ RT-PCR 1988.7 Microarrays 2048.8 RNA interference (RNAi) 205Protocol 8.1: Reverse transcriptase reaction 208
Chapter 9 Real-Time RT-PCR 2099.1 Introduction 2099.2 Basic principles of real-time RT-PCR 2099.3 Detection methods 2129.4 General guidelines for probe and primer design 2219.5 Instruments and quantification of results 2229.6 Normalization and control selection 2259.7 A typical real-time RT-PCR experiment using SYBR® Green I 2259.8 Common real-time RT-PCR pitfalls 2289.9 Applications of real-time RT-PCR 229
Chapter 10 Cloning Genes by PCR 233A Cloning genes of known DNA sequence 23310.1 Using PCR to clone expressed genes 23310.2 Express sequence tags (EST) as cloning tools 23710.3 Rapid amplification of cDNA ends (RACE) 238B Isolation of unknown DNA sequences 24010.4 Inverse polymerase chain reaction (IPCR) 24010.5 Multiplex restriction site PCR (mrPCR) 24310.6 Vectorette and splinkerette PCR 24410.7 Degenerate primers based on peptide sequence 248Protocol 10.1: 5′-RACE 253Protocol 10.2: Inverse PCR from plant genomic DNA 255
Chapter 11 Genome Analysis 25711.1 Introduction 25711.2 Why map genomes? 25811.3 Single-strand conformation polymorphism analysis (SSCP) 25911.4 Denaturing-high-performance liquid chromatography
(DHPLC) 26311.5 Ligase chain reaction (LCR) 26411.6 Amplification refractory mutation system (ARMS) 264
Contents vii

11.7 Cleaved amplified polymorphic sequence analysis (CAPS) 26711.8 SNP genotyping using DOP-PCR 26811.9 Random amplified polymorphic DNA (RAPD) PCR 26911.10 Amplified fragment length polymorphisms (AFLPs) 27011.11 Multiplex PCR analysis of Alu polymorphisms 27011.12 Variable number tandem repeats in identity testing 27111.13 Minisatellite repeat analysis 27411.14 Microsatellites 27611.15 Sensitive PCR for environmental and diagnostic applications 27711.16 Screening transgenics 278
viii Contents

8-MOP 8-methoxypsoralen8-oxo-dGTP 8-oxo-2′deoxyguanosineAFLP amplified length
polymorphismAMV avian myeloblastoma virusAP alkaline phosphataseAP-PCR arbitrarily primed PCRARMS amplification refractory
mutation systemASA allele specific amplificationASP allele-specific PCRBAC bacterial artificial
chromosomeBCIP 5-bromo, 4-chloro, 3-
indolyl phosphateCAPS cleaved amplified
polymorphic sequenceanalysis
CcdB control of cell deathCt threshold cycleCCD charge coupled device cDNA complementary DNACT comparative threshold DHPLC denaturing-high-
performance liquidchromatography
DIG digoxigeninDIG-dUTP digoxigenin-11-2′-
deoxyuridine-5′-triphosphate
DOP-PCR degenerate oligonucleotideprimed-PCR
dPTP 6-(2-deoxy-β-D-ribofuranosyl)-3,4-dihydro-8H-pyrimido-[4,5-C][1,2]oxazin-7-one
ELISA enzyme linkedimmunosorbent assay
EST expressed sequence tagFAM 6-carboxyfluoresceinFDD fluorescent differential
display
FRET fluorescence resonanceenergy transfer
FS fluorescent sequencingGAPDH glyceraldehyde-3-phosphate
dehydrogenaseGAWTS gene amplification with
transcript sequencingGM genetically modifiedHEX 4,7,2′,4′,5′,7′-hexachloro-6-
carboxyfluoresceinHRP horseradish peroxidaseIPCR inverse polymerase chain
reactionLCR ligase chain reactionLIC ligation-independent
cloningM-MLV Moloney murine leukemia
virusMPSV mutations, polymorphisms
and sequence variants mrPCR multiplex restriction site
PCRMVR minisatellite variant repeatNBT nitro blue tetrazoliumNF nonfluorescent nt nucleotidesORFs open reading framesPAGE polyacrylamide gel
electrophoresis PASA PCR amplification of
specific alleles PBS phosphate buffered salinePCR polymerase chain reactionPCR-VNTRs PCR highly polymorphic
variable number tandemrepeats
PEETA Primer extension,Electrophoresis, Elution,Tailing, Amplification
PMBC peripheral bloodmononuclear cells
PMT photomultiplier tube
Abbreviations
PNA peptide nucleic acidPORA NADPH:
protochlorophyllideoxidoreductase
RACE rapid amplification of cDNAends
RACHITT random chimeragenesis ontransient templates
RAPD random amplifiedpolymorphic DNA
RAWIT RNA amplification with invitro translation
RAWTS RNA amplification withtranscript sequencing
RFLP restriction fragment lengthpolymorphism
RISC RNA-induced silencingcomplex
RNAi RNA interferenceRT reverse transcriptaseSDS sodium dodecyl sulfatesiRNAs small interfering RNAsSNPs single nucleotide
polymorphismsSOEing splicing by overlap
extensionSPA scintillation proximity assaySSCP single strand conformation
polymorphism analysis
StEP staggered extension process
STR short tandem repeatsTAIL-PCR thermal asymmetric
interlaced PCRTAMRA 6-carboxytetramethyl-
rhodamineTBR tris (2,2′-bipyridine)
ruthenium (II) chelateTCA trichloroacetic acidTdT terminal deoxynucleotidyl-
transferaseTEMED N,N,N′,N′-
tetramethylenediamineTET 4,7,2′,7-tetrachloro-6-
carboxy fluoresceinTK thymidine kinase Tm melting temperatureTNF tumor necrosis factor TOPO ligation topoisomerase-mediated
ligationTp optimized annealing
temperatureUNG uracil N-glycosylaseUSE unique site eliminationVNTR variable number tandem
repeatsYAC yeast artificial
chromosome
x Abbreviations

Preface
The concept underlying this book has not changed from the first edition; it is to providean introductory text that is hopefully useful to undergraduate students, graduate studentsand other scientists who want to understand and use PCR for experimental purposes.Although applications of PCR are provided these do not represent a comprehensivecatalogue of all possible PCR applications, but serve to indicate the types of applicationpossible. The main purpose of this new edition of PCR, as for the first edition, is toprovide information on the fundamental principles of the reactions occurring in a PCRtube. Understanding these basic features is essential to fully capitalize upon and adapt thepower of PCR for a specific application. This means that the structure of the book remainssimilar to that of the first edition. The first six Chapters discuss the fundamental aspectsof performing PCR and of analyzing and cloning the products. All these Chapters havebeen updated and additional aspects added where appropriate. In some Sections there isdiscussion of particular enzymes or instruments. However, clearly suppliers are continuallychanging their formulations or designs and so these are provided only to indicate thedifferent types. We recommend checking manufacturers’ literature for new and improvedsystems, particularly when it comes to investing in the purchase of a new PCR instru-ment. In terms of the applications, a new Chapter has been written on real-time PCR,which represents a very sensitive and reliable method for providing information about therelative concentrations of starting template molecules, such as mRNA or genomic genes.The remaining Chapters have been updated and Protocols have been rationalized to retainthose that are likely to be the most useful. We have also removed the list of web addressesof various reagent suppliers. Such lists can quickly become outdated and it is simpler forthe reader to identify the up to date website from a web search engine. We hope that thisbook will provide the basic information required to get scientists started with PCR experi-ments either to use it simply as a routine tool, or as a starting point for developing newand innovative processes.
We thank those who kindly provided figures to illustrate aspects of the book, and LizOwen at Garland Science, Taylor & Francis Group for her persistence in ensuring that wekept working on this volume and finished at least close to one of the deadlines!


An introduction to PCR
1.1 Introduction: PCR, a ‘DNA photocopier’
Does it really work? It is so simple! Why did I not think of it? Thesethoughts were probably typical of most molecular biologists on readingearly reports of the polymerase chain reaction or PCR as it is morecommonly called. PCR uses a few basic everyday molecular biology reagentsto make large numbers of copies of a specific DNA fragment in a test-tube.PCR has been called a ‘DNA photocopier’. While the concept is simple, PCRis a complicated process with many reactants. The concentration oftemplate DNA is initially very low but its concentration increases dramatic-ally as the reaction proceeds and the product molecules become newtemplates. Other reactants, such as dNTPs and primers, are at concentra-tions that hardly change during the reaction, while some reactants, suchas DNA polymerase, can become limiting. There are significant changes intemperature and pH and therefore dramatic fluctuations in the dynamicsof a range of molecular interactions. So, PCR is really a very complexprocess, but one with tremendous power and versatility for DNA manipu-lation and analysis.
In the relatively short time since its invention by Kary Mullis, PCR hasrevolutionized our approach to molecular biology. The impact of PCR onbiological and medical research has been like a supercharger in an engine,dramatically speeding the rate of progress of the study of genes andgenomes. Using PCR we can now isolate essentially any gene from anyorganism. It has become a cornerstone of genome sequencing projects, usedboth for determining DNA sequence data and for the subsequent study ofputative genes and their products by high throughput screening method-ologies. Having isolated a target gene we can use PCR to tailor its sequenceto allow cloning or mutagenesis or we can establish diagnostic tests todetect mutant forms of the gene. PCR has become a routine laboratory tech-nique whose apparent simplicity and ease of use has allowed nonmolecularbiology labs to access the power of molecular biology. There are manyscientific papers describing new applications or new methods of PCR. Manycommercial products and kits have been launched for PCR applications inresearch and for PCR-based diagnostics and some of these will be discussedin later chapters.
1.2 PCR involves DNA synthesis
PCR copies DNA in the test-tube and uses the basic elements of the naturalDNA synthesis and replication processes. In a living cell a highly complexsystem involving many different proteins is necessary to replicate thecomplete genome. In simplistic terms, the DNA is unwound and eachstrand of the parent molecule is used as a template to produce a comple-
1

mentary ‘daughter’ strand. This copying relies on the ability of nucleotidesto base pair according to the well-known Watson and Crick rules; A alwayspairs with T and G always pairs with C. The template strand thereforespecifies the base sequence of the new complementary DNA strand. A largenumber of proteins and other molecules, such as RNA primers, are requiredto ensure that the process of DNA replication occurs efficiently with highfidelity, which means with few mistakes, and in a tightly regulated manner.DNA synthesis by a DNA polymerase must be ‘primed’, meaning we needto supply a short DNA sequence called a primer that is complementary toa template sequence. Primers are synthetically produced DNA sequencesusually around 20 nucleotides long. The DNA polymerase will addnucleotides to the free 3′-OH of this primer according to the normal basepairing rules (Figure 1.1).
2 PCR
Primer
DNApolymerase
Template
Synthesis of new DNA strand
5' 3'
3' 5'
5'
dNTPs
T GT
T
CC
CAA
G
G A
T
T
T
GG
G GA
A
A C
CCC3'
3'
5'
5'
3'
A A A
A A
G G
G
T T
T T TC C
C
Figure 1.1
Primer extension by a DNA polymerase. The primer anneals to a complementarysequence on the template strand and the DNA polymerase uses the templatesequence to extend the primer by incorporation of the correct deoxynucleotide(dNTP) according to base pairing rules.

PCR requires only some of the components of the complex replicationmachinery to copy short fragments of DNA in a simple buffer system in atest tube. Unwinding of the DNA in the cell uses a multi-componentcomplex involving a variety of enzymes and proteins, but in PCR this isreplaced simply by a heating step to break the hydrogen bonds betweenthe base pairs of the DNA duplex, a process called denaturation.
Following template denaturation two sequence-specific oligonucleotideprimers bind to their complementary sequences on the template DNAstrands according to normal base pairing rules (Figure 1.2). These primersdefine the region of template to be copied. DNA polymerase then beginsto add deoxynucleotides to the 3′-OH group of both primers producing newduplex DNA molecules (Figure 1.2). This requirement of DNA polymerasesto use primers to initiate DNA synthesis is critical for the PCR process sinceit means we can control where the primers bind, and therefore whichregion of DNA will be replicated and amplified. If the DNA polymerase waslike an RNA polymerase that does not require a primer then we would haveno way of defining what segment of DNA we wanted to be copied.
At the next heating step the double-stranded molecules, which areheteroduplexes containing an original template DNA strand and a newlysynthesized DNA strand produced during the first DNA synthesis reaction,are now denatured. Each DNA single strand can now act as a template forthe next round of DNA synthesis. As discussed in detail in Chapter 2, it isduring this second cycle of PCR that the first DNA single strand of a lengthdefined by the positions of the primers can be formed. In cycle 3 the firstcorrect length double-stranded PCR products are formed. In subsequentcycles there is then an exponential increase in the number of copies of the‘target’ DNA sequence; theoretically, the number of copies of the targetsequence will be doubled at each PCR cycle. This means that at 100%efficiency, each template present at the start of the reaction would give riseto 106 new strands after only 20 cycles of PCR. Of course the process is not100% efficient, and it is usually necessary to carry out more reaction cycles,often 25 to 40 depending upon the concentration of the initial templateDNA, its purity, the precise conditions and the application for which yourequire the product. The specificity and efficiency of PCR, however, meansthat very low numbers of template molecules present at the start of the PCRcan be amplified into a large amount of product DNA, often a microgramor more, which is plenty for a range of detailed analyses. Of course, thisability to amplify also means that if you happen to contaminate yourreaction with a few molecules of product DNA from a previous reaction, youmay get a false result. This is why performing control reactions is so impor-tant and we will deal with such contamination problems in Chapter 4.
1.3 PCR is controlled by heating and cooling
PCR relies on the use of different temperatures for the three steps of thereaction, denaturation, annealing and extension. A high temperature,usually 94–95°C, is used to denature (separate) the strands of the DNAtemplate. The temperature is then lowered to allow the primers to annealby base pairing to their complementary sequences on the template strands;this temperature varies depending on the primers (see details in Chapter 3).
An introduction to PCR 3

The annealing temperature is important to ensure high specificity in thereaction; generally the higher the annealing temperature the more specificwill be the reaction. A temperature of 55°C is commonly used, but in manycases a higher temperature is better and this can even be as high as 72°Cfor some experiments, leading to a two-temperature PCR cycle. Finally, for
4 PCR
G
5'
5'
5'
3'
3'
3'
3'
3'
5'
5'
5' 3'
3'
5'
3'
Primer 2
dNTPs
Primer 1
Synthesis of new DNA strands defined by primers
TT
T
G
G
G
A
A A
AA
C C
C
CC
C C
C C C C
C C C C
C C C C
C C C C
A A
A A A
A A A
A
A A A A
AA A
G G G
G G G G
G G G
G G G G
G G G G
T T T
T T T
T T T
T T
T T T T
5'
T TG AC
5' 3'
3' 5'DNA denatured andprimers annealed
T T
TTT T
G G
G G G G
C
C C CA A AC
T G GC C CA A AA
Figure 1.2
The first cycle of a PCR. A double-stranded template molecule is denatured.Primers anneal to their complementary sequences on the single-strandedtemplate. DNA synthesis is catalyzed by a thermostable DNA polymerase. Theresult of this PCR cycle is that two copies of the target sequence have beengenerated for each original copy.

efficient DNA synthesis, the temperature is adjusted to be optimal for theDNA polymerase activity, normally 72°C (see Chapter 3). To amplify thetarget DNA it is necessary to cycle through these temperatures several times(25 to 40 depending on the application). Conveniently, this temperaturecycling is accomplished by using a thermal cycler, a programmable instru-ment that can rapidly alter temperature and hold samples at the desiredtemperature for a set time. This automation is one of the importantadvances that led to PCR becoming widely accessible to many scientists andis covered in more detail in Chapter 3. Before thermal cyclers became avail-able, PCR was performed by using three water baths set to temperatures oftypically 95°C, 55°C and 72°C, and reaction tubes in racks were movedmanually between the baths.
The other major technological advance that preceded the developmentof thermal cyclers was the replacement of DNA polymerase I Klenowfragment with thermostable DNA polymerases, such as Taq DNA poly-merase, which are not inactivated at the high denaturation temperaturesused during PCR. The ability to carry out the reaction at high temperaturesenhances the specificity of the reaction (Chapter 4). At 37°C, whereKlenow works best, primers can bind to nontarget sequences with weaksequence similarity, because mismatches between the two strands can betolerated. This leads to poor specificity of primer annealing and the amplifi-cation of many nontarget products. The introduction of thermostable DNApolymerases also reduced the cost of a reaction by reducing the amount ofpolymerase required. With Klenow, at each denaturing step the enzymewas also denatured and therefore a fresh aliquot had to be added at eachcycle. Thermostable polymerases retain their activity at the denaturationtemperatures and therefore only need to be added at the start of thereaction.
1.4 PCR applications and gene cloning
PCR has revolutionized our approach to basic scientific and medicalresearch, to medical, forensic and environmental testing. It provides anextremely flexible tool for the research scientist, and every molecularbiology research laboratory now uses PCR routinely; often adapting andtailoring the basic procedures to meet their own special needs. It hasbecome an indispensable tool for routine and repetitive DNA analyses suchas diagnosis of certain genetic diseases within clinical screening laboratorieswhere speed and accuracy are important factors, and also for sampleidentification in forensic and environmental testing. In particular PCR hasbecome a central tool in the analysis and exploitation of genome sequenceinformation, for example in gene knockout through RNA interferencewhere PCR allows the rapid generation of appropriate constructs. It alsofacilitates measurement of levels of gene expression by ‘real-time’ PCR thatmonitors the level of product amplification at each cycle of the PCR(Chapter 9), providing information on the relative concentrations oftemplate cDNA.
In some cases PCR provides an alternative to gene cloning, but in othercases it provides a complementary tool. In gene cloning a fragment of DNAis joined by ligation to a cloning vector which is able to replicate within a
An introduction to PCR 5

host cell such as the bacterium Escherichia coli. As the bacterium grows, thenew recombinant DNA molecule is copied by DNA replication, and as thecell divides the number of cells carrying the recombinant molecule increases.Finally, when there are enough cells you can isolate the recombinant DNAmolecules to provide sufficient DNA for analysis or further manipulation ofthe cloned DNA fragment. This type of cloning experiment takes about 2–3days. PCR also amplifies your target DNA fragment so that you have enoughto analyze or manipulate, but in this case the DNA replication occurs in atest-tube and usually takes no more than 1–3 hours. In many cases, forexample in diagnostic tests for cancers or genetic diseases, including ante-natal screening, or in forensic testing, PCR provides the most sensitive andappropriate approach to analyze DNA within a day.
For studying new genes and genetic diseases it is often necessary to creategene libraries and this may involve PCR followed by cloning into a suitablevector. Also many experiments to produce proteins to study their structureand function require expression in host cells and this requires the cloningof the gene perhaps as a PCR product, into a suitable expression vector. Soin many cases PCR and gene cloning represent complementary techniques.It is important to consider carefully the most appropriate strategy for theexperiments you wish to undertake. Integrating PCR and cloning will becovered further in Chapter 6 while diagnostic applications of PCR arecovered in Chapter 11.
1.5 History of PCR
As long ago as 1971, Khorana and colleagues described an approach forreplicating a region of duplex DNA by using two DNA synthesis primersdesigned so that their 3′-ends pointed towards each other (1). However, theconcept of using such an approach repeatedly in an amplification formatwas not conceived for another 12 years. ‘Sometimes a good idea comes toyou when you are not looking for it.’ With these words, Kary Mullis, theinventor of PCR, starts an account in Scientific American of how, during anight drive through the mountains of Northern California in Spring 1983,he had a revelation that led him to develop PCR (Mullis, 1990). Mullis wasawarded the 1993 Nobel Prize for Chemistry for his achievement. Thepractical aspects of the PCR process were then developed by scientists atCetus Corporation, the company for which Mullis worked at that time.They demonstrated the feasibility of the concept that Mullis had provided,and PCR became a major part of the business of Cetus, before they finallysold the rights to PCR in 1991 for $300m to Roche Molecular Systems. PCRand the thermostable polymerase responsible for the process were namedas the first ‘Molecule of the Year’ in 1989 by the international journalScience.
Since the myriad of applications of PCR were recognized it has becomerather entangled in commercialism, due to the large amounts of money tobe made from licensing the technology. PCR is covered by patents, grantedto Hoffman La-Roche and Roche Molecular Systems, and these have beenvigorously enforced to prevent unlicensed use of the method. Some of thesepatents terminated on 28 March 2005. From this date it has been possibleto perform basic PCR in the US without a license, although some other
6 PCR

patents still apply to instruments and specific applications. Outside the USin countries covered by the equivalent patents, there is a further year ofpatent protection to run.
Key milestones in the development of PCR
1983 Kary Mullis of Cetus Corp. invents PCR.1985 First paper describing PCR using Klenow fragment of DNA
polymerase I (2).1986 Cetus Corp. and Perkin Elmer Corp. establish a joint venture
company (Perkin Elmer Cetus) to develop both instruments andreagents for the biotechnology research market.
1987 Cetus develop a partnership with Kodak for PCR-based diagnostics,but Kodak terminate this agreement and Hoffman-La Rochebecome the new partner.
1988 First paper describing the use of Taq DNA polymerase in PCR (3).1990 Cetus licence certain reagents companies, namely Promega,
Stratagene, USB, Pharmacia, Gibco-BRL and Boehringer, to sellnative Taq DNA polymerase for non–PCR applications.
1991 Cetus wins court case against DuPont who challenged the CetusPCR patents.
1991 Perkin Elmer Cetus joint venture dissolved as the PCR rights areacquired by Hoffman LaRoche.
1991 Perkin Elmer form a ‘strategic alliance’ with Roche to sell PCRreagents in the research market. Roche continue to develop thediagnostics reagents business. Perkin Elmer assume total respon-sibility for the thermal cycler business.
1991 Cetus is acquired by Chiron Corp. for non-PCR business aspects, inparticular interleukin-2-based pharmaceuticals.
1993 Roche file a lawsuit against Promega for alleged infringement oftheir license to sell native Taq polymerase for non-PCR applications.Action also taken against several smaller companies for selling TaqDNA polymerase without license agreements. These disputesbetween Roche and Promega are still proceeding through the courtsin 2005, and do not look like they will be resolved quickly or easily.
1993 Perkin Elmer merges with Applied Biosystems. The AppliedBiosystems Division of Perkin Elmer assumes responsibility for allDNA products such as DNA synthesis, sequencing and the PCR inaddition to the other products associated with protein sequencingand analysis.
1993 License granted to Boehringer-Mannheim to supply reagents,including Taq polymerase for use in PCR.
1993 Kary Mullis, inventor of PCR, wins a Nobel Prize for Chemistry.1993 + Widespread licensing of PCR technology and Taq DNA polymerases
to a large number of Biological Supplies Companies.1998 Promega Corporation challenges the original patents on native Taq
DNA polymerase and court proceedings continue.2005 March 28 2005 is the date on which several US PCR patents expire:
● 4 683 195 Process for amplifying, detecting and/or cloningnucleic acid sequences;
An introduction to PCR 7
● 4 683 202 Process for amplifying nucleic acid sequences;● 4 965 188 Process for amplifying, detecting and/or cloning
nucleic acid sequences using a thermostable enzyme;● 6 040 166 Kits for amplifying and detecting nucleic acid
sequences including a probe;● 6 197 563 Kits for amplifying and detecting nucleic acid
sequences;● 4 800 159 Process for amplifying, detecting and/or cloning
nucleic acid sequences;● 5 008 182 Detection of AIDS-associated virus by PCR;● 5 176 995 Detection of viruses by amplification and hybridization.
The speed and simplicity of PCR technology accompanied by an increasedrange of high quality products has led to a more rational approach to PCRexperimentation. We understand better the molecular processes underlyingPCR (see Chapter 2) so that it is seen less as a ‘witches’ brew’. It is impor-tant to highlight good practices that increase confidence in results byreducing the likelihood of artefactual results. The importance of good PCRtechnique, particularly with regard to proper controls and the preventionof contamination (Chapter 4) cannot be overemphasized. Remember, if youwork in a research laboratory a wrong result may be inconvenient leadingto a waste of time, effort and money and so should be avoided. But, if youwork in a diagnostic laboratory, a wrong result could mean the differencebetween life and death. It is a good idea to start with the highest standardsand expectations so that you can be confident in your results no matterwhere you work.
PCR has now been adapted to serve a variety of applications and someof these will be described in this book (Chapters 5 to 11).
Further reading
Mullis KB (1990) The unusual origins of the polymerase chain reaction. Sci Am 262:56–65.
White TJ (1996) The future of PCR technology: diversification of technologies andapplications. Trends Biotechnol 14: 478–483.
References
1. Kleppe K, Ohtsuka E, Kleppe R, Molineux R, Khorana HG (1971) Studies onpolynucleotides. XCVI. Repair replication of short synthetic DNA’s as catalysedby DNA polymerases. J Mol Biol 56: 341–346.
2. Saiki RK, Scharf S, Faloona F, Mullis KB, Horn GT, Erlich HA, Arnheim N (1985)Enzymatic amplification of beta-globin genomic sequences and restriction siteanalysis for diagnosis of sickle cell anemia. Science 230: 1350–1354.
3. Saiki RK, Gelfand DH, Stoffel S, Scharf S, Higuchi R, Horn GT, Mullis KB, ErlichHA (1988) Primer-directed enzymatic amplification of DNA with a thermostableDNA polymerase. Science 239: 487–491.
8 PCR

Understanding PCR
This Chapter is designed to provide you with essential information tounderstand what is happening in the PCR tube. We will consider thekinetics of the PCR process during the various stages of the reaction andthen outline a basic protocol as a starting point for many PCR experiments.
2.1 How does PCR work?
PCR proceeds in three distinct steps governed by temperature.
● Denaturation: the double-stranded template DNA is denatured by heat-ing, typically to 94°C, to separate the complementary single strands.
● Annealing: the reaction is rapidly cooled to an annealing temperature toallow the oligonucleotide primers to hybridize to the template. Thesingle strands of the template are too long and complex to be able toreanneal during this rapid cooling phase. During this annealing step thethermostable DNA polymerase will be active to some extent and willbegin to extend the primers as soon as they anneal to the template. Thiscan lead to specificity problems if the annealing temperature is too low(Chapter 4).
● DNA synthesis: the reaction is heated to a temperature, typically 72°Cfor efficient DNA synthesis by the thermostable DNA polymerase.
In the first cycle of PCR each template strand gives rise to a new duplex, asshown in Figure 2.1(A), doubling the number of copies of the target region.Likewise at each subsequent cycle of denaturation, annealing andextension, there is a theoretical doubling of the number of copies of thetarget DNA. If PCR achieved 100% efficiency then 20 cycles would yield aone million-fold amplification of the target DNA (220 = 1 048 572). Of coursePCR is not 100% efficient for a variety of reasons that we will considershortly, but by increasing the number of cycles and optimizing conditionsamplification by 106-fold or greater is routinely achievable.
One of the great advantages of PCR is its ability to amplify a definedregion of DNA from a very complex starting template such as genomicDNA. It is therefore worth dissecting what is happening during PCR ampli-fication from a genomic DNA template as this will provide a betterunderstanding of the reaction process (Section 2.3).
PCR uses two oligonucleotide primers that act as sites for initiation ofDNA synthesis by the DNA polymerase and so these primers define theregion of the template DNA that will be copied (1). DNA polymerases needa primer to begin DNA synthesis and so we need to know at least smallparts of the DNA sequence of the target region in order to be able to designthese primers. The primers (sometimes called amplimers) are comple-mentary to regions of known sequence on opposite strands of the templateDNA and their 3′-OH end points towards the other primer. The primer is
2

10 PCR
(A) The first cycle of a PCR reaction
Double-strandtemplate
Denaturationof template
Annealingof primers
DNA synthesis
Products offirst PCR cycle
Primers
Template
Key
72°C
55°C
95°C
(C) The third cycle of a PCR reaction
Products ofsecond PCR cycle
Denaturationof template
Amplification ofdefined-lengthproduct
72°C
55°C
95°CAnnealingof primers
DNA synthesis
1
2 3
45
6 7
8
1
2
3
4
5
6
7
8
(B) The second cycle of a PCR reaction
95°C
55°C
72°C
Products offirst PCR cycle
Denaturationof template
Annealingof primers
DNA synthesis
Appearance ofdefined lengthproduct
(D) The fourth cycle of a PCR reaction
Products ofthird PCR cycle
Exponentialamplification ofdefined-lengthproduct
1
2
34
56
7
8
×3
×3

extended by the DNA polymerase incorporating the four deoxynucleotides(dATP, dGTP, dCTP and dTTP) in a template-directed manner. The DNAsequence between the two primer binding sites will therefore be replicatedduring each cycle of the PCR. The reaction vessel, a 0.2 ml or 0.5 mlpolypropylene microcentrifuge tube or well of a microtiter plate, is placedin a thermal cycler and subjected to a series of heating and cooling reactionsas outlined in Figure 2.2.
A typical PCR protocol is provided at the end of this Chapter in Protocol2.1 and so you should refer to this as issues are highlighted in the remainderof this Chapter.
At the start of a PCR there is usually an extended denaturation step at94°C for 2–5 min to ensure that the template DNA is efficiently denatured.There are then usually three temperature-controlled steps:
● 94°C to denature the template strands; then● 40–72°C (55°C is often used as a good starting point) to allow the primers
to anneal; then● 72°C, the optimal temperature for many thermostable DNA polymerases
to allow efficient DNA synthesis (2).
These three steps are repeated usually for between 25 and 40 times, asnecessary, for the specific application. Normally there is then an extended72°C step to ensure that all of the products are full-length. Finally thereaction is cooled to either room temperature or 4°C depending upon theapplication and type of thermal cycler used.
2.2 PCR: a molecular perspective
A good way to understand any molecular biology process is to think aboutwhat is going on at the molecular level. Try to imagine what is happeningto the different types of molecules in a reaction tube. Ask yourself questionsabout the reactants and what will happen to these as the reaction proceeds.
● What are the relative concentrations of the various reactants?● Which reactants are present in excess and which are limiting?● What interactions are going on between molecules such as enzymes and
DNA?● What factors will influence these molecular interactions?● What are the activities of the enzyme and how will these modify the
DNA?● What are the products of the reaction and how will their accumulation
affect the reaction?
Understanding PCR 11
Figure 2.1 (opposite)
PCR theoretically doubles the amount of target DNA at each cycle. (A) Cycle 1,products generated from template DNA are not of a defined length. (B) Cycle 2,the first single-strand products of defined length are produced due to priming onsingle-strand products generated during cycle 1. (C) Cycle 3 results in theproduction of the first double-strand products of defined length. (D) Cycle 4 andsubsequent cycles lead to exponential amplification of the defined lengthproducts. In parts C and D the various strands are numbered to enable thetemplates and products to be followed.
It is sometimes useful to think about a single enzyme molecule in thereaction tube and to consider how it works to gain a molecular perspectiveon the reaction.
A genomic DNA template
PCRs are usually performed on template DNA molecules that are longerthan the target region that we wish to amplify. The extreme case is wherewe start with genomic DNA. A key question is ‘How does the DNApolymerase know when it has reached the end of the target region that isto be copied?’ The answer is that it does not know; it therefore carries onsynthesizing new DNA until the temperature of the reaction is increasedduring the denaturing step of the next PCR cycle (see Figure 2.1(A)). If wethink about a simple case where we start with one molecule of genomicDNA, then, after one cycle of PCR we will have the original template strandsand two new strands, initiated from the primers. These new strands will bemuch shorter than the original genomic strands, but will still be longerthan the target region to be amplified. Importantly however, one end ofeach of the new strands now corresponds to a primer sequence. In thesecond cycle, the primers again anneal to the original templates but alsoto the strands synthesized during the first cycle. The DNA polymerase willextend from the primers, and again the original templates will give rise tolonger strands of undefined length. However, on the strands synthesizedduring the first cycle the enzyme will ‘run out’ of template DNA when itreaches the end of the primer sequence incorporated during the first cycle.So, by the end of this second cycle we have produced two single strands of
12 PCR
94
72
55
20
Initialdenaturation Cycle 1 Cycle 2 Cycle 3
D D
A A
S
etc.
Time
Tem
pera
ture
(°C
)
S
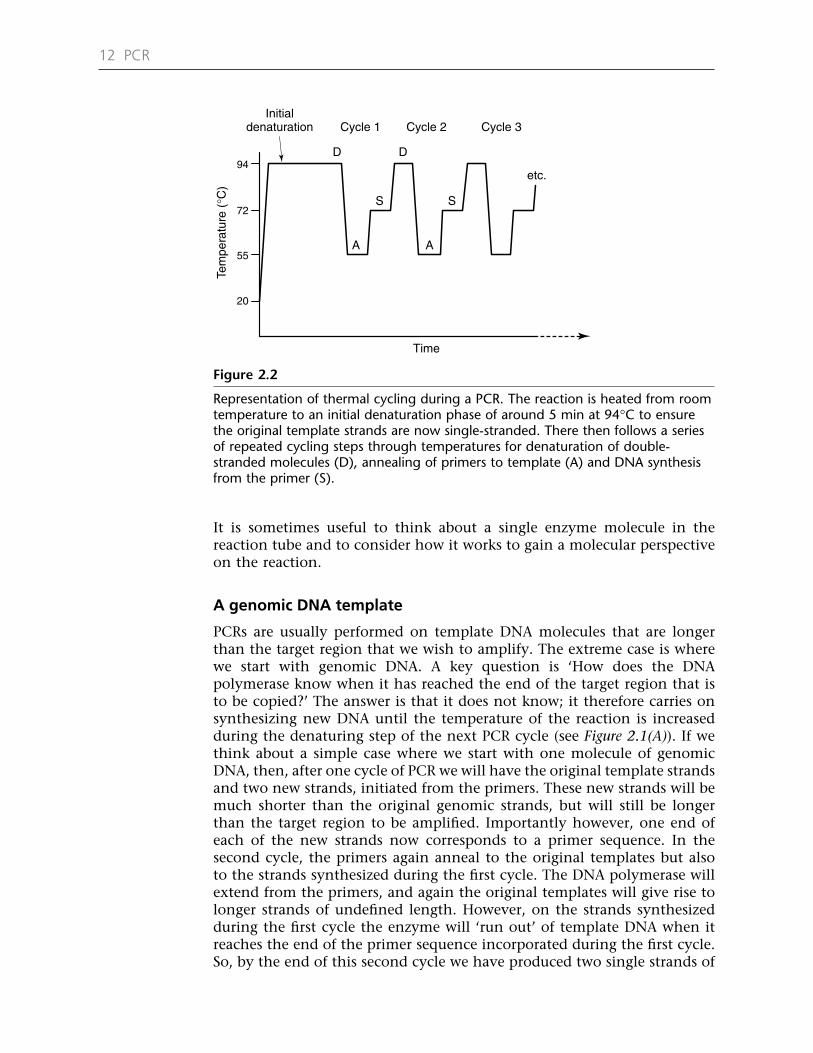
Figure 2.2
Representation of thermal cycling during a PCR. The reaction is heated from roomtemperature to an initial denaturation phase of around 5 min at 94°C to ensurethe original template strands are now single-stranded. There then follows a seriesof repeated cycling steps through temperatures for denaturation of double-stranded molecules (D), annealing of primers to template (A) and DNA synthesisfrom the primer (S).

DNA that correspond to the product length defined by the two primers(Figure 2.1(B)). These defined-length strands are now amplified in eachsubsequent cycle leading to an exponential accumulation of this target PCRproduct. This is illustrated in Figure 2.1(C) and (D) and Table 2.1.
This exponential amplification of the target PCR product contrastsdramatically with the linear accumulation of the longer strands copied fromthe original template molecule. Every PCR cycle produces only two furtherelongated DNA strands for each original template DNA molecule. As youcan also see from Table 2.1 by the end of 20 cycles in an ‘ideal PCR’, forevery original template molecule there will only be 42 single strands of DNAof undefined length, including the two original template strands. So thetheoretical 106 double-strand product molecules of correct length generatedfor each original template duplex are present in vast excess over thesestrands of undefined length.
As illustrated in Table 2.1, amplification at 100% efficiency shouldgenerate some 106 product molecules per original template molecule. So,under these ideal conditions starting with 1 µg of human genomic DNA(around 3 × 10⁵ molecules) a single copy target sequence should theoretic-ally be amplified to yield 3 × 10¹¹ product fragments after 20 cycles. Inpractice, as with most biological reactions, PCR amplification is not 100%efficient, so normally a greater number of cycles (25–40) are performed toachieve these levels of amplification.
Understanding PCR 13
Table 2.1 Theoretical accumulation of PCR products during the first 20cycles of a PCR with a single genomic DNA template
Number of Number of Number ofCycle single strands of single strands of copies of number undefined length defined length double-strand target
0 2 0 1a
1 4 0 22 6 2 43 8 8 84 10 22 165 12 52 326 14 114 647 16 240 1288 18 494 2569 20 1 004 51210 22 2 026 1 02411 24 4 072 2 04812 26 8 164 4 09613 28 16 356 8 19214 30 32 738 16 38415 32 65 504 32 76816 34 131 038 65 53617 36 262 108 131 07218 38 524 250 262 14419 40 1 048 536 524 28820 42 2 097 110 1 048 576a This copy represents the original target DNA which therefore represents two single strandsof undefined length.

14 PCR
Tab
le 2
.2C
once
ntra
tions
of
reac
tant
s an
d p
rodu
cts
befo
re a
nd a
fter
a 3
0-cy
cle
PCR.
Som
e co
mp
onen
ts u
nder
go d
ram
atic
alte
r-at
ions
in c
once
ntra
tion
whi
le o
ther
s sh
ow li
ttle
cha
nge
Con
ditio
ns f
ollo
win
g 30
cyc
les
of P
CR
Initi
al r
eact
ion
cond
ition
s(1
06 -fol
d am
plifi
catio
n)
Ratio
to
Ratio
to
Ratio
to
geno
mic
am
plifi
edRe
agen
tA
mou
ntPi
com
oles
Con
cent
ratio
nte
mp
late
Am
ount
Pico
mol
esC
once
ntra
tion
tem
pla
tefr
agm
ent
Hum
an g
enom
ic D
NA
1 µg
5 ×
10–7
5 fM
11
µg5
×10
–75
fM1
10–6
Targ
et r
egio
n (1
kb)
0.3
pg
5 ×
10–7
5 fM
10.
3 µg
0.5
5 nM
106
1Ea
ch p
rimer
325
ng50
0.5
µM10
832
2 ng
49.5
0.49
5 µM
108
99Ea
ch d
NTP
2.88
µg
5 ×
103
50 µ
M10
102.
78 µ
g4.
8 ×
103
48 µ
M9.
5 ×
109
9.5
×10
3
Taq
DN
A p
olym
eras
e2
units
0.1
1 nM
2 ×
105
2 un
its0.
11
nM2
×10
50.
2

Table 2.2 illustrates the relative concentrations and numbers of moleculespresent in an ideal PCR starting with a human genomic DNA template. Thenumbers at the start of the reaction and then after 20 cycles of amplificationare shown. It is clear that some reactant and product concentrations changesubstantially whilst others do not. It will be useful to refer to Table 2.2during some of the following discussion.
2.3 The kinetics of PCR
We can consider a PCR to have three distinct phases as shown in Figure 2.3:
● E: the early cycles during which the primers search the template DNAfor their complementary sequences, effectively acting like probes in aDNA hybridization experiment;
● M: the mid cycles when the amplification process is well underway withprimer pairs acting together to bring about an exponential accumulationof the product fragment; and
● L: the late cycles, sometimes called the plateau, when amplification issuboptimal due to limiting reagents (most usually the thermostable DNApolymerase) or inhibition of the reaction.
Ideally we want to enhance the specificity of primer selection during E,achieve maximal efficiency of amplification during M and stop the reactionbefore L. Each phase will now be considered in more detail.
The early cycles (E)
For a PCR from genomic DNA we have relatively few copies of the templateand a large number of copies of the two primers that define the target regionto be amplified. If this target represents a unique gene, then for each copyof the haploid genome there will only be one specific binding site for each
Understanding PCR 15
E M L
Increasing number of cycles
Incr
ease
in p
rodu
ct c
once
ntra
tion
Figure 2.3
Kinetics of accumulation of the target product during PCR. E is the early phase ofprimer scanning and initial product formation; M is the middle phase duringwhich product accumulates in an exponential manner; L is the late phase orplateau where product accumulation is suboptimal.

primer, a bit like two needles (some 20 nucleotides in length) searching ina haystack (some 6 × 10⁹ nucleotides). A 1 µg aliquot of human genomicDNA contains 3 × 10⁵ copies of the genome and therefore of the single copytarget sequence. The number of molecules of each primer is around 1.5 ×10¹⁴ so these are present in vast excess over the template. The first task ofthe primers is to find their complementary sequences; in effect they areacting like hybridization probes scanning the genomic DNA for theircomplement and since there are plenty of copies of each primer this searchprocess should not be difficult. In this stage the primers will bindtransiently to random sequences; if the sequence is not complementary tothe primer then it will rapidly dissociate and reanneal elsewhere. The reasonprimers dissociate from nontarget sequences is because the annealingconditions (temperature, Mg2+ ion concentration) favor the formation ofperfectly matched duplexes. During this intensive search a primer will findthe correct complementary sequence and will remain associated to thetemplate in a binary complex for sufficient time for further interaction witha molecule of thermostable DNA polymerase to form a ternary complex. Asthe DNA polymerase will display some DNA synthesis activity even at theannealing temperature, which is normally lower than its optimal activitytemperature, it will initiate DNA synthesis from this primer. This results ina much more stable complex of template and extended primer that will notdissociate when the temperature is raised to 72ºC for optimal DNApolymerase activity. Any primers that are only transiently associated withthe DNA will be denatured from the template as the temperature is raised.
Mispriming
During the annealing phase some of the primers may find alternative siteson the template to which they are partially complementary and to whichthey can bind. Most importantly if their 3′-end is complementary to arandom sequence on the template the primer may remain associated forsufficient time for a DNA polymerase molecule to interact with the duplexregion and initiate DNA synthesis. This is a mispriming or nonspecificpriming event (Chapter 4). The DNA polymerase cannot discriminatebetween a perfectly matched primer–template duplex and one that hassome mismatches. The DNA polymerase acts like a machine; anything thatlooks like a substrate will be used as a substrate. In many cases suchmispriming causes problems during a PCR because the misprimed products,which now have a perfect primer sequence at one end, can interfere withefficient amplification of the true target fragment as described below.
The presence of the primer sequence is obviously critical for successfulamplification of the correct sequence during later cycles of the PCR.However, nontarget products generated by mispriming will also have aprimer sequence associated with it. Of course, not all of these nonspecificmisprimed sequences will be amplified during PCR; amplification can onlyoccur if there is a second priming site for either of the primers, sufficientlyclose to the first site (within a few kb) and on the opposite strand of thetemplate. Nonetheless, a proportion of nonspecific products often fulfillthese criteria and may become amplified, together with, or in preferenceto, the target sequence.
16 PCR

How can you prevent mispriming? The primers should be designed care-fully according to the guidelines outlined in Chapter 3. The annealingtemperature should be selected to be as high as possible so that primers canonly base pair to their perfectly complementary sequence to form a stableduplex. A variety of approaches have been described to improve thespecificity of primer annealing. These include various ‘enhancer’ additives,‘hot start’ and ‘touchdown’ procedures that are dealt with in Chapter 4.Optimizing the annealing temperature by using a gradient thermocycler isalso a useful approach.
Of course there are some cases where conditions are chosen that do allowmismatches between primer and template to be tolerated. For example, inprocedures such as PCR mutagenesis (Chapter 7) it is essential thatmismatched primers can act as templates and so conditions such as primerlength and annealing temperature are adjusted to allow this.
The mid cycles (M) – exponential phase
Following the early cycles of PCR the amplification phase of the reactionbegins. The mid phase of a PCR involves the exponential amplification,ideally with a doubling of the number of copies of the target sequenceselected during the early cycles. As this phase of PCR gets underway theprocess of primer scanning for complementary sites becomes simpler asthere are an increasing number of copies of the target sequence whichcontain the primer binding sites. The rapid accumulation of productfragment continues until the efficiency of this amplification is disturbedand the reaction eventually reaches a plateau. It is important to stop a PCRduring this exponential phase rather than allowing it to reach the plateauphase.
Late cycles (L) – plateau phase
The plateau phase is reached as a consequence of changes in the relativeconcentrations of certain components of the reaction (Table 2.2). Inparticular all the molecules of thermostable polymerase (about 3 × 10¹⁰) willbe engaged in DNA synthesis. If there are a larger number of product strandsthan DNA polymerase molecules then not all DNA strands will be used astemplates for further DNA synthesis during each cycle and thereforeexponential amplification cannot continue. In addition, as product DNAaccumulates and the ratio of primer to product decreases, there is a greatertendency for product strands to anneal thus preventing their use astemplates. Since the products are longer than the primers the annealing ofcomplementary product strands can begin at higher temperatures than forprimer/template annealing therefore product strands can be sequesteredfrom the reaction. It is likely that some nonspecific products will accumu-late. As the true product becomes less available to act as template, due toreannealing, any nonspecific products that have been generated will bepresent at lower concentrations than the true products and therefore canprovide alternative templates for amplification. These nontarget productsmay now accumulate at an exponential rate while the true products willincrease in number more slowly. In some cases, at high product concen-
Understanding PCR 17

trations product strands can anneal to allow self-primed concatamericproducts that are longer than the desired product and can appear as ahigher molecular mass smear on an agarose gel. These features are clearlynonproductive and lead to contamination of the true PCR product withother fragments.
In general you are probably best stopping the PCR after 30–35 cycles. Ifthis was insufficient to generate the desired amount of product, use analiquot of the first PCR as template in a fresh PCR. Of course there areexceptions and some protocols call for more cycles when minute amountsof template are available. For example, in difficult PCR, with a complextemplate present at low concentration, the accumulation of productfragments will occur more slowly. In such cases a greater number of cyclesare needed in order to achieve good amplification before reaching theplateau phase. Some recombination strategies for generating variant librariesof sequences may use up to 60 cycles (Chapter 7) although in general it isbetter to perform no more than 35 cycles during a PCR, and to reamplifyan aliquot. Remember, even when using a proofreading enzyme the greaterthe number of cycles you perform the greater the risk of mutations beingintroduced, so DNA sequencing of products or resulting clones is essential.
2.4 Getting started
Protocol 2.1 outlines a basic PCR procedure that provides a good startingpoint for most applications. You can use any source of template DNA suchas genomic DNA, linear or circular plasmid or phage DNA, and more detailson template sources are given in Chapter 3, which also considers thevarious components of the reaction. This basic protocol often gives verygood results; in other cases it provides evidence for product and so providesa starting point for optimization experiments as described in Chapter 4. Inany PCR it is important that you carry out parallel control experiments asdetailed in Chapter 4. As a minimum these should include setting up PCRtubes with all but one reaction component, specifically one withouttemplate DNA and one without primers. Other controls could includeadding only one of the two primers to check that products are onlygenerated when both primers are present. Remember to set up control reactionslast so that you detect any possible contamination introduced during the set-upof sample tubes.
2.5 Post-PCR analysis
Once the PCR has finished, you need to analyze the products. The usualway of doing this is to size fractionate the DNA through an agarose gel.Examining the gel provides evidence for success or failure.
● Is there a single product band? Is it of the expected size? This would bea good indication of success, but you should confirm this by further PCRanalysis, restriction analysis or DNA sequencing either before or aftercloning.
● Are there several products? Is your product the major band? This mightindicate suboptimal annealing temperature, but certainly suggests a
18 PCR

problem with the PCR. If the major product is likely to be your productyou might isolate this product from the gel and analyze it as above.Alternatively, repeat the PCR by adjusting the conditions to increasestringency.
● Is there a very strong low molecular weight product band? This is usuallyprimer-dimer that results from self-priming of one or both primers togenerate a small product that is very efficiently amplified. It may not bea problem if you are still able to see substantial amounts of your productband. If the intensity of your product band is low, then either repeat thereaction at higher stringency, or redesign one of the primers and checkfor self-complementarity and annealing to the partner primer.
Depending on the success of your first PCR it may be necessary tooptimize the conditions to achieve improved results as described in Chapter4. It will certainly be necessary to confirm the identity of the PCR productto ensure it is the desired sequence to avoid spending time, effort andmoney studying the wrong DNA fragment.
Later, if you are using a routine procedure optimized for amplification ofyour product then there are solution approaches that do not require gelanalysis or real-time PCR that allow you to follow the kinetics of productaccumulation at each cycle of the PCR. The various approaches for PCRanalysis are described in Chapter 5.
Further reading
Kidd KK, Ruano G (1995) Optimising PCR. In McPherson MJ, Hames BD, Taylor GR(eds) PCR2: A Practical Approach, pp. 1–22. Oxford University Press, Oxford, UK.
References
1. Mullis K, Faloona F (1987) Specific synthesis of DNA in vitro via a polymerase-catalyzed chain reaction. Methods Enzymol 155: 335–350.
2. Chien A, Edgar DB, Trela JM (1976) Deoxyribonucleic acid polymerase from theextreme thermophile Thermus aquaticus. J Bacteriol 127: 1550–1557.
Understanding PCR 19

Protocol 2.1 Basic PCR
EQUIPMENTIce bucket
Microcentrifuge
Thermal cycler
Gel electrophoresis tank
MATERIALS AND REAGENTSThermostable DNA polymerase and accompanying 10 × reaction buffer1 (eg. Taq DNApolymerase or KOD DNA polymerase)
2 mM dNTP solution
Oligonucleotide primers
Template DNA
Mineral oil
0.8% agarose (100 ml; 0.8 g agarose in 100 ml 1 × TAE)
1. Add the following components to a 0.5 ml microcentrifugetube:(a) 5 µl 10 × PCR buffer (supplied with enzyme);(b) 5 µl 2 mM dNTPs;(c) 1 µl primer 1 (10 pmol µl–1);(d) 1 µl primer 2 (10 pmol µl–1);(e) template DNA (~ 0.1 pmol of plasmid to 1 µg genomic
DNA);(f) thermostable DNA polymerase (1 unit);(g) water to 50 µl.
Ensure that fresh pipette tips are used for each componentand make additions to fresh sections of the sides of thetube to prevent mixing of components until all reagentsare added2. Set up control tubes in the same way but leav-ing out either DNA or primers.
2. Mix the reagents by centrifuging in a microcentrifuge for 1 s.
3. If the thermal cycler does not have a heated lid, add 50 µl oflight mineral oil to prevent evaporation during thermalcycling.
4. Place the tube in a thermal cycler and program for the follow-ing temperature regime:(a) 94°C3 for 5 min (to denature the template);
20 PCR

(b) 94°C for 1 min4; (c) 55°C6 for 1 min4; repeat 25–35 times7
(d) 72°C for 1 min5; (e) 72°C for 2 min (to ensure all molecules are completely
synthesized).
5. Samples can be left in the thermal cycler and held at roomtemperature or 4°C until you are able to remove them forfurther processing. Generally room temperature is sufficientalthough some protocols may require a low temperature. It isnot a good idea to routinely cool the samples at 4°C forextended periods if this is not necessary as this will reduce thelifetime of the thermal block in the thermal cycler.
6. Remove the tube from the thermal cycler. If the samples areoverlaid with mineral oil, carefully insert a pipette tip underthe layer of mineral oil and remove about 45 µl of the reactiontaking care not to remove any mineral oil.
7. Wipe the outside of the pipette tip with tissue to removemineral oil sticking to the tip then transfer into a fresh tube.
8. Analyze between 5 and 15 µl of the sample on an agarose gelusing suitable DNA molecular size markers as described inChapter 5.
NOTES
1. PCR buffers are generally supplied by the manufacturer whenyou purchase a thermostable DNA polymerase. Check thecomposition of the buffer and specifically whether it containsMgCl2. Magnesium ions are critical for DNA synthesis. Somebuffers will contain MgCl2, typically designed to give a finalconcentration of 1.5 mM in the final PCR. Other buffers willnot contain any MgCl2, but a stock solution will usually besupplied by the manufacturer to allow you to determine theoptimal MgCl2 concentration.
2. If you are setting up several reactions then prepare a premixof any common components to reduce pipetting steps andpotential contamination, as described in Chapter 4. There is auseful online form athttp://www.sigmaaldrich.com/Area_of_Interest/Life_Science/Molecular_Biology/PCR/Key_Resources/PCR_Tools.html, forcalculating the amounts of reagents for premixes. Rememberto add 1 or 2 additional reactions to account for pipettinginaccuracies.
3. The denaturation temperature should be as low as reasonableto denature the template DNA and often 92°C will be effi-cient, although most protocols will recommend 94°C, andmost people use this temperature. For difficult templates, such
Understanding PCR 21

as GC-rich sequences, a higher temperature may be necessary,perhaps 96°C. Also this extended initial denaturation phasemay not be necessary or could be significantly reduced to 1 or2 min in many applications. These measures will extend thefunctional life of the DNA polymerase molecules.
4. The length of incubation times at each step will depend criti-cally on the thermal cycler characteristics. Often short times of10–30 s are sufficient for the denaturation and annealingsteps. In robust PCR screening for thermal cyclers that monitortube temperature (Chapter 3) the incubations can be as shortas 1 s.
5. The time for the extension step is usually based on the rule ofthumb of 1 kb min–1. For shorter products therefore the timecan be reduced, while for longer templates it should beincreased.
6. This annealing temperature of 55°C is a useful starting pointfor many PCRs, but can optimally be between 40 and 72°C,depending upon the primer–template combination.
7. The number of cycles depends upon the complexity andamount of template added. Generally for plasmid templates25 cycles is sufficient whereas for genomic DNA between 30and 35 cycles are usually necessary. It is sometimes helpfulduring a genomic amplification to remove 5 µl aliquots at 30and 35 cycles to compare with the 40-cycle sample to followthe accumulation of the specific band.
22 PCR

Reagents andinstrumentation
3.1 Technical advances in PCR
The major technical advances that have allowed PCR to become such aroutine and accessible tool are:
● thermostable DNA polymerases (Table 3.2; Sections 3.10–3.15);● automation of the temperature cycling process (Section 3.19).
Today PCR is a technically simple operation in which reagents are mixedand incubated in a thermal cycler that automatically regulates thetemperature of the reaction cycles according to a preprogrammed set ofinstructions. The DNA polymerase, being thermostable, need only be addedat the start of the reaction so once you have started your PCRs you can geton with another experiment! This Chapter deals with the reagents requiredfor PCR including buffer components, oligonucleotide primer design,thermostable DNA polymerases and template preparation, before dealingwith thermal cyclers for performing PCR.
3.2 Reagents
Always remember to thoroughly thaw out and mix buffer and dNTPsolutions. If you only partially thaw a solution then differential thawing ofcomponents will mean you are not adding the correct concentrations ofreactants to your PCR. As a routine approach place the tube in an ice bucketsome time before you are going to set up the PCRs. Allow the solution tothaw, vortex briefly, or for a small volume flick the tube with your finger.Place the tube in a microcentrifuge and briefly (1 s) centrifuge to collectthe mixed contents at the bottom. Similarly with enzyme solutions, whichwill not freeze at –20°C due to the glycerol concentration, you should flickthem and spin briefly to mix and collect at the bottom of the tube beforetaking an aliquot to add to your PCRs.
3.3 PCR buffers
Most suppliers of thermostable DNA polymerases provide 10× reactionbuffer with the enzyme. Otherwise the following general 10× bufferproduces good results with Taq DNA polymerase:
● 100 mM Tris-HCl (pH 8.3 at 25°C);● 500 mM KCl;● 15 mM MgCl2;● 1 mg ml–1 gelatin;
3
● 0.1% Tween-20;● 0.1% NP-40.
The buffer solution should be autoclaved prior to addition of the nonionicdetergents (Tween-20 and NP-40), then aliquoted and stored at –20°C. Somebuffer recipes recommend including BSA (bovine serum albumin) at500 µg ml–1.
Tris.HCl
Tris.HCl is a dipolar ionic buffer and the pH of a Tris buffer varies withtemperature so during PCR the pH will vary between about 6.8 and 8.3.In fact Taq DNA polymerase has a higher fidelity at the lower pH valuesthat occur at the higher temperatures of PCR. It has been recommendedthat buffers such as Bis–Tris propane and Pipes would be more usefulfor high fidelity PCR as they have a pKa between pH 6 and 7 and thepH of solutions containing them do not change as significantly withtemperature (1).
KCl
KCl can assist primer–template annealing although at high concentrationsthis can go too far and it may lead to anomalous products through thestabilization of mismatched primers to nontarget sites.
Magnesium
Magnesium is one of the most critical components in the PCR as its concen-tration can affect the specificity and efficiency of the reaction. Taq DNApolymerase is dependent upon the presence of Mg2+ and shows its highestactivity at around 1.2–1.3 mM free Mg2+. Standard PCR buffers, such as theone shown above, contain 1.5 mM MgCl2; however, buffers for enzymessuch as Pwo DNA polymerase (Section 3.12) contain 2 mM MgSO4 and notMgCl2. The free Mg2+ concentration is affected by the dNTP concentration.There is equimolar binding between dNTPs and Mg2+.
For example, if each dNTP were present at a concentration of 200 µM,the total [dNTP] = 800 µM. The free [Mg2+] = 1 500 – 800 = 700 µM and thisis significantly below the optimal concentration for Taq DNA polymerase.However, if each dNTP was present at a concentration of 50 µM, the total[dNTP] = 200 µM. The free [Mg2+] = 1 500 – 200 = 1 300 µM which repre-sents the optimal concentration for Taq DNA polymerase. The magnesiumconcentration can also affect the fidelity (error rate) of DNA polymerases(Section 3.11). With excess magnesium Taq DNA polymerase is more error-prone than at lower concentrations. Protocol 2.1 should represent a goodcompromise between yield and fidelity and is a reasonable starting point.If results are not as expected, then perform a Mg2+ optimization experiment.Note that with proofreading DNA polymerases the dNTP concentrationshould not be lower than 200 µM for each dNTP to guard against nucleaseactivity degrading primers (Sections 3.4 and 3.12).
24 PCR

Suppliers of thermostable polymerases may supply their enzymes with abuffer that lacks magnesium and a magnesium stock solution to allow theuser to optimize the magnesium concentration most appropriate for theirapplication. Do not make the common mistake of assuming that magnesiumis in every buffer supplied. It is also possible to obtain a variety of buffersand additives to optimize conditions for PCR. For example, Stratageneproduce an Opti-Prime™ PCR optimization kit comprising 12 differentbuffers and 6 additives, allowing a range of buffer conditions to be tested.Once optimized conditions have been determined the appropriate buffer canbe purchased separately. Epigene also produce a Failsafe PCR optimizationkit comprising a range of buffers.
3.4 Nucleotides
Stock solutions of dNTPs can be purchased from many commercial sourcesand it is recommended that you use such ready prepared solutions, as theseare quality assured. Stock solutions (100–300 mM) should be stored at–70°C and working solutions should be prepared by diluting stocks tobetween 50 µM and 200 µM of each dNTP in sterile double-distilled water.Because these working solutions should ideally only be stored for 2–3 weeksat –20°C it is recommended that relatively small volumes of workingsolutions are made. It is important for successful PCR that the four dNTPsare present in equimolar concentrations otherwise the fidelity of PCR canbe affected. Similarly, the concentration of dNTPs should be around 50–200µM. If the concentration is higher the fidelity of the process will beadversely affected by driving Taq DNA polymerase to misincorporate at ahigher rate than normal, while if the concentration is lower it may affectthe efficiency of PCR. Protocols often suggest using 200 µM of each dNTP.This amount would be sufficient to synthesize about 10 µg of productalthough the most you are likely to achieve is 2–3 µg. Reducing the concen-tration of dNTPs below 200 µM each is not recommended whenproofreading polymerases are being used as they have a 3′→5′ exonucleaseactivity that will degrade single-stranded DNA molecules such as theprimers (Section 3.12). This activity increases as nucleotide concentrationdecreases. Taq and other thermostable DNA polymerases will usuallyincorporate modified nucleotides into DNA.
3.5 Modified nucleotides
Various modified nucleotides can be incorporated into products during PCRamplifications for various purposes including:
● secondary structure resolution:– 7 deaza-dGTP reduces secondary structure in G-rich regions of DNA
to improve PCR or sequencing;● prevention of contamination:
– dUTP can be used to replace dTTP to provide a substrate for uracilN-glycosylase to allow destruction of previously amplified PCR productsto prevent carryover (Chapter 4);
Reagents and instrumentation 25

● radiolabelling of PCR products:– [α32P]dNTPs;– [α33P]dNTPs;– [α35S]dNTPs;
● nonradioactive labelling of PCR products:– usually the labels are modified forms of dUTP carrying biotin,
fluorescein or digoxigenin and are substituted for some of the dTTPin the reaction mix (for example 50 µM modified dUTP + 150 µMdTTP). Bromodeoxyuridine can also be used;
● DNA sequencing:– ddNTPs as chain terminators in standard sequencing;– fluorescently labeled ddNTPs in fluorescent DNA sequencing
(Chapter 5);● random mutagenesis:
– modified nucleotides eg. dPTP and 8-oxo-dGTP (Chapter 7).
3.6 PCR premixes
Increasingly PCR premixes are becoming available. These contain buffer,dNTPs and Taq DNA polymerase as a premixed reagent at a concentrationthat allows addition of template DNA and primers to produce the finalreaction volume. In some cases the buffers contain no magnesium, allow-ing optimization experiments to be undertaken by addition of magnesiumstocks. It is also possible to obtain custom prepared stocks with desiredconcentrations of reagents, such as magnesium, optimized for your experi-mental procedure. Clearly the use of premixes is highly advantageous forhigh-throughput screening or template preparation applications, particu-larly with the increasing use of automated robotics for reaction set-ups in,for example, clinical screening and genomics laboratories. However, it isalso worth considering the use of premixes for more routine applications.Many manufacturers now provide premix reagents for both standard andreal-time applications available as bulk reagents or prealiquoted into PCRplate format.
3.7 Oligonucleotide primers
Oligonucleotides are widely available and there are many companies (suchas Alpha DNA, Biosource, Bio-Synthesis, Integrated DNA Technologies,Invitrogen, Midland Certified Reagent Company, MWG Biotech, PEBiosystems and Sigma Genosys) that offer low-cost custom synthesis andpurification of your primer sequences within a few days of ordering. Formost PCRs (with the exception of some genomic mapping approaches, suchas RAPD analysis, Chapter 11) you will need two primers of differentsequence that anneal to complementary strands of the template DNA.When you know the DNA sequence of your template it is quite easy todesign suitable primers to amplify any segment that you require. Thereare several computer programs that can be used to assist primer design.Web primer (http://seq.yeastgenome.org/cgi-bin/web-primer); Primer3
26 PCR

(http://frodo.wi.mit.edu/cgi-bin/primer3/primer3_www.cgi); Oligoperfectdesigner (http://www.invitrogen.com/content.cfm?pageid=9716); Fastpcr(http://www.biocenter.helsinki.fi/bi/Programs/fastpcr.htm); Net primer(http://premierbiosoft.com/netprimer/index.html. However, in practicemany people still design primers by following some simple rules.
A primer should:
● be 16–30 nucleotides long, which provides good specificity for a uniquetarget sequence, even with a starting template as complex as humangenomic DNA;
● contain approximately equal numbers of each nucleotide;● avoid repetitive sequences or regions containing stretches of the same
nucleotide as this can lead to ‘slipping’ of the primer on the template;● avoid runs of three or more G or Cs at the 3′-end as this can lead to
mispriming at GC-rich regions;● not be able to form secondary structures due to internal complementarity;● not contain sequences at the 3′-ends that will allow base pairing with
itself or any other primer that it may be coupled with in a PCR; other-wise this can lead to the formation of primer-dimers.
A primer-dimer is the product of primer extension either on itself or on theother primer in the PCR as shown in Figure 3.1. Since the primer-dimerproduct contains one or both primer sequences and their complementarysequences they provide an excellent template for further amplifications. Tomake matters worse smaller products are copied more efficiently (and aprimer-dimer is about as small as you can get!); primer-dimers can dominatethe PCR and sequester primer from the real target on the template DNA.
In many cases the primer sequence does not need to be a perfectcomplement to the template sequence. The region of the primer thatshould be perfectly matched to the template is the 3′-end because this isthe end of the primer that is extended by the DNA polymerase and is there-fore most important for ensuring the specificity of annealing to the correcttarget sequence (Figure 3.2). In general at least the first three nucleotides atthe 3′-end should perfectly match the template with complemarity extend-ing to about 20 bp with a few mismatched bases. The 5′-end of the primeris less important in determining specificity of annealing to the targetsequence and this means it is possible to alter the sequence in somedesirable manner to facilitate subsequent cloning, manipulation, muta-genesis, recombination or expression of the PCR product (Figure 3.2). Acommon modification is to introduce a restriction site so that the ampli-fied product can be cloned into the desired plasmid vector simply andefficiently. A restriction endonuclease site can simply be added close to the5′-end of the primer (Chapter 6) or it can be generated within the primerregion by altering one or more nucleotides (Chapter 7).
Longer additions can be made to the 5′-end of a primer includingpromoter sequences to allow in vitro transcription of the PCR product, orsequences to allow the splicing or joining of PCR products (Chapter 7). Arange of mutations can be introduced into a PCR product by altering thesequence of the primer (Chapter 7). The primers define the region of DNAto be amplified and can be used to tailor the PCR product for subsequentuse.
Reagents and instrumentation 27

28 PCR
5' Primer 3'
3' Primer 5'
Primer–dimer
Figure 3.1
Primer-dimer formation is due to self-priming by one or both primers and can beovercome by careful design of primers to try to ensure they do not havecomplementary 3′-ends. If one or both of the primers in the PCR anneal becausetheir 3′-ends have some complementarity, then during PCR the primers self-primeresulting in a primer-dimer. At the next PCR cycle, each primer-dimer strand canact as a new template resulting in highly efficient amplification of this smallartifact product.
Template
5' Primer3'
Figure 3.2
The 3′-region of a primer is critical for efficient annealing to the correct targetsequence. The 5′-region is less important and can be modified to carry additionalsequences, such as restriction sites or promoter sequences, that are notcomplementary to the template.

Melting temperature (Tm)
You will often see references to the melting temperature of a primer as anindicator of the annealing temperature step during PCR. The Tm is thetemperature at which half the primers are annealed to the target region.There are a number of approaches for calculating Tm. The simplest methodfor primers up to about 20 nucleotides in length is based on adding up thenumber of each nucleotide in the primer then using the formula [1]:
Tm = ((Number of G+C) × 4°C + (Number of A+T) × 2°C) [1]
This formula reflects the fact that G/C base pairs are more stable than A/Tbase pairs due to their greater hydrogen bonding. It can provide a rough guideto choosing primer sequences that have similar Tms. Originally it was devisedfor hybridization assays in 1 M salt, an ionic strength significantly higherthan that used in PCR (2). It is best when designing a pair of primers to tryto match their Tms so that they will have similar annealing temperatures. Itis obviously not very appropriate to use one primer with a Tm of 40°C andanother with a Tm of 68°C, for example. If you use the formula above tocalculate Tm then it is probably best to set the annealing temperature in thefirst PCR to about 5°C below the calculated Tm.
A more accurate formula [2][Q4] that can be used for oligonucleotidesbetween about 15 and 70 nucleotides in length in aqueous solution [3] is:
Tm = 81.5 + 16.6(log10(I)) + 0.41(%G+C) – (600/N) [2]
where I is the concentration of monovalent cations and N is the length ofthe oligonucleotide.
An alternative approach [3] for primers 20–35 nt long is to calculate Tp,
the optimized annealing temperature ± 2–5°C (4):
Tp = 22 + 1.46 ((2× number of G+C) + (number A+T)) [3]
The only region that you need to consider when calculating a Tm (or Tp) isthat part of the primer that will anneal to the template; if you have addeda long tail at the 5′-end then you can forget about this.
As an example let us look at the following primer sequence annealed toits complementary template:
5′-AGTTGCTGAATTCGTGAGTCCCTGAATGTAGTG-3′
| | | | | | | | | | | | | | | | | | | | | | |3′-TAGCTCGCTAGGGTCGGTCCACTCAGGGACTTACATCACGATCGTTTGCAATCCCATA-5′
The primer is designed to contain a tail including the site for the restrictionenzyme EcoRI (GAATTC), shown boxed. This tail does not contribute to thespecificity of the primer annealing to its target sequence and so we onlyneed consider the 20 nucleotides at the 3′-end of the primer when determin-ing the Tm. This region of the primer contains 7Gs, 3Cs, 4As and 6Ts.
According to formula (1), the Tm = (10 (G+C) × 4°C) + (10 (A+T) × 2°C) =60°C. According to formula [2], assuming a standard monovalent ionconcentration of 50 mM (KCl), the Tm = 81.5 + 16.6(log10(0.05 M)) + 0.41(50)– (600/20) = 50.4°C. According to formula [3], the Tp = 22 + 1.46 (20 + 10)= 65.8 ± 2–5°C.
Reagents and instrumentation 29

As you can see there is significant variation in calculated values. Suchcalculations only provide guidelines for the annealing temperature to usein PCR. In practice it is usually necessary to determine the optimum anneal-ing temperature empirically. Ideally you should use the highest annealingtemperature that gives you efficient amplification of the desired productwith the lowest level of nonspecific product. In some cases it is possible toperform two-step PCRs where the annealing temperature of 72°C is also thetemperature for optimum DNA synthesis. The optimization of annealingtemperatures is greatly simplified if you have access to a thermal cycler withgradient heat block facility (Section 3.19).
5¢-end labeling of primers
PCR products can be cloned directly into various vectors, but unless youare performing ligation independent cloning, the primer or PCR productmust be 5′-phosphorylated to allow formation of a phosphodiester bondduring ligase-mediated joining with the vector. When they are chemicallysynthesized primers will not contain a 5′-phosphate group unless this hasbeen requested. Phosphoramidites are available for addition of 5′-phosphate groups during oligonucleotide synthesis but this can beexpensive. In the lab the process of phosphorylating the primer, or indeedthe PCR product, is relatively simple and involves treatment with T4polynucleotide kinase and ATP (Protocol 3.1). The γ-phosphate group ofATP is transferred to the 5′-OH of the unphosphorylated primer. The sameprocess is used to end-label a primer with 32P by transfer from [γ-32P]ATPallowing autoradiographic detection of the PCR product in experimentssuch as DNA shift assays, protein binding site determinations or directanalysis of PCR products. Such a 5′-end label can also be useful fordetermining whether a restriction enzyme has successfully cleaved a PCRproduct (Chapter 6), as the label will be lost from the product uponcleavage.
It is also possible to introduce a number of other labels that facilitate PCRproduct detection, localization, quantification and isolation. A widely usedmethod for labeling primers that is useful not only for detection but also forpurification, is biotinylation. There are now several biotin phosphoramiditereagents that allow simple and convenient 5′-end labeling and these arereadily available from commercial oligonucleotide custom synthesissuppliers and other companies. Biotin can be detected by using streptavidin,which is widely available in a number of forms including enzyme-linkedsystems for nonisotopic detection, and even associated with paramagneticparticles for simple capture and purification of PCR products (Chapters 5and 6).
Another nonisotopic labeling method widely used for nucleic aciddetection is digoxigenin, which can be coupled to primers that aresynthesized with a 5′-AminoLink (Figure 3.3). In addition to their incorpo-ration as end-labels in PCR primers, both biotin and digoxigenin can alsobe incorporated into PCR products as nucleotide analogues during the PCRas described later (Chapter 5).
Fluorescent dye-labeled primers can be produced for use in laser detectionof product accumulation in real time (Chapter 9), in some DNA sequencing
30 PCR

approaches (Chapter 5) and for analysis of genomic polymorphisms(Chapter 11). Again many fluorescent dyes are available in an active esterform, for example N-hydroxysuccinimide (NHS), and can be coupled toAminoLink-oligonucleotides. There are also a variety of fluorescent dyephosphoramidites such as FAM (6-carboxyfluorescein), HEX (4,7,2′,4′,5′,7′-hexachloro-6-carboxyfluorescein), ROX (6-carboxy-X-rhodamine) or TET(tetrachloro-6-carboxyfluorescein) that can be incorporated at the 5′-end ofthe primer during chemical synthesis by a number of oligonucleotide supplycompanies.
Non-nucleosidic phosphoramidites are also now available and can beincorporated into PCR primers. These compounds, such as naphthosine R(www.DNA-techoplogy.dk) (usually two contiguous naphthosines areneeded), are not recognized as normal nucleotides but act to terminate theDNA polymerase. This can result in the production of double-stranded PCRproducts with single-stranded tails that can be subsequently used fordetection or isolation purposes (Figure 3.4).
Reagents and instrumentation 31
O
O O OP
N2HBase
O–
Figure 3.3
Structure of AminoLink attached to the 5′-deoxyribose of an oligonucleotide. Thereactive amine group is separated from the DNA by a spacer.
Non-nucleotide ‘base’
Single-strandtail
Double-strand region
5'
Figure 3.4
Incorporation of a non-nucleosidic phosphoramidite within a primer allows theproduction of a PCR product with a single-strand tail because the DNApolymerase terminates at the non-nucleosidic ‘base’.

Degenerate primers (mixtures of primers)
Primers for PCR are usually a unique sequence designed from the knownDNA sequence of the template. However, for certain applications you maynot know the sequence of the template DNA. This situation normally ariseswhen the gene sequence is not known, but amino acid sequence data areavailable from the protein encoded by the target gene (Chapter 10). In suchcases there are two options. If many genes have been sequenced from thegenome of the organism in question then it is possible to generate a codonusage table or access http://www.kazusa.or.jp/codon/ and to identify thecodons that the organism uses most frequently for each amino acid. Thiswould allow you to generate a ‘best guess’ at the likely DNA sequence thatwould encode the known peptide sequence, so that you could synthesize asingle oligonucleotide sequence as a primer. Of course this assumes that yourguess is reasonably correct. If the gene happens to use different codons fromthose most frequently used by the organism then you risk never amplifyingthe target gene. The second approach is to use a mixture of different oligonu-cleotides where all the possible codons for each amino acid are present. Thedegeneracy of the genetic code means that a single amino acid may beencoded by several possible codons. Thus a given peptide sequence mightbe encoded by several possible DNA sequences and it is necessary tosynthesize a mixture of all the possible DNA sequences of the primer thatcorrespond to the region of peptide sequence. It may however be possibleto combine the two approaches to reduce the complexity of a degenerateprimer mixture by identifying very pronounced codon bias and includingsuch codons as unique rather than degenerate sequences. Such primers arecalled degenerate primers and there is further discussion of their use inChapter 10.
Figure 3.5 illustrates the design of degenerate primers from an amino acidsequence. Two examples are shown that differ in the way positions thatcould be any of the four dNTPs are handled. In the first example (Primer1), a mixed base synthesis is performed with all four dNTPs added to thegrowing oligonucleotide resulting theoretically in 25% of the moleculeshaving an A, 25% G, 25% C and 25% T. In the second example (Primer 2),such positions are substituted by one nucleotide, deoxyinosine (I), whichis capable of pairing with all four bases. This reduces the complexity of theoligonucleotide mixture. Deoxyinosine is a widely used universal basealthough its capacity to pair with the four bases is not equal. Universal bases(5,6) are also available as phosphoramidites for use in primer synthesis thatbase pair equally with all four bases. Although universal bases are useful,care should be taken when using multiple deoxyinosines in that the higherthe degeneracy the more mismatches, ultimately resulting in higher back-ground and nonspecific amplification. Ideally the three nucleotides at the3′-end of the primers should be perfectly matched with the template.
The two main objectives when designing a degenerate primer are to havethe primer as long as possible and to have the lowest possible degeneracy(the number of nucleotides needed to cover all combinations ofnucleotides). This can at times be problematic but by following some simplerules the task is made easier. First, identify an eight to ten amino acidstretch in your protein that is rich in amino acids encoded by only one or
32 PCR

two codons (Met, Trp, Phe, Cys, His, Lys, Asp, Glu, Gln, Asn, Tyr) and thathas no or few amino acids encoded by six codons (Ser, Leu, Arg). Once theamino acid sequence has been defined translate it to nucleotides based onthe respective codons. It can sometimes be useful to translate the sequenceusing the IUPAC symbols for degeneracy (Table 3.1) as you will need thesewhen you order your oligonucleotide from a commercial company. Onceyou have identified a suitable region the primer sequence can be refined toreduce the degeneracy. Degeneracy is calculated by multiplying all thedegeneracy values in the primer together. It is important to remember thatsynthetic oligonucleotides are chemically synthesized in a 3′→5′ directionso it is important to avoid a degenerate position at the 3′ terminal end ofthe primer. If we take Primer 1 in Figure 3.5 as an example, the removal ofthe terminal degenerate nucleotide position from the glycine codon at the3′-end of the primer provides a valuable 3′-GG clamp (Figure 3.5). Anotherway of reducing degeneracy is to make the third nucleotide at the 5′-endof the primer fixed, as tight annealing is less important at the 5′-end. Aninformed decision can be made using codon usage information for theorganism in question. If we apply this rule to Primer 1 in Figure 3.5 thedegeneracy decreases from 256 to 64, which is a huge improvement.
Although Tm calculations have been described earlier in this Section,determining the Tm for degenerate primers is slightly different, bearing inmind that as the primer concentration decreases the Tm also decreases.Over a wide range of primer concentrations the Tm decreases by 1°C foreach two-fold decrease in primer concentration. This implies that if thedegeneracy of a primer is 1000 the melting temperature should be approxi-mately 10°C lower than that calculated without the primer concentrationcorrected. If the specific primer concentration is low due to highdegeneracy this can simply be overcome by increasing the overall primerconcentration.
Although degenerate primers can be designed manually following theabove rules there are several web-based programs (COnsensus-DEgenerateHybrid Oligonucleotide Primers: http://blocks.fhcrc.org/codehop.html andGeneFisher: http://bibiserv.techfak.uni-bielefeld.de/genefisher/) that willdesign your degenerate primers after you input your amino acid sequence.
Primer concentration
The amount of primer that is used in a PCR depends upon the experiment,as the primer to template ratio is an important consideration. Generally,the two primers should be used at equal concentrations and recommended
Reagents and instrumentation 33
Table 3.1 When ordering a degenerate oligonucleotide primer from a commercial companythe following IUPAC symbols for degeneracy are used
IUPAC symbols R Y M K S W H B V D N
Nucleotides A C A G C A A C A A AG T C T G T C G C G C
T T G T GT

amounts vary from 0.1 µM to 1 µM which are equivalent to 5–50 pmol ofeach primer in a 50 µl reaction volume. It has been calculated that at thelower concentration of 0.1 µM for a genomic DNA amplification the primerexcess over template is around 107 (Table 2.2) and remains fairly constantthroughout the PCR because 95% of the primers remain unused after a30-cycle reaction. It is suggested that using high concentrations of primerscan lead to artifacts with increasing likelihood of primer-dimer formationand mispriming on nontarget sequences.
When your primer arrives it should contain information about thequantity that is provided and so it should be straightforward to dissolve thesample in an appropriate volume of water. Of course this may not alwaysbe the case and there may be times when you need to determine theconcentration of an oligonucleotide sample.
To calculate the concentration of an oligonucleotide the formula A260 = εclcan be used.
● A260 is the absorbance at 260 nm of an aliquot of the primer; if necessarydilute the primer so that the absorbance value is within the range0.1–0.8, then multiply the A260 value by the dilution factor. For exampleif you dilute 10 µl of primer into the 1 ml sample, multiply the A260 valueyou measure by 100, because you diluted the original sample 100-foldto make the measurement.
● ε is the molar extinction coefficient (M–1cm–1). You can calculate thisquite precisely or fairly crudely.
34 PCR
Amino acid sequencePossible DNA sequences
A D T E W D G GNNNGCAGACACAGAATGGGACAAAGGANNNN G T G G T G G C C C T T T
Primer 1 Mixed base synthesis (256 different sequences)
GCAGACACAGAATGGGACAAAGG5’ G T G G T G 3’ C C T T
Primer 2 Universal base synthesis (8 different sequences)
GCIGACACIGAATGGGACAAAGG
Figure 3.5
Example of the design of degenerate primers by back-translation from amino acidsequence data. The mixed base synthesis version includes all four nucleotides atpositions of four-fold degeneracy in the Ala and Thr codons and leads to a mixtureof 256 different oligonucleotide sequences in the primer sample. The universalbase option replaces these four-fold degenerate positions with the single basedeoxyinosine or other universal base thereby making the primer sample lesscomplex with only eight different sequences. Both primer samples should becapable of priming on the DNA sequence that encoded the amino acid sequenceshown. Note the 3′-end of the primers corresponds to positions 1 and 2 of the Glycodon which provides two unique 3′-nucleotides.

If you want to be precise then you add up the number of each of thefour nucleotides in the primer and multiply each number by the appro-priate ε value (15 200 for A, 8 400 for T, 12 010 for G and 7 050 for C).For example the 20 mer GTGAGTCCCTGAATGTAGTG would have an ε= (15 200 × 4) + (8 400 × 6) + (12 101 × 7) + (7 050 × 3) = 216 420. Thecrude approach uses an average ε value of 10 600 for each nucleotide inthe sequence, which assumes that each of the four nucleotides arepresent in equal numbers. For the oligonucleotide above this would givea value of 212 000, which is in good agreement with the more precisevalue. Of course if the oligonucleotide contained predominantly G andA or C and T then the agreement would not be as good.
● c is the concentration of the primer (M) that we are trying to calculate.● l is the pathlength (cm) which is usually 1 (one).
So to calculate the primer concentration from c = A260/εl we need to measureA260, calculate ε and know l.
Taking the example of the primer above, if we dilute 10 µl of stocksolution into 1 ml water in a 1 cm pathlength cell and measure anabsorbance of 0.15 we can calculate the concentration of oligonucleotidein the original sample:
c = (0.15 × 100 [the dilution factor])/(216 420 × 1) = 0.000069 M= 69 µM= 69 pmol µl–1
Another way to determine primer concentration is to determine the A260 ofa diluted sample (A260 = 1 = 33 µg ml–1 single-stranded DNA) and combinewith the length of the oligonucleotide N (in this case 20 nt) and molecularmass of an average nucleotide (dNMP; 325 Da). If we take the solutionabove that gives an A260 = 0.15 for a 10 µl sample of the 20-mer diluted into1 ml then this is equivalent to an A260 of 15 (0.15 × 100; the dilution factor)for our stock solution. So by using the formula c = A260 (33 µg/N × 325) wecan calculate the concentration c of the stock solution:
c = (0.15 × 100) × (33 µg/ (20 × 325)) = 15 × 0.005 = 0.076 µmol ml–1
= 76 nmol ml–1
= 76 pmol µl–1
This value is in reasonable agreement with the 69 pmol µl–1 value determinedfrom the extinction co-efficients. The solution can be diluted to give a workingstock of perhaps 10 µM (10 pmol µl–1). If you are going to repeatedly use aparticular primer pair together, then it can be useful to mix these as a workingstock. Be careful when handling stock primer solutions that you do not con-taminate the stock with another primer or any extraneous DNA (Chapter 4).
Other useful conversion factors for primers include:
● calculation of pmol to ng = (no. of pmol × N × 325)/1 000for example, 2.5 pmol of a 20-mer = (2.5 × 20 × 325)/ 1 000
= 16.3 ng● calculation of ng to pmol = (ng × 1 000)/(N × 325)
for example 70 ng of the 20-mer = (70 × 1 000)/(N × 325)= 10.8 pmol
Reagents and instrumentation 35
Primer stocks
Oligonucleotides will usually arrive either in a dried-down state, in aqueoussolution, or in ammonia, depending upon your supplier. Commercialsuppliers are most likely to supply dried or aqueous solution stocks whilein-house facilities may provide ammonia solutions. Redissolve the oligo-nucleotides to an appropriate concentration, perhaps 10–100 pmol µl–1 inwater or 10 mM Tris-HCl, pH 8.0, and take a sample for use as a working stockwhile storing the remainder at –20 or –70°C, or by re-drying and storing in adried state. If the stock arrives in aqueous solution then deal with it similarly.If it arrives in ammonia, then store the stocks at –20°C, remove an aliquot,dry it down in a centrifugal vacuum dryer then redissolve in water or 10 mMTris-HCl (pH 7.5–8) as for example a 10–100 pmol µl–1 working stock solution.Working stock solutions may be stored for many weeks at –20°C.
3.8 DNA polymerases for PCR
During DNA synthesis the DNA polymerase selects the correct nucleotideto add to the primer to extend the DNA chain according to the standardWatson and Crick base pairing rules (A:T and G:C).
Two classes of DNA polymerase are commonly used according to thetemplate they copy:
● DNA-dependent DNA polymerases;● RNA-dependent DNA polymerases also called reverse transcriptases.
A DNA polymerase always catalyses the synthesis of DNA in the 5′→3′direction. Some DNA polymerases also have a 3′→5′ exonuclease activity,called a ‘proofreading’ activity which ‘checks’ that the correct base has beenadded to the growing DNA strand. When an incorrect nucleotide isincorporated the proofreading activity will remove the incorrect base sothat the synthesis activity can incorporate the correct base. This correctionmechanism increases the accuracy, or fidelity, with which the polymerasecopies the template strand. We will consider the fidelity of the polymerasereaction in Section 3.11 when we consider Taq DNA polymerase.
When different DNA polymerases are being compared, there are twooverall properties that are important for PCR; the fidelity and the efficiencyof synthesis. The efficiency is a consequence of processivity and rate ofsynthesis; although it can be difficult sometimes to distinguish betweenthese aspects. Processivity is a measure of the affinity of the enzyme for thetemplate strand. The stronger the interaction, the more processive thepolymerase should be, and so the more DNA it will synthesize before itdissociates from the template. A DNA polymerase molecule dissociates fromthe template quite often, perhaps after copying as few as 10 bases, or asmany as 50 or 100. After a DNA polymerase molecule dissociates, the 3′-endof the newly synthesized DNA strand is a substrate for another DNApolymerase molecule which can associate with the template and synthesizeanother stretch of DNA. This process continues until the complete DNAstrand has been synthesized. The rate of synthesis or speed at which apolymerase copies the template, usually measured as nucleotides incorpo-rated per second, also varies. Some enzymes incorporate only 5–10 nt s–1
36 PCR

while others incorporate more than 100 nt s–1. The properties of some DNApolymerases commonly used in PCR are compared in Table 3.2.
3.9 Early PCR experiments
The first PCR experiments used the Klenow fragment of DNA polymerase I(Klenow fragment) from E. coli, an enzyme still widely used in molecularbiology experiments. The Klenow fragment has two enzyme activities,5′→3′ DNA synthesis activity and 3′→5′ exonuclease (proofreading)activity. Although PCR using the Klenow fragment was successful inamplifying DNA it had severe drawbacks:
● the operator had to be present throughout the reaction to add regularlyfresh Klenow fragment as the high temperature used for the denatura-tion step also denatured the enzyme, so an aliquot had to be added ateach 37°C DNA synthesis step;
● due to this continual addition, large amounts of Klenow fragment wererequired, making the process expensive;
● the low temperature of 37°C needed for the DNA synthesis steps led toefficient amplification of nontarget regions of DNA because primerscould anneal to nontarget regions.
You can probably imagine how boring and tedious this early process musthave been. Only a few reactions could be performed at any one time andas you probably know, if you carry out any sort of monotonous task it isquite easy for your mind to wander and to make a mistake – such as incubat-ing the tubes at the wrong temperature, or forgetting to add enzyme!
3.10 Thermostable DNA polymerases
Taq DNA polymerase, from the thermophilic bacterium Thermus aquaticus,was first described by Brock and Freeze in 1969 (7) but was not widely useduntil the need for such an enzyme arose for PCR. The stability of Taq DNApolymerase at the high temperatures used in PCR allowed repeated ampli-fication cycles following the single addition of enzyme at the start of thereaction. The enzyme displays an optimum temperature for DNA synthesisof around 72–75°C. As high temperatures (55–72°C) can be used during theprimer annealing steps the added bonus is improved specificity of primerannealing leading to greater amplification of target sequences and lessamplification of nontarget sequences.
3.11 Properties of Taq DNA polymerase
Taq DNA polymerase is a 94 kDa protein that has two catalytic activities:
● 5′→3′ DNA polymerase with a processivity of 50–60 nucleotides and anextension rate of around 50–60 nt s–1, corresponding to around 3 kbmin–1 at 72°C; and
● 5′→3′ exonuclease.
Reagents and instrumentation 37

Tab
le 3
.2Pr
oper
ties
of s
ome
ther
mos
tabl
e D
NA
pol
ymer
ases
5’→
3’3’
→5’
Er
ror
rate
Reve
rse
DN
AM
agne
sium
Exte
nsio
nex
onuc
leas
eex
onuc
leas
ep
er b
p
tran
scrip
tase
term
ini o
fio
n En
zym
eSu
pp
liera
Hal
f-lif
ePr
oces
sivi
tyra
te n
t s–1
activ
ityp
roof
read
ing
activ
ityp
rodu
cts
optim
um
95°C
97.5
°C10
0°C
Taq
PE-A
B40
min
10 m
in<5
min
50––
6075
Yes
No
1 ×
104
Wea
k3’
-A1.
5–4
mM
Stof
fel
PE-A
B80
min
20 m
in5–
10>5
0N
oN
oW
eak
3’-A
2–10
mM
Tth
Vario
us20
min
2 m
in30
–40
>33
Yes
No
Yes
3’-A
b1.
5–2.
5 m
MVe
nt™
NEB
400
min
1.8
h7
>80
No
Yes
4 ×
105
>95%
blu
nt(N
o fo
r ex
o–)
Dee
pVe
nt™
NEB
1380
min
8 h
No
Yes
�Ve
nt>9
5% b
lunt
(No
for
exo–
)Pf
uST
RA12
0 m
in60
No
Yes
1.6
×10
6
(No
for
exo–
)Pw
oRo
che
>2 h
No
2 m
MM
gSO
4
UlT
ma™
PE-A
B50
min
No
Yes
10Bl
unt
AC
CU
ZYM
EBi
olin
eYe
s2
×10
6Bl
unt
2 m
M M
gSO
4+
up t
o 2
mM
MgC
l2
BIO
-X-A
CT
Biol
ine
Yes
~1 ×
106
3’-A
KDD
HiF
iN
ova
>300
120
No
Yes
2 ×
106
Blun
t2.
5 m
M M
gCl2
aPE
-AB,
Per
kin
Elm
er-A
pp
lied
Bios
yste
ms;
NEB
, N
ew E
ngla
nd B
iola
bs;
STRA
, St
rata
gene
; Ro
che,
Roc
he M
olec
ular
Sys
tem
s; B
iolin
e; N
OVA
, N
ovge
n.b
rTth
DN
A P
olym
eras
e X
L fr
om P
E Bi
osys
tem
s is
rep
orte
d no
t to
add
a 3
’-A
.

The enzyme has a half-life of around 40 min at 95°C that equates to some50 cycles under standard PCR conditions. It does not have a 3′→5′ exo-nuclease ‘proofreading’ activity which means that errors made by thepolymerase activity can not be corrected, an aspect we will return to whenwe consider fidelity of polymerases later in this section. Taq DNA poly-merase is a good general purpose enzyme for many routine PCRapplications and is capable of amplifying products up to 2–4 kbp quite effi-ciently. The use of DNA polymerase mixtures can reduce the apparent errorrate of Taq DNA polymerase and can result in longer products being gener-ated (Section 3.15).
Commercial sources of Taq DNA polymerases
Many companies sell Taq DNA polymerase under a variety of commercialnames under license from Hoffman LaRoche who hold the patent rights tothe use of the enzyme for PCR. These include Clontech, Eppendorf,Fermentas Invitrogen, New England Biolabs, Promega, Qbigene, Qiagen,Sigma Aldrich and Stratagene. Technically any enzyme that is not soldunder license should not be used for PCR amplification of DNA. However,legal processes take some considerable time to reach a final conclusion.Promega Corporation have challenged the original patents on Taq DNApolymerase which may therefore eventually be revoked. Several companieshave developed new sources of thermostable DNA polymerases that are alsosuitable for use in PCR. Patent protection for use of the enzyme expiresshortly.
AmpliTaq®
AmpliTaq® is produced by PE Biosystems and is a recombinant version ofTaq DNA polymerase that is produced in E. coli. Recombinant Taq DNApolymerase production in E. coli facilitates simple recovery of thethermostable enzyme by incorporation of a heating step during purifica-tion. The properties of the enzyme are the same as those given above forTaq DNA polymerase but as it is from a recombinant source the purity andbatch-to-batch reproducibility are higher than for native enzyme. Due tothe bacterial source of the recombinant enzyme it is possible that DNA maybe present in the enzyme preparation and could lead to contamination ofthe PCR. It is recommended that either a native Taq DNA polymerase or asource of AmpliTaq® certified to have low DNA content (AmpliTaq® LD,Perkin-Elmer Applied Biosystems) should be used for PCR with bacterialDNA templates.
AmpliTaq Gold®
This is a modified form of AmpliTaq® that is supplied in an inactive formthat requires a 9–12 min pre-PCR heat step at 94 or 95°C to activate thepolymerase. This enzyme provides a convenient approach to hot-start PCRthat is used to improve the specificity of PCRs and which is covered in more
Reagents and instrumentation 39

detail in Chapter 4. Alternatively it can be activated slowly during PCR tocombine a hot-start approach with time-released PCR. The benefits includeprevention of mispriming and increased yields of the specific product.
Stoffel fragment
The Stoffel fragment of AmpliTaq® DNA polymerase is named after S.Stoffel who was responsible for generating this modified protein. The Stoffelfragment is a 61 kDa protein that lacks the N-terminal 289 amino acidresidues of AmpliTaq® and is also produced as a recombinant protein in E.coli. The Stoffel fragment lacks the 5′→3′ exonuclease activity of AmpliTaq®and is around two-fold more thermostable, which allows PCR to beperformed at higher temperatures leading to more specific primer anneal-ing which may be particularly useful for template DNAs with a high G+Ccontent. Compared with the parent AmpliTaq®, Stoffel fragment is lessprocessive (5–10 nucleotides) but the overall DNA synthesis rate is com-parable (3 kb min–1 at 70°C) and it is very efficient at producing relativelyshort PCR products of less than 500 base pairs. Stoffel fragment works overa broader range of magnesium ion concentrations (2–10 mM) which meansyou do not need to spend so much time optimizing reaction conditions(discussed in Chapter 4). This can also be useful for multiplex reactions(Chapter 11) where more than one set of primers are being used simul-taneously. The Stoffel fragment also works best in a lower ionic strengthbuffer (10 mM KCl) than AmpliTaq (50 mM KCl).
Fidelity of Taq DNA polymerase
For most purposes Amplitaq® or an equivalent recombinant thermostableDNA polymerase represents the most appropriate enzyme for PCR. Onedeficiency however, is the lack of 3′→5′ exonuclease ‘proofreading’ activity.In fact this deficiency has not proved to be as much of a problem as wasoriginally thought and the frequency of base misincorporation, alsoreferred to as accuracy of the DNA polymerase, has been extensively investi-gated and is reported to be of the order of 1 error in every 104 nucleotidesincorporated for base pair changes and 1 in every 4 × 10⁴ for frameshifts.The error rate is the reciprocal of accuracy and provides a measure of themutation rate per base pair duplicated. It is possible to calculate that for a400 bp target fragment amplified 106-fold an error rate of 1 in 104 resultstheoretically in 33% of the product fragments carrying a mutation. Thismutational capacity of Taq DNA polymerase should be considered duringexperimental design to ensure that, should they occur, mutations can beidentified. For example, if a product is cloned for further studies, thenseveral independent clones may need to be sequenced to identify onewithout an error. This is reasonably straightforward when you know theDNA sequence of the wild-type target region. However, if you are amplify-ing a new sequence then you should sequence several clones to derive aconsensus sequence for the target region and allow selection of clones thatrepresent this consensus. Ideally clones should be sequenced fromindependent PCRs to ensure the highest level of certainty that a clonerepresents the wild-type sequence. The rationale is that identical errors are
40 PCR

extremely unlikely to occur in independent PCRs and therefore polymerase-introduced mutations should be more readily identifiable.
There have been several thorough studies of the error rates of a varietyof DNA polymerases used for copying DNA templates. Essentially threemethods have been used to examine this feature: the reversion assay, theforward mutation assay and gradient gel assays. These methods areobviously appropriate for determination of the error rate of any DNApolymerase whether mesophilic or thermophilic, and whether or not theenzyme has a proofreading activity.
Reversion assay
This system has been widely used for assessing polymerase-induced errorrates. It uses an M13mp2 template carrying defined mutation(s) which leadto a known mutant phenotype, in this case colorless plaques. FollowingDNA synthesis of a single-strand region including the mutated site, by theDNA polymerase being examined, the error rate can be assessed by thenumber of reversion events leading to a wild-type phenotype, in this caseblue coloration on indicator plates. The approach has been used to measureboth single-base substitution (8) and single-base frameshift error rates (9).It has been argued that since this method relies upon measuring reversionof specific mutations at only a few sites, it may bias some estimates of errorrate since there can be regions of DNA more prone to or more resistant topolymerase-induced errors.
Forward mutation assay
This system provides a mechanism for assessing the range and frequencyof errors introduced by a DNA polymerase within a DNA sequence (10). Inessence DNA polymerase errors are measured for the synthesis of a single-stranded gap (390 nt) in an otherwise duplex M13mp2 DNA molecule. Thegap is opposite the lacZ region and loss of function is scored as phenotypicoccurrence of colorless or light blue plaques (mutant) compared with darkblue plaques (wild type). Clearly it is also possible to sequence productsfrom both forward and reverse assays which can provide a definitive indi-cation of the number of polymerase-induced errors, including those thatdo not affect phenotype.
Gradient gel analysis
This technique relies upon a polyacrylamide gel assay system that is able todiscriminate between molecules that carry single-base changes, on the basisof their differential mobility through a gel that includes some form ofgradient (11). The target sequence is amplified by PCR and one primer hasa 5′-tail comprising some 40 G and C nucleotides. This results in a duplexproduct with one end comprising a GC duplex that is known as a GC-clamp.This region represents a DNA domain highly resistant to denaturationcompared with the target region to which it is attached. As the targetsequence migrates through the gel and moves into higher denaturant ortemperature it begins to denature and eventually completely denatures
Reagents and instrumentation 41

resulting in a ‘Y-shaped’ DNA where the stalk of the Y is the GC-clamp andthe tails are the single strands of the target region. This Y-shaped moleculebecomes entangled in the gel network and essentially stops migrating. Sincesingle-base changes can dramatically alter the temperature, or denaturantconcentration, at which the target sequence will ‘melt’, there is normally asignificant difference in melting characteristics between a wild type andmutant that differ by only one base pair, leading to good separation on thegel. In the first examples a denaturing gradient (DGGE) was used but thereis now a system that uses a temperature gradient (TGGE). In essence thisapproach relies upon detecting the total radioactivity associated with wild-type molecules and with those in regions of the gel which carry mutation(s).It then becomes possible to calculate the fidelity from the formula:
f = HeF/(b × d)
where f = errors per bp incorporated/duplication;HeF = heteroduplex fraction (the fraction of molecules carrying mutations;i.e. not running as wild type in the gel);b = length of single-strand DNA being measured (does not include the GCanchor); andd = number of DNA duplications.
Alternatively denaturing HPLC can be used. This is a technique increas-ingly important for detecting single nucleotide polymorphisms (Chapter11) which can also be applied for detecting mutations in any DNA PCRproduct.
In many cases a level of misincorporation can be tolerated if the PCRDNA is to be studied as a population, for example by direct sequencing orrestriction analysis of the product where randomly distributed mutationsdo not interfere with the predominant pattern. If you are starting with alarge number of template molecules you could anticipate that anymutations would appear relatively infrequently against the predominant,wild-type sequence. On the other hand if you are starting with smallnumbers of templates, and a mutation occurred very early during the PCR,it would be amplified and might come to represent a major product, thuscomplicating the results; you will sometimes see this referred to as a‘jackpot’ phenomenon. This problem is important when you want to cloneindividual molecules of the PCR-amplified DNA or where you are interestedin very rare events, such as rare naturally occurring mutations in tissues orcells, the identification of alleles or the characterization of single DNAmolecules. As mentioned above, if you clone PCR products you may needto sequence several clones to identify one that carries no errors.
PCR fidelity can be improved to reduce the number of errors; alterationof reaction conditions, including modifying the buffer and dNTP concen-trations, can significantly improve the fidelity (12). Optimization of PCRconditions is covered in Chapter 4. As with any process, you will find thatwhat you ‘gain on the swings you lose on the roundabouts’. In essence theefficiency and fidelity of PCR counteract each other. If you want a largeamount of product and are not too worried about the level of backgroundmutations, then you can optimize efficiency at the expense of fidelity.Likewise if you are keen to ensure optimal fidelity you will need to be
42 PCR

prepared to sacrifice efficiency, meaning that for a given number of cycles,you will get less product formed. In most cases you will probably want toreach a suitable compromise between these two parameters and this can beachieved by selecting the correct reaction conditions (Chapters 3 and 4).Increasingly with the use of PCR for gene cloning and manipulation, fidelitybecomes an important factor and makes it more likely that you shouldchoose a thermostable DNA polymerase that has a proofreading activity.
3.12 Thermostable proofreading DNA polymerases
Various thermostable polymerases that have a proofreading activity areavailable and these increase the range of experiments for which the PCRcan be used, to include those where it is important to have high-fidelitycopying of the template. Such enzymes, which are available in recombi-nant form, include: VentR
® (New England Biolabs), a recombinant form ofthe naturally occurring enzyme available as Tli (Promega) isolated fromThermococcus litoralis; DeepVentR™ (New England Biolabs) from PyrococcusGB-D; Pfu (Stratagene, Promega) and PfuUltra (Stratagene) from Pyrococcusfuriosus; Pwo (Boehringer, Roche) from Pyrococcus woesei; and UlTma™ (PEBiosystems) from Thermotoga maritima KDD HiFi (Novagen); Accuprime Pfx(Invitrogen). The proofreading ability is due to the capacity of the enzymeto discriminate between whether the nucleotide at the 3′-OH of an extend-ing strand is correctly or incorrectly paired with the template strand. If thenucleotide is not correctly paired then the 3′→5′ activity will remove the3′-nucleotide and the 5′→3′ synthesis activity will introduce a newnucleotide. The presence of the correct nucleotide, base paired with thetemplate, provides a substrate for further polymerase extension.
In addition to higher fidelity, the proofreading enzymes are often moretolerant of variations in buffer conditions, and are more thermostable. Thelatter allows the use of higher denaturation temperatures and/or longerincubations at high temperatures, without significant loss of enzymeactivity, which may be important for templates with high GC content.Their low Km for DNA allows them to efficiently amplify from very lowconcentrations of DNA.
A characteristic feature of Taq DNA polymerase is its tendency to add anontemplate-directed base to the 3′-end of the new DNA strand. Thisresults in a single overhanging base that can affect the efficiency of avariety of subsequent manipulations, including cloning and mutagenesis.Proofreading enzymes generally do not result in such terminal additions,favoring blunt-ended products, although this is not always the case. Forexample VentR
® and DeepVentR® yield >95% blunt ends with the remainder
having nontemplate-directed 3′-additions. For UlTma™, and probablymost proofreading DNA polymerases, it specifically removes 3′-mismatchedbases during a mispriming assay. Thus the enzyme will remove adiscriminating 3′-nucleotide allowing it to amplify from either wild-type ormutant template. For example, allele-specific PCR (Chapter 11) relies uponthe inability of a primer with a 3′-mismatch to prime on a templatemolecule while a primer with no 3′-mismatch will prime efficiently. Insuch assays a nonproofreading enzyme, like Taq DNA polymerase, must beused.
Reagents and instrumentation 43

The propensity for proofreading enzymes to remove 3′-bases couldpotentially lead to problems of single-stranded primer degradation, mostpronounced in the absence of dNTPs. This is perhaps most critical whenusing a primer with a mismatch to the template. Although the primer ispresent in vast excess over enzyme, the 3′ ‘nibbling’ activity of a proof-reading enzyme could lead to loss of the mismatch. You should design theoligonucleotide so that the mismatch is not close to the 3′-end of theprimer. It is also recommended that the enzyme be added as the finalreagent during PCR set-up and that the dNTP concentration is not less than200 µM for each nucleotide. If problems persist then it is possible tosynthesize oligonucleotides with phosphothioate linkages that are resistantto cleavage, although this will be a more expensive option.
As discussed in Section 3.7 and Chapter 10, degenerate primers are some-times used in PCR. These contain mixtures of sequences when you do notknow exactly what the sequence of the template is; in some cases inosineis incorporated at one or more positions to act as a universal base allowingpairing with any of the four normal bases. Taq DNA polymerase has nodifficulty in extending such deoxyinosine-containing primers, but it hasbeen shown that some, and therefore probably all, proofreading enzymesare unable to utilize such primers, presumably because they will notrecognize the mispairing of inosine with A, G, C or T as it reaches the I inthe primer region of the template strand. The degree of rejection ofinosine-containing templates may depend upon the degree of proofreadingas measured by the error rate (see Table 3.2). To allow labeling of the PCRproduct, modified nucleotides including digoxigenin-, biotin- andfluorescein-forms of dUTP can generally, though not necessarily efficiently,be incorporated by these enzymes. The modified nucleotide shouldpartially substitute for dTTP, say by using 150 µM dTTP with 50 µMmodified dUTP.
Choice of proofreading enzyme
It is important to consider the type of experiment you wish to perform andthen to select the appropriate enzyme. A brief summary of properties ofsome proofreading enzymes is provided.
Vent® and Tli DNA polymerases
Vent® and Tli DNA polymerases are derived from the thermophilic archae-bacterium Thermoccocus litoralis that exists at temperatures of up to 98°C.The native enzyme is Tli (Promega) while VentR® (New England Biolabs) isthe form cloned and expressed in E. coli. VentR® with a calculated half-lifeat 95°C of 6.7 hours is significantly more thermostable than Taq DNApolymerase (t1/2 =1.6 hours at 95°C). VentR® DNA polymerase can generatelong products up to 8–13 kb in length. It has 3′→5′ proofreading activitygiving it a higher fidelity than Taq polymerase by a factor of aroundfive-fold. More than 95% of PCR product ends are blunt-ended with theremainder having a 3′-nucleotide extension. An exo– form of Vent® isavailable.
44 PCR

DeepVentR® DNA polymerase
DeepVentR® DNA polymerase is a more thermostable enzyme than VentR®,also available from New England Biolabs, and is isolated from PyrococcusGB-D that can grow at temperatures as high as 104°C. The calculated half-life at 95°C is 23 hours.
Pfu DNA polymerase
Pfu DNA polymerase is from the hyperthermophilic archaebacteriumPyrococcus furiosus and is available from various manufacturers. It has both3′→5′ exonuclease proofreading activity and 5′→3′ exonuclease activity. Thefidelity of the enzyme is some 12-fold higher than for Taq DNA polymeraseand probably has the highest fidelity of any of the currently usedthermostable DNA polymerases. Pfu has also been combined with a thermo-stable factor in PfuTurbo™ DNA polymerase (Stratagene), which is reportedto increase product yield, without affecting the high fidelity of the enzyme,allowing increased product from complex targets, fewer cycles of PCR andincreased sensitivity of amplification from low quantities of template.
Exo– versions
Versions of VentR® (13), DeepVent R® and Pfu have been engineered toremove the 3′→5′ proofreading activity and are usually designated exo–.You may wonder why such enzymes should be produced. In fact these areprimarily intended for DNA cycle sequencing (Chapter 5). For normalPCRs these versions still display a slightly higher fidelity than Taq DNApolymerase, for example Vent R® (exo–) has a two-fold higher fidelity, andcan generate more target product than their proofreading parents. Theexo– versions also tend to generate blunt ends (70%) although a higherproportion of products have 3′-A extensions (30%), more like Taq DNApolymerase. Of course the exo– enzyme is now not a proofreadingenzyme!
Pwo DNA polymerase
Pwo DNA polymerase was isolated from the hyperthermophilic archae-bacterium Pyrococcus woesei and is now available from Roche MolecularBiochemicals in recombinant form expressed in E. coli. The enzyme is a 90kDa protein with a highly processive 5′→3′ DNA polymerase and a 3′→5′exonuclease proofreading activity. There is no detectable 5′→3′ exonucleaseactivity. Pwo has higher thermal stability than Taq DNA polymerase withrespective half-lives at 100°C of 2 h and 5 min. Pwo DNA polymerase hasa preference for MgSO4 (2 mM) rather than MgCl2. It is almost as proces-sive as Taq DNA polymerase but the fidelity of the enzyme is about 10-foldhigher. dUTP is a poor substrate for Pwo DNA polymerase and therefore itshould not be used with uracil glycosidase (UNG) systems to prevent carry-over contamination (Chapter 4). Pwo DNA polymerase generates productssuitable for blunt-end cloning.
Reagents and instrumentation 45

UlTma™ DNA polymerase
UlTma™ DNA polymerase is a recombinant version of the enzyme fromthe hyperthermophilic Gram-negative eubacterium Thermotoga maritima.It has proofreading activity and is more thermostable than Taq DNApolymerase.
ACCUZYME DNA polymerase
ACCUZYME DNA polymerase (Bioline) possesses 5′→3′ DNA polymeraseand 3′→5′ proofreading exonuclease activities, offering 47-fold higherfidelity compared to Taq DNA polymerase. This high fidelity is guaranteedfor amplification products up to 5 kb in size. ACCUZYME DNA polymeraseis supplied with buffer containing MgSO4, which provides optimal finalreaction conditions (2 mM Mg2+) for most experiments, however foroptimization purposes the MgCl2+ concentration can be varied. As for otherproofreading thermostable polymerases ACCUZYME generates blunt ends.We would recommend ACCUZYME as a solid thermostable proofreadingDNA polymerase for applications which require high-fidelity and/or bluntending.
KOD HiFi DNA Polymerase
KOD HiFi DNA Polymerase is supplied by Novagen. It is a proofreadingenzyme, isolated from the extreme thermophile Thermococcus kodakaraensisKOD1, and displays high processivity and fidelity that allow faster, moreaccurate PCR amplification than with some other enzymes, such as Pfu DNApolymerase. For example the elongation rate is 5 times faster andprocessivity 10–15 times higher, than for Pfu DNA polymerase. KOD HiFiDNA Polymerase is also supplied in a hot-start version in which the DNApolymerase and 3′→5′ exonuclease activities are inactivated by two mono-clonal antibodies.
3.13 Tth DNA polymerase has reverse transcriptase activity
Tth DNA polymerase, isolated from Thermus thermophilus, is a highlyprocessive thermostable DNA polymerase making it useful for theproduction of long PCR products. It does not possess a proofreading activityand so has a similar fidelity to Taq DNA polymerase. However, it has goodreverse transcriptase (RT) activity and so is useful for reverse transcriptasePCR (RT-PCR). It can transcribe mRNA transcripts into cDNA and thenamplify these for applications such as analysis of gene expression levels,construction of cDNA libraries from limited amounts of tissue or detectionof low levels of a transcript (Chapter 8). The RT activity is dependent uponthe presence of 1–2 mM manganese ions while the DNA polymerasefunctions best in the presence of magnesium ions. There are twoapproaches to amplifying mRNAs using Tth polymerase. The first reliesupon a reaction containing only manganese and involves an initial RT stepwith subsequent PCR thermal cycling to amplify cDNAs. The main draw-back to this simple procedure is that the fidelity of Tth DNA polymerase is
46 PCR

reduced in the presence of manganese and so cDNAs are likely to accumu-late more errors. This may not be important for procedures where only thedetection of an amplification product is important. In most detection assaysit is likely to be the size and amount of product formed that is important,rather than whether the amplified product contains errors. However,fidelity will be important if you want to clone and study the product.Increased fidelity is possible by performing the initial RT step in thepresence of manganese and then adding a chelating agent, such as EGTA,to sequester the manganese, before adding magnesium to activate the DNApolymerase activity for the PCR stages. Both approaches can be performedin a single tube. The key advantage of the Tth polymerase system over astandard two-enzyme approach based on a mesophilic RT and Taq DNApolymerase, is that Tth polymerase will perform both reactions at hightemperature (70°C). This is an advantage for GC-rich RNA templates thatoften form complex intramolecular secondary structures. The high temper-ature at which Tth RT activity operates allows the template to bemaintained in a denatured state, allowing efficient copying of normallydifficult templates. The high temperature also ensures high specificity ofprimer annealing. Alternatives to Tth polymerase for single-tube RT-PCRthat comprise enzyme mixtures can be found in Section 3.15.
3.14 Red and green polymerases and reagents
Some enzyme preparations or PCR reagent mixes include a dye that providesconfidence that the enzyme or reagents have been added and correctlymixed and can assist in post-PCR analysis. For example, there is usually noneed to add a loading buffer prior to agarose gel analysis of reaction prod-ucts as the sample has increased density and the dyes migrate through thegel to act as a marker for migration of samples through the gel (Chapter 5).Sigma have a REDTaq™ preparation supplied at 1 U µl–1 that colors thereaction and is also claimed to act as a gel loading and migration markerthat moves slightly faster than bromophenol blue. ABGene® supply a RedHot® DNA polymerase that contains a red dye to monitor addition andmixing of the enzyme. They also produce a ReddyMix™ buffer containingan inert red dye and a gel loading reagent allowing monitoring of reagentaddition and subsequent direct gel analysis of an aliquot of the reaction.Addition of a dye and loading reagent as part of a buffer, rather than theenzyme, should improve the qualities of loading and visualization since theconcentrations are greater due to the increased volume of reagents added.Similarly Ruby Taq and Ruby Taq Master mix are available from USB Corpand contain an inert dye. GoTaq® DNA Polymerase from Promega is a TaqDNA Polymerase and a Green GoTaq® Reaction Buffer that can be used forroutine PCR applications, including colony screening. Amplified DNA canbe loaded directly onto agarose gels, without the need to add loading dye.
3.15 Polymerase mixtures: high-fidelity, long-range andRT-PCRs
Barnes (14) described a two-enzyme system for the amplification of long PCRproducts (5 to >20 kbp). The enzymes included predominantly Taq DNA
Reagents and instrumentation 47

polymerase and a smaller component of a proofreading DNA polymerase.As DNA synthesis proceeds, Taq DNA polymerase will occasionally insert thewrong nucleotide leading to a stalling of the extension process anddissociation of Taq molecule from the template. If it was the only DNApolymerase present, a subsequent reassociation event between the Taq DNApolymerase and mismatched 3′-end might lead to extension and thus ‘fixing’of a mutation in the population of DNA molecules. By including some proof-reading enzyme, the stalled extension product can be repaired by theproofreading enzyme thereby allowing efficient extension of the productwith reduced error rate (Figure 3.6). The length of product that can begenerated generally depends upon the complexity of the starting template.The more complex the template the shorter the likely products, so mostexamples of very long products are from simple cloned templates. Whenperforming long-range amplifications from genomic templates (Chapter 10)the quality of starting DNA is obviously of great importance and care shouldbe taken to produce high quality genomic DNA. An additional benefit of anenzyme mixture is that it will work over a wider range of Mg2+ concen-trations.
As the majority of DNA polymerase activity in such enzyme mixes tendsto be due to Taq DNA polymerase it is expected that most products willcarry a 3′-A extension. Many commercially available sources of optimizedenzyme mixes are available for long-range PCR, high-fidelity PCR, ampli-fication of GC-rich templates and RT-PCR. The following examplesrepresent a snapshot of some available reagents, but there are continualdevelopments being made by manufacturers.
Long-range PCR
● The Advantage® 2 mix from Clontech comprises their AdvanTaq™enzyme for high-yield product synthesis together with a smaller amountof a proofreading polymerase to allow increased fidelity and longerproduct lengths to be synthesized. The fidelity is about three timeshigher than the AdvanTaq™ polymerase alone. The system also incorpo-rates a TaqStart™ antibody to allow hot starts (Chapter 4).
● The Advantage®-Genomic mixes (Clontech) for amplifying large genomicsequences contain Tth polymerase which is useful for copying longsequences, but which does not contain a proofreading activity. Inaddition there is a small amount of a proofreading enzyme to increasethe fidelity of copying allowing up to 10 kb regions to be amplified fromgenomic DNA. From less complex templates it is possible to amplifylonger sequences up to 40 kb.
● The Expand™ Long Template PCR system (Roche) is a mix of Taq and PwoDNA polymerases together with three optimized buffers for different sizeranges that when used with the recommended protocols provide efficientamplifications of 0.5–12, 12–15 or >15 kb products. Even longerfragments can be generated using the Expand™ 20 kb PLUS PCR system.
● Hot Tub™ from Thermus ‘ubiquitous’ (Amersham Pharmacia Biotech) isnot a mixture of enzymes, but is a single enzyme preparation that isproduced specifically for long-range PCR, and so is most appropriatelylisted here.
48 PCR

Reagents and instrumentation 49
Primerextension
Template
Mismatch error
Taq DNA polymerasestalls and dissociates
Proofreadingpolymerase associatesCorrects mismatch Proofreading
polymerase
Proofreadingpolymerase continuesthen dissociates
Taq DNA polymerasereassociates andcontinues
TAQ
Figure 3.6
A mixture of Taq DNA polymerase and a proofreading enzyme allows efficientrepair of errors during PCR. If Taq DNA polymerase introduces a mismatchednucleotide it will stall and will dissociate from the template. The error can becorrected by the proofreading DNA polymerase that will continue to synthesizeDNA until it also dissociates from the template allowing Taq DNA polymerase toreinitiate DNA synthesis. The use of a mixture containing predominantly Taq DNApolymerase with a low concentration of a proofreading enzyme improves thefidelity over Taq DNA polymerase alone, but allows high levels of product to besynthesized.
● The TaqPlus® Long PCR system (Stratagene) is a combination of Taq2000and Pfu DNA polymerases allowing amplification of products up to 35kb with two buffers supplied and extension times of only 30 s per kb.
● The Extensor Long PCR kit (ABGene®) is a mix of Taq and a proofreadingDNA polymerase for 3 to >20kb products.
● The ELONGASE® Amplification System (Invitrogen) represents a combi-nation of Taq and Pfu DNA polymerase giving a five-fold-enhancedfidelity over Taq DNA polymerase alone. It uses a single buffer systemfor amplifications of products 250 bp to 30 kbp.
● KOD XL DNA Polymerase is a blend for amplifying very long templates.This comprises KOD HiFi DNA Polymerase and a mutant form of KODHiFi deficient in 3′→5′ exonuclease activity. This preparation also allowsthe incorporation of dITP, dUTP and derivatized dNTPs into PCRproducts and produces a mixture of PCR products with blunt and 3′-dAoverhangs.
High-fidelity PCR mixtures
● The Advantage®-HF 2 PCR kit (Clontech) is also available and is designedto achieve a fidelity 25-fold higher than AdvanTaq™ alone.
● The Expand™ High Fidelity PCR system (Roche) comprises a mixture ofTaq and Pwo DNA polymerases to provide optimized fidelity and yieldduring amplification of genomic fragments of less than 5 kb. The yieldis two times higher than that of Taq DNA polymerase while the fidelityis three times higher. The Expand™ High Fidelity also provides improvedsensitivity with limiting quantities of genomic DNA template.
● The TaqPlus® Precision PCR system (Stratagene) is a mix of Taq2000 andPfu DNA polymerases designed for amplifications up to 15 kb and with2.7-fold higher fidelity than Taq DNA polymerase alone.
● BIO-X-ACT Long DNA Polymerase (Bioline) is a high-performanceproprietary complex of enzymes and additives designed for applicationsrequiring high processivity and high fidelity. BIO-X-ACT Long DNAPolymerase has a 17-fold increase in fidelity compared to regular Taqpolymerase and is recommended for amplification of genomic DNAfragments between 2 kb and 20 kb. BIO-X-ACT possesses 5′→3′ DNApolymerase activity and 3′→5′ proofreading activity and is supplied withits own unique buffer and also with ‘HiSpec Additive’, which reducessmears, primer-dimers and spurious bands that are associated withdifficult GC-rich and repetitive sequences.
● Platinum® Taq DNA polymerase (Invitrogen) is a mixture of Pyrococcusspecies GB-D polymerase, which displays 3′→5′ proofreading activity,and recombinant Taq DNA polymerase with the Platinum Taq antibodyto allow hot start. The mixture displays a 6-fold enhanced fidelitycompared with Taq DNA polymerase, and allows 12 to 20 kb to be ampli-fied following optimization.
GC-rich template PCR
● The Advantage®-GC 2 system (Clontech) provides a polymerase mixdesigned to increase the efficiency of copying difficult templates, such
50 PCR

as GC-rich regions or genomes that often prove difficult or intractableto PCR. It also includes DMSO in the buffer to disrupt base pairing ofthe DNA template while a reagent, GC-Melt™, is also included to assistdestabilization of the template and to make AT and GC base pairs equallystable.
● The GC-Rich PCR system (Roche) combines Taq and a proofreadingenzyme plus buffer additives and a resolution solution to achieve PCRof GC-rich templates.
RT-PCR
● The C. therm. Polymerase One-Step RT-PCR System (Roche) provides an alter-native to the use of Tth polymerase. The Klenow fragment of DNApolymerase I from Carboxydothermus hydrogenoformans has a reversetranscriptase activity that functions at between 60 and 70°C therebyincreasing the specificity and yield of the RT step, particularly withdifficult templates. However, the enzyme does not require manganesethat can lead to reduced fidelity. Rather, it is dependent upon magnesiumand has a 3′→5′ proofreading activity leading to a two-fold higher fidelitythan Tth polymerase. The subsequent PCR amplification of cDNAs isperformed by the Taq DNA polymerase, allowing a simple one-tubeapproach. The C. therm. enzyme is also supplied separately for use in two-step RT-PCRs for GC-rich templates. In this case the reaction is performedin the presence of DMSO to assist denaturation of secondary structureand 1–2 M betaine to improve transcription of GC-rich sequences.
● The Titan™ One Tube RT-PCR system (Roche) combines AMV reversetranscriptase with Expand™ PCR enzyme mix of Taq and Pwo DNApolymerases to achieve RT-PCR products up to 6 kbp with higher fidelitythan a Tth polymerase-based approach.
● ProSTAR™ RT-PCR systems (Stratagene) are available in HF (High Fidelity)or Ultra HF (Ultra High Fidelity) formats. The former is a combinationof MMLV reverse transcriptase for first-strand cDNA synthesis andTaqPlus® Precision for the PCR stage. The system allows single-tube, high-yield and fidelity PCR from an mRNA template. The Ultra HF versionuses again MMLV reverse transcriptase with PfuTurbo™ DNA polymerasefor the highest fidelity amplification of the cDNAs. This system is usefulfor cloning, sequencing and expression of products.
● The OneStep RT-PCR kit (Qiagen) uses a blend of two reverse transcriptasesand a HotStar Taq DNA polymerase.
3.16 Nucleic acid templates
A wide range of DNA and RNA samples can be used as templates for PCR,including genomic DNAs, mRNAs, cDNAs, libraries, plasmid, phage, cosmid,BAC and YAC clones. In addition to preparing the template yourself thereare an increasing number of commercial suppliers providing genomic DNAs,genomic libraries (in various vectors), cDNA libraries, total RNAs andpoly(A)+ RNAs. These are available from several animal and plant species,tissues and cell types.
Reagents and instrumentation 51

The amount of template required is likely to require optimization, butgenerally less than a nanogram of cloned template and up to a microgramof genomic DNA is used. For high molecular weight genomic samples PCRshould prove successful, but it may be useful to do a partial digestion ofthe DNA with rare-cutting restriction enzymes such as NotI or SfiI. PCR canbe used to amplify from single cells or even a single template moleculealthough it is critical in such cases to avoid contamination (Chapter 4). Itis also possible to perform some PCR analyses in situ within a fixed sampleof tissue to explore the expression of genes at the level of tissue or cells orto identify the presence of viral transcripts associated with disease(Chapter 8).
Sources of template DNA
DNA from almost any source has been successfully used in PCR. Whateverthe source, make certain that you know what safety rules to apply to thehandling and disposal of the starting material and/or by-products of theextraction; this may involve correct disposal of bacterial cultures, human oranimal tissues, transgenic plant tissue or chemical reagents such as phenol.
In general, as with any biological system, PCR is almost certain to workbest with the cleanest, purest DNA sample you can prepare. However, theinherent capacity of PCR to amplify even minute amounts of DNA meansthat even very crude tissue samples which have simply been lyzed, forexample by boiling, will often produce a product after PCR. However, insome cases you may find that you get no amplification products fromcertain DNA sources, particularly those which contain significant amountsof polysaccharides, or which look an ‘unusual’ color. It might be that theDNA contains some contaminant that is inhibiting Taq DNA polymerase,and you may find that by testing a variety of dilutions of the DNApreparation, you get to a point where amplification works successfullybecause the concentration of contaminant has been sufficiently reduced.
Genomic DNA
Essentially any method can be used to prepare genomic DNA from bacteria,fungi, plants and animal. For the amplification of large fragments (>1000bp) purer genomic DNA will mean better amplification and there are anumber of very good commercially available DNA purification kits.However, when dealing with a large number of samples, preparation ofhighly purified DNA can become very time consuming. Crude samplepreparations will often suffice for successful amplification of small products(200–1000 bp).
RNA isolation and first-strand cDNA preparation
There are a number of ways to isolate RNA for reverse transcriptase appli-cations. Standard methods include the lysis of cells and tissues, andextraction of RNA followed by ethanol precipitation. Various methods canbe found in most molecular biology manuals and these normally work well.
52 PCR

However, these extraction procedures usually include a phenol step and soare not recommended when dealing with a large number of samples. Forsuccessful reverse transcription it is important to have the highest qualityRNA possible and there are many good commercial RNA isolation kitswhich do not include phenol extraction. Reverse transcription is coveredin detail in Chapter 8.
Plasmid and bacteriophage DNA
DNA prepared by any method from rapid mini-preps to purificationthrough CsCl gradients may be used as template for PCR experiments. Forplasmid screening there is really no need to purify DNA from bacteria orphage since small parts of colonies or plaques can be picked directly intoPCR reaction mixes (Protocol 6.2). Most molecular biology supplycompanies have proprietary systems for the simple, routine and reliablepurification of plasmids (Chapter 6).
Pathological and forensic samples
Clearly with human tissue or blood samples you must take the appropriateprecautions to prevent contamination with infective agents. DNA canusually be extracted from fresh tissues or blood samples very simply by aproteinase K digestion procedure. However, it is also possible to isolate DNAfrom archival samples stored either as fixed tissues on microscope slides oras museum specimens in an appropriate preservative agent (15).
Archaeological samples
DNA can be extracted and amplified from ancient biological specimens(16). The focus of such studies is often chloroplast or mitochondrial DNAsor genomic ribosomal RNA genes that occur in multiple copies per cell andtherefore are likely to be better represented than the one or two copies ofsingle-copy genes in genomic DNA. Over time the quality of the templateDNA will have degenerated. Often this results in amplification of only shortproducts of 100–200 nt (17). However, it is possible to reconstruct longersequences by overlap analysis of many shorter segments (18,19). Analternative approach is the initial reconstruction of a longer template byrecombinant PCR from purified short initial PCR products (20). Of coursethere is always the risk in such experiments that artefactual products maybe generated that did not exist in the original sample. It would be prudentto perform parallel reactions to provide confirmation that a product wasgenerated in independent experiments. In any studies of ancient samplesit is critical to ensure appropriate controls are performed to ensure thatamplification products do not arise from more recent microbial or othercontamination. DNA amplification studies have been carried out on a widerange of samples such as Siberian woolly mammoth mitochondrial DNA(21), insects in amber using nuclear 18S rRNA (22,23) or mitochondrialDNA (24), leaf fossils using chloroplast DNA (25) and nuclear 18S rRNA (26)and Neanderthal DNA (18).
Reagents and instrumentation 53

Amount of template DNA required
The amount of template DNA required for a PCR varies according to theapplication and the source of the template. As a comparative guide for 3 ×10⁵ template molecules, which is a reasonable number to start with in aPCR, you would need:
● 1 µg human genomic DNA● 10 ng yeast genomic DNA● 1 ng E. coli genomic DNA● 1–2 pg of plasmid or M13 DNA● 20 pg of bacteriophage λ DNA
Increasing the number of template molecules is recommended in someapplications to reduce the number of amplification cycles, for example insome gene splicing and mutagenesis procedures (Chapter 7).
3.17 Mineral oil
In thermal cyclers that do not have a heated lid (Section 3.19) it is neces-sary to overlay the PCR reactants with a barrier that will prevent thermalevaporation. A high quality light mineral oil, such as that available fromSigma or Aldrich, has traditionally been used. An alternative is silicone oil,which creates a flatter and clearer phase transition interface and which isavailable in a dropper bottle format from Life Technologies.
3.18 Plasticware and disposables
A number of manufacturers supply disposable items for PCRs. Theseinclude, 0.5 and 0.2 ml polypropylene tubes and 96-well microtiter plates,glass slides, glass and plastic capillaries and pipette tips. Tubes andmicrotiter plates are designed to give uniform contact with reaction blocksand are available in thin-wall format for rapid heat conduction betweenthe block and reactants to improve cycling efficiency. Tubes are availablein strips. Caps are also available in strips while seals for microtiter platesare available either as strips of caps or self-adhesive or heat seal membranes;the latter require access to an appropriate heat sealer unit. Pipette tips areavailable that prevent contamination due to aerosols by the use of filters,or for positive displacement pipettes, and are discussed further in Chapter4. When using 96-well microtiter plates multi-channel pipettes are recom-mended as this reduces pipetting error and is less time consuming. For highthroughput studies it can be useful to make use of a liquid handling robotif possible. Racks that accept a mixture of tube sizes can be useful for PCRset-up, since it is unlikely that your reagents will all be stored in the samesize tubes as your PCR reaction tubes. The type of tube you use will affectthe temperature profile of your PCR. As an example Figure 3.7 shows acomparison of a set thermal cycle of 94°C, 1 min; 55°C, 1 min; 72°C, 1min, on an instrument that monitors block, rather than reaction tempera-ture. The reaction temperatures were monitored in two different types oftubes, a standard 0.5 ml polypropylene tube and a thin-walled PCR tube.The traces show that the normal tube never reaches the preset temperature
54 PCR

before the transition to the next temperature. Thus for example the reac-tions are being carried out at an annealing temperature above that set. Bycontrast the thin-walled tube reaches the preset temperatures by around 30s allowing a 30 s hold at the set temperature. It is important to understandhow parameters such as reaction tubes can affect the kinetics of the PCRto ensure reproducibility in your experiments.
3.19 Automation of PCR and thermal cyclers
The early instruments for PCR were rather crude and generally consisted ofa robotic arm used to transfer a rack of reaction tubes between the waterbaths held at different temperatures. Such devices were not particularlyefficient and were generally replaced by programmable heating blocks,commonly called thermal cyclers. These instruments are based on mech-anisms for rapid heating and cooling of the reaction tubes to apredetermined temperature and holding the temperature for a defined timebefore moving to the next temperature. Various mechanisms for heatingand cooling exist and the most common are heating by electrical resistancewith either fluid or semiconductor (Peltier device) cooling, or heating usinga powerful lamp or heating coil with air cooling. Many manufacturerssupply instruments for PCR and these range from the simple through toextremely sophisticated. All tend to provide simple-to-understand program-ming capacity that allows the user to control the cycling parameters, rateof heating and cooling and the number of cycles. Some instruments havea single control block that can operate satellite blocks. Others have gradientblocks that can be set to a range of temperatures while the most sophisti-cated also have real-time systems for monitoring product accumulation.
Patents, held by Hoffman-LaRoche, were originally licensed only to PE-Biosystems, for the sale of thermal cyclers. Now, most manufacturers supplyappropriately licensed instruments and these are generally very user-friendly requiring only simple menu-driven programming. Suchinstruments will cycle through a series of preset temperatures a predefined
Reagents and instrumentation 55
100
80
60
401 8 15 22 29 36
Time (10 s)
Tem
pera
ture
(°C
)Temperature profiles during PCR
Block temperature
Normal 0.5ml tubes
Thin-walled 0.5ml tubes
Figure 3.7
The effect of altering tube type on the temperature profile of a PCR reaction. Theset profile is shown together with actual reaction temperature monitored in eithera standard or thin-walled reaction tube on the same instrument. The resultsdemonstrate the significant difference in reaction conditions.

number of times. Some instruments allow the rate of heating and cooling(s °C–1), known as ramping, to be regulated which may be important forcertain experiments, for example using long primers. They may also provideadditional features such as preprogrammed pauses to allow sampling of thereaction mix or addition of further reactants after a defined number ofcycles. Some will refrigerate the samples at 4–6°C on completion. Thisfacility can be useful, especially when performing overnight reactions whenthe samples might be sitting for several hours after the completion of thePCR.
Heating
Most instruments rely upon a heating element in contact with metal blocksuitably modified to hold the reaction tubes or microtiter plates. The ratesof heating are usually around 1–2°C s–1. What should concern you most isthe uniformity of heating across the block. It is all very well the tubes inthe middle of the block reaching the appropriate temperature, but those atthe outsides should also reach this same temperature, at the same time.This does not always happen and is a feature worth checking, preferablyfor yourself by getting an instrument on a trial basis. There are experimentalprocedures where such minor temperature variation can have significanteffects. Examples are the quantitation of PCR products to provide a measureof initial template concentration, or RAPD-PCR where annealing of theshort primers is often highly sensitive to temperature. Air cyclers do nothave a block but instead use rapid heating of air surrounding reactioncapillaries.
Cooling
When it comes to cooling the block there are a range of systems, forexample the Perkin-Elmer instruments use a conventional refrigerant,others use fans or solid-state Peltier devices while others use water-basedcooling. The type of cooling system is not insignificant since to achievemaximal efficiency you require rapid, uniform cooling, and most systemsachieve this. The other consideration is the lifetime of the instrument, orperhaps more accurately that of its components. Early Peltier devices werenotorious for failing, particularly if frequently used to cool post-PCRsamples to 4°C, and were quite expensive to replace. Advances in tech-nology have improved performance and reliability.
Temperature monitoring
It is important to understand the mechanism that the manufactureremploys for controlling the cycle parameters as these are not the same onall instruments and can lead to failure when a protocol developed on oneinstrument is exported to a different type of instrument. An important cri-terion is reproducibility both in attaining and maintaining temperaturesfor the desired times. Some instruments monitor block temperature anduse this to regulate the time of each step while others use a reactiontemperature measured by a thermocouple in a tube placed in the block. As
56 PCR

it will take longer for the reaction solution than the block to reach theprogrammed temperature this means that alterations need to be made ifidentical reactions are to be carried out on such different instruments. Thisis also true when moving from a block-based instrument to an air cycler(see below) which is based on capillaries exposed to air that is rapidlyheated and cooled. Such instruments tend to reach their programmedtemperature much more quickly than block-based instruments and there-fore reaction cycles are generally very short. It is also important that thetemperature of the reactants in the reaction vessel do not over- or under-shoot the desired temperatures as this would prevent controlled reactionconditions.
Gradient blocks
Instruments are now increasingly available that allow rapid optimization ofthe annealing temperature step of PCRs. The ability to use a single block tosimultaneously test 8 or 12 predetermined temperatures during optimizationof PCR conditions is a significant advance. For day-to-day experiments agradient instrument should allow different sections of the block to operateat different temperatures allowing you to perform independent experiments,requiring different annealing temperatures, simultaneously. If you areconsidering purchasing a new instrument and will be undertaking a rangeof experimental studies, rather than routine established testing, it is recom-mended that you seriously consider an instrument with a gradient capacity.One thing to bear in mind is that due to the varying mechanisms employedby different instrument manufacturers it is often difficult to dissect out theexact conditions of incubation time and temperature. This means it will notalways be possible to optimize conditions on a gradient instrument and thento transfer the protocol to a nongradient instrument, unless it is from thesame manufacturer. Instruments are being developed that provide veryaccurate readout of temperature dynamics that should improve the facilityto transfer protocols more reliably.
Heated lids
Most manufacturers produce thermal cyclers with heated lids. If you havean instrument without a heated lid you will need to add a drop of lightmineral oil to provide a thermal barrier preventing evaporation of thereaction solution. The heated lid fits tightly against the lids of thetubes ensures good thermal equilibration and overcomes the evaporationproblem.
Air cyclers
Thermal cyclers are now available that do not rely upon a thermal blocksystem. Air cyclers use a heat source such as a bulb or heating coil to directhot air into a chamber into which are inserted sealed capillaries contain-ing the PCR reaction mix, usually in a volume of 10–20 µl. The coolingsteps are achieved by a fan, which extracts hot air and allows entry of cold
Reagents and instrumentation 57

air to the chamber to achieve the required annealing temperature. Therapidity of the air-mediated temperature changes and the high surface-area-to-volume ratio of the capillaries lead to very rapid alteration of thetemperature of the PCR mix and therefore cycling times are significantlyreduced. A typical PCR that may take 2–3 hours in a standard instrumentcan be completed in as little as 30–45 min in an air cycler.
Monitoring product accumulation and PCR kinetics
Systems are becoming increasingly available both for performing PCR andfor monitoring the accumulation of product directly in real time after eachcycle. These systems are based on fluorescent detection of double-strandedDNA or specific target sequences by measurement of fluorescence resonanceenergy transfer (FRET). These assay systems are discussed in greater detailin Chapter 9.
Examples of PCR instruments
The choice of instrument for your laboratory should be made on the basisof a list of your requirements and ideally the ability to test differentinstruments with your own samples. Many suppliers will provide ademonstration instrument for you to test, either during a more formaldemonstration, or ideally by leaving it with you for a few days. It is usefulto be able to directly compare instruments with identical samples tocompare the quality and reproducibility of PCRs. It is a good idea to checkout several competing instruments within your budget range. The betterones are obviously likely to be the most expensive, but it is not worthbuying one because it is cheap (relatively speaking) if it will not do the jobproperly. You are better to try to come to some deal with whoever holdsthe purse strings, and with the suppliers, in order to get the best machineyou can. The following section highlights some types of instruments thathave features worthy of particular note and gives the relevant websites forfurther information.
Applied Biosystems instruments
Applied Biosystems have a range of thermal cyclers including theGeneAmp® PCR system 9700, the Applied Biosystems 2720 thermalcycler and the Applied Biosystems 9800 Fast thermal cycler. The instru-ments are based on a Peltier system and are recognized as beingmanufactured to the highest standards. The 9700 system comes withvarious reaction sample block modules including: (i) a 60-well 0.5 mlsample block; (ii) a 96-well 0.2 ml sample block; (iii) a 96-well reactionplate block, and (iv) two 384-well reaction plates block. The 2720 systemis a personal-sized thermal cycler and can be used with standardMicroAmp® eight-strip reaction tubes or a MicroAmp® 96-well plate.The 9800 Fast system is more rapid than the 9700 and 2720 systems anduses a 96-well plate. Further detailed information can be found athttp://www.appliedbiosystems.com/.
58 PCR

Thermo Hybaid instruments
Thermo Hybaid instruments encapsulate many of the features describedearlier in this Section. There are gradient and nongradient versions withheated lids and in-reaction tube temperature monitoring. It is possible toprogram increases or decreases (touchdown PCR, Chapter 4) in temperatureat each cycle, which can be useful for certain applications such as long-rangePCR. For certain robust applications such as colony screening (Chapter 6) itis possible to reduce the times required for denaturation, annealing andextension due to the rapid heating rates. The PCR Sprint Thermal cycler isideal for relatively small amounts of PCRs on a regular basis. The PCR Sprinthas two choices of sample format; the 0.2 ml block option with 24 tubesand the 0.5 ml block option with space for 20 tubes. The blocks are alsointerchangeable, so no need to buy a new thermocycler if your requirementschange. The P×E Thermal Cycler (P×E) is a licensed 96-well PCR machinesimilar to the PCR Sprint. If more advanced amplification parameters areneeded the P×2 Thermal Cycler is a good choice designed to offer perform-ance, accuracy and simplicity. The P×2 offers five control modes for precisiontemperature control, including active tube control for in-sample measure-ment. In addition, six interchangeable blocks are available including thelatest gradient cycling format. Further detailed information can be found athttp://www.thermo.com/.
Eppendorf Gradient Mastercycler
In addition to the flexibility, reproducibility and ease of programmingexpected in a modern gradient thermal cycler this instrument also has anovel universal block able to accommodate 96 0.2 ml tubes, 77 0.5 ml tubes(or a mixture of 0.2 and 0.5 ml) or a 96-well plate. Further detailed infor-mation can be found at http://www.eppendorf.com.
RoboCycler® temperature cyclers
Supplied by Stratagene these are a modern variation on the original themeof having water baths at preset temperature and transferring tubes betweenthe baths to perform the PCR cycle. Robocylers have four temperatureblocks, one a fixed cooling block while the other three are user-programmable for the denaturation, annealing and extension steps. Arobotic arm rapidly (< 3 s) transfers tubes from one block to the nextthereby overcoming the normal requirement on single-block instrumentsfor ramping the block between the appropriate temperature. The cyclingtime is therefore reduced allowing more rapid completion of PCRs. Theinstruments have either a 40-well or a 96-well format. Gradient temperaturecyclers are also available that allow simultaneous testing of 8 (40-wellformat) or 12 (96-well format) annealing temperatures. As expected well-to-well uniformity is good with ± 0.1°C for the standard instruments and0.25°C for the gradient version. Further detailed information can be foundat http://www.stratagene.com.
Reagents and instrumentation 59

MJ Research instruments
MJ thermal cyclers pioneered the use of Peltier-effect heating and coolingthat is now standard in thermal cyclers and MJ is the only cycler manu-facturer to make its own Peltier modules. The introduction of the DNAEngine revolutionized thermal cycling and has become a platform for newerfeatures and upgrades. The DNA Engine has fantastic thermal uniformityand also interchangeable blocks and is often looked upon as the ‘workhorse’of thermal cyclers.
In terms of real-time RT-PCR (Chapter 9) the MJ product line offers arange of instrumentation for both single- and multi-color fluorescencedetection. The Opticon™ real-time PCR detector employs an array of 96blue light-emitting diodes (LEDs) to excite fluorescent dyes. LEDsprovide a long-lived excitation source of uniform performance and eachLED beam is focused onto its corresponding well to ensure minimalcrosstalk and light scattering. Emitted fluorescence is detected by aphotomultiplier tube (PMT) that detects and amplifies the fluorescencesignal and together with a bandpass-filter detection system the specificsignal is separated from the background. This results in exceptionalsensitivity and the ability to accurately quantify template concentrationsover a broad dynamic range. The Opticon™ 2 system has the samefeatures as the Opticon system but has the capability of two-colordetection. Sample wells are illuminated by an array of 96 blue-greenLEDs but detected by two PMTs. The first PMT detects wavelengthsbetween 523 and 543 nm (suitable for detecting SYBR Green I andFAM-labeled probes; Chapter 9), and the second PMT detects wave-lengths from 540 to 700 nm (suitable for detecting fluorophores, such asHEX, TET, TAMRA; Chapter 9). The Chromo4 detector system isparticularly attractive since it easily converts any DNA Engine into areal-time RT-PCR system by simply swapping with any of the inter-changeable sample blocks. The flexibility of the Chromo4 allows it tokeep pace with such a rapidly evolving field. Further detailed infor-mation can be found at http://www.mjr.com.
LightCycler™ instrument
This instrument (Roche) is an air cycler allowing rapid PCR combined withreal-time amplicon detection (Chapter 9). An additional feature allowingmelting curve analysis also makes the instrument suitable for rapid productanalysis and mutation detection studies. The instrument has the benefitsof an air cycler in facilitating rapid cycling allowing 30–40 cycles to beperformed in 20–30 min and accepts up to 32 capillaries in a carousel. Theglass capillary also facilitates fluorescent signal detection by acting as anoptical element. The carousel is rotated to position each capillary above thefluorescence monitoring unit which comprises a light-emitting diode lightsource (470 nm emission) and three band-pass filters (530, 670 and 710nm) allowing simultaneous detection of three fluorophores. Fluorescenceoutput is displayed in real time. Lightcyclers that use 96 and 384 well plateformat are also available. Further detailed information can be found athttp://www.roche-applied-science.com/.
60 PCR
In situ PCR instruments
Instruments are also available for performing in situ PCR experiments basedon microscope slides. Essentially such instruments are rather similar tostandard thermal cyclers except that they must have a special block capableof accepting slides that have been appropriately sealed to ensure reagentsremain in contact with the samples during cycling. Eppendorf hasdeveloped an in situ adapter that fits on universal blocks of the EppendorfMastercycler thermal cyclers. This adapter, with room for up to fourstandard glass slides, provides perfect control of sample temperature. Theadapter also contains a removable humidity chamber. Further detailedinformation can be found at http://www.eppendorf.com.
Further reading
Bebenek K, Kunkel TA (1995) Analyzing fidelity of DNA polymerases. MethodsEnzymol 262: 217–232.
McPherson MJ, Jones KM, Gurr S-J (1991) PCR with highly degenerate primers. InMcPherson MJ, Quirke P, Taylor GR (eds) PCR1: A Practical Approach,pp. 171–186. Oxford University Press, Oxford, UK.
References
1. Eckert KA, Kunkel TA (1995) The fidelity of DNA polymerases in the polymerasechain reaction. In McPherson MJ, Quirke P, Taylor GR (eds) PCR2: A PracticalApproach, pp. 225–244. Oxford University Press, Oxford, UK.
2. Suggs SV, Wallace RB, Hirose T, Kawashima EH, Itakura K (1981) Use ofsynthetic oligonucleotides as hybridization probes. 3. Isolation of cloned cDBAsequences for human β-2-microglobulin. Proc Natl Acad Sci USA 78: 6613–6617.
3. Sambrook J, Fritsch EF, Maniatis T (1989) Molecular Cloning: A Laboratory Manual(2nd edition). Cold Spring Harbor Laboratory Press, Cold Spring Harbor, NY.
4. Wu DY, Ugozzoli L, Pal BK, Qian J, Wallace RB (1991) The effect of temperatureand oligonucleotide primer length on the specificity and efficiency of ampli-fication by the polymerase chain reaction. DNA Cell Biol 10: 233–238.
5. Nichols R, Andrews PC, Zhang P, Bergstrom DE (1994) A universal nucleosidefor use at ambiguous sites in DNA primers. Nature 369: 492–493.
6. Loakes D, Brown DM (1994) 5-Nitroindole as an universal base analog. NucleicAcids Res 22: 4039–4043.
7. Brock TD, Freeze H (1969) Thermus aquaticus gen. n. and sp. n., a nonsporulat-ing extreme thermophile. J Bacteriol 98: 289–297.
8. Kunkel TA, Soni A (1988) Exonucleolytic proofreading enhances the fidelity ofDNA synthesis by chick embryo DNA polymerase-λ. J Biol Chem 263: 4450–4459.
9. Bebenek K, Joyce CM, Fitzgerald MP, Kunkel TA (1990) The fidelity of DNAsynthesis catalyzed by derivatives of Escherichia coli DNA polymerase I. J BiolChem 265: 13878–13887.
10. Kunkel TA (1985) The mutational specificity of DNA polymerase-b during invitro DNA synthesis – production of frameshift, base substitution and deletionmutations. J Biol Chem 260: 5787–5796.
11. Fodde R, Losekoot M (1994) Mutation detection by denaturing gradient gelelectrophoresis (DGGE). Hum Mut 3: 83–94.
12. Eckert KA, Kunkel TA (1991) The fidelity of DNA polymerases used in PCRs. InMcPherson MJ, Quirke P, Taylor GR (eds) PCR1: A Practical Approach,pp. 225–244. Oxford University Press, Oxford, UK.
Reagents and instrumentation 61

13. Kong H, Kucera RB, Jack WE (1993) Characterization of a DNA polymerase fromthe hyperthermophile archaea Thermococcus litoralis. Vent DNA polymerase,steady state kinetics, thermal stability, processivity, strand displacement, andexonuclease activities. J Biol Chem 268: 1965–1975.
14. Barnes WM (1994) PCR amplification of up to 35-kb DNA with high fidelityand high yield from lambda bacteriophage templates. Proc Natl Acad Sci USA 91:2216–2220.
15. Jackson DP, Hayden JD, Quirke P (1991) Extraction of nucleic acids from freshand archival material. In McPherson MJ, Quirke P, Taylor GR (eds) PCR1: APractical Approach, pp. 29–50. Oxford University Press, Oxford, UK.
16. Hoss M, Pääbo S (1993) DNA extraction from Pleistocene bones by silica-basedpurification method. Nucleic Acids Res 21: 3913–3914.
17. Pääbo S (1989) Ancient DNA: extraction, characterization, molecular cloningand enzymatic amplification. Proc Natl Acad Sci USA 86: 1939–1934.
18. Krings M, Stone R, Schmitz H, Krainitzki M, Stoneking M, Pääbo S (1997)Neanderthal DNA sequences and the origin of modern humans. Cell 90: 19–30.
19. Stone AC, Stoneking, M (1998) mtDNA analysis of a prehistoric Oneota popu-lation: implications for the peopling of the new world. Am J Hum Genet 62:1153–1170.
20. Nasidze I, Stoneking M (1999) Construction of larger-size sequencing templatesfrom degraded DNA. BioTechniques 27: 480–481.
21. Hoss M, Pääbo S, Vereshchagin NK (1994) Mammoth DNA sequences. Nature370: 333.
22. Cano RJ, Poinar HN (1993) Rapid isolation of DNA from fossil and museumspecimens suitable for PCR. BioTechniques 15: 432.
23. Cano RJ, Poinar HN, Pieniazek NJ, Acra A, Poinar GO (1993) Amplification andsequencing of DNA from a 120–135 million year old weevil. Nature 363:536–538.
24. De Salle R, Gatesy J, Wheeler W, Grimaldi D (1992) DNA sequences from a fossiltermite in oligomiocene amber and their phylogenetic implications. Science 257:1933–1936.
25. Golenberg EM, Giannasi DE, Clegg MT, Smiley CJ, Durbin M, Henderson D,Zurawski G (1990) Chloroplast DNA sequences from a miocene magnoliaspecies. Nature 344: 656–658.
26. Poinar HN, Cano RJ, Poinar GO (1993) DNA from an extinct plant. Nature 363:677.
62 PCR

Protocol 3.1 Phosphorylation ofthe 5¢-end of an oligonucleotide
EQUIPMENT1.5 ml microcentrifuge tube
Adjustable heating block or water bath
Ice bucket
MATERIALS AND REAGENTSPolynucleotide kinase and accompanying buffer
10 mM ATP solution
DNA template, i.e. an oligonucleotide primer
Sterile double distilled water or equivalent
1. Mix the following reagents in a microcentrifuge tube:● 2 µl 10 × kinase buffer (supplied with enzyme);● 5 µl primer (20 pmol µl–1);● 2 µl 10 mM ATP;● 1 µl polynucleotide kinase (5–10 units);● 10 µl water.
2. Incubate at 37°C for 30 min.
3. Inactivate the kinase by heating to 90°C for 5 min.
4. Place on ice if to be used immediately, or store at –20°C forlater use.
Reagents and instrumentation 63


Optimization of PCR
4.1 Introduction
Depending on the success of your PCR amplification it may be necessaryto optimize the conditions. This Chapter deals with various aspects of PCRoptimization including reagents, temperatures, enhancers and preventingcontamination. There is also a troubleshooting guide that will hopefullyhelp you identify the source of any problems.
Control reactions
It is important to perform control reactions in parallel with the test samplesto indicate whether any specificity (Section 4.2) or contamination (Section4.5) problems exist. At least two controls are essential, a reaction contain-ing no DNA and one containing no primers. You should think of thecontrol reactions as being just as important as your test samples and thereare times when you may wish to include more controls. For example, if youare beginning to work with a new pair of primers, it is a good idea to includecontrols containing single primers. In this way you can see whether anyproducts are generated from either of the primers alone, rather than by thetwo working in combination.
4.2 Improving specificity of PCR
Primer pairs do not all work under the same reaction conditions. In somecases under ‘standard’ conditions one pair of primers will work veryefficiently and give rise to a unique product in large amounts. At the sametime, and under identical reaction conditions with the same templateDNA, another primer pair will give rise to either no product, or to acomplex pattern of extraneous products. Even more perplexing, some-times you can take one primer (primer A) that you know works well withprimer B, but when you use it in combination with a new primer C, thePCR fails.
The rules governing the operating characteristics of a primer pair are notdefined. In essence the strategy that is usually followed for a new primerpair is to start with ‘standard’ amplification conditions (such as Protocol 2.1).If the PCR is not optimal then one of the reaction parameters should bechanged to increase or decrease the stringency of the reaction conditionsappropriately. If no bands are detected then the stringency may be too highwhilst if several bands are seen then the stringency should be increased.How do you set about this optimization task? Are there standard rules oris it an empirical ‘hit-and-miss’ process? The answer lies somewherebetween these two extremes. The most important parameters that will
4

influence reaction specificity are the annealing temperature, the cyclingregime and the buffer composition.
High specificity in PCR is favored by:
● optimal concentration of Mg2+, other ions, primers, dNTPs and DNApolymerase;
● efficient denaturation, high annealing temperatures and fast rampingrates;
● touchdown PCR;● hot-start PCR;● booster PCR;● limiting the number of cycles and their length;● thermal cycler efficiency;● PCR additives;● template quality (Section 4.3);● nested PCR (Section 4.4).
Magnesium ions
As you already know (Chapter 3) the concentration of magnesium ions(Mg2+) is critical. It exists as dNTP-Mg2+ complexes that interact with thesugar-phosphate backbone of nucleic acids and influence the activity of theDNA polymerase. So, altering the concentration of MgCl2 can lead to oneprimer/template pair behaving significantly differently from another underidentical conditions. The usual strategy for assaying the effect of Mg2+ ionconcentration is to adjust the standard buffer so that the MgCl2 concen-tration varies between 0.5 and 5 mM, usually in steps of 0.5 or 1 mM. Oftenone concentration will show a significantly improved PCR product pattern.Remember also that you will change the Mg2+ concentration if you alter theconcentration of dNTPs in the reaction (Chapter 3). If the Mg2+ concentra-tion is too low then yields are likely to be poor while excess Mg2+ can reducethe fidelity of Taq DNA polymerase and lead to amplification of nonspecificproducts.
Other ions
A study by Blanchard et al. (1) has gone some way towards standardizingbuffer conditions and variations that may lead to rapid optimization ofPCRs. They used a set of buffers called TNK that contain Tris-HCl (pH 8.3),ammonium chloride (NH4Cl), potassium chloride (KCl) and magnesiumchloride (MgCl2) and analyzed the effects of varying the concentrations ofthese buffer components. Interestingly, they found that potassium andammonium ions, which in many biological systems behave interchange-ably, gave opposite effects in the PCR. Increasing KCl leads to a reducedstringency by affecting the melting characteristics of DNA by neutralizingthe negative charge of the phosphate groups of the backbone so that thehydrogen bonding between bases becomes more important. Indeed at veryhigh KCl concentrations (>0.2 M) this stabilizing effect becomes sopronounced that the DNA strands will not denature at 94°C and thereforeno PCR can occur.
66 PCR

DNA polymerase concentration
If you have no product band(s) or weak band(s) you may have too littleDNA polymerase. Different versions of thermostable DNA polymerase canbe supplied at a variety of specific activities and concentrations. To checkwhether this is the problem you can perform a titration with varyingamounts of DNA polymerase. Thermostable proofreading DNA polymerasescan have lower processivity than Taq DNA polymerase, affecting yield, andso more enzyme may be needed for successful amplification. It is alsoimportant to remember that thermostable polymerases will become inacti-vated at high temperatures and this can lead to reduced levels of product.So, try to limit the time the enzyme spends above 90°C by using a shortdenaturation time at 94°C, say 15 s, or a lower denaturation temperatureof 92°C rather than the 94°C recommended in many protocols.
Temperatures
Denaturation
It is important that the template is efficiently denatured in order to providesingle-stranded templates for PCR. This is achieved during the initial,usually 5 min denaturation phase when the sample is heated to around94°C. If this step is inefficient then partially denatured duplex moleculeswill rapidly reassociate to prevent efficient primer annealing and DNAextension. For GC-rich templates it may be necessary to increase thetemperature of this step to, for example, 96°C. However, it is not clear thatsuch an extended time is required for many applications. With theexception of GC-rich templates, or where you are using a hot-start enzyme,the time could probably be reduced to 1 or 2 min. This would have theadditional benefit of extending the useful life of the thermostable DNApolymerase. At the start of each cycle there is a shorter denaturation stepthat should denature the PCR products for subsequent reaction. Whilemany protocols use a 94°C step here, for many templates it may besufficient to use a temperature of 90–92°C, although GC-rich ones mayrequire a higher temperature. It is useful to try to use the lowest effectivetemperature for the shortest effective time in order to retain the highestDNA polymerase activity in the reaction.
Annealing
The success of a PCR relies heavily on the specificity with which a primeranneals only to its target (and not nontarget) sequence so it is importantto optimize this molecular interaction. Whether a primer can anneal onlyto its perfect complement, or also to sequences that have one or moremismatches to the primer, depends critically upon the annealingtemperature. In general the higher the annealing temperature the morespecific the annealing of the primer to its perfect matched template and sothe greater the likelihood of only target sequence amplification. The lowerthe temperature, the more mismatches between template and primer canbe tolerated leading to increased amplification of nontarget sequences. Inpractice it is often feasible to start at a temperature such as 55°C and assess
Optimization of PCR 67

the success of your PCR. If there is poor recovery of product and a highbackground of nonspecific products then empirical determination of anoptimal annealing temperature may be necessary, coupled with optimiza-tion of the MgCl2 concentration (see above). It is also worth checking thatthe time for annealing is not too long. Generally about 30–60 s is reportedin methods and the shorter the better. Since the polymerase will have someactivity at the annealing temperature, the longer you hold the reaction atthis temperature the increased risk there is of amplification of nonspecificproducts.
Adjusting the annealing temperature step can alter the specificity of pair-ing between template and primer. If there is no product, the temperaturemay be too high and can be reduced, for example from 55°C to 50°C inthe first instance. At the new temperature the primers may be moreefficient. If there are products in control lanes where only one primer ispresent this indicates that the single primer is annealing to more than oneregion of the template and generating products. In this case you shouldincrease the annealing temperature. As described in Chapter 3 thermalcyclers are now widely available that have a gradient block, allowing thesimultaneous determination of optimal annealing temperature profiles inone reaction. By aliquoting a reaction premix into a series of tubes, the onlyvariable should be the annealing temperature applied by the gradient block.If you do not have access to such an instrument an appropriate way tooptimize primer/template annealing is to test by setting up PCR reactionsand carrying out a series of experiments with 2–5°C adjustments of theannealing temperature.
There are examples of two-step PCR where the primers can anneal to thetemplate at 72°C thereby allowing cycling between the denaturationtemperature and the extension temperature. Two-step PCRs are oftenperformed for difficult PCRs such as amplification of large fragments fromgenomic DNA.
Several approaches that rely upon temperature-based control of primerannealing have proven useful in improving the specificity of primer anneal-ing and therefore of amplification of the desired product. These areconsidered in the next two Sections.
Touchdown PCR
Touchdown PCR starts initially with an annealing temperature higher thanthe Tm of the primers and then at each of the earlier cycles of the PCR theannealing temperature is lowered gradually to below the Tm. This ensuresthat only specific annealing of the primers to their correct target sequencetakes place before any nonspecific annealing events. A good rule of thumb,described by Don et al. (2), when using primers about 20 nucleotides inlength, is to reduce the annealing temperature by 1°C every 2 cycles movingfrom 65°C to 55°C over the first 20 cycles. The reaction should then becompleted by another 10 cycles at a 55°C annealing temperature. Since thefirst products to be made are specific products, this increases the concen-tration of true target sequences in the early stages of the PCR therebyenhancing the accumulation of true product as the amplification continuesat a less specific annealing temperature.
68 PCR

Hot-start PCR
Even if you take great care in designing primers and in determining themost appropriate annealing conditions, specificity problems can arise evenbefore the first cycle of PCR. How is this possible? Consider what happenswhen the various reagents and template are added to the PCR tube at roomtemperature or on ice and then placed in a thermal cycler to start thereaction. The tube may be left for some time before being placed in thethermal cycler. It is then heated up to 95°C in order to denaturethe template. However, during the time it is standing at or below roomtemperature, until it reaches a temperature of around 65 to 70°C, non-specific primer/template and primer/primer annealing events may occur toprovide substrates for the DNA polymerase. Any products formed in thismanner will be templates for subsequent amplification resulting in non-specific products and/or primer-dimers. The simplest way of avoiding suchspurious priming events by enhancing correct primer annealing is by theuse of a ‘hot-start’ procedure (3–5), which relies upon the physicalseparation of reagents until a high temperature has been reached. One ormore reactant is omitted until the temperature of the reaction is above70°C. The final reactant(s) can then be added to allow the reaction toproceed.
There are various strategies for performing hot-start PCR; the cheapestprocedure is to set up the complete reactions without the DNA polymeraseand incubate the tubes in the thermal cycler to complete the initialdenaturation step at >90°C. Then, while holding the tubes at a tempera-ture above 70°C, the appropriate amount of DNA polymerase can bepipetted into the reaction. But remember if you are using mineral oil youmust put the pipette tip through the mineral oil layer first, so that thepolymerase is introduced into the reaction rather than floating around ontop of the oil. This approach can be used in a research laboratory whererelatively small numbers of reactions are being performed. However, it isnot suitable for processing large numbers of samples due to:
● the time involved in making additions of enzyme to individual tubes;● the ‘loss-of-concentration’ phenomenon leading to failure to add
enzyme to one or more tubes; and● the opportunity for contamination due to the need to open the tubes
(Section 5).
Various commercial reagents are now available to facilitate hot starts andsuch products are recommended for routine hot-start applications. Someexamples are given below.
Inactive DNA polymerase
Probably the most common approach used for hot start is DNA polymerasewhose polymerase and in some cases 3′→5′ exonuclease activity has beeninhibited by the physical binding of inactivating monoclonal antibodiesthat prevent it reacting with substrates (Figure 4.1). This allows all thereaction components to be mixed together in the absence of anypolymerization. When the reaction reaches a high temperature the anti-
Optimization of PCR 69

body(s) denatures thereby releasing the thermostable DNA polymerase inan active form, allowing polymerization (Figure 4.1). There are many DNApolymerases of this type sold by a range of companies. These requiresufficient time during the initial denaturing step to inactivate the anti-bodies, but usually this is achieved by a 5 min soak at 94°C. Even if it isnot fully activated during this step, it will activate during thermal cyclingat each denaturation step during the early cycles of a PCR.
Hot-start procedures are most useful when low concentrations of acomplex template, such as genomic DNA, are being used. However,artefactual amplifications can occur in any reaction and it is generallyrecommended that all PCRs should be performed under a hot-startprocedure.
Wax beads
The principle of wax beads, such as Ampliwax (Applied Biosystems) orDyNAwax (Finnzymes), is to physically separate some reaction componentsuntil the entire reaction has reached a high temperature, where misprimingevents will not occur. As illustrated in Figure 4.2, some reactants, such asbuffer, dNTPs, primers, template DNA and Mg2+, are placed in the reactiontube. A wax bead is added and the reaction incubated in the thermal cyclerat 75–80°C for 5–10 min to melt the wax. The tube is then cooled to below35°C to allow the wax to solidify and form a barrier layer above the initialreactants. The thermostable DNA polymerase can then be pipetted on tothe wax layer and the PCR cycling started. As the temperature rises the waxmelts and the enzyme becomes mixed with the other reactants to initiatethe PCR while the wax rises to the surface. The wax layer has the added
70 PCR
Add DNA polymerase/MAb complex
As temperature reaches >70°C antibodydenatures and activates polymerase
DNA polymerase remains inactivedue to antibody inhibition
Active DNA polymerase releasedwhen antibody denatures so PCRis initiated
Figure 4.1
Hot-start PCR using a thermostable DNA polymerase-inactivating antibodycomplex. The antibody sterically blocks the enzyme active site preventing theDNA polymerase from functioning until the antibody is denatured at hightemperature.

benefit of providing a barrier against evaporation during thermal cycling,in place of mineral oil. It also serves as a physical barrier to protect samplesfrom contamination during subsequent storage and processing. After PCRwhen the tubes cool the wax solidifies and samples can be taken by insert-ing a pipette tip through the wax layer. It may be possible to use analternative source of paraffin wax such as that from Sigma-Aldrich whichmelts at 53–56°C.
Taq Bead™ hot-start polymerase
These small spherical beads supplied by Promega comprise wax encapsu-lating Taq polymerase that is released when the reaction reaches 60°C.Unlike the wax beads above the volume of wax is small and does not forma physical barrier above the reaction solution. The beads are suitable for usein either standard or heated-lid thermal cyclers, but for the former additionof a mineral oil overlay is necessary.
Optimization of PCR 71
Add wax bead
Add dNTPs, buffer,DNA, MgCl2
Wax layer
75–80°C5–10 minto melt wax
Cool below35°C toreset wax
Add DNApolymerase
Cool below35°C, waxresets Thermal cycling
Wax layerReagents mixduring firstcycle
Figure 4.2
Hot-start procedure using wax beads. Some reagents are added to the tube beforea wax bead is added and melted. Once the wax has solidified to form a barrierover the reactants, the missing reagents are pipetted onto the wax layer. Whenthe wax layer melts during the first heating step of the PCR all the reagentsbecome mixed and the reaction is initiated.

Magnesium wax beads
The presence of magnesium is essential for DNA polymerase activity. PCRreaction mixes set up in magnesium-free buffer can be activated at around70°C when a StartaSphere™ wax bead (Stratagene) melts, releasing thecorrect amount of magnesium. These beads are small and nonbarrier-forming and so are compatible with heated-lid thermal cyclers. Mineral oilshould be added for a non-heated lid thermocycler.
Booster PCR
The appropriate choice of annealing conditions allows primers to efficientlyidentify their complementary sequences when reasonable concentrationsof DNA are being used, for example 1 µg of human genomic DNA (around3 × 105 template molecules). However, at very low template concentrations,perhaps less than 100 molecules, the interactions between primers andtemplate become less frequent. Instead there are more significant inter-actions between primers themselves, which can lead to primer-generatedartifacts such as primer-dimers (Chapter 3). To enhance the specificity oftemplate priming at low DNA concentrations a procedure called boosterPCR can be employed (6). This involves performing the first few cycles ofPCR at low primer concentration, so that the molar ratio of primer:templateis around 107–108, the level normally found in a PCR (see Table 2.2). Thisenhances specific priming events and subsequently the concentration ofprimers can be ‘boosted’ during the amplification phase to maintain the108 ratio of these reactants.
Cycle number and length
In general the number of cycles of PCR should be kept to the minimumrequired to generate sufficient product for further analysis or manipulation.This reduces the likelihood of errors arising and of nonspecific productsaccumulating. If the basic protocol (Protocol 2.1) does not yield sufficientproduct you could try to increase the amount of template in the firstinstance. Alternatively the number of cycles of PCR could be increased. Itis possible to sample PCRs by removing an aliquot such as 0.1 vol (5 µl ofa 50 µl vol) every 5 cycles at 25, 30 and 35 cycles during a 40-cycle reaction.The samples can then be analyzed by agarose gel electrophoresis to allowthe appropriate number of cycles to be determined. This number will bethe minimum number that gives good yield of a single product.
Another consideration that can influence PCR specificity is the timetaken to move between temperatures during PCR cycling (7). Generally thefaster the ramping rates the higher the specificity and the faster thereactions are completed. Some instruments can now achieve ramp rates ofup to 2.5°C per s–1.
Thermal cycler efficiency
It is easy to forget that instruments may malfunction. If your PCRs beginto fail then you should ask whether the thermal cycler is reaching the
72 PCR

correct temperatures. Newer instruments have self-diagnosis features thatcan identify problems. As thermal cyclers get old they can tend to becomeless accurate in terms of their temperature profiles and often need adjust-ments. It is therefore worth using an independent temperature monitoringsystem occasionally, and certainly if variability in standard PCR resultsoccurs. Temperature verification systems are available but are often veryexpensive. A simple and inexpensive temperature monitoring system canbe made from a thermocouple, placed in a reaction tube containing water,and a digital thermometer. Even less expensive is to use a thin digitalthermometer that fits inside a reaction tube filled with water. Thetemperature reached by the thermal cycler during PCR cycling can easilybe monitored. In addition the system allows any temperature variationacross the block to be assessed.
PCR optimization and additives
It is possible to purchase optimization kits that comprise a variety of buffersand additives to optimize conditions for PCR. For example, Stratageneproduce an Opti-Prime™ PCR optimization kit comprising 12 differentbuffers and 6 additives, allowing a range of buffer conditions to be tested.Once optimized conditions have been determined the appropriate buffercan be purchased separately. Epigene also produce a Failsafe PCRoptimization kit comprising a range of buffers.
Various ‘enhancer’ compounds have also been reported to improve thespecificity or efficiency of PCR. These include chemicals that increase theeffective annealing temperature of the reaction, DNA binding proteins andcommercially available reagents. Such additives can be added to PCRs toenhance primer annealing specificity, reduce mismatch primer annealingand improve product yield and length. Additives that lead to a destabiliza-tion of base pairing can improve PCR particularly from difficult templatessuch as GC-rich sequences and may also increase specificity by theirrelatively greater destabilization of mismatched primer–template complexes.Although these compounds can be useful in some circumstances to improvesuboptimal PCR conditions, some are not applicable to a wide range oftemplates and primer combinations. There is no ‘magic’ additive that willensure success in every PCR and it may be necessary to test differentadditives under different conditions, such as annealing temperature. Suchtesting has been made easier with the advent of gradient thermal cyclersthat allow the automatic testing of different annealing temperatures(Chapter 3). Compounds that have been added to PCR reactions include:
● dimethyl sulfoxide (DMSO), up to 10% (8);● formamide at 5% (9);● trimethylammonium chloride 10–100 µM (10);● betaine (N,N,N-trimethylglycine) 1–1.3 M. A useful study and primary
references are provided in Promega Notes http://www.promega.com/pnotes/65/6921_27/6921_27_core.pdf;
● nonionic detergents (11) such as Tween® 20 at 0.1–2.5%;● polyethylene glycol 6000 (PEG) 5–15%;● glycerol 10–15%;
Optimization of PCR 73

● single-stranded DNA binding proteins such as Gene 32 protein(Amersham Pharmacia Biotech) added to 1 nM or E. coli single-strandedDNA binding protein at 5µM;
● 7 deaza-dGTP to reduce the strength of G–C base pairs; it is used at 150µM with 50 µM dGTP as the G nucleotide mix;
● Taq Extender™ (Stratagene) increases Taq DNA polymerase DNAextension capacity leading to a greater proportion being fully extended.This is due to a reduction in the mismatch pausing when Taq DNApolymerase is dissociated from the template;
● Perfect Match® PCR Enhancer (Stratagene) apparently destabilizes mis-match primer template complexes where there are several mismatchesclose to the 3′-end. Perfect or near-perfect matched primer–templatecomplexes including those with nonhomologous 5′-ends or tails are notdestabilized and therefore generate good yields of product;
● Q-solution (Qiagen) modifies the melting behavior of template DNA, isused at a defined concentration for any template–primer combinationand is not toxic.
The two additives that are probably most useful are DMSO, which disruptsbase pairing and is usually added to 5–10% (v/v), and betaine (~1 M), whichequalizes contributions of GC and AT base pairs towards duplex stability. Itis advisable to adjust the denaturation, annealing and extensionstemperatures down by perhaps 2°C when using betaine to adjust conditionsfor the weakening of the duplex bonding interactions and enzyme stability.In an interesting study undertaken by Promega they used NMR to analysethe constitutents of two commercially available PCR enhancer solutions anddiscovered that they were solutions of betaine (see http://www.promega.com/pnotes/65/6921_27/6921_27_core.pdf).
An example showing the effect of DMSO addition is shown in Figure 4.3.
74 PCR
M 1 2 3 4 M–DMSO +DMSO
7 kb
Figure 4.3
Agarose gel showing the effect of DMSO on PCR amplification. Lanes 1 and 2show PCR amplification without DMSO, while lanes 3 and 4 show PCRamplification with 5% DMSO (final concentration). Lanes 1 and 3 are performedat 60°C annealing temperature and lanes 2 and 4 are performed at 58°Cannealing temperature. (Provided by Dr Luis Lopez-Molina, Laboratory of PlantMolecular Biology, Rockefeller University.)
M 1 2 3 4 M
−DMSO +DMSO
7 kb

4.3 Template DNA preparation and inhibitors of PCR
PCR may be inhibited by a wide range of compounds derived from thebiological specimens or method and reagents used to extract the DNA.Typical biological samples used for PCR are animal tissues and bodily fluids,including peripheral blood cells, urine, fecal samples, cell smears, hair roots,semen, cerebrospinal fluid, biopsy material, amniotic fluid, placenta andchorionic villus, bacteria, forensic and archaeological samples and planttissues. Often PCRs are performed on relatively crude DNA preparationsthat contain unidentified inhibitory substances, and appropriate PCRcontrols are essential to eliminate the possibility of inhibition. Often ifinhibition is occurring it is useful to dilute the DNA sample (Figure 4.4).This will have the effect of diluting both the template DNA and theinhibitor. If the inhibitor becomes diluted to a concentration that does notinterfere with PCR then products should be obtained from the templateDNA even if this requires a modest increase in the number of cycles. Acommon source of human DNA is blood, which should be collected intotubes containing 1 mg ml–1 EDTA to avoid coagulation. Heparin, a commonanticoagulant, should be avoided, as it is a potent PCR inhibitor. Othersubstances in blood, perhaps porphyrin compounds, also inhibit PCR butcan be removed by lyzing red blood cells and collecting the white cells bycentrifugation for DNA preparation.
Optimization of PCR 75
2 kbp
M 50 ng 100 ng 200 ng
Figure 4.4
The effect of dilution of the DNA sample to enhance specificity of PCR. DNAconcentrations are shown in ng. If the DNA sample contains a contaminant thendiluting the sample can lead to dilution of the contaminant and successfulamplification of the product. In this case the product can be seen only in thelowest dilution of the sample containing 50 ng DNA.
The variety of DNA sources demands a variety of extraction proceduresthat may include inhibitory compounds. For example, detergents are oftenused for cell lysis and protein denaturation. Nonionic detergents such asTriton X100, Tween 20 and Nonidet P40 usually do not inhibit PCR atconcentrations up to 5%. By contrast, ionic detergents such as sodiumdodecyl sulfate (SDS) are only tolerated at very low concentrations (< 0.01%)and should be removed by using a PCR clean-up kit or by phenol extractionand ethanol precipitation of the DNA before PCR. Adding 0.5% Tween 20or Nonidet P40 may reverse inhibition at low SDS concentrations. Oftenextraction protocols use proteinase K to digest denatured proteins. It isimportant to remove or inactivate this protease before PCR, as Taq DNApolymerase is susceptible to digestion. Typically the sample is heated to90–95°C and then phenol extracted and ethanol precipitated (seeChapter 6).
4.4 Nested PCR improves PCR sensitivity
Sometimes, no matter what you try, the specificity of your reaction may bevery low, resulting in mispriming and the generation of false amplificationproducts. Nested PCR provides a tool for increasing sensitivity allowing youto ‘fish out’ the specific amplification product from the ‘sea’ of nonspecificproducts. Since nested PCR is covered in more detail in Chapter 5 only theprinciple will be described briefly here.
Even if PCR primers have amplified nonspecific sequences, making itimpossible to identify the desired product, it is highly unlikely that thesenonspecific products will also have sites for a further pair of ‘nested’ specificprimers. These nested primers are designed to anneal to sequences that willbe present within the correct target PCR product. The true product willpossess such nested primer target sequences while nontarget sequenceswill not. So, a second PCR using nested primers, designed to amplify aninternal region of the original amplified product, should lead to a 104
enhancement of the true product over nonspecific products (Figure 4.5).Quite simply, a small aliquot of the first PCR, perhaps 1 µl of a 1-in-10 or1-in-100 dilution can be used as the template for the nested PCR.
4.5 Contamination problems
Having considered how to optimize your reactions to reach the highestspecificity and product yield, it is important to understand the potentialproblems of contamination. Great care should be taken to avoid contami-nating your PCRs since this can be costly in terms of wasted time andreagents and potentially, in laboratories where clinical diagnosis or forensicanalyses are performed, it could affect people’s lives. The ability of PCR toamplify minute amounts of template DNA offers great advantages fordetecting the target sequence, even in complex starting materials, but it hasthe disadvantage that small quantities of contaminating DNA may also beamplified. The analogy between PCR and good microbiological practice isa valid one. When dealing with potentially pathogenic bacteria, thescientist takes the necessary precautions to ensure that the bacteria arecontained and do not contaminate the environment. In a similar way, the
76 PCR

PCR is prone to contamination from DNA molecules present in thelaboratory environment. There are some major sources of DNA contami-nation that can be introduced through bench surfaces, laboratoryequipment, pipettors, airborne particles such as microbes and debris suchas skin or hair, or contaminated solutions. The contamination may be dueto new template such as microbial or particulate aerosols, often giving riseto a sporadic contamination of single samples.
More general contamination is due to:
● original template DNAs;● cloned DNA molecules carrying the target gene;● previously PCR-amplified molecules.
In general the same rules can be applied to prevent all types of contami-nation, although there are additional steps that you can take to prevent the
Optimization of PCR 77
Template DNA
PCR leads to nonspecificamplification and failureto identify true product
Smear of productsprevent identificationof true product
Nested PCR with internalprimers only amplifies fromthe true product and notfrom nonspecific products
Single nestedproduct bandobvious
M PCR1
M PCR2
Figure 4.5
Schematic illustration of nested PCR from genomic DNA. The first-round PCRamplification results in a smear of nonspecific amplification products masking thetarget product. The second round of amplification uses a pair of nested primersthat lie within the target region, leading to the amplification of only the correctproduct. M; molecular size markers. PCR1 and PCR2; amplified product(s) fromthe first PCR and the nested PCR respectively.

latter form which is usually known as ‘carryover’ contamination. Also, thetype of PCR experiments you are doing will affect the potential for contami-nation of your PCRs. For example, if you work in a research laboratorywhere different genes are being studied and manipulated, the problems ofcontamination are generally much easier to contain and, in the event of aproblem, to track down and overcome. This contrasts with, for example, aclinical diagnosis laboratory, where multiple samples are routinelyprocessed in the same way and hundreds of identical PCRs are performedto identify a particular genetic disease. Contamination in such an environ-ment would be disastrous, and unfortunately is much more easily achieved,and so requires the most rigorous steps to prevent any possible problems.
Probably the most serious source of contamination is carryover from apreviously processed PCR. However, there are correct ways of setting up aPCR and relatively simple procedures for ensuring that any contaminatingmolecules are destroyed. You should set yourself a high standard andshould aim to become a perfect practitioner of the PCR. Do not be put offby the person on the next bench who ‘just throws everything in’ or evenworse ‘never bothers about controls’. They may try to persuade you to adopttheir slap-dash methods because it will save you time. Do not be tempted.What you are doing now may not be too sensitive to contamination butyou may be doing something very different next month or next year, andgood practice that becomes second nature now will prevent serious errorslater. A short article by Kwok and Higuchi (12) describes probable contami-nation problems and gives some useful advice on prevention. To highlightthe potential problem they calculated that if you were to dilute a completed100 µl PCR reaction into the water of an Olympic-sized swimming pool andthen, after mixing, were to remove a fresh 100 µl aliquot, it would containsome 400 molecules of DNA.
Control reactions
You should routinely set up control reactions as described in Section 4.1.In addition it is a good idea to set up the control reactions as the last in aseries so that any cross-contamination can be detected; for example ifcontamination of a premix (see ‘Premixes’, below) occurs during the PCRset-up then the early reactions may not be contaminated, but later onesmay be. This will be detected if controls are set up last.
A designated PCR set-up area
It is best to try to avoid setting up PCRs in the same area as you processpost-PCR samples. Small PCR cabinets or chambers with built-in UV lampsto destroy template DNA and maintain a contamination-free environmentare available. Alternatively, set up your PCRs in another room, preferablyone dedicated for that purpose. If these options are not available then usea separate bench in the laboratory as a PCR area. Whatever solution youcome up with for keeping the set-up and post-PCR areas separate, followthe rule that ‘separation helps prevents contamination’. Always wear freshgloves when setting up reactions and work on clean surfaces regularlywashed down with 1% sodium hypochlorite and ethanol.
78 PCR

Pipettes and tips
Even moving to another building will not prevent contamination prob-lems if it is you that takes the contaminants with you! Likelycontamination sources are aerosols from opening tubes containing DNAor from pipettes. The latter will be a particular problem if you only haveone set of pipettes that you use for both setting up PCRs and for themanipulation of the resulting solutions. It is therefore important to havea dedicated set of pipettes for setting up the reactions. Additionalmeasures to ensure clean pipetting will, to a large extent, be governed byyour budget. A simple way of trying to keep things clean is to regularlywipe the tip of the pipette barrels with ethanol-soaked tissue. However,do not soak the pipette in ethanol or suck any up into the barrel, becauseit will be added to the reaction next time you perform a pipetting step.Various special tips are available that contain a filter to prevent anyexchange of aerosol or solution between the pipette barrel and thesolution being pipetted. Such tips work well, although they are moreexpensive than ordinary pipette tips. Even if you cannot afford to usethem for every pipetting step there are several stages of setting up PCRswhere they are invaluable:
● for removing aliquots of oligonucleotides from stock solutions, since thecontamination of a primer stock is a very serious issue resulting in theneed to resynthesize the oligonucleotide with the inevitable time delayand expense that entails;
● template DNA additions to prevent contaminating your DNA stock.
Finally, positive displacement pipettes are available that employ adisposable piston that makes direct contact with the solution beingaliquoted so there is no air/liquid interface that might allow contaminationin a normal air displacement pipette. They also allow very accurate deliveryof the small volumes. These are relatively expensive, require special tips butare a useful investment.
Solutions
Most enzyme suppliers now provide appropriate buffer stocks, magnesiumsolutions and even dNTP mixes with their enzymes. It can be helpful toaliquot these reagents on arrival to ensure protection from contaminationduring routine use. For other solutions, always use the highest quality ofreagents available and make up solutions using autoclaved ultrapure water.Obviously if any solution is contaminated with DNA then it will contami-nate the reaction(s) to which it is added. As with any DNA work, solutionsshould be autoclaved where possible and, again, aliquoted into appropriatevolumes (often 0.1–0.2 ml) for storage purposes. This allows a single tubeto be taken from the freezer for PCR set-up while the rest of the solutionremains safely frozen. After use the tube can be discarded and a fresh aliquotused for the next set of PCRs. If you encounter any contaminationproblems, throw away any working stocks and use fresh aliquots from yourstocks.
Optimization of PCR 79

Premixes
Where possible you should prepare a premix containing the commonreactants for all the PCRs you are setting up. This reduces the number ofrepetitive pipetting steps and thus potential cross-contamination. Calculatethe required amounts of each reaction component, multiply by the numberof reactions to be set up and add one or two additional reaction volumes toaccount for minor pipetting errors. For example, if you are setting up 10 reac-tions then premix sufficient reactants for 11 or 12 reactions. There is a usefulonline calculator to help prepare premixes at http://www.sigmaaldrich.com/Area_of_Interest/Life_Science/ Molecular_Biology/PCR/Key_Resources/PCR_Tools.html; remember to add an extra 1–2 reactions when doing the calcu-lation. Obviously, when preparing premixes, you should take care to preventcontamination while transferring aliquots from stock solutions. Aliquot thepremix into reaction tubes prior to the addition of other reactants. Rememberto set up the controls last.
Mineral oil
The use of oils is now less common since most thermal cyclers have hot-lidtechnology (Chapter 3). If you still use mineral oil it is important to ensureit does not become contaminated by careless use of a pipette. Pour mineraloil from the stock bottle into a microcentrifuge tube for dispensing andthen discard this aliquot. An alternative is silicone oil,which creates a flatterand clearer phase transition interface. It is available in a dropper bottleformat from Life Technologies/Invitrogen.
Other sources of contamination
There can be particular problems associated with human DNA analysis. Amicroscopic flake of skin or even dandruff is sufficient to contaminate aPCR, potentially leading to an erroneous result. Always wear gloves whensetting up PCRs and ideally use an appropriate PCR hood.
4.6 Preventing contamination
Uracil N-glycosylase
Substituting dUTP for dTTP during PCR provides one route for eliminatingcarryover of previous PCR products. Such dU-containing PCR products aresusceptible to the enzyme uracil N-glycosylase (UNG), which will hydrolyzeuracil glycosidic bonds in both single- and double-stranded DNA. Thisreleases uracil, resulting in strand cleavage when the DNA is heated duringPCR. The enzyme does not affect RNA or normal DNA molecules. It is there-fore an easy task to destroy previous PCR products by including a uracilN-glycosylase pretreatment of the reactant mix prior to PCR. Such a practiceis particularly critical in diagnostic laboratories where routine amplificationof identical products is being performed on a daily basis and the possibilityof cross-contamination is omnipresent, but must be avoided to preventfalse positives and misdiagnosis.
80 PCR

The resulting PCR products contain dU in place of dT and will behavenormally for most forms of post-PCR analysis. For example such products areas effective as dT-containing templates in hybridization protocols and DNAsequencing. In addition the products can be cloned efficiently, although theymust be transformed into an ung– strain of E. coli lacking the normal uracilN-glycosylase activity that would otherwise destroy the cloned DNA.Restriction enzyme digestion is efficient for common enzymes such as EcoRI,and is only slightly reduced for others such as HindIII, although for manyenzymes the efficiency of digestion remains to be determined. Major appli-cations for which dU-containing templates are not recommended includethose involving molecular interactions studies, such as DNA binding assays.
Some proofreading DNA polymerases are inefficient at incorporatingdUTP into PCR products and therefore this approach cannot be used withsuch enzymes, although it is very effective with Taq DNA polymerase. Theenzyme can retain some activity even after treatment at 95°C and there-fore some consideration of this may be necessary if dUTP incorporation isbeing used in a PCR previously treated with UNG. It is recommended thatthe reaction be held at 72°C, or be frozen at –20°C if it is not to be analyzedimmediately. Several manufacturers supply uracil N-glycosylase specificallyfor this purpose, including AmpErase® (Roche) and HK-UNG™ Thermo-labile Uracil N-Glycosylase (EpiCentre).
It has also been reported that incorporating dUTP in place of dTTP duringprimer synthesis can prevent carryover contamination. Treatment of thePCR products with UNG will destroy the original primer regions of the PCRproduct thereby preventing amplification of the full-length product duringa subsequent PCR (13).
UV irradiation
UV treatment of reaction components by illumination at 254 nm has beenused to overcome contamination. This treatment leads principally tothymidine dimerization resulting in the inability of the DNA to functionas a template during the PCR. Remember that the reaction componentsmust be treated before addition of the template DNA or thermostable DNApolymerase! UV irradiation systems, which are often sold predominantlyfor their ability to UV crosslink DNA to nylon membranes, can also be usedto pretreat PCR components. Companies supplying such crosslinkersinclude Stratagene, GE Healthcare, Hoefer Inc., Ultra-Lum, UVP and Cole-Palmer. UV irradiation does not completely destroy contaminating DNAbut it dramatically reduces the concentration, often by a factor of 104. UVhas little effect upon the dNTPs and, perhaps surprisingly, does not appearto affect the short primers significantly. However, this also means that itwill be less efficient at inactivating short contaminating DNAs (<250 bp)than longer DNAs. The UV approach has had a mixed reception and it isnot clear how widely used it is.
Psoralen and isopsoralen treatment
An alternative approach to prevent contamination carryover by pretreat-ment of PCR reactants has been developed (14). Psoralens such as
Optimization of PCR 81

8-methoxypsoralen (8-MOP) intercalate into double-stranded nucleic acidsand result in interstrand crosslinks upon longwave UV irradiation (300–400nm). Treatment of the reaction components (but not the template DNA)with 8-MOP and UV irradiation leads to contaminating DNA moleculesbecoming crosslinked and unable to denature during PCR and thereforethese molecules cannot act as templates. The treatment does not adverselyaffect the primers or DNA polymerase.
A post-PCR treatment can also be used to prevent subsequent carryoverof PCR products. Isopsoralens, for example 4′-aminomethyl-4,5′-dimethyl-isopsoralen (4′-AMDMIP) or 6-aminomethyl-4,5′-dimethylisopsoralen(6-AMDMIP), form covalent monoadducts with double-stranded DNAwhen photo-activated by longwave UV irradiation (15). DNA polymerasesare unable to proceed when they reach such a modified base and socontaminating DNA cannot act as template in a subsequent PCR. Thetreatment involves addition of the isopsoralin at the start of the PCR anda post-PCR irradiation to modify the products to ensure they are unable tocontaminate further PCRs.
4.7 Troubleshooting guide
This Section is designed to help identify possible causes for common PCRproblems and to suggest solutions that may overcome the problem.Generally if PCR does not work then there is likely to be something wrongwith the template DNA, primers, polymerase or the choice of conditions.Initially, it is worth trying it again under the same conditions to ensurethat there was not a simple error that resulted in the failure. In addition itis important to include controls. A positive control with a template knownto amplify well will ensure that all reagents are added and that they are allfunctioning. Negative controls, one lacking template DNA and anotherlacking primers, will reveal any contamination, disclose whether primer-dimer formation is an issue and ensure no nonspecific priming events areoccurring. It can also be worth starting from the beginning again by scrap-ping all the reagents you have used and preparing fresh ones. Table 4.1provides some guidelines for helping solve problems that you may face withyour PCRs.
82 PCR
Table 4.1 PCR troubleshooting guide
Problem Possible reasons Things to try
No PCR product One or more Use a checklist to ensure all components are added component missing or to tubes. Check the concentrations of all reagents, faulty including primers, template, dNTPs, MgCl2 and
buffer. If possible use a premix containing most ofthe reagents to reduce pipetting steps. Alwaysperform a positive control to show that reagents arefunctioning efficiently
No PCR product Insufficient number of Increase the number of cycles. Reactions can be cycles sampled by removing an aliquot (0.1 vol i.e. 5 µl of
a 50 µl vol) every 5 cycles (at 25, 30 and 35 cycles)during a 40-cycle reaction to allow the appropriatenumber to be determined

Optimization of PCR 83
Table 4.1 continued
Problem Possible reasons Things to try
No PCR product Poor primer design Reconsider the design of primers and check DNAsequencing data. If possible test primer function in aDNA sequencing reaction to ensure it is uniquelypriming from the desired position in the templateDNA. Resynthesize longer primers with particularcare to ensure 3’-end is perfectly matched totemplate
No PCR product Template quality or Too little template or template contaminated with quantity inhibitors or of poor quality through, for example,
long-term storage in dilute solution may all lead tolack of product. Check the integrity of the templateby agarose gel electrophoresis. Dilute a fresh aliquotof template DNA and set up a series of concentra-tions of template including higher and lowerconcentration, the former in case there was too littleand the latter to dilute out any inhibitory substances.Alternatively prepare a fresh sample of template DNA
No PCR product Thermal cycler Check that the thermal cycler is reaching the preset malfunction temperatures by using an inexpensive thermocouple
device to monitor reaction tube temperature, andthat it is cycling correctly
No PCR product Insufficient denaturation An initial incubation at 95°C for 5 min should be or difficult templates sufficient to denature the template. For highly GC-
rich sequences it may be necessary to addcomponents that enhance denaturation and destabi-lize the DNA duplex. See Section 4.2: Temperatures
No PCR product Extension time too short As a rule use 1 minute for each kbp of target.Increase the time in 1 min increments if no productsare observed
No PCR product Enzyme problem This should become clear from your positive control.1–2 units of enzyme is usually sufficient for mostapplications. If the enzyme is old and has beenpoorly stored then it is likely to be suboptimal. Testanother aliquot or batch of enzyme. In rare casesadding more units may yield a product, although itmay also increase background
No PCR product Buffer components If you use a 10 × PCR buffer supplied by the enzymemanufacturer this should not be the problem. Ifpossible test another batch of buffer. The magne-sium ions may affect product yield if added at thewrong concentration. Remember that many manu-facturers supply PCR buffers that are magnesium-freeso check that you are adding the correct range ofmagnesium to give a final concentration of typically1.5 mM but within the range 1–5 mM normally
No PCR product Deoxynucleotides Ultrapure solutions should perform well and thedNTPs are present in the reaction in vast excess,therefore even if they are added at a lower concen-tration some product would be expected. Check theconcentration you are adding and ensure the posi-tive control gives a product. Test a new aliquot orbatch of dNTPs

Further reading
Boleda MD, Briones P, Farreo J, Tyfield L, Pi R (1996) Experimental design: a usefultool for PCR optimization. BioTechniques 21: 134–140.
Dieffenbach CW, Dveksler GS (1993) Setting up a PCR laboratory. PCR Methods Appl3: S2–7.
84 PCR
Table 4.1 continued
Problem Possible reasons Things to try
Multiple products Low annealing Use a hot-start procedure (Section 4.2) and increase generated temperature the annealing temperature in 2°C steps. The use of a
gradient thermal cycler is recommended.Alternatively use a touchdown procedure (Section4.2)
Multiple products Too many cycles Reduce the number of cycles used. Reactions can be generated sampled by removing an aliquot (0.1 vol i.e. 5 µl of
a 50 µl vol) every 5 cycles (at 25, 30 and 35 cycles)during a 40-cycle reaction to allow the optimalnumber to be determined
Multiple products Poor primer design Reconsider the design of primers and check DNA generated sequence data. If possible test primer function in a
cycle or manual DNA sequencing reaction.Resynthesize longer primers with particular care toensure that the 3’-end is perfectly matched to thetemplate
Smeared products Extension time too Reduce the extension time in 30 s to 1 min steps generated longSmeared products Too many cycles Reduce the cycle number in five-cycle steps or use generated the sampling technique described aboveSmeared products Denaturation Check that the thermal cycler reaches the generated temperature too low denaturation temperature using a thermocouple and
if necessary increase the denaturation temperature in1°C steps
Smeared products Too much polymerase Reduce the amount usedgeneratedSmeared products Too much template Reduce the amount of template added, ideally by generated testing a dilution seriesFaint product Insufficient number of Increase the number of cycles. Reactions can be band cycles sampled by removing an aliquot (0.1 vol, i.e. 5 µl of
a 50 µl vol) every 5 cycles (at 25, 30 and 35 cycles)during a 40-cycle reaction to allow the appropriatenumber to be determined
Faint product Template quality or Too little template or template contaminated with band amount inhibitors. Dilute a fresh aliquot of template DNA
and set up a series of concentrations of templateincluding higher and lower concentrations, theformer in case there was too little and the latter todilute out any inhibitory substances
Faint product Extension time too short As a rule use 1 min for each kbp of target. Increase band the time in 1 min increments if no products are
observedFaint product Additive required Add a PCR enhancer compound (see Section 4.2)band

Dragon E (1993) Handling reagents in the PCR laboratory. PCR Methods Appl 3: S8–9.Roux KH (1995) Optimization and troubleshooting in PCR. PCR Methods Appl 4:
S185–194.
References
1. Blanchard MM, Taillon-Miller P, Nowotny P, Nowotny V (1993) PCR bufferoptimization with uniform temperature regimen to facilitate automation. PCRMethods Appl 2: 234–240.
2. Don RH, Cox PT, Wainwright BJ, Baker K, Mattick JS (1991) ‘Touchdown’ PCRto circumvent spurious priming during gene amplification. Nucleic Acids Res 19:4008.
3. D’Aquila RT, Bechtel LJ, Videler JA, Eron JJ, Gorczyca P, Kaplan JC (1991)Maximizing sensitivity and specificity of PCR by pre-amplification heating.Nucleic Acids Res 19: 3749.
4. Erlich HA, Gelfand D, Sninsky JJ (1991) Recent advances in the polymerasechain reaction. Science 252: 1643–1651.
5. Ruano G, Pagliaro EM, Schwartz TR, Lamy K, Messina D, Gaensslen RE, Lee HC(1992) Heat-soaked PCR: an efficient method for DNA amplification with appli-cations to forensic analysis. BioTechniques 13: 266–274.
6. Ruano G, Fenton W, Kidd KK (1989) Biphasic amplification of very dilute DNAsamples via ‘booster’ PCR. Nucleic Acids Res 17: 5407.
7. Wittwer CT, Garling DJ (1991) Rapid cycle DNA amplification: time andtemperature optimization. BioTechniques 10: 76–83.
8. Seto D (1990) An improved method for sequencing double stranded plasmidDNA from minipreps using DMSO and modified template preparation. NucleicAcids Res 18: 5905–5906.
9. Sarkar G, Kapelner S, Sommer SS (1990) Formamide can dramatically improvethe specificity of PCR. Nucleic Acids Res 18: 7465.
10. Hung T, Mak K, Fong KA (1990) Specificity enhancer for polymerase chainreaction. Nucleic Acids Res 18: 4953.
11. Bachmann B, Luke W, Hunsmann G (1990) Improvement of PCR amplifiedDNA sequencing with the aid of detergents. Nucleic Acids Res 18: 1309.
12. Kwok S, Higuchi R (1989) Avoiding false positives with PCR. Nature 339:237–238.
13. Longo MC, Berninger MS, Hartley JL (1990) Use of uracil DNA glycosylase tocontrol carry-over contamination in polymerase chain reactions. Gene 93:125–128.
14. Jinno Y, Yoshiura K, Niikawa N (1990) Use of psoralen as extinguisher ofcontaminated DNA in PCR. Nucleic Acids Res 18: 6739.
15. Cimino GD, Metchette KC, Tessman JW, Hearst JE, Isaacs ST (1991) Post-PCRsterilization: a method to control carryover contamination for the polymerasechain reaction. Nucleic Acids Res 19: 99–107.
Optimization of PCR 85

Analysis, sequencing andin vitro expression of PCRproducts
5.1 Introduction
Analysis of PCR products is critical in optimizing PCR conditions to yieldreliable and accurate results, and in interpreting the levels of productsgenerated, for example, in a diagnostic context.
The first part of this Chapter considers how to analyze PCR-amplified DNAfragments in the most appropriate way for different experimental strategies.In general it is important to ensure that you develop robust and reproduciblePCR conditions, particularly if they are to become part of a routine high-throughput screening procedure. Approaches for detection and analysis ofPCR products and for verification of product identity, including directsequencing strategies, are considered. Following this, procedures forquantitation of a specific product are covered. The final section deals within vitro expression of PCR products to yield protein products. Real-timeanalysis is covered in Chapter 9.
5.2 Analysis of PCR productsThere are many ways to analyze PCR products depending upon the infor-mation required:
● the presence or absence of the target DNA sequence;● the length of the amplified fragment;● the yield of PCR product to quantitate the relative or absolute amounts
of the starting DNA or RNA;● sequence analysis, either by differential probe hybridization or by direct
sequencing of the product.
It will often be possible to predict the size(s) of expected PCR products,which are of a length defined by the positions of the PCR primers. In othercases the size of product cannot be predicted, for example in some cDNAamplification experiments such as RACE-PCR and in some genomic cloningor walking experiments. Often PCR products are relatively small, in therange of 0.2–3 kbp, and even in many genomic cloning experiments theyare less than 10 kbp in length. The simplest and most direct methods toanalyze PCR products involve gel electrophoresis.
Gel electrophoresisThe most common and rapid way of analyzing PCR products is by standardagarose gel electrophoresis. Depending on the expected size of the ampli-
5

fied fragment, a fraction of your PCR reaction should be loaded onto a0.8–3% agarose gel containing 1 µg ml–1 ethidium bromide. Usually one-tenth or one-fifth of the reaction volume is loaded and the remainder isstored at 4°C or –20°C for subsequent use. An aliquot of loading dyecontaining glycerol and a marker such as bromophenol blue should beadded to the sample to assist both loading on the gel and visualization ofthe sample migration through the gel. If you have used a reaction mixalready containing a dye, such as described in Chaper 3, then the samplecan be loaded directly.
Appropriate molecular size markers such as a 100 bp or 1 kbp DNA ladderor bacteriophage lambda or φX174 restriction enzyme digests, availablefrom a range of manufacturers, or previously characterized PCR products,should be loaded in adjacent lanes of the gel. The amplified fragment(s)should be readily visible under ultraviolet transillumination (always useprotective eye-wear and minimize time of exposure) and the gel can bephotographed using a camera or digital imaging system to record theresults. In most cases a 1% agarose gel gives sufficient resolution for DNAfragments between 500 and 4000 bp. If you are expecting very smallfragments then it is probably better to use a specialized agarose such asMetaphor® at 3.5% which has very high resolution (10–1000 bp), orNuSeive® GTG at 4% (50–2000 bp), both from Cambrex Bioproducts. Thelatter allows efficient DNA recovery. Other specialty agarose preparationsare also available such as Agarose 1000 (Life Technologies), which providesresolution of up to 10 bp for PCR products up to 350 bp in length whenused at a concentration of 4.5%. Such gels can be useful for analysis ofmultiplex PCRs that contain several PCR products. For very small products,or for identifying small size differences between products, such as inmicrosatellite repeats or single-strand conformational polymorphisms,nondenaturing or denaturing polyacrylamide gels provide the mostappropriate resolution system (Chapter 11).
If your PCR conditions are optimal and your PCR has worked well youshould be able to visualize an intense sharp band of the expected size.Sometimes you may also observe small primer-dimer products at the lead-ing end of the gel (Chapter 3). Frequently these products are mostpronounced in the absence of a specific PCR product. If the PCR conditionswere not optimal or the reaction used degenerate primers (Chapter 3) anda complex source of template DNA (such as human genomic DNA) you maysee additional bands that are most probably due to nonspecific primingevents. Common reasons for the occurrence of such products include lowannealing temperatures, high Mg2+ concentrations and/or the occurrenceof similar priming sequences in the complex template source. Usually it isfairly straightforward to determine which ‘band’ contains the correct DNAfragment based on its expected size, if known, and its sharper appearanceand higher intensity compared to the lower intensity of nonspecific ampli-fication products. However, sometimes it is difficult to distinguish betweennonspecific and specific amplification products either due to similar bandintensities or due to the presence of a smear of DNA amplification products.Smearing of DNA amplification products is most often associated withnonspecific primer annealing conditions, poor quality DNA or low copynumber template, or a combination of such factors (Chapter 4). In such
88 PCR

cases it is often possible to increase the sensitivity of the analysis in orderto identify the amplified target DNA by, for example, nested PCR orSouthern or dot/slot hybridization (Section 5.3). Such methods can assistin the optimization of PCR conditions so that you are able to amplify thedesired product routinely and reproducibly, allowing the use of homo-genous detection methods that do not rely on gel fractionation.
5.3 Verification of initial amplification product
Often a PCR product will be used for subsequent experiments and so it isimportant to ensure that the amplified DNA fragment really represents theDNA sequence of interest. This Section covers hybridization analysis, nestedPCR and restriction analysis, which are all approaches to verify productidentity that can be more rapid for processing a number of samples thanthe most direct approach; direct DNA sequence analysis of the PCR product(Section 5.4)
Southern and dot blot analysis
Southern blot analysis involves the transfer of DNA fragments from anagarose gel to a nylon membrane by capillary transfer, followed by DNAhybridization with a specific probe to detect the presence of the target DNAfragment (1). It offers a sensitive approach for the detection of the targetsequence using probes that are either radiolabeled or nonisotopically labeled,including enzyme-linked detection systems. DNA hybridization conditionscan be controlled at both the hybridization and post-hybridization stages byaltering the temperature and salt concentration. The use of a probe is moresensitive than ethidium bromide detection methods and can reveal a targetfragment that was not visible on the original ethidium bromide-stained gel.In addition when the probe hybridizes it confirms the identity of thefragment. Although homologous probes from the target gene are preferred,heterologous probes obtained from a similar gene from another organism alsowork well, but may require more optimization and less stringent hybridiza-tion and post-hybridization conditions.
An alternative and more rapid technique than Southern blot analysis isdot or slot blotting. Here a sample of the amplification reaction is trans-ferred directly to a membrane followed by DNA hybridization to a specificprobe. It does not involve agarose gel electrophoresis or capillary transferand so is more rapid. Although dot or slot blotting identifies the presenceof the correct amplification product this technique does not determine itssize or the presence of other PCR products. Dot or slot blot analysis is oftenused when there are large numbers of PCR samples to be analyzed.
For Southern and dot blot hybridization a range of probe-labelingstrategies are available. Oligonucleotide probes are generally 5′-end labeledwith 32P by T4 polynucleotide kinase-catalyzed transfer of terminal labeledphosphate from [λ–32P]ATP to the 5′-end of the oligonucleotide. Larger DNAfragments are often labeled by nick translation or random hexamer-primedlabeling with the incorporation of 32P from [α32P] dCTP or dATP during DNAsynthesis by a suitable DNA polymerase such as T7 DNA polymerase. Probesmay also be labeled nonisotopically with a range of fluorescent dyes, with
Analysis, sequencing and in vitro expression of PCR products 89

crosslinked enzymes such as horseradish peroxidase (HRP) or alkalinephosphatase (AP), with digoxygenin (DIG), which is detected by a specificanti-DIG antibody coupled to HRP or AP, with acridinium esters or withother tags.
Nested PCR
Nested PCR offers a quick and reliable way of verifying a PCR product. Itgenerally uses two primers that are internal to the product of the first PCR.The PCR product from the first PCR is used as template DNA for a secondround of PCR with the internal primers. This should yield a smaller PCRproduct compared with the original product (Figure 5.1). It is estimated thatnested PCR leads to a 104-fold increase in sensitivity of detection of thecorrect product. Even if the first round PCR product is poorly represented
90 PCR
M A B C
1.6 kbp
1.0 kbp
0.6 kbp
1
2
Template
1 3 1.6 kbp
Product A
4 2
Nested PCR usingprimers 1 and 4
Nested PCR usingprimers 3 and 4
1.0 kbp 0.6 kbp
Product B Product C
(A)
(B) (C)
Initial PCR amplification
Figure 5.1
Diagrammatic representation of nested PCR and analysis by agarose gelelectrophoresis. (A) Initial PCR amplification product using two original flankingprimers (primers 1 and 2); (B) nested PCR from the primary PCR amplificationproduct using one original flanking primer (primer 1) and one internal nestedprimer (primer 4); (C) nested PCR from the primary PCR amplification productusing two internal nested primers (primers 3 and 4). M denotes molecular sizemarkers.

within a background of nonspecific products it will be enriched for thespecific template allowing efficient amplification by the nested PCRprimers. By contrast the nonspecific products of the first PCR are unlikelyto have sequences that are complementary to the nested primers and sothere should be no nonspecific amplification after the nested PCR.
Even if it is not possible to design two internal primers because of lackof sequence information, for example when only limited peptide sequencedata are available, it is usually still possible to perform a nested PCR. Onenew internal primer could be used together with one of the originalprimers. Alternatively, extending one or both of the original primers byeven two or three nucleotides at their 3′-ends should be sufficient to imposeincreased specificity on the nested PCR. As discussed in Chapter 3 it is the3′-end of the PCR primer that is most critical for determining specificity ofPCR amplification. If the 3′-nucleotide is not complementary to thetemplate then no amplification should occur. So extending a nested PCRprimer by two or three nucleotides should allow the specific target to beamplified but not the nonspecific products even though the nested primersoverlap significantly with the original primers. Of course in this case theuse of an enzyme with 3′-exonuclease proofreading activity should beavoided to protect the differentiating 3′-end. An example of the design oforiginal and nested PCR primers by back-translation of a limited region ofamino acid sequence information is shown in Figure 5.2.
To reduce manipulations and avoid any contamination problems boththe initial and nested PCR reactions can be performed in a single tube. Bothprimer pairs are included at the start of the PCR but the nested primers aredesigned to have a lower Tm than the initial primer pair. This allows ampli-fication of the primary target at an annealing temperature above that ofthe nested primers. Then, a second PCR program is performed but at a lowerannealing temperature, allowing the nested primer pair to amplify thespecific PCR product from the initial PCR product. The PCR products canthen be analyzed by agarose gel electrophoresis and should reveal both theprimary amplification product and the smaller nested amplificationproduct. However, if the primary amplification resulted in multiple bandsor a smear the nested amplification product may be harder to identify. Itis best not to use the initial PCR product for further experiments since theextended number of PCR cycles increases the chances of PCR-generatedmutations.
An obvious potential problem when verifying the identity of the initialPCR products by nested PCR is the presence of the original template DNA.If the initial product is nonspecific, but sufficient original template ispresent to allow amplification by the nested primers, a positive result maylead to the erroneous assumption that the initial PCR product representsthe correct target product. To avoid any amplification from the originaltemplate the first PCR can be diluted so that the absolute amount of originaltemplate is negligible. In a case where there is a defined initial PCR productthen a more reliable approach is to physically purify the PCR product fromthe original template DNA, for example by agarose gel electrophoresis andgel purification (Chapter 6).
In any PCR experiment it is important to perform suitable controls toensure specificity of the PCR. In nested PCR the increased sensitivity of the
Analysis, sequencing and in vitro expression of PCR products 91

method makes this much more critical as any contamination will beenhanced. It is essential to include single primer control reactions to ensureprimer specificity as described in Chapter 4, as well as no DNA and noprimer controls.
Restriction analysis of a PCR product
Restriction digest analysis of PCR products is not commonly used to verifyidentity. However, the approach can be efficient giving a clear result andis relatively rapid and simple requiring mixing of an aliquot of PCR product,10× restriction buffer and restriction enzyme, incubation to allow digestionand then agarose gel electrophoresis to visualize the restriction fragments.Of course it is only useful if a restriction map of the amplified DNAfragment is available. Not all restriction enzymes are active in the presenceof various PCR components so an additional purification step may berequired. Direct restriction analysis can be useful for verifying site-specificmutations that introduce or remove a restriction site from a PCR product.The approach can be coupled with Southern blot hybridization methodsfor product identification and can be used to analyze nested PCR products.
In summary, nested PCR offers a rapid and sensitive approach for verify-ing PCR amplification profiles. However, Southern blot data obtained underhigh stringency conditions offer more definitive verification of productidentity. Some combination of approaches may be required in difficultcases. Of course the most definitive confirmation of identity of a PCRproduct is determination of its DNA sequence, a process that can be morerapid than Southern blot analysis if small numbers of samples are involved(Section 5.4).
92 PCR
Amino acid sequenceDNA sequence
A D T E W D K G E H GNNNGCAGACACAGAATGGGACCAAGGAGAACACGGANNNN G T G G T G G G T G C C C C T T T T
Primer for PCR 1(256)
GCAGACACAGAATGGGACAAAGG5’ G T G G T G 3’ C C T T
Primer for nested PCR(128)
GAATGGGACAAAGGAGAACACG5’ G T G G G T 3’
CT
Figure 5.2
Design of degenerate primers from amino acid sequence data. The primer mix forinitial PCR represents a combination of 256 different sequences and is usedtogether with an appropriate downstream primer in PCR 1. Due to the limitedamount of amino acid sequence data available the nested primer (128 differentsequences) overlaps with part of the PCR 1 primer, but has been extended so thatthe 3′-end is different.

5.4 Direct DNA sequencing of PCR products
Once a PCR product has been cloned into a suitable vector the recombinantmolecule can be used for DNA sequence analysis of the PCR insert. However,during product verification, particularly where there are multiple samples toscreen, it is not always efficient to clone each fragment. A more directapproach is to perform direct sequence analysis of the PCR product (2,3). Itmight be argued that this approach should be routinely used as the onlymethod of PCR product verification, however, it is not always straight-forward and can involve greater time and effort than less direct methodssuch as nested PCR, in particular when processing large numbers of samples.Nonetheless, with improvements in automation and sequencing tech-nologies (see below) and the ever-decreasing cost it seems reasonable toassume that sequencing will eventually become the preferred approach toproduct verification.
It is also important to remember that direct sequencing provides anadditional benefit in that you are sequencing a population of PCRmolecules. Since errors can occur randomly during PCR any single clone isderived from only one PCR product that may or may not represent the truenatural sequence. It is therefore usually necessary to sequence severalindependent clones to ensure a correct consensus sequence is obtained. Indirect sequencing one is determining such a consensus sequence directly.Only if the PCR is performed on a very small amount of template is therelikely to be a risk that an early PCR error will be detected in the final productpopulation. However, the reproducibility of direct DNA sequence data willalso depend upon the source of template DNA. In most cases of DNAisolation from fresh samples there will be no difficulties, but for old samplesin which the DNA may be damaged, more care may be required. A studyof old forensic samples indicated that the level of errors was 30-fold higherthan in control samples, effectively leading to an error rate as high as 1 in20 nucleotides (4). It was demonstrated by HPLC and ionization massspectrometry that there was a decrease in the concentrations of the fournormal bases, and an increase in oxidation products within the old DNAsamples. It was found that both strands of DNA should be sequenced, andreplicate PCRs should be performed and sequenced from the same DNAsamples. Similar arguments would apply to other aged samples, such asthose used for PCR archaeology (Chapter 3).
DNA sequencing chemistry and automation
Dideoxy terminator DNA sequencing (5) involves the incorporation of 2′,3′-dideoxynucleotide ‘terminators’ into nascent DNA chains (5; Figure 5.3).Basically, a DNA sequencing reaction results in DNA polymerase-directedsynthesis of new DNA from a primer annealed to a single-strand templateDNA molecule. In general for PCR products the template will be double-stranded and is heat denatured and rapidly frozen by placing in dry ice orliquid nitrogen to prevent reannealing of the separated strands. VariousDNA polymerases can be used for sequencing reactions including T7 DNApolymerase (6) and thermostable enzymes such as Taq (7) or Amplitaq™(PE Biosystems), Vent® exo– (New England Biolabs), Pfu exo– (Stratagene)
Analysis, sequencing and in vitro expression of PCR products 93

and Bst DNA polymerase I (8) (BioRad). The DNA polymerase uses the fourdNTPs (dATP, dCTP, dGTP and dTTP) to synthesize DNA by extending the3′-end of the primer. In each of four reactions, one per nucleotide, the corre-sponding dideoxynucleoside triphosphate (ddNTP) is also present.Incorporation of a ddNTP, rather than the corresponding dNTP, results inchain termination because the absence of a 3′-OH group prevents theformation of the next phosphodiester bond. So, for example in Figure 5.3,the A reaction contains the four dNTPs plus ddATP which acts as a termi-nator during DNA synthesis. As there is no 3′-OH group on the ddNTP itis not possible to form a phosphodiester bond so DNA synthesis of thegrowing DNA strand stops upon addition of ddATP. At each T position in
94 PCR
Template DNA
Primer
AGCGCGGGTTAGCAGTTGT
ddA terminationproducts
TCGCGCCCddATCGCGCCAAddATCGCGCCCAATCGTCddATCGCGCCCAATCGTCAddA
ddG terminationproducts
TCddGTCGCddGTCGCGCCCAATCddG
ddC terminationproducts
TddCTCGddCTCGCGddCTCGCGCddCTCGCGCCddCTCGCGCCCAATddCTCGCGCCCAATCGTddCTCGCGCCCAATCGTCddCTCGCGCCCAATCGTCAAddC
TCGCGCCCAAddTTCGCGCCCAATCGddT
ddT terminationproducts
A G C T
DNA sequencing gel
Figure 5.3
Dideoxynucleotide chain termination approach for DNA sequencing. Anoligonucleotide primer is extended by DNA polymerase that incorporates theappropriate dNTPs. Occasionally the polymerase incorporates a dideoxy NTP thatlacks a 3′-OH group and therefore cannot support further nucleotide addition.This chain is therefore terminated by the ddNTP. Within the population ofmolecules will be chains terminated at each position. A high-resolution systembased on polyacrylamide gel or capillary electrophoresis separates the productsand allows the DNA sequence to be read. Either primers or ddNTPs can befluorescently labeled allowing detection in an automated DNA sequencer.

the template there is a possibility that either dATP or ddATP will be addedto the extending DNA chain. A small proportion of strands will terminatewhile the majority will continue being synthesized until the next T posi-tion where again a proportion will terminate by ddATP incorporation. Thusa series of fragments are generated that all start at the 5′-end of the primerand extend to one of the A positions in the growing chain, and therebycorrespond to each T in the template strand. When these fragments areseparated through a high-resolution denaturing polyacrylamide gel or capil-lary system they will migrate according to their length with the shortestfragments migrating fastest. This will create a ladder of fragments thatrepresent the positions of each A in the synthesized DNA fragment. Whenthe other reactions, C, G and T, are similarly performed using the sameprimer, template and the appropriate ddNTP, they also will produce a seriesof fragments terminating at the appropriate ddNTP. Comparing the migra-tion rates of the fragments from the different reactions allows the sequenceof the DNA to be read starting with the fastest migrating fragments that areclosest to the primer.
In order to be able to read the reaction products they must be labeled insome way, usually by a radiolabel or a fluorescent label. Radiolabels areusually used for manual sequencing but the most common method fortoday involves the use of fluorescent dyes and automated detectionsystems. Two approaches are available; either primer-labelling or morecommonly ddNTP labelling.
A variety of fluorescent dyes are available (e.g. JOE, ROX, FAM andTAMRA; Chapter 9) and can be linked to primers synthesized with a 5′-amino group, so that each fragment can be assigned to the correspondingnucleotide reaction by detection of a characteristic fluorescence wavelength.Primer labeling provides the highest quality and most uniform sequencedata, however the dyes are commonly incorporated as ddNTPs (such asBigDye terminators™, Applied Biosystems). This allows any unlabelledprimer to be used for sequencing, a particular advantage when using targetsequence-specific primers rather than generic vector-specific primers.However, many universal, vector-specific fluorescently labeled primers areavailable commercially from several companies (Fluorescein labeled primers,Takara Mirus Bio; TAMRA labeled primers, USB Corp.).
Fluorescence detection systems include DNA sequencers based on slabgels (for example, ABI Prism™ 377 from PE Biosystems, ALF DNASequencer™ from Amersham/Pharmacia or the IR2 from Li-Cor) or capillaryelectrophoresis systems (ABI Prism™ 3100 Genetic Analyzer or 3700 seriesfrom Applied Biosystems, Megabase from Molecular Dynamics or CEQ 2000from Beckman-Coulter). These latter systems are based on DNA separationin thin-coated capillaries containing nonpolymerized gel matrices and laserdetection systems. The introduction and removal of polymer from thecapillaries, plus loading and running samples and fragment detection, areautomated processes. Automated detection systems allow longer readlengths (800–1100 nts) than traditional radiolabeled approaches since thesample can be allowed to run for longer with real-time detection of frag-ments as they pass a laser and then continue to migrate into the lowerbuffer chamber (see below). In radiolabeled approaches the gel must bestopped and exposed to reveal the band pattern by autoradiography,
Analysis, sequencing and in vitro expression of PCR products 95

thereby limiting the extent of sequence information (∼300 nt) that can bedetected.
Radioactive sequencing or the use of a single fluorophore requires the useof four separate sequencing reactions, one for each of the ddNTP termi-nators, and four lanes of a gel. In contrast, by using multiple dyes in dyeprimer reactions four separate sequencing reactions are required, but thesecan be mixed and loaded on a single gel lane or capillary. An advantage ofmultiple fluorescent dye terminators is that all four reactions can beperformed in a single tube and loaded on a single gel lane or capillary. Onlyfragments that have incorporated a dideoxynucleotide will be dye-labeledand will be detected individually using a real-time laser gel scanner. Thisreduces the amount of work involved and avoids track-to-track variationduring electrophoresis. Four laser systems allow up to 96 samples to besequenced per slab gel. The larger capillary systems allow 96 samples to besequenced every 1–2 h depending upon the amount of sequence datarequired per run.
Alternative fluorescence systems are available such as the IR2 from Li-Corwhere the four ddNTP-reactions are separated in adjacent lanes and detectedby an infrared laser detection system. The output is an autoradiogram typeimage, but the fact that fragments are detected as they pass the laser systemallows the gel to be run for longer. Together with its high sensitivity thisallows detection of on average 1100 nucleotides from a single template.Since there are two fluorescent dyes that have nonoverlapping spectralfeatures it is possible to mix two A reactions and separate them in one laneof the gel. Similarly two C, G and T reactions can be separated in thecorresponding lanes. Simultaneous detection of the two fluorescent dyesallows up to 48 sequencing reactions to be separated on each gel.
Genome projects have significantly advanced the technologies associatedwith DNA sequencing including robotic automation of PCR set-ups,template purification, sequencing reactions and comb loading, all of whichwill serve to simplify sequencing of PCR products.
Primers for direct sequencing
The choice of primer for direct sequence analysis depends upon how muchinformation is available before the PCR. One of the original PCR primers canbe used, or ideally a nested primer that lies within the amplified fragment(Section 5.3). However, it is also possible to use generic sequencing primerssuch as M13 forward or reverse primers by including the appropriatesequences within the PCR primers when these were synthesized. This isparticularly useful when a genomic PCR has been performed using degenerateprimers and where there is no unique internal sequence information avail-able for the amplified fragment. The inclusion of a generic primer site willensure high-quality sequence information that would not be obtained byusing the original degenerate mixture as sequencing primers. Examples ofgeneric primer sites that can be added to PCR primers include:
● M13/pUC –47 sequencing primer (which also includes the –40 primer –shown in italics)5′-CGCCAGGGTTTTCCCACTCACGAC-3′;
96 PCR

● M13/pUC –20 sequencing primer5′-CGTTGTAAAACGACGGCCAGT-3′;
● M13/pUC –48 reverse sequencing primer5′-AGCGGATAACAATTTCACACAGGA-3′;]
● M13/pUC –24 reverse sequencing primer5′-AACAGCTATGACCATG-3′;
● T7 promoter/universal primer5′-TAATACGACTCACTATAGGG-3′;
● T3 promoter primer5′-ATTAACCCTCACTAAAGGGA-3′;
● SP6 promoter primer (which includes SP6 universal primer –(italics)]5′-CATACGATTTAGGTGACACTATAG-3′.
Isolating and purifying the PCR product
It is important to start the sequencing reaction with a pure template. Asingle PCR reaction should provide sufficient template for several DNAsequencing reactions. The methods used to isolate PCR fragments for directsequencing (9) are identical to those used to isolate products before cloningand the range of options available is covered in more detail in Chapter 6.Usually an aliquot of the PCR is separated through an agarose gel. If thereare several products, the band corresponding to the target fragment isexcised and the DNA recovered by an appropriate method (Chapter 6). Itmay be necessary, depending upon yield of the product, to perform apreparative agarose gel with more of the original PCR product. An exam-ple of gel purification and cycle sequencing of the products is shown inFigure 5.7. Alternatively, if the analytical gel indicates a single product, itis possible to separate the DNA from other low-molecular-mass reactioncomponents such as primers and nucleotides that may interfere with thesequencing, by using a simple spin column or other commercial PCR clean-up approach (Chapter 6). If the PCR product was biotinylated then asolid-phase system such as streptavidin-coated paramagnetic particles couldbe used (see below). The purified DNA is usually double-stranded unless ithas been generated by asymmetric PCR (see below) and it is therefore neces-sary to denature the two strands and to prevent reannealing. This isachieved either by alkali denaturation followed by neutralization, or byheating to 100°C for 3–5 min and then snap-freezing in liquid nitrogen ordry-ice. Either a fluorescently labeled primer is annealed to the denaturedtemplate and standard dideoxy sequencing is performed, or an unlabeledprimer is used with incorporation of fluorescent ddNTPs. A typical directsequencing protocol is given in Protocol 5.1.
Generating single-stranded DNA templates
It is possible to generate single strand templates for DNA sequencing andother applications, for example as strand-specific probes. A simple approachis to use asymmetric PCR, in which one primer is added in vast excess(10–50-fold) over the other. During the first 20 or so cycles of PCR double-stranded product accumulates, but then with depletion of the lowconcentration primer the later cycles result in linear accumulation of one
Analysis, sequencing and in vitro expression of PCR products 97

strand (Figure 5.4). This single-stranded product then provides a templatefor dideoxy sequencing (3,10). Although asymmetric PCR can be performedon any template source it is usually necessary to perform a titration to estab-lish optimal primer:template ratios for each new template. A more efficientapproach is to amplify a double-stranded PCR product and then to use analiquot of this together with only one primer to generate a single-strandedproduct. It is important to remember that the primer for sequencing anasymmetric PCR product must be complementary to the asymmetricallyamplified strand so you cannot use the same primer that was used for theasymmetric amplification.
Solid-phase sequencing
PCR products can be sequenced by capture of one strand onto a solidsupport, followed by alkaline denaturation and DNA sequencing (Figure5.5). The most common method of immobilization is through theincorporation of biotin at the 5′-end of one primer. The resulting PCRproduct can then be isolated from solution by monodisperse paramagneticbeads coated with covalently bound streptavidin (11–13; Figure 5.6) or witha streptavidin affinity gel (14,15). Treatment with 0.1 M NaOH denaturesthe double-stranded captured product releasing the nonbiotinylated strand
98 PCR
DNA sequencing reaction
Asymmetric amplificationof one strand
10–50-fold excessof primer
PCR
Figure 5.4
Asymmetric PCR for generating single-stranded template for sequencing. PCR isperformed with an excess of one primer. When the low-concentration primer isexhausted the primer in excess continues to allow linear accumulation of onestrand of DNA suitable for subsequent DNA sequencing.

into solution and leaving the other strand attached to the matrix. Thestrand on the solid support can be resuspended in appropriate buffer andannealed with either a fluorescent labeled primer for dideoxy sequencing.Solid-phase sequencing allows both strands of the PCR product to besequenced, either using alternate biotinylated primers, or by performingone dideoxy reaction in solid phase and the other in solution. The approach
Analysis, sequencing and in vitro expression of PCR products 99
Template DNA
PCR with onebiotinylated primer
Biotinylated PCR product
Bind to streptavidincoupled toparamagneticparticles
Streptavidin
Magnetic captureof the DNA
Alkali denaturation
DNA sequencing
PMPB
B
B
B
B
PMP
PMP
Figure 5.5
Solid-phase DNA sequencing. One of the PCR primers is biotinylated, allowingcapture by streptavidin coupled to paramagnetic particles. This allows rapidpurification of the DNA. Treatment with alkali leads to dissociation of thenonbiotinylated single strand. Both the strands can be used as templates for DNAsequencing reactions. The immobilized strand can be stored and reused for furtherreactions.

allows simple separation of the solid and solution phases for steps likebuffer exchange and recovery of the template DNA. In addition the immo-bilized template can be reused for multiple sequencing reaction if necessary.
Cycle sequencing
Cycle sequencing involves incorporation of terminators during anasymmetric PCR. A thermal cycler (Chapter 3) is used to perform cycles ofdenaturation, annealing and extension on a template using a single primerresulting in linear amplification with simultaneous incorporation ofdideoxynucleotide terminators. Although any form of template DNA canbe used (double-stranded PCR products, plasmids, asymmetric PCRproducts), double-stranded PCR products or plasmids are most commonlyused. For double-stranded molecules either strand can be sequenceddepending on which primer is used. The cycle sequencing reaction productsare analyzed using an appropriate gel or automated system with radioactive
100 PCR
(C)
(B)
(A)
ATTCACTGGTATAGTACCAGTTCATGGCTGTGCTAGGTCCCGCTTGGAACACCGAACCCTTCTTCCATCCAAAGAGCCACGCGTGGTTG 10 20 30 40 50 60 70 80
TCTGAACGGTACAATCCTTGCTTGTCAGCCGTCAACATTGGGTTGACCTTGGCATTGGGTAGGGACGTCCATGTCTTTGAAGAT90 100 110 120 130 140 150 160 170
TGGGCTATAGACTTCGCCATTCTTCTCAAATACGCCACCGCTCCAGGAGCCTCCAATGGTAAAAACACGACCGTCTGACATGC 180 190 200 210 220 230 240 250
GTAGCTGATGACTGATACCCACGAGCCACTTGCATGTCAGGTCCCGGGATCCAGCTATCGCTAGATGAATCATACAAACT 260 270 280 290 300 310 320 330
TGGTCTTCTTGGCATCGTTGCCACCTGTTGACTACGATCTGACCGTTACCATCCATGGAGATACCAGGCCAGAACATA 340 330 360 370 380 390 400 410
(D)
Figure 5.6
Direct sequencing of PCR products by cycle sequencing. The process was performed according toProtocol 5.2. (A)–(C), agarose gel analysis of: (A) an aliquot of the PCR products; (B) preparative gelafter ethanol precipitation to concentrate the products (the DNA was recovered from gel slices usinga gel purification kit); (C) aliquot of purified products to assess the amount of DNA to be used ineach cycle sequencing reaction. (D) shows an example of DNA sequence from purified DNA withAmpliTaqFS and fluorescent-labeled ddNTPs with analysis on an ABI 373 DNA sequencer.

or fluorescent detection. A standard procedure is used for all templates incycle sequencing and is superior to other PCR sequencing procedures interms of length and accuracy of the sequence information obtained.Another benefit is that it can be used with relatively crude samples such asunpurified plasmid DNA from bacterial lysates because the linear ampli-fication allows crude samples to be diluted to reduce the concentration ofany inhibitory compounds that might normally poison the sequencingreaction. However, when dealing with difficult sequencing templates it ispossible to add sequencing enhancers such as the SequenceRx EnhancerSystem from Invitrogen, containing seven co-solvents which are addedindividually to automated fluorescent DNA sequencing reactions toimprove the length and quality of sequencing data.
Several thermostable DNA polymerases are available commercially insequencing kits for cycle sequencing including Amplitaq™ (AppliedBiosystems), VentR™(exo–) (New England Biolabs) and Cyclist exo– Pfu(Stratagene). Notably, AmpliTaq™ DNA polymerase FS (FluorescentSequencing) has become widely used for cycle sequencing, when modifiedto exhibit very little 5′→3′ exonuclease activity and to incorporate ddNTPsmuch more efficiently than other enzymes. The ability to use lower concen-trations of ddNTPs in both dye primer and dye terminator reactionssignificantly improves enzyme performance leading to higher sensitivityand therefore a requirement for reduced concentrations of template DNAand simpler dye removal before gel loading. Although most DNA sequenc-ing companies offer services that include cycle sequencing a protocol forcycle sequencing using Applied Biosystems Big Dye terminators is given inProtocol 5.1. The cycle parameters are significantly different to those usedin standard PCR conditions in order to favor incorporation of ddNTPs. Inparticular the extension step involves an extended incubation at 60°C, andit is important to follow the recommended procedures provided by themanufacturers of the sequencing reagents to achieve reproducibly highquality results. An example of output from a cycle sequencing reaction ona PCR template is shown in Figure 5.6.
5.5 Direct labeling of PCR products and homogenousassays
Southern blot and dot blot hybridization procedures allow the simul-taneous detection and verification of the identity of a PCR product. Onceappropriate conditions for routine PCR product amplification areestablished it is often more appropriate to use more rapid and simplerapproaches for detection of the amplified product. One approach is thedirect labeling of the PCR product. It is possible to label the PCR productsduring the amplification reaction by the addition of labeled dNTPs or ofradiolabeled, fluorescent or biotinylated primers that become incorporatedinto the PCR product. Various detection approaches can then be used,including gel electrophoresis followed by either X-ray film or phosphor-imager exposure or by fluorescent detection on instruments such as theApplied Biosystems DNA sequencers.
For some applications such as DNA footprinting and in situ PCR it isnecessary to label the PCR product directly. Direct labeling of PCR
Analysis, sequencing and in vitro expression of PCR products 101

products also increases the sensitivity of detection when low levels ofamplification occur. It is simple and rapid compared with Southern blotand hybridization methods (Section 5.3), and a variety of labels can beincorporated. In direct labeling, one of the four nucleotides is eithersubstituted for, or a reduced concentration of unlabeled nucleotide issupplemented with, labeled nucleotide. PCR is performed according to astandard protocol leading to direct incorporation of labeled nucleotidesinto the final PCR product. Radiolabelled nucleotides are frequently usedwhen analyzing low levels of amplification with detection by autoradio-graphy or phosphorimager analysis of a gel or by scintillation counting ofa trichloroacetic acid (TCA)-precipitated aliquot. Care must be taken toavoid excessive exposure to the radioactive source and the thermal cyclershould always be shielded from the user. Nonradioactive labels havebecome increasingly popular as alternatives to radiolabels although insome cases they are not so sensitive. These include hapten-conjugatednucleotides such as biotin-dUTP and digoxigenin (DIG)-dUTP and fluores-cent nucleotides such as fluorescein-dUTP. An alternative to directincorporation into the PCR product is through the use of labeled primers.Although these can be significantly more expensive than nonlabeledprimers they allow single additions of a label per product molecule allow-ing more accurate quantitation and are very useful for high-throughputprocedures. Most methods for real-time detection of PCR utilize labeledPCR primers as described in Chapter 9. A useful discussion of the relativesensitivity of radioactive versus nonradioactive labels can be found inMundy et al. (16).
Scintillation proximity assay
The scintillation proximity assay (SPA) (17–19) is a methodology availablefrom Amersham Biosciences. SPA beads contain a fluor and are coated withappropriate acceptor molecules that bind radiolabeled ligands in solution.The ligand is isotopically labeled with a low-energy radiation emitter suchas tritium (3H) whose energy is dissipated in the aqueous medium. However,upon binding of the ligand to the SPA bead the label will be sufficientlyclose to activate the fluor and generate light that can be detected by ascintillation counter. In practice the SPA beads are coated with streptavidinthat binds biotin. If one of the PCR primers is biotinylated then duringamplification in the presence of [3H] dTTP the products will become bothradiolabeled and biotinylated. An aliquot can then be added to SPA beadsand the amount of product quantitated by the scintillation signal resultingfrom streptavidin binding of PCR product to the SPA bead. The process canbe made selective for a particular PCR product by using nonbiotinylated PCRprimers during the synthesis of labeled product. The products are then heatdenatured and mixed with a specific 5′-biotinylated oligonucleotide probethat will hybridize to the target PCR product allowing detection of thisproduct but not other products that may also be present in the reaction(Figure 5.7). Unbound labeled ligands in solution are too distant from theSPA beads to facilitate energy transfer to the fluor and therefore the signal-to-noise ratio is low and there is a linear response over two orders ofmagnitude.
102 PCR

Immunological detection of PCR products
Enzyme-linked immunosorbent assay (ELISA) methods can be used todetect PCR products. These approaches offer high sensitivity allowingdetection of products at levels of around 10 pg. One approach (HybridCapture® 2 Technology, Digene Diagnostics Inc.) involved the use of amonoclonal antibody that detects RNA:DNA hybrids (20–21). PCR amplifi-cation uses one biotinylated and one nonbiotinylated primer, the productis heat denatured and hybridized in solution to a complementary unlabeledRNA probe. The resulting DNA:RNA hybrids are isolated from solution bybiotin binding to streptavidin-coated wells in a microtiter plate. The mono-clonal antibody conjugated to alkaline phosphatase is added to bind to thetrapped DNA:RNA hybrids and detected by adding a colorimetric substrate.A similar DNA Enzyme Immunoassay System (Sorin Biomedica nowDiaSorin), is based on a biotinylated probe immobilized in the wells of astreptavidin-coated microtiter plate. Denatured PCR products are allowedto hybridize to the probe, creating double-stranded DNA segments that canbe detected using an anti-double-stranded DNA antibody with a coupledenzyme reaction using a chromogenic substrate. This approach has beenused to detect various genetic lesions, virus and parasite sequences.
5.6 In vitro expression of PCR products
As described in Chapter 3, in addition to including promoter sequences as5′-additions to PCR primers, other gene expression signals can be added.
Analysis, sequencing and in vitro expression of PCR products 103
B
B
3H-labeled PCR product
Heat denature
Anneal withbiotinylated probe
Streptavidin binding
Scintillationgenerateslight emission
Figure 5.7
Scintillation proximity assay. A biotinylated oligonucleotide probe anneals to thetarget PCR product, allowing its capture by streptavidin immobilized on a fluor-containing bead. The proximity of the 3H-labelled PCR product to the fluor leadsto scintillation that can be measured.

For example, inclusion of a translation initiation region downstream (3′)to a phage promoter will yield a transcript that can subsequently betranslated in vitro. An E. coli S30 extract has been used successfully whenprokaryotic translation signals are included. For a eukaryotic system suchas a wheat germ or rabbit reticulocyte system, eukaryotic translationalsignals are necessary and the transcript should be synthesized in thepresence of 7mGpppG, so that a 5′-capped RNA is produced. Thisapproach (Figure 5.7) is known as RNA amplification with in vitro trans-lation (RAWIT; 22).
It is now a relatively easy process to amplify a coding region of a geneor cDNA and to use the PCR product as a template for direct expression ofthe encoded protein. Generally the amounts of protein expressed arerelatively small so it is common to include an appropriate detection systemsuch as a radiolabeled amino acid during protein synthesis coupled withautoradiography of a polyacrylamide gel or by adding a tag such as poly-histidine (His6-tag) during the PCR for subsequent Western blot detectionusing an anti-His antibody. As well as complete coding regions, PCRvariants such as truncated fragments can readily be analyzed. For example,the expression of a series of PCR fragments derived from a gene, withsubsequent Western blot detection using a monoclonal antibody, could beused for epitope mapping of an antigenic determinant in the protein.Similarly, the addition of a His6-tag during PCR amplification to mutatedversions of a protein (removal of silent codons) followed by antibodydetection has been used for high-throughput screening strategies to identifyprotein versions that express to high levels (23). By using such an approachseveral mutants can be analyzed for expression levels within a day followedby selection for future heterologous expression strategies.
The in vitro expression of proteins can also be used for functional studiesof proteins. For example, enzymes synthesized in vitro are likely to becorrectly folded and to retain enzymatic activity which can subsequentlybe measured in an appropriate assay system. The approach could also beused for rapid functional domain mapping of proteins where fragments thatrepresent protein domains are expressed and functionally analyzed usingin vitro assays. Furthermore, rapid in vitro protein–protein interactionstudies could be performed using this technique where not only full-lengthversion of proteins could be expressed and analyzed but also proteinfragments for mapping of interaction domains.
The use of in vitro expression approaches to analyze protein products islikely to gain momentum for the analysis of known proteins as well as forstudies on unknown proteins encoded by ORFs (open reading frames)generated by genome-sequencing projects. In this era of genome sequencingthere is an increasing demand to assign functions to ORFs and the in vitroexpression approach will certainly be of benefit.
Efficient expression obviously relies upon the presence of appropriatesignals for both transcription and translation and these vary dependingupon whether a prokaryotic or eukaryotic coupled expression system is tobe used. A number of commercially available transcription and translationsystems are available for in vitro expression studies of PCR products. Ingeneral the promoter used is a phage promoter such as T7, T3 or SP6 thatis recognized by the corresponding phage RNA polymerase (Figure 5.8).
104 PCR

Analysis, sequencing and in vitro expression of PCR products 105
Figure 5.8
RNA amplification with in vitro translation.
PCR amplification on template DNA withaddition of 5¢ signals eg RBS
PCR to add additional transcriptionsignals, eg T7 promoter
In vitro transcription by T7 RNApolymerase to generate mRNA transcripts
In vitro translation
Synthesis of protein

It is possible to design PCR primers that have 5′-tails corresponding to apromoter and translation initiation sequence. For example the sequences:
● GAATTCTAATACGACTCACTATAGGGTTAACTTTAAGAAGGAGATATACATATG [1]
● CCAAGCTTCTAATACGACTCACTATAGGGTTTTTATTTTTAATTTTCTTTCAAATACTTCCACCATG [2]
could be used as 5′-extensions to primers to add a T7 RNA polymerasesequence and untranslated leader to PCR products for expression in either[1] an E. coli S30 or [2] a wheat germ system, respectively (24). Thetranscribed region is underlined and the initiating ATG start codon is inbold. An alternative promoter, such as SP6, can also be used in place of T7.This primer-tailing approach requires the synthesis of long primers 70–80nucleotides in length for each PCR product to be analyzed. An alternativeapproach is to incorporate these sequences in a second PCR followingligation to a vector. Various manufacturers provide suitable systems, forexample Roche or Invitrogen.
References
1. Southern EM (1975) Detection of specific sequences among DNA fragmentsseparated by gel electrophoresis. J Mol Biol 98: 503–517.
2. Wong C, Dowling CE, Saiki RK, Higuchi RG, Erlich HA, Kazazian HH Jr (1987)Characterization of β-thalassaemia mutations using direct genomic sequencingof amplified single copy DNA. Nature 330: 384–386.
3. Wrischnik LA, Higuchi RG, Stoneking M, Erlich HA, Arnheim N, Wilson AC(1987) Length mutations in human mitochondrial DNA: direct sequencing ofenzymatically amplified DNA. Nucleic Acids Res 15: 529–542.
4. Fattorini P, Ciofuli R, Cossutta F, Giulianini P, Edomi P, Furlanut M, PrevidereC (1999) Fidelity of polymerase chain reaction-direct sequencing analysis ofdamaged forensic samples. Electrophoresis 20: 3349–3357.
5. Sanger F, Nicklen S, Coulson AR (1977) DNA sequencing with chain-terminat-ing inhibitors. Proc Natl Acad Sci USA 74: 5463–5467.
6. Tabor S, Richardson CC (1987) DNA sequence analysis with a modified bacterio-phage T7 DNA polymerase. Proc Natl Acad Sci USA 84: 4767–4771.
7. Innis MA, Myambo KB, Gelfand DH, Brow MA (1988) DNA sequencing withThermus aquaticus DNA polymerase and direct sequencing of polymerase chainreaction-amplified DNA. Proc Natl Acad Sci USA 85: 9436–9440.
8. Mead DA, McClary JA, Luckey JA, Kostichka AJ, Witney FR, Smith LM (1991)Bst DNA polymerase permits rapid sequence analysis from nanogram amountsof template. BioTechniques 11: 76–78.
9. Vogelstein B, Gillespie D (1979) Preparative and analytical purification of DNAfrom agarose. Proc Natl Acad Sci USA 76: 615–619.
10. Gyllensten UB, Erlich HA (1988) Generation of single-stranded DNA by thepolymerase chain reaction and its application to direct sequencing of theHLA-DQA locus. Proc Natl Acad Sci USA 85: 7652–7656.
11. Hultman T, Bergh S, Moks T, Uhlen M (1991) Bidirectional solid-phasesequencing of in vitro-amplified plasmid DNA. BioTechniques 10: 84–93.
12. Hultman T, Stahl S, Hornes E, Uhlen M (1989) Direct solid phase sequencingof genomic and plasmid DNA using magnetic beads as solid support. NucleicAcids Res 17: 4937–4946.
13. Kaneoka H, Lee DR, Hsu KC, Sharp GC, Hoffman RW (1991) Solid-phase direct
106 PCR

DNA sequencing of allele-specific polymerase chain reaction-amplified HLA-DRgenes. BioTechniques 10: 30.
14. Stahl S, Hultman T, Olsson A, Moks T, Uhlen M (1988) Solid phase DNAsequencing using the biotin-avidin system. Nucleic Acids Res 16: 3025–3038.
15. Mitchell LG, Merril CR (1989) Affinity generation of single-stranded DNA fordideoxy sequencing following the polymerase chain reaction. Anal Biochem 178:239–242.
16. Mundy CR, Cunningham MW, Read CA (1991) Nucleic acid labelling anddetection. In Brown TA (ed) Essential Molecular Biology II: A Practical Approach,pp. 57–109. Oxford University Press, Oxford, UK.
17. Hart HE, Greenwald EB (1979) Scintillation proximity assay (SPA) – a newmethod of immunoassay. Direct and inhibition mode detection with humanalbumin and rabbit antihuman albumin. Mol Immunol 16: 265–267.
18. Udenfriend S, Gerber L, Nelson N (1987) Scintillation proximity assay: asensitive and continuous isotopic method for monitoring ligand/receptor andantigen/antibody interactions. Anal Biochem 161: 494–500.
19. Gyllensten UB (1989) Direct sequencing of in vitro amplified products. In ErlichHA (ed) PCR Technology, pp. 45–60. Stockton Press, New York.
20. Bobo L, Coutlee F, Yolken RH, Quinn T, Viscidi RP (1991) Diagnosis ofChlamydia trachomatis cervical infection by detection of amplified DNA with anenzyme immunoassay. J Clin Microbiol 29: 2912.
21. Lazar JG (1993) A rapid and specific method for the detection of PCR products.Am Biotechnol Lab 11: 14.
22. Sarkar G, Sommer SS (1989) Access to a messenger RNA sequence or its proteinproduct is not limited by tissue or species specificity. Science 244: 331–334.
23. Betton JM (2004) High throughput cloning and expression strategies for proteinproduction. Biochimie 86: 601–605.
24. Lesley SA (1995) In McPherson MJ, Hames BD, Taylor GR (eds) PCR 2: A PracticalApproach. IRL Press at Oxford University Press, Oxford, UK.
Analysis, sequencing and in vitro expression of PCR products 107

Protocol 5.1 Cycle sequencing –Applied Biosystems Big Dyeterminators
EQUIPMENTAgarose gel apparatus
Microcentrifuge
Thermal cycler
0.5 ml microcentrifuge tubes
or 96 well plate
MATERIALSAgarose gel
Gel loading buffer
PCR purification or gel purification kit
Molecular size markers
Sequencing premix (containing buffer, dNTPs, dye terminators, AmpliTaqFS)
Sequencing primer (2 pmol µl–1)
Mineral oil (if no heated lid)
Phenol/chloroform from PE Biosystems at room temperature (it is critical that this is of thehighest quality to avoid fluorescent contaminants that otherwise affect the sequencing gel)
3 M sodium acetate, pH 5.2
125 mM EDTA
Ethanol, ice-cold 95% and 70%
1. Purify the PCR product either by use of a PCR clean-up kit orby isolation from an agarose gel (Chapter 6). Resuspend theDNA in a small volume, <30µl, of elution buffer.
2. Analyze 0.1 vol of the DNA on an agarose gel containing 1 µgml–1 ethidium bromide, alongside a known quantity ofmolecular size markers. Estimate the quantity of sample DNAby comparing the relative intensity of the ethidium bromide-stained band with the marker bands. A total of 30–90 ng ofDNA is recommended for direct sequencing of PCR products.
108 PCR

3. Combine in a 0.5 ml microcentrifuge tube:● 30–90 ng template DNA;● 1.6 µl (3.2 pmol) primer;● 1 µl sequencing premix;● × µl distilled water to give a total volume of 20 µl.If necessary overlay the tubes with a drop of mineral oil.
4. Place in a thermal cycler incubate for 1 min at 96°C thensubject to 25 cycles of the following:● 96°C, 10 s;● 50°C, 5 s;● 60°C, 4 min.This takes approximately 2 h to complete.
5. Add 2 µl sterile 3 M sodium acetate, 2 µl 125 mM EDTAvortex for 1 s, then add 50 µl ice-cold 95% ethanol, vortex for1 s and leave on ice for up to 15 min.
6. Pellet the DNA in a microcentrifuge (13 000 g), preferably at4°C for 15 min. As the pellet may not be visible (unless youuse a pellet paint, Chapter 3) orient the tubes convenientlywith the hinges to the outside to indicate the side of the tubeon which the DNA will be pelleted.
7. Remove the ethanol by aspirating off with a pipettor, takingcare not the touch the side of the tube with the DNA.
8. Wash the pellet by adding 100 µl ice-cold 70% ethanol,vortex briefly and centrifuge as before with the tube in thesame orientation.
9. Aspirate off the ethanol, gently tap the mouth of the tubeonto some tissue to remove most of the residual ethanol anddry briefly (up to 5 min) in a centrifugal evaporator to removetraces of ethanol. Do not overdry the DNA as this makesredissolving difficult.
10. The samples are now ready to be resuspended in dye-formamide and fractionated on an ABI sequencing instrument.
Analysis, sequencing and in vitro expression of PCR products 109


Purification and cloningof PCR products
6.1 Introduction
Once you have generated a PCR product it must often be cloned to providea permanent source of the amplified DNA fragment(s) for future use. ThisChapter outlines methods for purifying PCR products prior to cloning ordirect sequence analysis (Chapter 5), or for use as hybridization probes, andthen describes strategies for cloning PCR products into appropriate vectors.
PCR is a superb technique for the isolation of a target DNA sequence fromeither genomic DNA or cDNA in a relatively short time, avoiding many ofthe time-consuming aspects of ‘traditional’ gene cloning procedures.However, once you have your product you will often clone it into a suit-able vector to provide a ready supply of the DNA without the need torepeatedly amplify the product from its original source. This will allow youto use the product for a variety of purposes, either as control DNA insubsequent experiments or for further detailed investigation.
A critical step in planning a PCR experiment is to consider the vector andcloning strategy that you will adopt before you design and order the primersto perform the PCRs. Although, as we will discuss, it is possible to clone anyPCR product, it is most efficient to design the experiment first in order tooptimize primer design and build appropriate features into the primers beforePCR. For example, these may include suitable restriction sites, regulatoryelements such as promoters, or additional nucleotides to encode a peptidelinker or to ensure the reading frame of a coding region is maintained. It isthis ability to tailor make primers with the most appropriate features and thusto modify the resulting PCR product that makes PCR such a powerful methodcompared with traditional ‘cut-and-paste’ experiments based on naturallyoccurring restriction enzyme sites. Once the primers have been designed andthe PCR product has been generated you will invest significant time and effortin cloning and characterizing your amplified DNA. It can be very helpfulto perform your experiments in silico first to ensure correct design featuresare considered such as maintenance of open reading frames. An appropriatesoftware system can be used, such as Vector NTI (Invitrogen; seehttp://www.invitrogen.com/, where a limited number of tools are availablefreely online). Take note of the methods described in Chapter 5 that dealwith verification of the PCR product and make sure that it is the correct oneeither before you clone it, or as the first analysis of resulting clones.
6.2 Purification of PCR products
Advantages of purifying PCR products for sequencing or cloning includeremoval of:
6

● primers, nucleotides and buffer components;● nontarget amplification products;● compounds that may inhibit the ligation reaction.
In addition the concentration of product can be increased.The major disadvantage is loss of product as no purification procedure
has a 100% recovery rate. Clearly the advantages outweigh the disadvan-tages and so it is strongly recommended that PCR products are purifiedprior to the ligation reaction. There are a range of alternative protocolsfor product purification depending upon the efficiency and specificity ofthe PCR and the subsequent use for the purified DNA. The followingsections do not attempt to provide a comprehensive list of availablemethods and commercial kits but do describe the main approaches andtheir principles.
Commercial DNA purification kits
The simplest, most convenient and most reproducible approach is to use acommercial PCR purification kit. Such kits for purification of PCR-generatedDNA fragments, either from solution or from a gel slice, are available frommost large molecular biology reagent supply companies, and in generalthey perform equally well. Most kits are based on the retention of DNAfragments of greater than around 100 bp on some form of solid support,such as a silica membrane. Following washing steps to remove dNTPs,buffer and unincorporated primers, a final elution step allows recovery ofthe bound DNA in a reasonably small volume. The benefit of such systemsis that they remove the need for steps such as phenol extractions andethanol precipitations and they are relatively quick and easy. For example,the QIAGEN QIAquick Gel extraction kit, like many commercial kits, isbased on spin-column technology together with absorption of DNA to amembrane. It can be used for either gel extraction or direct purification ofPCR products. For gel extractions, the PCR products should be size-fractionated through an agarose gel and the DNA band of interest cut fromthe gel in the smallest possible volume of agarose, under UV illumination,using a fresh razor blade. Remember to take precautions such as wearinggloves and a face shield to prevent UV irradiation damage. Carefully trimaway as much excess agarose as possible. The gel slice is melted in thepresence of a chaotropic salt such as sodium iodide followed by absorptionto a membrane in a spin column. The bound DNA is then washed,removing contaminants, followed by elution into a Tris-based buffer. Thesame procedure is used for post-PCR clean-up without gel separation. Inthis case the contents of the PCR tube are mixed with a high salt solution,loaded onto the spin column, which is washed to remove dNTPs andprimers, and the PCR products are eluted. The procedure is rapid (~15 min)and results in highly purified DNA for use in ligation reactions. Othersimilar kits are available from a range of molecular biology suppliers.
A benefit of commercial kits is that they generally avoid ethanol precipi-tation steps, although for small amounts of product elution in therecommended volume of around 30–50 µl of buffer may lead to samplesbeing too dilute. However, as they are in water or a low-salt buffer the
112 PCR

sample can usually be concentrated by evaporation for a few minutes in aspin-vac to achieve the desired concentration.
Ethanol precipitation
Ethanol precipitation can be used as a fairly crude purification tool forremoval of nucleotides and salts, with the added benefit that it also concen-trates DNA samples. It can remove short oligonucleotides (<15 nucleotides)but can lead to coprecipitation of the longer oligonucleotides used asprimers in many PCR applications. Several new approaches for recovery ofDNA do not require concentration of DNA by precipitation from ethanol.The main justification for including some discussion of the method here isthat ethanol precipitation is a simple, cheap and well-tested tool. The DNAsolution is increased in salt concentration and precipitated by addition ofethanol. Traditionally ethanol precipitation was performed at low temper-ature, usually by incubating at –20°C or –70°C, however, it is nowrecognized that this results in increased precipitation of salt and soincubation at room temperature or in an ice bucket is now more common.After collecting the DNA by centrifugation, usually at 13 000 g in a micro-centrifuge, the pellet is washed in 70% ethanol to remove excess salt beforebriefly drying and redissolving in an appropriate buffer such as 10 mMTris-HCl (pH 8.0), 1 mM EDTA. Particularly where small quantities of DNAare being precipitated it can be difficult to see a pellet. In such cases themicrocentrifuge tubes should be placed in the microcentrifuge in a definedorientation, for example with the hinge upwards, so the position of thepellet can be identified even if it is not visible. An inert carrier compoundsuch as glycogen used at 50–150 µg ml–1 or linear acrylamide used at 10–20µg ml–1 such as those from Ambion can be added to increase the size of thepellet. There are also now colored carriers available. Examples includeGlycoblue, a derivatized glycogen (Ambion) and Pellet Paint™ coprecipi-tant (Novagen) that is available either in a fluorescent or nonfluorescent(NF) format. These reagents provide a visual indicator of the presence andposition of an ethanol pellet. The Pellet Paint™ NF reagent is compatiblewith preparation of samples for fluorescent sequencing applications involv-ing dyes such as the BigDye™ terminators where the fluorescentcoprecipitant would interfere with sequence detection.
In-gel ligation
High-purity, low-melting-temperature agarose does not inhibit DNA ligaseactivity. Thus, PCR products can be cloned directly after agarose gel electro-phoresis and without recovery from the agarose. The PCR products shouldbe size fractionated through a low-melting-temperature agarose gel and theDNA band of interest cut from the gel as described above. Ideally the finalconcentration of agarose should be 0.4% or lower so if, for example, youused a 4% gel then the agarose can only comprise 0.1 vol. of the ligationreaction volume. The gel slice should be equilibrated with water in a micro-centrifuge tube for about 30 min to remove the electrophoresis buffer. Theagarose slice is melted by heating to 50°C. The ligation reaction com-ponents are set up as for a standard reaction, with the exception of the PCR
Purification and cloning of PCR products 113

product. The appropriate volume of gel, held at 50°C is then pipetted intothe ligation mix held at 37°C, and mixed immediately. This ensures theagarose does not set on contact with the other reaction components. Theligation reaction can then be incubated at the desired temperature(15–37°C). Depending on the temperature at which the ligation reaction isperformed the agarose may partly solidify, but this is not a problem.Advantages of in-gel ligation are that it is rapid and relatively cheap(although high-quality agarose is expensive) and DNA loss is avoided. As acomment on any gel purification procedure, even when well-separatedbands are purified from a gel, there can be some cross-contamination fromother DNA molecules. This makes it important to confirm the identity ofan insert in clones derived from the isolated DNA. If the PCR product is tobe used for direct analysis such as DNA sequencing without cloning, thenany such minor cross-contamination will not be an issue.
Spin columns
An early method of DNA purification used a siliconized glass wool plug andstandard microcentrifuge tubes. The principle of the technique is that theglass wool physically retains an agarose slice while under centrifugal forcethe buffer and DNA are forced out of the gel and can pass through the glasswool plug. A small plug of siliconized glass wool is placed in the bottomof a 0.5 ml microcentrifuge tube containing a pin-sized hole in the bottomto allow liquid to pass through during centrifugation. The gel slice contain-ing DNA is placed on top of the glass wool cushion and the tube placedinside a 1.5 ml microcentrifuge tube before centrifugation at 13 000 g for1–2 min. The liquid in the larger tube should contain DNA from the geland can be concentrated by ethanol precipitation if necessary. Once it isplaced in the tip of filter unit the gel slice can be subjected to a freeze–thawcycle by placing the unit at –20°C until the gel is frozen and then allow-ing it to thaw at room temperature. Such a treatment can increase therecovery of product. This method is cheap and generally reliable althoughoccasionally agarose components can pass through the glass wool plug. Itis better to use a standard agarose rather than a low-melting-temperatureagarose as the former will be less likely to disintegrate during centrifugation.Generally this approach has been superseded by commercially availablespin filters such as 0.22 µm Costar® Spin-X® centrifuge tube filters(Corning Life Sciences). The agarose slice is simply placed in the filter andcentrifuged in a microcentrifuge for 1–2 min. Quantitative recovery ofproduct depends on the size and amount of DNA being purified, and isgenerally more efficient for shorter fragments. In general recovery is usuallyless than 50%.
Electroelution
After agarose gel electrophoresis the DNA band is cut from the gel and theDNA is eluted from the gel slice by means of an electrical current. There aremany approaches to electroelution and we mention only two here. The firstapproach does not require special apparatus. The gel slice is placed at oneside of a piece of preboiled (1) dialysis tubing that also contains a small
114 PCR

volume (100–500 µl depending on the gel slice size) of the agarose gel runningbuffer. After sealing, the dialysis tube is placed in the gel electrophoresis tankcontaining the same buffer as in the tubing and gel slice. The gel slice isclosest to the anode (–) and an electrical current is applied to electrophoretic-ally elute the DNA from the gel slice so it becomes trapped on the surface ofthe dialysis tubing. It is recommended that the elution be allowed to proceedfor 30 min at 50–75 V when using a mini-gel apparatus. DNA elution fromgel slices can be monitored by use of a hand-held UV lamp (365 nm) tovisualize ethidium bromide fluorescence. Often the DNA will accumulate onthe cathode-facing inner surface of the dialysis membrane. It can be releasedby reversing the current in the electrophoresis tank for 30–60 s. Alternatively,following removal of the gel slice, it can be released back into solution bygentle agitation or pipetting of the solution against the membrane. It cansometimes be convenient to remove some of the buffer from the dialysis bagbefore dislodging the DNA to allow a more concentrated solution to berecovered. If necessary the DNA can be concentrated by ethanol precipita-tion (see above). There are also various commercial apparatus forelectroelution, for example from Stratagene and Millipore.
Silica matrix or Geneclean purification
This approach is the basis for most commercial purification kits. It is basedon the observation that DNA could be released from agarose gel slices andbound to silica particles in the presence of a chaotropic salt (2,3). A gel slicecontaining DNA is excised from an agarose gel and allowed to dissolve in1 ml of 6 M sodium iodide at 55°C. Once dissolved around 10 µl of a silicafine-particle suspension is added, mixed and incubated with constant butgentle shaking for 10 min. The silica fines bind the DNA that can becollected by microcentrifugation followed by washing three times with 70%ethanol. The pellet is air-dried briefly (about 5 min) and the DNA eluted in20 µl of water by incubation at 45°C for 1 min. Although this approachresults in good recovery (up to 80%) of DNA from agarose gels it is notrecommended for large DNA fragments (10–15 kbp) as shearing is oftenobserved. For example, Geneclean can be obtained from Q-biogene.
6.3 Introduction to cloning of PCR products
The success of cloning PCR-generated fragments depends on several factors,including PCR product purity (Section 6.2), the choice of restrictionenzyme(s), primer design and the plasmid you choose to use as the recipientvector. Although the cloning of PCR-amplified products can sometimes provedifficult, new and improved vectors and procedures have been developed toincrease cloning efficiency. The following sections describe factors thatshould be considered in order to successfully clone your PCR product andwill outline several ways to increase your PCR cloning efficiency.
PCR re-amplification
Occasionally you will have a low yield of PCR product. To increase the yieldit is possible to re-amplify using PCR. Essentially a small aliquot of the
Purification and cloning of PCR products 115

products of the first PCR is used as template in a second round of PCR usingthe same primers and reaction conditions. In this case there is no need topurify the products of the first PCR before performing the second PCR,simply use a 1–5 µl aliquot of the first PCR reaction mix as the templatefor the second PCR. Of course one potential disadvantage of the increasednumber of PCR cycles is the increased possibility of accumulatingPCR-mediated mutations in the final PCR products. Use of ‘proofreading’DNA polymerases (Chapter 3) reduces, but does not eliminate thispossibility. Generally therefore, PCR re-amplification should be avoided asa routine procedure to increase product yield. Rather, it is more appropriateeither to increase the amount of template used, or to perform severalidentical PCR amplifications using a standard number of cycles (25–30cycles) and to pool the products. Nonetheless, it may be appropriate to usea re-amplification step if there is negligible product visible and you suspect,for example, that either the amount of starting template was very low, orthe reaction has not worked efficiently, perhaps due to some contaminant.The effect of performing a further PCR would be to use the enrichedtemplate preparation to amplify the product sufficiently to visualize it, orto dilute out contaminants interfering with the reaction. If products fromre-amplifications or nested PCRs are to be cloned it is important to ensurethat several independent clones are sequenced to identify those containingthe correct sequence and to discard any that may contain a mutation. Thisis obviously more difficult for clones whose sequence is not already knownand in such cases may require the sequencing of 10–12 clones to identifythe consensus.
Why can PCR cloning be a problem?
You may have heard that the efficiency of PCR cloning can be low, butcareful experimental design can reduce such difficulties. One importantsource of difficulty is the terminal transferase activity of Taq DNApolymerase that leads to the addition of an additional nucleotide, usuallyan A, at the 3′-end of the newly synthesized DNA strand. This non-template-directed addition leads to PCR products that do not have bluntends as expected, but rather have single nucleotide extensions. Thisphenomenon explains the inefficiency of blunt-end ligations involvingPCR products. In order to generate blunt-end PCR fragments it is necessaryto treat the DNA with a proofreading enzyme such as the Klenow fragmentof DNA polymerase I, or T4 or T7 DNA polymerase, or a proofreadingthermostable DNA polymerase, in the presence of the four dNTPs (seeProtocol 6.1). This procedure results in the enzyme removing the unpairedterminal nucleotide, but the presence of the dNTPs means that if theenzyme removes the next nucleotide this is immediately replaced by its5′→3′ DNA synthesis activity, leaving a blunt or ‘polished’ end. The‘terminal A’ issue does not generally occur when a thermostable proof-reading DNA polymerase is used as these enzymes would remove anyunpaired nucleotide they erroneously added. Several commercial systemsare available for cloning PCR products by exploiting the additional Aadded by Taq DNA polymerase.
116 PCR

6.4 Approaches to cloning PCR products
Essentially any cloning vector can be used for cloning a PCR product,although as with any cloning experiment success is often better withrelatively small vectors (2.5–5 kbp). An increasing range of vectors are avail-able from molecular biology reagent suppliers that:
● allow cloning of restriction digested PCR products;● allow efficient blunt-end cloning of proofreading enzyme products;● exploit the additional A on Taq PCR products (4); or● utilize topoisomerase-mediated (TOPO) ligation (5) for very rapid (5 min)
cloning reactions;● exploit the addition of 5′-sequences on primers to allow ligation-
independent cloning or recombinational cloning.
Various approaches for cloning PCR products are outlined below, and thefeatures of the PCR product and vector are summarized in Table 6.1.
Restriction enzyme cloning
It is common to incorporate restriction enzyme sites into the primers usedto generate the PCR products (6). When the PCR product is digested withthese restriction enzymes the resulting fragment can be ligated with a suit-ably restricted vector molecule. Often it is convenient to introduce differentrestriction enzyme sites at the two ends of the PCR product to allowdirectional cloning into the doubly digested vector, with at least one of theenzymes generating a cohesive or ‘sticky’ end (Table 6.2). This double-digeststrategy can also avoid the need to use alkaline phosphatase to dephos-phorylate the vector, a step that is necessary to prevent religation of thevector alone if it is restricted with a single enzyme. The introduction ofrestriction sites into the primer is straightforward (Chapter 3) and there aretwo approaches. Most commonly the site is added as a 5′-extension to thePCR primer (Table 6.2), or if there is a sequence within the PCR primer thatdiffers by only one or two nucleotides from a restriction enzyme site, thesenucleotides can be changed or mutated to generate the new restriction sitewithin the original sequence. There are some issues that must be consid-ered when designing such primers. The positioning of the restriction sitein relation to the 5′-end of the primer and the enzyme you choose dictatethe efficiency of digestion and the overall success of your cloning experi-ment (7). A useful source of information about how many nucleotides toadd to the 5′-end of primers for digestion by different enzymes is given inan Appendix to the New England Biolabs molecular biology products cata-logue. It is recommended that between 3 and 10 nucleotides should precedethe restriction enzyme site in order to ensure efficient cleavage of the sitewithin the terminus of a PCR product (Table 6.2). It is best to err on theside of caution and add sufficient overhang nucleotides since the cost ofadditional nucleotides added to a primer sequence is more effective thanhaving to adopt some alternative strategy to ensure efficient restrictionenzyme cleavage.
If this issue does prove problematic, one approach that has been reportedto overcome some difficulties with restriction enzyme digestion is to blunt-
Purification and cloning of PCR products 117

Tab
le 6
.1A
pp
roac
hes
to c
loni
ng P
CR
pro
duct
s an
d th
e ve
ctor
fea
ture
s ne
cess
ary
for
diffe
rent
PC
R cl
onin
g st
rate
gies
Clo
ning
str
ateg
yTy
pe
of e
ndSe
que
nce
of e
ndVe
ctor
pro
per
ties
Taq
DN
A
3’-d
A o
verh
ang
5’ANNNNNN......3’
TA v
ecto
r +
ligas
ep
olym
eras
e3’ANNNNNN......5’
TOPO
TA
vec
tor
Proo
frea
ding
DN
A
Blun
t en
d5’NNNNNN......3’
Blun
t en
ded
vect
or,
e.g.
Sm
aI d
iges
ted
pol
ymer
ase
3’NNNNNN......5’
(CCC/GGG
) th
en a
lkal
ine
pho
spha
tase
the
nlig
ase
Add
ed r
estr
ictio
n si
te (
blun
t en
d)Z
ero
Blun
t
Zer
o Bl
unt
TOPO
Add
ed r
estr
ictio
n 5’
or
3’ o
verh
ang
e.g.
Sim
ilarly
dig
este
d ve
ctor
site
(co
hesi
ve e
nd)
EcoR
I5’AATTCNNNN......3’
If si
ngle
dig
est,
the
n tr
eat
vect
or w
ith
AA
AA3’GNNNN......5’
alka
line
pho
spha
tase
the
n lig
ase
Bam
HI
5’GATCCNNNN......3’
If do
uble
dig
est,
add
liga
seA
AA
A3’GNNNN......5’
PstI
AA
AA5’GNNNN......3’
3’ACGTCNNNN......5’
Dire
ctio
nal T
OPO
A
dd t
he a
pp
rop
riate
5’CACC-target sequence......3’
TOPO
act
ivat
ed v
ecto
rcl
onin
gse
que
nce
to t
he 5
’ en
d 3’GTGG-target sequence......5’
of t
he s
ense
prim
er
5’......vector3’
3’......vectorGTGG5
’St
rand
inva
sion
of
the
adde
d se
que
nce
by t
heco
mp
lem
enta
ry v
ecto
r ta
il an
d TO
PO li
gatio
n.Th
e ot
her
end
of t
he p
rodu
ct is
join
ed t
o th
eve
ctor
by
a bl
unt
end
TOPO
rea
ctio
n

Tab
le 6
.1co
ntin
ued
Clo
ning
str
ateg
yTy
pe
of e
ndSe
que
nce
of e
ndVe
ctor
pro
per
ties
Liga
tion
Poly
nucl
eotid
e ta
il Re
stric
ted
vect
or t
reat
ed w
ith (
TdT)
and
in
dep
ende
nt
adde
d by
Ter
min
al
com
ple
men
tary
nuc
leot
ide
clon
ing
deox
ynuc
leot
idyl
tr
ansf
eras
e (T
dT)
5’GGGGGGGGGGGGG...3’
5’...3’
5’GGGGGGGGGGG3’...5’
3’…CCCCCCCCCCCCCC...5’
Liga
tion
Spec
ific
seq
uenc
e ad
ded
5’GAC GAC GAC AAG ATX-targetsequence 3’
5’vector......3’
inde
pen
dent
to
5’e
nd o
f up
stre
am
5’GAC GAC GAC AAG3’AX-targetsequence 5’
3’vector......CTGCTGCTGTTCT5’
clon
ing
prim
er
Spec
ific
seq
uenc
e ad
ded
5’target sequence-A
5’CC GGG CTT CTC CTC......vector3’
to 5
’end
of
dow
nstr
eam
3’target sequence–TGG CCC GAA GAG GAG5’
3’......vector5’
prim
erA
nnea
l vec
tor
and
inse
rt,
22o C
, 5
min
Then
tre
at P
CR
pro
duct
w
ith T
4 D
NA
pol
ymer
ase
+ dA
TP
Gat
eway
clo
ning
A
dd a
ttB
site
s to
PC
R p
rodu
ct
Sens
e st
rand
(at
tB1)
5’G GGG ACA AGT TTG TAC AAA AAA GCA GGC
Reco
mbi
ne w
ith D
onor
vec
tor
cont
aini
ng
T-target sequence 3’
attP
1 an
d at
tP2
site
s. E
nsur
e th
e re
adin
g
Ant
isen
se s
tran
d (a
ttB2
)5’GGG GAC CAC TTT GTA CAA GAA AGC TGG
fram
e is
mai
ntai
ned
as s
how
n fo
r th
e tr
iple
t
GTA-target sequence
codo
ns
Gat
eway
clo
ning
D
irect
iona
l TO
PO c
lone
See above
Clo
ne in
to T
OPO
act
ivat
ed D
onor
vec
tor
soth
at a
ttL1
and
att
L2 s
ites
now
flan
k th
e in
sert
.En
sure
cor
rect
rea
ding
fra
me
is m
aint
aine
d

end ligate the PCR products (Figure 6.1) to produce concatamers. For TaqDNA polymerase-generated products this will require a polishing step toensure removal of any overhang nucleotides to create a blunt end (Protocol6.1). Remember also that the PCR products must be 5′-phosphorylated forthis strategy to work. Since most primers are not usually synthesized inphosphorylated format, a treatment of the primers before PCR (Protocol 3.1)or of the PCR product with T4 DNA kinase in the presence of ATP will benecessary for efficient self-ligation. The latter can also be performed
120 PCR
PCR products with terminalrestriction sites added byPCR primers
Blunt-end polish thenligate PCR products
Restriction digestion ofconcatamers of PCRproducts
Figure 6.1
Concatemerization of blunt-end PCR products to allow efficient restrictiondigestion for subsequent cloning via cohesive ends. Restriction enzyme sites areintroduced as part of the PCR primers. The PCR products are first made blunt-ended (Protocol 6.1) and are then ligated under conditions favoring intermolecularligation to form concatemers. This leads to restriction sites being located withinlong DNA molecules, allowing efficient restriction enzyme digestion to releasefragments with cohesive ends suitable for ligation into the cloning vector.
Table 6.2 Cleavage efficiency of some commonly used restriction endonu-cleases. This assay system measures the cleavage rate close to the end ofduplex oligonucleotides. The restriction endonuclease cleavage site is shownin bold.
Restriction enzyme Oligonucleotide sequence Cleavage efficiency after 2 hour at 37°C
EcoRI GGAATTCC >90%CGGAATTCCG >90%
XbaI CTCTAGAG 0%GCTCTAGAGC >90%
XhoI CCTCGAGG 0%CCCTCGAGGG 10%
BamHI CGGATCCG 10%CGGGATCCCG >90%

essentially according to Protocol 3.1, but with the primer replaced by analiquot of PCR product. Within the resulting self-ligated concatamers, therestriction enzyme sites are now found internally within long DNAmolecules and digestion of these sites is therefore more efficient. Thisapproach can also be modified to include only half a restriction site at the5′-end of both primers (8). If the three 3′-nucleotides of a restriction siteare added to the 5′-end of each primer, the PCR products will contain halfrestriction sites at each end. Blunt-end ligation results in concatamers thatnow have full restriction sites that can be cleaved to release DNA fragmentswith sticky ends (Figure 6.2). This approach results in fragments withidentical restriction sites at both ends of the digested product and there-fore does not allow directional cloning.
Sometimes you will want to incorporate a restriction site within a primerfor use in cloning the PCR product, but the site may occur internally withinthe amplified fragment. This situation may occur during some complexsubcloning experiments, for example to create recombinant moleculescomprising multiple components, or during cDNA cloning. In such cases itmay be possible to protect the internal site(s) from digestion byincorporating 5-methyl-dCTP in place of dCTP during PCR. If the restrictionenzyme is sensitive to methylation of C then only the sites in the primer,that contain unmethylated dC will be cleaved whereas the internal sitescontaining 5-methyl-dC will not be cleaved. The approach of protecting
Purification and cloning of PCR products 121
PCR products with terminalhalf restriction sites addedby PCR primers
Blunt-end polish thenligate PCR products
Restriction digestionof concatamersof PCR products
TTC GAA
AAG CTTGAA
CTT
TTC GAA
CTT
… TTC
… AAG
GAATTC
CTTAAG
GAATTC
CTTAAG
GAA …
CTT …
G AATTC G
CTTAA G CTTAA
AATTC
G
TTC
AAG
AAG
AATTC G
G CTTAA
Figure 6.2
Introduction of half-restriction sites added at the 5′-ends of PCR primers, to createfull sites by blunt-end ligation of PCR products. The PCR products can be madeblunt-ended (Protocol 6.1) and then ligated to create complete restriction siteswithin long molecules of DNA. This allows efficient restriction enzyme cleavage togenerate fragments with cohesive ends suitable for cloning into a vector.
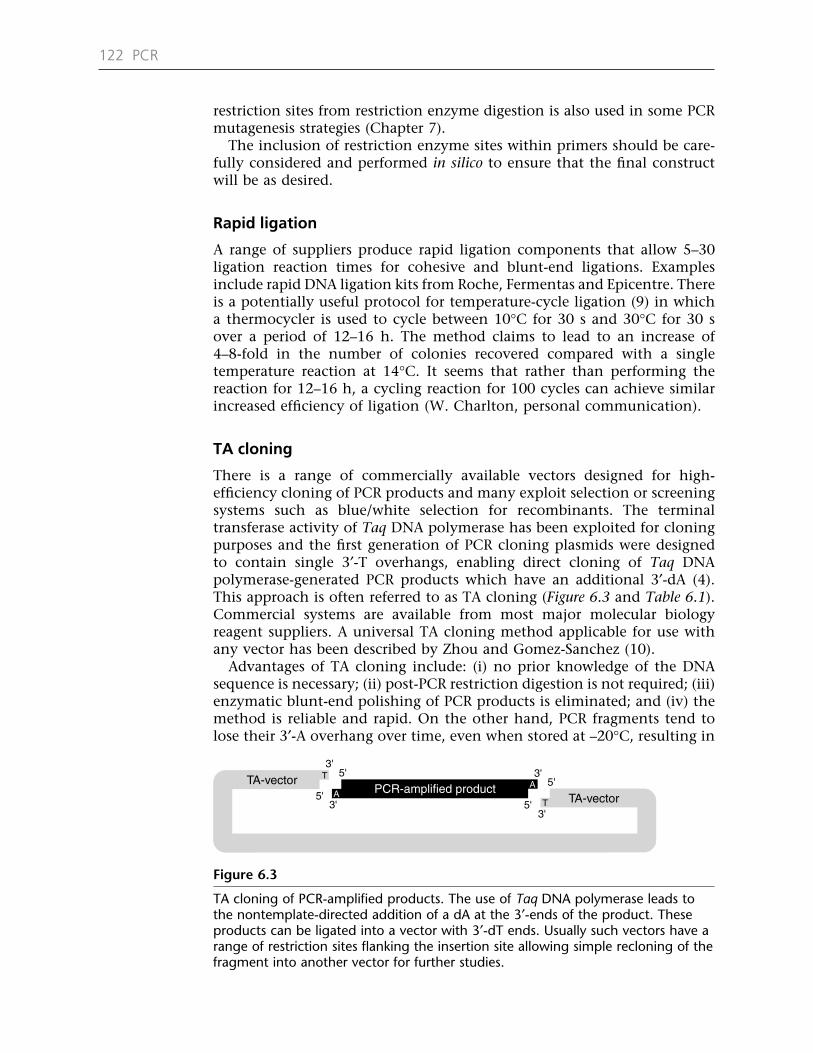
restriction sites from restriction enzyme digestion is also used in some PCRmutagenesis strategies (Chapter 7).
The inclusion of restriction enzyme sites within primers should be care-fully considered and performed in silico to ensure that the final constructwill be as desired.
Rapid ligation
A range of suppliers produce rapid ligation components that allow 5–30ligation reaction times for cohesive and blunt-end ligations. Examplesinclude rapid DNA ligation kits from Roche, Fermentas and Epicentre. Thereis a potentially useful protocol for temperature-cycle ligation (9) in whicha thermocycler is used to cycle between 10°C for 30 s and 30°C for 30 sover a period of 12–16 h. The method claims to lead to an increase of4–8-fold in the number of colonies recovered compared with a singletemperature reaction at 14°C. It seems that rather than performing thereaction for 12–16 h, a cycling reaction for 100 cycles can achieve similarincreased efficiency of ligation (W. Charlton, personal communication).
TA cloning
There is a range of commercially available vectors designed for high-efficiency cloning of PCR products and many exploit selection or screeningsystems such as blue/white selection for recombinants. The terminaltransferase activity of Taq DNA polymerase has been exploited for cloningpurposes and the first generation of PCR cloning plasmids were designedto contain single 3′-T overhangs, enabling direct cloning of Taq DNApolymerase-generated PCR products which have an additional 3′-dA (4).This approach is often referred to as TA cloning (Figure 6.3 and Table 6.1).Commercial systems are available from most major molecular biologyreagent suppliers. A universal TA cloning method applicable for use withany vector has been described by Zhou and Gomez-Sanchez (10).
Advantages of TA cloning include: (i) no prior knowledge of the DNAsequence is necessary; (ii) post-PCR restriction digestion is not required; (iii)enzymatic blunt-end polishing of PCR products is eliminated; and (iv) themethod is reliable and rapid. On the other hand, PCR fragments tend tolose their 3′-A overhang over time, even when stored at –20°C, resulting in
122 PCR
PCR-amplified product A
3'
5'
5'
3'
TA-vector T
A
3'
3'5'
5'
T TA-vector
Figure 6.3
TA cloning of PCR-amplified products. The use of Taq DNA polymerase leads tothe nontemplate-directed addition of a dA at the 3′-ends of the product. Theseproducts can be ligated into a vector with 3′-dT ends. Usually such vectors have arange of restriction sites flanking the insertion site allowing simple recloning of thefragment into another vector for further studies.

decreased cloning efficiency after prolonged storage. Also, TA cloning onlyworks efficiently with thermostable DNA polymerases, such as Taq DNApolymerase, which have terminal transferase activity. However, for manyPCR cloning purposes Taq DNA polymerase is not the most appropriateenzyme since it lacks 3′→5′ exonuclease proofreading activity and there-fore can incorporate mutations into the final PCR product as discussed inChapter 3. TA cloning does not work efficiently with many thermostableproofreading polymerases used in PCR, although some, such as Vent® andDeepVent® do yield a low proportion (~5%) of dA-tailed products.
TOPO cloning
Increased speed and efficiency of cloning dA-tailed products has also beenachieved by the use of DNA topoisomerase I rather than DNA ligase. TheTOPO-Cloning™ (Invitrogen) approach uses linearized vectors carrying a3′-dT extension and preactivated with DNA topoisomerase I covalentlyassociated with each 3′-phosphate. On addition of a PCR product the topo-isomerase DNA joining activity rapidly joins the fragment into the vectorallowing transformation of competent cells after only a 5 min roomtemperature incubation. A similar approach, Zero Blunt®, is available forblunt-ended fragments such as PCR products generated by a proofreadingthermostable DNA polymerase. The problem with these approaches is thatthe identity between the two ends means that a fragment could be clonedin either orientation. A series of pET-based expression vectors exist fordirectional cloning of PCR products (Invitrogen). In this case the 5′-addition CACC is added to the upstream primer (Table 6.1). Thedownstream primer does not contain this terminal sequence. The PCRproduct is then incubated with TOPO-activated pET vector in which oneend contains a 3′-overhang GTGG. By strand invasion this anneals tothe CACC addition on the PCR product and the topoisomerase catalysesthe formation of the appropriate phosphodiester link. At the other end theenzyme performs a blunt-end ligation.
Cloning long PCR fragments
The increasing use of long-range polymerase mixes (Chapter 3) is allowingthe amplification of longer DNA regions that often need to be cloned forfurther analysis. The TOPO-XL PCR cloning kit (Invitrogen) is one optionfor direct cloning and relies upon the pCR®-XL-TOPO vector that carriesboth kanamycin and zeomycin resistance genes and the ccd positiveselection marker. The kit also utilizes crystal violet to avoid the use ofethidium bromide and UV irradiation for detection of DNA in gels, therebypreventing DNA damage of the long molecules and enhancing isolation offull-length clones. The range of cloning kits and vectors adapted for directcloning and expression of PCR products is increasing continually.
More rapid TOPO cloning
There are now also a series of TOPO cloning vectors that are coupled withtransformation of Mach1™–T1® E. coli cells from Invitrogen that allow very
Purification and cloning of PCR products 123

rapid growth of a culture in just 4 h from an overnight colony. This allowsDNA purification to be performed in the same day, rather than waiting fora further overnight culture.
Blunt-end cloning
PCR products can be blunt-end cloned into any vector linearized by arestriction enzyme that generates blunt ends. If a proofreading enzyme wasused during PCR then the PCR products should already be blunt-ended. IfTaq DNA polymerase was used then the dA overhangs (11) must beremoved by ‘polishing’ the ends as described in Section 6.3 and Protocol 6.1.
Blunt-end cloning vectors are commercially available. For example,Perfectly Blunt™ cloning kits (Novagen) include reagents for polishing andphosphorylating the PCR product, then ligating with one of a range oflinearized vectors and competent cells for transformation. The ZeroBlunt™PCR cloning kit (Invitrogen) utilizes the pCR®-Blunt vectors with a power-ful selection for recombinants. The ligation of an insert into these vectorsleads to an inability to express a lethal gene, ccdB (control of cell death).Any linearized vector molecules that are religated in the absence of an insertshould be nonviable. These kits contain linearized vector, reagents forligation and competent cells and are also available in TOPO-Cloning™format to enhance ligation efficiency and speed. As described above, thereare rapid ligation components that can be used for blunt-end ligation.
Restriction-enhanced cloning
PCR cloning vectors are available based on combining DNA ligation withrestriction digestion to reduce vector only religation (Figure 6.4). Oneexample is pCRScript plasmid (Stratagene) based on the blunt-endcloning of PCR products into an SrfI site. SrfI cuts DNA rarely and it is there-fore highly unlikely that such a site will occur in the PCR product to becloned. Including the restriction enzyme SrfI in the ligation reactionensures that vector molecules remain linearized. Any vector molecules thatare religated will then be redigested by the SrfI. However, once a PCRfragment has been ligated into the vector the SrfI restriction site no longerexists and the recombinant plasmid remains circularized. Subsequent trans-formation of E. coli cells with the ligation reaction results in efficientreplication of the circular recombinant molecules but poor efficiencyrecovery of the linear vector alone. The high efficiency of this system alsominimizes the ligation time, which at 1 h gives rise to a sufficient numberof positive transformants for use in further analysis. Such an approach leadsto recombinant plasmids in which the PCR fragment can be inserted ineither orientation. An alternative strategy relies on the use of thepCRScript Direct vector for directional cloning of the blunt-end PCRfragment. In this case the SrfI-digested vector is treated with alkalinephosphatase to remove the 5′-phosphate groups. The vector is then digestedwith a second restriction enzyme that also generates a blunt end. Thisresults in a vector with one dephosphorylated end and one phosphorylatedend. If one of the primers is 5′-phosphorylated then directional cloning ofthe PCR fragment will result in ligation at both ends, resulting in a circular
124 PCR

molecule with single-strand nicks. If the fragment is joined to the vectorin the wrong orientation only one end can ligate but the other cannot, thusresulting in only linear molecules. Again the differential efficiency oftransformation of circular versus linear molecules means high efficiencyrecovery of recombinants with the PCR fragment inserted in the definedorientation. The advantages of this system and other systems based onsimilar technologies include: (i) > 90% ligation efficiency; (ii) short ligationtime; (iii) no requirement for 3′-overhangs; and (iv) the use of thermostableDNA polymerases with proofreading activity such as Pfu and Pwo DNApolymerase. Taq DNA polymerase can also be used, however this requirespolishing the ends of the amplified DNA fragment (Section 6.3).
Ligation-independent cloning (LIC)
It is possible to generate circular recombinant molecules for efficient trans-formation without the need for covalent closure of the circle by DNA ligase(12–15). The simplest approach relies upon the action of terminal deoxy-nucleotidyltransferase (TdT) to add nontemplate directed nucleotides onto3′-ends of DNA molecules (Figure 6.5). If the linearized vector is treated withTdT in the presence of, for example dGTP, then the ends of the vector will
Purification and cloning of PCR products 125
Srf Idigestion
Srf I
Ligation
Transformation
Low frequencynonrecombinant colonies
High frequencyrecombinant colonies
PCR fragment
PCR fragment
+
GCCCGGGCCGGGCCCG
GCCCCGGG
GGGCCCCG
GCCCCGGG
GGGCCGGG
GCCCCGGG
GGGCCCCG
GCCCGGGCCGGGCCCG
Figure 6.4
Restriction-enhanced cloning using pCRScript (Stratagene). After SrfI digestion thevector is linearized but in the absence of the blunt-ended PCR fragment the SrfIrestriction site is constantly redigested with the majority of the vector stayinglinearized. Upon ligation of the blunt-ended PCR fragment to the vector the SrfIsite is destroyed, generating a stable recombinant molecule that cannot beredigested by SrfI.

have oligodG extensions and the vector cannot recircularize. Treatment ofthe PCR product with TdT in the presence of dCTP will generate oligodCextensions. The G and C tails on the vector and PCR fragment are comple-mentary and can anneal, producing stable hybrids that can be efficientlytransformed (Table 6.1). In vivo repair of the gaps will yield covalently closedmolecules.
A more specific approach is to generate PCR primers that incorporate12–15 nucleotide extensions at the 5′-ends of PCR primers designed toamplify the vector and target PCR products (Figure 6.6). If the extensionsadded to the vector and primer are designed to be complementary it ispossible to subsequently join these molecules without ligation. To do thisit is necessary to generate single-stranded tails corresponding to the endsof the vector and PCR products (Table 6.1). This is readily achieved by treat-ing the DNA molecules with an enzyme such as T4 or T7 DNA polymerasein the presence of one dNTP determined by the design of the primers. The3′→5′ exonuclease (proofreading) activity of the DNA polymerase removesnucleotides from the 3′-end of the DNA molecule until it encounters thefirst position corresponding to the dNTP added to the reaction. Once sucha nucleotide is encountered the DNA polymerase may remove it, but the5′→3′ DNA synthesis activity immediately replaces it so the DNA fragmentsthen effectively all have the same single-stranded regions removed. The
126 PCR
Terminaltransferase
+dCTP
+dGTP
PCR-amplified product
Vector
PCR-amplified product
Vector
Vector Vector
Hybridization
CCCCCC
CCCCCC
GGGGGG
GGGGGG
3'
5'3'
5'
5'
3'
GGGGGG
5'
3'
GGGGGG
CCCCCC
CCCCCC
Figure 6.5
Ligation-independent cloning (LIC) of PCR fragments. Terminal transferase is usedto add a single dNTP to create a polymeric tail on the 3′-ends of the vector andcomplementary tails on the PCR fragment. The tails can anneal leading to a stablemolecule that can be directly transformed into E. coli cells which will repair themolecule in vivo.

Purification and cloning of PCR products 127
GATGGTAGTAGGC
CTACCATCATCCG
(A)
(B)
(C)
PCR fragment to be cloned withprimers with sequence-specific tails
5'
3'
PCR-amplified productGCCTACTACCATC
CGGATGATGGTAG
GATGGTAGTAGGC
CGGATGATGGTAG
CGATGGTAGTAGG
GCTACCATCATCC
GCTACCATCATCC
CCTACTACCATCG
CGATGGTAGTAGGC
GCTACCATCATCCG
GCCTACTACCATCG
CGGATGATGGTAGC
PCR amplify vector using primerswith sequence-specific tails
Digest 3'-ends with T4 DNApolymerase and dCTP
Anneal PCR product from (A)with vector from (B)
PCR-amplified product
PCR-amplified product
Vector Vector
Vector Vector
Vector Vector
Digest 3'-ends with T4 DNApolymerase and dCTP
5'
3'
5'
5' 3'
3'G
G
5'3'
3'5'
5'
3' 5'
3'
C
C
CCTACTACCATCG
GGATGATGGTAGC
Figure 6.6
Ligation-independent cloning (LIC) of PCR fragments using specific PCR-generatedtails. The primers are modified to carry 5′-additions that will become incorporatedinto the PCR product. The primers are designed so that treatment with T4 DNApolymerase and one nucleotide will digest the 3′-ends of the tails. The T4polymerase will only digest the DNA until it reaches the position corresponding tothe added dNTP, which allows the proofreading activity to continually repair themissing nucleotide if the polymerase removes it. This results in a defined single-stranded tail on each end of the treated fragment. (A) Preparation of the PCRproduct, in this case using T4 polymerase and dGTP. (B) Treatment of theamplified vector, but in this case in the presence of dCTP, yielding single-strandedtails that are complementary to those on the PCR products. (C) Annealing of thetwo molecules for transformation into E. coli cells.

single-stranded sequences on the vector and PCR products are comple-mentary therefore allowing annealing of these ends to produce stabledouble-stranded circular molecules that can be transformed efficiently.
Novagen produce an Ek/LIC vector series based on this approach andspecifically designed for expression of fusion proteins with an enterokinaseprotease cleavage for recovery of the target protein. The primer sequencesare 5′-GAC GAC GAC AAG ATX-insert specific sequence 3′ for the sensestrand and 5′-GAG GAG AAG CCC GGT-insert specific sequence 3′ for theantisense strand (Table 6.1). Position X in the sense primer must completethe codon and therefore will encode either Met (ATG) or Ile (ATC, ATT,ATA). Following PCR it is critical that the dNTPs are removed beforeproceeding with the T4 DNA polymerase treatment. This is to ensure thatonly the chosen dNTP is present at this stage of treatment to create thesingle-strand ends. A PCR clean-up set is therefore necessary (Chapter 4).The reactions with T4 DNA polymerase are performed in the presence ofdATP to create the single-strand ends that are complementary to single-strand ends of the vector. The treated PCR fragment is then added to thevector and annealing is allowed to proceed at 22°C for 5 min before trans-formation of an aliquot into E. coli cells. It is possible to adapt your ownpreferred vector for LIC by adding appropriate sequences flanking a uniquerestriction site. Restriction digestion followed by T4 DNA polymerase treat-ment will then yield a vector for use in LIC.
A general vector that has been shown to function efficiently in LIC forhigh-throughput cloning is pMCSG7. This contains an N-terminal his-tagfollowed by a tobacco etch virus (TEV) protease cleavage site and a SspI(AAT/ATT) restriction site for LIC (16).
An alternative approach to generating the single-stranded ends is togenerate PCR primers with about 12 nucleotide 5′-tails that are synthesizedto replace dT with dU. The resulting PCR fragment, synthesized using thefour normal dNTPs, therefore has one strand carrying terminal dUs whilethe complementary ends would contain dTs. Treatment of the PCRproducts with the enzyme uracil N-glycosidase leads to the cleavage ofN-glycosidic bonds between uracil and deoxyribose leading to a loss of thebase. The loss of bases leads to disruption of base pairing and thereforeexposure of single strands that can be annealed to a vector displayingcomplementary single-stranded ends. It is possible to clone either non-directionally by having identical ends on both primers, or directionally byhaving distinct sequences on the two primers used in the original PCR, andby appropriate choice of a directional vector.
These approaches to ligation-independent cloning can be performedmore rapidly than many traditional ligation reactions as the annealing ofsingle-stranded ends is achieved within about 30 min to produce trans-formation-ready DNA molecules.
Recombination-mediated cloning
This approach is intended to reduce the need to use traditional restrictiondigestion and ligation steps in gene cloning procedures and to support high-throughput cloning applications based on robotic platforms. The mostprominent system is the GATEWAY™ system from Life Technologies, now
128 PCR

part of Invitrogen. There is a useful online tutorial that explains thetechnology at http://www.invitrogen.com/Content/Online%20Seminars/gateway/gatewayhome.html. This system provides a generic and rapidmechanism for initial cloning of PCR fragments into an entry clone by utiliz-ing a recombinase and negative selection. The insert can subsequently betransferred to a wide range of expression clones by recombination from theentry clone. This allows the parallel production of a range of expression clonesthat can be tested in a range of different expression systems from bacteria tomammalian cells. The approach is rapid and is adaptable for high-throughputcloning. The simplicity of the Gateway approach relies upon att recombi-nation sites that are built into PCR primers and the vectors (Table 6.1) andthat are acted upon by enzyme mixes that cleavage and rejoin att sites.
The system is based upon the naturally occurring bacteriophage lambdasystem for integration of its phage genome into the E. coli chromosome toenter the lysogenic phase and subsequently its excision from the genometo enter the lytic cycle. These integration and excision events occur byhomologous recombination controlled by enzymes. The recombinationsites in lambda are known as attP and those in E. coli are attB and are only25 bp long. The integration reaction involves two proteins, an integraseand a host integration factor. Homologous recombination leads to theproduction of attL and attR sites with no loss of DNA sequence. These sitescontain a core sequence of 15 nucleotides that is the recognition sequencefor the integrase. The excision process involves the action of the twoenzymes above plus an excisionase. There has been significant refinementof the att sites so that a range of compatible sites now exist. This providesspecificity and directionality to cloning reactions.
There are two processes for creating an entry clone from PCR products:
● TOPO cloning;● adding att sites to the PCR primers.
TOPO cloning approaches have been discussed earlier in this Sectionand a range of TOPO-ready Gateway vectors are available for directionalcloning. The consequence of cloning a PCR fragment in this manner is toplace the DNA adjacent to appropriate attL1 and attL2 sites that arepresent in the vector. The critical consideration is to ensure that the result-ing clone will be in-frame with the sequence upstream in the final vector ifthere is reliance on a vector-based ribosome binding site and ATG. In silicocloning experiments using Vector NTI allow the various constructs to bedesigned to ensure they will be appropriate before ordering the PCRprimers.
The other approach to creating an entry clone involves adding attB sitesto the 5′-ends of the PCR primers. The attB sequences are slightly differentand are represented as attB1 and attB2 that recombine with the attP1 andattP2 sites respectively on the donor vector, creating attL1 and attL2 siteswhen BP clonase is added (Figure 6.7). This is called the BP reaction.
The subsequent movement of the insert from the entry clone, in whichit is transcriptionally silent, into appropriate expression vectors is facilitatedby LR clonase. This allows the movement of the insert from the entry cloneinto various expression vectors that carry attR1 and attR2 sites with whichthe attL1 and attL2 sites of the entry clone can recombine to recreate attB1
Purification and cloning of PCR products 129

130 PCR
attP1 attP2
att B1 att B2
PCR product
pDONOR Target sequence
Target sequence
BP clonase reactionto create entry clone
pDEST
att R1 att R2
att L1 att L2
Target sequence
att B1 att B2
Target sequence
pENTRY
Add expression vectorpDEST to pENTRY clone
LR clonase reaction tocreate expression clone
Expressionclone
+

and attB2 sites in the expression clone (Figure 6.7). This is called the LRreaction.
There is a powerful positive selection system associated with the variouscloning steps. The vectors contain the ccd gene between its att sites, whichconfers a lethal phenotype when the vector is transformed into a normalE. coli strain. This means that only clones that have undergone recombi-nation and which have therefore lost the ccd gene and at the same timegained the target insert, should be viable following transformation.
There are a wide a range of expression vectors available for final expres-sion in bacteria, yeast or various animal cell lines. In addition it is possibleto adapt your own vector to accept inserts by Gateway cloning. A series ofcassettes are available that can be cloned into your favorite vector to createa vector in the correct reading frame for recombinational insertion of a PCRfragment or pENTRY clone.
Primers for the gene-specific regions should be designed according to thenormal rules for primer design (Chapter 3), and so would normally bearound 15–20 nt long. The att sites are added as additional sequence to the5′-end. If primers are ordered from Invitrogen then the appropriate attsequences can be selected automatically during the ordering process andthe cost of synthesis is relatively cheap.
An example of appropriate design of primers to add attB1 and B2 sites tothe 5′ and 3′ ends respectively of a gene of interest are shown in Table 6.1.The addition of att sites leads to the inclusion of additional amino acids atthe start and end of the encoded protein. If stop codons are introducedbefore the 3′-attB2 site then it is possible to ensure that the C-terminal endof the protein finishes at the natural sequence.
6.5 Confirmation of cloned PCR fragments
Assume that you have cloned a PCR fragment and have analyzed the result-ing clones by PCR screening of bacterial colonies or cultures (Protocol 6.2),or by preparing plasmid DNA and releasing the insert by restrictiondigestion, and you identify clones with the correct fragment size. A word
Purification and cloning of PCR products 131
Figure 6.7 (opposite)
Gateway cloning. A PCR product is generated with primers containing 5′-terminalattB sites. This PCR product is purified and mixed with a pDONOR vector thatcarries attP sites. Addition of BP clonase leads to homologous recombination ofthe PCR fragment into the pDONOR plasmid with the creation of aatL sites. Thereis also excision of the corresponding vector fragment that carries a lethal ccdBgene. Any pDONOR vector that has not undergone recombination leads to deathof any bacterial transformant. The resulting pENTRY clone carrying the PCR insertis isolated from bacterial transformants, purified and then mixed with anappropriate expression vector often called pDEST vectors. These pDEST vectorsalso carry a ccdB insert flanked by attR sites. Addition of LR clonase leads tohomologous recombination between the att sites. The insert is inserted into thepDEST vector to form an expression clone. Once again any pDEST vector that failsto recombine will be lost during transformation due to the ccdB gene. Carefuldesign of the original PCR primers should lead to a clone that is in the correctreading frame for efficient expression in the chosen host.

of caution: for the reasons described in Chapter 5 do not simply rely onrestriction digest analysis by using the restriction enzymes used to cloneyour amplified product. All this will tell you is that you have the correctsized insert, but not whether it is the correct fragment. Perhaps the PCRamplification resulted in a heterogeneous mixture of DNA fragments withnear-identical sizes that you have cut out from the gel, purified and nowcloned into a suitable vector. If you engineered restriction sites into yourprimers then any DNA fragment, including nonspecific products, will alsocontain these sites. A similar result would be obtained if you blunt-endcloned your PCR fragment and analyzed it using restriction enzymes thatcut within the polylinker of the plasmid. It is important to perform yourPCR reaction under high stringency conditions to minimize the possibilityof generating other DNA fragments. It is essential to analyze your clonesusing known internal restriction enzymes or nested PCR. Several clonesshould be analyzed to verify that the amplified band used for the cloningexperiment consisted of one DNA species. For putative positive clones youshould also then determine the DNA sequence of the insert to ensure thatthe DNA fragment is exactly what you expect.
References
1. Sambrook J, Fritsch EF, Maniatis T (1981) Molecular Cloning: A Laboratory Manual(2nd edition). Cold Spring Harbor Laboratory Press, Cold Spring Harbor, NY.
2. Vogelstein B, Gillespie D (1979) Preparative and analytical purification of DNAfrom agarose. Proc Natl Acad Sci USA 76: 615–619.
3. Yang RCA, Lis J, Wu B (1979) Elution of DNA from agarose gels after electro-phoresis. Methods Enzymol 68: 176–182.
4. Marchuk D, Drumm M, Saulino A, Collins FS (1991) Construction of T-vectors,a rapid and general system for direct cloning of unmodified PCR products.Nucleic Acids Res 19: 1154.
5. Pan G, Luetke K, Juby CD, Brousseau R, Sadowski P (1993) Ligation of syntheticactivated DNA substrates by site-specific recombinases and topoisomerase I.J Biol Chem 268: 3683–3689.
6. Scharf SJ, Horn GT, Erlich HA (1986) Direct cloning and sequence analysis ofenzymatically amplified genomic sequences. Science 233: 1076–1078.
7. Moreira RF, Noren CJ (1995) Minimum duplex requirements for restrictionenzyme cleavage near the termini of linear DNA fragments. BioTechniques 19:56–59.
8. Kaufman DL, Evans GA (1990) Restriction endonuclease cleavage at the terminiof PCR products. BioTechniques 9: 304.
9. Anders H, Lund AH, Duch M, Pedersen FS (1996) Increased cloning efficiencyby temperature-cycle ligation. Nucleic Acids Res 24: 800–801.
10. Zhou M-Y, Gomez-Sanchez CE (2000) Universal TA Cloning. Curr Issues Mol Biol2: 1–7 http://www.horizonpress.com/cimb/abstracts/v2/01.html
11. Clark JM (1988) Novel non-templated nucleotide addition reactions catalyzedby prokaryotic and eukaryotic DNA polymerases. Nucleic Acids Res 16:9677–9686.
12. Aslanidis C, de Jong PJ (1990) Ligation-independent cloning of PCR products(LIC-PCR). Nucleic Acids Res 18: 6069–6074.
13. Aslanidis C, de Jong PJ, Schmitz G (1994) Minimal length requirement of thesingle-stranded tails for ligation-independent cloning (LIC) of PCR products.PCR Methods Appl 4: 172–177.
132 PCR

14. Haun RS, Moss J (1992) Ligation-independent cloning of glutathione S-transferasefusion genes for expression in Escherichia coli. Gene 112: 37–43.
15. Haun RS, Serventi IM, Moss J (1992) Rapid, reliable ligation-independentcloning of PCR products using modified plasmid vectors. BioTechniques 13:515–518.
16. Stols L, Gu M, Dieckman L, Raffen R, Collart FR, Donnelly MI (2002) A newvector for high-throughput, ligation-independent cloning encoding a tobaccoetch virus protease cleavage site. Protein Expr Purif 25: 8–15.
Purification and cloning of PCR products 133

Protocol 6.1 Blunt-end polishingof PCR fragments
MATERIALST7 DNA polymerase
10 × T7 DNA polymerase buffer
100 mM MgCl2
2 mM each dNTP mix
Distilled water
EQUIPMENTMicrocentrifuge tube
Microcentrifuge
Water bath or heat block set at 70°C
1. Combine in a microcentrifuge tube:● up to 40 µl of purified PCR product;● 5 µl of 10 × T7 polymerase buffer;● 2 µl of 100 mM MgCl2;
● 2.5 µl of 2 mM dNTP mix;● 1 unit of T7 DNA polymerase;● water to 50 µl.
2. Collect reagents and mix by a brief (1 s) centrifugation step.
3. Incubate at room temperature for 30 min.
4. Heat to 70°C for 10 min to inactivate the polymerase.
134 PCR

Protocol 6.2 PCR screening ofbacterial colonies or cultures
MATERIALSAgar plate with colonies for screening
Sterile water
PCR reactant mix containing 5 pmol each primer, 0.2 mM each dNTP, 1 × PCR buffer, 0.5 unitTaq DNA polymerase, water per 25 µl1
LB or 2 × TY media with appropriate antibiotic used to grow cultures
Agarose gel
EQUIPMENT0.5 or 0.2 ml tubes or microtitre plates for PCR
Microcentrifuge
Orbital incubator for growth of bacterial cultures
It is possible to directly analyze colonies to determine whether they contain a desiredrecombinant plasmid and at the same time to set up overnight cultures from the colonies toallow isolation of recombinant plasmids for further study.
1. Prepare 3 ml aliquots of LB or 2 × TY media containing theappropriate antibiotic in 20–50 ml volume plastic tubes.
2. Pipette 100 µl of sterile water into a 0.5 ml microcentrifugetube.
3. Use a toothpick to collect a colony from the agar plate andswirl gently in the sterile water, then use the toothpick toinoculate a tube containing growth medium2.
4. Place the tube containing the water and dispersed bacterialsuspension in a thermal cycler and heat to 100°C for 5 minthen cool to 20°C.
5. Centrifuge for 1 min at 13 000 g in a microcentrifuge to pelletthe debris.
6. Pipette a 24 µl aliquot of the PCR premix into a PCR tube andadd 1 µl of the DNA solution from the bacterial colony.
7. Collect and mix reagents by a brief (1 s) centrifugation step.
8. Perform the PCR using the following conditions:● 94°C, 5 min initial denaturation;
Purification and cloning of PCR products 135

● 94°C, 30 s3; 55°C4, 30 s3; 72°C, 30 s3 for 25–30 cycles;● 72°C, 1 min.
9. Analyze a 5 µl aliquot on an agarose gel.
10. Meanwhile place the inoculated cultures in an orbitalincubator at 37°C to allow growth of the culture forsubsequent plasmid isolation from PCR positive colonies, orincubate the agar plate to allow subsequent cultureinoculation once positives have been identified.
NOTES
1. A hot-start procedure (Chapter 4) will enhance specificity, butthe short cycle times often used make this approachunsuitable for TaqStart antibody approaches.
2. It is advisable to use the water lysis approach, but it is alsopossible to add a small amount of a bacterial pellet directly toa PCR tube. Touch a toothpick to the edge of the colonytaking care not to transfer a visible amount of the colony.Swirl the toothpick briefly in the PCR mix and then if requiredinoculate a tube containing growth medium such as 2 × TY orLB, to allow growth of a culture, or streak onto an appropriateagar plate.
3. The length of each incubation step depends upon the type ofthermal cycler. In some cases for reaction temperaturemonitoring instruments the time may be as short as 1–10 s.
4. The annealing temperature depends upon the length of theprimers and should be as high as possible to ensure specificityof priming. It is worth testing a positive culture at differentannealing temperatures. This can conveniently be undertakenwith a gradient thermal cycler.
136 PCR
PCR mutagenesis
7.1 Introduction
The ability to mutate DNA by changing its nucleotide sequence is an impor-tant molecular biology tool that has led to significant insights into:
● the structure–function relationships of protein, DNA and RNA molecules;● molecular interactions involving biomolecules including receptor–ligand,
antibody–antigen and enzyme–substrate, effector or regulator complexes;● in vivo regulation of gene expression.
In addition, it provides a routine approach for the modification of DNAsequences to facilitate cloning or analysis to make life simpler for thescientist.
The structural and functional importance of specific nucleotidesequences in a DNA or RNA molecule, or of a specific amino acid within aprotein, can be explored by changing the corresponding DNA sequence bysite-directed mutagenesis. This requires some knowledge of positions thatare worth investigating. In the case of proteins it is usually important tohave some structural information. However, where there is limited or nostructural information then random mutagenesis techniques can beemployed to explore biomolecule function. This involves the randomchanging of nucleotides and screening for those that show interestingdifferences based on some phenotype, such as an enzyme or binding assay.Interesting variants can then be sequenced to see what nucleotide change(s)has led to the new phenotype. This approach is very powerful for generat-ing new proteins for biotechnology applications.
PCR mutagenesis allows us to modify and engineer any target DNA withease and high efficiency and can be used to:
● introduce a deletion or insertion of sequence information includingrestructuring genes by domain swapping experiments;
● alter one or a few specific nucleotides; or● randomly mutate a region of nucleotide sequence including a complete
coding region if required.
There are a range of kits available for mutagenesis experiments. It can beconvenient to use a kit when you require a mutation as a one-off experi-ment, or when funds are not limiting. Sometimes when you mustundertake extensive mutagenesis reactions the cost of purchasing kits canbe prohibitive. Normally, the kits are based on published procedures andtherefore it is possible to adapt the approach and build your own ‘kits’ usingindividual reagents that you can optimize for your studies.
For any mutagenesis reaction the template DNA must be single-strandedto allow an oligonucleotide to bind to its complementary sequence so thatit can act as a DNA synthesis primer. Historically this required cloning
7

your gene of interest into a vector such as bacteriophage M13, whichproduces single-stranded copies of its genome, and any inserted gene,which can be isolated from the culture medium. Alternately double-stranded plasmid DNA can be denatured by using an alkali treatment anda neutralization step or by heating. PCR is ideally suited to mutagenesisbecause the production of single-strand template occurs during thedenaturing step of the reaction. Even though most protocols now use aproofreading thermostable DNA polymerase, it is still appropriate to limitthe number of cycles of amplification to limit possible errors becomingamplified. This can be done quite simply by performing the reaction on arelatively high concentration of the recombinant plasmid template(around 10–100 ng).
The amplification of DNA in a PCR means that at the end of the reactionthe newly synthesized, mutated product should be present in excess overthe wild-type template. However, most mutagenesis approaches incorpo-rate a step that acts to destroy the original template DNA, leaving themutated DNA to be transformed into the host cells. This is important forensuring that most clones recovered are derived from the mutated DNArather than the wild-type template. As we will see some mutagenesisprocedures, such as the Quikchange approach, use a PCR-type reaction butlead to only linear rather than exponential amplification of the product.Selecting against the wild-type template is therefore critical in these experi-ments.
In this Chapter we shall cover the basic principles of PCR-based muta-genesis for introducing a variety of DNA modifications.
7.2 Inverse PCR mutagenesis
The introduction of mutations by inverse PCR involves synthesis of thewhole plasmid. This allows a plasmid to be altered by including a muta-tion during the PCR replication of the complete plasmid followed byligation to reform the circular plasmid molecule as outlined in Figure 7.1and Protocol 7.1 (1). In essence the two primers are designed to anneal toopposite strands of the plasmid so that their 5′-ends are adjacent. Theseprimers will thus lead to copying of the two strands of the plasmid. The 5′-ends of both primers must be phosphorylated by T4 DNA kinase treatment(Protocol 3.1) so that they can be ligated to the 3′-end of the replicatedplasmid strand. The original procedures used Taq DNA polymerase but thiscan lead to a nontemplate directed addition of a 3′-dA that could introducean unselected secondary insertion mutation. This additional dA can beremoved by treatment of the DNA with Klenow fragment of DNApolymerase I in the presence of the four nucleotides. However, to avoid thisproblem and for higher fidelity a proofreading DNA polymerase (Chapter3) should be used. It is important to ensure sufficient time for the copyingof the template given the length of the plasmid template and typically oneshould allow 2 min per kb. This method relies upon circularization of thePCR products by blunt-end ligation.
Copying a whole plasmid by inverse PCR can be used to introduce pointmutations, deletions or insertions. Since the wild-type plasmid is used astemplate it is usual to start with a low concentration of template so that it
138 PCR

will not contribute a high background during screening. For example witha plasmid miniprep the DNA should be diluted 1:1 000 or 1:10 000 and1–10 µl used in the reaction. However, it is more efficient to start with ahigher concentration of plasmid template and perform fewer PCR cycles.This approach can be used if it is coupled to a procedure to destroy thewild-type DNA once its function as a template has been performed. Thereare several such ‘high efficiency’ methods that have been developed toselect against the template. The one that has become most widely adoptedand is of general applicability is based on the Quikchange proceduredeveloped by Stratagene. This approach is outlined in detail below, andcould be adopted to enhance the efficiency of inverse PCR by including aDpnI digestion step after the ligation step.
PCR mutagenesis 139
Anneal primers in a back-to-backarrangement and perform PCR toreplicate the plasmid
Linear form of plasmid generatedwith mutation on both strands
Recircularize plasmid by ligationand transform into E. coli
Figure 7.1
Inverse PCR for mutagenesis of a plasmid. Two primers are designed in a back-to-back manner (with their 5′-ends designed to correspond to adjacent positions).One primer carries a point mutation (�). PCR amplification of the completeplasmid using a proofreading DNA polymerase will result in linear double-stranded, mutated plasmid molecules that can be blunt-end self-ligated to givecircular molecules for transformation into E. coli. Alternatively if a deletion is to beintroduced then the primers are designed to flank the sequence to be deleted.

Quikchange mutagenesis
The Quikchange strategy makes use of an inverse site-directed mutagenesisapproach together with destruction of parental template by usingmethylation-dependent restriction endonuclease (DpnI) digestion (Figure 7.2and Protocol 7.2). The principle can be adapted for other plasmid systems andreagents. Although the process is performed in a thermocycler, using typicalreagents for a PCR, due to the complementary nature of the primers used it
140 PCR
Product
CH3
CH3
CH3
CH3
CH3CH3
CH3
CH3
CH3
CH3
CH3
CH3
CH3
CH3
CH3
CH3
CH3
CH3
Annealedproduct
Dpnl digestion
Transform into E. coli
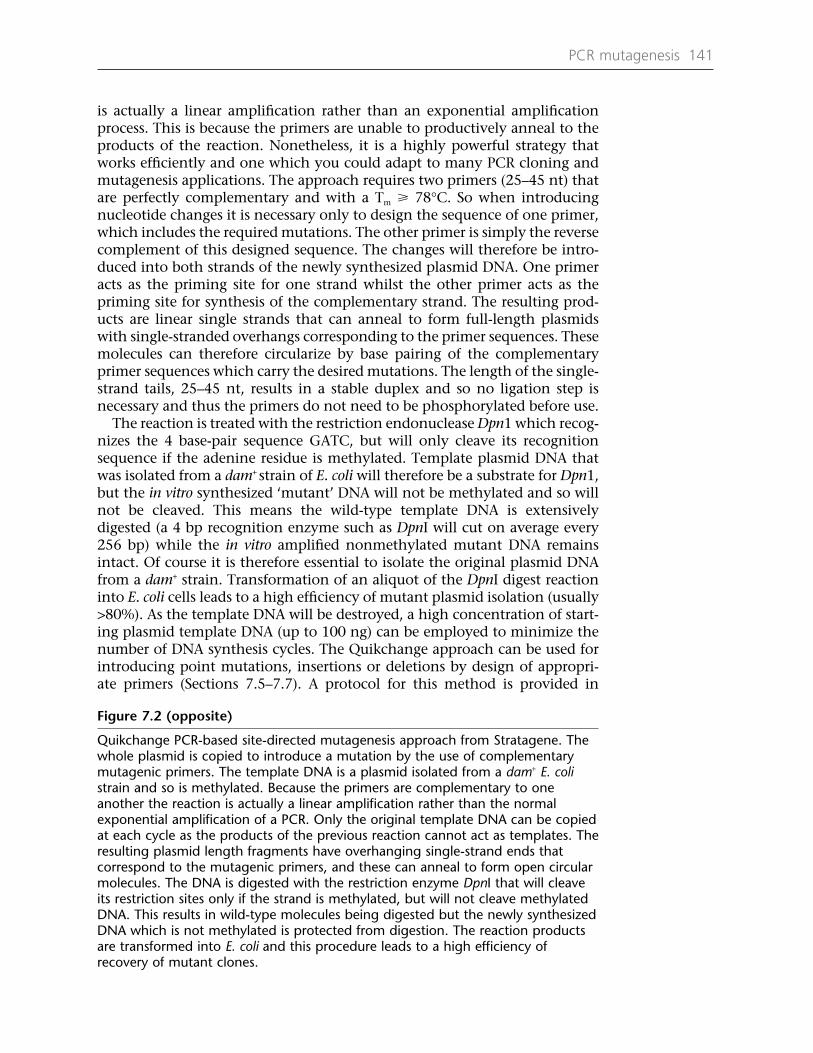
is actually a linear amplification rather than an exponential amplificationprocess. This is because the primers are unable to productively anneal to theproducts of the reaction. Nonetheless, it is a highly powerful strategy thatworks efficiently and one which you could adapt to many PCR cloning andmutagenesis applications. The approach requires two primers (25–45 nt) thatare perfectly complementary and with a Tm � 78°C. So when introducingnucleotide changes it is necessary only to design the sequence of one primer,which includes the required mutations. The other primer is simply the reversecomplement of this designed sequence. The changes will therefore be intro-duced into both strands of the newly synthesized plasmid DNA. One primeracts as the priming site for one strand whilst the other primer acts as thepriming site for synthesis of the complementary strand. The resulting prod-ucts are linear single strands that can anneal to form full-length plasmidswith single-stranded overhangs corresponding to the primer sequences. Thesemolecules can therefore circularize by base pairing of the complementaryprimer sequences which carry the desired mutations. The length of the single-strand tails, 25–45 nt, results in a stable duplex and so no ligation step isnecessary and thus the primers do not need to be phosphorylated before use.
The reaction is treated with the restriction endonuclease Dpn1 which recog-nizes the 4 base-pair sequence GATC, but will only cleave its recognitionsequence if the adenine residue is methylated. Template plasmid DNA thatwas isolated from a dam+ strain of E. coli will therefore be a substrate for Dpn1,but the in vitro synthesized ‘mutant’ DNA will not be methylated and so willnot be cleaved. This means the wild-type template DNA is extensivelydigested (a 4 bp recognition enzyme such as DpnI will cut on average every256 bp) while the in vitro amplified nonmethylated mutant DNA remainsintact. Of course it is therefore essential to isolate the original plasmid DNAfrom a dam+ strain. Transformation of an aliquot of the DpnI digest reactioninto E. coli cells leads to a high efficiency of mutant plasmid isolation (usually>80%). As the template DNA will be destroyed, a high concentration of start-ing plasmid template DNA (up to 100 ng) can be employed to minimize thenumber of DNA synthesis cycles. The Quikchange approach can be used forintroducing point mutations, insertions or deletions by design of appropri-ate primers (Sections 7.5–7.7). A protocol for this method is provided in
PCR mutagenesis 141
Figure 7.2 (opposite)
Quikchange PCR-based site-directed mutagenesis approach from Stratagene. Thewhole plasmid is copied to introduce a mutation by the use of complementarymutagenic primers. The template DNA is a plasmid isolated from a dam+ E. colistrain and so is methylated. Because the primers are complementary to oneanother the reaction is actually a linear amplification rather than the normalexponential amplification of a PCR. Only the original template DNA can be copiedat each cycle as the products of the previous reaction cannot act as templates. Theresulting plasmid length fragments have overhanging single-strand ends thatcorrespond to the mutagenic primers, and these can anneal to form open circularmolecules. The DNA is digested with the restriction enzyme DpnI that will cleaveits restriction sites only if the strand is methylated, but will not cleave methylatedDNA. This results in wild-type molecules being digested but the newly synthesizedDNA which is not methylated is protected from digestion. The reaction productsare transformed into E. coli and this procedure leads to a high efficiency ofrecovery of mutant clones.

Protocol 7.2. This uses KOD polymerase (Novagen) rather than the PfuTurborecommended in the kit, since in our experience KOD provides a much morerobust and efficient DNA polymerase with high yields of product.
General applicability of DpnI selection
The ability to destroy the template DNA by using DpnI in this way couldbe built into many PCR methodologies and so we recommend that when
142 PCR
Product
CH3
CH3
CH3
CH3
CH3
CH3
CH3
CH3
CH3
Dpnl digestion
Coupling of mutationsin megaprimer
Mutagenicprimer 1
PCR
Annealing
Mutagenicprimer 2
Megaprimer linearamplification
CH3
Wild-typetemplate digested
by Dpnl
Mutant strandresistant to
Dpnl
CH3

considering strategies for new experimental procedures you should considerwhether a template destruction step such as this would be helpful. It mayfor example allow you to cut out a purification step which will preventsome level of product loss.
Coupling independent mutations
In some cases you may wish to introduce more than one mutation into atarget gene but the mutation sites are too far apart to be included in thesame mutagenic primer. A modified Quikchange approach can be used. Asoutlined in Figure 7.3, two primers are designed, one to incorporate eachof the desired mutations into the target gene. These primers are designedto point towards each other to facilitate the amplification of the interveningDNA. This product now has both mutations physically linked in a singleDNA fragment. The product can be purified by gel extraction or a PCRclean-up kit. It is then annealed to the original plasmid DNA and bothstrands act as primers for synthesis of the remainder of the plasmidmolecule. Digestion of the reaction mix with DpnI leads to destruction ofthe wild-type plasmid molecules. The products of the reaction can annealto form double-stranded molecules with single-strand tails correspondingto the original PCR product which can therefore anneal to circularize theplasmid. This digested DNA mixture is then used to transform E. coli cellsto yield mutant DNA with high efficiency.
An alternative strategy is to perform one round of mutagenesis with oneset of mutagenic primers both of which are 5′-phosophorylated. After DpnIdigestion, the reaction is treated with DNA ligase and dam methylase in thepresence of S-adenosylmethionine, to create closed circular DNA that isthen methylated. Following a clean-up step this acts as template for thenext set of mutagenesis primers (2). The approach allows sequential intro-duction of mutations into the template DNA without intermediatetransformation and plasmid characterization steps.
Stratagene have also introduced a Multisites kit, which uses a series ofphosphorylated primers in a Quikchange reaction containing a thermo-stable ligase. Only one primer is designed per mutation, and only onestrand of the template is copied. DNA extension from one primer proceedsuntil it reaches the adjacent primer annealed to the template, which hasalso been extended. The ligase can then join these DNA fragments. DNAsynthesis from the 3′-most primer continues until it proceeds around therest of the plasmid template and reaches the 5′-most primer. The wild-typetemplate is destroyed by the DpnI digestion before transformation.
PCR mutagenesis 143
Figure 7.3 (opposite)
Introduction of coupled mutations by use of a megaprimer approach andQuikchange selection. Two mutagenic primers are designed to amplify a region ofDNA, each primer introducing a mutation (�) and (�). This fragment is then usedas a megaprimer to amplify the remainder of the plasmid in a manner analogousto the Quikchange approach. In this case the primers are longer DNA fragmentsrather than short oligonucleotide primers. Subsequent restriction digestion withDpnI leads to destruction of the wild-type, methylated template DNA, but not thenewly synthesized plasmids that circularize to form open circles due to thecomplementarity of the megaprimer sequences.

7.3 Unique sites elimination
This approach relies upon the coupled removal of a unique restriction sitetogether with the introduction of the desired mutation. It can be adaptedfor essentially any plasmid that carries a unique restriction site. If therestriction enzyme site lies within a coding region, then it is important toensure that the change you will introduce to destroy the site does notalter the coding sequence of the DNA, otherwise you will introduceanother mutation into the encoded protein. As outlined in Figure 7.4, twoprimers are designed, one to incorporate the desired mutation and theother to eliminate the unique restriction site. These primers are designedto point towards each other to amplify the intervening DNA. Thisproduct now has both mutations physically linked on a single DNAmolecule. The product can be purified by gel purification or a PCR clean-up kit. It is then annealed to the original plasmid and acts as a primer forsynthesis of the remainder of the plasmid molecule. This is a linear ampli-fication reaction of essentially the same type as the Quikchange approach(Section 7.2). The resulting fragments will therefore have long single-strand ends that can anneal to form circular molecules. There is no needto perform a ligation step. If you do wish to ligate, then ensure that theprimers are 5′-phosphorylated before performing the PCR. Next digest theDNA with the restriction enzyme whose site you have destroyed. This willlinearize any wild-type plasmid molecules, but any in which the site hasbeen destroyed will not be linearized. If you have performed a ligation,ensure that you have performed a heat inactivation step before the digestto prevent any religation of wild-type sequences. This digested DNAmixture is then used to transform E. coli cells. Since circular DNA is ableto transform much more efficiently (~3 000-fold) than linear DNAmolecules, the cells will largely be transformed by the circular mutantmolecules. Individual colonies can then be screened for plasmid that haslost the restriction site and should therefore contain the linked desiredmutation. An alternative approach is to grow a culture of the transforma-tion cells without plating out. Plasmid DNA can then be isolated fromthese cells and subjected to a restriction digest with the enzyme whosesite was knocked out. Any wild-type plasmid that was able to replicatewill again be linearized, but mutant DNA will remain circular. A furthertransformation step with this DNA will effectively ensure that all colonieswill now contain the mutation.
7.4 Splicing by overlap extension (SOEing)
PCR SOEing can be used to join or ‘splice’ together sequences, such as aregulatory sequence with a coding region, or two protein domain codingregions. It can also introduce deletions, insertions or point mutations intoa DNA sequence (3). Figure 7.5 shows a schematic example of the approachfor joining two sequences together. The critical aspect is that at least oneprimer (P3 in Figure 7.5) should contain a sequence overlap with the endof the fragment to which it is to be joined.
Two separate PCRs are performed, often simultaneously, using the appro-priate template DNAs and appropriate primers; one reaction with primers
144 PCR

PCR mutagenesis 145
Coupling of mutationsin megaprimer
Mutagenicprimer
PCR
Restrictionselectionprimer
Megaprimerinverse PCR
Wild-typetemplate digested
by restrictionenzyme
Mutant strandresistant to
restriction enzyme
Ligation
Restriction digestion
Figure 7.4
Unique site elimination (USE) mutagenesis scheme using PCR. Two primers areused to introduce the desired mutation (�) and the selection mutation (�) thatwill destroy a unique restriction site. This PCR step physically joins these twomutations on a single DNA molecule that can be purified and used as a primer forsynthesis on a plasmid template. The resulting heteroduplex molecules arerestriction digested with the enzyme whose site has been mutated. Wild-typemolecules that contain an intact restriction site will be linearized but heteroduplexmolecules carrying one wild-type and one mutant strand will remain circular andwill transform E. coli cells efficiently. Plasmid replication in E. coli will resolve thestrands leading to some cells carrying wild-type plasmids and some carryingmutants. The cells are pooled, and plasmid DNA is purified and digested with theselection enzyme. The wild-type plasmids will be linearized, but the mutantplasmids will remain circular and can be recovered as clones following a secondround of E. coli transformation.

P1 and P2 and a second with primers P3 and P4. The design of at least one,and sometimes two ‘overlap’ primers (P2 and P3) leads to two PCR productswhich have a region of identical sequence, defined by the overlap primers.Aliquots of these two primary reactions are mixed in a second PCR. In theearly rounds of this PCR the products of the primary PCRs are denaturedand can anneal with each other, due to the overlap, to create 3′-ends thatcan be extended on the complementary template strand to give a full-lengthproduct. Once this product is formed the flanking primers (P1 and P4; Figure7.5) will allow exponential amplification of this full-length product.
As shown in Figure 7.5 only one strand of each PCR product is ‘productive’.These are the strands that have 3′-ends capable of priming on the comple-mentary strand of the other product. The other two strands cannot act inthis way and so are considered to be nonproductive. However, primers P1and P4 will be able to anneal to these nonproductive strands, which can actas templates for linear amplification of further copies of the productive
146 PCR
5'3'
PCR 1A PCR 1B
Sequence A Sequence B
PCR 2
5'3'
Denature templateAnneal primers
5'3' 5'
3'
5'
5' 5'
3'3'
3'3'
5'
3' 5'
3'
5'
3'
5'
3'
P1 P2 P3 P4
5'
5'
5'
5'
5'
3'
3'
5'
5'
5'
3'
3'
5'3'
3'
5'
3'
3'
3'
3'
Amplify target regions
Mix productsAdd primers P1 and P4
Linear amplificationfrom the nonproductivestrands
Self-priming of productsgenerates final product
Amplification offinal product
P1P4
P4
P1
Figure 7.5
Example of gene SOEing experiments to join two sequences A and B. Initial PCR amplification ofgene A uses two primers P1 and P2, and amplification of gene B uses two primers P3 and P4. Notethat primer P3 contains a 5′-extension corresponding to the sequence on gene A at the site ofjoining. The two fragments can therefore anneal by virtue of the complementary terminal tails andcan self-prime with subsequent amplification of the full-length product by flanking primers P1 andP4. As shown in the box, only one strand of each product is ‘productive’ for self-priming.

strands as shown in the box in Figure 7.5, thus enhancing the likelihood offormation of a full-length product.
This basic approach to PCR SOEing can also be used to introducemutations into a DNA sequence. In this case the template DNA for bothprimary PCRs will be the same. The overlap primers (P2 and P3) will bedesigned to incorporate the mutations and so the overlaps will be comple-mentary but both strands will now include the appropriate base changes(Figures 7.6 and 7.7). In the secondary PCR the mutated products of theprimary PCRs will anneal with one another and self-prime to form full-
PCR mutagenesis 147
Figure 7.6
Example of gene SOEing experiment to introduce a mutation (�). Parallel PCRsintroduce the mutation into two products by use of primers P1 and P2, and P3and P4. Primers P2 and P3 are complementary and therefore facilitate self-primingof the PCR products. The full-length mutated product is amplified by flankingprimers P1 and P4.
5¢3¢
Gene A
Generate mutant fragmentswith complementary tails
Denature templateAnneal primers in separate PCRs
Mix PCR productsAdd flanking primers P1 and P4
Self priming of productsgenerates final products
Amplification of final product
3¢5¢
5¢
3¢
PCR 1
P2P1
3¢
5¢
P1
5¢
5¢ 3¢
3¢5¢
3¢3¢
5¢ 3¢
3¢ 5¢
5¢
5¢ 3¢3¢ 5¢
5¢3¢
3¢5¢
5¢
3¢
PCR 2
P4P3
3¢
5¢
P4

length, mutated product, which can be amplified by the flanking primers(P1 and P4). This product can then be digested with appropriate restrictionenzymes and inserted in place of the corresponding wild-type region in thestarting plasmid. Alternatively it could be introduced by an adaptation of
148 PCR
Design primers P2 and P3to introduce mutationTGC (cysteine) to GCC (alanine)
Set up parallel PCR1 reactionsP1 (not shown) + P2 andP3 + P4 (not shown)Perform PCRs
Mix aliquots of PCRI reactionproducts and perform PCR2.Megaprimers from PCR1anneal and extend
Final product is amplifiedby P1 and P4 to givemutated sequence
…ACTGTGACAGTCACCAAGCATGATATGTTGTGCCCTGGTATCTCCATGGATGGTAACGGTCAG…
…TGACACTGTCAGTGGTTCGTACTATACAAGACGGGACCATAGAGGTACCTACCATTGCCAGTC…
T V T V T K H D M F C P G I S M D G N G Q
CAAGCATGATATGTTCGCCCCTGGTATCTCCATGG
GTTCGTACTATACAAGCGGGGACCATAGAGGTACC
…ACTGTGACAGTCACCAAGCATGATATGTTGTGCCCTGGTATCTCCATGGATGGTAACGGTCAG…
GTTCGTACTATACAAGCGGGGACCATAGAGGTACC
CAAGCATGATATGTTCGCCCCTGGTATCTCCATGG
…TGACACTGTCAGTGGTTCGTACTATACAAGACGGGACCATAGAGGTACCTACCATTGCCAGTC…
…ACTGTGACAGTCACCAAGCATGATATGTTCGCCCCTGGTATCTCCATGG
GTTCGTACTATACAAGCGGGGACCATAGAGGTACCTACCATTGCCAGTC…
…ACTGTGACAGTCACCAAGCATGATATGTTCGCCCCTGGTATCTCCATGGATGGTAACGGTCAG…
…TGACACTGTCAGTGGTTCGTACTATACAAGCCGGGACCATAGAGGTACCTACCATTGCCAGTC…
T V T V K H D M A P G I S M D G N G Q
5'
3'
3'
5'
3'5'
5'3'
3'
3'
T F
Figure 7.7
Example of changing a DNA sequence by gene SOEing focusing on the region tobe mutated. A region of DNA sequence is shown and a position to be mutated isidentified. Two primers, P2 and P3 are designed to be complementary and tointroduce the required nucleotide changes. Primer P2 is used with P1 (not shown)in a PCR, and primer P3 is used with P4 (not shown). Both PCRs use the sametemplate DNA and therefore generate two parts of the gene, both containing thedesired mutation, and containing a region of overlap defined by primers P2 andP3. The two products are mixed and used in a further PCR in which theproductive strands anneal and self-prime. Further amplification of the full-lengthproduct is achieved by primers P1 and P4. The resulting DNA product carries thedesired mutation.

Quikchange procedure with the fragment acting as megaprimers forplasmid synthesis, followed by DpnI digestion and transformation (Section7.2).
Primer design
The most important parameter for successful SOEing is primer design. Thesame general rules as described in Chapter 3 are applicable, but there are anumber of further considerations. For the primary PCRs, the flankingprimers (P1 and P4; Figures 7.5 and 7.6) should be designed as ‘normal’primers perhaps 18–20 nucleotides in length and these could be vector-specific primers if the whole insert is to be amplified. Both of the internalprimers (P2 and P3) should contain the mutation(s) (Figure 7.6) or containa 5′-addition that is complementary to part of the DNA fragment to whichit is to be joined (Figure 7.5). Since P2 and P3 will act as the primers duringthe secondary PCR, they should be around 25–35 nt long depending uponthe number of mutations being introduced, or if they are being used to joinfragments then the added tails should be around 15–20 nt long. Essentiallyprimers P2 and P3 can be complementary if they are acting on the sametemplate and are introducing mutations. If they are being used to joinfragments then the 3′-regions should be sequence specific, but the tailsshould be complementary to one another, probably representing a regionof one of the sequences being joined. A basic procedure for SOEing is givenin Protocol 7.3.
Primary PCR
The primary PCR amplifications are performed essentially according to thestandard PCR protocol (Protocol 2.1) with the proviso that the highestpossible annealing temperature should be used to prevent nonspecificamplification. The use of an efficient proofreading DNA polymerase, suchas KOD polymerase (Novagen), is recommended to reduce the possibilityof errors and enhance the production of product and to prevent non-template directed addition of a 3′-nucleotide that might affect thesubsequent steps. If you must use Taq DNA polymerase then the 5′-end ofthe primer(s) should be designed to be adjacent to a T in the sequence sothat any addition of a 3′-A will not alter the DNA sequence of the finalproduct. Two primary PCRs are performed simultaneously, one withprimers P1 and P2 and the other with P3 and P4 to generate the two primaryPCR products (Figures 7.5 and 7.6).
Secondary PCR
For the joining PCR amplification, the two amplified fragments from theprimary PCRs should be mixed in a 1:1 molar ratio. The intention is to addthe same number of molecules of each fragment. This is not the same asmixing the same volume or weight of each DNA fragment. For example, iffragment A is 600 bp long and fragment B is 300 bp then 100 ng of fragmentA will contain the same number of DNA molecules as 50 ng of fragment B.If the gel used to estimate the concentration of the primary PCR products
PCR mutagenesis 149

shows a good yield of a single product per reaction, then simply mixingaliquots of the reaction is appropriate when setting up the secondary PCR.Removal of the primers and other components is not really necessary,although a PCR clean-up step will not do any harm. However, if there isany doubt about the purity of the product it should be gel purified (Chapter6).
In PCR 2 (Figures 7.5 and 7.6) primers P1 and P4 are also included. In theearly cycles the two primary PCR products should anneal due to their over-lapping ends and self-prime to generate a double-stranded full-lengthmolecule, which in subsequent cycles of PCR can be amplified exponentiallyby primers P1 and P4. This PCR should only be performed for about 15–20cycles to reduce the possibility of errors being incorporated. Low yields fromthis PCR are best overcome by adding larger amounts of the two primaryPCR products rather than by increasing the number of cycles used.
7.5 Point mutations
Point mutations refer to the replacement of one or more nucleotides withina sequence by other nucleotides (Figure 7.7). In the case of a protein codingsequence this usually has the effect of changing one or more amino acidcodons so that the corresponding protein has one or more altered aminoacids. In protein engineering the major advantage of site-directed muta-genesis is that a single amino acid can be changed anywhere in the protein,potentially altering the function or specificity of the protein, with minimalchange in overall protein structure. For example a tyrosine codon (TAC) canbe altered to an alanine codon (GCC) by changing T→G and A→C. Multiplemutations of a single codon can also be introduced by designing the primerto include a mixture of sequences at the codon position. For example thetyrosine codon (TAC) could be changed to alanine (GCC), glycine (GGC),serine (TCC) or cysteine (TGC) by using a mixed codon sequence of(G/T)(G/C)C; that is a mixture of G and T at position 1, G and C at position2 and C at position 3. After mutagenesis, individual clones would be isolatedand the mutation identified by DNA sequencing. More complex mixtures ofmutations can also be introduced in a process usually called saturationmutagenesis. Theoretically, by using (A/G/C/T)(A/G/C/T)(G/C) at the targetcodon any of the 20 amino acids could be encoded, as well as one stop codon(TAG). In practice the situation is not quite so straightforward. There is somedifferential success in the coupling efficiencies of different nucleotides duringchemical synthesis of oligonucleotides. Some codon sequences may there-fore be preferentially represented within the mixture thus creating some biasin the frequencies with which different codons may be isolated in a mutantplasmid population. Screening around 300 colonies from such a saturationlibrary should allow all 20 replacements to be identified. Primers for intro-ducing point mutations into a sequence should usually be 20–40 nucleotideslong depending upon the complexity of the mutations. The greater thenumber of mismatches being introduced, the longer the primer should be.For a single mismatch a primer of 20 nt should be sufficient, whereas for asaturation experiment at one codon a primer of 30 nt would be appropriate.For introducing 4 or 5 point mutations a primer of 35–40 nucleotides maybe more appropriate. The primers for introducing mutations should
150 PCR

PCR mutagenesis 151
correspond to primers P2 and P3 in the general SOEing scheme describedabove (Figure 7.6). In this case there should be around 10–15 nucleotides atthe 5′-end of each primer that are perfectly matched to the template (Figure7.7). These regions will give rise to the 3′-ends of the fragments used in thesecondary PCRs so it is best to avoid mismatches in these regions.
7.6 Deletions and insertions
SOEing can also be used to introduce deletions (Figure 7.8) and insertions(Figures 7.9, 7.10, 7.12). The only prerequisite for all of these applicationsis the introduction, via a PCR primer, of an overlapping region of DNA atthe ends of the two DNA fragments to allow them to be joined. Syntheticgene construction follows a similar strategy to join together segments of agene that display overlapping terminal sequences (Section 7.13).
7.7 Deletion mutagenesis
The introduction of a deletion is a relatively simple task with SOEing asshown in Figure 7.8. Primers P2 and P3 are designed so that their 3′-regionscorrespond to sequences adjacent to the deletion end points. The primaryPCRs with primers P1 + P2 and P3 + P4 will fail to copy the sequence destinedfor deletion. Primer P2 or P3 or both should also contain a 5′-extensionsequence complementary to the other primer sequence. In the exampleshown (Figure 7.8), P3 contains a 5′ sequence complementary to P2. The endsof the two PCR products will therefore be complementary and can be joinedin the PCR2 SOEing reaction to yield a product that now lacks the regiontargeted for deletion. This product can be readily cloned into a suitable vector.Deletions can also be introduced by inverse PCR as described in Section 7.2.The primers are simply designed to lie adjacent to the deletion end points.
7.8 Insertion mutagenesis
SOEing can be used to insert DNA sequences or for ‘domain swapping’ experi-ments. Different approaches are required depending upon the size of theinserted sequence and will be considered as (i) insertion of short sequences(1–80 nucleotides) and (ii) insertion of long sequences (>80 nucleotides).
Insertion of short sequences
If the insertion is to be added to the start or end of a target gene or codingregion then a simple PCR amplification, with two primers P1 and P2 inwhich one primer carries the additional sequence, will achieve this outcomeas previously discussed in Chapters 3 and 5. This strategy is frequently usedfor addition of restriction endonuclease cleavage or to add in-frame codingregions for detection and purification handles such as a 6 or 8 Histidine tagor a StrepTagII sequence or protease cleavage sites.
If the insertion is to be introduced within an existing sequence, orbetween two sequences that are to be joined, the most common approachis to use a SOEing strategy. The new DNA sequence can be added to the5′-ends of the overlapping primers P2 and P3 (Figures 7.9 and 7.10).
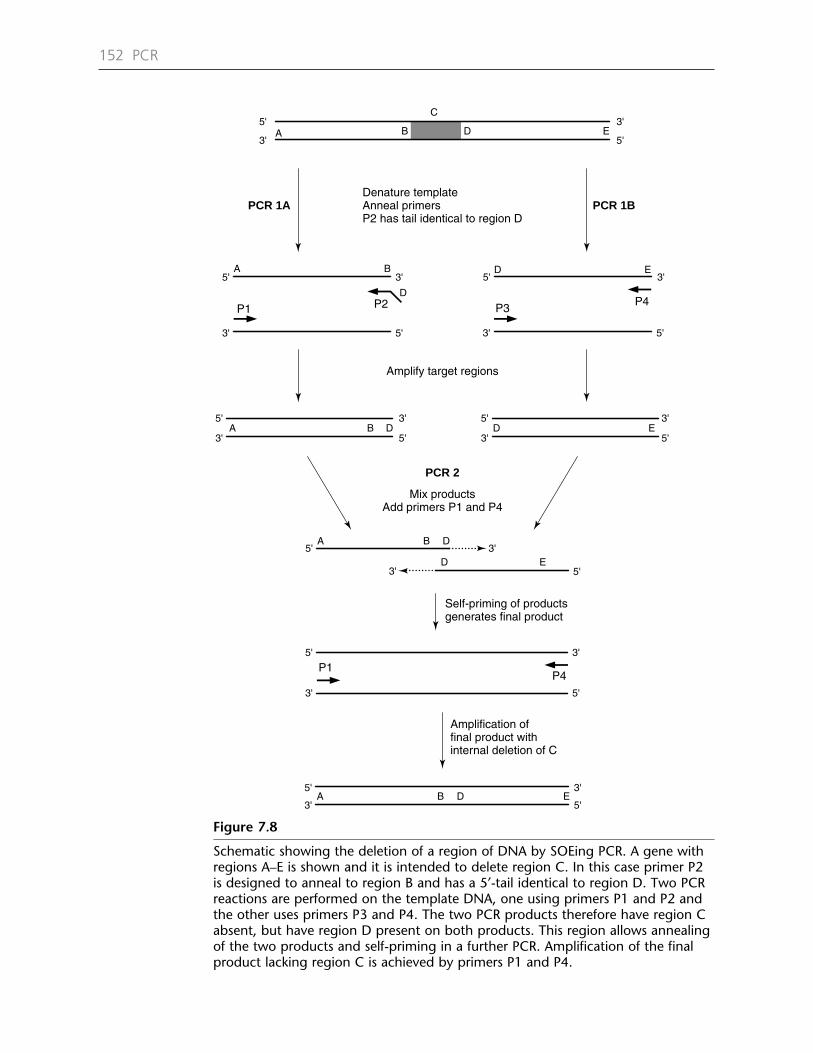
152 PCR
5'
3'
PCR 1A PCR 1B
Amplify target regions
Denature templateAnneal primersP2 has tail identical to region D
PCR 2
5'
3' 5'
3'
5'
3'
5' 5'
5'
3'3'
3'3'
5'
3'
5'
5' 3'
P1 P2 P3P4
5'
5'
5'
3'
3'
3'
Mix productsAdd primers P1 and P4
Self-priming of productsgenerates final product
Amplification offinal product withinternal deletion of C
P1P4
A B
C
D E
5'
3' 5'
3'
5'
A B D E
A B D D E
B D
D E
A
A B D E
D
3'
Figure 7.8
Schematic showing the deletion of a region of DNA by SOEing PCR. A gene withregions A–E is shown and it is intended to delete region C. In this case primer P2is designed to anneal to region B and has a 5′-tail identical to region D. Two PCRreactions are performed on the template DNA, one using primers P1 and P2 andthe other uses primers P3 and P4. The two PCR products therefore have region Cabsent, but have region D present on both products. This region allows annealingof the two products and self-priming in a further PCR. Amplification of the finalproduct lacking region C is achieved by primers P1 and P4.

PCR mutagenesis 153
5'
3'
PCR 1A PCR 1B
Amplify target regions
Denature template and annealprimers. P2 and P3 haveidentical tails encoding sequenceE to be inserted
PCR 2
5'
3' 5'
3'
5'
3'
5' 5'
5'
3'3'
3'3'
5'
3'
5'
5'
3'
P1
P2
P3 P4
5'
5'
5'
3'
3'
3'
Mix productsAdd primers P1 and P4
Self-priming of productsgenerates final product
Amplification offinal product withinsertion
P1P4
A BC D
5'
3' 5'
3'
5'
A B D
E
A B DE
B
C D
EA
A B D
E
Point of insertion between B and C
C
E C
E
C
3'
E
Figure 7.9
Schematic showing the insertion of a region of sequence E, between two existingsequences, B and C, in a gene. Primer P2 is designed to anneal to region B and tocarry a 5′-tail representing all or part of region E. Primer P3 is designed to anneal toregion C and to have a 5′-tail also representing all or part of region E,complementary to the sequence carried by primer P2. There must be at least aregion of around 16 nucleotides complementary between the tails on P2 and P3 toallow the annealing of the PCR products and self-priming. Amplification of the full-length product is achieved by use of P1 and P4. The resulting product carriesregion E inserted between regions B and C. The size of the insertion that can beintroduced is limited by the length of oligonucleotides that can be synthesized (seeFigure 7.10); larger inserts can be introduced as described in Figures 7.11 or 7.12.

The length of oligonucleotide that can be synthesized using currentchemistry limits the insertion size. It is technically difficult to synthesizeoligonucleotides longer than 100 nucleotides. Since the 3′-region (at least16–20 nt) must act as an efficient PCR primer, the insertion sequence canonly be around 80 nt. However, the SOEing strategy allows this size to beincreased as the 5′-ends of primers P2 and P3 need only have sufficient over-lap (around 15–20 nt) to allow them to anneal effectively and to primeDNA synthesis. So for two primers each 100 nt long, with 16 nt at the3′-ends and 16 nt at the 5′-ends required for priming in the primary andsecondary PCRs respectively, the maximum insert that could be introducedis (2 × 100) – (3 × 16) = 200 – 48 = 152 nt (Figure 7.10).
Insertion of long sequences
Before the advent of PCR, the insertion of long sequences into a target genewas generally dependent on conveniently situated restriction sites. PCRprovides an elegant level of control over the generation of exactly tailoredcontructs. Here we describe two approaches for large insertions or replace-ments of DNA sequences by sticky-feet mutagenesis and SOEing.
Sticky-feet mutagenesis
’Sticky-feet’ mutagenesis (4) can be used either as a method for inserting anew sequence or as a way of replacing a region of the existing sequence.Essentially, as illustrated in Figure 7.11, a region of DNA from gene X isamplified by using two primers that have 5′-extensions corresponding to thesequences of junction regions at which the insertion is to be made withinthe target gene Y. PCR with these two primers generates a DNA fragmentwith ends corresponding to the target gene. These 5′-ends act as ‘sticky feet’that allow the PCR product to anneal precisely to the target gene. The 3′-endof the annealed fragment acts as a primer in a standard DNA synthesisreaction of the remainder of insert plus vector. The final stage, the plasmidreplication step, does not involve a PCR amplification but rather is a linearamplification of the type previously discussed in the Quikchange process(Section 7.2). A method for sticky-feet mutagenesis is provided in Protocol 7.4,
154 PCR
Length of primers (~100 nt)
Primer region(~16 nt)
Overlap region(~16 nt)
Primer region(~16 nt)
Maximum length of insertion (~150 nt)
Figure 7.10
Length of insertion that can be introduced into a DNA sequence by SOEing usingtwo overlapping oligonucleotides of 100 nucleotides in length.

and uses a proofreading thermostable enzyme, such as KOD (Chapter 3) sothat as soon as the long primer fragment anneals to the template it can beextended during the cooling period from the denaturation temperature.
The initial description of sticky feet mutagenesis used the single-strandedgenome of M13 as template DNA for synthesis of a complete second strandof the circular genome. The template was prepared from a dut–, ung– E. colistrain that leads to the incorporation of some dUTP instead of the normaldTTP in DNA synthesized within the cells. The dut gene encodes a dUTPasethat maintains a low level of dUTP in the cells so the dut– mutation increasesthe cellular pool of dUTP. When dUTP is erroneously incorporated intoDNA it is removed by the enzyme uracil N-glycosylase, encoded by the unggene. This enzyme is not produced in the ung– background. So in the dut–,ung– strain dUTP levels are elevated, more dUTP is incorporated into DNAmolecules, but these cannot be removed. This means that about 30 or sodUs are incorporated into each M13 template. Following primer-directedsynthesis on the template, the newly synthesized strand contains no dU,but the original dU-containing template DNA strand is destroyed when theheteroduplex molecule is transformed into an ung+ (uracil glycosylase-containing) E. coli host, leading to efficient selection of insertion mutants.While the use of filamentous phage such as M13 is becoming increasinglypopular for the display of molecules on their surface in so-called phagedisplay procedures, it is also true that they are not routinely used for manyother cloning experiments. A benefit of this ‘sticky feet’ methodology isthat it can be used to introduce insertions or sequence replacements with-out the need to clone PCR products. A method for this process is given inProtocol 7.4. By considering the approaches discussed in Section 7.2 itshould be obvious that an alternative strategy to introduce mutations bysticky feet mutagenesis would be to use the DpnI restriction selection usedin the Quikchange procedures.
Primer design and primary PCR amplification
If a region of gene A is to be amplified and inserted into gene B then theprimers used for ‘sticky-feet’ mutagenesis should contain:
● at the 3′-ends, a 15–20 nt region of gene A at the 3′-end;and
● at the 5′-ends a 20–30 nt region adjacent to the insertion site in gene B;these regions will fulfill the roles of ‘sticky-feet’.
The length of the primers (Figure 7.11; primers 1 and 2) used to generate the‘sticky-feet primer’ depends largely on the template source from which theprimary PCR is being performed. In the case of complex templates, such asgenomic DNA or cDNA libraries, long 3′-primer regions of 25–30 nucleotidesare advisable to ensure specificity at high annealing temperatures.
Template preparation
If the UNG system is being used then a dut– ung– strain for propagation ofthe M13 or plasmid template leads to the incorporation of some uracils inplace of thymidines (~30–40) in each template strand. This provides a
PCR mutagenesis 155
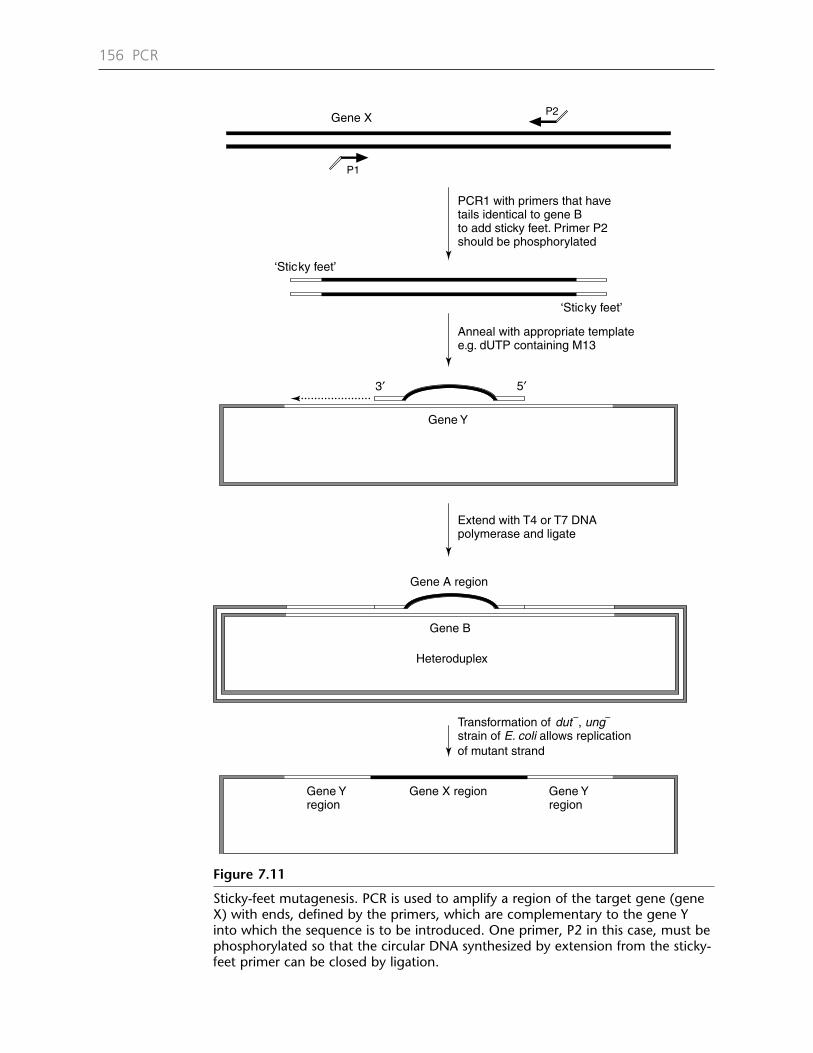
156 PCR
Gene XP2
P1
PCR1 with primers that havetails identical to gene Bto add sticky feet. Primer P2should be phosphorylated
‘Sticky feet’
‘Sticky feet’
Anneal with appropriate templatee.g. dUTP containing M13
Gene Y
Extend with T4 or T7 DNApolymerase and ligate
Gene Yregion
Gene X region Gene Yregion
Transformation of dut–, ung–
strain of E. coli allows replication
3′ 5′
of mutant strand
Gene B
Heteroduplex
Gene A region
Figure 7.11
Sticky-feet mutagenesis. PCR is used to amplify a region of the target gene (geneX) with ends, defined by the primers, which are complementary to the gene Yinto which the sequence is to be introduced. One primer, P2 in this case, must bephosphorylated so that the circular DNA synthesized by extension from the sticky-feet primer can be closed by ligation.
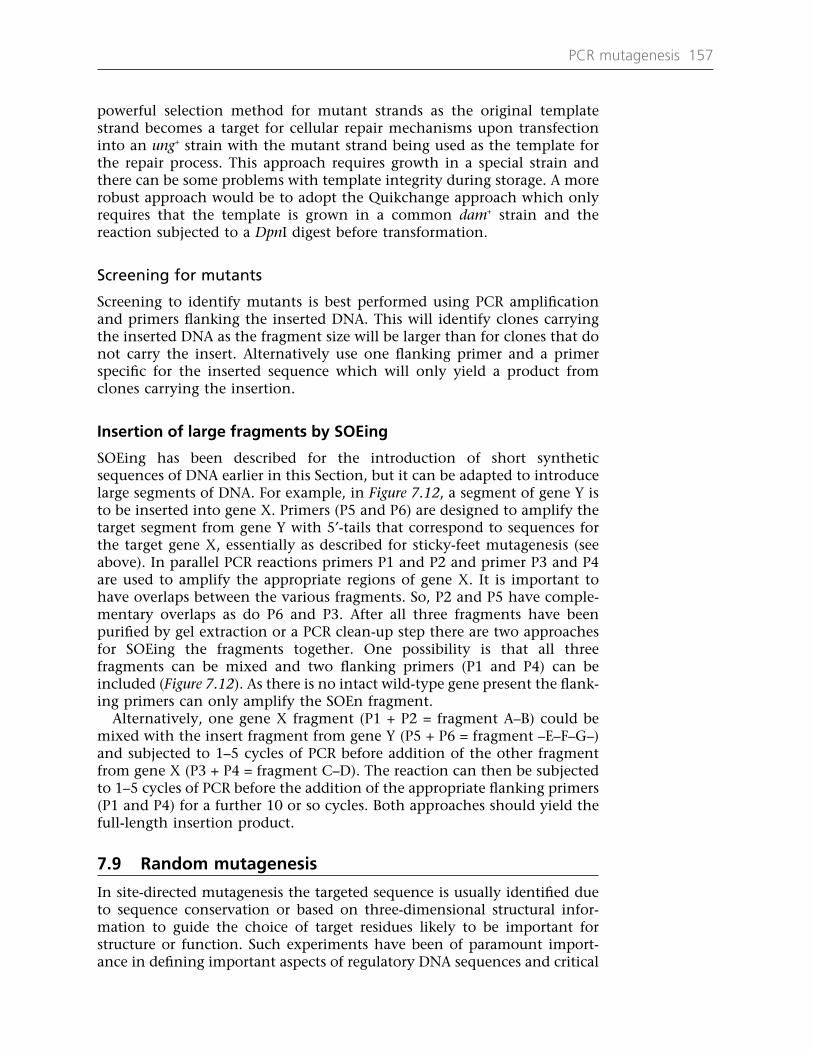
powerful selection method for mutant strands as the original templatestrand becomes a target for cellular repair mechanisms upon transfectioninto an ung+ strain with the mutant strand being used as the template forthe repair process. This approach requires growth in a special strain andthere can be some problems with template integrity during storage. A morerobust approach would be to adopt the Quikchange approach which onlyrequires that the template is grown in a common dam+ strain and thereaction subjected to a DpnI digest before transformation.
Screening for mutants
Screening to identify mutants is best performed using PCR amplificationand primers flanking the inserted DNA. This will identify clones carryingthe inserted DNA as the fragment size will be larger than for clones that donot carry the insert. Alternatively use one flanking primer and a primerspecific for the inserted sequence which will only yield a product fromclones carrying the insertion.
Insertion of large fragments by SOEing
SOEing has been described for the introduction of short syntheticsequences of DNA earlier in this Section, but it can be adapted to introducelarge segments of DNA. For example, in Figure 7.12, a segment of gene Y isto be inserted into gene X. Primers (P5 and P6) are designed to amplify thetarget segment from gene Y with 5′-tails that correspond to sequences forthe target gene X, essentially as described for sticky-feet mutagenesis (seeabove). In parallel PCR reactions primers P1 and P2 and primer P3 and P4are used to amplify the appropriate regions of gene X. It is important tohave overlaps between the various fragments. So, P2 and P5 have comple-mentary overlaps as do P6 and P3. After all three fragments have beenpurified by gel extraction or a PCR clean-up step there are two approachesfor SOEing the fragments together. One possibility is that all threefragments can be mixed and two flanking primers (P1 and P4) can beincluded (Figure 7.12). As there is no intact wild-type gene present the flank-ing primers can only amplify the SOEn fragment.
Alternatively, one gene X fragment (P1 + P2 = fragment A–B) could bemixed with the insert fragment from gene Y (P5 + P6 = fragment –E–F–G–)and subjected to 1–5 cycles of PCR before addition of the other fragmentfrom gene X (P3 + P4 = fragment C–D). The reaction can then be subjectedto 1–5 cycles of PCR before the addition of the appropriate flanking primers(P1 and P4) for a further 10 or so cycles. Both approaches should yield thefull-length insertion product.
7.9 Random mutagenesis
In site-directed mutagenesis the targeted sequence is usually identified dueto sequence conservation or based on three-dimensional structural infor-mation to guide the choice of target residues likely to be important forstructure or function. Such experiments have been of paramount import-ance in defining important aspects of regulatory DNA sequences and critical
PCR mutagenesis 157
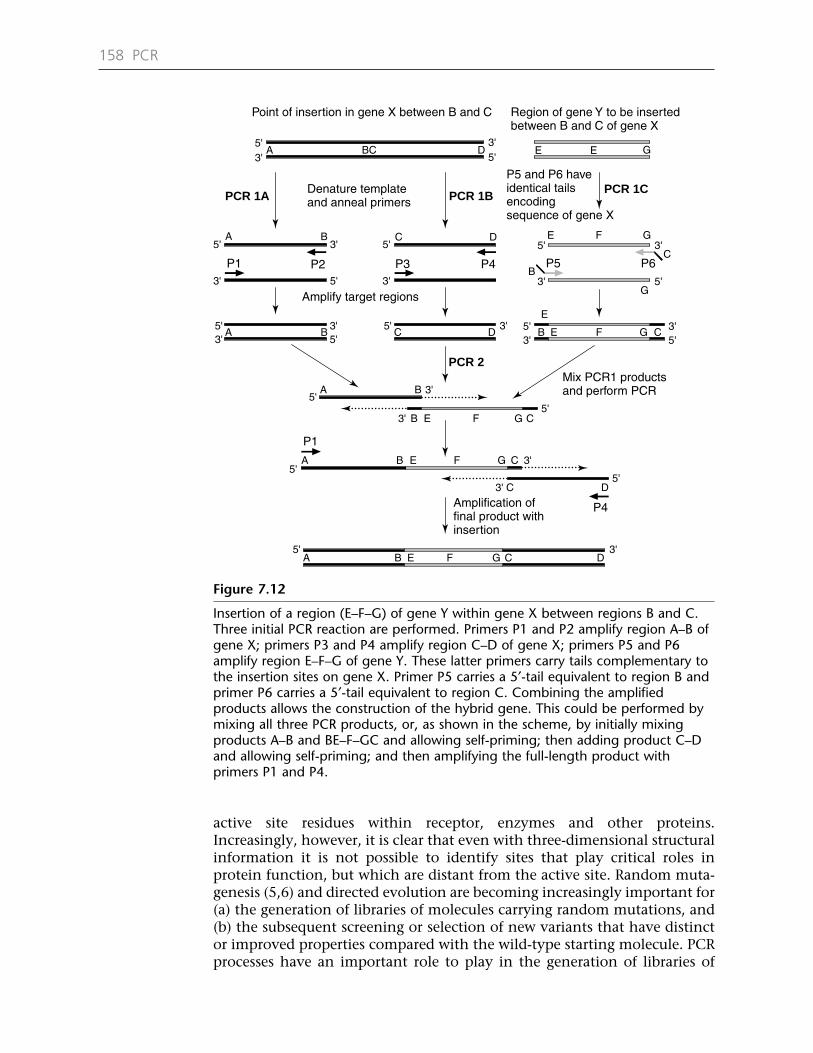
active site residues within receptor, enzymes and other proteins.Increasingly, however, it is clear that even with three-dimensional structuralinformation it is not possible to identify sites that play critical roles inprotein function, but which are distant from the active site. Random muta-genesis (5,6) and directed evolution are becoming increasingly important for(a) the generation of libraries of molecules carrying random mutations, and(b) the subsequent screening or selection of new variants that have distinctor improved properties compared with the wild-type starting molecule. PCRprocesses have an important role to play in the generation of libraries of
158 PCR
5'3'
PCR 1A PCR 1B
Amplify target regions
Denature templateand anneal primers
PCR 2
5'3'
5'
3'
5'3'
5' 5'
5'
3'
3'
3'3'
5'
5'
3'
P1 P2 P3 P4
3'
Mix PCR1 productsand perform PCR
Amplification offinal product withinsertion
P1
P4
A BC D E
5'
3'
5'
5'
A
E
G
PCR 1C
C E G
G
A B C D B E F G C
A B
B E F G C
A B E F G C
C D
A B E F G C D
P5 P6C
3'
Point of insertion in gene X between B and C Region of gene Y to be insertedbetween B and C of gene X
P5 and P6 haveidentical tailsencodingsequence of gene X
5' 5'3' 3'5' 3'
5'3'
5'3'
B
E
FB D
Figure 7.12
Insertion of a region (E–F–G) of gene Y within gene X between regions B and C.Three initial PCR reaction are performed. Primers P1 and P2 amplify region A–B ofgene X; primers P3 and P4 amplify region C–D of gene X; primers P5 and P6amplify region E–F–G of gene Y. These latter primers carry tails complementary tothe insertion sites on gene X. Primer P5 carries a 5′-tail equivalent to region B andprimer P6 carries a 5′-tail equivalent to region C. Combining the amplifiedproducts allows the construction of the hybrid gene. This could be performed bymixing all three PCR products, or, as shown in the scheme, by initially mixingproducts A–B and BE–F–GC and allowing self-priming; then adding product C–Dand allowing self-priming; and then amplifying the full-length product withprimers P1 and P4.

random mutations. In Section 7.5 the concept of saturation mutagenesis wasdiscussed. This represents a form of random mutagenesis since you areexploring the substitution of a single amino acid with any of the other 19amino acids, although it is specifically targeting a particular amino acid. Theapproaches to random mutagenesis that will be highlighted in this sectionare more truly random in that they can lead to a change in any amino acidwithin a coding region.
7.10 PCR misincorporation procedures
You are already aware that Taq DNA polymerase has a relatively lowfidelity in DNA replication, meaning that it will incorporate the wrongnucleotide once in every 104–105 nucleotides it synthesizes. In most PCRapplications we are trying to reduce this error rate to ensure the templateis copied accurately with no errors. However, for random mutagenesis byerror-prone PCR we try to increase the rate at which the enzyme intro-duces errors. Cadwell and Joyce (5) identified conditions that led to suchan enhanced error rate by altering the reaction conditions to favor mis-incorporation, leading to a significantly higher frequency of error rateduring DNA synthesis. The key to this is the use of manganese and thealteration of the ratio of nucleotides concentrations. An error rate ofapproximately 0.05% or about one error in every 2000 nucleotidessynthesized can be achieved.
The error rate may be further enhanced or controlled in longer productsby including various nucleotide analogues that are rather promiscuous intheir base pairing capabilities, thus favoring both transitions and trans-versions. Zaccolo and coworkers (7) described the use of dPTP (6-(2-deoxy-β-D-ribofuranosyl)-3,4-dihydro-8H-pyrimido-[4,5-C][1,2]oxazin-7-one) and8-oxo-dGTP (8-oxo-2′deoxyguanosine) for error-prone PCR. dPTP canreplace dTTP during DNA synthesis with only a four-fold reduction inincorporation efficiency, and leads to transversion and transition mutationsA→G or T, T→C or G, G→A and C→T at between 1 and 4.4 per 100 basessynthesized. 8-oxodGTP cannot completely replace dGTP, but when amixture of dGTP and 8-oxodGTP was used G→A, C→T, A→C and T→Gmutations were observed at rates of 0.8–1 per 100 nucleotides synthesized.Clearly dPTP is the most effective, leading to mutation rates as high as9.38%, while the combination of both compounds could generatemutations at an even higher frequency of 10.3%. There is now somedifficulty in obtaining these nucleotide analogues commercially, butalternatives may be available or may be synthesized by a friendly chemist.
Random mutational libraries
The Quikchange approach can also be used to introduce random mutationsbased on error-prone PCR. For example Stratagene provide a system calledGeneMorph with EZClone. This involves error-prone PCR of a region of thetarget gene defined by two opposing PCR primers by using an enzyme calledMutazyme II. The products of this reaction represent a population ofmolecules with a low level of sequence variation introduced during the
PCR mutagenesis 159

error-prone PCR. These products are used as megaprimers in a Quikchange-type reaction. Both strands of the product act as primers on the plasmidtemplate that carries the wild-type gene and in a linear amplification leadto new plasmid strands with single-strand ends corresponding to themegaprimers. These plasmid products will circularize by base pairing of themegaprimers, and following treatment with DpnI to destroy the originalplasmid template can be transformed into E. coli to generate a library ofrandomly mutated variants for the starting gene. The EZClone kit containsan enzyme mix to facilitate this plasmid replication. The process seems towork efficiently using a standard PCR reaction using a proofreading enzymesuch as KOD DNA polymerase. The process is essentially as shown in Figure7.3 with the exception that a low level of mutations are introducedthroughout the megaprimer sequence.
Spectrum of changes by error-prone PCR
Error-prone PCR provides an efficient mechanism for creating a library ofvariants that differ from the wild-type gene. Depending upon the level ofmutations required, any single copy of the gene will contain one, a few ormany nucleotide differences from any other copy of the gene. Some of thechanges will not lead to any amino acid change in a protein codingsequence due to the degeneracy of the genetic code, while other changeswill alter an amino acid. It is important to remember that this approachwill allow the change of any one amino acid into only some, not all of theother 19. At these low rates of mutagenesis only one nucleotide in anycodon will be changed, leading to a subset of possible amino acid substi-tutions. For example if single nucleotide changes were introduced intoglutamic acid, GAA, it could give rise to:
AAA (lysine);TAA (stop);CAA (glutamine);GGA (glycine);GTA (valine);GCA (alanine);GAG (glutamate);GAT (aspartate);GAC (aspartate).
It would not give rise to any of the other 13 amino acids because in eachcase it would require more than one nucleotide to be changed per codon.
7.11 Recombination strategies
Variant libraries such as those generated by error-prone PCR can provide auseful source of new variant molecules, but such libraries may not allowthe identification of combinations of mutations that display synergisticeffects on enhancing protein function. It is possible to explore combi-nations of mutations that coexist within molecules by subjecting the DNAmutant library to some form of recombination, allowing beneficialmutations that may exist on separate molecules to be recombined so that
160 PCR

they occur on the same DNA molecule. These processes can be termed‘recursive gene synthesis’. Recursive is defined as ‘a data structure that ispartially composed of other instances of the data structure’. As you will seefrom the following discussions this perfectly describes the processes thatare involved in recombinational generation of sequence diversity.
Staggered extension process
Frances Arnold developed the staggered extension process (StEP) to achievethis controlled recombination (8,9). Having identified two or more usefulvariants from an error-prone PCR screen, these can be subjected to roundsof recombination, preferably under high-fidelity (proofreading) conditionsto prevent accumulation of deleterious mutations (9). The effect is togenerate combinations of the starting mutations that may prove beneficial.The library is usually small enough (up to 100 000 clones) to screen as indi-vidual clones, particularly if you have access to a robotic colony picker andliquid-handling robot. The process, illustrated in Figure 7.13, utilizes PCRwith two flanking primers. The PCR conditions are quite standard, but theextension time is as short as possible. This usually means moving directlyfrom the annealing to the denaturation temperature. In practice thepolymerase will begin to extend from the primer even at the annealingtemperature and so, as the reaction heats, DNA synthesis is occurring. Theintention is to allow very short sections of DNA to be synthesized. At thenext denaturation stage these short extension products will dissociate andat the next annealing step can anneal to a new template, perhaps contain-ing a different mutation. A further short extension effectively recombinesthe short sequence copied from the original template sequence with a shortsequence copied from the new template sequence. This process is called‘template switching’ and this recursive synthesis is continued until full-length molecules are generated. Each new molecule should be the result ofpriming on several different templates and if these templates containeddifferent mutations then some of these mutations should now exist on thesame DNA molecules. The overall result is that some molecules may containno mutations, some may contain one and others may contain several. Thelibrary can then be screened for the desired function of the protein.
The closer two mutations are in the sequence the less chance there is thatthey will be recombined. This molecular process shows segregation ofmutations in a psuedo-Mendelian manner. Starting with two templateseach carrying a mutation sufficiently far apart to allow recombination, theStEP process will yield new molecules in a 1:2:1 ratio carrying both, oneand none of the mutations, respectively. The minimum amount of DNAthat is synthesized during the short extension step, and therefore theminimum recombination distance, has been estimated to be around 34 nt.This was measured by analyzing the frequency with which mutations foundon different DNA molecules could be recombined (9). The StEP approachhas been demonstrated to generate variants with improved catalytic activity(8) and thermostability (9). The StEP process is generally not used as widelyas DNA shuffling for generating recombinational libraries but, with theadvent of new thermocyclers that have extremely rapid ramp rates forchanging temperature, it is possible that there are some applications where
PCR mutagenesis 161

162 PCR
Template DNAs carryingpoint mutations
Denature and annealflanking primers asfor normal PCR
Cycle 1Very short extension step
Generates only short extensionof primers on template
Cycle 2Repeat annealing so shortextended products cananneal to new templates
Very short extension stepcreates short hybrid products
PCR cycles with short extensiontime repeated ~40 times
Recombined sequences generatedby template switching
Cloning into vector, transformation into E. coli
Screening or selection for desired function
Figure 7.13
Staggered extension process. DNA recombination is generated by the use of veryshort extension steps during rapid PCR cycles. Two versions of a target gene arecolored gray and white to allow the process of recombination to be visualized. Thetwo genes carry distinct mutations [�] and [�] selected as beneficial followingerror-prone PCR. Denaturation and annealing of primers to template strands using avery short extension time leads to short extended products. Repeated cycles of thisrapid PCR lead to template switching and recombination at each PCR cycle.Eventually, after around 40 cycles of PCR, full-length recombinant genes aregenerated and amplified. Some carry no mutations, some have one of themutations, others now carry both original mutations. After cloning into anappropriate expression vector, the library of variants is transformed into E. coli andclones are tested for the desired phenotype. Selected clones can be subjected tofurther rounds of error-prone PCR, StEP and screening.

this will prove useful and the recombination distance achievable may nowbe shorter than that measured originally.
DNA shuffling
Stemmer (10) described a PCR-based approach for the generation of largelibraries of variants (Figure 7.14). In this case the method was originallydesigned for use with powerful selection such as antibiotic-resistant growthof bacteria. For example, if a variant confers the ability to grow on a higherlevel of an antibiotic then only the cells carrying this variant will growwhereas any that display normal or poorer resistance will die and will neverbe selected. Since this selection approach is more powerful than the screen-ing approaches, it is possible to generate very large libraries where there willbe many variants that are functionally worse than that encoded by theparent gene. The DNA shuffling procedure, illustrated schematically in Figure7.14, uses physical fragmentation such as sonication, or controlled DNAse Idigestion, to generate fragments from the starting DNA molecule. An exam-ple is shown in Figure 7.15. Generally these fragments will be in the range50–100 bp and can be gel purified. The fragments are then subjected to about40–60 cycles of a PCR but there are no flanking primers included. DNAsynthesis therefore relies upon self-priming of annealed fragments of DNA.The random positions of ends of DNA molecules mean that various lengthsof fragments will be synthesized and at the next cycle the extended prod-ucts dissociate and can anneal to new fragments for a further round ofself-priming extension. During this recursive PCR process the conditionsfavor incorporation of new mutations and these mutations can becomerecombined by DNA synthesis steps during the template switching.
Monitoring the reaction, by taking samples at stages during the reaction,reveals smears of DNA increasing in length with increasing cycle numberindicating the formation of larger products with time (Figure 7.15). The finalfull-length products can be recovered by adding flanking primers andperforming a limited number of standard PCR cycles followed by gelpurification of the amplified band and cloning into an appropriate vector.A procedure for DNA shuffling is given in Protocol 7.5.
The shuffling approach is an extremely powerful tool for the generationand identification of new variants with improved properties such ascatalytic rate, thermal and chemical stability, substrate specificity and bind-ing capacity. These approaches represent a useful approach for thegeneration of variants of academic interest. However, for commercial appli-cations patents are held by Maxygen Inc.
Family gene shuffling
In the original gene shuffling approach the starting material was a singlegene and so error-prone PCR during the template switching steps that ledto full-length gene products was an important mechanism for introducingdiversity. An alternative strategy that relies upon naturally occurringvariation between genes was then recognized to provide perhaps a morepowerful approach for identifying improved proteins. In this approach afamily of genes that encode proteins that have similar functions are used.
PCR mutagenesis 163

164 PCR
Template DNA
Random fragmentationof template DNA
Denaturation of fragments
Annealing of fragments
Self-priming to generateextended products
Further rounds of denaturation,template switching and extension
PCR cyclesrepeated ~40–60 times
Amplification of full-lengthsequence by PCR withflanking primers
Clone into vector, transform into E. coli
Screening or selection for desired function
Figure 7.14
DNA shuffling approach for generation of large variant libraries by random mutagenesis andrecombination. Two versions of a target gene are colored gray and white to allow the process ofrecombination to be visualized. The DNA is fragmented by sonication or DNAse I treatment and asubset of fragments of 50–100 bp are gel purified. Annealing of fragments by base pairing in a PCRcontaining no primers results in self-priming and fragment extension. In addition the PCR conditionslead to accumulation of new point mutations (� and �). Some 40–60 PCR cycles are performed toreconstruct genes. Eventually full-length recombinant genes are generated; since this process is alinear synthesis process, rather than an amplification reaction, it is often difficult to identify full-lengthproducts. Addition of flanking primers allows the full-length products to be amplified by PCR. Arange of variants are generated due to new mutations arising during PCR and these are recombinedby the DNA shuffling process. After cloning into an appropriate expression vector, the library ofvariants is transformed into E. coli and clones are tested for the desired phenotype. Selected clonescan be subjected to further rounds of DNA shuffling.

These may for example be a family of a particular enzyme that catalyses thesame reaction in a range of different organisms. Generally all of the startingmolecules encode functional proteins, but sequence variation confers differ-ent properties on these proteins depending upon their evolutionary origins.For example some may be more efficient catalysts, others may be more ther-mostable or may use an altered spectrum of substrates.
In family shuffling the coding regions or those for specific domains areisolated, usually by PCR. These are then mixed and subjected to DNA
PCR mutagenesis 165
(A) Starting templates X and Y
M X Y
(B) DNAse digests of X and Y
M X + Y 20–50 M
Figure 7.15
Example of using DNA shuffling approach to recombine two genes. Gel (A): lanesX and Y; starting DNA fragments. Gel (B): X + Y, DNAse I digestion of mixedfragments from Gel (A) lanes X and Y; lane 25–50, a region of the gel containingDNA fragments in the region of 25–50 base pairs has been removed to recoverthe DNA fragments. Gel (C): PCR reassembly of gene from fragments isolatedfrom Gel (B), lane 25–50. Lanes indicate products after 20, 40 and 60 cycles ofreconstruction; an increase of smeared products can be observed with theincreasing number of cycles. Gel (D): product is the PCR amplification of full-length gene product from Gel (C), lane 60, using flanking PCR primers. M;molecular size markers. Photographs kindly provided by D.J. Harrison.
(C) PCR reassembly
M 20 40 60
(D) Final PCR amplification
M Product

shuffling by fragmentation of the DNA and regeneration of full-lengthsequence by the template switching recursive DNA synthesis procedure. Inthis case however, there are multiple different fragments derived fromdifferent genes and so template switching leads to recombination ofsequences derived from different parental genes. However, since all thestarting genes were functional, it is expected that many of the products willexpress hybrid proteins that retain some function. The question is whetherthe recombination process allows the acquisition of a range of beneficialproperties from different parents, now within individual hybrid proteins.
Remarkable results have been achieved by DNA shuffling of families ofgenes. The first example was based on antibiotic resistance (11), which isquite easy to select for. However, more difficult screening strategies havebeen shown to be useful for isolating new functional proteins from familyshuffling experiments. A particularly nice example demonstrates the powerof this approach and the use of a heirachical screening strategy for theselection of improved serine proteinases (12). There is also an informativestudy of the use of this type of family shuffling approach to begin to explorethe functional importance of key residues within a protein, to begin tailor-ing substrate specificity, without any knowledge of protein structure. Thisinvolved the analysis of atrizine hydrolases (13).
7.12 RACHITT
Random chimeragenesis on transient templates (RACHITT) provides a newstrategy for DNA recombination that leads to a higher level of crossovers thanfamily shuffling (13). The method, illustrated in Figure 7.16, uses single-stranded molecules as the starting point. These can be generated by lambdaexonuclease, a 5′-exonuclease that will degrade a strand of DNA containinga 5′-phosphate or 5′-overhang. The other DNA strand can therefore beprotected by cutting with a 3′-overhang-generating enzyme. One strandcontains deoxyuracil and acts as a scaffold for construction of the recombinedcomplementary strands. Parental genes are used to prepare the complemen-tary single strands to the scaffold and are then fragmented by DNAse Idigestion. Following hybridization of these fragments and terminal primersto the scaffold any overhangs on the annealed DNA are trimmed back by themixture of thermostable DNA polymerases included in the reaction. Taq DNApolymerase removes 5′-overhangs while Pfu DNA polymerase removes any 3′-overhangs and fills in any gaps. Taq DNA ligase then joins the fragments tocreate a full-length DNA strand. The scaffold strand is destroyed by treatmentwith uracil glycosylase and the recombined strands are then amplified byPCR. The parental genes could be a family of homologous genes, or a popu-lation of molecules generated by error-prone PCR. In addition mutationscould also be introduced following the recombination step by error-pronePCR. The resulting amplified fragments are cloned into an appropriate expres-sion vector for screening or selection of the desired variants.
7.13 Gene synthesis
PCR also provides an extremely efficient process for the generation ofsynthetic genes. It is increasingly common for genes to be resynthesized to
166 PCR

PCR mutagenesis 167
Parental DNA
Generation of single-strandedparental DNA by lambdaexonuclease digestion
Generation of fragmentsby DNAse 1
Annealing of fragmentsplus primers to dU-containingscaffold strand
Digestion of overlaps, self-primingto fill-in gaps and ligation of fragments
Digestion of scaffold strand withuracil glycoylase
Amplification of full-lengthsequence by PCR withflanking primer
Cloning into vector, transformation into E. coli
Screening or selection for desired function
Figure 7.16
Schematic illustration of the RACHITT approach using recombination to introducediversity. Complementary single-stranded scaffold DNA, containing dUTP, andparental DNAs are prepared by lambda exonclease digestion. The parental DNA isthen fragmented by DNAse I digestion and annealed to the scaffold. Ends aretrimmed and gaps repaired by a combination of Taq and a proofreadingthermostable DNA polymerase, and nicks are sealed by thermostable DNA ligase.The scaffold strand is then digested by uracil N-glycosylase so that only therecombined strands remain. These can be PCR amplified by use of flankingprimers and cloned into an appropriate vector, for transformation into E. coli.

allow the introduction of specific features such as convenient restrictionsites and regulatory signals and to optimize the codon usage for expressionof the encoded protein in a particular heterologous host. The strategy isillustrated in Figure 7.17. Oligonucleotides of 60–70 nucleotides can beproduced and purified relatively easily and these can be designed to haveoverlaps with adjacent oligonucleotides. Pairs of oligonucleotides with
168 PCR
1 3 5
2 4 6
A B C
1 + 2 3 + 4 5 + 6
D
1 + 2
3 + 4
E
1 + 2 + 3 + 4
F
1 + 2 + 3 + 4
5 + 6G
1 + 2 + 3 + 4 + 5 + 6
Figure 7.17
Example of total gene synthesis from 6 oligonucleotides of 60–70 nucleotideseach. Oligonucleotide 2 overlaps with 3 by 12 nucleotides, and 4 overlaps with 5by 12 nucleotides. Three separate self-priming fill-in reactions (A, B and C) areperformed by one cycle of PCR denaturation, annealing and extension, to joinrespectively oligonucleotides 1 with 2, 3 with 4, and 5 with 6. An aliquot of the 1+ 2 product is then mixed with the product of 3 + 4 (D) and a further cycle ofPCR is performed (E). This results in the joining of products 1 + 2 with 3 + 4 dueto the 12-nucleotide overlap between oligonucleotidess 2 and 3. An aliquot of thisproduct is then mixed with the product of 5 + 6 (F) and subjected to one cycle ofPCR to allow a self-priming fill-in to generate the product 1+ 2 + 3 + 4 + 5 + 6(G). The product can then be further amplified by PCR using either the originaloligonucleotides 1 and 6 or smaller flanking primers.

overlaps of 10–15 nucleotides can be briefly heated and allowed to annealand can then be extended by self-priming from their 3′-ends to generate asegment of the gene. Products of two such reactions that are adjacent inthe gene can be mixed, denatured and allowed to anneal by virtue of theshort overlapping sequences present on their ends. A further extensionreaction will lead to a fragment now comprising four oligonucleotides.Depending upon the number of oligonucleotides that must be joined, thisprocess can be continued with various combinations of oligonucleotidesand extension products until the full-length gene has been generated andthis can then be amplified by PCR using two flanking primers. The processis very rapid and simple. If the oligonucleotides have been designed care-fully to avoid any possibility of mispriming on other oligonucleotides, thereis no reason why all the oligonucleotides should not be mixed, subjectedto a few rounds of heating, annealing and extension and then to around5–10 cycles of standard PCR to generate a full-length gene.
It is important to ensure that the primers for use in gene synthesis arepurified. The longer the oligonucleotides, the greater the proportion oferroneous sequences that will be present and the lower the yield of correct,full-length sequence that will be made. Purification of this product by HPLCor polyacrylamide gel electrophoresis is essential. Most manufacturers willprovide such a purification service. Although this adds to the cost it signifi-cantly reduces the difficulties that are likely to be encountered otherwisein isolating the correct gene sequence. Even so, it is advisable to sequenceseveral clones from a gene synthesis experiment to increase the likelihoodthat a correct clone will be identified.
Further readingArnold, F and Georgiou, G (eds) (2003) Directed Evolution Library Creation, Humana
Press, Totowa NJ.Arnold, F and Georgiou, G (eds) (2003) Directed Enzyme Evolution: Screening and
Selection Methods, Humana Press, Totowa, NJ.
References1. Hemsley A, Arnheim N, Toney MD, Cortopassi G, Galas DJ (1989) A simple
method for site-directed mutagenesis using the polymerase chain reaction.Nucleic Acids Res 17: 6545–6551.
2. Kim, Y-G, Maas, S (2000) Multiple site mutagenesis with high targeting efficiencyin one cloning step. Biotechniques 28: 196–198.
3. Horton RM, Hunt HD, Ho SN, Pullen JK, Pease LR (1989) Engineering hybridgenes without the use of restriction enzymes: gene splicing by overlap exten-sion. Gene 77: 61–68.
4. Clackson T, Winter G (1989) ‘Sticky feet’-directed mutagenesis and its appli-cation to swapping antibody domains. Nucleic Acids Res 17: 10163–10170.
5. Cadwell RC, Joyce GF (1992) Randomization of genes by PCR mutagenesis. PCRMethods Appl 2: 28–33.
6. Hubner P, Iida S, Arber W (1988) Random mutagenesis using degenerateoligodeoxyribonucleotides. Gene 73: 319–325.
7. Zaccolo M, Williams DM, Brown DM, Gherardi E (1996) An approach to randommutagenesis of DNA using mixtures of triphosphate derivatives of nucleosideanalogues. J Mol Biol 255: 589–603.
PCR mutagenesis 169

8. Moore JC, Jin H-M, Kuchner O, Arnold FH (1997) Strategies for the in vitroevolution of protein function: enzyme evolution by randon recombination ofimproved sequences. J Mol Biol 272: 336–347.
9. Zhao H, Giver L, Shao Z, Affholter JA, Arnold FH (1998) Molecular evolutionby staggered extension process (StEP) in vitro recombination. Nature Biotechnol16: 258–261.
10. Stemmer WP (1994) Rapid evolution of a protein in vitro by DNA shuffling.Nature 370: 389–391.
11. Crameri A, Railland S-R, Bermudez E, Stemmer WPC (1998) DNA shuffling of afamily of genes from diverse species accelerates directed evolution. Nature 391:288–291.
12. Ness JE, Welch M, Giver L, Bueno M, Cherry JR, Borchert TV, Stemmer WP,Minshull J (1999) DNA shuffling of subgenomic sequences of subtilisin. NatureBiotechnol 17: 893–896.
13. Raillard S, Krebber A, Chen Y, Ness JE, Bermudez E, Trinidad R, Fullem R, DavisC, Welch M, Seffernick J, Wackett LP, Stemmer WP, Minshull J (2001) Novelenzyme activities and functional plasticity revealed by recombining highlyhomologous enzymes. Chem Biol 8: 891–898.
14. Coco WM, Levinson WE, Michael J, Crist MJ, Hektor HJ, Darzins A, Pienkos PT,Squires CH, Monticello DJ (2001) DNA shuffling method for generating highlyrecombined genes and evolved enzymes. Nature Biotechnol 19: 354–359.
170 PCR
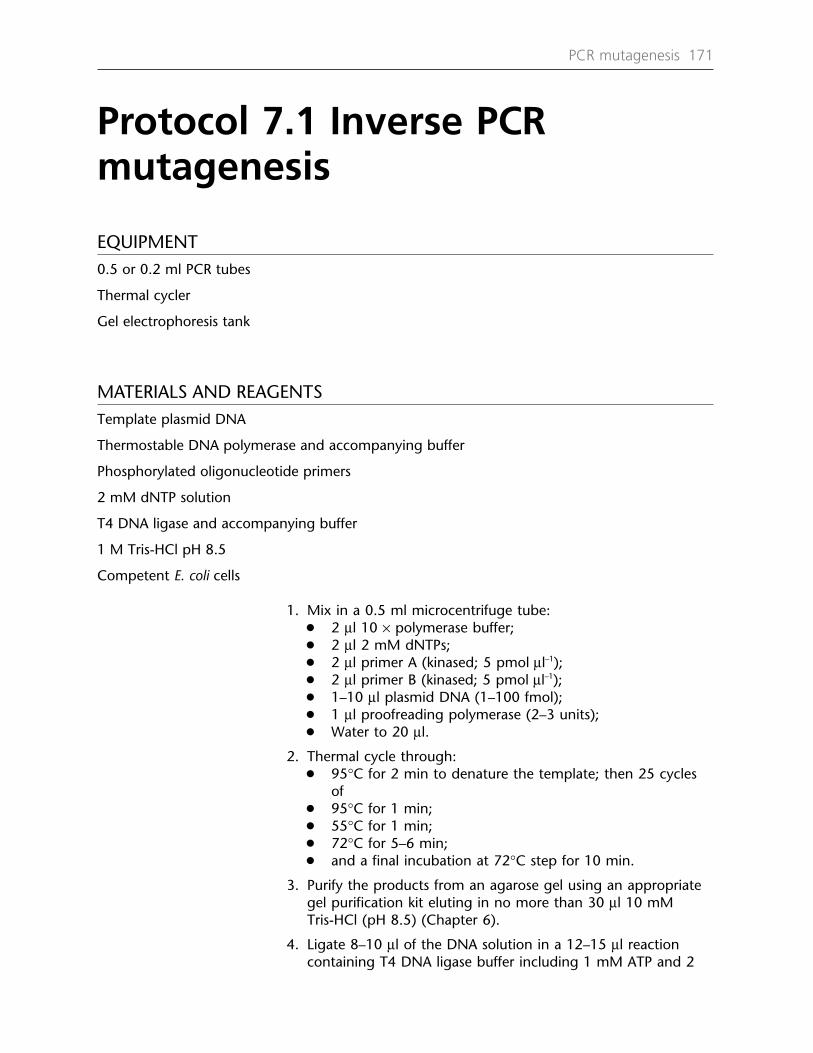
Protocol 7.1 Inverse PCRmutagenesis
EQUIPMENT0.5 or 0.2 ml PCR tubes
Thermal cycler
Gel electrophoresis tank
MATERIALS AND REAGENTSTemplate plasmid DNA
Thermostable DNA polymerase and accompanying buffer
Phosphorylated oligonucleotide primers
2 mM dNTP solution
T4 DNA ligase and accompanying buffer
1 M Tris-HCl pH 8.5
Competent E. coli cells
1. Mix in a 0.5 ml microcentrifuge tube:● 2 µl 10 × polymerase buffer;● 2 µl 2 mM dNTPs;● 2 µl primer A (kinased; 5 pmol µl–1);● 2 µl primer B (kinased; 5 pmol µl–1);● 1–10 µl plasmid DNA (1–100 fmol);● 1 µl proofreading polymerase (2–3 units);● Water to 20 µl.
2. Thermal cycle through:● 95°C for 2 min to denature the template; then 25 cycles
of● 95°C for 1 min;● 55°C for 1 min;● 72°C for 5–6 min;● and a final incubation at 72°C step for 10 min.
3. Purify the products from an agarose gel using an appropriategel purification kit eluting in no more than 30 µl 10 mMTris-HCl (pH 8.5) (Chapter 6).
4. Ligate 8–10 µl of the DNA solution in a 12–15 µl reactioncontaining T4 DNA ligase buffer including 1 mM ATP and 2
PCR mutagenesis 171

units T4 DNA ligase to catalyse recircularization of the linearplasmid molecules in a blunt-end ligation reaction.
5. Incubate at room temperature for 4–6 hours and transfectcompetent cells with 5–10 µl of the ligation reaction.Optionally a DpnI digest could be added at this point toensure that any wild-type template molecules which will bemethylated are destroyed.
NOTE
The annealing temperature will depend upon the melting temperature of the oligonucleotidesand it should ideally be as high as possible to ensure specificity.
172 PCR

Protocol 7.2 Quikchangemutagenesis of plasmid DNA
EQUIPMENT0.5 or 0.2 ml PCR tubes
Thermal cycler
Gel electrophoresis tank
MATERIALS AND REAGENTSTemplate plasmid DNA
KOD DNA polymerase and accompanying buffer (Novagen)
Complementary oligonucleotide primers (~35 nt long with central mutation(s)) 125 ng µl–1
2 mM dNTP solution
25 mM MgSO4
1 M Tris-HCl pH 8.5
Competent E. coli cells
1. Mix in a 0.5 ml microcentrifuge tube:● 5 µl 10 × polymerase buffer;● 5 µl 2 mM dNTPs;● 2 µl 25 mM MgSO4;● 1 µl primer A (125 ng);● 1 µl primer B (125 ng);● 1–10 µl plasmid DNA (20–50 ng);● 1 µl KOD DNA polymerase (2–3 units);● Water to 50 µl.
2. Thermal cycle through:● 95°C for 2 min to denature the template; then 25 cycles
of● 95°C for 30 s;● 55°C for 30 s;● 72°C for 1–2 min kb–1 of template (for example for a 5 kb
plasmid up to a 10 min extension step should be used)1;● and a final incubation at 72°C step for 10 min.
3. Remove an aliquot (~5 µl) as a control for gel analysis.
4. Add 1 µl DpnI (New England Biolabs) and digest at 37°C for1–2 h.
PCR mutagenesis 173

5. Remove a 5 µl aliquot and run together with the DNA fromstep 8, on a 1% agarose gel. As an additional control analiquot of the original plasmid template can be subjected toDpnI digestion and separated on the same gel. If the reactionhas worked there should be a substantial band in both theDpnI undigested and digested samples, indicating theproduction of a product that is resistant to DpnI digestion1. Ifyou use a plasmid template control this should be digested byDpnI2.
6. Transform a 4 µl aliquot of the digested reaction into suitablecompetent E. coli cells.
7. Screen around 4 colonies to identify mutants by DNAsequencing. Generally 2–4 clones will be mutant.
NOTE
1. If the results show a smeared and high molecular weight product this can be due to toohigh a concentration of template DNA or sometimes to the extension step being too long.Try reducing the amount of template and then reducing the time of the extension step to1 min/kb.
2. The gel analysis step is optional. You could simply proceed to the transformation step afterthe DpnI digestion; however, the additional time to analyse the products on a gel canprovide confidence that the reaction has worked efficiently.
174 PCR

Protocol 7.3 Splicing by OverlapExtension (SOEing)
EQUIPMENT0.5 or 0.2 ml PCR tubes
Microcentrifuge
Thermal cycler
Gel electrophoresis tank
MATERIALS AND REAGENTSPlasmid template
PCR reagents
Oligonucleotide primers
Ethanol
1 M Tris-HCl pH 8.0
0.8% agarose (100 ml; 0.8 g agarose in 100 ml of 1 × TAE)
Part A – Primary PCRs
1. Set up two PCRs to perform primary PCR amplifications of thetwo DNA fragments to be spliced. One reaction shouldcontain primers 1 and 2 and the second primers 3 and 4. PCRconditions and the reaction mixes should be as described inProtocol 2.1, except use:● 100–500 ng of plasmid template and only 10–15 cycles;● an annealing temperature as close to 72°C as possible.
2. Analyze the two amplified products on an agarose gel.Depending on the purity of the products either:● purify using a PCR clean-up kit (Chapter 6) to remove
buffer and primers;or● concentrate the samples by ethanol precipitation, separate
through a 0.8% agarose gel, excise the two fragments andrecover from the agarose (Chapter 6).
3. Elute each fragment in a low volume (20–30 µl) of 10 mMTris-HCl (pH 8.0) and estimate the concentration on an
PCR mutagenesis 175

agarose gel using known quantities of appropriate DNAmolecular size markers.
Part B – Secondary PCR
1. Mix the fragments in a 1:1 molar ratio so that the amount ofDNA added to PCR 2 is around 100 ng. Add 25 pmol each ofprimers 1 and 4.
2. Perform PCR 2 under the same temperature regime as for PCR1 for 10–15 cycles.
3. Size fractionate the final product through an agarose gel, gelpurify the fragment and clone into a suitable vector (Chapter6).
176 PCR

Protocol 7.4 ‘Sticky-feet’mutagenesis
EQUIPMENT0.5 or 0.2 ml PCR tubes
Thermal cycler
Gel electrophoresis tank
MATERIALS AND REAGENTSPhosphorylated oligonucleotide primers
PCR reagents
Phagemid single-stranded template DNA
5 mM dNTP solution
Thermostable DNA polymerase and accompanying buffer
T7 DNA polymerase and accompanying buffer
100 mM DTT
T4 DNA ligase and accompanying buffer
500 mM EDTA pH 8.0
0.8% agarose (100 ml; 0.8 g agarose in 100 ml of 1 × TAE)
1. Make sure that the appropriate primer for the primary PCRamplification contains a 5′-phosphate prior to use. This can berequested when the primers are synthesized or you canperform a T4 DNA kinase reaction (Protocol 3.1).
2. Perform a PCR amplification with the two primers, asdescribed in Protocol 2.1. Use an annealing temperature asclose to the polymerization temperature as possible.
3. Size-fractionate the reaction products through an agarose geland purify the ‘sticky-feet’ fragment (Chapter 6).
4. Set up a DNA extension reaction containing:● ~ 100–200 pmol ‘sticky-feet primer’;● 200 ng of M13 or phagemid single-stranded template
DNA propagated in a dut–, ung– strain, or alkali denaturedand neutralized supercoiled plasmid;
● 5 mM each dNTP;● 10 × DNA polymerase buffer;
PCR mutagenesis 177

● 2–5 units of a thermostable proofreading DNA polymerase(Chapter 3).
5. Incubate the reaction at● 94°C for 2 min;● 65°C for 1 min;● 37°C for 1 min;
with a ramping rate that allows about 1 min between thetemperatures, to allow template denaturation and annealingof the sticky feet fragment.
6. To the reaction add the following components in order:● T7 DNA polymerase buffer;● 5 mM ATP;● 100 mM DTT;● 400 units T4 DNA ligase; and● 1 unit T7 DNA polymerase.
7. Incubate the reaction at 37°C for 30 min, inactivate with 1 µlof 500 mM EDTA and transform a dut+, ung+ E. coli strain with1/10 of the final reaction.
8. Screen for mutant plaques (M13) or colonies (phagemid/plasmid) using PCR amplification and primers flanking theinserted sequence. While M13 phage are plated for theproduction of plaques representing the slower growth of cellsinfected by the phage, phagemids can infect a cell but thenreplicate as plasmids and carry none of the phage infectionfunctions. Phagemid transformants are therefore selected foras colonies capable of growth on plates containing anantibiotic for which the phagemid carries a resistance gene.
178 PCR

Protocol 7.5 DNA shuffling
EQUIPMENT1.5 ml microcentrifuge tubes
0.5 or 0.2 ml PCR tubes
Adjustable heating block or water bath
Thermal cycler
MATERIALS AND REAGENTSTemplate DNA
10 × DNAse I digestion buffer (400 mM Tris-HCl (pH 7.9), 100 mM NaCl, 60 mM MgCl2 ,100 mM CaCl2)
DNAse I
Ethanol
4% Nusieve GTG agarose (100 ml; 4 g Nusieve GTG agarose in 100 ml 1 × TAE)
Thermostable DNA polymerase and accompanying buffer
Flanking oligonucleotide primers
2 mM dNTP solution
This procedure describes shuffling of a single gene or severalgene fragments.
PART A – TEMPLATE DNA
1. Prepare template fragments either by PCR amplification or byrestriction digestion. It is necessary to use approximately0.5 µg of template DNA in a shuffling reaction. Since only aproportion of the starting DNA will be fragmented in thecorrect size range you must ensure you generate about 5times more of each template (approximately 2.5 µg pertemplate fragment)
2. Purify the fragments from vector and if PCR is used, it isessential to remove the primers. Use an appropriatepurification approach such as a spin column or gel purification(Chapter 6).
PCR mutagenesis 179

PART B – DNASE I DIGESTION
3. Mix the following components in a microcentrifuge tube:● 5 µl 10 × DNAse I digestion buffer;● 5 µg template DNA;● 0.5 units DNAse I;● total volume 50 µl.
4. Incubate at room temperature for 15 min.
5. Terminate the reaction by heating to 90°C for 10 min.
6. Ethanol precipitate (Chapter 6).
PART C – FRAGMENT PURIFICATION
7. Electrophorese the DNA through a 4% NuSeive GTG agarosegel (BioMolecular Whittaker) using TAE buffer with EDTA at0.2 mM.
8. Visualize the ethidium bromide stained gel under UVillumination and recover the appropriate size fraction(normally 50–100 bp, although for small genes recovering asmaller size range such as 25–50 bp is recommended).
9. Trim the slice to remove excess agarose, but minimizeexposure to UV.
PART D – DNA SHUFFLING REACTION
10. Combine in a 0.5 ml microcentrifuge tube:● gel slice maximum 12.5 µl;● 5 µl 10 × Taq DNA polymerase buffer;● 5 µl 2 mM each dNTP;● 1–3 units Taq DNA polymerase;● total volume 50 µl.
11. Perform thermal cycling (for an instrument-monitoring tubetemperature) according to the following scheme:● 95°C for 5 min; then 40–60 cycles of● 95°C, 30 s;● 50°C, 30 s;● 72°C, 1 min;● and a final 72°C, 5 min extension.
12. Purify the final product using an appropriate spin columnmethod as the reaction contains agarose eluted inapproximately 30 µl 10 mM Tris-HCl (pH 8.0).
180 PCR
PART E – FINAL PCR STEP
13. Combine in a microcentrifuge tube:● 1.25 µl shuffled DNA;● 5 µl 10 × Taq DNA polymerase buffer;● 5 µl 0.2 mM each dNTP;● 25 pmol each flanking primer;● 1 unit Taq DNA polymerase;● total volume 50 µl.
14. Perform thermal cycling under the same conditions in step 11for 20–30 cycles. If insufficient full-length product is generatedthen the number of cycles can be increased.
15. Clone the products into an appropriate expression vector forsubsequent screening or selection.
PCR mutagenesis 181

Protocol 7.6 Gene synthesisThis Protocol describes the synthesis of a gene ofapproximately 300 base pairs from 6 oligonucleotides each65–70 nt long and with 12–15 nt terminal overlaps.
EQUIPMENTMicrocentrifuge
Microcentrifuge tubes
Thermal cycler
Agarose gel system
MATERIALS AND REAGENTSOligonucleotides designed to generate synthetic gene at 50 ng µl–1
Flanking primers to amplify the full-length product
Proofreading thermostable KOD DNA polymerase
10 × KOD polymerase buffer
2 mM dNTPs
25 mM MgCl2
Water
1. Set up three parallel reactions, each containing one primerpair with reference to Figure 7.17: (primer 1 + 2); (primer 3 +4); (primer 5 + 6):● 3 µl primer A (1 or 3 or 5);● 3 µl primer B (2 or 4 or 6);● 1 µl 10 × buffer;● 1 µl 2 mM dNTPs;● 0.4 3 µl 25 mM MgCl2;
● 1 unit polymerase;● total volume 10 µl.
2. Mix the reactions by a brief (1 s) centrifugation step
3. Place in a thermocycler and incubate as follows:● 94°C, 2 min;● 25°C, 2 min;● 72°C, 2 min.
This step allows the annealing of the oligonucleotides andtheir self-extension to generate complete double-strandedfragments.
182 PCR

4. From each reaction take a 5 µl aliquot andcombine in a fresh tube1.
5. Repeat the incubation cycle in step 3.
6. Set up the following reaction:● 15 µl reaction mix from step 5;● 1 µl flanking primer 1 (100 pmol 15
µl–1);● 1 µl flanking primer 2 (100 pmol µl–1);● 3.5 µl 10 × polymerase buffer;● 3.5 µl 2 mM dNTPs ;● 1.4 µl 25 mM MgCl2;● 1 µl KOD DNA polymerase;● total volume 50 µl.
7. Perform thermal cycling according to thefollowing scheme:● 94°C, 15 s;● 60°C, 15 s;● 72°C, 15 s to 1 min depending on size
of gene.
8. Analyze a 1–5 µl sample on a 2% agarosegel to determine whether a correct sizedproduct is visible.
9. Set up a restriction digest if required todigest the product to allow cloning into theappropriate cloning vector.
10. Separate the sample on a 2% agarose gel,excise the correct band and purify using anappropriate gel purification procedure(Chapter 6).
NOTES
1. At step 4 it is possible to perform additional steps to join pairs of frag-ments together in a stepwise manner. For example, you could set up areaction to join product (1 + 2) to product (3 + 4) according to step 3.Then an aliquot of this reaction (1 + 2 + 3 + 4) could be added to analiquot of the product (5 + 6) reaction and joined according to step 3.Finally in step 6 the full-length gene would be amplified.
PCR mutagenesis 183


Analysis of geneexpression
8.1 Introduction
The varied phenotypes observed for both unicellular and multicellularorganisms result from differences in the genes and alleles that comprise thegenomes of each species. However, most cell types of a multicellularorganism, such as nerve cells, liver cells, bone cells and blood cells, alsoshow striking phenotypic variations. Similarly plant development isgoverned by differential expression of genes in different tissues and celltypes. The DNA sequence of the genome in all cells is identical, but changesin the methylation state of regions of the genome and regulation oftranscriptional processes leads to differential expression of cell-specificgenes during development. In modern biology, accurate analysis of geneexpression has become increasingly important not only in improving ourunderstanding of gene and protein functions but also to detect low-leveltranscripts as part of biotechnological applications or in medical diagnosis(1). The website http://www.cs.wustl.edu/~jbuhler/research/array/#cellscontains a useful introduction to comparative gene expression analysis.
For many years the conventional approaches to analyzing gene expres-sion have been by Northern blot, in situ hybridization or RNAse protectionassays. While these are still used extensively, they are often time consum-ing and are relatively insensitive, making detection of rare transcriptsdifficult or impossible. The development of PCR as a tool for analysis of geneexpression patterns and to detect rare transcripts has revolutionized thesensitivity of gene expression analysis. It is now possible, using fluorescentdyes, to perform real-time analysis of accumulation of multiple products toprovide more sophisticated information on relative levels of different genetranscripts. Changes in gene expression of even more genes can be analyzedin parallel by the use of microarrays which can allow several tens of thou-sands of gene probes to be investigated in a single experiment. This Chapteroutlines how PCR can be used to analyze gene expression patterns and willdescribe current PCR techniques that allow quantitative gene expressionanalysis, and cellular and subcellular detection of transcript levels. A majortechnology for analysis of differential gene expression is real-time PCR andChapter 9 has now been devoted to this important topic.
8.2 Reverse transcriptase PCR (RT-PCR)
Analysis of gene expression requires accurate determination of mRNAlevels. But PCR is based on amplification of DNA rather than RNA, so how
8

can it be used for mRNA analysis? The answer is that first, mRNA isconverted into DNA using the well-known process of reverse transcription,which is used by RNA viruses to convert their genomic RNA into a DNAwithin the host cell; and second, PCR amplification is performed on theresulting complementary DNA (cDNA).
Standard RT-PCR
Standard RT-PCR offers a rapid, versatile and extremely sensitive way ofanalyzing whether a target gene is being expressed and can provide somesemi-quantitative information about expression levels. Theoretically RT-PCRshould be able to amplify one single mRNA molecule, although in practicethis is not likely to be a realistic goal. However, RT-PCR is an extremelyvaluable tool when limited material, such as specific differentiated cells, isavailable. In this context RT-PCR can be used either to detect specifictranscripts by using sequence-specific primers, or to create cDNA libraries byusing generic primers such as oligo-dT and either random oligonucleotidesor 5′-cap-specific primers such as the SMART II oligonucleotide (Clontech).The following Sections describe the steps involved in RT-PCR.
The reverse transcriptase reaction
RT-PCR is based on the ability of the enzyme reverse transcriptase, anRNA-dependent DNA polymerase, to generate a complementary strand ofDNA (first-strand cDNA) using the mRNA as a template. The reversetranscriptase reaction can be performed on either total cytoplasmic RNA orpurified mRNA. It is important that no genomic DNA is present, as this willalso provide a template for the PCR amplification step. An appropriatecontrol for any contaminating DNA is a control reaction in which thereverse transcriptase step is omitted. Many commercial kits generate high-quality DNA-free total or mRNA preparations, or an RNAse-free DNAse Idigestion step can be included in the RNA extraction protocol. To analyzea previously characterized gene the primers can be designed to amplifyacross an intron, thus allowing simple identification of contaminatinggenomic DNA that will contain the intron while the transcript will not.This means DNA will give rise to a longer product than the RNA transcript.The method is sometimes called intron-differential RT-PCR. The use ofpurified mRNA is recommended since this generally gives rise to a higheryield of first-strand cDNA. When analyzing low abundance transcripts theuse of purified mRNA is important for success since the relative concentra-tion of the target mRNA will be much higher than when using totalcytoplasmic RNA. A wide variety of simple-to-use kits, based on the use ofoligo-dT annealing to the 3′-polyA tract of eukaryotic mRNAs, are availablefor purifying mRNA (Figure 8.1).
The next step is to copy the mRNA to first-strand cDNA (Figure 8.2). Thisis often done using an oligo-dT primer that can anneal to the 3′-polyA tailof eukaryotic mRNAs and allows reverse transcriptase to synthesize cDNAfrom each mRNA molecule present in the reaction. This can be carried outeither using purified eluted mRNA or purified mRNA still attached to a solidsupport matrix. There are two common types of reverse transcriptase; Avian
186 PCR

Myeloblastoma Virus (AMV), reverse transcriptase and Moloney MurineLeukemia virus (M-MLV) reverse transcriptase. Versions that allow efficientcopying of long mRNAs are available, for example the M-MLV RNase (H–)that carries a point mutation (Stratagene, Promega). However, new enzymesare being produced such as the Carboxydothermus hydrogenoformanspolymerase (Roche Applied Science), which displays reverse transcriptaseactivity at a high reaction temperature between 60°C and 70°C. AMV-RThas both 5′→3′ primer-dependent polymerase activity with either RNA orDNA as template and a 3′→5′ RNAse H activity that degrades the RNAportion of the RNA-DNA heteroduplex product of cDNA synthesis. TheM-MLV-RT is essentially identical to the AMV enzyme but it can only useRNA as a template.
For a standard first-strand cDNA reaction using AMV-RT approximately1 µg of total RNA or 10–100 ng mRNA should be used. Depending on theabundance of the target mRNA species, the optimal amount of RNA mayneed to be determined empirically by testing various starting amounts. Astandard reverse transcriptase reaction is described in Protocol 8.1.
Usually first-strand cDNA synthesis is very reliable and an aliquot of thereaction can be taken immediately for PCR amplification. However, if thereis any doubt about the quality of the mRNA or the cDNA synthesis reaction,or you fail to obtain a PCR product, the success and efficiency of the reversetranscriptase reaction should be monitored. For example, if no PCR ampli-
Analysis of gene expression 187
Solidsupport
Solidsupport
Solidsupport
Solidsupport
Hybridization and purification
mRNA
mRNA
mRNA
cDNA
cDNA
Reverse transcription
Purification
+ AAAAAAAAA
TTTTTTTTTAAAAAAAAA
AAAAAAAAA
TTTTTTTTT
TTTTTTTTT
TTTTTTTTT
–
–
–
–
Figure 8.1
mRNA purification using an oligo-dT solid support matrix and subsequent first-strand cDNA synthesis.

fied product is detected it is important to know whether this is due to thefailure of the first-strand cDNA synthesis reaction or of the PCR reaction.If a gene-specific primer to be used for the subsequent PCR step lies closeto the 5′-end of the gene, it is useful to know that reverse transcription hasyielded first-strand cDNA of appropriate length. If the abundance of thetranscript is extremely low it may be necessary to optimize the first-strandcDNA synthesis conditions by varying mRNA and primer concentrations/combinations. The simplest way of analyzing the efficiency of first-strandsynthesis is to substitute one of the nucleotides with a radiolabelednucleotide, such as [α–32P] dATP or dCTP that will be incorporated into thecDNA, and then to calculate the final incorporation value by scintillationcounting. A less quantitative method, but one that provides informationon the size range of cDNA products, is gel electrophoresis. An aliquot ofthe first-strand cDNA reaction can be fractionated through an agarose gelafter RNAse digestion to remove the template RNA. The first-strandsynthesis product will consist of single-stranded DNA so cannot be visual-ized efficiently using ethidium bromide. However, the radiolabeled cDNAcan be analyzed by autoradiography of the gel. This can be done directlyby covering the gel in plastic film and then exposing it to X-ray film or aphosphorimager plate. Alternatively, the gel can be transferred to amembrane, such as nitrocellulose, by using standard Southern blotprocedures (Chapter 5) and the membrane can be exposed to film or animager plate. If radiolabel was not included, the membrane or the agarosegel can be stained using a single-stranded specific nucleic acid dye such asSYBR Green II nucleic acid gel stain (Molecular Probes) or Fast RNA Stain‘(HealthGene Corporation). A successful first-strand cDNA synthesisreaction produced by oligo-dT priming should appear as a smear from aposition greater than 2 kb due to the heterogeneous mixture of cDNAproducts. RNA markers can be used to help assess the size range of cDNAproducts. Once the success of the first-strand cDNA reaction has beenverified the remainder of the reaction products can either be used directlyfor PCR or stored at –80°C.
The analysis of RT-PCR amplification products is performed by thedetection methods described in Chapter 5. Despite the possibility of lowlevels of amplification due to low initial concentrations of target transcript,standard agarose gel electrophoresis and ethidium bromide staining isusually sufficient to detect the final RT-PCR amplification product.
The PCR reaction
The next step is to amplify the cDNA by PCR as described in Protocol 2.1.Appropriate upstream and downstream primers are used and can either bespecific to the target gene, or, for cDNA library construction, generic. Dueto the single-stranded nature of the first strand cDNA, the early cycles ofthe PCR involve linear amplification as the first strand can only act astemplate for one of the primers. Exponential amplification from bothprimers occurs once sufficient copies of the second strand have beengenerated. In practice this has no effect on the final PCR amplification yield.
In some cases, particularly when transcript levels are low, someoptimization of PCR conditions will probably be necessary to obtain a
188 PCR

convincing result. The optimization can of course be performed on the first-strand cDNA material but, if extensive optimization is required, this will bevery wasteful and will require the use of large amounts of reversetranscriptase.
A more economical way of optimizing the PCR parameters is to use thesame reaction components as for the RT-PCR itself but using genomic DNAor plasmid DNA containing either the genomic region or the cDNA ofinterest. Of course by using double-stranded DNA for the optimizationexperiments, the PCR conditions are not strictly mimicked, but shouldallow you to determine the best temperature profiles and primer combi-nations for any given sample.
8.3 Semi-quantitative and quantitative RT-PCR
While standard RT-PCR can detect the presence or absence of mRNA speciesit does not provide a quantitative measurement of levels of gene expres-sion principally due to the ‘plateau effect’ described in Chapter 2. However,by modifying the standard method RT-PCR can be used to quantify thelevels of mRNA in a sample or provide insight into the relative expressionlevels between different cell types or in response to external stimuli.
Semi-quantitative RT-PCR
If relative differences in transcript levels are to be compared between differ-ent cell types, a semi-quantitative approach may be sufficient. The simplestway of performing such analysis is to determine the amounts of PCRproduct during the exponential phase of the PCR but before the plateauphase (Chapter 2). While this approach does not give any absolute value
Analysis of gene expression 189
dATPdGTP
dCTPdTTP
Reversetranscriptase
mRNA
Generation offirst-strand cDNA
Gene-specificprimer 2
Gene-specificprimer 1
First-strand cDNASecond-strand cDNA
3'
5'
5'
3'
3'
3' 3'
PCR amplification
(T)nTTTTTTTTTT
(A)nAAAAAAAAA
(T)nTTTTTTTTTT
(A)
(B)
–
Figure 8.2
Diagram showing (A) reverse transcription from mRNA using an oligo-dT primerand (B) second-strand cDNA synthesis.

of the mRNA level in your starting sample it will readily detect differencesof 10–20-fold in mRNA levels between different samples. This method canbe useful for analyzing changes in the level of a target transcript in identicaltissue or cells in response to external stimuli. Of course valid comparisonsare only possible when the same primer combinations and reactionconditions are used for all samples. The PCR experiments should beperformed in parallel at least twice to ensure that the results obtained areconsistent and reproducible. An example of a semi-quantitative analysisanalyzed by agarose gel electrophoresis is shown in Figure 8.3.
An oligo-dT primer should be used for the first-strand cDNA synthesisbecause eukaryotic mRNA molecules have a polyA tail, ensuring that thelevel of cDNA synthesis reflects the level of the starting target mRNA. Therecommended way of determining the efficiency of cDNA synthesis is tomeasure the incorporated level of radiolabeled nucleotides by scintillationcounting. Identical quantities (radioactivity counts per minute) of eachfirst-strand cDNA reaction should be used for PCR (Section 2.1). Aliquotsshould be removed from each reaction during the PCR every 3–5 cycles forthe first 15–20 cycles. This ensures that the reaction is being sampled duringthe exponential phase of the PCR and that the plateau is never reached.Agarose gel electrophoresis may not be sufficiently sensitive to detect slightdifferences in amplification levels between samples. In such cases Southernblot analysis (Chapter 5) should be performed using either a DNA or anoligonucleotide probe. For the detection of slight differences between highabundance mRNA species it may be necessary to perform serial dilutions ofthe RNA or PCR products to achieve the optimal range for accurate esti-mation of mRNA levels. For this purpose dot-blot analysis is recommendedas large numbers of samples can be analyzed simultaneously. The measure-
190 PCR
M 1 2 3 4
Figure 8.3
Agarose gel showing semi-quantitative RT-PCR analysis from plant RNA.Amplification was performed using primers designed for an abundantly expressedroot gene. Lanes 1 and 2 represent RT-PCR of RNA from Arabidopsis thalianaflowers using 10 (lane 1) and 15 (lane 2) amplification cycles. Lanes 3 and 4represents RT-PCR of RNA from Arabidopsis thaliana roots using 10 (lane 3) and 15(lane 4) amplification cycles.

ment of signal intensities can either be performed by densitometry meas-urements of X-ray films or by a phosphoimager. X-ray film has a majorlimitation since even short exposures to different amounts of PCR productcan appear equally intense due to the nonlinear nature of X-ray film.However, it can be useful if the amounts of PCR product are strikinglydifferent. If possible use a phosphoimager, as even small differences insignal intensity can be accurately determined. If you do not have access toa phosphoimager an alternative is scintillation counting of isolatedproducts on sections of the filter.
Virtual Northern blotting
Semi-quantitative analysis of gene expression profiles, either by Northernblot analysis or by differential display (Section 5), can lead to apparent falseexpression patterns and so it is best to perform an experiment based on analternative approach to verify the result. For example a differential displayresult could be confirmed by Northern blot analysis or a Northern blotresult could be confirmed by an RNAse protection assay. However, thebottleneck for such approaches is the requirement for microgram amountsof RNA. To overcome this problem of the availability of material a newapproach involving an intrinsic PCR ‘amplification’ step has been incorpo-rated into the Northern blot procedure creating a virtual Northern blot. Theapproach was first described by Clontech and has now been used success-fully in place of standard Northern blot analysis. The principle is to generatefull-length double-stranded cDNA and to incorporate an amplification stepto boost the measurable levels of ‘transcript’ in the form of cDNA. Thisprocess requires between 50 and 500 ng of total RNA, which is significantlyless than is required for standard Northern blotting (2–10 µg). Clontech’sSMART PCR cDNA synthesis kit facilitates production of high-qualitycDNA from total or polyA RNA as described more fully in Chapter 10(Section 10.1).
In order to allow for semi-quantitative analysis it is important that thePCR amplification does not reach the plateau phase (Chapter 2) thus ensur-ing that the differential expression profile is mirrored in the correspondingamplified cDNA. ‘Test’ amplifications are required using different numbersof PCR cycles so that optimal conditions are used for the transcript inquestion. Following amplification, the cDNAs are size fractionated throughan agarose gel and subjected to Southern blot analysis. Figure 8.4 shows acomparison of a standard Northern blot using 2 µg of polyA RNA and avirtual Northern blot using 100 ng of total RNA. Virtual Northern blottinghas been used successfully for a number of gene expression studies and ithas been shown that as little as 100 cultured cells is sufficient to generatemore than 100 virtual Northern blots (2).
Quantitative RT-PCR
Since every PCR displays different reaction dynamics it is difficult tocompare semi-quantitative data from separate experiments, and com-parisons of mRNA transcript levels from amplified genes using differentprimer pairs cannot be made. More robust and reliable methods for mRNA
Analysis of gene expression 191

quantitation rely on the use of internal standards and quantitative com-petitive RT-PCR.
Competitor PCR
A relatively simple approach to quantitative RT-PCR involves coamplifica-tion of both the target mRNA and a standard RNA in a single reaction usingprimers common to both target and standard (Figure 8.5). As the standardcompetes with the target mRNA for both primers and enzyme it is referredto as a competitor or mimic (3). It is best to design an RNA competitor thatis slightly different in length from the target allowing simple and direct geldetermination of relative efficiencies of amplification. The competitor RNAcan be generated by T7 or SP6 directed in vitro transcription from a suitableplasmid vector. The competitor should contain the same primer sites as thetarget and can then be used to control for both cDNA synthesis and PCR.Both the target and standard are primed with a gene-specific primer andthe cDNAs are then coamplified directly in the same tube using a singleprimer pair. In practice several reactions are performed simultaneously withdifferent amounts of competitor RNA. The concentration of the targetmRNA can be determined as being equivalent to that of the competitorwhen there is a 1:1 ratio of target and competitor products. One of the mostcritical steps in this process is determining accurately the concentration ofthe competitor RNA. The best and simplest way of doing this is by spectro-photometry. The absorbance of the transcribed competitor RNA, afterDNAse treatment, at 260 nm (A260) should be measured in triplicate and theaverage will give a quantitatively accurate measure of the competitor RNAconcentration.
Controls and measurements
In all experiments that involve the quantification of mRNA levels it isimportant to ensure the integrity of samples, and to ensure that normal-
192 PCR
Spl
een
Pro
stat
e
Test
is
Standard Northern Virtual Northern
Spl
een
Pro
stat
e
Test
isFigure 8.4
Comparison of a standard Northern blot analysis using 2 µg of polyA RNA and avirtual Northern blot using 100 ng of total RNA. (Reproduced with permission ofCLONTECH Laboratories Inc.)

ization between samples can be achieved. This is done by including theanalysis of a gene whose level should remain constant under all conditions.For example actin is widely used as such a control. The levels of the mRNAfor this protein can be used to quantitate the amounts of mRNA producedfrom a sample, and differences in signal intensity can be used to moderatethe levels of target gene signals. The measurement of signals from samplesseparated through gels will depend on whether the DNA is labeled or not.
Analysis of gene expression 193
T7 RNApolymerase
Primer 1
Primer 2
Target RNA
Primer 2
Primer 1
Primer 1
Primer 2
Primer 2
Competitor
Target
Competitor concentrationequal to target concentration
PCR amplificationusing primers 1 and 2
In vitrotranscription byT7 RNA polymerase
Competitor RNA
Reverse transcribe
Mix various quantities ofcompetitor with target
Competitor DNA template
Figure 8.5
Principle of quantitative RT-PCR analysis using in vitro transcribed competitors. Acompetitor is generated that can be distinguished from the target product upongel analysis. The RT-PCR reactions are spiked with known amounts of competitor.The concentration of competitor that gives the same amount of product as thetarget sample provides a measure of the amount of target mRNA in the originalsample.

For standard DNA gels, it is possible to capture gel images using a CCDcamera and to analyze the intensity of the signals in each band by usingappropriate software, often supplied by the manufacturer of the imagingequipment. These programs allow integration of the intensity of the bandand provide a numerical value for the level of signal. The use of a standard,such as actin, allows the normalization of signal intensities. If the samplesare radiolabeled, such as for virtual Northern analysis, then the signals canbe measured by exposing X-ray film in a suitable cassette. It is importantthat the bands are gray and do not become black during this exposure sincethis prevents subsequent accurate quantification of signal intensities whenthe film is scanned in a densitometer. For faster and more accurate analysisuse a phosphorimager, which has a much broader dynamic range thanX-ray film. It uses a storage phosphor autoradiography system, but someinstruments also offer direct fluorescence and chemifluorescence detection.All systems come with associated software for accurately quantifying signalintensities.
8.4 One-tube RT-PCR
RT-PCR protocols are not always successful. The major limitation is thatcDNA synthesis is commonly performed at 42°C, which does not elimi-nate RNA secondary structures. In addition, the two-step procedureinvolving the first-strand cDNA synthesis step and then the PCR step canresult in potential contamination problems. New systems have beendeveloped where both the RT-PCR reaction and the subsequent PCRreaction are carried out in the same tube. Details of such systems areprovided in Chapter 3. A further benefit is that in some systems cDNAsynthesis can be performed at high temperatures, which eliminates RNAsecondary structure. For example, the Titan one-tube RT-PCR system(Roche) uses a reverse transcriptase and buffer that allows the cDNAsynthesis reaction to be performed at 60°C. The tube, now containing first-strand cDNA, can be directly subjected to PCR amplification, as the initialreactants include a thermostable DNA polymerase. This system has beenused to successfully amplify cDNAs up to 6 kb in length from as little as10 ng of total RNA.
8.5 Differential display
Differential display, first described by Liang and Pardee (4), allows rapid andsimultaneous display of the expression profiles of mRNAs from different cellpopulations. The main steps include:
● reverse transcription using a 3′-anchored primer;● PCR in the presence of α-35S dATP using an arbitrary 5′-primer;● size fractionation of the amplified products and comparison of patterns
derived from different cell populations; and● re-amplification and cloning of differentially expressed cDNA products.
Each step will be described in more detail, but for a comprehensive protocolsee the website http://www.plant.dlo.nl/projects/hybtech/Liu/DISPLAY.html.
194 PCR

Reverse transcription
The 3′-primer for reverse transcription is based on the polyadenylation(polyA) tail found on eukaryotic mRNAs. An oligo-dT primer is used toanchor the primer at the 3′-end of the mRNA to ensure directional first-strand cDNA synthesis. If you tried to compare all the transcripts at onetime the pattern would be extremely complicated and impossible tointerpret. To simplify the interpretation the oligo-dT primer is modified toanneal to only a subset of mRNA molecules. At the 3′-end of the primer,one or commonly two extra bases are included to select a subpopulation ofthe mRNAs for amplification. This specificity of annealing shown belowalso ensures that all products prime from the 3′-end of the transcript ratherthan nonspecifically within the polyA tail:
mRNA 5′-NNNNNNNNNNNNAAAAAAAAAAAAAAAAAAAAAAAAAAAAAAAAAAAAAAA-3′3′-NNTTTTTTTTTTTTTTTTTTTTT-5′
NN in the primers could be either AA, AG, AC, GA, GG, GC, CA, CG, CC,AT, GT or CT, giving 12 different combinations of oligo-dT primer. Anysingle primer will therefore anneal to one-twelfth of the total mRNAs inthe population. The use of all 12 primers in separate cDNA synthesisreactions should amplify different subpopulations of the mRNA comple-ment of the cells thereby allowing comparison of essentially all thetranscripts. The reverse transcription reaction is then performed asdescribed previously (Section 8.2). Further advances in primer design weresubsequently introduced. For example only a one-base anchor means thatonly three primers of the general design N10T11C and N10T11A and N10T11G,are required. In this case N10 represents a 10-nucleotide 5′-sequencethat includes a restriction site for subsequent cloning (5). The two-nucleotide-anchor primers produce fewer bands per gel lane than thesingle-anchor primers, but provide higher resolution of the product bands(6).
mRNA 5′-NNNNNNNNNNNNAAAAAAAAAAAAAAAAAAAAAAAAAAAAAAAAAAAAAAA-3′3′-ATTTTTTTTTTTGGAATTCCTA-5′3′-GTTTTTTTTTTTGGAATTCCTA-5′3′-CTTTTTTTTTTTGGAATTCCTA-5′
The PCR reaction
The main constraint in differential display is the separation and display ofproducts. Amplified cDNAs larger than about 500 bp will not be resolvedby standard polyacrylamide DNA sequencing gels. Thus it is important totry to amplify fragments from each cDNA within 500 bp of the mRNA polyAtail. This is most conveniently achieved using a short, essentially randomsequence 5′-primer that is 10 nucleotides in length (4). A range of suchprimers is commercially available, for example from Operon Technologies.The specificity of amplification also increases dramatically if the final dNTPconcentration is reduced to 2 µM compared with 200 µM used for standardPCR reactions. The lower dNTP concentration also increases the efficiencyof incorporation of [α-35S] dATP, increasing the specific activity of thegenerated fragments and consequently improving their detection. Differ-
Analysis of gene expression 195
ential display procedures normally require extensive optimization in orderto efficiently and clearly display cDNA differences. Optimization is veryimportant as the success of both the DNA elution and re-amplificationdepends on the amount of cDNA generated during the first round of PCR.A good way of optimizing the first round PCR is to take advantage of knowngenes that are differentially expressed in the cells that you will use for the‘real’ experiment. The value of such an internal control was demonstratedwith the murine thymidine kinase (TK) gene from tumorigenic cells (4).
Displaying the differentially expressed genes
Polyacrylamide gel electrophoresis can separate DNA molecules that differby as little as 1 bp in 500 bp and is therefore an appropriate method fordisplaying differentially expressed genes. The gel system is the same as thatused for manual DNA sequencing (7). The accuracy and resolution of thedifferential gene expression profiles depends to a large extent on the qualityof the polyacrylamide gel and generally a final polyacrylamide concentra-tion of 6% is appropriate with an effective separation range of between 25and 500 bp. Acrylamide and bis-acrylamide are both neurotoxins which canenter the body by inhalation, if a powder, or through the skin, so extremecare should be taken when handling these chemicals, and protective cloth-ing, gloves and mask should always be used. Because of this we recommendusing commonly available ready prepared solutions.
Preparing the gel apparatus
A number of gel apparatus are commercially available and consist of twoglass plates (a ‘notched’ front plate and a complete back plate), plasticspacers, a comb and a discontinuous electrophoresis buffer system.Generally, a gel of 40 cm length and 20 cm width is used. The gel thick-ness is determined by the spacer thickness and is normally between 0.2 mmand 0.6 mm. Thinner gels give increased resolution but are fragile, whilethicker gels are easier to handle, accept larger sample volumes, but are moredifficult to fix and dry. A gel thickness of 0.4 mm is recommended, whichgives good resolution, ease in post-run handling and is generally easy to fixand dry.
Re-amplification and cloning
Once you are satisfied that there are cDNAs differentially expressed betweenyour samples it is time to perform the re-amplification and cloning of thecDNA fragments. The re-amplification serves two purposes; first, it generatessufficient cDNA to clone into a plasmid for further analysis, and second, itserves as a control to demonstrate that the initial PCR amplification wasprimer-specific. To perform the re-amplification the DNA must be elutedfrom the dried gel by crushing the gel slice in elution buffer(http://www.plant.dlo.nl/projects/hybtech/Liu/DISPLAY.html).
The amount of cDNA available for re-amplification may be limiting anda frequent problem when analyzing the PCR re-amplification is that noproduct can be detected. This is not uncommon even after 40 rounds of
196 PCR

PCR and a third round of PCR amplification may be required. The problemsassociated with re-amplification, described in Chapter 4, such as increasedprobability of PCR-generated mutations, are not so important here sincedifferential display cDNA fragments will usually be used to screen a cDNAlibrary to isolate the full-length cDNA for further characterization.However, by increasing the number of PCR rounds, the possibility ofamplifying nonspecific DNA fragments increases. This means that follow-ing cloning of the product, it is important to verify its differentialexpression character by Northern blot analysis or RT-PCR (Section 8.3).
Advantages of differential display
The advantages of PCR-based differential display are:
● that differences in expression patterns can be readily visualized byrunning different samples in parallel;
● the differentially expressed cDNAs can, in theory, be easily recovered,cloned and sequenced;
● the displayed mRNA patterns are highly reproducible.
In addition, PCR-based differential display is technically much simpler andquicker than the traditional techniques used for detecting differences ingene expression patterns. After initial optimization, PCR-based differentialdisplay only requires 2 days for differential band pattern visualization andonly 5 days for the subsequent elution, re-amplification and cloning.
Fluorescent differential display
The main drawback to differential display is that it makes use of hazardousradioisotopes. Recent advances have overcome the use of radioisotopes andmanual autoradiography detection by incorporating fluorescent primers orfluorescent dUTP into the PCR reaction as part of the differential displayprotocol. The fluorescent signal can then be detected using an automatedfluorescent DNA gel imager (for example from Hitachi or AmershamBiosciences) and the fluorescent signal can be analyzed using various soft-ware packages such as FMBIO (Hitachi). This technique has been termedfluorescent differential display (FDD). The main advantages of FDD are: fullautomation, which makes it cost effective in terms of time when optimiz-ing the experimental protocol; no need for radiolabels; high level ofreliability; and consistency between duplicate samples. Conveniently,fluorescently labeled universal primers can be used for virtually all experi-ments, thereby reducing the overall cost. Both fluorescein isothiocyanateand rhodamine can be used as fluorescent tags. The FDD procedure isessentially identical to standard differential display.
FDD has been used successfully for a number of applications such as theidentification of differentially expressed genes during neuroblastomadifferentiation (8) and in identifying differentially expressed genes in plantsin response to different light regimes (9). Recently it has been shown thatcloning of the differentially expressed fragments can be omitted. Afterexcision of FDD bands from the polyacrylamide gel these are separated onan agarose gel containing a base-specific DNA ligand which separates
Analysis of gene expression 197

equally sized fragments differing in base composition. It has been shownthat most of the cDNA fragments selected using this method can be directlysequenced and subsequent Northern blot analysis reveals them to havedifferential expression patterns (10).
8.6 PCR in a cell: in situ RT-PCR
The concept of performing PCR to detect gene expression patterns insidesingle cells or even specific intracellular organelles would have been un-believable only a few years ago. In situ RT-PCR follows the same principleas RT-PCR but instead of being performed in a test-tube the reaction occursinside cells or even at specific intracellular locations showing organelle-specific gene expression.
Principle
In situ RT-PCR detects gene expression profiles at the cellular and sub-cellular level. In essence the technique is carried out on the biologicalsample usually immobilized on a glass slide. In situ RT-PCR therefore hasthe sensitivity of standard RT-PCR but also the spatial resolution of in situhybridization. The technique can be divided into several main steps includ-ing:
● sample preparation;● in situ first-strand cDNA synthesis;● in situ PCR using either labeled primers or unlabeled primers; and● in situ hybridization or detection.
The following Sections outline these different steps whilst more detailedinformation can be found at http://www.bioscience.org/1996/v1/c/nuovo1/htmls/list.htm.
Sample preparation
Preparing a sample for in situ RT-PCR is slightly more time consuming thanpreparing samples for standard RT-PCR as they must maintain cellularintegrity during first-strand cDNA synthesis, PCR and product detection. Toachieve this, samples are normally prepared on glass slides to allowsufficient heat transfer during the RT and PCR steps. Depending on thetissue or sample there are a number of standard sample preparation stepsthat should be followed. To maintain cellular integrity the tissues shouldbe fixed in 2–4% paraformaldehyde or 2–3% glutaraldehyde solutions. Oncefixed the tissue must be sectioned, usually by embedding in paraffin-basedwaxes, followed by standard µm-range sectioning. The tissue sections areplaced on silane-coated in situ PCR slides and allowed to dry at roomtemperature for several days. The sections are then deparaffinized, incubatedin xylene and dried at room temperature.
The cells must be permeabilized to allow entry of reactants for thesubsequent RT-PCR analysis which is normally achieved by pre-treatingsections with proteinases such as proteinase K or pepsin. It must be stressedthat proteinase treatment should be optimized for each sample type, since
198 PCR
over-digestion will result in loss of cellular integrity while under-digestionwill render the sections impermeable to reaction components. A recom-mended starting point is incubation with 5 µg ml–1 proteinase K for 30 minat 37°C followed by heat inactivation at 95°C for 5 min.
As for standard RT-PCR, it is important to remove any contaminatingDNA which can potentially interfere with the RT-PCR reaction. The removalof DNA for in situ RT-PCR is extremely important since product detectionis not based on size determination, which eliminates the possibility of usingintron-spanning primers. Sections should therefore be treated with RNAse-free DNAse. At this stage it is also important to include RNAse inhibitorsto avoid RNA degradation. It has been shown that the precise adjustmentof the DNAse concentration and incubation time is essential for reliableand reproducible results when performing in situ RT-PCR (1). The efficacyof DNAse treatment varies between different cell lines and it is more appro-priate to fine-tune the incubation time rather than DNAse concentrations.
Attachment of samples to glass slides
As described above, in most cases in situ RT-PCR involves fixing samples toglass slides. It is important that samples remain attached to the glass slidesthroughout the entire experimental procedures. This requires the attach-ment procedure to be thermostable and chemically inert. The use ofsilane-coated slides for in situ PCR studies was first described by Dyanov andDzitoeva (11). It allows rapid and irreversible sample attachment where morethan 95% of the material remains attached after in situ PCR and in situhybridization procedures. For most applications, silane A-174 (Bind-Silane;Amersham Pharmacia Biotech) together with γ-methacryloxypropyl-trimethoxy-silane (Sigma Chemicals) provides a very strong adhesive for awide range of samples. For most single cell applications it is advisable toperform the fixation and permeabilization on the glass slides. Fixed andparaffin-embedded sections are generally easy to transfer to silane-coatedglass slides. The attachment of whole organs to glass slides has obvious sizelimitations. Whole organs from, for example, Drosophila melanogaster havebeen successfully attached to glass slides and subjected to in situ RT-PCRexperiments (11). The attachment process is essentially identical to theattachment procedure used for tissue sections.
In situ thermal cyclers
There are an increasing number of instruments available for in situ PCRapplications and these are designed to accept multiple slides and to provideoptimized thermal exchange for in situ applications (Chapter 3).
In situ first-strand cDNA synthesis
The in situ first-strand cDNA synthesis reaction is essentially identical tostandard first-strand cDNA synthesis described in Section 8.2. One limita-tion is that the absolute level of mRNA is not controllable and this may,in cases of low mRNA levels, result in a low yield of first-strand cDNAmolecules. This is normally not a problem and an example illustrating this
Analysis of gene expression 199

is the successful detection of insulin-like growth factor-IA (IGF-1A) mRNAfrom human lung tumor cell lines (12). IGF-1A mRNA levels are present atextremely low levels in these cell lines (13), which limited the use ofstandard in situ hybridization protocols and Northern blot experiments.However, by carefully optimizing in situ RT-PCR protocols it was possibleto detect IGF-1A mRNA species and detect their cellular location.
The in situ first-strand synthesis reaction can be performed using randomprimers, an oligo-dT primer, gene-specific primers, or a combination ofthese. Random primers will generate a vast array of differently sized single-stranded cDNA fragments which in turn will act as templates for the in situPCR reaction. In most cases the randomly generated DNA fragments willspan the region to be subsequently amplified; however it is possible thatthe majority of DNA fragments generated lie outside of the desired PCRamplification area. To ensure that the region of DNA to be subsequentlyamplified is present in the first-strand cDNA, it is recommended that eitheran oligo-dT or a gene-specific primer be used. As described in later parts ofthis Section, product detection can be achieved by indirect in situ hybridiza-tion or by using labeled primers for the in situ PCR. If in situ hybridizationis the method of choice we advise the use of both oligo-dT and randomprimers to maximize the efficiency of the first-strand reaction. However, iflabeled primers are to be used it is advisable to use gene-specific primers oran oligo-dT primer.
For the first-strand cDNA synthesis reaction a premix consisting ofreaction buffer, dNTPs, RNAse inhibitor, the primer or primer set of choiceat a concentration of 200 pmols and the reverse transcriptase. The premixis added to the sample on the in situ PCR slide and ‘sealed’ in a chamber.The chamber can be constructed with silicon spacers that surround thesample followed by sealing with a second glass slide. Alternately, special-ized in situ glass slides, cover slips, and cover discs can be purchased froma number of commercial sources such as PE Biosystems and Hybaid. Oncesealed the reaction should be allowed to proceed at 42°C for 1 h, or at ahigher temperature if a thermostable reverse transcriptase is used.
In situ PCR
After first-strand cDNA synthesis the cover disc should be removed, thesamples rinsed briefly in phosphate buffered saline (PBS) and the PCRpremix added to the sample, and the chamber resealed. The PCR premix isessentially the same as for standard PCR containing the reaction buffer,dNTPs, gene-specific primers, and Taq DNA polymerase. Although the insitu PCR cycling conditions will not vary a great deal from standard PCRconditions some degree of optimization of reactant concentrations andamplification conditions may be required. For example, the number ofamplification cycles required for in situ PCR is normally lower than forstandard PCR. In general, 15–20 cycles are sufficient, with an increase incycle number often having a detrimental outcome with the signal losingits ‘crisp’ appearance and becoming more diffuse due to excess final product(12).
Once the in situ PCR has been completed the reaction chamber shouldbe rinsed thoroughly with PBS. There are two main ways in which to detect
200 PCR

the in situ PCR-generated amplification products and these are described inthe following Sections.
In situ hybridization
In situ hybridization is well established and has been optimized for anumber of different biological systems. Some common applications includedetection of gene expression patterns at the cellular level, cellular detectionof pathogen DNA, detection of DNA rearrangements in single cells andanalysis of both legitimate and illegitimate recombination events. Thepower of in situ hybridization makes it an obvious method for productdetection as part of the in situ RT-PCR protocol.
The basic principle of in situ hybridization is the ability of a labeled nucleicacid fragment to ‘seek out’ and hybridize to a complementary nucleic acidsequence. The method is extremely versatile and by applying only slightmodifications it can be used to detect either perfectly homologous nucleicacid sequences (high-stringency conditions) or heterologous stretches ofnucleic acids (low-stringency conditions). When using in situ hybridizationas part of the in situ RT-PCR protocol, high-stringency conditions are alwaysrequired so that only DNA sequences generated as part of the in situ PCR aredetected. High-stringency conditions will also minimize nonspecific back-ground hybridization.
A variety of different labels, varying from radiolabels to enzymaticcomponents, can be conjugated to probes, with enzyme-conjugated probesbeing the most common for in situ RT-PCR applications.
Alkaline phosphatase
There are several different commercially available enzyme-linked labels thatcan be incorporated into nucleic acids. Alkaline phosphatase (AP) is widelyused for in situ RT-PCR applications and several chromogenic substratessuch as 5-bromo,4-chloro,3-indolyl phosphate (BCIP) and nitro blue tetra-zolium (NBT) are cleaved by the enzyme to generate a visible dense blueinsoluble precipitate. Both BCIP and NBT are stable as stock solutions. APcan be linked to DNA fragments in different ways. A common and efficientmethod is to conjugate avidin-bound biotinylated AP to the generatedprobe, and several manufacturers offer kits for such enzyme–DNA probeconjugation. Enzyme-linked probes can be stored for extended periods at4°C. The DNA probes for in situ hybridization reactions are normallygenerated by PCR amplification or restriction digestion of a plasmidfollowed by gel purification as described in Chapter 6.
Once the probe has been labeled the in situ hybridization reactions canbe performed. It is important to prehybridize the sample to minimizenonspecific hybridization. Prehybridization makes use of a blocking agentsuch as sonicated salmon sperm DNA or calf thymus DNA to ‘mask’ non-specific targets for the probe. The prehybridization buffer should be of thesame composition as the hybridization buffer with the exception of theadded probe. A ‘standard’ hybridization buffer, for an enzyme-conjugatedprobe, consists of 1 × PBS and sonicated ‘blocking’ DNA at a final concen-tration of 200 µg ml–1. Samples should be incubated in prehybridization
Analysis of gene expression 201

buffer at 37–40°C for 2–5 hours with gentle shaking followed by carefulrinsing in hybridization buffer and addition of fresh hybridization buffercontaining the denatured labeled probe. The labeled probe must be addedto the hybridization buffer (2–5 µg ml–1) before adding it to the sample toeliminate high probe concentrations at the site of application. Thehybridization reaction should be performed at the same temperature as theprehybridization for between 8 and 16 hours. However, to limit potentialloss of cellular integrity and minimize loss of enzyme activity theincubation times should be kept to a minimum.
Post-hybridization washes are important to remove nonspecificallybound probe molecules. The substrates NBT or BCIP can then be added inthe reaction buffer. AP requires a basic pH for optimal activity and thebuffer contains 100 mM NaCl, 50 mM MgCl2, and 100 mM Tris, pH 9.5.The reaction should be performed in the dark for between 10 and 15minutes or until visible staining appears. The reaction can be stopped byextensive washing in PBS containing 20 mM EDTA followed by viewingusing bright-field microscopy.
Indirect detection of incorporated labels
Another well-documented method of product detection as part of in situRT-PCR is the use of modified nucleotides followed by antibody detection.For in situ RT-PCR applications, as for many other applications, digoxigenin-11-2′-deoxyuridine-5′triphosphate (DIG-dUTP) is commonly used as themodified nucleotide. Digoxigenin is a steroid hapten found only in Digitalisplants so background problems are minimal. DIG-dUTP is incorporated intoDNA as part of the PCR (Chapter 3) and the amplification products can beanalyzed by agarose gel electrophoresis (Chapter 5) and gel purified (Chapter6) for use as a probe (Figure 8.6). The DIG-labeled probe can be used for thehybridization steps as described above, but normally at a higher temperaturesuch as 65°C. After hybridization and post-hybridization washes the samplesshould be incubated at room temperature with an AP-conjugated anti-DIGantibody for 1 h. After extensive washing with PBS, product detection isperformed using NBT or BCIP. One limitation when using anti-DIG anti-bodies is background staining in complex tissues due to antibody ‘trapping’.However, by including appropriate controls, false staining patterns cannormally be identified.
Labeled primers and direct detection
Recent developments have eliminated the need for post-PCR in situhybridization. Direct detection of the in situ RT-PCR products can beachieved using primers carrying a fluorescent label, usually fluorescein, inthe final PCR reaction (14). An example of the use of fluorescein-labeledprimers for final product detection is illustrated by detection of tumornecrosis factor (TNF). The mammary carcinoma cell line MCF-7 harbors theTNF-α gene but does not express TNF mRNA. To achieve TNF expressionthe cell line has to be transduced with a retrovirus containing the cDNAfor the human TNF gene. This system was chosen by Stein et al. (1) todevelop a one-step in situ RT-PCR protocol. To check for successful TNF
202 PCR

expression standard RT-PCR was performed showing specific amplificationof the TNF gene. For in situ RT-PCR the transduced cell line was grown,fixed and DNAse treated. M-MLV reverse transcriptase was used togetherwith random hexamer primers for the in situ RT reaction. For in situ PCR a3′-unlabeled TNF-specific primer was used together with a 5′-fluorescein-labeled TNF-specific primer, both at 1 µM concentration. The PCR wasperformed in situ using a GeneAmp In Situ System 1000 thermal cycler (PEBiosystems). Slides were washed in PBS and the final amplification productvisualized by fluorescent microscopy (absorbance wavelength 495 nm andemission wavelength 525 nm). This technique proved to be reliable andreproducible and did not generate any ‘false’ positive results due to non-specific amplification as shown when the nontransduced cell line was usedas a negative control. Also, as for any PCR, single primer controls, no primercontrols and no DNA polymerase controls were performed confirminggene-specific amplification. This elegant technique can be modified by
Analysis of gene expression 203
PCR amplification + DIG-dUTP
DIG DIG DIG
Hybridization
Incubate withanti-DIG antibody
DETECTION
AP AP AP
DIG DIG DIG
DIG DIG DIG
Figure 8.6
Labeling of a PCR-amplified probe with DIG as part of in situ RT-PCR indirectdetection of gene expression.

using different fluorescent labels for different primer sets, which shouldmake it possible to detect several expressed genes in one reaction.
As labeled primers can be expensive it is advisable to first produce an unla-beled primer set which should be used for the optimization of in situ PCRconditions. One of these primers can subsequently be used as the unlabeledprimer for the ‘real’ experiment. The cost of having one unlabeled primer isminimal if it ensures that the expensive labeled primer will functionefficiently. Optimization of conditions, such as annealing temperature andextension times, can be performed on genomic DNA or on in vitro generatedfirst-strand cDNA, which makes the procedure rapid and easy to perform.Once optimized, the conditions can be transferred to the in situ RT-PCRprotocol.
8.7 Microarrays
With the increasing availability of genome sequence information it hasnow become possible to interrogate the gene expression patterns inparticular cells. To investigate which genes are expressed in particular celltypes, or which genes are altered in their expression in response to someexternal stimulus or disease state, it would be useful to have a method forglobal analysis of gene expression. A DNA microarray represents an arrayof DNA sequences representing large numbers of genes, immobilized on asolid support, such as a nylon membrane, glass slide or silicon chip. Thearray must be prepared so that the identity of the sequence at each spot isknown. The DNA samples spotted onto the support can be either cDNAsequences, which can be produced by PCR, or oligonucleotides. In the caseof Affymetrix gene chips the oligonucleotides are actually synthesized insitu on the slide at defined locations.
The microarray chip is then interrogated by measuring the ability ofmRNA molecules to bind or hybridize to the DNA template that producedit. Since the array contains many DNA sequences it is possible to determinefrom a single experiment the expression levels of hundreds or thousandsof genes within a sample by measuring the amount of mRNA bound to eachspot (or sequence) on the array. Usually the experiment is performed as acompetition hybridization between two samples of mRNA, one from acontrol sample and one from the test sample. These mRNAs are used toproduce cDNA populations that are differently labeled by addition of afluorescent tag, say green for the control and red for the test sample. If thereis more of a particular sequence in the control sample, the spot will begreen, indicating that expression of the gene was reduced in the test sample.This is because more of the sequences that are available for hybridizationto the chip sequence will be labeled green, and so more of these sequenceswill hybridize compared with the lower concentration red sequences.Conversely if the gene shows increased expression in the test sample thespot will be red, while if there is no difference in expression between thetwo samples the spot will be yellow indicating roughly equal amounts ofboth sequences have hybridized to the chip.
After the hybridization process the microarray slide is placed in a scannerthat contains a laser to excite the fluorescent tags on the cDNAs; the result-ing fluorescence is detected by a microscope and camera that captures an
204 PCR
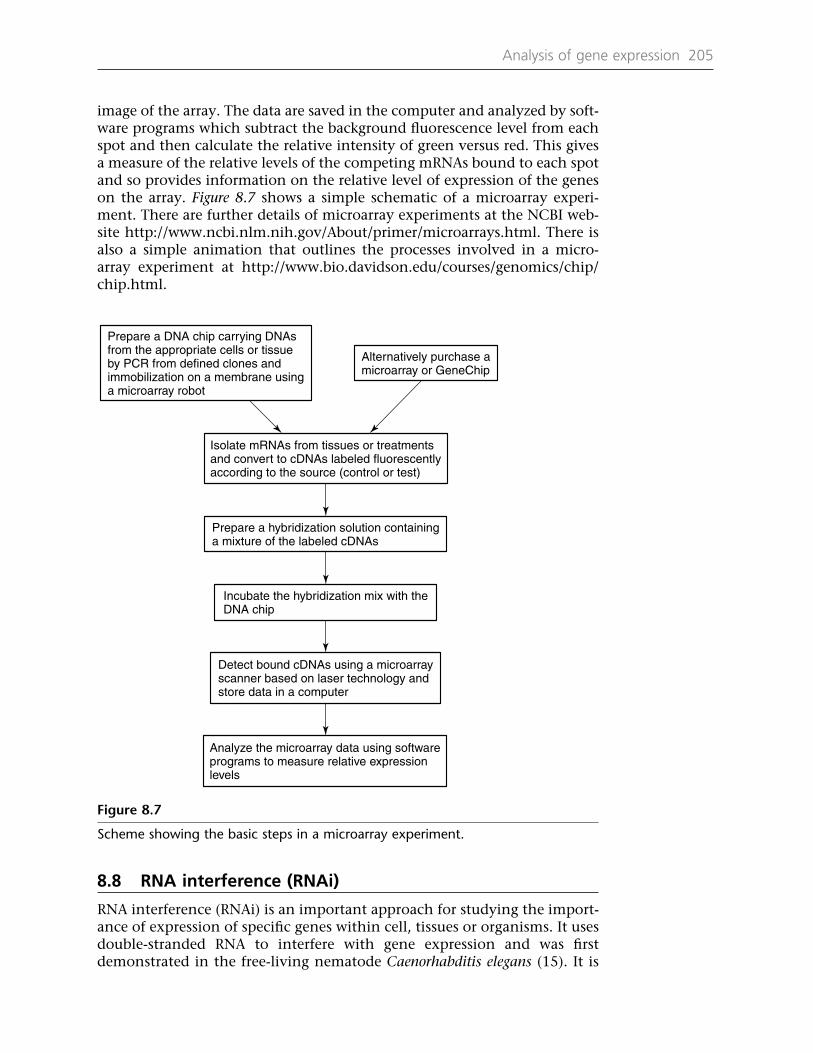
image of the array. The data are saved in the computer and analyzed by soft-ware programs which subtract the background fluorescence level from eachspot and then calculate the relative intensity of green versus red. This givesa measure of the relative levels of the competing mRNAs bound to each spotand so provides information on the relative level of expression of the geneson the array. Figure 8.7 shows a simple schematic of a microarray experi-ment. There are further details of microarray experiments at the NCBI web-site http://www.ncbi.nlm.nih.gov/About/primer/microarrays.html. There isalso a simple animation that outlines the processes involved in a micro-array experiment at http://www.bio.davidson.edu/courses/genomics/chip/chip.html.
Analysis of gene expression 205
Prepare a DNA chip carrying DNAsfrom the appropriate cells or tissueby PCR from defined clones andimmobilization on a membrane usinga microarray robot
Alternatively purchase amicroarray or GeneChip
Isolate mRNAs from tissues or treatmentsand convert to cDNAs labeled fluorescentlyaccording to the source (control or test)
Prepare a hybridization solution containinga mixture of the labeled cDNAs
Incubate the hybridization mix with theDNA chip
Detect bound cDNAs using a microarrayscanner based on laser technology andstore data in a computer
Analyze the microarray data using softwareprograms to measure relative expressionlevels
Figure 8.7
Scheme showing the basic steps in a microarray experiment.
8.8 RNA interference (RNAi)
RNA interference (RNAi) is an important approach for studying the import-ance of expression of specific genes within cell, tissues or organisms. It usesdouble-stranded RNA to interfere with gene expression and was firstdemonstrated in the free-living nematode Caenorhabditis elegans (15). It is

now known to be a phenomenon of wide occurrence in many organismsincluding mammals (16–18), plants (19,20), insects (21), protozoans (22)and fungi (23). It provides a potentially powerful investigative tool for thegenome-wide identification of gene function (24).
The basic mechanism of RNAi involves introducing a double-strandedRNA (dsRNA) of around 300–500 bp into a cell by microinjection or feed-ing. This dsRNA molecule is acted upon by an RNAse III-like enzyme calledDICER which results in a processive ATP-dependent cleavage to generate aseries of 21–23 bp duplexes that have 2 nt overhangs at their 3′-ends. Thesesmall interfering RNAs (siRNAs) can in some organisms be transmittedsystemically to other cells through the involvement of the SID protein, atransmembrane channel protein. The siRNA forms a complex with a furthernuclease called RNA-induced silencing complex (RISC). Once again, in anATP-dependent process the siRNA duplex is unwound into single strands,thus activating RISC which then identifies homologous mRNA transcriptsby base pairing with the single-strand siRNA and cleaving the mRNA andleading to mRNA degradation.
In order to generate the dsRNA it is first necessary to start with cDNAclones. These could be ESTs (Chapter 10) or clones isolated from a custom-made library. The usual approach is to use PCR to amplify a fragment of~500 bp and to clone this into a vector containing two T7 promoters suchas pPD129.36. By restricting aliquots of the recombinant vector adjacent toone or other of the T7 promoters it is possible to create linear templates forproduction of either the sense or the antisense RNA strand of the sequenceby using T7 RNA polymerase. These RNA samples are then mixed andannealed to give double-stranded RNA that can be introduced into the testcells or organisms. For mammalian cell culture experiments it is now morecommon to use siRNAs that are prepared synthetically to induce an RNAieffect, as these appear to be more efficient in such systems and are morereadily taken up by the cells. For many organisms, however, siRNAs do notmediate an RNAi effect and so longer dsRNAs are essential.
In most RNAi experiments one measures a phenotype mediated by thedsRNA compared with a treatment with a control RNA from a nontargetgene. This allows one to discount any nonspecific effects due to treatmentwith any dsRNA, and to identify those specifically mediated by the testsequence. In some cases, however, and particularly in mammalian cellculture experiments, it can be useful to measure changes in gene expres-sion mediated by the treatment. The more sensitive and appropriateapproach to such analysis is real-time PCR, described in detail in Chapter 9.
References1. Stein U, Walther W, Wendt J, Schild TA (1997) In situ RT-PCR using fluorescence-
labeled primers. Biotechniques 23: 194–195.2. Franz O, Bruchhaus I, Roeder T (1999) Verification of differential gene
transcription using virtual northern blotting. Nucleic Acids Res 27: e3.3. Siebert PD, Kellogg DE (1995) PCR MIMICs: competitive DNA fragments for use
in quantitative PCR. In McPherson MJ, Hames BD, Taylor GR (eds) PCR 2: APractical Approach, pp. 135–148. Oxford University Press, Oxford, UK.
4. Liang P, Pardee AB (1992) Differential display of eukaryotic messenger RNA bymeans of the polymerase chain reaction. Science 257: 967–971.
206 PCR

5. Liang P, Zhu W, Zhang X, Guo Z, O’Connell RP, Averboukh L, Wang F, PardeeAB (1994) Differential display using one-base anchored oligo-dT primers. NucleicAcids Res 22: 5763–5764.
6. Martin KJ, Pardee AB (1999) Principles of differential display. Methods Enzymol303: 234–257.
7. Brown TA (1994) DNA Sequencing: The Basics. BIOS Scientific Publishers, Oxford,UK.
8. Kito K, Ito T, Sakaki Y (1997) Fluorescent differential display analysis of geneexpression in differentiating neuroblastoma cells. Gene 184: 73–81.
9. Kuno N, Muramatsu T, Hamazato F, Furuya M (2000) Identification by large-scale screening of phytochrome-regulated genes in etiolated seedlings ofArabidopsis using a fluorescent differential display technique. Plant Physiol 122:15–24.
10. Yoshikawa Y, Mukai H, Asada K, Hino F, Kato I (1998) Differential display withcarboxy-X-rhodamine-labeled primers and the selection of differentially ampli-fied cDNA fragments without cloning. Anal Biochem 256: 82–91.
11. Dyanov HM, Dzitoeva SG (1995) Method for attachment of microscopicpreparations on glass for in situ hybridization, PRINS and in situ PCR studies.Biotechniques 18: 822–824.
12. Martinez A, Miller MJ, Quinn K, Unsworth EJ, Ebina M, Cuttitta F (1995) Non-radioactive localization of nucleic acids by direct in situ PCR and in situ RT-PCRin paraffin-embedded sections. J Histochem Cytochem 43: 739–747.
13. Reeve JG, Brinkman A, Hughes S, Mitchell J, Schwander J, Bleehen NM (1992)Expression of insulinlike growth factor (IGF) and IGF-binding protein genes inhuman lung tumor cell lines. J Natl Cancer Inst 84: 628–634.
14. Long AA, Komminoth P, Lee E, Wolfe HJ (1993) Comparison of indirect anddirect in-situ polymerase chain reaction in cell preparations and tissue sections.Detection of viral DNA, gene rearrangements and chromosomal translocations.Histochemistry 99: 151–162.
15. Fire A, Xu SQ, Montgomery MK, Kostas SA, Driver SE, Mello CC (1998) Potentand specific genetic interference by double-stranded RNA in Caenorhabditiselegans. Nature 391: 806–811.
16. Zamore PD, Tuschl T, Sharp PA, Bartel DP (2000) RNAi: double-stranded RNAdirects the ATP-dependent cleavage of mRNA at 21 to 23 nucleotide intervals.Cell 101: 25–33.
17. Hannon GJ (2002) RNA interference. Nature 418: 244–251.18. Silva J, Chang K, Hannon GJ, Rivas FV (2004) RNA-interference-based functional
genomics in mammalian cells: reverse genetics coming of age. Oncogene 23:8401–8409.
19. Waterhouse PM, Graham MW, Wang MB (1998) Virus resistance and genesilencing in plants can be induced by simultaneous expression of sense andantisense RNA. Proc Natl Acad Sci USA 95: 13959–13964.
20. Jorgensen RA, Cluster PD, English J, Que Q, Napoli CA (1996) Chalconesynthase cosuppression phenotypes in petunia flowers: comparison of sense vsantisense constructs and single-copy vs complex T-DNA sequences. Plant MolBiol 31: 957–973.
21. Kennerdell JR, Carthew RW (1998) Use of dsRNA-mediated genetic interferenceto demonstrate that frizzled and frizzled 2 act in the wingless pathway. Cell 95:1017–1026.
22. Ngo H, Tschudi C, Gull K, Ullu E (1998) Double-stranded RNA induces mRNAdegradation in Trypanosoma brucei. Proc Natl Acad Sci USA 95: 14687–14692.
23. Cottrell TR, Doering TL (2003) Silence of the strands: RNA interference ineukaryotic pathogens. Trends Microbiol 11: 37–43.
24. Kamath RS, Ahringer J (2003) Genome wide RNAi screening in Caenorhadbitiselegans. Methods Enzymol 30: 313–321.
Analysis of gene expression 207

Protocol 8.1 Reversetranscriptase reaction
EQUIPMENTAdjustable heating block or water bath
Gel electrophoresis tank
MATERIALS AND REAGENTSRNA isolation kit (e.g. Qiagen RNeasy minikit)
First-strand cDNA synthesis kit (e.g. ProSTAR First-strand RT-PCR Kit, Stratagene)
or
Reverse transcriptase buffer: (AMV 10 × RT buffer; 25 mM Tris-HCl pH 8.3, 50 mM KCl, 2 mMDTT, 5 mM MgCl2)
10 mM dNTP mix
Random hexamer, gene-specific or oligo-dT primer
RNase inhibitor
Reverse transcriptase (e.g. Qiagen)
0.8% agarose (100 ml; 0.8 g of agarose in 100 ml of 1 × TAE)
1. Add to a reaction tube the following in order:● 1–5 µg of RNA (the amount of RNA used for the RT
reaction depends on the abundance of the targettranscript);
● 1 mM of each dNTP;● 50–100 pmol of primer (random hexamers, gene-specific
primers, or oligo-dT primers);● 1–5 units of an RNase inhibitor;● water up to 49 µl.
2. Heat the reactions to 90°C for 5 min. (Heating the RNAeliminates RNA secondary structures and in turn increases thepriming efficiency.)
3. Add 50–200 units of reverse transcriptase.
4. Incubate reactions at 42°C for 1 h.
5. Heat inactivate the reaction at 90°C for 10 min. (Heating thereaction to 90°C inactivates the reverse transcriptase anddenatures remaining RNA–DNA hybrids.)
208 PCR

Real-time RT-PCR
9.1 Introduction
The importance of mRNA (transcript) quantification and profiling in basicresearch, molecular diagnosis and biotechnology has led to a rapid advancein quantitative RT-PCR technologies in terms of instrumentation, auto-mation and chemistries. Real-time RT-PCR represents an advance which hasseveral advantages over conventional quantitative RT-PCR. The mainadvantage of real-time RT-PCR is that it sensitively and reproduciblyquantifies the initial amount of starting template (transcript) by monitor-ing PCR amplification product (amplicon) accumulation during each PCRcycle, in contrast to conventional methods which detect the final endproduct. Furthermore, real-time RT-PCR is rapid, it is possible to analyzeseveral transcripts (genes) simultaneously and post-PCR quantificationprocedures are eliminated. Because post-PCR analysis is eliminated carry-over contamination is reduced and a higher throughput can be achieved.In addition, the dynamic range of real-time RT-PCR is higher (up to 1010-fold) than conventional quantitative RT-PCR (1000-fold), which means thata wide range of amplification products can be accurately and reproduciblyquantified. Although real-time RT-PCR does have numerous advantagesover conventional methods there are also some disadvantages: higher costsand the inability to detect amplicon size can make differentiation betweencDNA and DNA amplification difficult.
This Chapter deals with various aspects of real-time RT-PCR includingdetection systems and chemistries, oligonucleotide primer and probedesign, real-time thermal cyclers, quantification and control selection,common pitfalls and applications. There is also a glossary of frequently usedterms (Table 9.1) which will help you to familiarize yourself with the jargonof real-time RT-PCR.
9.2 Basic principles of real-time RT-PCR
The basic principle of real-time RT-PCR is much like conventional RT-PCR:cDNA is synthesized from mRNA using reverse transcriptase followed bycDNA PCR amplification and amplicon quantification. However, there aretwo fundamental differences: (i) amplicon accumulation is detected andquantified using a fluorescent reporter and not by conventional gel electro-phoresis (Chapter 5); and (ii) amplicon accumulation is measured duringeach PCR cycle in contrast to standard end-point detection (Chapters 1 and5). In addition, real-time RT-PCR is performed in 96-well microtiter platesand the fluorescent signal (amplicon accumulation) is detected and quanti-fied using a real-time PCR thermocycler (Section 9.5).
A real-time RT-PCR reaction contains all the components used forconventional RT-PCR (Chapter 8) but in addition contains a fluorescent
9

reporter either in the form of a fluorescent DNA-binding dye or as afluorescent oligonucleotide primer (Section 9.3). Because the fluorescentreporter only fluoresces when associated with the product amplicon(Section 9.3), the increase in recorded fluorescence signal during ampli-fication is in direct proportion to the amount of amplification product inthe reaction. So how can this be related back to the initial startingamount of nucleic acid template in your sample? Because the intensity ofthe fluorescence emission is monitored and recorded during each PCRcycle it is possible to identify the exact PCR cycle at which thefluorescent signal significantly increases, and this correlates to the initialstarting amount of the template. One easy way of thinking about this isthat the higher the template concentration the earlier a significantincrease in fluorescence will be observed. So what is a significant increasein fluorescence? During the early stages of the amplification reaction(3–15 cycles as a general rule) the fluorescence signal will show no orlittle change and this is taken as the background fluorescence or baseline(Table 9.1). By setting a fixed fluorescence threshold value above thebaseline a significant increase in fluorescence is recorded when the signal
210 PCR
Table 9.1 Glossary of frequently used terms
Term Explanation
Amplification plot A plot showing the cycle number versus the fluorescent signal whichcorrelates with the initial amount of RNA during the exponential phase of thePCR amplification
Baseline The initial cycles of PCR when the fluorescent signal shows no or little changeCT value/number The threshold cycle (CT) indicates the cycle number where the reaction
fluorescence crosses the threshold. This reflects the point in the reactionwhen sufficient amplicons have been generated to give a significantfluorescent signal over the baseline
Linear dynamic range Range of initial template concentration giving accurate CT valuesMelting curve analysis The melting point (Tm) of double-stranded DNA is the temperature at which
50% of the DNA is single-stranded and this temperature depends on theDNA length and GC content. When using SYBR® Green I a sudden decreasein fluorescence is detected when Tm is reached (dissociation of DNA strandsand release of SYBR® Green I)
Multiplex analysis Multiple RNA target analysis within one reaction well using gene-specificprobes containing different reporter fluorophores
Passive reference An internal reference dye to which the reporter dye can be normalizedduring analysis to correct for fluctuations between reaction wells. The mostcommonly used reference dye is ROX
Rn value The normalized reporter (Rn) value represents the reporter dye fluorescenceemission intensity divided by the passive reference dye. The Rn+ value is theRn of a complete reaction sample whilst the Rn– value is the Rn of anunreacted sample. Rn– values are obtained during early amplification cycles(baseline)
∆Rn (Rn+) – (Rn–) = the fluorescent signal intensity generated at each time pointduring PCR given a certain set of conditions
Standard curve A curve consisting of CT values plotted against the log of standardconcentrations. The concentration/quantity of unknown samples areextrapolated from the standard curve

intensity is higher than the threshold value, which in turn determinesthe threshold cycle or CT (Table 9.1; Figure 9.1(A)). By knowing the CT
value for a reaction and by generating a standard cDNA concentrationcurve (fluorescence vs cDNA concentration) the concentration of theinitial starting template can be extrapolated (Figure 9.1(B)). Although theoverall principle of real-time RT-PCR can sound a little complicated thetechnique is relatively simple because of recent improvements inchemistries and instrumentation.
Real-time RT-PCR 211
(A)
(B)
Flu
ores
cenc
e
CT = 12 CT = 21
CT = 26Threshold
Baseline
Sample 1Sample 2Sample 3
Cycle number
0 2 4 6 8 10 12 14 16 18 20 22 24 26 28 30 32 34 36 38 40
40
35
30
25
20
15
10
50 2 4 6 8 10
Log (copy number)
CT
Sample 1
Sample 2
Sample 3
Figure 9.1
A schematic diagram showing a typical real-time RT-PCR reaction data set fromthree unknown samples. (A) The measured fluorescence signal at eachamplification cycle is plotted against cycle number. The baseline where there is noor little change in fluorescence is indicated, as is the threshold value. The CT valuefor each sample represents the cycle number when the fluorescence signal ishigher than the threshold value. (B) A standard curve showing CT versus the log ofthe copy number of standard cDNA samples. The initial starting concentration(copy number) of samples 1, 2 and 3 can be determined based on their CT values.From this data set it is clear that sample 1 contains more starting template thansample 2 and that sample 3 has the least amount of starting template.

9.3 Detection methods
During the last 5 years there have been several advances in real-time RT-PCRdetection methods in terms of both instrumentation and chemistries. Twogeneral amplicon-detection methods are used which are based on eitherfluorescent DNA-binding dyes or fluorescent probes. The different detec-tion systems, and their advantages and disadvantages, will now bedescribed in detail.
SYBR® Green I
SYBR® Green I is a fluorescent DNA intercalating agent that binds to theminor groove of double-stranded DNA and upon excitation (498 nm) emitslight (522 nm) that can be recorded by real-time PCR thermocyclers(Section 9.5). Because SYBR® Green I does not bind to single-stranded DNAand because the dye only emits weak fluorescence in solution, SYBR® GreenI is widely used as a fluorescent reporter in real-time RT-PCR experimentsto monitor double-stranded amplicon production (Figure 9.2). SYBR® GreenI has numerous advantages over fluorescent probe approaches (covered inthe remainder of this Section). First, SYBR® Green I is a nonsequence-specific dye which means that it will bind to any double-stranded piece ofDNA. The advantage of this feature is that SYBR® Green I can be used forthe amplification and monitoring of any gene. Second, because of the
212 PCR
Denature
Anneal
Extension
Taq
Figure 9.2
A schematic diagram showing how SYBR® Green I acts as a double-stranded-specific fluorescent reporter during PCR amplification. During the denaturationstep when the DNA is single-stranded SYBR® Green I is free in solution in anonfluorescent state ( ). Upon annealing of the primer to the target templateand during the extension phase the nonfluorescent SYBR® Green I ( ) binds tothe double-stranded amplicon and becomes fluorescent ( ).

nonsequence-specific nature of SYBR® Green I it represents a cheap alter-native to fluorescent probes. Third, SYBR® Green I is simple to use. Fourth,SYBR® Green I is temperature stable and does not interfere with DNApolymerase.
Although the advantages of SYBR® Green I are clear there are also a fewdisadvantages compared with the fluorescent probe approach. BecauseSYBR® Green I binds to any double-stranded piece of DNA it will also bindto primer-dimers and any nonspecific amplification product. However, thenonspecific binding to primer-dimers can be overcome by melting curveanalysis (Table 9.1) which will determine at which temperature primer-dimers are denatured (and therefore will stop fluorescing), allowing theidentification of the target amplicon at an appropriate higher temperature.Melting curve analysis can also be used to eliminate the detection ofnonspecific amplification products. Because of these potential problemsSYBR® Green I-based real-time RT-PCR does need optimization and some-times independent verification. Another potential problem that may occuris related to amplicon size. Long amplicons can generate a very strongfluorescence signal which may in turn saturate the camera situated insidethe real-time PCR thermocycler. However, this is a minor problem since thesize of the amplicon can easily be controlled by designing oligonucleotideprimers that will amplify a 200–300 bp amplicon. SYBR® Green I is alsomost frequently used for single-amplicon monitoring (singleplex reaction)because of its nonsequence specificity, although multiplex reactions arepossible if it is combined with melting curve analysis.
General principle of fluorescent probes
In contrast to fluorescent DNA-binding dyes such as SYBR® Green I,fluorescent probe approaches are based on amplicon detection using DNAsequence-specific oligonucleotide probes. These probes contain both afluorogenic dye and a quencher dye and are designed to hybridize to thetarget gene either in between the two oligonucleotide primers used for thePCR amplification (TaqMan and Molecular Beacons; see below) or as partof one of the oligonucleotide primers used for the amplification reaction(Scorpions; see below). The general principle of amplicon detection usingsuch probes is based on the fact that if a fluorescent dye is in closeproximity to a quencher dye the fluorescent signal generated by thefluorescent dye in response to excitation is ‘absorbed’ by the nearbyquenching dye, resulting in no fluorescent signal. This phenomenon istermed fluorescence resonance energy transfer (FRET). However, upon PCRamplification the fluorescent dye and the quenching dye become spatiallyseparated either by probe displacement (TaqMan) or by probe rearrange-ment (Molecular Beacons and Scorpions), resulting in loss of FRETbetween the fluorescent dye and quenching dye, ultimately producing afluorescent signal.
There are two main advantages of fluorescent probes over fluorescentDNA-binding dyes. First, because of the sequence specificity between thefluorescent probe and the target gene, detection of nonspecific ampli-fication products and primer-dimers is eliminated. This reduces the needfor extensive PCR optimization as is the case when using fluorescent DNA-
Real-time RT-PCR 213

binding dyes. Second, multiple probes containing different fluorogenic dyesemitting different wavelengths of light can be used in a single reaction,allowing for the detection of several amplicons simultaneously (multiplex-ing). As with any system, fluorescent probes also have disadvantages.Firstly, the coupling of a fluorescent dye and a quenching dye to anoligonucleotide can be costly, and secondly, the designed oligonucleotideprobe can only be used for a single target gene. If the transcript levels ofseveral genes are to be analyzed the use of fluorescent probes can soonbecome a costly exercise.
TaqMan probes
The TaqMan real-time RT-PCR assay was first reported in 1996 in two articlespublished by Williams’ research group at Genentech in California (1,2) andis used widely in both basic and applied research programmes. The TaqManassay combines the fact that Taq DNA polymerase has 5′→3′ exonucleaseactivity and that dual-labeled oligonucleotide probes only fluoresce whencleaved/degraded by this exonuclease activity. In a typical TaqMan reactionthree oligonucleotides are included: one forward primer, one reverse primerand one nonextendable internal TaqMan probe (Figure 9.3). The TaqManprobe is a standard oligonucleotide which has a covalently attachedfluorescent reporter dye, such as FAM (6-carboxyfluorescein) at its 5′-end anda quencher dye, such as TAMRA (6-carboxytetramethylrhodamine) at its3′-end (Figure 9.3). In addition to the most commonly used FAM and TAMRAdyes, 4,7,2′,4′,5′,7′-hexachloro-6-carboxyfluorescein (HEX) and 4,7,2′,7-tetrachloro-6-carboxyfluorescein (TET) can be used as fluorescent dyestogether with rhodamine or DABCYL as the 3′-quencher. When the TaqManprobe is intact, either free in solution or hybridized to its target DNA, thereporter dye fluorescence is absorbed by the quencher dye, because theirclose proximity allows FRET to occur (Figure 9.3). However, as the PCRreaction proceeds, the Taq polymerase will reach the 5′-end of the TaqManprobe and will strand displace it from the template. The 5′→3′ exonucleaseactivity of the Taq polymerase will cleave the 5′-FAM dye from the probethereby liberating the fluorescent reporter from its association with thequencher dye which leads to an increase in fluorescence (Figure 9.3). Theincrease in fluorescence is measured during each cycle and is proportionalto the rate of probe displacement and hence the amount of amplificationproduct in the reaction.
Although the TaqMan assay uses universal thermal cycling parametersand PCR reaction conditions, care should be taken when designing aTaqMan oligonucleotide probe. TaqMan probes should generally belonger than the amplification primers and typically between 20 and 30nucleotides. In addition, the melting temperature (Tm) of a TaqManoligonucleotide should be approximately 10°C higher than for theamplification primers, which allows hybridization to the target geneduring the extension step. This is critical to ensure that the emittedfluorescence after TaqMan probe displacement is directly proportional tothe amount of target DNA present in the reaction. Another critical factorwhen designing TaqMan probes is to avoid guanidine at the 5′-end
214 PCR

because this results in quenching of the fluorescent signal even afterprobe cleavage. Furthermore, the probe should contain more cytosinethan guanidine and this can be achieved by designing either a sense or anantisense probe. Another critical factor when designing TaqMan probes isthe possibility of coamplification of genomic DNA together with thetarget cDNA. To avoid this the probe should be designed so that it spanstwo exons, so that only correctly spliced versions of the cDNA areamplified. However, if the DNA sequence of the target cDNA has not been
Real-time RT-PCR 215
Denaturation
Extension and TaqManprobe hydrolysis
Target gene
ExcitationNo fluorescenceFRET
FAM
Taq
TaqManprobe
TAMRAProbeannealing
TAMRA
FAM
Target gene
Taq
Taq
Primer 2
Primer 1
Figure 9.3
A schematic diagram showing the principle of real-time RT-PCR using the TaqManapproach. In addition to general PCR components the reaction also contains atarget gene-specific probe containing a fluorescent dye ( ) at the 5′-end and aquencher dye ( ) at the 3′-end. During the annealing step both the primersand the probe anneal to the target gene and because the quencher dye is in closeproximity to the fluorescent reporter dye (on the same oligonucleotide) nofluorescence is generated. During the extension step the 5′→3′ exonucleaseactivity of Taq DNA polymerase displaces (degrades) the TaqMan probe resultingin loss of quenching and a fluorescence signal is generated ( ).FA
M
TAMRA
FAM

determined the only way to avoid genomic DNA amplification is to treatthe RNA with RNAse-free DNAse.
Once the TaqMan probe has been designed, following the simple guide-lines described above, little optimization is needed. Despite this, TaqManprobes can be expensive to synthesize and a separate probe is needed foreach target gene. In addition, the TaqMan approach is not as sensitive asother more recent approaches such as molecular beacons (see below) andoften has high background fluorescence.
Molecular beacons
As for TaqMan probes, molecular beacons contain a fluorescent and aquenching dye. Although molecular beacons make use of the fact that FREToccurs between a fluorescent and quenching dye when in close proximity,their design varies from that of TaqMan probes. During the annealing stepthe molecular beacon hybridizes to the target DNA, thereby separating thefluorescent reporter and the quenching dye, resulting in loss of FRET andan increase in fluorescence. During the PCR, molecular beacons remainintact and rehybridize during each cycle and because of this the fluorescenceemission after hybridization is proportional to the concentration of targetDNA (Figure 9.4).
Molecular beacons contain two parts: the probe, which can specificallyhybridize to the target DNA; and the stem, which forms a hairpin structurewhilst free in solution, ensuring that the fluorescent dye and the quench-ing dye are in close proximity, allowing FRET to occur (Figure 9.4). The firstconsideration when designing a molecular beacon is the selection ofthe probe sequence. The probe sequence can be any sequence within theamplicon that lies between the two oligonucleotide primers used for theamplification. The probe sequence should be between 15 and 30nucleotides long and should be able to hybridize to the target DNA duringthe annealing phase of the PCR (Figure 9.4). The probe length may vary butshould allow the dissociation from the target DNA at temperatures of7–10°C higher than the annealing temperature. It is important to consideronly the probe sequence of the molecular beacon and not the arms whencalculating the Tm, because the arms are not involved in the hybridizationevent.
Once the probe sequence has been selected, two complementary armsequences are designed and added on either side of the probe sequence. Thetwo arm sequences allow molecular beacons to adopt a hairpin structure thatforms a stable stem (Figure 9.4). The length of the arms may vary but shortarms, containing 5–8 base pairs, have been shown to be stable in thepresence of 1 mM MgCl2 (3). Although the more economical solution is todesign short arms, it is important that the arms have the correct length andDNA sequence to allow for a Tm similar to the probe (i.e. 7–10°C higher thanthe annealing temperature). It is advisable to design the arms with a75–100% GC content, which will keep the length to a minimum; however,as for TaqMan probes a guanidine residue should not be present next to thefluorescent reporter as this quenches the fluorophore. Because the hairpinstructure of a molecular beacon is formed by an intramolecular hybridiza-tion event the GC rule (Chapter 3) cannot be applied to calculate the Tm.
216 PCR

To calculate the Tm DNA folding software should be used, such as the ZukerDNA folding program (http://www.bioinfo.rpi.edu/applications/mfold/ old/dna/form1.cgi). As a rule of thumb a five base pair-long GC-rich stem willmelt between 55 and 60°C and a six base pair-long GC-rich stem will meltbetween 60 and 65°C, whilst a seven base pair-long GC-rich stem will meltbetween 65 and 70°C. The Zuker DNA folding program can also be used toassess the probability of the free molecular beacon forming a hairpin struc-ture rather than alternative structures. If alternative structures form, thefluorescent reporter and the fluorescent quencher may not be placed in theimmediate vicinity, resulting in background fluorescence. Alternatively,longer stems may form, resulting in slow binding to the target DNA.
In parallel with the molecular beacon design the amplification primersshould also be considered and it is important that there is no comple-mentarity between the amplification primers and the molecular beacon.This may cause the molecular beacon to hybridize to one of the primers,resulting in primer extension by the DNA polymerase. It is also advisableto design amplification primers that will result in an amplicon of approxi-
Real-time RT-PCR 217
Denaturation
Nonfluorescentmolecular beacon
Target gene
FRET
FAM
DABCYL
DABCYL
AnnealingLoss of FRET
FAM
Figure 9.4
A schematic diagram showing the principle of molecular beacons as a reporterduring real-time RT-PCR. In addition to general PCR components the reaction alsocontains a target gene-specific molecular beacon containing a fluorescent dye( ) at the 5′-end and a quencher dye ( ) at the 3′-end. Because themolecular beacon adopts a hairpin stem structure when free in solution thefluorescent dye and the quencher dye are in close proximity, allowing FRET tooccur resulting in no fluorescence. During the annealing step the hairpin structuredissolves and the molecular beacon anneals to the target amplicon resulting inloss of FRET and increased fluorescence ( ).FA
M
DABCYLFAM

mately 150 base pairs as this will make the amplification reaction more effi-cient. In addition a shorter amplicon allows the molecular beacon tocompete for its target more efficiently, which in turn will produce a strongerfluorescent signal. A useful review of molecular beacons is provided athttp://www.bio.davidson.edu/courses/Molbio/MolStudents/spring2000/palma/beacons.html. Reagents are available from Sigma-Aldrich.
Although molecular beacons have the advantage of lower backgroundfluorescence and greater specificity compared with TaqMan probes, theycan be difficult to design and optimize. In light of this, Premier BiosoftInternational (http://www.premierbiosoft.com) have developed a softwarepackage that will design molecular beacons automatically. A free trialversion can be downloaded from the Premier Biosoft International website;however, once the trial version expires the price of this software is in theregion of 2 000 US dollars.
Scorpions
Scorpion probes are similar to molecular beacons in that they form a hair-pin structure when free in solution; however, their design and mode ofaction differs substantially. Scorpion probes are bi-functional moleculesthat contain a PCR amplification primer covalently attached to a probesequence. As for molecular beacons, the probe sequence is held in a hair-pin configuration by complementary arm sequences (Figure 9.5), ensuringthat the fluorescent reporter, such as FAM, and the fluorescent quencher,such as DABCYL, are in close proximity, allowing FRET to occur (Figure 9.5).However, in contrast to molecular beacons the hairpin structure ofscorpions is attached to the 5′-end of a target gene-specific oligonucleotideprimer (Figure 9.5). During the annealing and extension stage of the PCRthe scorpion primer anneals to the target DNA and the primer is extendedby Taq DNA polymerase to form an amplicon (Figure 9.5). To ensure thatthe DNA polymerase does not read through the scorpion primer, and bydoing so copy the probe region, a nonamplifiable monomer (blocker) isadded between the fluorescent quencher and the primer (Figure 9.5). Afterthe extension phase and a second round of denaturation, the hairpinstructure opens up, allowing the probe, which contains an amplicon-specific sequence, to curl back and hybridize to the target sequence in thePCR product (Figure 9.5). Because the hairpin structure requires less energyto denature than the newly formed DNA duplex, the sequence-specificprobe hybridizes to the target amplicon with great speed and accuracy. Theopening up of the hairpin loop prevents the fluorescence reporter frombeing quenched and an increase in fluorescence is observed.
The design of the amplicon-specific probe and the stem sequences inscorpions is essentially the same as for molecular beacons (see above). First,the probe sequence should have a Tm approximately 7–10°C lower than theTm of the hairpin stem. Second, the stem sequences should be between fiveand eight base pairs, GC rich but avoiding a guanidine residue next to thefluorescent reporter. Third, the probe sequence should be between 15 and30 nucleotides long. In addition to these considerations the target for theprobe should not be more than 11 nucleotides from the 3′-end of thescorpion.
218 PCR

Real-time RT-PCR 219
Scorpion
+
1st strand target cDNA
FRETBlocker
Scorpion annealingand extension
2nd denaturationand annealing
FAMDABCYL
Taq
FAM
DA
BC
YL
FAM
DA
BC
YL
FRET
Am
plico
n-specific sequence
Figure 9.5
A schematic diagram showing the principle of a scorpion as a reporter during real-time RT-PCR. In addition to general components the reaction also contains atarget gene-specific scorpion probe containing a fluorescent dye ( ) at the 5′-end and a quencher dye ( ) at the 3′-end. As for molecular beacons thescorpion adopts a hairpin stem structure when free in solution, ensuring that thefluorescent dye and the quencher dye are in close proximity. This allows FRET tooccur, resulting in no fluorescence. In contrast to molecular beacons the hairpinstructure of a scorpion probe is attached to the 5′-end of a target gene-specificoligonucleotide primer. During the PCR annealing and extension stage thescorpion primer anneals to the target DNA and the primer is extended by TaqDNA polymerase to form an amplicon. To ensure that the DNA polymerase doesnot read through the scorpion primer a nonamplifiable blocker (�) is placedbetween the fluorescent quencher and the gene-specific primer. After a secondround of denaturation, the hairpin structure dissolves. This allows the probe,which contains an amplicon-specific sequence, to curl back and hybridize to thetarget sequence in the PCR product, resulting in loss of FRET and increasedfluorescence ( ).FAM
DABCYL
FAM

There are several advantages of scorpions over molecular beacons. Incontrast to molecular beacons and the TaqMan approach, scorpion assaysonly require one probe. Because the tail of the scorpion and the PCR productis part of the same DNA strand the reaction leading to a fluorescent signalis unimolecular, in sharp contrast to the bimolecular collisions needed byTaqMan and molecular beacons. The scorpion unimolecular arrangementeffectively means that the reaction leading to signal generation occursalmost spontaneously, before any competing reactions such as targetamplicon reannealing. This in turn leads to stronger signal generation andless background fluorescence. Furthermore, because of the rapid reactionkinetics there is no need for long extension periods. The unimoleculararrangement also results in increased discrimination and specificity andscorpions are ideal for SNP testing (Chapter 11). Although scorpions arerelatively expensive to make they do not suffer from temperamental probedesign as do molecular beacons. Scorpions are also compatible with anycommercial fluorescent dye and, together with the low backgroundfluorescence, extended multiplexing can be performed combining four ormore separate reactions.
LightUp probes
LightUp probes (LightUp Technologies, Sweden) represent the simplestmethod for monitoring amplicon accumulation during real-time RT-PCR.LightUp probes are based on peptide nucleic acid (PNA), which is a mimicof DNA (4) that contains an asymmetric cyanine dye (5). Upon PNA probehybridization the dye binds to the target amplicon, resulting in a dramaticincrease in fluorescence. The increase in fluorescence is so great that it canbe seen by the naked eye in a test tube.
PNA consists of a N-(2-aminoethyl)glycine backbone to which the basesare attached and PNA hybridizes to DNA and RNA in an anti-parallelfashion following standard Watson and Crick rules. There are several advan-tages of PNA over DNA. First, DNA hybridization requires the presence ofsalt to balance the phosphate backbone negative charge whilst PNA doesnot require salt due to its neutral backbone. Second, PNA has greatersequence specificity than DNA, which allows the use of shorter PNAoligomers as probes. Third, single-stranded PNA is completely resistant toenzymes such as nucleases, peptidases and proteases, which commonlydegrade DNA. LightUp probes take advantage of these facts and althoughtheir use in real-time RT-PCR is not yet extensive (probably due to theirrelatively high cost), they have several benefits over other amplicondetection systems. Since LightUp probes contain only a single fluorescentdye a simple increase in fluorescence is measured, in contrast to a changein fluorescence energy distribution when using energy transfer probes suchas TaqMan probes, molecular beacons and scorpions. In addition, becauseLightUp probes fluoresce after hybridization to the target amplicon, theycan be designed to bind only during the annealing step and not duringextension. This in turn does not interfere with the PCR as is the case whenusing TaqMan probes which are degraded by the Taq DNA polymerase (seeabove). The use of a single dye that fluoresces immediately after hybridiza-tion also eliminates the need for conformational changes to take place for
220 PCR

signal generation, as is the case for molecular beacons and scorpions.Taking all these considerations together, LightUp probes are easy to designand require little optimization and are likely to become more commonlyused.
9.4 General guidelines for probe and primer design
Although primer dimers and nonspecific amplification products will not bedetected when using fluorescent probe approaches, they will affect theefficiency and dynamics of the PCR. Because of this there are a number ofgeneral guidelines that should be followed when designing fluorescentprobes and oligonucleotide primers for real-time RT-PCR experiments. Thefollowing paragraphs outline general rules regarding probe and primerdesign, amplicon characteristics and fluorophore selection.
Probe design
The consensus amongst researchers setting up real-time RT-PCR experi-ments is that it is generally easier to design the fluorescent probe sequencefirst and then the amplification primers.
The length of a fluorescent probe should be between 18 and 30nucleotides, with an optimal length of 20 nucleotides. Although it ispossible to use probes with more than 30 nucleotides it is recommendedthat in such cases the fluorescent quencher is not placed at the 3′-end butinternally between 18 and 25 nucleotides from the 5′-end. This is only anissue when using TaqMan probes and this ensures efficient energy transferfrom the fluorescent reporter to the fluorescent quencher minimizing back-ground fluorescence. Probes should also have a GC content between 30 and80% however, it is more favorable to have more cytosine than guanidineso the correct strand should be selected accordingly. Related to this, probesshould not contain runs of identical nucleotides, and runs of four or moreguanidine residues should be avoided at all costs. A guanidine at the very5′-end of the probe should also be avoided as this will quench thefluorescent dye.
The Tm of the probe should be between 8 and 10°C higher than the Tm
of the amplification primers. As a general rule of thumb an 8°C higher Tm
should be used for genotyping whilst a 10°C increase should be used forgene expression profiling. It is also important when designing a probe toavoid any mismatches between the probe and the target, as well as avoid-ing any complementarity with either of the amplification primers.
In terms of probe placement it is advisable to design the probe so thatits 5′-end hybridizes as close to the 3′-end of the forward amplificationprimers as possible without actual overlapping. This again is only crucialfor TaqMan probes as this ensures an optimal 5′-nuclease reaction duringprobe displacement.
The general design rules described above should be used for bothsingleplex and multiplex reactions; however, when designing probes formultiplex reactions the position of the polymorphism should be in themiddle of the probe and the Tm should be the same for both probes.
Real-time RT-PCR 221

Amplification primers
Once the probe sequence has been designed the forward and reverseamplification primers should be designed. The amplification primers shouldbe designed following the standard rules as described in Chapter 3, althoughprimer design for real-time RT-PCR approaches is perhaps more importantthan for standard analytical PCR. The Tm of the forward and reverse primershould be between 63 and 67°C, depending on the Tm of the probe (seeabove). It is important to avoid runs of identical nucleotides and to avoidcomplementarity within the primers, as this would result in hairpinformation and less efficient amplification. It is also important to avoidcomplementarity between the primers so as to avoid primer-dimer formation.One problem often encountered during real-time RT-PCR is the amplificationand detection of contaminating genomic DNA. This can be avoided bydesigning primers that span or flank introns. For intron-spanning primers thefirst half of the primer should hybridize to the 3′-end of one exon and the5′-end of the other exon, which will only allow cDNA amplification to takeplace. For intron-flanking primers the forward and reverse primers shouldhybridize to separate exons. By using such primers amplicons from cDNA willbe smaller than amplicons from genomic DNA and the difference in ampli-con size can be determined from melting curve analysis.
Amplicon characteristics
When designing the forward and reverse primers it is important to take intoconsideration amplicon size. The length of the amplicon should be between80 and 120 base pairs since the shorter the amplicon the more efficient theamplification reaction. In addition, a small amplicon size also increases theefficiency of the nuclease reaction associated with the use of TaqMan probes.Another important factor is the GC content, which should ideally be between40 and 60%, although amplicons with as low as 30% or as high as 80% GCcontent will also work. During the amplification reaction it is crucial to avoidsecondary structure formation and the amplicon sequence should thereforebe analyzed in terms of possible secondary structure elements.
9.5 Instruments and quantification of results
There are a range of real-time PCR instruments and the properties of someof these are summarized in Table 9.2.
The quantification of results from a real-time RT-PCR experiment isimportant and there are two ways commonly used to do this: the standardcurve method and the comparative threshold or CT method. Both methodshave different strengths and will be discussed below.
Standard curve method
The standard curve method is based on using a sample of RNA or DNA ofknown concentration to construct a standard curve. Once a standard curvehas been generated it can then be used as a reference standard for theextrapolation of quantitative information regarding mRNA targets of
222 PCR

Real-time RT-PCR 223
Table 9.2 Real-time thermal cyclers
Excitation Detection PCR system Company specifications specification Sample format
Applied Biosystems Applied Tungsten Halogen FAM™/SYBR® 96-well plates7300 Real-Time Biosystems fixed wavelength Green 1, 0.2 ml tubesPCR System VIC™/JOE, NED™/
TAMRA™, ROX™ dyes
Applied Biosystems Applied Tungsten Halogen FAM™/SYBR Green 1, 96-well plates7500 Real-Time Biosystems variable wavelength VIC™ /JOE, NED™/ 0.2 ml tubes PCR System TAMRA™/ CY3 Dye™,
ROX™/Texas Red , CY5 Dye™
Exicycler™ Real- Bioneer Metal halide lamp, 4 channels 96-well plates Time Thermal Block filters: 4 channels (520–680 nm)
(480–640 nm)
iCycler iQ Real- Bio-Rad 400–700 nm CCD with intensifier 96-well plates Time PCR technology Detection System
MyiQ Single-Color Bio-Rad 400 nm FAM/SYBR 585 nm FAM/SYBR 96-well plates Real-Time PCR Detection System
Smart Cycler® II Cepheid 4 channels 4 channels (510–527, 16 programmable System (450–495, 500–550, 565–590, 606–650, reaction sites
565–590, 670–750 nm) 630–650 nm)
R.A.P.I.D. ™ System Idaho 450–490 nm 3 channels (520–540, 32-well plates Technology 630–650, Inc. 690–730 nm)
Chromo 4™ Four- MJ Research 4 channels 4 channels (515–530, 96-well platesColor Real-Time (450–490, 500–535, 560–580, 610–650, 0.2 ml tubesSystem 555–585, 675–730 nm) 8-tube strips
620–650 nm)
DNA Engine MJ Research 450–495 nm 515–545 nm 96-well platesOpticon® 8-tube stripsContinuous Fluorescence Detection System
DNA Engine MJ Research 470–505 nm 2 channels (523–543, 96-well platesOpticon® 2 540–700 nm) 8-tube stripsContinuous Fluorescence Detection System
LightCycler® Roche Blue LED light 3 channels (530, 32-well platesInstrument Applied 470 nm 640, 710 nm)
Science
LightCycler® Roche Blue LED light 6 Channels (530, 32-well plates2.0 Instrument Applied 470 nm 560, 610, 640, 670, 20 µl reaction
Science 710 nm) cuvettes

unknown concentration. There are a variety of different standards that canbe used, including in vitro reverse transcribed mRNA, in vitro synthesizedsingle-stranded DNA, or purified plasmid DNA. To generate the standardcurve the concentration of the DNA or RNA standard should be measuredusing a spectrophotometer (260 nm) followed by conversion into thenumber of copies using the molecular weight of the sample. Although DNAis most commonly used as a standard, absolute quantification of mRNAexpression requires the use of in vitro reverse-transcribed RNA because thisaccounts for the efficiency of the reverse transcription step. However, usingreverse-transcribed RNA to construct a standard curve is labor intensivebecause of the need to generate a cDNA plasmid for the in vitro reversetranscription reaction. Another potential problem when using in vitroreverse-transcribed RNA relates to RNA stability and this should be takeninto account when determining the concentration.
By far the most commonly used standards are cDNA plasmids. Althoughcloning of cDNAs into plasmid vectors can be time-consuming, the advan-tage is that this now represents an unlimited source of a DNA standard.Because large amounts of plasmid DNA can be generated with ease,numerous experiments can be performed using the same dilutions of thesame standard, which will minimize variations between different assays.Despite this advantage, cDNA plasmid standards will not account forvariations during reverse transcription and will therefore only provideinformation on relative changes in mRNA expression. This is however nota large problem in that this and variations in RNA input amounts can becorrected for by normalization to housekeeping genes (Section 9.6).
The comparative threshold (CT) method
The comparative threshold (CT) method is based on the relative quantifi-cation of transcript levels and involves the comparison of CT values of thesamples being analyzed with those of a control (calibrator) such as forexample nontreated sample or RNA from an untreated sample. As explainedin Table 9.1 the threshold cycle (CT) indicates the cycle number where thereaction fluorescence crosses the threshold, which reflects the reactionpoint when sufficient amplicons have been generated to give a significantfluorescent signal over the baseline. The equation used to calculate relativegene expression levels using the comparative CT method is given by 2–∆∆CT
where ∆∆CT = ((∆CT of the target sample) – (∆CT of the calibrator)). The ∆CT
224 PCR
Table 9.2 continued
Excitation Detection PCR system Company specifications specification Sample format
Mx3000P™ Real- Stratagene Quartz Tungsten 1 scanning 96-well platesTime PCR System Halogen lamp photomultiplier tube
350–750 nm (PMT)
Mx4000™ Multiplex Stratagene 350–750 nm 350–830 nm 96-well platesQuantitative PCR System

is the CT of the target gene (or the calibrator) subtracted from the CT of ahousekeeping gene. The described equation therefore represents thenormalized (Section 9.6) expression of the target gene relative to thenormalized expression of the calibrator. For the ∆∆CT equation to be validthe PCR efficiency of the target gene has to be more or less equal to theefficiency of the housekeeping gene and this is often not the case. If theefficiency of the target gene is not the same as for the housekeeping genethe comparative CT method cannot be used and the standard curve methodshould therefore be used (see above). The need for equal efficiencies forboth the target and housekeeping genes is clearly a disadvantage of thismethod; however, in contrast to the standard curve method there is noneed to construct standards and moreover the entire 96-well microtiterplate can be used for target samples.
9.6 Normalization and control selection
In order to obtain reliable quantitative results from a real-time RT-PCRexperiment, variations in both the reverse transcription reaction and thePCR itself must be corrected for. Differences in the efficiency of the reversetranscription reaction will result in a cDNA amount that does not corre-spond to the amount of RNA and a difference in PCR amplificationefficiency will result in differences in amplicon accumulation. The latter isnot a major problem in that quantification is based on CT values determinedearly in the exponential phase of the PCR reaction.
The most acceptable way of correcting for differences in input RNA andreverse transcription efficiencies is based on normalization of the targetgene to a housekeeping gene. A number of housekeeping genes can be usedbut it should be expressed at a constant level in all tissues and at all stagesof development. In addition, the treatment of the unknown sample shouldnot affect the housekeeping gene. The commonly used housekeeping genesare glyceraldehyde-3-phosphate dehydrogenase (GAPDH) or β-actin.
GAPDH is a very abundant glycolytic enzyme involved in a number ofcellular processes which is present in most tissues and has been usedextensively for normalization purposes. However, a number of studies haveshown that GAPDH is in fact not suitable as an internal control because itsexpression is affected by a number of treatments (6,7).
β-actin is a cytoskeletal protein and is expressed in almost all tissue types.Although its expression can vary under some conditions and in somediseases β-actin probably represents the best housekeeping gene for use inreal-time RT-PCR experiments. Studies have shown that β-actin levels donot vary under numerous treatments in a variety of samples (8).
Although β-actin fulfils the criteria of a good housekeeping gene theoptimal choice of a housekeeping gene is dependent on the experiment inquestion and should therefore be selected with this in mind.
9.7 A typical real-time RT-PCR experiment using SYBR®
Green I
By reading the previous Sections in this Chapter you should now be familiarwith the theory behind real-time RT-PCR. However, to give an idea of the
Real-time RT-PCR 225

226 PCR
more practical aspects of the technique and to become more familiar withdata sets a typical real-time RT-PCR experiment together with a typical dataset using SYBR® Green I is outlined below. The experiment made use of anMJ Research PTC 200 thermocycler with a Chromo4 ContinuousFluorescence Detection system and data analysis was performed using MJResearch Opticon Monitor v. 2.03.5 software. The experiment describedinvolves analysis of the NADPH: protochlorophyllide oxidoreductase (PORA) genein the model plant Arabidopsis thaliana in response to far-red light irradiation.In wild-type Arabidopsis seedlings the expression of PORA rapidly decreaseswhen seedlings are transferred from total darkness to far-red light conditions.By contrast, the fhy1 Arabidopsis mutant, affected in a number of far-redresponses, shows defective PORA gene expression in response to far-red lightirradiation. Real-time RT-PCR was used to quantify the difference in PORAgene expression between wild-type (Laer-Landsberg erecta) and the fhy1mutant after exposure to 6 and 18 hours of far-red light.
Wild-type and fhy1 Arabidopsis seedlings were grown for 5 days in thedark followed by transfer to monochromatic far-red light treatment. Tissuewas harvested after 0, 6, and 18 hours of far-red light treatment and cDNAwas synthesized using an oligo-dT primer. For the PCR amplificationoligonucleotide primers were designed to the 3′-end of the PORA gene andoligonucleotide primers for β-actin were used as an internal reference/control (Section 9.6).
When using SYBR® Green I as a detection method the first step is to testthe efficiency of the oligonucleotide primers (Section 9.3). This not onlygives a measure of amplification efficiency but also enables one to checkthat only one amplification species is being produced. The efficiency iscalculated using a cDNA dilution series and calculated by E = 10–1/slope (9).As observed from Figure 9.6(A) the primers designed for the PORA ampli-fication give rise to a single defined fluorescence peak demonstrating thatthese primers are well suited for real-time quantification.
Once it has been demonstrated that the oligonucleotide primers arespecific for the gene in question the real-time experiment can be performed.In this case real-time PCR was used to amplify β-actin and PORA from thedifferent individual experimental samples. Three replicates of each experi-mental sample were run together with a water control and a minus reversetranscription (RT) control (to eliminate DNA contamination). A thresholdvalue (Section 9.2 and Table 9.1) was chosen above the fluorescence back-ground (Figures 9.6(B) and 9.1) and any fluorescence signal over thisthreshold was measured, which determines the CT values. The CT valueswere recorded for each light treatment (far-red and darkness) from bothwild-type and fhy1 samples. In order to calculate the relative expression ofPORA in far-red light as compared with darkness the CT values were usedin the following equation:
The relative value (R) of each time point in relation to wild-type grown indarkness was then plotted against hours exposed in far-red light. As can beseen from Figure 9.6(C) the real-time RT-PCR data show that PORA expres-
R = (Etarget)∆CPtarget (control–sample)
(Ereference)∆CPreference (control–sample)

Real-time RT-PCR 227
(A)
(B)
(C)
Flu
ores
cenc
e
70 75 80 85
0 5 10 15 20 25 30 35 40
1.4
1.2
1.0
0.8
0.6
0.4
0.2
0
10
1
0.1
0.01
0.001
Laer
fhy1
5 10 15 200
Threshold
Flu
ores
cenc
eR
Cycle
Temperature
PORA
Hours in far-red light
Figure 9.6
An example of a real-time RT-PCR experiment using SYBR® Green I as reporter.The aim of the experiment was to determine the relative difference in theexpression level of the NADPH: protochlorophyllide oxidoreductase (PORA) gene inwild-type and fhy1 mutant Arabidopsis seedlings in response to 0, 8, and 18 h offar-red light irradiation. (A) Melting curve analysis using the PORA-specific primersshowing a single, well-defined peak demonstrating that only one amplificationproduct is being produced. (B) During the first 3–15 amplification cycles athreshold baseline is determined and the fluorescence above this threshold ismeasured giving the CT values for each reaction/sample. (C) From the CT valuesthe relative expression (R) of PORA is calculated for both wild-type and the fhy1mutant at each time-point and in this case plotted against hours exposed to far-red irradiation. This demonstrates that PORA expression decreases in wild-type butremains constant in fhy1 seedlings. Data kindly provided by Dr Trudie Allen,(University of Leicester).

228 PCR
sion in wild-type seedlings decreases upon exposure to far-red light whilstin the fhy1 mutant PORA expression remains unchanged.
This simple example demonstrates the power of real-time RT-PCR indetermining and comparing relative expression levels of a gene in wild-typeand in a mutant under two different environmental conditions.
9.8 Common real-time RT-PCR pitfalls
When designing and performing any PCR amplification there are a numberof potential pitfalls and real-time RT-PCR is no exception. Most pitfalls areeasy to solve and the most common pitfalls and problems are described below.
Primer and probe design
If the oligonucleotide primers and/or the probe are poorly designed yourreal-time RT-PCR experiment will have limited success if any. Althoughamplification primers for everyday PCR amplification can be designedmanually using general design rules (Chapter 3), it is recommended thatprimer design software is used to design both the amplification primers andthe probe for your real-time RT-PCR experiment (Section 3.7). Most designprograms have a number of adjustable parameters including primer/probeTm, complementarity, and secondary structure.
RNA quality
The quality of your RNA is extremely important in order to ensure success-ful real-time RT-PCR. Degraded or impure RNA will limit the efficiency ofthe RT reaction, reducing yield, and thereby not giving an accurate repre-sentation of gene expression.
Minus RT control
To completely eliminate genomic DNA from RNA preparations is virtuallyimpossible. Because of this a mock reverse transcribed RNA sample, contain-ing all reagents apart from the RT, should be included in the real-timeexperiment. No fluorescence increase would demonstrate no DNA contami-nation. To overcome problems with DNA amplification, probes and primerscan be designed to span exon–intron borders, however this is not alwayspossible.
Normalization control
To correct for sample-to-sample variation during real-time RT-PCR aninvariant endogenous control gene should be included. The most commoncontrols include β-actin and GAPDH (Section 9.6).
Melting curve analysis
A common mistake is to avoid performing melting curve analysis whenusing SYBR® Green I as a reporter. Ideally a single and well-defined peak

Real-time RT-PCR 229
should be observed at the melting temperature of the amplicon whichdemonstrates that the fluorescence is a direct measure of specific productaccumulation. If a series of peaks are observed the discrimination betweenspecific and nonspecific product formation is too small, which requiresoptimization of the PCR itself.
Fluorescence baseline and thresholds
To obtain accurate CT values the baseline has to be set at least two cyclesbefore the first CT value of the most abundant sample. The threshold shouldbe in relation to the baseline and set when the products reach exponentialphase approximately 10 deviations above the baseline.
Reaction efficiency
The reaction efficiency (E) is calculated by the equation E = 10–1/slope (9) andthe efficiency of the PCR should be between 90% and 110%. If the reactionefficiency is lower than 90% optimization is needed and you should startconsidering the amplicon size, secondary structures and primer design.
9.9 Applications of real-time RT-PCR
Since the advent of real-time RT-PCR the number of applications has grownexponentially. It is outside the scope of this book to describe every appli-cation of real-time RT-PCR; however we will describe two general butimportant application areas below.
Cancer research and detection
The number of patients with leukemia or lymphoma who achieve acomplete remission after initial treatment is very high. However, manypatients will relapse due to residual and undetected tumor cells. For thedetection of rare tumor cells in clinical samples, real-time RT-PCR offerstwo main advantages over conventional RT-PCR. First, the results arequantitative, which gives a measure of the number of residual tumor cells,and second, it facilitates exact sensitivity controls on a per-sample basis. Inaddition real-time RT-PCR is used more frequently in detecting themolecular events underlying disease reoccurrence, which may guidetherapeutic decisions.
When using peptide-based anticancer vaccines it is important to analyzecirculating lymphocytes to enumerate the number of T cells elicited by thetreatment. However, it is also important to gain information regarding theirfunctional state. Real-time RT-PCR has been used to assess directly theimmune status of peripheral blood mononuclear cells (PBMC) frommelanoma patients being treated with peptide-based vaccines (10). By test-ing PMBC for interferon-γ mRNA expression the PMBC response to vaccinescould be assessed in a direct way. Another exciting application of real-timeRT-PCR involves analysis of dynamic changes in expression of tumor-associated antigens and cytokine expression during immunization (11).

230 PCR
Real-time RT-PCR can also be used to screen for genomic mutations andpolymorphisms. For example, the identification of BRCA1 and BRCA2mutations permits molecular diagnosis for breast cancer susceptibility, anddifferent types of fluorescent molecular probes have been used to success-fully perform allelic discrimination (11).
Real-time RT-PCR and plants
The detection and quantification of foreign DNA present in plants isbecoming increasingly important. Plants are subject to a myriad ofinfections, and real-time RT-PCR has been used to measure pathogeninfection (12) in the field and for applied purposes. For example, seedpotatoes cannot be sold within the European Union (EU) if they containthe potato brown rot agent Ralstonia solanacearum. In contrast to lengthypathogenicity tests on tomato seedlings, real-time RT-PCR can quanti-tatively detect R. solanacearum rapidly (13).
The contamination of food with mycotoxins is of great concern sincemany are carcinogenic. However, toxin abundance does not correlate withfungal contamination but with the toxinogenic properties of individualstrains. Real-time RT-PCR has been used to detect genes involved in toxino-genesis in the tricotecene-producing Fusarium (14) and in theaflatoxin-producing Aspergillus species (15).
With the introduction of stringent food safety regulations, real-timeRT-PCR has seen increased use in assessing foreign DNA contamination inprocessed food. For instance, the absence of gluten in baby food iscontrolled by real-time RT-PCR amplification of cereal genes (16). Similarly,real-time RT-PCR is used to assess common wheat adulteration in durumwheat pasta (17) since Italian, Spanish and French regulations only allowup to 3% common wheat contamination in pasta and semolina.
References
1. Heid CA, Stevens J, Livak KJ, Williams PM (1996) Real time quantitative PCR.Genome Res 6: 986–994.
2. Gibson UE, Heid CA, Williams PM (1996) A novel method for real time quanti-tative RT-PCR.. Genome Res 6: 995–1001.
3. Tyagi S, Kramer FR (1996) Molecular beacons: probes that fluoresce uponhybridization. Nature Biotechnology 3: 303–308.
4. Egholm M, Buchardt O, Christensen L, Behrens C, Freier SM, Driver DA, BergRH, Kim SK, Norden B, Nielsen PE (1993) PNA hybridizes to complementaryoligonucleotides obeying the Watson–Crick hydrogen-bonding rules. Nature365: 566–568.
5. Svanvik N, Westman G, Wang D, Kubista M (2000) Light-up probes: thiazoleorange-conjugated peptide nucleic acid for detection of target nucleic acid inhomogeneous solution. Anal Biochem 281: 26–35.
6. Suzuki T, Higgins PJ, Crawford DR (2000) Control selection for RNA quanti-tation. BioTechniques 29: 332–337.
7. Ke LD, Chen Z, Yung WK (2000) A reliability test of standard-based quantitativePCR: exogenous vs endogenous standards. Mol Cell Probes 14: 127–135.
8. Giulietti A, Overbergh L, Valckx D, Decallonne B, Bouillon R, Mathieu C (2001)

Real-time RT-PCR 231
An overview of real-time quantitative PCR: applications to quantify cytokinegene expression. Methods 25: 386–401.
9. Pfaffl M (2001) A new mathematical model for relative quantification in real-time RT-PCR. Nucleic Acids Res 29: e45.
10. Panelli MC, Wang E, Monsurro V, Marincola FM (2002) The role of quantitativePCR for the immune monitoring of cancer patients. Expert Opin Biol Ther 2:557–564.
11. Mocellin S, Rossi CR, Pilati P, Nitti D, Marincola FM (2003) Quantitative real-time PCR: a powerful ally in cancer research. Trends Mol Med 9: 189–195.
12. Gachon C, Mingam A, Charrier B (2004) Real-time PCR: what relevance to plantstudies? J Exp Bot 55: 1445–1454.
13. Weller SA, Elphinstone JG, Smith NC, Boonham N, Stead DE (2000) Detectionof Ralstonia solanacearum strains with a quantitative, multiplex, real-time,fluorogenic PCR (TaqMan) assay. Appl Environ Microbiol 66: 2853–2858.
14. Schnerr H, Niessen L, Vogel RF (2001) Real time detection of the tri5 genein Fusarium species by lightcycler-PCR using SYBR Green I for continuousfluorescence monitoring. Int J Food Microbiol 4: 53–61.
15. Mayer Z, Bagnara A, Farber P, Geisen R (2003) Quantification of the copynumber of nor-1, a gene of the aflatoxin biosynthetic pathway by real-time PCR,and its correlation to the cfu of Aspergillus flavus in foods. Int J Food Microbiol82: 143–151.
16. Sandberg M, Lundberg L, Ferm M, Yman IM (2003) Real-time PCR for thedetection and discrimination of cereal contamination in gluten free foods.European Food Research and Technology 217: 344–349.
17. Alary R, Serin A, Duvaiu MP, Joudrier P, Gautier MF (2002) Quantification ofcommon wheat adulteration of durum wheat pasta using real-time quantitativepolymerase chain reaction (PCR). Cereal Chem 79: 553–558.

Cloning genes by PCR
The cloning of genes is often a crucial step in a scientific project and canbe both difficult and time-consuming. The use of PCR has greatly enhancedthe successes of gene isolation. Cloning of genes by PCR can be dividedinto two main areas: (i) genes of known DNA sequence; and (ii) genes ofunknown DNA sequence. Genome sequencing projects (Chapter 11) aregenerating an increasing amount of data that makes cloning of genes morestraightforward, however there remain many cases where unknown genesmust be cloned. This Chapter deals with the cloning of both unknowngenes and those that have been previously isolated.
A Cloning genes of known DNA sequence
10.1 Using PCR to clone expressed genes
If a DNA fragment has been isolated containing part of the target gene,perhaps as a genomic sequence, it can be used to clone a full-length cDNA forfurther analysis. Perhaps quantitative RT-PCR (Chapter 8) or real-time RT-PCR(Chapter 9) has indicated very low levels of expression of the target gene, andhybridization screening of a cDNA library, using the isolated fragment as aprobe, fails to yield clones. Dealing with a low-abundance transcript can oftenbe frustrating as conventional cDNA library screening is labor intensive andsuccess depends on a number of parameters associated with the quality of thelibrary. First, the quality of the mRNA used to generate the cDNA library is ofgreat importance since low-abundance transcripts can easily be ‘lost’ duringsample handling. Second, the efficiency of the first- and second-strand cDNAsynthesis should be optimized and monitored by incorporating radiolabelednucleotides. Third, the proportion of recombinant clones should be as highas possible to reduce the number of plaques or bacterial colonies needed to bescreened and to increase the likelihood of cloning low-abundance transcripts.Even if you manage to generate a good cDNA library it may not be possibleto isolate certain low-abundance cDNA clones. By contrast, it is often possibleto isolate such cDNAs using PCR-based techniques.
Generating cDNA libraries by PCR
Various approaches have been applied to the construction of cDNA librariesby PCR. Often the rationale for using such an approach is the limitedamount of material available from which mRNA can be produced. Due tothe limitations on materials, such procedures rely on the use of total RNApreparations as the source of templates for mRNA reverse transcription andcDNA amplification. An inevitable consequence of this strategy is theamplification of rRNA sequences that predominate in any total RNA
10

preparation and which form templates for nonspecific or self-primingreactions leading to a reduction in library quality.
Early methods were based on an oligo-dT primer for first-strand cDNAsynthesis and homopolymer-tailing, often by dCTP, of the 3′-end of thesecDNA strands. PCR with oligo-dG and oligo-dT primers was thenperformed. This approach was improved by the inclusion of specificsequence extensions on the oligo-dG and oligo-dT primers so that ratherthan using the homopolymer tracts as priming sites, specific primerscomplementary to the primer extensions could be used for increasedspecificity. Alternatively, and more efficient than homopolymer tailing,following standard double-strand cDNA synthesis the molecules can beblunt-ended by treatment with, for example, Klenow fragment and dNTPs,and a double-stranded adaptor ligated to provide specific priming sites. Ofcourse in this case the new priming site would be added to both the 5′- and3′-ends of the cDNA allowing amplification by a single primer, but this alsoresults in single strands that have complementary ends that are capable ofannealing. The consequence is a process called suppression, which resultsin such self-associated molecules being unavailable as templates for PCR.This suppression phenomenon has been exploited in some cDNA synthesisprotocols to prevent the nonspecific amplification of rRNA sequences thatare commonly recovered during cDNA library construction from total RNApreparations (1). In essence the procedure is identical to the generation ofa library by ligation of a double-strand adaptor. The adaptor is added to the5′- and 3′-ends of each molecule in the library whether derived from mRNAor rRNA. In the PCR step, however, the adaptor-base primer is addedtogether with an oligo-dT primer. This will allow amplification of anymolecule, but only the mRNA molecules that have a polyA tail will providesites for both the adaptor and oligo-dT primer. Any molecules that areamplified only by the adaptor primer will have complementary terminalsequences that will be able to anneal, thus preventing the primer accessingthe site and therefore suppressing the level of representation of suchmolecules in the final library. This provides an efficient method for theselective amplification of mRNA-derived cDNAs.
Solid-phase procedures for library construction have also been developedthat either depend upon the capture of mRNA molecules, by annealing ofthe polyA tail to oligo-dT coupled to some form of solid support, or the useof a biotinylated oligo-dT primer for first-strand cDNA synthesis.
PCR amplification from a cDNA library
A cDNA library is a highly complex mixture of nucleic acids and often, inthe case of a phage library, protein components, and so it is important touse high stringency conditions for the PCR reaction in order to minimizenonspecific background amplification. It is convenient to use PCR as a toolto rapidly screen random clones to determine the quality of a cDNA library.Essentially random plaques are transferred with a toothpick to a PCR mixand universal primers flanking the cDNA cloning region are used to amplifythe inserts. A good library should give a high number of clones with insertsof varying sizes. An example of PCR screening of random clones from abacteriophage λ gt10 cDNA library is shown in Figure 10.1.
234 PCR

For the isolation of target genes there are two general approaches to PCRamplification from a cDNA library:
● from the starting cDNA, which may be one of the increasing sources ofcommercially available PCR-ready cDNA samples specifically producedfor this purpose; or
● from the phage library suspension.
During cDNA library construction (ligation, packaging, transfection) toyield the primary library and its subsequent amplification, the distributionof clones can be skewed such that the library is not representative of thestarting mRNA population. This can have a particularly adverse effect onthe representation of clones representing low-abundance transcripts. Forthis reason it is better, where possible, to start from a cDNA template source,since this increases the chance of isolating rare transcripts due to the highercomplexity of cDNAs whilst reducing nonspecific amplification due to thelack of phage DNA. There are no major difficulties associated with directPCR amplification from cDNA although the following points should beconsidered. First, use a low template concentration such as for genomicPCR, in the range of 10–50 ng, and second, for rare transcripts use 40–45amplification cycles. Alternately, use 30 cycles followed by re-amplificationof an aliquot for an additional 25 cycles.
SMART cDNA cloning
Clontech’s SMART™ PCR cDNA synthesis kit facilitates production of high-quality cDNA from total or polyA RNA as shown in Figure 10.2. Reversetranscriptase uses a modified oligo-dT primer to generate first-strand cDNA.Upon reaching the 5′-end of the mRNA the terminal transferase activity ofthe reverse transcriptase adds additional nucleotides, normally deoxy-
Cloning genes by PCR 235
1 2 3 4 5 6 7 8 M
Figure 10.1
Screening random λgt10 plaques from a library for the presence of inserts. Severalclones carry inserts of differing size (1, 2, 3, 5, 7, 8) while other clones show noapparent inserts (4, 6). Photography kindly provided by A. Neelam (University ofLeeds).

cytidine, to the 3′-end of the first-strand cDNA. The SMART II oligo-nucleotide, containing a 3′ oligo-G sequence, base pairs to these Cs on thecDNA, and now acts as a ‘new’ template for the reverse transcriptase, whichextends the cDNA to the end of the SMART II oligonucleotide. Theextended full-length single-stranded cDNA, now containing two primingsites (5′ and 3′), can be used for end-to-end cDNA amplification by PCR.The majority of cDNAs should represent full-length copies allowing forefficient amplification of 5′-regions.
It is advisable for all cDNA library production schemes to use primer pairsthat contain engineered restriction sites that will facilitate subsequentcloning of the PCR-amplified cDNA (Chapter 6).
The second option is to PCR from a phage cDNA library suspension. Thismay result in more nonspecific amplification compared with direct PCRfrom cDNA. When dealing with phage suspensions it is important to allowaccess to the packaged DNA by heating an aliquot of the phage suspensionto 95°C for 5 min or by placing in a microwave oven for 5 min at full power(700 W). As for direct PCR amplification from library DNA, a low con-centration of template DNA should be used to minimize nonspecific
236 PCR
First-strand synthesis and dCtailing by reverse transcriptase
Template switching andextension by reversetranscriptase
PCR amplification
cDNA
mRNA
mRNA
First-strand cDNA
mRNA
First-strand cDNA
oligo-dT+
SMART II
SMART II
SMART II
oligo-dT
oligo-dT
AAAAAAAAAA
AAAAAAAAAA
pppG
Me
5'
pppG
Me 5'
CCC GGG 5'
5'
CCCGGG
pppG
Me
5'
AAAAAAAAAA
GGG
5'
Figure 10.2
The principle of SMART™ PCR cDNA synthesis kit for generating full–length cDNAmolecules.

amplification events. When a cDNA library is generated it is usual to checkthe integrity of the library by analyzing random clones for the presence ofinserts of varying sizes that correspond to different initial transcripts, andsuch a screen is shown in Figure 10.1. The identification of positive clonesis usually achieved by filter transfer of plaques from a plate, followed byfixing the released DNA to the membrane, then hybridization with a labeledprobe. In initial library screens it is difficult to isolate single plaques and sothe screening must be repeated. However, PCR screening can be used to tryto isolate individual clones by amplification from dilutions of a library(Figure 10.3). When the lowest dilution that still gives a positive result isidentified this corresponds to the number of plaques that must be screenedto isolate a single positive. If this number is small (10–50), then it is possibleto pick individual plaques to screen. If the number remains large (>50) thena further hybridization experiment is probably more efficient.
10.2 Expressed sequence tags (EST) as cloning tools
DNA sequence databases provide a wealth of EST sequences and these canbe used as very efficient tools for gene cloning by PCR. ESTs are DNAsequences of the 5′- or 3′-ends of cDNA clones often randomly picked froma cDNA library, or as a subpopulation of clones isolated from a develop-mental library, perhaps by differential screening. The sequence informationis limited to usually about 500 nucleotides, the amount generated from asingle sequencing reaction. Thus for any given cDNA clone there can betwo ESTs, one corresponding to 5′- and one to 3′-sequence, but in manycases the region between these extremes is unknown. Nonetheless, thelimited sequence information is sufficient to search databases to identifyhomology to known genes, or genomic regions. Most importantly, if yousearch a database with a sequence of interest and identify an EST, then thismeans that a cDNA clone of your target gene is available. In most cases
Cloning genes by PCR 237
3000
015
000
750
03
750
187
594
047
023
512
060 60 M
(B)
7500
050
000
3750
018
750
1250
06
250
312
51
560
M
(A)
Figure 10.3
Screening dilutions of an enriched λgt10 cDNA library for the presence of a targetclone. The number of plaque–forming units (p.f.u.) present in the PCR areindicated above each lane; M is molecular size markers. (A) The initial enrichmentshows detection of a clone in 6 250 p.f.u. (B) Subsequent enrichment reveals thepresence of a clone in the highest dilution sample that contains 30 p.f.u.Photographs kindly provided by A. Neelam (University of Leeds).

ESTs can be ordered, for a small handling fee, from various stock centers inthe form of a plasmid containing the cDNA. There are also a growingnumber of commercial biotechnology companies that offer a variety of ESTclones, but these can be expensive.
EST sequence data provide a rapid mechanism for obtaining cDNAsequence data from your gene without the need to screen cDNA libraries.In some cases you may wish to use the EST sequence data for rapid cloningof the target gene by RT-PCR, cDNA library PCR or genomic PCR. This isachieved by designing an oligonucleotide primer complementary to part ofthe EST sequence for use in conjunction with a 5′- or 3′-gene-specificprimer, an adaptor primer or a universal vector-specific primer. The latteris used either for amplification from an existing cDNA library or where thecDNA has been ligated to a vector as a convenient mechanism for addinga universal primer site. If both 5′- and 3′-ESTs are available then two primerscould be designed to amplify a selected part of the cDNA clone, such as theprotein-coding region.
10.3 Rapid amplification of cDNA ends (RACE)
RACE is a procedure for amplification of cDNA regions corresponding tothe 5′- or 3′-end of the mRNA (2) and it has been used successfully to isolaterare transcripts. The gene-specific primer may be derived from sequencedata from a partial cDNA, genomic exon or peptide.
3¢-RACE
In 3′-RACE the polyA tail of mRNA molecules is exploited as a priming sitefor PCR amplification. mRNAs are converted into cDNA using reversetranscriptase and an oligo-dT primer as described in Protocol 8.1. Thegenerated cDNA can then be directly PCR amplified using a gene-specificprimer and a primer that anneals to the polyA region.
5¢-RACE
The same principle as above applies but there is of course no polyA tail(Figure 10.4). First-strand cDNA synthesis extends from an antisense primer,which anneals to a known region at the 5′-end of the mRNA. However, thereis no known priming site available for the subsequent PCR amplification.The trick is to add a known sequence to the 3′-end of the first-strand cDNAmolecule as described in Protocol 10.1. Terminal transferase, a template-independent polymerase, will catalyse the addition of a homopolymeric tail,such as poly-dC, to the 3′-end of each cDNA molecule. PCR amplificationcan now be performed using a nested internal antisense primer together withan oligo-dG primer. This will allow the specific amplification of unknown5′-ends of the mRNA molecule. Alternatively, as discussed for cDNA libraryconstruction (Section 10.1), double-strand cDNA synthesis can be followedby blunt ending and adaptor ligation. This provides a specific primer sitethat in combination with the nested gene-specific primer will lead to ampli-fication of the 5′-end of the cDNA. A common problem with theseapproaches is that the cDNAs are not always full-length.
238 PCR

A significant advance in the production of full-length 5′-end RACEproducts is the use of the CapSwitch primer (Clontech). As described inChapter 8 this allows the addition of a specific primer sequence to the5′-end of each cDNA by virtue of the homopolymer C-tail added by thereverse transcriptase. This new primer site can be used together with a gene-specific primer for efficient 5′-RACE.
5¢- and 3¢-RACE
An efficient procedure for cloning both 5′- and 3′-ends of cDNAs or full-length molecules uses adaptor ligation and allows the isolation of both5′-and 3′-cDNA ends from the same cDNA preparation (3). The adaptorutilizes a vectorette feature for selective amplification of a desired end(Section 10.6) as well as suppression PCR to reduce background ampli-fication (Section 10.1.1).
The technical details of the RACE reaction itself will not be described heresince a variety of commercial kits for RACE are available and have optimizedprotocols and reagents that work very efficiently. These are relativelyexpensive but more time and money may be spent in optimizing theprocedure using a series of independent reagents.
Cloning genes by PCR 239
mRNA
Reverse transcriptionto generate cDNA
cDNA
Tailing cDNA using dCTPand terminal transferaseAnneal primers
GSP2
Primary PCR
GSP3
Secondary PCR
Clone and sequence
5’ 3’AAAAAAAAA
CCCC
GSP1
CCCC
CCCC
cDNA
cDNA
cDNA
Figure 10.4
Outline of the 5′-RACE technique. Total RNA or mRNA is subjected to reversetranscription using a gene-specific primer (GSP1) priming in the 5′ direction. Theresulting cDNA is tailed followed by amplification using a tail-specific primer and anested gene-specific primer (GSP2). Following this a nested amplification reactionis performed using a tail-specific primer and a nested gene-specific primer (GSP3).
An improvement to standard RACE techniques has recently beenreported (4). PEETA (Primer extension, Electrophoresis, Elution, Tailing,Amplification) involves resolving the extension product after reversetranscriptase followed by elution from a gel, then dC-tailing and PCR ampli-fication. It is claimed to be more efficient than the standard RACEprocedure and aids in the mapping and cloning of alternatively splicedgenes.
Clearly during the design of 5′- and 3′-RACE experiments the primerpositions can be located so that the final products have a region of overlap.It is then a simple process to join the two parts of the cDNA by SOEing(Chapter 7). This involves mixing the fragments and performing at leastone cycle of PCR, although more cycles can be performed and flankingprimers used in the RACE amplifications can be included to amplify thefull-length product.
B Isolation of unknown DNA sequences
It is often of interest to isolate and clone unknown DNA fragments that lieadjacent to already cloned regions of DNA. One obvious example is theisolation of downstream or upstream regulatory regions, includingpromoters. A further application that is increasingly common is theisolation of flanking regions next to transposon insertions as part of geneknockout strategies. Various approaches to the PCR cloning of unknownDNA sequences will be outlined.
10.4 Inverse polymerase chain reaction (IPCR)
PCR allows the specific amplification of genomic DNA regions that liebetween two primer sites facing one another. What if the region of interestlies either 5′ or 3′ in relation to the primer sites? The answer is inverse PCR(IPCR) (5). The principle of IPCR is shown in Figure 10.5 and involves thedigestion of genomic DNA with appropriate restriction endonucleases,intramolecular ligation to circularize the DNA fragments and PCR ampli-fication. PCR uses primer pairs that originally pointed away from each otherbut which after ligation will prime towards one another around the circularDNA.
The principle and the protocol for IPCR (Protocol 10.2) are the same what-ever the application and so as an example the use of IPCR for the isolationof flanking DNA sequences that lie next to a transposon insertion will bedescribed.
Isolation of genomic DNA, digestion and ligation
The success of IPCR is largely dependent on the efficiency of intramolecularligation of the target DNA fragments within a complex mixture of non-target fragments. A prerequisite is the use of high-quality genomic DNAthat should ideally be prepared by using an available commercial kit. Theintegrity of the DNA should be checked by agarose gel electrophoresis and
240 PCR

should not show any smearing or small molecular size species, includingRNA.
A 500 ng aliquot of genomic DNA should be digested with a restrictionendonuclease enzyme that digests within the known DNA region, in this casewithin the transposon, and which will also cut within the unknown DNAregion (Figure 10.5). It is advisable to set up several different restrictionenzyme digests, if possible, since the efficiency of the subsequent PCRamplification decreases rapidly for fragment sizes above 2 kbp in size. Follow-ing heating to 70°C to inactivate the restriction enzyme, an aliquot can beretained for gel analysis (see below) and the remainder of the restriction digestreaction should be diluted five-fold in ligation mixture (ligation buffer, H2O,ligase) and incubated for 6–12 hours at room temperature.
To check the efficiency of restriction digestion and ligation, Southern blotanalysis can be performed, in this case using part of the transposon as aprobe. An aliquot of the genomic digest should be analyzed along with theligation reaction. If both the restriction digest and ligation were successful,
Cloning genes by PCR 241
Region of known DNA sequence
XbaI XbaIPrimer 1Primer 2
Primer 3
Primer 4
XbaI digestionand ligation
First PCR and secondnested PCR amplification
Primer site 1 Primer site 3
Unknown DNA sequence
XbaI
Primer 3Primer 1
Primer 2
XbaI
Primer 4
Figure 10.5
Schematic diagram showing the principle of IPCR from genomic DNA. Afterrestriction endonuclease digestion and religation the first round PCR is performed,in this case using primers 2 and 4. Following this the second-round nested PCR iscarried out using primers 1 and 3 which should give rise to one specificamplification product.

one hybridizing band should be observed in the genomic digest lane whilstin the ‘ligation’ lane one hybridizing band of decreased mobility should bevisible, due to the circular nature of the ligated product. However, twohybridizing bands are often observed in the ligation sample due to incom-plete ligation, as shown in Figure 10.6.
First-round PCR
It is important to realize that the first-round PCR is not straightforward,due to the highly complex nature of the template. The reaction isequivalent to amplification of a single copy gene from genomic DNA, butwhere only a subset of the templates are available for amplification, due toincomplete ligation of the digested DNA. With this in mind, care shouldbe taken when performing the first-round PCR amplification. As describedin Protocol 10.2, a titration series of the ligation reaction should be used forthe first-round amplification in order to maximize the chances of success.Using the outermost primers, a standard PCR amplification should beperformed under high-stringency conditions (55–60°C annealing) using arelatively long extension time (2 min) and allowing the reaction to proceedfor 40 cycles. The use of 40 cycles ensures that even extremely raretemplates are subjected to amplification. A proofreading DNA polymeraseshould be used to minimize the error rate.
It is useful to analyze an aliquot of the first-round PCR by gel electro-phoresis before proceeding to the second-round nested PCR amplification.You may be very lucky and have a single amplification product and in thiscase you may wish to proceed directly to cloning and sequence analysis toconfirm the identity of the product. Generally, however, the outcome is amultitude of relatively weak DNA products, which may or may not beidentical in the different restriction digest reactions, but in any case do notprovide any indication of the success or failure of IPCR. A second outcomeis that no amplification products are detected after the first round ofamplification, although again this does not mean that the amplificationhas failed. The worst outcome is a smear. If heavy smearing appears after
242 PCR
Digest Ligation
Figure 10.6
Schematic diagram showing a typical Southern blot of digested genomic DNAbefore and after ligation as part of IPCR. The ‘Digest’ lane shows detection of aspecific restriction fragment corresponding to the target DNA. The ‘Ligation’ laneshows detection of a larger fragment due to recircularization of the targetfragment and also a proportion of DNA that has not ligated and so migrates atthe position of the original digested DNA.
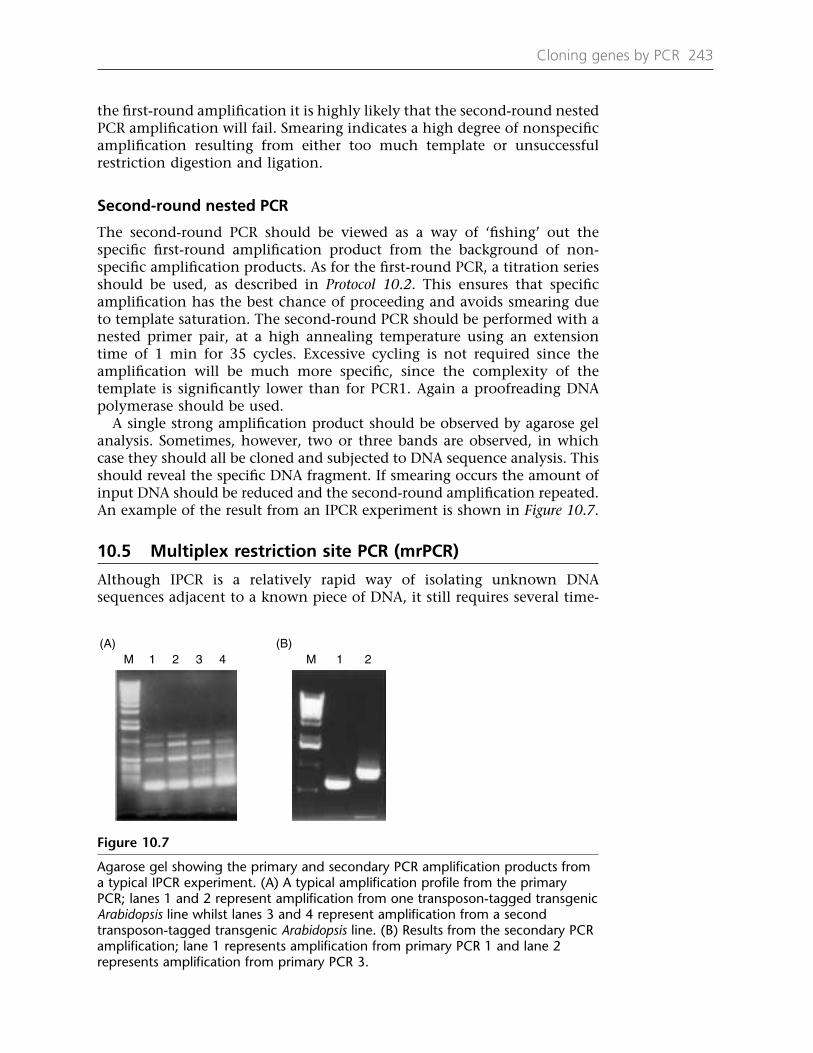
the first-round amplification it is highly likely that the second-round nestedPCR amplification will fail. Smearing indicates a high degree of nonspecificamplification resulting from either too much template or unsuccessfulrestriction digestion and ligation.
Second-round nested PCR
The second-round PCR should be viewed as a way of ‘fishing’ out thespecific first-round amplification product from the background of non-specific amplification products. As for the first-round PCR, a titration seriesshould be used, as described in Protocol 10.2. This ensures that specificamplification has the best chance of proceeding and avoids smearing dueto template saturation. The second-round PCR should be performed with anested primer pair, at a high annealing temperature using an extensiontime of 1 min for 35 cycles. Excessive cycling is not required since theamplification will be much more specific, since the complexity of thetemplate is significantly lower than for PCR1. Again a proofreading DNApolymerase should be used.
A single strong amplification product should be observed by agarose gelanalysis. Sometimes, however, two or three bands are observed, in whichcase they should all be cloned and subjected to DNA sequence analysis. Thisshould reveal the specific DNA fragment. If smearing occurs the amount ofinput DNA should be reduced and the second-round amplification repeated.An example of the result from an IPCR experiment is shown in Figure 10.7.
10.5 Multiplex restriction site PCR (mrPCR)
Although IPCR is a relatively rapid way of isolating unknown DNAsequences adjacent to a known piece of DNA, it still requires several time-
Cloning genes by PCR 243
(A) (B)M 1 2 3 4 M 1 2
Figure 10.7
Agarose gel showing the primary and secondary PCR amplification products froma typical IPCR experiment. (A) A typical amplification profile from the primaryPCR; lanes 1 and 2 represent amplification from one transposon-tagged transgenicArabidopsis line whilst lanes 3 and 4 represent amplification from a secondtransposon-tagged transgenic Arabidopsis line. (B) Results from the secondary PCRamplification; lane 1 represents amplification from primary PCR 1 and lane 2represents amplification from primary PCR 3.

consuming steps. Multiplex restriction site PCR (mrPCR) eliminates thesesteps (6) by using a set of sequence-specific primers in conjunction with aset of universal primers that have 3′-sequences corresponding to restrictionenzyme sites. Products of mrPCR are analyzed by direct automated DNAsequencing, which means that the whole procedure can be performed intwo tubes; one for the first-round PCR and the second for the nested PCR.
Two overlapping primers should be designed from the region of knownDNA sequence so that nested PCR can be performed. In addition, fouruniversal primers should be designed that have 3′-sequences matchingcommon restriction sites. Any restriction sites can be used, but formaximum success common six-base recognition site enzymes such as EcoRI,BamH1 and XbaI are recommended. In some cases six-base enzymes givelittle success due to the rare distribution of such sites, in which case a four-base recognition site enzyme, such as Sau3A, should be used. For thefirst-round PCR the outermost sequence-specific primer (Figure 10.8; SP1)should be used together with all four universal primers (Figure 10.8; UP1–4).A 5-fold excess of each universal primer should be used compared with thespecific primer. So, in a 50 µl reaction use 50 pmol of the specific primerand 250 pmol of each universal primer. The PCR should be performed asfor a standard amplification reaction; however, an extended annealing timeof 2 min is recommended and in case of long amplification products, a 3–4min extension time should be used for a total of 40 cycles. For the second-round nested PCR, 1–10 µl of the first round PCR should be used togetherwith the ‘nested’ specific primer (Figure 10.8; SP2) and the four universalprimers (Figure 10.8; UP1–4). After agarose gel electrophoresis one productshould appear, although this is not always the case. If two or three ampli-fication products are present they should all be gel purified (Chapter 6) andsubjected to DNA sequencing (Chapter 5). Even if only one amplificationproduct is present, it is best to gel purify it prior to DNA sequencing. Oncethe DNA sequence has been determined and the identity of an ampli-fication product has been verified, the remaining purified DNA fragmentshould be cloned (Chapter 6) for further analysis.
10.6 Vectorette and splinkerette PCR
Vectorette PCR, also called bubble PCR, was first described by Riley andcolleagues (7) as a method for determination of yeast artificial chromosome(YAC) insert–vector junctions. Vectorette PCR provides a method for uni-
244 PCR
GAATTC
GAATTCC
TCTAGA
GATC SP1SP2
UP4UP2
UP3UP1
Region of knownDNA sequence
Figure 10.8
Multiplex restriction site PCR. Sequence-specific nested primers SP1 and SP2 areused in combination with various general primers that carry 3′-terminal sequencescorresponding to restriction enzyme sites (UP1–4).

directional PCR amplification and is useful for a number of applicationsincluding genome walking, analysis of gene structure, promoter cloningand sequencing of YAC and BAC (bacterial artificial chromosome) clones.Vectorette PCR is based on the digestion of DNA and the addition ofspecially designed adaptors to the digested ends, followed by PCR ampli-fication using a linker-specific primer and a sequence-specific primer (Figure10.9). The adaptors are not completely complementary over their entire
Cloning genes by PCR 245
Genomic DNADigest with 5 differentrestriction enzymesLigate to 5 different adaptors
Genomic libraries
Example amplificationfrom one library
Ligate vectorette adaptors
Primary PCR
GSP1
No product
First cycle product
AP1 GSP1
PCR 1 product
Secondary PCR with nested primers
AP2 GSP2
Final products
Figure 10.9
Principle of vectorette or genomic walking techniques. Total genomic DNA isdigested with different restriction endonucleases followed by ligation to adaptorsof known DNA sequence. The generated genomic libraries are then subjected toamplification using an adaptor primer (AP1) and a gene-specific primer (GSP1).AP1 is specific to only one strand of the vectorette adaptor and therefore can onlycopy DNA after the first cycle of PCR when the GSP1 copies the vectoretteadaptor strand to yield a sequence to which the AP1 can anneal. In cases wherethere is no GP1-directed DNA synthesis no sequence complementary to AP1 isformed and therefore AP1 cannot amplify any DNA. Following the primary PCRamplification a nested amplification is performed using a nested adaptor primer(AP2) and a nested gene-specific primer (GSP2).

length. There is a central region of sequence difference that leads to anunpaired bubble in the adaptor as shown in the example in Figure 10.10(A).This means that there is no sequence in the adaptor that is complementaryto the adaptor-specific primer. Such a complementary sequence is onlyformed during the first cycle of PCR when the gene-specific primer isextended and copies the asymmetric adaptor strand (Figure 10.9). Thepurpose of such asymmetry in the adaptor is to prevent amplification frommolecules that do not contain the target sequence. For the isolation ofgenomic regions next to a known DNA sequence, between 2 and 5 µg ofgenomic DNA should be digested with various blunt-end producingrestriction endonucleases. Between three and five different ‘blunt-cutters’should be tested in order to ensure that the length of the subsequentfragment is within the range of efficient PCR amplification. The vectoretteadaptors should then be ligated to the ends of the digested DNA, in effectgenerating a number of genomic vectorette libraries. It is now possible toperform PCR amplification from these libraries using sequence-specificprimers and adaptor-specific primers. Two primers should be designed forboth the known DNA sequence and the adaptors so that a second-roundnested amplification reaction can be performed in order to increase thespecificity of the overall reaction to ensure that only correct nested productsare amplified. The PCR reactions should be carried out as for standard PCRamplifications; however, it is recommended that an extension time of 2–3min is employed to ensure amplification of large genomic fragments. Also,commercially available long-range thermostable DNA polymerase mixtures(Chapter 3) often give better results. Vectorette II PCR reagents are avail-able from Sigma Genosys.
The same principle applies to the Universal GenomeWalker™ kit(Clontech), although in this case the adaptors do not contain a bubble, butone strand is short and terminated by an amine group at the 3′-end thatcannot be extended (Figure 10.10(B)). Thus the complement to the longadaptor strand, which corresponds to the primer and nested primer sites,can only be generated by DNA synthesis from the gene-specific primer.
One problem with standard vectorette technology is that many genes arepart of gene families that share considerable DNA sequence identity. Sincevectorette PCR is based on the use of a sequence-specific primer togetherwith a vectorette-specific primer one often observes coamplification ofother members of the gene family when sequence identity is sufficientlyhigh. One way to overcome this problem, when dealing with humangenome analysis at least, is to make use of vectorette libraries constructedfrom, for example, mouse cell lines that only contain a single humanchromosome in the mouse background. This technique was initiallydeveloped by Moynihan et al. (8), where specific amplification of individualgenes from the gene family responsible for early onset of Alzheimer’sdisease was successful achieved. By constructing vectorette libraries fromtwo different mouse cell lines, GM10479 and GM13139, containingchromosome 14 and chromosome 1 respectively in a mouse background,it was possible using standard vectorette PCR to amplify the individualgenes. This technique could also be used for other organisms such as plantswhere chromosome- or region-specific vectorette libraries can be made, forexample, from introgressed lines.
246 PCR

Vectorette PCR can also be used for the isolation of cDNAs. However,instead of digesting genomic DNA followed by adaptor ligation, a cDNAlibrary is constructed followed by ligation of adaptors for the subsequentPCR amplification.
Although generally a specific technique, vectorette PCR can result inunwanted nonspecific amplification involving free cohesive ends of non-ligated free vectorettes and 5′-overhangs of unknown DNA fragments. Thisis because during the first cycle of the PCR these ends are filled in by theDNA polymerase and during the subsequent denaturation step these endsare able to anneal. The complementary strand of the vectorette primer can
Cloning genes by PCR 247
(A)
(B)
ATCGTAACCGTTCGTACGAGAATCG A C5' G T 3'CTCTCCCTTCTC GTCCTCTCCTTGAGAGGGAAGAG CAGGAGAGGAATTAA-P3' A G 5' G C CAGGCAAGGAATGGAAGCTGTCTGT
5' 3'GTAATACGACTCACTATAGGGGACGCGTGGTCGACGGCCCGGGCTGGGT H2N-CCCGACCA-P 5'
Sequencing primer5' 3'ATCGCTGTCCTCTCCTT
Nested primer5' 3'ACCGTTCGTACGAGAATCGCTGTC
Vectorette primer5' 3'ATCGTAACCGTTCGTACGAGAATCGC
Adaptor primer5' 3'GTAATACGACTCACTATAGGGC
Nested primer5' 3'ACTATAGGGCACGCGTGGT
3'
Figure 10.10
Adaptor sequences. (A) Example of a vectorette adaptor showing the ‘bubble’created by the asymmetry of the central region of the adaptor, the adaptor-specific primer and nested primer as well as a primer suitable for directsequencing of the amplified product. (B) Example of a GenomeWalker™ adaptorand adaptor primers. The lower strand 3′-end is blocked from extension by theamine group and so the adaptor primer binding site is only created once a gene-specific primer has led to copying of the upper adaptor strand. On non-targetmolecules, since there is no gene-specific primer, the adaptor is not copied and soAP1 has no priming site.

then be generated from the unwanted DNA fragments, which ultimatelydecreases the specificity of the vectorette PCR. To avoid this problemsplinkerettes can be used in place of vectorettes. Splinkerettes do not havea central mismatch but have mismatches engineered within them so thatthey form loop-backed hairpin structures. This reduces the occurrence ofend-repair priming and inhibits the DNA polymerase from nonspecificpriming at the end of the vectorette. In addition, because small unwantedDNA fragments are more likely to be amplified in the PCR, splinkerettes arebetter suited for the amplification of longer DNA fragments.
10.7 Degenerate primers based on peptide sequence
The techniques described so far in this chapter, involved in the isolationof unknown DNA sequences, have relied on the presence of known DNAsequence adjacent to the unknown region to be isolated. Sometimes theonly available sequence data for a target gene are peptide sequence dataderived from the protein encoded by the target gene. In such cases, acommon way to isolate a gene of completely unknown DNA sequence fromeither cDNA or genomic DNA is to use PCR with degenerate primersdesigned on the basis of such protein sequence data (9,10). There are twoprinciple approaches to the design of degenerate primers: (i) using peptidesequence data obtained from a purified protein; and (ii) using consensusprotein sequence data from alignments of gene families.
The purification of proteins can both be time-consuming and also oftenresults in very small amounts of pure protein. However, it is often possibleto purify sufficient protein for proteolytic cleavage and gel separation withsubsequent transfer to a membrane and solid-phase N-terminal amino acidsequencing of the peptide fragments. Degenerate primers can then bedesigned by back-translation of the peptide sequence into all possible codingsequences. One of these nucleotide sequences will be the actual sequencethat encodes this peptide region in the target gene. The availability of twoor more peptide sequences should allow a segment of the target gene to beamplified either from genomic DNA or cDNA. If it is possible to obtainN-terminal sequence data from the mature protein then the orientation ofthe PCR primer is known. Often, however, mature proteins have been post-translationally modified and do not yield useful sequence data. In this caseit may not be possible to order the peptide sequence data relative to themature protein. This means that the orientations of the PCR primers are notcertain and may require the design of two primers from each region, onedirected towards the 5′-end and one to the 3′-end. In this way various combi-nations of primers can be used to ensure that one will represent the correctcombination and orientation of a primer pair (Figure 10.11). In many experi-ments involving degenerate primers the length of the expected productcannot be predicted. This is particularly true for genomic amplificationswhere introns may lie between the peptide segments encoded by differentexons. It may be possible from the limited peptide sequence information toidentify a homologue in a sequence database which will provide usefulinformation on the relative locations of peptide segments to facilitaterational primer design, and perhaps some indication of the expected size ofthe product from cDNA amplification.
248 PCR
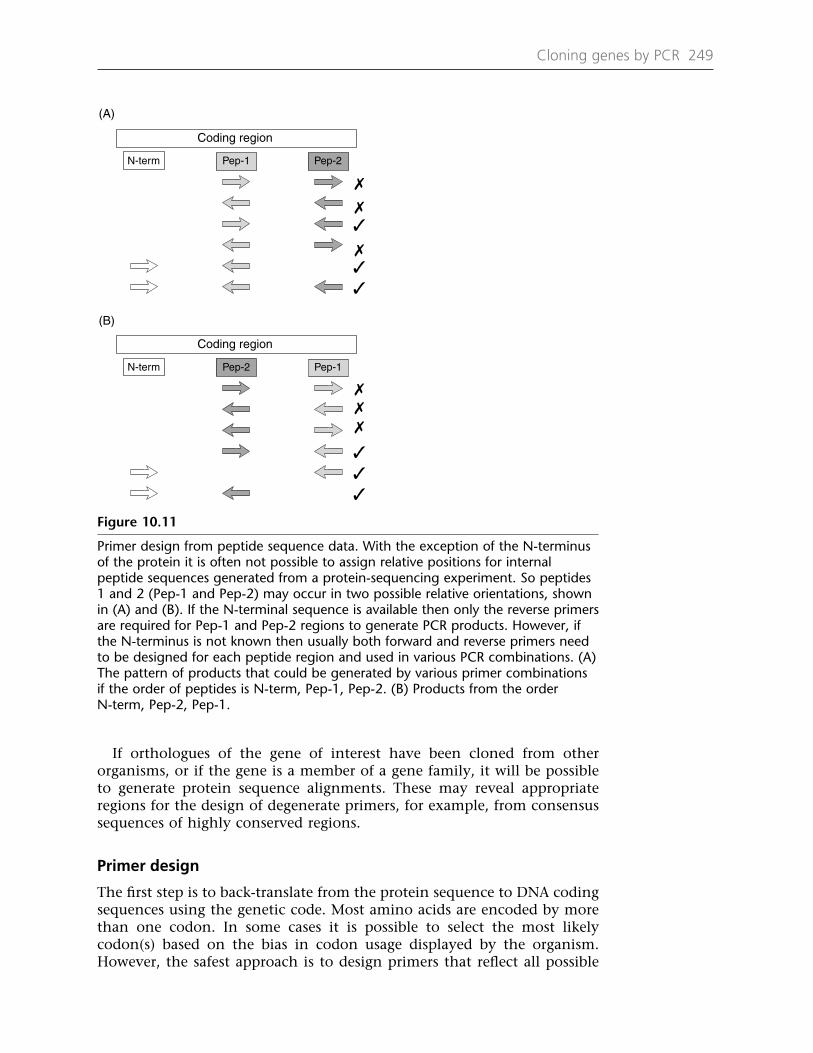
If orthologues of the gene of interest have been cloned from otherorganisms, or if the gene is a member of a gene family, it will be possibleto generate protein sequence alignments. These may reveal appropriateregions for the design of degenerate primers, for example, from consensussequences of highly conserved regions.
Primer design
The first step is to back-translate from the protein sequence to DNA codingsequences using the genetic code. Most amino acids are encoded by morethan one codon. In some cases it is possible to select the most likelycodon(s) based on the bias in codon usage displayed by the organism.However, the safest approach is to design primers that reflect all possible
Cloning genes by PCR 249
(A)
(B)
Coding region
N-term Pep-1 Pep-2
Coding region
N-term Pep-2 Pep-1
Figure 10.11
Primer design from peptide sequence data. With the exception of the N-terminusof the protein it is often not possible to assign relative positions for internalpeptide sequences generated from a protein-sequencing experiment. So peptides1 and 2 (Pep-1 and Pep-2) may occur in two possible relative orientations, shownin (A) and (B). If the N-terminal sequence is available then only the reverse primersare required for Pep-1 and Pep-2 regions to generate PCR products. However, ifthe N-terminus is not known then usually both forward and reverse primers needto be designed for each peptide region and used in various PCR combinations. (A)The pattern of products that could be generated by various primer combinationsif the order of peptides is N-term, Pep-1, Pep-2. (B) Products from the orderN-term, Pep-2, Pep-1.

codons for each amino acid (Figure 10.12). Where possible it is advan-tageous to select protein regions that have amino acids with the fewestpossible codon options (M and W [one codon]; C, D, E, F, H, K, N, Q andY [two codons]) and to avoid regions containing the amino acids L, R, andS which each have six possible codons. Degenerate primers can be producedby ‘mixed-base’ synthesis where all four nucleotide monomers are addedsuch that 25% of the oligonucleotides contain dA, 25% dC, 25% dG and25% dT at the degenerate position. An alternative approach is to include auniversal base (Chapter 3). As described in Chapter 3 it is important thatthe 3′-end of the oligonucleotide is perfectly matched to the template,avoiding either a universal or mixed base at the 3′-end. In fact, as shownin Figures 3.5 and 10.12 it is usually possible to have at least two perfectlymatched nucleotides at the 3′-end as these can correspond to codonpositions 1 and 2, which are the same irrespective of the third nucleotideof the codon, which show variation. Thus in Figure 3.5 the 3′-end of theprimer is GG, the positions 1 and 2 of a glycine codon. Of course this isanother reason to avoid Ser, Leu and Arg which also show variation incodon positions 1 and 2. Even where there are only limited peptidesequence data it is also usually possible to design a nested PCR primer. The3′-end of the PCR primer is the most critical for determining specificity of
250 PCR
(D) Primer for nested PCR(32 sequences)
GAA TGG GAC AAA GGI GAA CAC G5' G T G G T 3'
(C) Primer for PCR 1with inosine(16 sequences)
GCI GAC ACI GAA TGG GAC AAA GG5' T G T G 3'
(B) Primer for PCR 1(256 sequences)
GCA GAC ACA GAA TGG GAC AAA GG5' G T G G T G 3' C C T T
(A) Amino acid sequenceDNA sequences
A D T E W D K G E H GNNN GCA GAC ACA GAA TGG GAC AAA GGA GAA CAC GGA NNN GCG GAT ACG G T G G G T G GCC ACC C C GCT ACT T T
Figure 10.12
Example of the design of degenerate primers from amino acid sequence data. (A) The amino acidsequence can be back-translated into all possible codon combinations that might encode the regionof peptide sequence. (B) The primer for PCR represents a combination of 256 different sequences;however (C) by using inosine as a universal base for positions of four-base degeneracy the complexityof the mixture can be reduced to 16 different sequences. The primer mix is used together with anappropriate downstream primer in PCR1. (D) Due to the limited amount of amino acid sequencedata available, the nested primer overlaps with part of the PCR1 primer, but has been extended sothat the 3′-end is different. The use of a single inosine again reduces the complexity of theoligonucleotide mixture to 32 different sequences in this example.

PCR amplification, and so extending the original primer by even two orthree nucleotides at the 3′-end should be sufficient to allow amplificationof the specific target but not of any nonspecific products formed during thefirst PCR. The differential specificity of the 3′-end should impose highspecificity even though the nested primers overlap significantly with theoriginal primers.
The PCR amplification
The PCR amplification should be performed as for standard PCR, exceptthat usually a higher concentration of primers (100 pmole) is included asonly a small proportion of the primers will exactly match the template. Infact under the conditions of a degenerate primer experiment there is someflexibility, in that mismatched primers will also participate in the ampli-fication process, yielding target products that have variation within theregions corresponding to the primer sites. Amplifications using degenerateprimers can sometimes be problematic and may require optimization (seeChapter 4). The first parameter to vary is annealing temperature. It isimportant to keep the annealing temperature as high as possible to avoidextensive nonspecific amplification and a good rule of thumb is to use 55°Cas a starting temperature. Ideally if you have access to a gradient blockthermal cycler (Chapter 3) set a gradient starting from 55°C up to 65°Cusing 1°C increments. Alternatively, the magnesium concentration can betitrated from 1 mM to 5 mM in 0.5 mM steps (see Chapter 4). It can oftenbe useful to sample the reaction, every 5 cycles from 25 to 40 cycles, foragarose gel analysis, to allow comparison of relative band patterns andintensities that may indicate the accumulation of a specific product. It isbest to use a nonproofreading enzyme for PCR with degenerate primers, asthis will prevent exonuclease digestion of the 3′-end of the primer, whichwould reduce specificity. Normally experiments with degenerate primersare used to provide DNA sequence data for subsequent specific ampli-fications, which can use proofreading enzymes, or to provide ahybridization probe.
Once you are satisfied that the optimal PCR conditions have beenreached it is a good idea to perform nested PCR of the primary reactionusing a second set of degenerate primers. This most often leads to increasedstringency and the amplification of the correct unknown gene.
Further reading
McPherson MJ, Jones KM, Gurr S-J (1991) PCR with highly degenerate primers. InMcPherson MJ, Taylor GR, Quirke P (eds) PCR1: A Practical Approach,pp. 171–186. Oxford University Press, Oxford, UK.
References
1. Lukyanov K, Diatchenko L, Chenchik A, Nanisetti A, Siebert P, Usman N, MatzM, Lukyanov S (1997) Construction of cDNA libraries from small amounts oftotal RNA using the suppression PCR effect. Biochem Biophys Res Commun 230:285–288.
Cloning genes by PCR 251
2. Frohman MA, Dush MK, Martin GR (1988) Rapid production of full-lengthcDNAs from rare transcripts: amplification using a single gene-specific oligo-nucleotide primer. Proc Natl Acad Sci USA 85: 8998–9002.
3. Chenchik A, Diachenko L, Moqadam F, Tarabykin V, Lukyanov S, Siebert PD(1996) Full-length cDNA cloning and determination of mRNA 5′- and 3′-endsby amplification of adaptor-ligated cDNA. BioTechniques 21: 526–534.
4. Flouriot G, Brand H, Gannon F (1999) Identification of differentially expressed5′-end mRNA variants by an improved RACE technique (PEETA). Nucleic AcidsRes 27: e8.
5. Ochman H, Gerber AS, Hartl DL (1988) Genetic applications of an inversepolymerase chain reaction. Genetics 120: 621–623.
6. Weber KL, Bolander ME, Sarkab G (1998) Rapid acquisition of unknown DNAsequence adjacent to a known segment by multiplex restriction site PCR.BioTechniques 25: 415–419.
7. Riley J, Butler R, Ogilvie D, Finniear R, Jenner D, Powell S, Anand R, Smith JC,Markham AF (1990) A novel, rapid method for the isolation of terminalsequences from yeast artificial chromosome (YAC) clones. Nucleic Acids Res 18:2887–2890.
8. Moynihan TP, Markham AF, Robinson PA (1996) Genomic analysis of humanmultigene families using chromosome-specific vectorette PCR. Nucleic Acids Res24: 4094–4095.
9. Lee CC, Wu XW, Gibbs RA, Cook RG, Muzny DM, Caskey CT (1988) Generationof cDNA probes directed by amino acid sequence: cloning of urate oxidase.Science 239: 1288–1291.
10. Knoth K, Roberds S, Poteet C, Tamkun M (1988) Highly degenerate, inosine-containing primers specifically amplify rare cDNA using the polymerase chainreaction. Nucleic Acids Res 16: 10932.
252 PCR

Protocol 10.1 5¢-RACE
EQUIPMENTMicrocentrifuge
Adjustable heating block or water bath
Thermal cycler
Gel electrophoresis tank
MATERIALS AND REAGENTSRNA isolation kit (e.g. Qiagen RNeasy® minikit)
DEPC-treated water
Gene-specific primer 1–3 (GSP1–3)
Poly-G primer
First-strand cDNA synthesis kit (e.g. ProSTAR First-strand RT-PCR Kit, Stratagene)
or
Reverse transcriptase buffer: (AMV 10 × RT buffer; 25 mM Tris-HCl pH 8.3, 50 mM KCl, 2 mMDTT, 5 mM MgCl2)
10 mM dNTP mix and 2 mM dCTP solution
Reverse transcriptase (e.g. Qiagen)
Terminal transferase buffer: (10 × buffer; 2 M potassium cacodylate, 250 mM Tris-HCl pH 7.2,15 mM CoCl2, 2.5 µg ml–1 BSA)
Terminal transferase (e.g. New England Biolabs)
Thermostable DNA polymerase and accompanying buffer (e.g. Pwo DNA polymerase,Boehringer-Mannheim or KOD DNA polymerase).
0.8% agarose: (100 ml; 0.8 g of agarose in 100 ml of 1 × TAE)
PROTOCOL PART A – FIRST-STRAND cDNA SYNTHESIS
1. Add the following to a 1.5 ml microcentrifuge tube (finalreaction volume should be 25 µl):● 2.5–5 pmoles of GSP1;● 1–5 µg of total RNA;● DEPC-treated water up to 12.5 µl.
2. Heat samples to 70°C for 10 min to denature the RNAfollowed by chilling on ice.
Cloning genes by PCR 253
3. Centrifuge the tubes for 5 s in a microcentrifuge to collect theentire content.
4. Add the following to each tube:● 2.5 µl of 10 × RT-PCR buffer;● 1 µl of 10 mM dNTP;● 100–200 units of reverse-transcriptase (the amount
required depends on which RT enzyme is used);● DEPC-treated water up to 25 µl.
5. Incubate the reaction at 42°C for 1 h followed by heating to70°C for 10 min.
6. Sometimes it is advisable to purify the cDNA beforeproceeding but this is not strictly necessary.
PROTOCOL PART B – TdT TAILING OF THE cDNA
1. To each tube add the following:● 10 µl of 5 × tailing buffer;● 2.5 µl of 2 mM dCTP;● water up to 49 µl.
2. Heat the reaction to 94°C for 3 min followed by chilling onice.
3. Add 1 µl of TdT to each tube and incubate for 10 min at 37°Cfollowed by heat inactivation at 65°C for 10 min.
PROTOCOL PART C – PCR OF TAILED cDNA
1. Add the following to a 0.5 or 0.2 ml PCR tube in a preheatedheat block at 94°C:● 5 µl of 10 × PCR buffer;● 2 µl of 10 mM dNTP;● 20 µM of GSP2;● 20 µM of poly-G primer;● 5 µl of tailed cDNA;● water up to 49.5 µl.
2. Add 0.5 µl of Taq or other thermostable DNA polymerase.
3. Perform a standard PCR amplification.
4. Analyze amplification products on a 0.8% agarose gel.
5. If necessary perform a nested PCR amplification with GSP3and the oligo-dG primer as described in Chapter 5.
254 PCR

Protocol 10.2 Inverse PCR fromplant genomic DNA
EQUIPMENTPestle and mortar
Adjustable heating block or water bath
Microcentrifuge
Thermal cycler
Gel electrophoresis tank
MATERIALS AND REAGENTSLiquid nitrogen
Plant genomic DNA extraction kit (e.g. Nucleon Phytopure extraction kit, AmershamLifesciences)
Restriction endonucleases and accompanying buffer
Phenol-chloroform mix (e.g. phenol:chloroform:iso-amyl alcohol 25:24:1, GIBCO-BRL)
T4-DNA ligase and accompanying buffer
Gene-specific primers and nested gene-specific primers
Thermostable DNA polymerase and accompanying buffer (e.g. Pwo DNA polymerase,Boehringer-Mannheim)
1% agarose: (100 ml; 1 g of agarose in 100 ml of 1 × TAE)
PROTOCOL PART A – EXTRACTION OF PLANT GENOMIC DNA
1. Harvest fresh tissue and snap-freeze using liquid nitrogen.
2. Grind frozen tissue extensively.
3. Follow manufacturers’ instructions for the subsequent extrac-tion procedure.
PROTOCOL PART B – RESTRICTION ENDONUCLEASE DIGESTION
1. For each restriction digest use 500 ng of total genomic DNAin a total volume of 30 µl. Check that the genomic DNA hasbeen digested by gel electrophoresis.
Cloning genes by PCR 255

2. Heat-inactivate the restriction enzymes according to themanufacturers’ instructions. If heat stable, phenol chloroformextract.
3. Dilute the restriction digest five-fold in ligation mixture(ligation buffer, H2O, ligase) and incubate at roomtemperature for 6–12 hours.
PROTOCOL PART C – FIRST-ROUND PCR
1. For each restriction digest use 5 µl, and 10 µl of ligationreaction for each PCR in a final volume of 50 µl.
2. Use the innermost primers for the first-round PCR (Figure 9.5;primers 2 and 4).
3. Depending on the primer sequences use high stringency forannealing to avoid minimal nonspecific priming.
4. Perform a standard PCR using 2 min extension at 72°C andallow the reaction to proceed for 40 cycles.
5. Run 15 µl of the PCRs on a 1% agarose gel.
PROTOCOL PART D – SECOND-ROUND NESTED PCR
1. Set up three second-round nested PCRs containing 1 µl, 5 µl,and 10 µl of the first-round PCRs.
2. Use nested primers at high stringency (Figure 9.5; primers 1and 3).
3. Perform a standard PCR using 1 min extension at 72°C andallow the reaction to proceed for 35 cycles.
4. Run 20 µl of the PCRs on a 1% agarose gel.
256 PCR

Genome analysis
11.1 Introduction
Genome sequencing projects, whether bacterial, yeast, nematode, plant orhuman, have become an everyday part of scientific life. Scientific journalsand even the science section in national newspapers regularly refer togenome sequencing projects and their potential benefits. In medicine, forexample, there is development of rapid diagnostic tests and therapies fordisease treatment and prevention, including those based on gene therapies.Furthermore, diseases caused by bacterial pathogens are likely to be an areain which genomic research will have a great impact on new drug develop-ment. Prospects for enhancing food production, through more rapidmolecular breeding of crop plants and animals, are also highlighted as areasof potential benefit from genome research.
The first genome to be sequenced was the 5386 bp of bacteriophageφX174 (1) and in 1995 the first bacterial genome of Haemophilus influenzae(2) was sequenced. Almost 60 microbial genomes have now beencompletely sequenced, along with more than 100 which are still inprogress, and there is intense research to identify essential genes that maybe targeted for development of new antibiotics.
The first eukaryotic genome sequence was of the yeast Saccharomycescerevisiae that has some 6 000 genes (3,4). Global transcript analyses toinvestigate changes in patterns of gene expression when yeast cultures aregrown under different conditions are now possible. This became possiblethrough the use of microarrays or oligonucleotide chips representingunique sequences of each of the yeast genes. When such microarrays (5) oroligonucleotide chips (6; Affymetrix.com) are hybridized with fluorescentlylabeled mRNA isolated from two different cultures it is possible to detectby fluorescence which transcripts are present at increased or decreasedlevels between the two samples. This provides a picture of exactly whichgenes are affected by the culture conditions. DNA chip technology includ-ing both oligonucleotide chips and DNA microarrays will be important inmeasuring concerted changes in gene expression in many organisms,tissues and cells.
The first multicellular eukaryotic genome sequence was completed forthe nematode Caenorhabditis elegans in 1998 and the even more complexDrosophila melanogaster sequence was completed in 2000. The informationfrom these genomes offers many advantages for scientific study, particu-larly as they share many common developmental features with highereukaryotes including humans. It is possible to access the entire C. elegansgenome through over 3000 publicly available clones and oligonucleotideprimers for over 19 000 C. elegans genes can be purchased that yieldfragments of around 1.3 kbp for use in microarray and other applications(Research Genetics). The first plant genome sequencing project, of
11

Arabidopsis thaliana, was completed at the end of 2000, providing newinsights into plant gene functionality and providing a basis for comparativegenomics with crop plants. Many important crop plants, representing themost central staple foods of mankind, are also being sequenced, with therice genome completed in 2001 whilst the wheat and maize genome arestill in progress. A major landmark in biology came in 2003 when thesequence of the human genome was completed after 13 years.
The molecular mapping of genes and genetic traits and the diagnosis ofmedical conditions that derive from inheritance and/or spontaneouschanges in the genetic material will continue to represent a major appli-cation for PCR. It is not possible to describe every PCR-based techniqueused in genome mapping so we will focus on the most common and well-established techniques, including methods for analysis of mutations, forexample in medical diagnosis, and fingerprinting approaches for com-parative analysis of individual organisms in forensic applications and toprovide molecular markers for gene cloning and agricultural breedingstrategies.
11.2 Why map genomes?
The best way to understand protein functionality in any biological systemis to examine the phenotypic trait caused by a ‘gain-of-function’ or ‘loss-of-function’ mutation to address the question ‘what is the biological effectof altering the expression of one or several genes?’ Mutations, poly-morphisms, and sequence variants (MPSV) have a causal involvement inalmost all diseases with genetic components and advances in genomemapping as part of disease diagnosis is therefore extremely important. Themapping of genomes serves several purposes:
● by using the expanding number of genome-specific markers, genetictraits can be more accurately followed through generations;
● genes that cause a genetic defect can be mapped and cloned;● the mapping of genes allows the design of rapid diagnostic screens for
genetic disease traits as well as more informative genetic counseling.
While DNA sequencing provides the highest-resolution genetic analysisdata it remains relatively expensive and time-consuming, particularly forthe investigation of several markers. In order to generate the DNA forsequencing it is necessary first to amplify the corresponding segments ofgenomic DNA by PCR. However, the resolution and sensitivity of PCRmean that this technique alone can be sufficient to answer the mappingor diagnostic question without the need for detailed sequence analysis.PCR-based medical diagnosis is very sensitive for mutational detection asit is able to detect abnormal transcripts from one cell in every 106 cells.There are many PCR-based mutation detection methods that can distin-guish between the presence and absence of alleles of a target gene. As asimple illustration, consider a known genetic locus that gives rise to diseasewhen a small part of the locus has been deleted from both copies of thegene in the genome. The most rapid and reliable approach to analyze thislocus is a simple PCR assay using primers spanning the unstable region.When this region of DNA is amplified from an individual it would
258 PCR
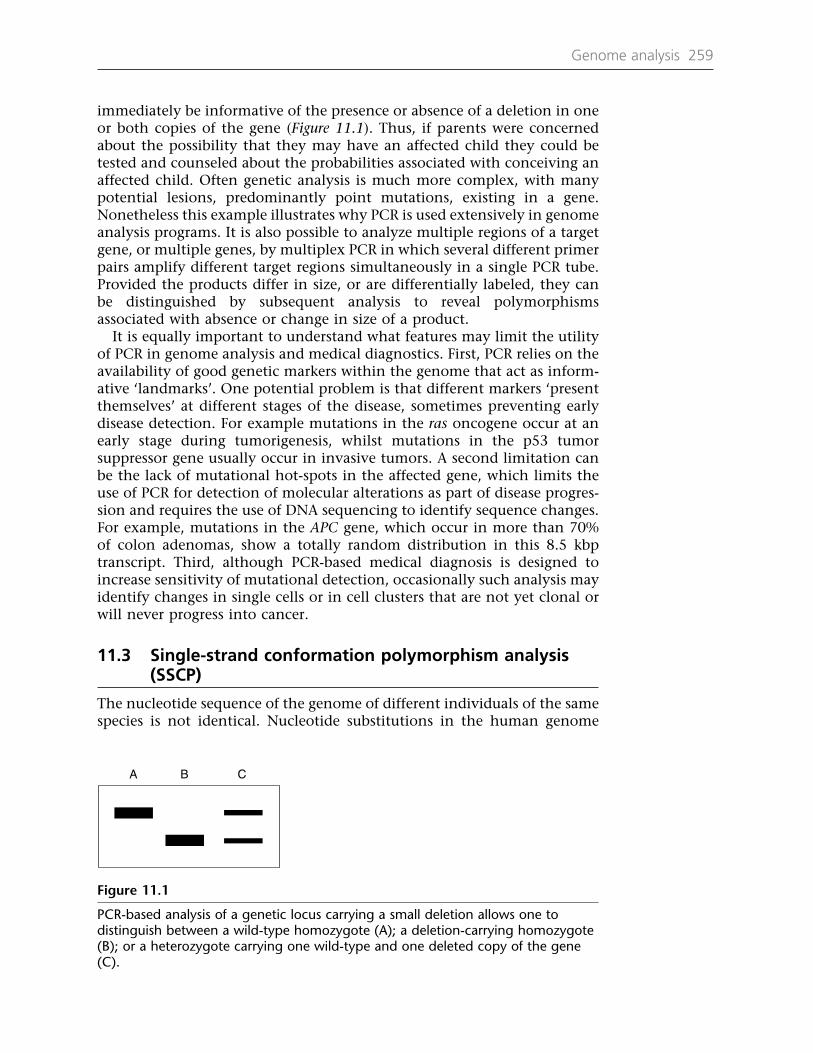
immediately be informative of the presence or absence of a deletion in oneor both copies of the gene (Figure 11.1). Thus, if parents were concernedabout the possibility that they may have an affected child they could betested and counseled about the probabilities associated with conceiving anaffected child. Often genetic analysis is much more complex, with manypotential lesions, predominantly point mutations, existing in a gene.Nonetheless this example illustrates why PCR is used extensively in genomeanalysis programs. It is also possible to analyze multiple regions of a targetgene, or multiple genes, by multiplex PCR in which several different primerpairs amplify different target regions simultaneously in a single PCR tube.Provided the products differ in size, or are differentially labeled, they canbe distinguished by subsequent analysis to reveal polymorphismsassociated with absence or change in size of a product.
It is equally important to understand what features may limit the utilityof PCR in genome analysis and medical diagnostics. First, PCR relies on theavailability of good genetic markers within the genome that act as inform-ative ‘landmarks’. One potential problem is that different markers ‘presentthemselves’ at different stages of the disease, sometimes preventing earlydisease detection. For example mutations in the ras oncogene occur at anearly stage during tumorigenesis, whilst mutations in the p53 tumorsuppressor gene usually occur in invasive tumors. A second limitation canbe the lack of mutational hot-spots in the affected gene, which limits theuse of PCR for detection of molecular alterations as part of disease progres-sion and requires the use of DNA sequencing to identify sequence changes.For example, mutations in the APC gene, which occur in more than 70%of colon adenomas, show a totally random distribution in this 8.5 kbptranscript. Third, although PCR-based medical diagnosis is designed toincrease sensitivity of mutational detection, occasionally such analysis mayidentify changes in single cells or in cell clusters that are not yet clonal orwill never progress into cancer.
11.3 Single-strand conformation polymorphism analysis(SSCP)
The nucleotide sequence of the genome of different individuals of the samespecies is not identical. Nucleotide substitutions in the human genome
Genome analysis 259
A B C
Figure 11.1
PCR-based analysis of a genetic locus carrying a small deletion allows one todistinguish between a wild-type homozygote (A); a deletion-carrying homozygote(B); or a heterozygote carrying one wild-type and one deleted copy of the gene(C).

have been estimated to occur every few hundred base pairs. The traditionalway to analyze these polymorphisms was by restriction fragment lengthpolymorphism (RFLP) analysis. RFLP analysis has been used very success-fully to create a genetic linkage map of the human genome (7) and hasgiven insight into the chromosomal locations of genetic elements thatcause hereditary diseases. While RFLP analysis is useful when distinguish-ing two alleles at a specific chromosomal locus, it has some disadvantages.First, RFLPs can only be detected if the polymorphisms are present withinthe recognition site of a restriction endonuclease or where deletions orinsertions are present in the region detected by the locus-specific probe.Second, it relies upon restriction of total genomic DNA, Southern blottingand detection of the polymorphism by hybridization with a radiolabelledprobe, followed by autoradiography. These methods are time-consumingand expensive.
To make polymorphism detection more efficient, Maniatis and coworkersshowed that denaturing polyacrylamide gels can resolve single base-pairsubstitutions from total genomic DNA due to mobility shifts caused byconformational changes of single-stranded fragments (8). It was subse-quently shown that nucleotide sequence polymorphisms can be detected byanalysis of mobility shifts of single-stranded DNA caused by single base-pairsubstitutions (9), known as single-strand conformation polymorphism(SSCP) analysis. With the increased demand for high-throughput mutationanalysis, PCR was quickly incorporated as a tool for generating fragments ofsuitable size for SSCP analysis. The following Sections describe how PCR hassimplified SSCP analysis allowing rapid detection of unknown mutations,polymorphisms and sequence variants.
The principle
PCR-SSCP analysis is based on two steps. First, the DNA sequence ofinterest is PCR-amplified and second, the amplified DNA is heat-denaturedand size-fractionated by native polyacrylamide gel electrophoresis (nativePAGE). After heat denaturation the mobility of single-stranded DNAfragments is size- and sequence-dependent, with single-stranded DNAmolecules adopting secondary structure conformations by intramolecularbase pairing (Figure 11.2). For a given double-stranded fragment there willbe two bands identified following SSCP, one corresponding to each of thetwo original DNA strands. If two fragments differ by as little as a singlebase pair, the denatured strands are likely to adopt different conforma-tions and therefore to be distinguishable following native PAGE. Thedifference is identified by a shift in mobility of one or both of the mutantbands relative to the wild-type control strands (Figure 11.2). [α32P]nucleotides are often incorporated into the products during the PCR tolabel the DNA for PCR-SSCP analysis. Alternatively, a sensitive dye, such asSYBR® Green II (Chapter 9) could be used for ‘cold’ PCR-SSCP analysis.The migration of single-stranded DNA and the conformational changes areinfluenced by the percentage of acrylamide, the electrophoresis tempera-ture and the ionic strength of the electrophoresis buffer (see below) and itis recommended that appropriately reproducible conditions are deter-mined for a given fragment.
260 PCR

The PCR reaction
One advantage of PCR-SSCP is the small quantity of template DNA neededcompared with traditional SSCP analysis. Routinely only 5–10 ng of DNAis required for each reaction, compared with SSCP analysis which normallyrequires between 5 and 10 µg of DNA. An example illustrating this point isthe PCR-SSCP based approach to fingerprint sequence variations in ribo-somal DNA of ascaridoid nematodes (10). In this example nematode eggswere collected from the uteri of gravid females by dissection and theisolated genomic DNA was sufficient to perform PCR amplification forPCR-SSCP analysis. Two primers were designed to regions of the 5.8S andthe 28S rRNA genes of C. elegans and labeled with [γ 33P]ATP. FollowingPCR it is advisable to check a small aliquot of the reaction products (1/25)on a standard 2.5% agarose gel to ensure that the amplification reactionwas successful. As discussed below, a dilution series of the amplificationreaction should be diluted in SSCP loading buffer (10 mM NaOH, 95%formamide, 0.05% bromophenol blue and 0.05% xylene blue) anddenatured at 95°C for 5 min, followed by snap-cooling before beingsubjected to native PAGE.
Genome analysis 261
Sense strandwild-type conformation
Antisense strandwild-type conformation
Sense strandmutant conformation
Antisense strandmutant conformation
1 2 3 4
Native PAGE
Figure 11.2
Principle of SSCP analysis showing that single base-pair mutation leads to changesin intramolecular conformation of single-stranded DNA fragments whichultimately leads to different electrophoretic mobilities when separated by nativePAGE. Mutants are labeled with a solid circle.

Factors affecting the quality of single-stranded DNA mobility
A number of parameters affect the quality and reproducibility of PCR-SSCPanalysis. Temperature influences the conformation of single-stranded DNAand should therefore be kept constant. Very often SSCP analysis isperformed by running gels at room temperature at low power (~ 10 W).This is acceptable if the room has temperature control such as air condition-ing. If not it is better that a constant electrophoresis temperature bemaintained by running the nondenaturing gel in the cold room (4°C) at40–50 W.
A second important factor is the percentage of acrylamide and the degreeof cross-linking by bis-acrylamide. Reduced cross-linker concentrations mayimprove the fragment separation quality. However, this is not always thecase and must be tested for the individual fragments. Adding additives tothe gel matrix may also have a positive effect on the overall separationquality. For example, addition of 2.5–10% glycerol increases purine-richfragment mobility compared with pyrimidine-rich strands due to polar-OHgroup interactions or new intermolecular hydrogen bond formation. Thisphenomenon is not limited to glycerol but is also seen when sucrose,glucose, formamide and dimethyl sulfoxide are used. It has been proposedthat glycerol makes the folded structure of single-stranded DNA morerelaxed, acting like a weak denaturing agent. Again optimal glycerolconcentrations, to achieve the best separation quality, must be determinedempirically.
The ionic strength can affect the resolution quality of the gel. In somecases it is advantageous to decrease the ionic strength of the electrophoresisbuffer to 0.5 × TBE (1 l 5 × stock solution: 54 g Tris base, 27.5 g boric acid,20 ml 0.5M EDTA pH 8.0), although this also lowers the buffering capacity.Another option is to lower the ionic strength of the stacking gel, which willincrease the sharpness of the banding pattern.
In some cases single strands anneal to form duplex DNA prior to orduring electrophoretic separation and this can affect polymorphismdetection. This is more likely to occur if several fragments are analyzed inone lane. To overcome this potential problem the PCR samples should bediluted and the extent of dilution will depend on the amount of PCRproduct. However, a good starting point is to make dilutions of 1:200, 1:50,1:10 and 1:2. Overloading the gel increases the possibility of abnormalitiesin migration patterns.
Traditionally when performing a problematic PCR an increase in primerconcentration may be advantageous, but in PCR-SSCP this is not the case.By increasing the primer concentration a dose-dependent decrease in SSCPresolution is often observed due to primer–fragment reannealing. Thisproblem can be overcome by purifying the PCR products from the primers(Chapter 6) prior to electrophoretic separation.
Fragment size for detection of polymorphisms
Using PCR-SSCP for the analysis of mutations in large fragments is difficult.The best results are achieved using fragments around 150 base pairs in lengthand fragments longer than 200 bp should not be used. If the use of larger
262 PCR

fragments cannot be avoided, it is possible to increase the chance of detect-ing polymorphisms by performing a restriction endonuclease digestion onthe fragment, which should allow the simultaneous analysis of the result-ing smaller fragments (Figure 11.3).
Genome analysis 263
PCRproduct
Sau3A digestion
Sau3A Sau3A Sau3A Sau3A
Figure 11.3
Restriction endonuclease digestion of PCR-generated DNA fragment for use inSSCP analysis. A four-base recognition site enzyme, such as Sau3A, which willrestrict the DNA on average every 256 bp, should be used.
11.4 Denaturing-high-performance liquid chromatography(DHPLC)
The high-throughput discovery and analysis of single nucleotide poly-morphisms (SNPs) relies heavily on automated techniques and ideally onlyrequires simple PCR amplification from samples. DHPLC represents such atechnique allowing the automated detection of single base pair substitu-tions and small insertions or deletions. The technique is based on the factthat under partial denaturing conditions DNA heteroduplexes, represent-ing DNA with different sequences, formed after mixing, denaturation andreannealing, will be retained less than the corresponding homoduplex ona DNA separation matrix. The stationary phase, commercially availablefrom Transgenomic Inc. as DNASep™, is made of 2–3 µM alkylated non-porous poly(styrene-divinylbenzene) particles, which allow separation ofnucleic acids by means of ion-paired reverse-phased liquid chromato-graphy. By using a hydro-organic eluent containing an amphiphilic ionsuch as triethylammonium ion and a hydrophilic counter-ion such asacetate, the separation of DNA fragments is achieved. The retention itselfis governed by electrostatic interactions between the positive surfacepotential formed by the triethylammonium ions (or similar amphiphilicions) at the stationary phase and the negative surface potential generatedby the dissociated and exposed phosphodiester groups of the DNA. Becauseof this, double-stranded DNA is retained according to the length (11).Retained double-stranded DNA is then eluted using an increase in concen-tration of an organic solvent such as acetonitrile. DHPLC has been usedsuccessfully for microsatellite analysis (Section 11.13), human identifica-tion and parentage testing, detection of loss of heterozygosity in tumors,DNA methylation analysis and quantification of gene expression (11).
Although DHPLC represents a high-throughput and sensitive method thatdoes not require special reagents or post-PCR treatment, it does require DNAsamples at the same quality as for DNA sequencing. However, by carefullydesigning your PCR (Chapter 4) this should not present a problem. For

further information on DHPLC see www.transgenomic.com and for adetailed review of DHPLC and its uses we recommend an article by Xiao andOefner (11) or the website http://insertion.stanford.edu/pub_method.html.
11.5 Ligase chain reaction (LCR)
Successful detection of single base pair allelic differences is often requiredin genetic disease detection or forensic DNA analysis. The ligase chainreaction (LCR) allows detection of single base pair substitutions with highspecificity and reliability. LCR is not really a PCR method since there is noinvolvement of a polymerase; rather amplification of the product reliesupon the action of a ligase, ideally a thermostable ligase, to join the endsof two adjacent primers. The underlying principle of LCR is the ability ofDNA ligase to ligate two adjacent oligonucleotides only if the junctionbetween the two is perfectly base-paired to the target DNA (Figure 11.4).This means that a single base-pair substitution at the ligatable end of eitherprimer would prevent ligase forming a covalent linkage.
For increased specificity, the oligonucleotides should be of a sufficientlength (>20 nt) to allow hybridization to the unique genomic target regionand the ligation reaction should be performed near to the meltingtemperature (Tm) of the two oligonucleotides. The use of a thermostableDNA ligase allows multiple cycles of LCR to be performed, allowing a linearaccumulation of ligated product. The amount of product may be furtherincreased by using both strands of genomic DNA as targets together withtwo sets of adjacent oligonucleotides complementary to each strand. Thisin effect means that the product can be increased exponentially by repeatedthermal cycling. Target-independent ligations are minimized either byaddition of salmon sperm DNA or by using oligonucleotide primers thatcreate single 3′-overhangs.
In contrast to PCR the LCR requires high-quality genomic DNA. Theoligonucleotides should be radiolabelled at the 5′-end and used directly inthe subsequent LCR; 40 fmol of radiolabelled primers should be added tothe genomic DNA followed by addition of thermostable DNA ligase. Thereactions should then be incubated at 94°C for 1 min followed by 65°C for4 min for 20–30 cycles.
The specificity of T. aquaticus DNA ligase is very high, showing efficientligation when correctly base-paired oligonucleotides are used, with near tozero ligation in the presence of a single mismatch. However, some‘incorrect’ ligation events (less than 1%) do occur, which can be overcomeby reducing the input DNA amount (12).
11.6 Amplification refractory mutation system (ARMS)
The basic principle of the ARMS assay is similar to that of the LCR assay(Section 11.5), which relies on the discrimination of the 3′-nucleotide ofprimers for different alleles. ARMS is also known as allele-specific PCR (ASP),PCR amplification of specific alleles (PASA) or allele-specific amplification(ASA). In an ARMS assay (Figure 11.5) two PCR reactions are set up usingthe same template DNA, one common primer but with different allele-specific primers (13). In one reaction a primer is used that will amplify from
264 PCR
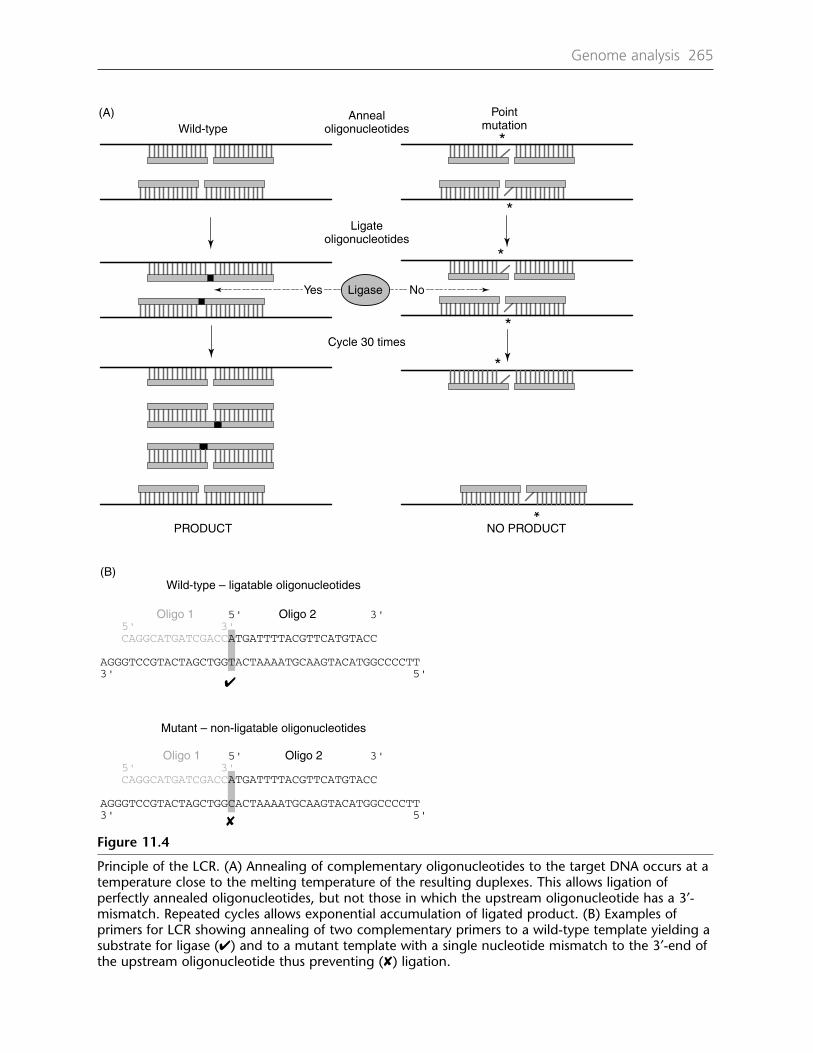
Genome analysis 265
*
*
*
*
*
*
(A)
PRODUCT NO PRODUCT
AnnealoligonucleotidesWild-type
Pointmutation
Ligateoligonucleotides
Yes No
Cycle 30 times
Ligase
(B)Wild-type – ligatable oligonucleotides
Mutant – non-ligatable oligonucleotides
Oligo 1 Oligo 2 5' 3' 5' 3' CAGGCATGATCGACCATGATTTTACGTTCATGTACC
AGGGTCCGTACTAGCTGGTACTAAAATGCAAGTACATGGCCCCTT3' 5'
5' 3' 5' 3' CAGGCATGATCGACCATGATTTTACGTTCATGTACC
AGGGTCCGTACTAGCTGGCACTAAAATGCAAGTACATGGCCCCTT3' 5'
Oligo 1 Oligo 2
Figure 11.4
Principle of the LCR. (A) Annealing of complementary oligonucleotides to the target DNA occurs at atemperature close to the melting temperature of the resulting duplexes. This allows ligation ofperfectly annealed oligonucleotides, but not those in which the upstream oligonucleotide has a 3′-mismatch. Repeated cycles allows exponential accumulation of ligated product. (B) Examples ofprimers for LCR showing annealing of two complementary primers to a wild-type template yielding asubstrate for ligase (✔) and to a mutant template with a single nucleotide mismatch to the 3′-end ofthe upstream oligonucleotide thus preventing (✘) ligation.
✔
✘

one allele while in the second, parallel reaction a primer is used that willamplify from the other allele. These primers are specific for only one allelebecause their 3′-nucleotides are different and correspond to a position ofnucleotide variation between the alleles. It is critical that Taq or a similarDNA polymerase that does not possess 3′→5′ proofreading activity is usedin PCR (Chapter 3). A proofreading enzyme would correct the mismatched3′-position on the primer, destroying the discrimination of the assay. In
266 PCR
(A) Homozygote for allele 1
Allele 1
AP1 CPProduct
No product
(B) Heterozygote
AP2
(C) Homozygote for allele 2
(D)
Allele 1
CP
Allele 1
Allele 2
AP1 CPProduct
ProductAP2 CP
AP1 CPProduct
ProductAP2 CP
Allele 2
Allele 2
AP1 AP2
B
AP1 AP2
A
AP1 AP2
C
Figure 11.5
ARMS assay for discriminating between alleles. Two allele-specific primers (AP1and AP2) are designed so that their 3′-ends are able to anneal to regions thatdiffer between the two alleles. In combination with a common primer (CP) theseallele-specific primers can amplify a product only if the allele to which they cananneal is present. Thus in (A), for an allele 1 homozygote, only AP1 can amplifythe product. The absence of allele 2 prevents AP2 from functioning. In (B), aheterozygote in which both alleles are present, both reactions will yield a product;while in (C), only AP2 can generate a product. (D) shows a schematic gelindicating the pattern of products expected from these different genotypes.

addition the enzyme should not be able to initiate DNA synthesis from amismatch site so that there is essentially no amplification and therefore noproduct. This should contrast with efficient amplification and a clearproduct when the primer is perfectly matched. The products can then beanalyzed simply by agarose gel electrophoresis (Chapter 5). Since anexpected outcome of the analysis of some DNA samples is the absence ofa product, it is important to ensure that the PCR is working efficiently andthe simplest way of ensuring this is to co-amplify a different genomic regionusing control primers.
Primers for an ARMS assay are designed from genomic DNA sequenceand should ideally be around 30 nucleotides in length. Discrimination maybe enhanced by introducing further mismatches close to the 3′-end of theprimer, although if these are not carefully considered, yield may be compro-mised. The closer to the 3′-end a destabilizing mismatch is placed the moresignificant the destabilizing effect. Not all mismatches are equallydestabilizing, with the following rank order: CC > CT > GG = AA = AC >GT. The effectiveness of any combination of mismatches must be deter-mined empirically for their utility in the ARMS assay being established. Thecommon primer should be of similar length, with about 50% GC contentand positioned to generate a conveniently sized ARMS PCR product. Thecontrol primers, for checking PCR efficiency, should be designed to havesimilar properties to the common primer, and these should yield a fragmentthat is of a distinct size to the ARMS product to allow simple identificationby agarose gel analysis. The common and control primers should bechecked to ensure that they do not display complementarity to the 3′-endsof either allele-specific primer. The control primers can sometimes influencethe efficiency and specificity of the ARMS assay.
ARMS analysis has been used for a large number of polymorphisms, germ-line and somatic mutations, carrier status determination, prenatal diagnosisof inherited disease and detection of residual disease during and after cancertherapy.
11.7 Cleaved amplified polymorphic sequence analysis(CAPS)
A well-established, but time-consuming method for detecting singlenucleotide polymorphisms (SNPs) is RFLP analysis. A PCR-based alternativethat has been widely used in the analysis and mapping of plant genomesis CAPS. The method relies on the fact that regions of known genes can beamplified and nucleotide differences between two alleles lead to a differ-ence in a restriction site. Thus the two alleles can be distinguished by PCRamplification followed by appropriate restriction endonuclease digestionand analysis of the products. In one case the product will be cleaved by therestriction enzyme while in the other it will not. This approach wasdeveloped by Konieczny and Ausubel (14) for 18 loci in Arabidopsis thalianato discriminate between the ecotype Landsberg erecta and Columbia. EachCAPS marker could be discriminated by at least one restriction enzymedigest which allows efficient mapping of cosegregating genes by direct PCRanalysis and restriction digestion. A limitation of RFLP and CAPS analysisis that the SNP must occur within the restriction site for an enzyme, there-
Genome analysis 267

fore the majority of SNPs will not be detectable. More recently the approachhas been modified through the use of modified primers that introduceadditional mismatches that create a restriction site only when the SNPoccurs, allowing easy discrimination between alleles (15,16). The approachrelies upon amplification of relatively short DNA fragments, as therestriction site is being introduced within the primer and therefore ingeneral the size discrimination between the two alleles will only be around20 or so base pairs. For example, the two alleles shown below can bediscriminated by the primer-directed introduction of a G in place of an Aleading to the introduction of a MboI restriction site (15).
The use of the primer to amplify from both alleles:
Primer GGATCTCGCCGAGAACGAAllele 1 ...GGATCTCGCCGAGAACAACCGTGGAG...Allele 2 ...GGATCTCGCCGAGAACAATCGTGGAG...
leads to PCR products that differ in their ability to be cleaved by MboI thatrecognizes the sequence GATC:
Allele 1 ...GGATCTCGCCGAGAACGACCGTGGAG...Allele 2 ...GGATCTCGCCGAGAACGATCGTGGAG...
11.8 SNP genotyping using DOP-PCR
SNP genotyping is generally performed by PCR amplifying SNP-containingloci individually. Although multiplexing can increase the speed of SNP geno-typing, the difficulty of predicting and determining compatibility as thecomplexity increases is challenging (Section 11.11). A method has beendeveloped that achieves a broader representation of possible amplifiablesequences by applying degenerate oligonucleotide-primed (DOP)-PCR withSNP genotyping (17). During the amplification step the partially degenerateprimers bind to many sites within the genome and amplify a product wheretwo sites lie close to one another in opposite directions. This results in ampli-fication of a mixture of DNA fragments many of which contain SNPs.Following this the SNPs can be subjected to genotyping directly from theDOP-PCR.
DOP-PCR utilizes a partially degenerate primer where about one-third ofthe positions in the center of the primer are degenerate. It has been shownthat by varying the length of the unique region from six to ten nucleotidesDOP-PCR results in a genome complexity reduction that supports effectiveSNP genotyping in species such as human, mouse, and Arabidopsis thaliana(17). When the 3′-end of such a degenerate primer consists of six uniquenucleotides, a huge proportion of any eukaryotic genome can be amplified,most often resulting in a smear of DOP-PCR products on a denaturingPAGE. However, by increasing the number of unique nucleotides to eightor ten a discrete number of products is generally observed, and in terms ofthe human genome such primers result in the amplification of a fewhundred unique products.
Fragment size is affected by the DOP-PCR cycling parameters and a two-part cycling program should be used. The first five cycles should have a verylow annealing temperature followed by 35 cycles at a higher annealing
268 PCR

temperature. This ensures primer binding during the initial cycles whereasthe later cycles improve specificity and yield. By lowering the annealingtemperatures and/or shortening extension times, the size range of theamplified products can also be shifted downward.
A critical factor for the use of a reduced-complexity genome-wide PCRamplification for SNP genotyping is the reproducibility of the PCR. Usingthe same parameters on 32 human genomic DNA samples on two differentthermocyclers, Jordan et al. (17) obtained similar banding patterns, demon-strating the robustness and reproducibility of the technique.
DOP-PCR product complexity is the most important variable for directSNP genotyping. If the complexity is too low, then only a few SNP-contain-ing fragments are amplified. However, as the complexity approaches thatof the whole genome, the efficiency and accuracy of SNP genotypingbecomes problematic. The effectiveness and accuracy of direct SNP geno-typing on DOP-PCR products has been shown by sequencing samples ofSNPs from fragments amplified in nine DOP-PCRs from human, mouse, andArabidopsis.(17).
11.9 Random amplified polymorphic DNA (RAPD) PCR
RAPD-PCR is also known as arbitrarily primed PCR (AP-PCR) and is arelatively rapid PCR-based genomic fingerprinting method. However, dueto occasional production of nonparental products it is not recommendedfor use in such applications as paternity testing where unequivocal resultsare demanded. It provides a very useful tool for genome analysis inbacterial, fungal and plant identification and population studies whereindividual isolates can be compared rapidly. For example they can be usedto identify pathogens or the occurrence of particular strains/pathotypes,and RAPD markers that cosegregate with pathogenesis traits can provide animportant tool for identifying pathogenic strains of bacteria and fungi. Inplant studies RADP-PCR provides a useful tool for plant breeding programsby providing markers associated with traits to examine trait heritability.The approach is also used for the detection of abnormal DNA sequences inhuman cancer. Commonly, AP-PCR genomic fingerprints of DNA fromnormal and tumor tissue can be used to compare deleted or amplified DNAsequences in cancer cells.
AP-PCR uses a single primer to initiate DNA synthesis from regions of atemplate where the primer matches imperfectly. In order for this to work,the initial cycles have to be performed at low stringency (37–50°C), normallyfor the first five cycles, which allows hybridization to imperfect sites through-out the genome. The stringency is then increased (55°C) as for standard PCRamplification and the reaction allowed to proceed for an additional 30–35cycles. In effect this means that only the best mismatches during the initialamplification cycles are further amplified. By careful optimization it ispossible to obtain between 50 and 100 distinct DNA fragments which canthen be separated by PAGE. Since AP-PCR is based on arbitrary amplificationunder low stringency conditions, various genomic regions can be amplifiedsimultaneously in a single PCR amplification. AP-PCR can allow visualizationof deleted or amplified DNA fragments with different intensities, which inturn allows genomes to be differentiated in a quantitative and qualitative
Genome analysis 269

manner. However, although intensity differences may be observed they maynot represent real deletions or amplifications but may reflect geneticpolymorphisms in the human population.
A key advantage of AP-PCR is that targeted DNA fragments can be re-amplified and cloned using the same primers as used in the initial PCRamplification. However, there are also problems associated with AP-PCR.First, the reproducibility of the banding patterns may vary from day to dayeven when using the same conditions and the same primers. Second, it hasbeen demonstrated that both MgCl2 and template concentrations can affectthe banding pattern. Third, although low stringency conditions are usedduring the initial cycles, low annealing temperatures may also affect theoutcome of the analysis.
11.10 Amplified fragment length polymorphisms (AFLPs)
AFLP displays a subset of PCR products derived from restriction digestionof genomic DNA (18). Genomic DNA is digested with a restriction enzymeand then double-stranded oligonucleotide adapters are ligated to the endsof the fragments. A subset of fragments is then amplified by PCR usingprimers designed to include part of the adapter, the restriction site andabout three nucleotides beyond the site. Since only a proportion of the DNAfragments will display complementarity to these three 3′-nucleotides, onlythis subset of fragments will be amplified. A nonproofreading enzyme suchas Taq DNA polymerase must be used to ensure that the specificity of the3′-end of the primer is maintained. The result is that many fragments willbe simultaneously amplified and a radiolabeled dNTP can be included tolabel the products, which can be separated by electrophoresis through aDNA sequencing gel.
The approach can be used to compare samples that display phenotypictraits, and bands that appear in one phenotype but not the other may repre-sent markers linked to the phenotypic marker. The use of AFLP markers canprovide powerful tools for molecular breeding strategies in both plantsand animals. The AFLP approach has also been used for comparativeanalysis of cDNA populations thus allowing differential analysis of expressedgenes (19). Detailed protocols for AFLP technology are available at(http://www.dpw.wau.nl/pv/index.htm) under the subheading Documents.
11.11 Multiplex PCR analysis of Alu polymorphisms
Alu sequences probably represent the largest family of short interspersedelements and were first defined as renatured repetitive DNA that wasdistinctively cleaved with the restriction enzyme AluI (20). In the humanhaploid genome Alus are present in excess of 500 000 copies constitutingapproximately 5% of the genomic DNA by mass and having an averagelength of 300 bp. Alus are ancestrally derived from the 7SL RNA gene andmove throughout the genome by retrotransposition (21). As geneticmarkers Alus have several exceptional features including: (i) stability ofinsertion; (ii) unknown mechanism for removal from their chromosomallocation; and (iii) some Alus have not yet reached a stable chromosomalfixation. The low rate of Alu loci that reach polymorphic levels dictates that
270 PCR

the probability of an independent polymorphic insertion into the samechromosomal site is extremely unlikely. Thus Alu insertions have provenextremely useful as genetic markers in DNA fingerprinting, populationstudies, forensic applications and paternity determinations. Rapid analysisof Alu polymorphisms is conveniently achieved using multiplex PCRtechniques with multiple primer combinations to amplify more than oneAlu locus in a single assay.
Duplex and triplex PCR reactions can be more difficult and tempera-mental than a PCR with a single primer pair. Primers for Alu amplificationshould be designed as complementary pairs directed to the 5′ and 3′ singlecopy flanking sequences of each Alu insertion. Alu sequences are easily acces-sible through databases such as ALUGENE (http://alugene.tau.ac.il/). Beforeembarking on duplex or triplex reactions it is important to ensure that thereaction conditions for each primer pair are optimized and give rise to aspecific amplification product. Samples in Alu analysis are normally ampli-fied in 50 µl reaction volumes using a titration of DNA ranging from 10 ngto 100 ng for each primer combination. Optimal primer concentrations mustbe determined empirically depending on the strength of amplification ofeach locus but typically range from 0.05 µM to 0.5 µM. For weakly ampli-fied loci the primer concentration should be increased whilst for ‘strong’ locithe primer concentration should be decreased. In addition, it is often neces-sary to have several different thermal cycler programs optimized for thedifferent primer combinations. Apart from these parameters the amplifica-tion reactions should be designed as for standard PCRs.
11.12 Variable number tandem repeats in identity testing
PCR highly polymorphic variable number tandem repeats (PCR-VNTRs) areextremely important markers in identity testing and form an integral part offorensic DNA analysis. VNTR loci variants were originally characterized byrestriction fragment length polymorphism (RFLP) analysis. However, with theadvent of the PCR, VNTR analysis methods have become more reliable bothin terms of sensitivity and specificity. VNTRs can be divided into shorttandem repeats (STRs) with a fragment length between 100 bp and 300 bpand amplified fragment length polymorphisms (AMP-FLP) with fragmentlengths between 350 bp and 1000 bp. Various commercial kits are now avail-able to facilitate such analyses. The following sections describe the use ofVNTR/STR analysis in identity testing as part of forensic DNA analysis.
Short tandem repeat (STR) amplification
STR loci are scattered around the human genome and are highly poly-morphic in length and often in the sequence of repetitive elements of 3–7nucleotides. In forensic studies allelic differences of 4–5 bp repeats are mostcommonly used (Table11.1). An advantage of STRs in forensic work is thateven partially degraded DNA often provides a template for successful PCRamplification due to the small size of the STR loci. Polymorphism analysisof STR loci is almost exclusively based on polyacrylamide gel electro-phoresis (PAGE). Agarose gel electrophoresis can also be employed to givelower-resolution data.
Genome analysis 271

General considerations
PCR allows the amplification of one or more STR loci simultaneously in amultiplex PCR. However, if sensitivity and robustness of analysis is themain issue it is advisable to amplify only one polymorphic STR. Success ofmultiplex analysis relies on different STR loci being amplified reliablytogether, which in turn relies on compatible amplification parameters suchas similar primer annealing temperatures. The migration pattern of differ-ent STRs is also important and, particularly for manual analysis, differentSTR loci should ideally not yield overlapping mobility patterns. However,fluorescent-labeled primers with different fluorophores are increasinglyused to successfully analyze alleles of overlapping sizes using analyticalequipment such as an automated DNA sequencer.
PCR amplification
PCR amplification parameters for STR analysis are essentially the same asfor a standard PCR (Chapter 2). However, there are some general consider-ations that should be noted. All procedures should be performed understerile conditions using gloves, aerosol-resistant pipettes and a laminarairflow sterile bench (Chapter 4). The amount of template DNA is particu-larly crucial for successful amplification and should be in the range 1–25ng. It is critical to include a positive control for the amplification and inmost forensic DNA analysis cases, DNA from cell line K562 is employed forthis purpose, which can be purchased from commercial sources. Anothercritical consideration is the number of amplification cycles that should beadjusted for each STR locus. It is advisable not to exceed 30 cycles due tothe increased chance of nonspecific amplification.
272 PCR
Table 11.1 Commonly used STR loci in forensic studies
STR locus Chromosomal location Repeat sequence 5’→3’ Primer sequences 5’→3’
HUMFES/FPS 15q25–qter AAAT GGG ATT TCC CTATGG ATT GG
GCG AAA GAA TGAGAC TAC AT
HUMF13A1 11p15.5 AATG GAG GTT GCA CTCCAG CCT TT
ATG CCA TGC AGATTA GAA A
HUMCSF1PO 5q33.3-34 AGAT AAC CTG ACT CTGCCA AGG ACT AGC
TTC CAC AGA CCACTG GCC ATC TTC
HUMTPOX 2p23–2pter AATG ACT CGC ACA GAACAG GCA CTT AGG
GGA GGA ACT GGGAAC CAC ACA GGT

Detection of polymorphic STRs
Perhaps the most important aspect of polymorphic STR analysis is thedetection of allelic differences after the PCR amplification itself. Mostlaboratories now use automated detection of STR profiles using fluorescentlylabeled primers in conjunction with automated DNA sequencers. In mostcases a fluorophore is attached to the 5′-end of one primer, becomingincorporated into the amplified product, which in turn can be detected byusing an automated DNA sequencer. If such instruments are not availablethere are manual detection methods using agarose and PAGE. Both yieldgood results although with differing resolution. Agarose gels can distinguishamplification products differing by 4 bp when using an agarose concentra-tion between 4 and 5% whilst polyacrylamide gels can accurately distinguishalleles differing by a single base pair. The main advantages of agarose gelelectrophoresis are that it is simple and cheap, and amplification productscan be rapidly analyzed which in turn speeds up optimization experiments.A further advantage is that the amplification products can be loaded directlyonto the gel and subsequently manipulated. However, for more complexSTR profiling, such as multiple loci amplification procedures, PAGE is recom-mended due to the improved resolution of amplification products. PAGEhas been described elsewhere in this book (Chapter 8) although it is worthhighlighting factors that may affect the overall result. Nondenaturing PAGEconditions have both advantages and disadvantages over denaturingconditions. Nondenaturing conditions allow additional variants of STRprofiling to be detected such as differences in hypervariable allelic regions.However, a large number of STRs are A/T rich and hence show electro-phoretic anomalies due to helical axis distortion. A second problem withnondenaturing conditions is that intra-allelic differences are most often onlydetected under very specific conditions, which means that standardconditions must be used in each analyzing laboratory. For maximumreliability and consistency the use of denaturing PAGE is therefore recom-mended.
Validation studies
Before any new STR system can be used as part of forensic work it shouldbe extensively validated to ensure reliability of the results. The importanceof validation studies for forensic DNA profiling cannot be overemphasized.We will describe several important points related to STR validation belowwhilst further information on STR validation studies can be found athttp://www.cstl.nist.gov/biotech/strbase/valid.htm and in Anderson et al.(22). In cases involving population studies, a rule of thumb is to examine aminimum of 200 unrelated individuals or 500 meioses for each STR systemto determine allele frequencies, Mendelian inheritance and mutationnumbers. Furthermore, it is very important that the PCR system employedresolves allelic differences from complex mixtures of material such as vaginalcells/semen, saliva, hair roots and blood. In effect this means that theextraction procedure, the storage conditions for PCR mixtures, and thesubsequent PCR amplification must be tested for reliability and consistencybetween various sample mixtures and individuals.
Genome analysis 273

11.13 Minisatellite repeat analysis
Minisatellite repeat coding as a digital approach to DNA typing waspioneered by Professor Sir Alec Jeffreys (23) and although an ‘old’ techniquein terms of PCR applications the approach deserves recognition and con-sideration due to its enormous impact on DNA typing.
Minisatellite repeat coding is based on assaying sequence variations inminisatellite alleles rather than length differences. Minisatellite alleles varynot only in the number of repeat copies but also in the interspersion patternof variant repeat units. The hypervariable locus D1S8 (MS32 probe) showstwo classes of repeat units, a-type and t-type, that differ by a singlenucleotide substitution which creates/destroys a HaeIII restriction endo-nuclease site. Before the development of the minisatellite repeat codingtechnology, HaeIII positive and HaeIII negative repeat units were deter-mined by PCR amplification of the entire allele followed by partial HaeIIIdigestion. This approach was limited in that alleles larger than 5 kb wereoutside the range of efficient PCR amplification. The development of theminisatellite repeat coding technology now allows minisatellite variantrepeat (MVR) mapping of MS32 alleles of any length. The technique,outlined in Figure 11.6, is based on using two MVR-specific primers thatprime from either an a-type or a t-type repeat unit and a primer that is fixedin the minisatellite flanking DNA (32D). The a- or t-type specific primerseach carry a 5′-tail called the TAG sequence that becomes incorporated intoall the products. Initial PCR amplification occurs at low selective primerconcentration (a-type or t-type specific) to generate two ladders of productsfrom the ultravariable end of any MS32 allele. These products terminate in32D and TAG sequences and so are efficiently amplified by the highconcentrations of the 32D and TAG primers in the reaction, generatingladders of PCR products that are detectable by Southern blot analysis. Theladders normally extend beyond 3 kb (100 bp units) into each allele whichcan then be used for the generation of allele binary codes. It is possible toincrease the number of amplification cycles and to visualize the ampli-fication products directly using ethidium bromide; however, over-amplification can also lead to the loss of minisatellite information for thefirst 10–15 repeat units. The variation in diploid codes is easily detectedusing minisatellite repeat coding. Jeffreys et al. (23) demonstrated this byperforming MVR-PCR typing of 334 unrelated individuals revealing anaverage of 30 code mismatches per pair of individuals within the first 50repeat units. It was shown that no two individuals had the same MVR codeand all individuals could be distinguished using only the first 17 repeatunits. MVR-PCR is very simple and also sensitive and has been usedextensively in forensic DNA analysis. Profiles can be generated from as littleas 10 ng human DNA. Even less DNA can be used although this often givesrise to random fluctuations in band intensities. The technique can also beemployed when dealing with degraded DNA because the only requirementfor minisatellite repeat typing is the presence of the 32D primer and at least30 repeat units. MVR-PCR can also be used for mixed samples, particularlyif pure DNA is available from one of the individuals. As a result MVR-PCRis often used in rape cases where pure DNA is available from the victim.MVR-PCR analysis procedures have been described extensively elsewhere
274 PCR

(24) and so only some guidelines on how this technique is performed willbe considered.
Normally, isolated human DNA is used directly for the MVR-PCR ampli-fication. However, if new allelic mutations are to be detected, digestedhuman DNA should be size fractionated by agarose gel electrophoresis prior
Genome analysis 275
(A)
(B)32D
32D
32-TAG-A
32-TAG-A
M32 repeat unit
Primers
HaeIII (GGCC) G5' G CCAGGGGTGACTCAGAATGGAGCAGG 3' A
32-TAG-A 3' CGGTCCCCACTGAGTCTTACAGGCCTGGTACCTGCGTACT 5'
32-TAG-T 3' AGGTCCCCACTGAGTCTTACAGGCCTGGTACCTGCGTACT 5'
TAG 3' AGGCCTGGTACCTGCTGACT 5'
Figure 11.6
Minisatellite variant repeat (MVR) mapping. Minisatellite alleles occur in twodistinguishable forms, a-type (shaded box) carrying a HaeIII restriction site and t-type (open box) with a single base change that destroys the HaeIII site. (A)Primers that discriminate between the a-type and t-type arrays differ at the 3′-nucleotide and carry a common 5′-TAG sequence (underscored). (B) MVRprinciple showing the products of a-type and t-type amplification reactions usinglow concentrations of the 32-TAG-A and 32-TAG-T primers in parallel reactions,under which conditions there is expected to be a single priming event from eachminisatellite molecule. These initial products carry sites for the 32D and the TAGprimers, which are present at high concentrations and can therefore efficientlyamplify the initial products to generate a set of products spanning between the32D priming site and each a-type or t-type repeat unit in the minisatellite. PCRproducts are separated through an agarose gel and detected by Southern blothybridization.

to MVR-PCR. This ensures that a series of DNA fractions are collected thatcontain DNA fragments that are smaller than the progenitor alleles andtherefore should contain de novo deletions. Without size fractionation thedetection of new mutations can be very difficult since contamination fromthe progenitor alleles, due to PCR amplification, can mask the detection of‘new’ mutations.
Standard MVR-PCR amplifications should be performed using between0.3 and 0.5 µg of human DNA in a final volume of 50 µl. The amplifica-tion reaction should contain all standard components for a PCR althoughthe amplification cycles vary slightly from ‘normal’ PCR amplifications. Forexample, for MS32 allele mapping there is an extension time of 4 minwhich is performed for between 25 and 30 cycles. Following the PCR, theamplified alleles are detected on a 0.8–1% agarose gel and the separatedproducts visualized by ethidium bromide staining. If single molecularanalysis is performed, the PCR should be carried out in one-fifth of thevolume of a standard amplification reaction and normally the detectionmethod of choice is Southern blot hybridization using, in this case, anMS32 radiolabeled minisatellite probe.
11.14 Microsatellites
One limitation of VNTRs (Section 11.12) is that they are often located neartelomeres. Another form of polymorphic repeat that does not show this biasis microsatellites, also known as TG or CA repeats. There are some 50 000to 100 000 such repeats each of 10–60 copies of the dinucleotide. Theserepeats also show variation in length and therefore provide useful molecularmarkers (25). PCR primers can be defined from clones carrying micro-satellites that allow the amplification of the dinucleotide repeat unit, butavoiding any complementarity to Alu repeat sequence. Since the variabilityin length is due to increases or decreases in the number of dinucleotides, itis important that the fragments being amplified are relatively small, consist-ing mainly of the repeat region, so that small dinucleotide differences canbe readily resolved. There is a common problem observed with microsatelliteanalysis due to extra or so-called ghost bands. These may arise due tomispairing slippage of the DNA polymerase during copying of the dinucleo-tide repeat units.
The products of PCR can be detected either by [γ 32P] end-labeling one ofthe primers, or incorporating [α32P]-dCTP into the PCR product, with subse-quent detection by autoradiography or a phosphorimager. Increasingly,fluorescent end-labeled primers are being used with automated sequencerdetection. Fluorescent labels such as FAM, HEX, ROX or TET (Chapters 3and 9) can be used. However, one potential problem with this approach isthe cost of primer synthesis as the fluorescent group additions can beexpensive. This is not an issue for high-throughput large laboratories thatwill use all the primers, but for smaller laboratories perhaps only a smallquantity of the labeled primer will be used and the remainder will bewasted. To overcome this potential problem a common fluorescentlylabeled primer should be utilized that can be used in each analysis, togetherwith sequence-specific primers for the microsatellites. In an example givenby Schuelke (26) the M13 (–21) primer (Chapter 5) was selected. The basic
276 PCR

strategy requires that the forward sequence-specific primer is synthesizedwith a 5′-extension corresponding to the commonly used sequence and thereverse primer is designed as a normal primer with no extension. Theseunlabeled primers are inexpensive. The PCR is set up with the unlabeledforward primer (2 pmol), the labeled common primer (8 pmol) and thereverse primer (8 pmol). There is a lower concentration of the forwardprimer than reverse and the PCR is conducted initially at a high annealingtemperature. As the reaction proceeds the forward primer leads to incor-poration of the common primer tail into the accumulating products andalso becomes depleted. During the later stages of the PCR the annealingtemperature is reduced to allow the labeled common primer to take overthe role of forward primer in the PCR, thereby labeling the products forsubsequent detection. A similar approach could be adopted for other formsof fluorescent-labeling experiments.
11.15 Sensitive PCR for environmental and diagnosticapplications
PCR provides an important tool for the sensitive detection of DNA as anindicator of the presence of an organism at low levels. Examples include:
● the detection of genetically modified organisms within a background ofnonmodified material, for food, labeling or regulatory purposes. Anexample would be the detection of transgenic soy or maize within a bulkbatch of predominantly nontransgenic material;
● the rapid detection of pathogenic microorganisms that either are presentat very low levels and would require significant time and effort to culture,or are not culturable.
In detection of GM soy or maize it has proved possible to use primers foreither single PCRs or multiplex PCRs that contain an internal positivecontrol (27). Detection of contaminating GM maize was possible down to0.001% dry weight and GM soy bean to 0.01% dry weight. The multiplexprocedure reduced the detection sensitivity by 10-fold.
Organisms that cannot be cultured, or that require exotic and time-consuming conditions, are ideal candidates for sensitive PCR assays.However, the use of PCR is sometimes limited by the amount of DNAsequence information that is known from the organism concerned. Theamplified sequences must be specific to the target organism, particularly asthere are likely to be significant amounts of nontarget DNA present; forexample, host DNA in detection of an infective pathogen.
A variety of diagnostic kits are available for common human viralpathogens, including human immunodeficiency virus, human T-celllymphotrophic virus and hepatitis B virus, and the number and diversityof these and their routine use will also undoubtedly increase. Kits are nowavailable for identification of a range of bacterial pathogens. For examplethe MicroSeq™ 16S kit (PE Biosystems) is based on PCR amplification ofthe 16S ribosomal DNA with identification by DNA sequence analysis. Twosequencing formats exist, either complete gene sequencing or, morerapidly, the first 500 nucleotides of the gene which is sufficient for identify-ing many bacteria, though is not as comprehensive as the complete gene
Genome analysis 277
analysis. In addition there is a database of more than 1200 bacterial 16SrRNA sequences with which to compare the data generated to facilitateaccurate identification. Taqman® Pathogen Detection Kits (PE Biosystems)are also available, for detection of food-borne contaminants such asEscherichia coli O157 and some 60 other serotypes. The system is based onautomated detection and the provision of a Yes/No answer rather thancomplex manual interpretation of amplification data.
A range of kits in both manual and fully automated formats are availablefrom Roche Diagnostic Systems. These allow highly sensitive detection ofinfectious organisms before they become symptomatic or elicit otherresponses such as antibody accumulation. The AMPLCOR™ range ofproducts detect HIV, hepatitis C, Chlamydia trachomatis, Neisseria gonor-rhoeae and Mycobacterium tuberculosis and the last four are also available forfull automation using the COBAS AMPLICOR™ instrument that combinesthermal cycling, automated pipetting, incubation, washing and readermodules for diagnostic analysis.
Automation and simplification of procedures, including the avoidance ofcross-contamination and simple detection, is important for ensuring widerapplication of PCR-based tests. An interesting innovation from Johnsonand Johnson Clinical Diagnostics is based on a sealed blister system forcomplete automation of the PCR and subsequent product detection (28). Aseries of blisters contain the reagents for PCR, capture of products, wash-ing and detection of product. The sample is introduced into the reactionpouch that contains biotinylated primers and reagents for hot-start PCR.After PCR, the final denatured products are physically forced into the nextblister for streptavidin–horseradish peroxidase (HRP) capture of products,then a wash solution. Product detection is by immobilized oligonucleotideprobes specific for target organisms, and detection relies upon formation ofa colored product by the action of the HRP bound to the oligonucleotideprobe via the specific PCR product.
Environmental testing for bacterial contamination in water supplies orsoil can be important for disease prevention, and PCR amplificationcoupled with hybridization detection provides a highly sensitive tool fordetection of levels as low as 1 cell per ml water. For example Legionellapneumophila, which is responsible for most cases of Legionnaire’s disease,is notoriously difficult to culture. The MicroSeq™ 16S kit (PE Biosystems)discussed above provides a useful tool for such analyses. A recent reportillustrates the use of a PCR/hybridization strategy to discriminate efficientlybetween E. coli and closely related bacteria by PCR analysis of DNA extractsfrom soil (29). The amplification target was the 16S ribosomal DNAsequence, and high-stringency annealing conditions of 72°C, well abovethe apparent Tm of the primers, was required for specificity. Other reactionconditions such as MgCl2 concentration and times were empiricallyoptimized. The use of Southern blot analysis of products allowed detectionat levels as low as 10 genome equivalents.
11.16 Screening transgenics
An obvious use of PCR is for screening genomes for the presence of aparticular gene as part of transgenic organism research programs, whether
278 PCR

bacterial, fungal, plant or animal. If a construct has been introduced intoan organism then usually some selectable marker is also introduced, allow-ing the initial selection of the transgenic lines. However, stable inheritanceof the transgene is not guaranteed and it is usually necessary to analyze thegenomic DNA to ensure all aspects of the transgene are present. Preliminaryanalysis of this type can be performed by PCR using primers designed fromdifferent elements of the introduced DNA. For example, one primer maycorrespond to a sequence in the upstream promoter region while anothermay be within the coding region (Figure 11.7). Since the DNA that has beenintroduced is well characterized it is possible to accurately predict the sizesof fragments that should be generated. Southern blot analysis can beperformed to confirm the identity of the products. Ultimately it is safest tosequence the PCR fragments that have been generated to ensure that theDNA sequence introduced has not been altered. Unfortunately this level ofanalysis is too often neglected and fragment sizes alone are often taken asindicators of appropriate integration. Clearly if required the regions flank-ing the transgene insertion site can be isolated by using methods describedin preceding sections as the situation is analogous to a transposon insertionline.
Genome analysis 279
(B)1 2 3 4 5 M
(A)1 2 3 4 5 M
Figure 11.7
PCR screening of genomic DNA from transgenic plant tissue for the presence ofintact transgenes. (A) PCR of samples 1–5 using gene-specific primers shows thepresence of the target gene in all the transgenic samples. (B) PCR of samples 1–5with a gene-specific and a promoter-specific primer demonstrates that onlysamples 1, 3 and 5 carry an intact version of the transgene. Presumably somerearrangement has led to the loss of part of the constructs in transgenic samples 2and 4. Photograph kindly provided by A. Neelam (University of Leeds).
Further reading
Reeder DJ (1999) Impact of DNA typing on standards and practice in the forensiccommunity. Arch Path Lab Med 123: 1063–1065.
Savelkoul PH, Aarts HJ, de Haas J, Dijkshoorn L, Duim B, Otsen M, Rademaker JL,Schouls L, Lenstra JA (1999) Amplified-fragment length polymorphism analysis:the state of an art. J Clin Microbiol 37: 3083–3091.
Vos P, Kuiper M (1998) AFLP analysis. In Caxtons-Arvolles G, Gresshoff PH (eds)DNA Markers, Protocols, Applications and Overviews, pp. 115–131. John Wiley &Sons, New York.

References1. Sanger F, Coulson AR, Friedmann T, Air GM, Barrell BG, Brown NL, Fiddes JC,
Hutchison CA, Slocombe PM, Smith M (1978) The nucleotide sequence ofbacteriophage phiX174. J Mol Biol 125: 225–246.
2. Fleischmann RD, Adams MD, White O, Clayton RA, Kirkness EF, Kerlavage AR,Bult CJ, Tomb JF, Dougherty BA, Merrick JM (1995) Whole-genome randomsequencing and assembly of Haemophilus influenzae Rd. Science 269: 496–512.
3. Goffeau A, Barrell BG, Bussey H, Davis RW, Dujon B, Feldmann H, Galibert F,Hoheisel JD, Jacq C, Johnston M, Louis EJ, Mewes HW, Murakami Y, PhilippsenP, Tettelin H, Oliver SG (1996) Life with 6000 genes. Science 274: 546.
4. Mewes HW, Albermann K, Bahr M, Frishman D, Gleissner A, Hani J, HeumannK, Kleine K, Maierl A, Oliver SG, Pfeiffer F, Zollner A (1997) Overview of theyeast genome. Nature 387: 7–8, Suppl.
5. Lashkari DA, DeRisi JL, McCusker JH, Namath AF, Gentile C, Hwang SY, BrownPO, Davis RW (1997) Yeast microarrays for genome wide parallel genetic andgene expression analysis. Proc Natl Acad Sci USA 94: 13057–13062.
6. Wodicka L, Dong HL, Mittmann M, Ho MH, Lockhart DJ (1997) Genome-wideexpression monitoring in Saccharomyces cerevisiae. Nature Biotechnol 15:1359–1367.
7. Donis-Keller H, Green P, Helms C, Cartinhour S, Weiffenbach B, Stephens K,Keith TP, Bowden DW, Smith DR, Lander ES (1987) A genetic linkage map ofthe human genome. Cell 51: 319–337.
8. Myers RM, Lumelsky N, Lerman LS, Maniatis T (1985) Detection of single basesubstitutions in total genomic DNA. Nature 313: 495–498.
9. Orita M, Iwahana H, Kanazawa H, Hayashi K, Sekiya T (1989) Detection ofpolymorphisms of human DNA by gel electrophoresis as single-strandconformation polymorphisms. Proc Natl Acad Sci USA 86: 2766–2770.
10. Zhu XQ, Gasser RB (1998) Single-strand conformation polymorphism (SSCP)-based mutation scanning approaches to fingerprint sequence variation inribosomal DNA of ascaridoid nematodes. Electrophoresis 19: 1366–1373.
11. Xiao W, Oefner PJ (2001) Denaturing High-Performance Liquid Chromato-graphy: A review. Hum Mut 17: 439–474.
12. Barany F (1991) Genetic disease detection and DNA amplification using clonedthermostable ligase. Proc Natl Acad Sci USA 88: 189–193.
13. Newton CR, Graham A, Heptinstall LE, Powell SJ, Summers C, Kalsheker N, SmithJC, Markham AF (1989) Analysis of any point mutation in DNA – the amplifi-cation refractory mutation system (ARMS). Nucleic Acids Res 17: 2503–2516.
14. Konieczny A, Ausubel FM (1993) A procedure for mapping Arabidopsis mutationsusing co-dominant ecotype-specific markers. Plant J 4: 403–410.
15. Michaels SD, Amasino RM (1998) A robust method for detecting single-nucleotide changes as polymorphic markers by PCR. Plant J 14: 381–385.
16. Neff MM, Neff JD, Chory J, Pepper AE (1998) dCAPS, a simple technique for thegenetic analysis of single nucleotide polymorphisms: experimental applicationsin Arabidopsis thaliana genetics. Plant J 14: 387–392.
17. Jordan B, Charest A, Dowd JF, Blumenstiel JP, Yeh RF, Osman A, Housman DE,Landers JE (2002) Genome complexity reduction for SNP genotyping analysis.Proc Natl Acad Sci USA 99: 2942–2947.
18. Vos P, Hogers R, Bleeker M, Reijans M, van de Lee T, Hornes M, Frijters A, PotJ, Peleman J, Kuiper M, Zabeau M (1995) AFLP – a new technique for DNA finger-printing. Nucleic Acids Res 23: 4407–4414.
19. Bachem CWB, Hoeven van der RS, Bruijn de SM, Vreugdenhil D, Zabeau M(1996) Visualization of differential gene expression using a novel method ofRNA fingerprinting based on AFLP: analysis of gene expression during potatotuber development. Plant J 9: 745–753.
280 PCR

20. Houck CM, Rinehart FP, Schmid CW (1979) A ubiquitous family of repeatedDNA sequences in the human genome. J Mol Biol 132: 289–306.
21. Szmulewicz MN, Novick GE, Herrera RJ (1998) Effects of Alu insertions on genefunction. Electrophoresis 19: 1260–1264.
22. Anderson TD, Ross JP, Roby RK, Lee DA, Holland MM (1999) A validation studyfor the extraction and analysis of DNA from human nail material and itsapplication to forensic casework. J Forensic Sci 44: 1053–1056.
23. Jeffreys AJ, MacLeod A, Tamaki K, Neil DL, Monckton DG (1991) Minisatelliterepeat coding as a digital approach to DNA typing. Nature 354: 204–209.
24. Jeffreys AJ, Neumann R, Wilson V (1990) Repeat unit sequence variation inminisatellites: a novel source of DNA polymorphism for studying allelicvariation and mutation by single molecule analysis. Cell 60: 473–485.
25. Litt M, Luty JA (1989) A hypervariable microsatellite revealed by in vitro ampli-fication of a dinucleotide repeat within the cardiac-muscle actin gene. Am J HumGenet 44: 397–401.
26. Schuelke M (2000) An economic method for the fluorescent labeling of PCRfragments. Nature Biotechnol 18: 233–234.
27. Hurst CD, Knight A, Bruce JJ (1999) PCR detection of genetically modified soyaand maize in foodstuffs. Mol Breeding 5: 579–586.
28. Findlay JB, Atwood SM, Bergermeyer L, Chemelli J, Christy K, Cummins T,Donish W, Ekeze T, Falvo J, Patterson D, Puskas J, Quenin J, Shah J, Sharkey D,Sutherland JWH, Sutton R, Warren H, Wellman J (1993) Automated closed-vessel system for in vitro diagnostics based on polymerase chain reaction. ClinChem 39: 1927–1933.
29. Sabat G, Rose P, Hickey WJ, Harkin JM (2000) Selective and sensitive methodfor PCR amplification of Escherichia coli 16S rDNA genes in soil. Appl EnvironMicrobiol 66: 844–849.
Genome analysis 281


16S ribosomal DNA, 277, 2782′,3′-dideoxynucleotide
terminator (ddNTP), 93–953′→5′ exonuclease (proofreading)
activity, 25, 36, 37, 39, 40,45, 50, 69, 125, 266
3′-dA addition (overhang), 43, 48,50, 118, 122, 124, 149
3′-anchored primer, 1943d protein structure, 157, 1583′-dT extension, 122,1233′-RACE, see also Rapid
amplification of DNA ends,238
4,7,2′,4′,5′,7′-hexachloro-6-carboxyfluorescein (HEX),31, 60, 214, 276
4′-AMDMIP, see I4′-aminomethyl-4,5′-dimethylisopsoralen
4′-aminomethyl-4,5′-dimethylisopsoralen(AMDMIP), 82
5′ phosphorylated primer, 305′→3′ exonuclease activity, 37,
40, 101, 2145′-AminoLink, 305′-capped mRNA, 1045′-exonuclease, 1665′-phosphorylated primer, 143,
1445-bromo-4-chloro-3-indolyl
phosphate (BCIP), 201, 2025-end label, 895′-extension, 1175′-fluorescein, 2035-methyl-dCTP, 1215′-phosphorylated, 1245′-RACE, see also Rapic
amplification of cDNAends, 238, 239
6-(2-deoxy-b-d-ribofuranosyl)-3,4-dihydro-8H-pyrimido-[4,5-C][1,2]oxazin-7-one 159
6-AMDMIP, see 6-aminomethyl-4,5′-dimethylisopsoralen
6-aminomethyl-4,5′-dimethylisopsoralen (6-AMDMIP), 82
6-carboxyfluorescein (FAM), 31,95, 214, 218, 276
labeled probe, 606-carboxytetramethylrhodamine,
2146-carboxy-X-rhodamine (ROX),
31, 95, 276
6-His tag, see Polyhistidine tag7 deaza-dGTP, 25, 747mGpppG, 1048-methoxypsoralen (MOP), 828-MOP, see 8-methoxypsoralen8-oxo-2′-deoxyguanosine, 26,
1598-oxo-dGTP, 26,159
[α-32P]dNTP, 26, 89, 260, 276[α33P]dNTP, 26[α35S]dNTP, 26, 194, 195β-actin, 225, 226[γ-32P]ATP, 89, 261[γ-32P]-labeled primer, 276γ-methacryloxypropyl-
trimethoxy-silane, 199γ-phosphate group of ATP, 30∆CT, 224∆Rn, 210λgt10, 234, 235, 237
ABI 3700 Genetic Analyzer, 95ABI Prism 3100 Genetic Analyzer,
95ABI Prism 377 sequencer, 95Absorbance value, 34Accuprime Pfx DNA polymerase,
43ACCUZYME DNA polymerase, 38,
45Acetonitrile, 263Acrylamide, see also
Polyacrylamide, 113, 196Actin, 193, 225, 226Adaptor, 245
adaptor ligation, 239adaptor primer, 238, 246, 247,
270Advantage® 2 PCR mix, 48Advantage®-GC 2 system, 50Advantage®-Genomic DNA
polymerase mix, 48Advantage®-HF 2 PCR kit, 50AdvanTaq® DNA polymerase, 48,
50Aerosol, 79
prevention, 54, 272resistant pipettes, 54, 272
Affymetrix gene chips, 204, 257Aflotoxin, 230AFLP, see Amplified fragment
length polymorphismAgarose, 20, 112–114, 208, 253,
255
gel electrophoresis, 83, 87, 89,91, 97, 113,114, 188, 190,202, 256, 267, 271, 273,275, 276
low-melting-temperature, 113,114
Metaphor®, 88NuSeive GTG, 88
Agricultural breeding, 258Air cycler, 56, 57, 60Alkali dentauration, 97Alkaline phosphatase (AP), 90,
103, 117, 118, 124, 201Allele binary code, 274Allele discrimination, 230Allele-specific amplification
(ASA), 264Allele-specific PCR (ASP), 43, 264Allele-specific primer, 267Allelic difference, 264Alu
insertion, 271polymorphism, 270–271repeat, 276sequence, 270
ALUGENE database, 271Amber, 53Amino acid sequence, 32, 91AminoLink, 30, 31Ammonium Chloride, 66AmpErase®, 81Amplicon, 211, 212AMPLICOR™ system, 278Amplification plot, 210Amplification refractory mutation
system (ARMS), 264,266–267
Amplified fragment lengthpolymorphism (AFLP), 270,271
Amplimer, 9AmpliTaq® DNA polymerase FS,
101AmpliTaq® DNA polymerase, 39,
93, 101AmpliTaq® Gold, 39Ampliwax, 70AMV reverse transcriptase, 51AMV, see Avian Myeloblastoma
VirusAncient DNA, 53Animal tissue, 52Annealing, 4, 9, 12, 18, 19, 22,
24, 29, 30, 66–68, 74, 127,195
Index

Antibiotics, 257Antibody, 202
antigen interaction, 137anti-His tag, 104DNA, 103
Antisense primer, 238Antisense RNA, 206AP, see Alkaline phosphataseAP-PCR, see Arbitrarily primed
PCRArabidopsis thaliana, 190, 226,
243, 267, 268genome, 258
Arbitrarily-primed PCR (AP-PCR),269, 270
Archeological sample, 53ARMS, see Amplification
refractory mutation systemAscaridoid nematode, 261Aspergillus, 230Asymmetric cyanine dye, 220Asymmetric PCR, 97, 98
product, 100ATP, 30, 120Atrizine hydrolase, 166att recombination sites, 129Automated DNA sequencer, 95,
272, 273Automated DNA sequencing, 96,
244Automation
PCR set-up, 96template preparation, 96
Autoradiography, 95, 102, 104,260, 276
Avian Myeloblastoma Virus(AMV), 186, 187
Avidin-bound biotinylatedalkaline phosphatase, 201
BAC, see Bacterial artificialchromosome
Back translation, 34, 91Background fluorescence, 210Bacterial artificial chromosome
(BAC), 51, 245Bacterial
contamination, 278cultures, 52genome, 257, 269pathogen, 257, 277
BacteriophageΦX174 genome, 257lambda, 129M13, see also M13, 138
BamH1, 244Base pairing, 3, 36Baseline, 210Base-specific DNA ligand, 197BCIP, see 5-bromo-4-chloro-3-
indolyl phosphateBetaine (N,N,N-trimethylglycine),
51, 73, 74BigDye® terminator, 95, 101, 113
Binding assay, 137Biotechnology, 137, 209Biotin, 30, 44, 98
dUTP, 102label, 26phosphoramidite, 30
Biotinylatedoligo-dT primer, 234oligonucleotide, 102, 103primer, 99, 278
BIO-X-ACT DNA polymerase, 38BIO-X-ACT Long DNA
polymerase, 50Bis-acrylamide, 196Bis-tris propane, 24Blocker, 218Blood, 75, 273Blunt end, 120
cloning, 45, 124ligation, 116
BP clonase, 129–131BRCA genes, 230Breast cancer susceptibility, 230Bromodeoxyuridine, 26Bromophenol blue, 88Bst DNA polymerase, 94Bubble PCR, 244Buffer, ionic strength, 29
C. therm. Polymerase One-StepRT-PCR system, 51
Caenorhabditis elegans, 205genome, 257rRNA genes, 261
Calf thymus DNA, 201Cancer, 6
cell detection, 269research and detection, 229therapy, 267
Capillary, 54, 57, 95Capillary sequencer, 95CAPS, see Cleaved amplified
polymorphic sequenceanalysis
CapSwitch primer, 239Carboxydothermus
hydrogenoformans, 51DNA polymerase, 187
Carryover of PCR product, 25CCD camera, 194ccdB (control of cell death), 124,
131cDNA, 46, 47, 51, 104, 111, 186,
191, 197, 206, 215, 224cloning, 121dilution, 226first-strand, 186–188, 199, 204,
235first-strand synthesis, 188, 190,
194, 195, 198, 208, 233,234, 238, 253
library, 46, 51, 233, 235, 237library construction, 235plasmid, 224
population, 270preparation, 52second-strand synthesis, 189,
233splice variant, 215synthesis, 194
Cell line K562, 272CEQ2000 sequencer, 95Chaotropic salt, 112, 115Chemifluorescence detection, 194Chloroplast DNA, 53Chromo4™ detector system, 60Chromogenic substrate, 103Chlamydia trachomatis, 278Cleavage efficiency, 120Cleaved amplified polymorphic
sequence analysis (CAPS),267–268
Clinicaldiagnosis, 76, 78screening, 26
Cloned DNA, 6Cloning, 27
blunt end, 45vector, 5, 117
COBAS AMPLICOR® instrument,278
Codon, 249change, 150usage, 32, 33, 168
Cohesive ends, 121Colon adenomas, 259Colony
PCR, 53picker, 161screening, 59
Commercial kit,1, 7, 25, 37, 51,53, 112, 137, 143, 271, 278
Comparative gene expressionanalysis, 185
Comparative threshold, 222,224–225
Competing mRNA, 205Competition hybridization, 204Competitor, 193
PCR, 192RNA, 192, 193
Complementary DNA, see cDNAConcatamers, 121Concatemerization, 120Consensus sequence, 93, 249Contamination, 3, 7, 21, 45,
52–54, 65, 76, 78, 80, 91cross-, 114, 278prevention, 25
Control reactions, 65Conversion factors, 35Co-precipitant, 113Cosmid template, 51Costar® Spin-X®, 114Coupling independent mutations,
143Crop plants, 258Crystal violet, 123
284 Index
CsCl gradient, 53CT
method, 222, 224–225value, 210, 226
Cycle sequencing, 97, 100, 101Cytokine expression, 229
dA overhangs, see 3′- dA addition(overhang)
DABCYL quencher, 214, 218dam- E. coli, 141dam methylase, 143dA-tailed products, 123ddNTP, see dideoxynucleotideDeepVent® DNA polymerase, 38,
43, 45, 123Degeneracy code IUPAC, 33Degenerate oligonucleotide
primed-PCR, 268Degenerate primer, 32, 33, 44, 88,
92, 248, 250, 251design, 32, 34
Deletion mutagenesis, 137, 138,141, 144
Deletion SOEing mutagenesis, 151Denaturation, 3, 5, 9, 11, 12, 37,
66, 67, 74, 84Denaturing gradient gel
electrophoresis (DGGE), 42Denaturing high performance
liquid chromatography, 42,263
Denaturing HPLC, see DHPLCDenaturing polyacrylamide gel,
260, 268Densitometer, 194Densitometry, 191Deoxyinosine, 32Deoxynucleotide, 1, 2, 3, 14, 20,
24, 25, 26, 32, 42, 44, 66,70, 71, 74, 79, 81–83, 94,112, 116, 125, 126–128,134, 135, 195, 200, 208,234, 254
Deoxyuracil template, 166Detection
AIDS-associated virus, 7assay, 47kits, 7PCR product, 30
DGGE, see Denaturing gradientgel electrophoresis
DHPLC, see Denaturing highperformance liquidchromatography
Diagnosis, see also ClinicalDiagnosis, MedicalDiagnosis, 5, 209
Diagnosticapplications, 277–278automation, 278kit, 277, 278laboratory, 7reagents, 7
test, 6, 257dialysis tube, 114,115DICER, 206Dideoxynucleotide, 26, 93, 94,
96, 100, 101fluorescent, 97labeling, 95sequencing, 98
Differential display, 191, 195advantages, 197
DIG-dUTP, see Digoxigenin-11-2′-deoxyuridine-5′ triphosphate
Digitalis, 202DIG-labeled probe, 202Digoxigenin, 30, 44, 202
label, 26Digoxigenin-11-2′-deoxyuridine-
5′ triphosphate (DIG-dUTP), 102, 202, 203
Dimethyl sulfoxide, 51, 73, 74,262
Directed evolution, 158–168Directional TOPO cloning, 118Disease treatment, 257dITP, 50DMSO, see Dimethyl sulfoxideDNA
antibody, 103binding dye, 210, 211chip technology, 257contamination, 230fingerprinting, 258, 271footprinting, 101intercalating dye, 211ligase, 113,143methylation analysis, 263photocopier, 1
DNA polymerase, see alsoindividual DNApolymerases, 2, 3, 5, 9, 11,12, 16, 22, 23, 36, 66, 67,69–71, 125, 217, 248, 276
exo− version, 45fidelity, 36, 47Green, 47half-life, 39high-fidelity, 50, 161inactive, 69Klenow fragment, 5, 37, 116,
138, 234mixes, 47nuclease activity, 24processivity, 36proofreading, 43, 67, 81, 116,
118, 123, 242, 243recombinant, 45Red, 47T4, 116, 119, 126–128T7, 116, 126, 134Taq, see Taq DNA polymerasethermostable, 4, 5, 11, 15, 16,
20, 21, 67, 70, 81, 123, 125,246, 253–255
DNA polymerase I, 116DNA purification, 112, 124
kit, 52DNA sequence analysis, 89, 277DNA sequencing, 7, 26, 30, 42,
45, 93, 111, 150, 196chemistry, 93–96gel, 270
DNA shift assay, 30DNA shuffling, 161, 163–166
protocol, 179–181DNA synthesis, 1, 2, 3, 5, 7, 9, 12,
17, 30, 36, 37, 43, 126DNA topoisomerase I, 123DNA cloned, 6DNA-dependent DNA
polymerase, 36DNAse I, 186, 192, 203
digestion, 163, 164, 166, 167,179
DNASep column, 263dNTP, see DeoxynucleotideDomain swapping, 151Donor vector (Gateway®), 119DOP-PCR, see Degenerate
oligonucleotides primed-PCR
Dot-blot, 190Double-strand adaptor, 234Double-strand cDNA synthesis,
234, 238Double-stranded RNA (dsRNA),
205, 206DpnI, 139, 142,143, 149, 155, 157,
160, 174dPTP, 26,159Drosophila melanogaster, 199
genome, 257Duplex PCR, 271dut- E. coli strain, 155dUTP, 25, 26, 50, 80, 81dUTPase, see Uracil N-glycosylaseDyNAwax™, 70
E. coli S30 extract, 104, 106EcoRI, 29, 244EDTA, 75, 202EGTA, 47Ek/LIC vector, 128Electroelution, 114Electrophoresis buffer,113, 262ELONGASE® Long PCR kit, 50Elution buffer, 196End-repair priming, 248Enterokinase protease, 128Environmental
applications, 277–278testing, 5, 278
Enzymeassay, 137catalytic activity, 161, 163conjugated probes, 201immunoassay system, 103linked detection, 89
Index 285

Enzyme – continuedsubstrate interaction, 137substrate specificity, 163
Epitope mapping, 104Error rate, 24, 40
enhanced, 159Error-prone PCR, 159, 160, 166Escherichia coli, 6Escherichia coli O157, 278EST, see Expressed sequence tagEthanol, 78, 79
precipitation, 52, 113, 115, 123,188
Ethidium bromide, 88, 89staining, 276
Eukaryotic genome, 268Excisionase, 129Exo− DNA polymerase, 45Expand High Fidelity PCR kit, 50Expand Long Template PCR
system, 48Expand PCR enzyme mix, 51Exponential amplification, 10, 11,
17Exponential increase, 3Expressed sequence tag (EST),
206, 237, 238Expression
of PCR product, 27vector, 6
Extension step, 3, 48Extensor Long PCR kit, 50Extinction coefficient, 34, 35EZclone kit, 159, 160
Failsafe™ PCR optimization kit,25
FAM, see 6-carboxyfluoresceinFamily gene shuffling, 163–166FAM-labeled probe, 60Fast RNA Stain, 188Fastpcr program, 27FDD, see Fluorescent differential
displayFidelity, 24, 25, 36, 42, 43, 47, 51First-strand cDNA, see cDNAFixed tissue, 53Fluorescein, 202
dUTP, 44isothiocyanate, 197label, 26
Fluorescence emission, 210, 216Fluorescence resonance energy
transfer (FRET), 58, 212,216, 218, 219
FluorescentddNTP, 97differential display (FDD), 197dUTP, 102, 197dye, 31, 60, 89, 95, 185, 210,
212, 213, 215, 216dye terminator, 96labeled primer, 97, 99, 272,
273, 276
microscopy, 203primer, 30, 197, 210probe, 211, 212, 214, 221, 230quencher, 217, 218, 219, 221reporter, 209, 217, 218, 219,
221Food safety regulations, 230Forensic
analysis, 5, 76, 258, 264, 271,272, 273
sample, 53, 93Formamide, 73, 262Frameshift error, 40, 41FRET, see Fluorescence resonance
energy transferFungal genome analysis, 269Fungi, 206Fusarium, 230
Gain-of-function mutation, 258GAPDH, see Glyceraldehyde-3-
phosphate dehydrogenaseGateway®
cloning, 119, 128pDEST vector, 130pDONOR vector, 130pENTRY vector, 130
GC-clamp, 33, 41, 42GC-Melt™, 51GC-rich
DNA template, 48region, 27RNA template, 47stem, 217template, 50, 51
GC-Rich PCR system, 51Gel
electrophoresis, 87, 101, 114,115, 188, 209, 242
extraction, 143, 144loading buffer, 47purification, 97, 163
Gene cloning, 5, 43, 258Gene deletion, 259Gene expression, 52
pattern, 257profiling, 221quantification, 263regulation, 137
Gene knockout, 5Gene splicing, 54Gene synthesis, 166–169
protocol, 182–183Gene therapy, 257GeneAmp® PCR system 9700,
58GeneAmp® In Situ System 1000,
203Geneclean® purification, 115GeneMorph® kit, 159Gene-specific primer, 200, 208,
238, 253, 255Genetic analysis, 259Genetic code degeneracy, 32
Geneticcounselling, 258, 259diagnosis, 258, 264disease, 5, 6traits, 258
Genetically-modified organisms,277
Genomeanalysis, 259project, 96, 257sequence, 1, 5, 257
Genome walking, 245Genome-specific markers, 258GenomeWalker™ adaptor, 247Genomic
DNA, 12–16, 18, 20, 27, 34, 51,52, 70, 72, 77, 87, 111, 189,204, 216, 222, 240–242,248, 255, 264, 267, 270,279
fingerprinting, 269laboratory, 26library, 51polymorphism, 31
Genomic template, 48, 51Glass slides, see Microscope slideGlobal transcript analyses, 257Glutaraldehyde, 198Gluten, 230Glyceraldehyde-3-phosphate
dehydrogenase (GAPDH),225
Glycerol, 73Glycoblue, 113Glycogen, 113GoTaq DNA polymerase, 47Gradient block, 30, 55, 57, 59
HaeIII, 274, 275Haemophilus influenzae genome,
257Hair roots, 273Hairpin structure, 216, 218, 248Half-restriction sites, 121Heat seal
membrane, 54unit, 54
Heated lid, 54, 57, 59Heparin, 75Hepatitis B, 277Hepatitis C, 278Heterologous expression, 104HEX, see 4,7,2′,4′,5′,7′-
hexachloro-6-carboxyfluorescein
Hexamers, 208Hierarchical screening, 166High-fidelity
enzyme, 50, 161mix, 50PCR, 24, 48
High-throughput, 54, 276screen, 1, 26, 87
His6-tag, see Polyhistidine tag
286 Index

HiSpec Additive, 50HK-UNG™, 81Homologous recombination, 129Homopolymeric tail, 234, 238Horse radish peroxidase (HRP),
90, 278Host integration factor, 129Hot start PCR, 46, 48, 50, 278Hot Tub™ DNA polymerase, 48HotStar Taq DNA polymerase, 51Housekeeping gene, 225HPLC, 93HRP, see Horseradish peroxidaseHuman
DNA, 269, 274, 275genome, 257, 258, 268, 270genomic DNA, 27, 88immunodeficiency virus (HIV),
277, 278T-cell lymphotrophic virus, 277tissue, 52viral pathogen, 277
Hybrid Capture® 2 technology,103
Hybrid protein, 166Hybridization, 87
analysis, 89buffer, 201, 202probe, 16, 111, 251stringency, 269
Hypervariable locus, 274
In situ PCR, 52, 101, 198, 199,200, 202
first-strand cDNA synthesis,198, 199
glass slides, 200hybridization, 185, 198,
200–202PCR instrument, 61RT-PCR, 198, 199, 202
In vitro expression, 104In vitro transcription, 27In-gel ligation, 113Inosine, 32, 44Insect in amber, 53Insertion mutagenesis, 137, 138,
141, 144, 151–155of large fragments, 157
Insertion SOEing mutagenesis,151
Insulin-like growth factor-IA, 200Integrase, 129Interferon-γ mRNA, 229Interleukin-2, 7Intramolecular
hybridization, 216ligation, 240
Intron-spanning primer, 199, 222Invasive tumor, 259Inverse PCR (IPCR), 151, 240–243
mutagenesis, 138, 139mutagenesis, protocol, 171–172
Ionic strength, 29
IR2 Li-Cor sequencer, 95, 96Isopsoralen, 81, 82IUPAC codes for degeneracy, 33
Jackpot phenomenon, 42Jeffreys, Alec, 274JOE dye, 95
Kanamycin, 123KCl, see Potassium ChlorideKhorana, 6Kit, see Commercial kitKlenow fragment, see DNA
polymeraseKOD DNA polymerase, 20,
38,142, 149, 155, 160, 173,182
KOD HiFi DNA polymerase, 43,46, 50
KOD XL DNA polymerase, 50
lacZ region, 41Lambda exonuclease, 166, 167Laminar flow sterile bench, 272LCR, see Ligase Chain ReactionLeaf fossil, 53Legionella pneumophila, 278Legionnaire’s disease, 278LIC, see Ligation independent
cloningLigase chain reaction (LCR), 264,
265Ligase, 30Ligation, 5
reaction, 112Ligation-independent cloning
(LIC), 30, 117, 119,125–128
LightUp probe, 220–221Linear amplification, 101, 141,
154Linear dynamic range, 210Linker-specific primer, 245Liquid handling robot, 54, 161Liquid nitrogen, 255Loading dye, 88Long-range PCR, 48Loss-of-function mutation, 258Low-abundance transcript, 233Low-melting-temperature agarose,
113LR clonase, 129–131Lymphocytes, 229
M13-24 reverse sequencing primer,
97-20 sequencing primer, 97, 276-47 sequencing primer, 96-48 reverse sequencing primer,
97single strand DNA, 155
M13mp2, 41Mach1™-T1®, 123
Magnesium chloride, 21, 66, 68,71, 82, 134, 216
Magnesium ion 16, 24, 47, 66, 70,72, 251
concentration, 48, 88optimization, 24
Maize genome, 258Manganese ion, 47, 51Mass spectrometry, 93Maxygen Inc., 163Medical
diagnosis, 258, 259research, 5testing, 5
Megabase sequencer, 95Megaprimer, 149, 160
mutagenesis, 143Melting curve analysis, 60, 210,
212Melting temperature, 29, 214
formula, 29Membrane self-adhesive, 54Membrane, heat seal, 54Metaphor agarose, 88Methylated template DNA, 141Methylation dependent
restriction enzyme, see alsoDpnI, 140
Methylation, 121Mg2+, see Magnesium ionMgCl2, see Magnesium ChlorideMicroAmp plates, 58MicroAmp reaction tubes, 58Microarray, 185, 204, 205, 257Microbial genome, 257Microcentrifuge, 113, 114Microsatellite, 276–277
analysis, 263repeats, 88
Microscope slide, 53, 54, 61MicroSeq 16S kit, 278Microtite plate, 11, 54, 209Mineral oil, 21, 54, 57, 71, 72, 80Minisatellite
probe, 276repeat analysis, 274–276variant repeat (MVR), 274
Mismatched 3′-end, 48Mispairing slippage, 276Mispriming, 16, 17, 34Mitochondrial DNA, 53M-MLV, see Moloney Murine
Leukemia virusModified nucleotides, 25Molar extinction coefficient, 34Molecular Beacon, 212, 216–218,
220, 221Molecular breeding, 257Molecular diagnosis, 209Molecular size markers, 88Molecule of the year, Taq DNA
polymerase, 6Moloney Murine Leukemia virus
(M-MLV), 187
Index 287
Moloney Murine Leukemia virus(M-MLV) – continued
M-MLV reverse transcriptase,51, 203
Monoclonal antibody, 69, 103MPSV, see Mutations,
polymorphisms andsequence variants
mRNA , 51, 185, 186, 189, 192,195, 199, 204, 233, 235
degradation, 206expression, 224purification, 187quantification, 209transcript, 46
mrPCR, see Multiplex restrictionsite PCR
Mullis, Kary, 1, 6, 7Multiple mutations, 150Multiplex PCR, 212, 221, 259,
277analysis, 210, 270–271
Multiplex restriction site PCR(mrPCR), 243, 244
Multisites mutagenesis kit, 143Murine thymidine kinase, 196Mutagenesis, 27, 43, 54
deletion, 144high efficiency, 139, 143insertion, 144kit, 137point mutation, 144Quikchange®, 140–143, 144splicing by overlap extension
(SOEing), 144–154unique sites elimination (USE),
144Mutation assay
forward, 41gradient gel, 41reversion, 41
Mutation detection, 42, 60Mutation segregation, 161Mutational hot-spot, 259Mutations, polymorphisms and
sequence variants (MPSV),258
Mutazyme® II, 159MVR, see Minisatellite variant
repeatMVR code, 274MVR-PCR, 274, 276
Mycobacterium tuberculosis, 278
N-(2-aminoethyl)glycinebackbone, 220
NADPH:protochlorophyllideoxidoreductase gene, 226
Naphthosine, 31Native polyacrylamide gel, 260NBT, see Nitro blue tetrazoliumNeanderthal DNA, 53Neisseria gonorrhoeae, 278Nematode genome, 257
Nested PCR, 66, 76, 77, 89, 90–92,93, 116, 132, 241, 242, 244,251
gene-specific primer, 238, 255primer, 96second-round nested PCR, 243,
256Net primer program, 27Neuroblastoma differentiation,
197NH4Cl, see Ammonium ChlorideN-hydroxysuccinimide (NHS), 31Nick translation, 89Nitro blue tetrazolium (NBT), 201,
202Nitrocellulose, 188Nonamplifiable monomer, 218Nonidet P40, 24, 76Nonionic detergents, 73, 76Non-nucleosidic base, 31Non-PCR applications, 7Nonproofreading DNA
polymerase, 270Nonspecific amplification, 32Nonspecific priming, 88Northern blot, 185, 191, 197, 198,
200NP-40, see Nonidet P40N-terminal amino acid
sequencing, 248Nuclease activity of DNA
polymerase, 24Nuclease, 206Nucleotide, 25,112, 113, 116, 250
analogue, 159misincorporation, 25modified, 25molecular mass, 35radiolabeled, 188, 190, 233stock solutions, 25
NuSeive GTG agarose, 88Nylon membrane, 89, 204
Oligo-dC, 126OligodG, 126
primer, 234, 238Oligo-dT, 186, 188, 189, 195
primer, 186, 190, 200, 208, 234,235, 238
solid support matrix, 187Oligonucleotide 32, 79, 113, 169,
2045′-phosphorylated, 171, 177adapter, 270concentration, 34custom synthesis, 26manufacturers, 26, 31phosphorylation, 63phosphothioate linkage, 44primer, 3, 9, 20, 23, 26probe, 89, 190purification, 169synthesis, 30synthesis efficiency, 150
Oligoperfect designer program, 27OneStep RT-PCR kit, 51One-tube RT-PCR, see Reverse
transcriptase PCROpen reading frame (ORF), 104Opticon real-time PCR, 60Optimization, 26, 189, 196, 251
annealing, 57PCR, 89
Opti-prime™ PCR optimizationkit, 25, 73
ORF, see Open Reading FrameOrganelle, 198
p53 tumor suppressor gene, 259Paraformaldehyde, 198Paramagnetic particle, 30, 98, 99Passive reference, 210Patent, 6, 7, 39, 55, 163Paternity test, 271Pathogen infection, 230Pathogenic microorganism, 277Pathogenicity test, 230Pathological sample, 53PCR
additives, 66, 73amplification of specific alleles
(PASA), 264archaeology, 93buffer, 23, 24, 25, 26
bulk reagents, 26plate format, 26
booster, 66, 72clean-up kit, 97, 143, 144, 150,
157diagnostic reagents, 7early cycles, 15, 188efficiency, 24, 267enhanced error rate, 159enhancer, 73, 74, 84Failsafe kit, 25fidelity, 42first cycle, 4high fidelity, 24history, 6hot start, 17, 66, 69, 70, 84in situ, see In situ PCRinhibitor, 75, 84instruments, 58–61kinetics, 15, 58late cycles, 17mid cycles, 17milestones, 7misincorporation, 159–160mutagenesis, 17, 122, 137–170nested, see Nested PCRoptimization, 25, 26, 42, 65, 73,
87Opti-prime kit, 25plateau phase, 17premixes, 26primers, 112, 117purification, 111reagents, 23
288 Index

reamplification, 115, 116real-time, 19, 209–231reproducibility, 55screening, 135specificity, 65temperature profile, 55touchdown, 17, 66, 68two-step, 68
PCR productanalysis, 87accumulation, 58biotinylation, 26, 97carryover, 26cloning, 27, 40, 42, 116, 118detection, 30, 87digoxigenin labeled, 26direct sequencing, 100DNA sequencing, 93expression, 27, 87, 103fluorescein labeled, 26isolation, 97long, 46purification, 91, 97radiolabeled, 26splicing, 27
pCR®-XL-TOPO vector, 123pCRScript™, 124, 125PCR-SSCP, see Single strand
conformationalpolymorphism
PEETA, see Primer extension,Electrophoresis, Elution,Tailing, Amplification
PEG, see Polyethylene glycolPellet Paint™, 113Peltier device, 55, 56, 60Pepsin, 198Peptide nucleic acid (PNA), 220Peptide sequence, 248, 250Perfect Match®, 74Perfectly Blunt™, 124Peripheral blood mononuclear
cells, 229Perkin Elmer Corporation, 7pET, vector, 123Pfu DNA polymerase, 38, 43, 45,
46, 50, 125, 166Pfu exo− DNA polymerase, 93,
101Pfu Turbo DNA polymerase, 45,
51, 142PfuUltra DNA polymerase, 43Phage
DNA, 18, 53display, 155library, 234template, 51
Phenol, 112Phenol-chloroform, 255, 256Phenotypic trait, 270Phosphate buffered saline (PBS),
200, 202Phosphoramidite, 30
fluorescent dye, 31
Phosphorimager, 101, 102, 188,191, 194, 276
Phosphorylation, 63Phosphothioate linkage, 44Pipes buffer, 24Pipette
filter tips, 54positive displacement, 54tips, 54
Plant genome, 257, 267Plant identification, 269Plaques, 234, 237
PCR, 53Plasmid, 115
DNA, 53, 131, 189template, 51, 100, 138
Plasticware, 54Plateau phase, 189Platinum Taq
antibody, 50DNA polymerase, 50
PNA, see Peptide nucleic acidPoint mutation, 141
mutagenesis, 144, 145PolyA tail, 190, 234, 238Polyacrylamide gel, 88, 197
electrophoresis, 94, 95, 196,273
Polyadenylation (polyA) tail, 195Poly-dC, 238Polyethylene glycol, 73Poly-G primer, 253, 254Polyhistidine tag, see 6-His tag,
104, 151Polymorphic insertion, 271Polymorphism, 221, 259, 260,
270detection, 262
Polynucleotide kinase, 30, 63, 89Polypropylene tubes, 54Polysaccharide problem, 52Population studies, 269, 271Porphyrin, 75Positive displacement pipettes, 54Post-hybridization, 202Post-PCR analysis, 47Potassium chloride, 24, 66Potato brown rot, 230Prehybridization, 201Premix, 78, 80Prenatal diagnosis, 267Primer, 1–4, 26–36
5′ end-labeled, 305′ phosphorylated, 30annealing, 17, 47, 272biotinylated, 101concentration, 33, 35degenerate, 32, 44, 268degradation, 44design, 23, 222design program, 26, 27design program, degenerate, 33design SOEing mutagenesis,
149
design sticky feet mutagenesis,155
DNA sequencing, 96–97extension, 2, 27fluorescent labeled, 30, 101,
210, 272intron-spanning, 222labeling, 95nested, 76, 247radiolabeled, 101specificity, 92stock, 35, 36vector-specific, 95working stocks, 36
Primer-dimer, 19, 27, 28, 34, 72,88, 212, 221, 222
Primer extension, Electrophoresis,Elution, Tailing,Amplification (PEETA), 240
Primer3 program, 26Probe displacement, 214Probe hybridization, 87, 216,
220Processivity, 36, 37, 46Promoter sequence, 27, 28, 111,
240Proofreading activity, 36, 37, 39,
40, 41, 43, 45, 48, 49, 50,51
Proofreading DNA polymerase,24, 43, 44, 46, 48, 138, 139,149, 155, 160
ProSTAR RT-PCR system, 51Protease cleavage sites, 151Protein
binding site, 30coding domain, 144domain mapping, 104engineering, 150function, 6, 160protein interaction, 104structure, 6, 150, 166structure-function, 137thermostability, 161, 163
Proteinase K, 53, 76, 198, 199Proteolytic cleavage, 248Protozoans, 206Psoralen, 81Pwo DNA polymerase, 24, 38, 43,
45, 48, 50, 51, 125Pyrococcus fusiosus, 43, 45Pyrococcus GB-D, 43, 45Pyrococcus GB-D DNA polymerase,
50Pyrococcus woesei, 43, 45
QIAquick Gel extraction kit, 112Q-solution, 74Quantitative competitive RT-PCR,
see Reverse transcriptasePCR
Quantitative RT-PCR, see Reversetranscriptase PCR
Quencher dye, 212–216
Index 289

Quikchange® mutagenesis, 138,139, 140–143, 144, 149,154, 155, 157, 159
primer design, 141protocol, 173–174
Rabbit reticulaocyte extract, 104,106
RACE, see Rapid amplification ofcDNA ends
RACHITT, see RandomChimeragenesis onTransient Templates
Radioisotopes, 197Radiolabeled
amino acid, 104nucleotide, 102PCR products, 26primer, 264probe, 89sequencing, 95
Ralstonia solanacearum, 230Ramp rate, 161Random amplified polymorphic
DNA (RAPD) PCR, 26, 56,269–270
Randomhexamer-primed labeling, 89,
208mutagenesis, 26, 137, 157–160mutation library generation,
158mutational library, 159primers, 200
Randon chimeragensis ontransient templates(RACHITT), 166–167
RAPD, see Random amplifiedpolymorphic DNA
Rapid amplification of cDNA ends(RACE), 87, 238
Rapid ligation, 122ras oncogene, 259RAWIT, see RNA amplification
with in vitro translationReal time
analysis, 30detection, 95, 102
Real-time PCR, 5, 26, 87, 185, 211∆Rn, 210amplification plot, 210baseline, 210chemistry, 209CT value, 210detection methods, 211–221detection systems, 209experiment, 225–228fluorescent dye, 210, 212, 213,
215fluorescent probe, 211instruments, 222, 223linear dynamic range, 210melting curve analysis, 210,
212
molecular beacon, 212,216–218
multiplex analysis, 210multiplex reaction, 212normalization, 225passive reference, 210primer, 209primer design, 222probe design, 209, 221probe displacement, 214quantification, 222, 224–225quencher dye, 212, 213, 214,
215, 216Rn value, 210Scorpion, 212standard curve, 210TaqMan®, 212, 215thermal cycler, 209, 211threshold cycle, 210, 211
Real-time RT PCR, 60, 209, 220,221, 222, 225, 226, 233
applications, 229–230basic principles, 209–211fluorescent reporter, 209primer design issues, 228probe design issues, 228RNA quality, 228fluorescence baseline issues,
229melting curve analysis issues,
228minus RT control issues, 228normalization control issues,
228reaction efficiency issues, 229thresholds issues, 229pitfalls, 228–229
Re-amplification, 196, 197Recombinant DNA, 6Recombinase, 129Recombination, 27, 160–166Recombinational
cloning, 117, 128library, 160–166
Recursive gene synthesis, 161Recursive PCR, 163, 166ReddyMix buffer, 47RedHot DNA polymerase, 47REDTaq, 47Regulatory DNA sequences, 157Restriction analysis, 42, 89Restriction endonuclease, 30, 115,
117, 120, 240, 246, 255,270
analysis, 92cleavage, 151cloning, 117digest, 88, 144, 263site, 27, 28
Restriction fragment lengthpolymorphism (RFLP), 260,267, 271
Restriction-enhanced cloning,124, 125
Reverse transcriptase, 36, 46, 51,186, 194, 200, 208, 209,235, 236, 253, 254
Reverse transcriptase PCR (RT-PCR), 46, 48,185, 186, 188,190, 194, 199, 209
intron-differential, 186in situ, see In situ PCRone-tube, 194quantitative, 191–193, 233quantitative competitive, 192reproducibility, 209semi-quantitative, 189, 190sensitivity, 209single tube, 47
Reverse transcription, 53, 185,188, 195, 224, 225
Reverse-phase liquidchromatography (RPLC),263
RFLP, see Restriction fragmentlength polymorphism
Rhodamine, 197quencher, 214
RibosomalDNA, 261RNA, 53, 234
RISC, see RNA-induced silencingcomplex
Rn value, 210RNA amplification with in vitro
translation (RAWIT),104–105
RNA, 80competitor, 192dependent DNA polymerase, 36RNA:DNA hybrid detection,
103interference (RNAi), 5, 205, 206isolation, 52isolation kit, 53secondary structure, 194
RNAi, see RNA interferenceRNA-induced silencing complex
(RISC), 206RNAse III-like enzyme, 206RNAse inhibitor, 199, 200, 208RNAse protection assay, 185, 191RNAse-free DNAse, 216RNAse-free DNAse, 199Robotics, 26ROX, see 6-carboxy-X-rhodaminerRNA, see Ribosomal RNART-PCR, see Reverse transcriptase
PCRRuby Taq DNA polymerase, 47Ruby Taq master mix, 47
Saccharomyces cerevisiae genome,257
S-adenosylmethionine, 143Salmon sperm DNA, 201Satellite block, 55Saturation mutagenesis, 150, 158
290 Index
Sau3A, 244Scintillation
counter, 102counting, 102, 190, 191
Scintillation proximity assay(SPA), 102, 103
beads, 102Scorpion, 212, 218–220, 221
bi-functional molecule, 218primer, 218
SDS, see Sodium dodecyl sulfateSeed potatoes, 230Selectable marker, 279Self-adhesive membrane, 54Self-complimentarity, 19Self-priming 19, 234
extension, 163Semen, 273Semi-quantitative RT-PCR, see
Reverse transcriptase PCRSensitive PCR, 277–278Sequence specific primer, 95, 245,
246Sequencing enhancer, 101Serine proteinase, 166Short tandem repeats (STR),
271–273profiling, 273validation studies, 273
Siberian woolly mammoth, 53SID protein, 206Signal-to-noise ration, 102Silane A, 174Silane-coated slides, 199Silica
fines, 115matrix, 115membrane, 112
Siliconchip, 204oil, 54, 80
Siliconized glass wool, 114Single cells, 52Single nucleotide polymorphism
(SNP) 42, 263, 267genotyping , 269using DOP-PCR, 268–269testing, 220
Single-tube RT-PCR, 47Single-amplicon monitoring, 212Single-strand conformational
polymorphism (SSCP), 88,259–263
Single-strand DNAmobility, 262template, 97
siRNAs, see Small interfering RNAs
Site-directed mutagenesis,137–151
Small interfering RNAs (siRNAs),206
SMART™ PCR cDNA synthesis,191, 235, 236
SMART™ II oligonucleotide, 186,236
SNP, see Single nucleotidepolymorphism
Sodium dodecyl sulphate (SDS),76
Sodium hypochlorite, 78Sodium iodide, 112SOEing, see Splicing by Overlap
ExtensionSolid-phase sequencing, 98, 99Sonication, 163Southern blot analysis, 89, 92,
101, 102, 188, 190, 191,241, 242, 260, 274, 276,278, 279
SP6 promoter, 104primer, 97
SPA beads, see Scintillationproximity assay
Spectrophotometry, 192Spin column, 112, 114Splicing by overlap extension
(SOEing), 144, 154, 240protocol, 175–176
Splinkerettes, 248Srfl, 124, 125SSCP, see Single strand
conformationalpolymorphism
SspI, 128Staggered extension process
(StEP), 161–163Standard curve, 210
method, 222, 224, 225StEP, see Staggered extension
processSteriod hapten, 202Sticky feet mutagenesis, 154–157
protocol, 177–178Stoffel fragment, 38, 40STR, see Short tandem repeat
271–273Streptag II, 151Streptavidin, 30, 98, 102
paramagnetic beads, 97horseradish peroxidase, 278
Stringency, 65Suppression, 234SYBR® Green I, 60, 211, 212, 225,
226SYBR® Green II, 188, 260Synthetic gene construct, 151
T3 promoter, 104primer, 97
T4 DNA kinase, 120, 138T4 DNA ligase, 171, 255T7 DNA polymerase, 89, 93, 177T7 promoter, 104, 206
primer, 97T7 RNA polymerase, 104, 193TA cloning, 122, 123TA vector, 118
TAG sequence, 274TAMRA, see
TetramethylrhodamineTaq antibody, 50Taq Bead™, 71Taq DNA ligase, 166, 167Taq DNA polymerase, 5, 7, 14, 20,
23, 24, 25, 26, 36, 37,43–52, 66, 67, 71, 74, 76,81, 93, 116, 118, 120,122–125, 135, 138, 149,159, 200, 214, 218, 220,254, 266, 270
commercial sources, 39fidelity, 40molecule of the year, 6properties, 37, 38recombinant, 39
Taq Extender™, 74Taq2000™ DNA polymerase, 50TaqMan®, 212, 215
Pathogen Detection Kit, 278probe, 214–216, 218, 221, 222real-time RT-PCR assay, 214
TaqPlus® Long PCR system, 50TaqPlus® Precision, 51TaqPlus® Precision PCR system, 50TaqStart™ antibody, 48TBE buffer, 262TCA precipitation, see
Trichloroacetic acidTdT, see Terminal
deoxynucleotidyltransferase
Temperature gradient gelelectrophoresis (TGGE), 42
Temperature, 3Temperature-cycle ligation, 122Template destruction, 138, 140,
143Template DNA, 1, 3, 26, 51
amount required, 54fixed tissue, 53microscope slide, 53quality, 53safety rules, 52source, 52
Template preparation uracil-containing, 155
Template strand, 2Template switching, 161, 163, 166Terminal deoxynucleotidyl
transferase (TdT), 119, 122,123, 125, 126, 235, 238,239, 253
Terminal transferase, see Terminaldeoxynucleotidyltransferase
TET, see Tetrachloro-6-carboxyfluorescein
Tetrachloro-6-carboxyfluorescein(TET), 31, 60, 214, 276
Tetramethylrhodamine (TAMRA),60, 95, 214
Index 291

TEV, see Tobacco etch virusTG/CA repeats, 276TGGE, see Temperature gradient
gel electrophoresisThermal cycler, 5, 11, 20–23, 30,
55, 68, 73, 83, 100, 102,122, 136, 140, 161, 253,255
air cycler, 56, 57, 60Applied Biosystems, 58block temperature, 56cooling, 56DNA engine, 60Eppendorf Gradient, 59Eppendorf Mastercycler, 61gradient block, 55, 57, 59, 84,
136efficiency, 72heat block, 56heated lid, 57, 59, 71, 72heating, 56in situ, 61, 199LightCycler, 60MJ Research, 60PCR Sprint, 59Px2, 59PxE, 59real-time system, 55, 209, 211refrigeration, 56reproducibility, 56RoboCycler, 59satellite block, 55temperature monitoring, 56Thermo Hybaid, 59
Thermal cycling, 12Thermococcus kodakaraensis, 46Thermococcus litoralis, 43, 44Thermocouple, 56, 73, 83Thermolabile uracil N-
Glycosylase, 81Thermostable DNA polymerase,
see also DNA polymerase, 4,6, 23, 25, 38, 43, 101, 171,177, 179, 264
Thermotoga maritime, 43, 46Thermus aquaticus, 37Thermus thermophilus, 46Thermus ubiquitous, 48Thin-wall tubes and plates, 54Threshold
cycle, 210value, 226
Titan ™ One Tube RT-PCRsystem, 51
Titan™ one-tube RT-PCR, 194
Tli DNA polymerase, 43, 44Tm, 29, 141, 214, 264
calculation, 33, 216, 217of probe, 221
TNF, see Tumor necrosis factorTobacco etch virus (TEV), 128Tomato seedling, 230TOPO™ cloning, 123, 124,129TOPO™ TA vector, 118Topoisomerase-mediated (TOPO)
ligation, 117TOPO™-XL PCR, 123Total RNA cDNA amplification,
233Touchdown PCR, 59Transgene insertion site, 279Transgenic
line, 279plant, 277plant tissue, 52screening, 278–279
Transgenomic Inc, 263Translation initiation sequence,
104Transposon, 241
insertion, 279Trichloroacetic acid (TCA)
precipitation, 102Triethylammonium chloride, 73,
263Triplex PCR, 271Tris-HCl, 24, 66, 113Triton X100, 76Tth DNA polymerase, 38, 46, 47,
48, 51Tumor heterozygosity, 263Tumor necrosis factor (TNF), 202Tumor tissue fingerprinting, 269Tumorigenesis, 259Tween, 20, 24, 76Two-step PCR, 30
UlTma™ DNA polymerase, 38,43, 46
UNG, see Uracil N-glycosylaseung − E. coli strain, 155ung+ E. coli strain, 45, 157Unique sites elimination (USE)
mutagenesis, 144, 145Universal base, 32, 44, 250Universal GenomeWalker™,
246Universal primers, 244Universal vector-specific primer,
238
Uracil N-glycosylase, 25, 45, 80,81, 128, 155, 166, 167
Uracil-containing templatepreparation, 155
UV irradiation, 81, 82, 112, 123UV lamp, 78, 115
Vaginal cells, 273Variable number Tandem repeat
(VNTR), 271–273, 276Vector, 30, 128
expression, 6pDEST, 130pDONOR, 130pENTRY, 130pMCSG7, 128
vectorette 239, 245II PCR, 246adaptor, 245–247PCR, 244primer, 247
Vector-specific primer, 95Vent® DNA polymerase, 38, 43,
44, 123Vent® exo− DNA polymerase, 44,
93, 101Viral transcript, 52Virtual Northern blotting,
191–192, 194VNTR, see Variable number Tandem
repeat, 271–273, 276
Wax beads, 70, 71magnesium, 72StartaSphere™, 72
Web primer program, 26Western blot, 104Wheat genome, 258Wheat germ extract, 104, 106Wheat pasta, 230
XbaI, 244X-Gal, see 5-bromo-4-chloro-3-
indolyl phosphateX-ray film, 191, 194Xylene, 198
YAC, see Yeast artificialchromosome
Yeast artificial chromosome(YAC), 51, 244, 245
Yeast genome, 257
Zeomycin, 123Zero Blunt® TOPO, 118, 123–124
292 Index