the bay area food economy - association of bay area ... · the bay area food economy: ... the bay...
TRANSCRIPT

The Bay Area Food Economy: Existing Conditions and Strategies for Resilience
Produced by
Sustainable Agriculture Education (SAGE) and
American Farmland Trust (AFT) for the
Association of Bay Area Governments
Comprehensive Economic Development Strategy
with funding provided by the
California Coastal Conservancy, San Francisco Bay Area Program
October 2017
The Bay Area Food Economy: Existing Conditions and Strategies for Resilience
Table of Contents
I. Introduction and Overview ............................................................................................................. 3
II. Defining the Food Economy ............................................................................................................ 4
III. Economic Trends – Establishments, Employment, and Wages ...................................................... 8
IV. Economic Contributions ................................................................................................................ 12
V. Geographic Distribution of Ag and Food Sector Businesses ......................................................... 23
VI. Bay Area Food Economy SWOT Analysis ...................................................................................... 26
VII. Key Strategies for the Agriculture and Food Sectors .................................................................... 30
VIII. Best Practices – What Other Regions Are Doing .......................................................................... 35
IX. Next Steps .................................................................................................................................... 36
Appendix A – Bibliography for SWOT Analysis ...................................................................................... 37
Appendix B – Interview Informants ....................................................................................................... 40
Produced by Sustainable Agriculture Education (SAGE) and American Farmland Trust (AFT), with
support from BAE Urban Economics, for the Association of Bay Area Governments’ Comprehensive
Economic Development Strategy. Funding for the Bay Area Food Economy white paper was
generously provided by the California Coastal Conservancy, San Francisco Bay Area Program.
For questions, please contact: Sibella Kraus, SAGE, at [email protected] or Serena Unger, AFT,
3
I. Introduction and Overview
The Bay Area has an extraordinarily rich and diverse food system that is an integral part of our
region’s economic prosperity, environmental sustainability, regional identity, and vibrant cultural
life. Producers, processors, distributors, retailers, restaurants, and food services companies are
food industry sectors that coordinate as part of a food industry cluster to bring us the food we eat
every day. Located throughout the Bay Area, from iconic farmlands, to industrial districts, to
downtowns and neighborhoods, the food supply chain is so interwoven with the economy and
fabric of our built and natural environment, that we take the flow of food almost as for granted as
running water.
The Bay Area has a thriving food economy, but one not without challenges and vulnerabilities. With
an annual value of around $113 billion, the food economy employs close to half a million people,
around 13 percent of the region’s workforce. However, the average wage is 64 percent lower than
the average regional wage. The hallmark of the food economy is the very wide spectrum of
business opportunities. The 38,500 food establishments include businesses from micro-food
enterprises to headquarters for global food and beverage corporations, from small urban-edge
farms to farms growing for export, from local food coops to national grocery chains, and from
neighborhood ethnic eateries to world class fine dining. However, even with the region’s bustle of
food enterprises, there are some cracks in the value chain such as food processing and distribution
businesses that are being squeezed for affordable space in high value real estate markets; a
shortage of qualified workers in many of the food sectors, and a dearth of food business incubators,
which are in high demand for the growing number of small businesses striving to enter the
marketplace.
The Bay Area is fortunate to be a place with range and farm lands that bring us a bounty of local
produce, fresh meats and dairy products, and the inspiring landscapes and ecosystems that define
our region. While roughly 40 percent of the land in the Bay Area is comprised of farmland and
grazing land, our region’s farmland is still at risk. Since 1984, more than 200,000 acres of
agricultural land in the nine-county Bay Area have been lost to development. Much of the region’s
urban footprint was carved from irrigated farmland, the most productive and versatile land for food
production. It is this high quality land that still remains the most vulnerable to development. Today,
only 237,000 acres of prime farmland are still in production.
The assets, vulnerabilities, and complexity of the food supply chain and our dependence on having
access to an abundance of fresh food daily require a more comprehensive understanding about our
indispensable agricultural resources and food supply sectors. Equally important is understanding the
interdependence of our food supply chain with regional issues such as urban and rural land use,
jobs, education, transportation, goods movement, disaster preparedness, climate change and
housing.
The purpose of this white paper is to highlight the economic and other contributions of our regional
food economy, propose strategies and investments needed to protect and strengthen its

4
contributions, and encourage increased investment in the agricultural resources and food supply
sectors that are a pillar of our regional resilience.
Over the last several decades, many Bay Area organizations and agencies have assessed the status
of various agricultural and food-related sectors, both locally and regionally. This white paper
synthesizes these findings and includes updated economic data to produce a comprehensive
assessment of the region’s food supply chain, from production through consumption, and spanning
all urban and rural jurisdictions.
The white paper is documented in, and included as an appendix to, the Bay Area Comprehensive
Economic Development Strategy (CEDS). The intention is to bring greater recognition of the role of
the region’s agricultural and food-related sectors as a key growth industry by placing an assessment
of its contributions, vulnerabilities and opportunities in the context of a regional economic
assessment. Without calling attention to these attributes and issues, the food sector stands to be
an under-recognized asset among other leading growth industries in an economic development
strategy for the region.
The white paper identifies strengths, weaknesses, opportunities, and threats among the agricultural
and food sectors; specific strategies, actions, investment needs, and implementation agents
necessary to build on existing assets; as well as ways to address critical barriers to continued
economic prosperity among these sectors. Lastly, it provides a brief summary of best practices from
other regions that have developed economic development strategies for their agricultural and food
sectors.
The insights included in this white paper reflect data, concerns, goals, and recommendations drawn
from dozens of studies and reflect additional input from key stakeholders. A strong theme among
the stakeholders is an interest in framing common regional goals, identifying investment needs of
regional significance, and developing collective action to leverage needed resources. With
additional funding and technical assistance anticipated as a result of the CEDS process, a
strengthened and more cohesive food value chain can help achieve key outcomes for the region:
facilitate the growth of the Bay Area food economy in both rural and urban communities, create
jobs, ensure regional resilience and a readily available supply of food, promote access to fresh
foods, reduce greenhouse gas emissions, and support local farm and food enterprises that are an
integral part of our region’s identity and culture.
II. Defining the Food Economy
There are a number of approaches to defining a regional food economy: in terms of the North
American Industry Classification system (NAICs) codes; as an industry cluster or set of industry
clusters; and more colloquially, as a “food shed”. This paper draws from all approaches, but
primarily utilizes NAICs, a standardized system used by Federal statistical agencies in classifying
business establishments for the purpose of collecting, analyzing, and publishing statistical data
related to the U.S. business economy.
5
NAICS Codes
NAICS classifies business establishments in terms of two-, three-, four-, five- and six-digit codes,
with two-digit codes (of which there are a total of 24 classifications) being the most general and six-
digit codes (of which there are thousands) being the most specific. To determine the best NAICS
code definition of the Bay Area food economy, the consultant team reviewed the NAICS codes
definitions used by a range of other food system studies both within the Bay Area and in other
regions of the U.S. The team also identified additional NAICS codes not already captured, and
considered the relevance of these other NAICS codes within the Bay Area context.
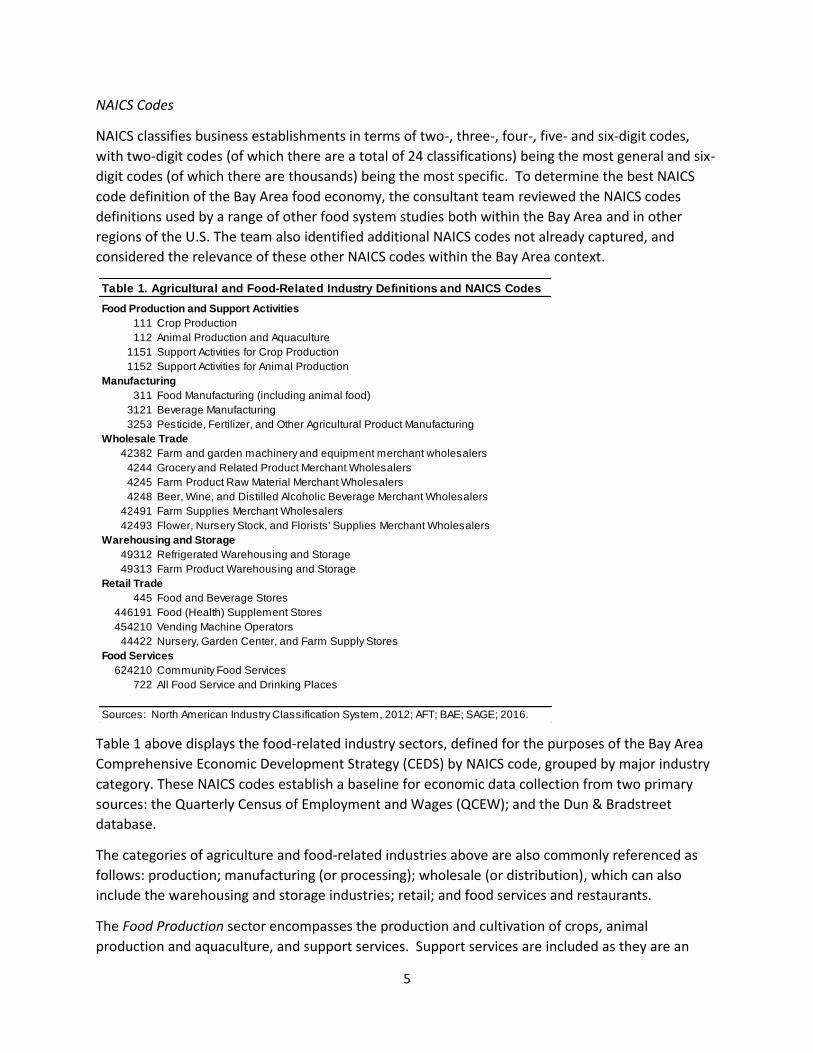
Table 1 above displays the food-related industry sectors, defined for the purposes of the Bay Area
Comprehensive Economic Development Strategy (CEDS) by NAICS code, grouped by major industry
category. These NAICS codes establish a baseline for economic data collection from two primary
sources: the Quarterly Census of Employment and Wages (QCEW); and the Dun & Bradstreet
database.
The categories of agriculture and food-related industries above are also commonly referenced as
follows: production; manufacturing (or processing); wholesale (or distribution), which can also
include the warehousing and storage industries; retail; and food services and restaurants.
The Food Production sector encompasses the production and cultivation of crops, animal
production and aquaculture, and support services. Support services are included as they are an
Table 1. Agricultural and Food-Related Industry Definitions and NAICS Codes
Food Production and Support Activities
111 Crop Production
112 Animal Production and Aquaculture
1151 Support Activities for Crop Production
1152 Support Activities for Animal Production
Manufacturing
311 Food Manufacturing (including animal food)
3121 Beverage Manufacturing
3253 Pesticide, Fertilizer, and Other Agricultural Product Manufacturing
Wholesale Trade
42382 Farm and garden machinery and equipment merchant wholesalers
4244 Grocery and Related Product Merchant Wholesalers
4245 Farm Product Raw Material Merchant Wholesalers
4248 Beer, Wine, and Distilled Alcoholic Beverage Merchant Wholesalers
42491 Farm Supplies Merchant Wholesalers
42493 Flower, Nursery Stock, and Florists' Supplies Merchant Wholesalers
Warehousing and Storage
49312 Refrigerated Warehousing and Storage
49313 Farm Product Warehousing and Storage
Retail Trade
445 Food and Beverage Stores
446191 Food (Health) Supplement Stores
454210 Vending Machine Operators
44422 Nursery, Garden Center, and Farm Supply Stores
Food Services
624210 Community Food Services
722 All Food Service and Drinking Places
Sources: North American Industry Classification System, 2012; AFT; BAE; SAGE; 2016.
6
essential part of agricultural production. These support activities may be performed by the
agriculture producing establishment or conducted independently as an alternative source of
material and service inputs required for the production process for a given crop or animal business.
The Manufacturing sector encompasses the processing or manufacturing of a large range of
products for human consumption, including: grains, edible oils, breakfast cereals, sugar, candy,
fruits and vegetables (e.g. frozen, canned, dehydrated, cut, etc.), seasonings and dressings, meats
and poultry, seafood, bakery goods, snack foods, coffee and tea, and fresh prepared foods. It also
encompasses manufacturing of products for consumption by animals, including pets and livestock.
The beverage manufacturing subsector encompasses breweries, wineries, and distilleries, as well as
manufacturing of soft drinks, bottled water and ice. The agricultural product manufacturing
subsector encompasses production of pesticides, fertilizers, agricultural chemicals and other
agricultural products.
The Wholesale-Trade sector (also known as the distribution sector) of the food supply chain covers
wholesale and distribution businesses that handle a wide range of food and beverage products.
These include: fresh fruits and vegetables, nuts, dairy products, meat, seafood, poultry, bakery and
confectionary products, grocery products, grains and field beans, frozen items, wine, beer and
distilled beverages. Additional services can include processing, re-packing, warehousing and
distribution.
The Warehousing and Storage sector covers businesses which provide dry and cold-storage facilities
for food and beverage products.
The Retail-Trade sector has a primary subsector of Food and Beverage stores, which in turn has the
following sub-categories: Supermarkets; Convenience Stores; Meat and Seafood Markets; Fruit and
Vegetable Markets; Baked Goods; Confectionary and Nut Stores; Other Specialty Stores; and Beer,
Wine and Liquor Stores. As in other sectors, there is considerable cross-over, with many retail
stores also having additional wholesale or restaurant components. A much smaller subsector, and
one somewhat tangential to food businesses, is Nursery, Garden Center, and Farm Supply Stores.
The Food Service sector includes Catering Services, Restaurants, and Bars & Nightclubs. The
Community Food Services subsector covers food banks and programs such as Meals-on-Wheels.
While defining the food economy through the NAICS codes above is a best practice, is it
nonetheless not an exact science. Some kinds of food-related businesses, such as research and
development of new types of food, food tech, food e-commerce, and farmers’ markets, are not
picked up in the NAICS code approach. Other kinds of businesses that are picked up, such as pet
food companies and agricultural chemical inputs, are not part of a common conception of the food
industries. Section VI, Agriculture and Food Sector Economic Contributions, below, provides more
detail about the types of businesses that are covered in each category.
Industry Clusters
Industry clusters, groups of interrelated industries concentrating in a geographic location, are
another classification system that helps analysis of the Bay Area food economy. In April 2017, ABAG
7
produced Bay Area Clusters, another CEDS Background White Paper, which focuses on employment
by industry cluster. The summary below draws from that paper.
Bay Area Clusters uses the U.S. Economic Development Administration Cluster Mapping Project
classification system of clusters as well as its division of economic activity into two types of clusters,
traded and local. Industries in traded clusters sell products and services outside of a region whereas
industries in local clusters primarily serve a local market. Local clusters account for most of the
employment in regional economies, but traded clusters register higher wages and higher levels of
investment. Traded clusters are the engines of regional economies, supported by local clusters.1
The Cluster Mapping Project2, a national economic initiative and data resource, also utilizes NAICS
codes for industries, but instead of organizing the industries in terms of linear codes (111, 112,
etc.), it organizes industries into clusters by function. In this system, food-related businesses get
lumped with non-food-related businesses based on function, such as distribution.
There are a number of examples from the Bay Area Clusters paper that are relevant to this analysis
of the Bay Area food economy.
Distribution and Electronic Commerce is the second largest traded cluster in terms of
regional employment. Within this cluster, Wholesale of Food Products is the fifth largest
sub-cluster. Alameda County has over a third of the region’s employment in Wholesale of
Food Products.
Hospitality and Tourism, which includes restaurants as well as accommodations, is the fifth
largest traded cluster in terms of regional employment. San Francisco County has around a
third of the region’s employment in this sector.
Food Processing and Manufacturing is the ninth largest traded cluster in terms of regional
employment. Napa and Sonoma counties lead regional employment in this area.
Local Hospitality Establishments and Local Food and Beverage Processing and Distribution,
are respectively the largest and sixth largest local clusters. In six counties, Local Hospitality
Establishments is the most important local cluster in terms of employment.
The takeaway here is that while the food economy can be analyzed in terms of its six NAICS code
categories, it is also instructive to look at the whole food economy as part of a continuum of
economic value and economic interdependence with a range of other industries. Cluster analysis is
one way to do this; analyzing indirect and induced contributions (for example, through IMPLAN
analysis) is another way.
Another perspective on the economics of food is understanding the food value chain as inseparable
from environmental and social considerations, values, and analysis. The terms “foodshed” and
“food system” are often used to connote these other environmental and social aspects of a regional
food economy. Clearly, the Bay Area has a passionate and growing local food movement, a
touchstone of which is appreciation of and demand for local food, which in turn helps drive
production of local food for local consumption.
8
At the same time, due to its extraordinary agricultural land, benign climate, strong food and
beverage production sector and its distribution infrastructure, the Bay Area sells a wide array of
agricultural and processed products nationally and globally. And due to its location and
cosmopolitan nature, the Bay Area sources its food regionally, nationally and globally.
All food businesses, from micro-food enterprise, to community food coop, to global corporations,
are part of the regional food economy and in turn, the regional food economy is an integral part of
the regional economy overall. Section III, Economic Trends, reflects this broad spectrum of the food
economy. Sections IV and VI, the SWOT analysis and the strategy sections of this paper, reflect a
more local bias, with a focus on those food industries that are most significantly invested in the Bay
Area’s unique agricultural resource base, food production, distribution, and consumption sectors.
They are industries that have significant local presence and are critical to a diverse food sector that
can sustain the Bay Area now and into the future.
III. Economic Trends – Establishments, Employment, and Wages
This section examines food business activity by sector, by looking at trends in the number of
establishments, employment, and wages. To provide a sense of scale, this section also looks at the
establishments, employment, and wages of the agricultural and food sectors compared to data for
all industries in the region.
Establishment Trends
Table 2 summarizes county-level establishment data from the Quarterly Census of Employment and
Wages (QCEW), furnished by the California Employment Development Department (EDD). Within
the nine-county region, there were 25,331 agriculture and food-related businesses in 2015, an 11
percent increase from 1995. This growth is comparable to the 14 percent growth of the
establishment count for other industries in the region.
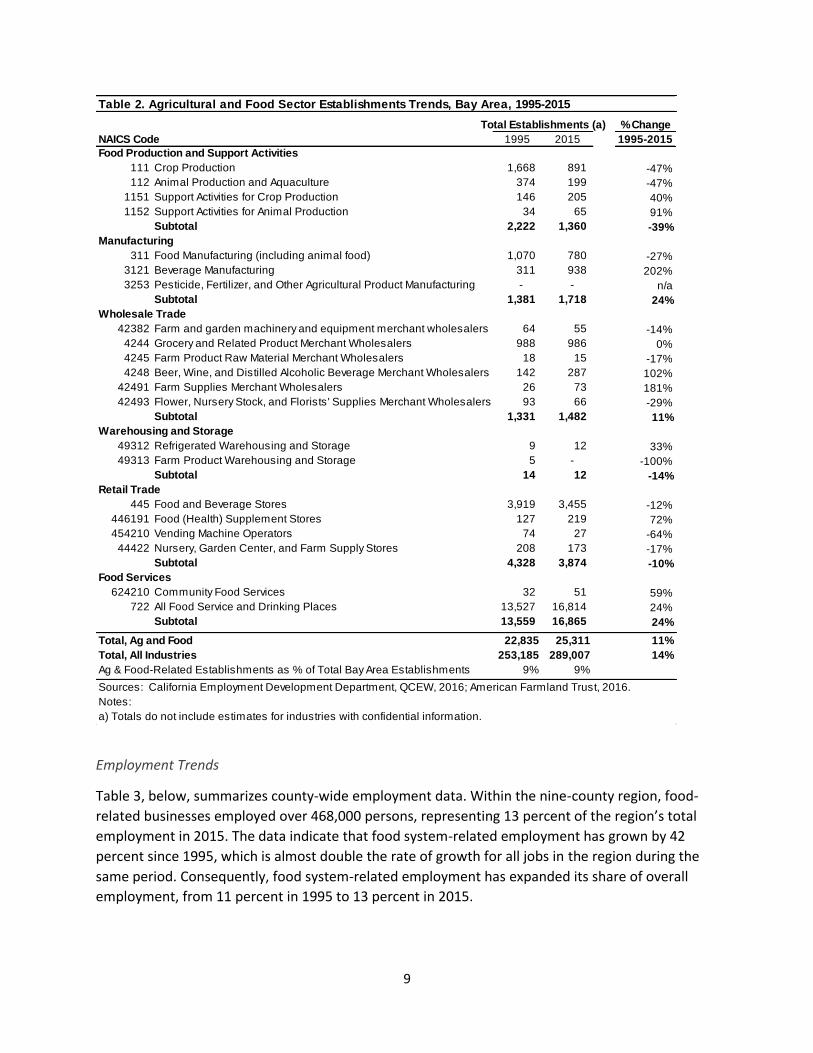
The number of establishments in the groupings of Food Production and Support Activities,
Warehousing and Storage, and Retail trade all dropped in the 20-year period, with 39 percent, 14
percent, and 10 percent declines, respectively. Most notable were the declines in Crop Production
and Animal and Aquiculture Production sub-sectors, which both experienced 47 percent declines.
The most notable growth in the number of establishments is seen in the Beverage Manufacturing
(+202 percent), Beer, Wine, Distilled Alcoholic Merchant Wholesalers (+102 percent), and Farm
Supplies Merchant Wholesalers (+181 percent) sub-sectors.
9
Employment Trends
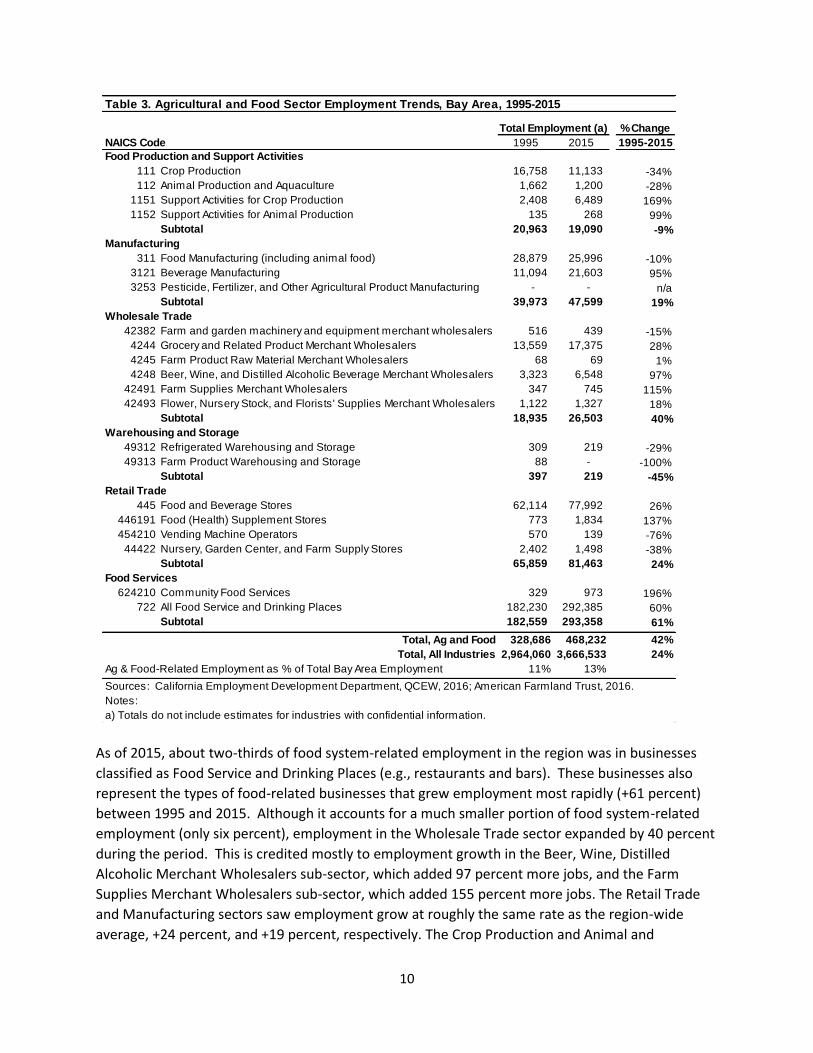
Table 3, below, summarizes county-wide employment data. Within the nine-county region, food-
related businesses employed over 468,000 persons, representing 13 percent of the region’s total
employment in 2015. The data indicate that food system-related employment has grown by 42
percent since 1995, which is almost double the rate of growth for all jobs in the region during the
same period. Consequently, food system-related employment has expanded its share of overall
employment, from 11 percent in 1995 to 13 percent in 2015.
Table 2. Agricultural and Food Sector Establishments Trends, Bay Area, 1995-2015
Total Establishments (a) % Change
NAICS Code 1995 2015 1995-2015
Food Production and Support Activities
111 Crop Production 1,668 891 -47%
112 Animal Production and Aquaculture 374 199 -47%
1151 Support Activities for Crop Production 146 205 40%
1152 Support Activities for Animal Production 34 65 91%
Subtotal 2,222 1,360 -39%
Manufacturing
311 Food Manufacturing (including animal food) 1,070 780 -27%
3121 Beverage Manufacturing 311 938 202%
3253 Pesticide, Fertilizer, and Other Agricultural Product Manufacturing - - n/a
Subtotal 1,381 1,718 24%
Wholesale Trade
42382 Farm and garden machinery and equipment merchant wholesalers 64 55 -14%
4244 Grocery and Related Product Merchant Wholesalers 988 986 0%
4245 Farm Product Raw Material Merchant Wholesalers 18 15 -17%
4248 Beer, Wine, and Distilled Alcoholic Beverage Merchant Wholesalers 142 287 102%
42491 Farm Supplies Merchant Wholesalers 26 73 181%
42493 Flower, Nursery Stock, and Florists' Supplies Merchant Wholesalers 93 66 -29%
Subtotal 1,331 1,482 11%
Warehousing and Storage
49312 Refrigerated Warehousing and Storage 9 12 33%
49313 Farm Product Warehousing and Storage 5 - -100%
Subtotal 14 12 -14%
Retail Trade
445 Food and Beverage Stores 3,919 3,455 -12%
446191 Food (Health) Supplement Stores 127 219 72%
454210 Vending Machine Operators 74 27 -64%
44422 Nursery, Garden Center, and Farm Supply Stores 208 173 -17%
Subtotal 4,328 3,874 -10%
Food Services
624210 Community Food Services 32 51 59%
722 All Food Service and Drinking Places 13,527 16,814 24%
Subtotal 13,559 16,865 24%
Total, Ag and Food 22,835 25,311 11%
Total, All Industries 253,185 289,007 14%
Ag & Food-Related Establishments as % of Total Bay Area Establishments 9% 9%
Sources: California Employment Development Department, QCEW, 2016; American Farmland Trust, 2016.
Notes:
a) Totals do not include estimates for industries with confidential information.
10
As of 2015, about two-thirds of food system-related employment in the region was in businesses
classified as Food Service and Drinking Places (e.g., restaurants and bars). These businesses also
represent the types of food-related businesses that grew employment most rapidly (+61 percent)
between 1995 and 2015. Although it accounts for a much smaller portion of food system-related
employment (only six percent), employment in the Wholesale Trade sector expanded by 40 percent
during the period. This is credited mostly to employment growth in the Beer, Wine, Distilled
Alcoholic Merchant Wholesalers sub-sector, which added 97 percent more jobs, and the Farm
Supplies Merchant Wholesalers sub-sector, which added 155 percent more jobs. The Retail Trade
and Manufacturing sectors saw employment grow at roughly the same rate as the region-wide
average, +24 percent, and +19 percent, respectively. The Crop Production and Animal and
Table 3. Agricultural and Food Sector Employment Trends, Bay Area, 1995-2015
Total Employment (a) % Change
NAICS Code 1995 2015 1995-2015
Food Production and Support Activities
111 Crop Production 16,758 11,133 -34%
112 Animal Production and Aquaculture 1,662 1,200 -28%
1151 Support Activities for Crop Production 2,408 6,489 169%
1152 Support Activities for Animal Production 135 268 99%
Subtotal 20,963 19,090 -9%
Manufacturing
311 Food Manufacturing (including animal food) 28,879 25,996 -10%
3121 Beverage Manufacturing 11,094 21,603 95%
3253 Pesticide, Fertilizer, and Other Agricultural Product Manufacturing - - n/a
Subtotal 39,973 47,599 19%
Wholesale Trade
42382 Farm and garden machinery and equipment merchant wholesalers 516 439 -15%
4244 Grocery and Related Product Merchant Wholesalers 13,559 17,375 28%
4245 Farm Product Raw Material Merchant Wholesalers 68 69 1%
4248 Beer, Wine, and Distilled Alcoholic Beverage Merchant Wholesalers 3,323 6,548 97%
42491 Farm Supplies Merchant Wholesalers 347 745 115%
42493 Flower, Nursery Stock, and Florists' Supplies Merchant Wholesalers 1,122 1,327 18%
Subtotal 18,935 26,503 40%
Warehousing and Storage
49312 Refrigerated Warehousing and Storage 309 219 -29%
49313 Farm Product Warehousing and Storage 88 - -100%
Subtotal 397 219 -45%
Retail Trade
445 Food and Beverage Stores 62,114 77,992 26%
446191 Food (Health) Supplement Stores 773 1,834 137%
454210 Vending Machine Operators 570 139 -76%
44422 Nursery, Garden Center, and Farm Supply Stores 2,402 1,498 -38%
Subtotal 65,859 81,463 24%
Food Services
624210 Community Food Services 329 973 196%
722 All Food Service and Drinking Places 182,230 292,385 60%
Subtotal 182,559 293,358 61%
Total, Ag and Food 328,686 468,232 42%
Total, All Industries 2,964,060 3,666,533 24%
Ag & Food-Related Employment as % of Total Bay Area Employment 11% 13%
Sources: California Employment Development Department, QCEW, 2016; American Farmland Trust, 2016.
Notes:
a) Totals do not include estimates for industries with confidential information.
11
Aquaculture Production sub-sectors saw declines in employment by 34 and 28 percent,
respectively. Meanwhile, Support Activities for Crop Production and Animal Production added 169
percent and 99 percent more jobs, respectively.
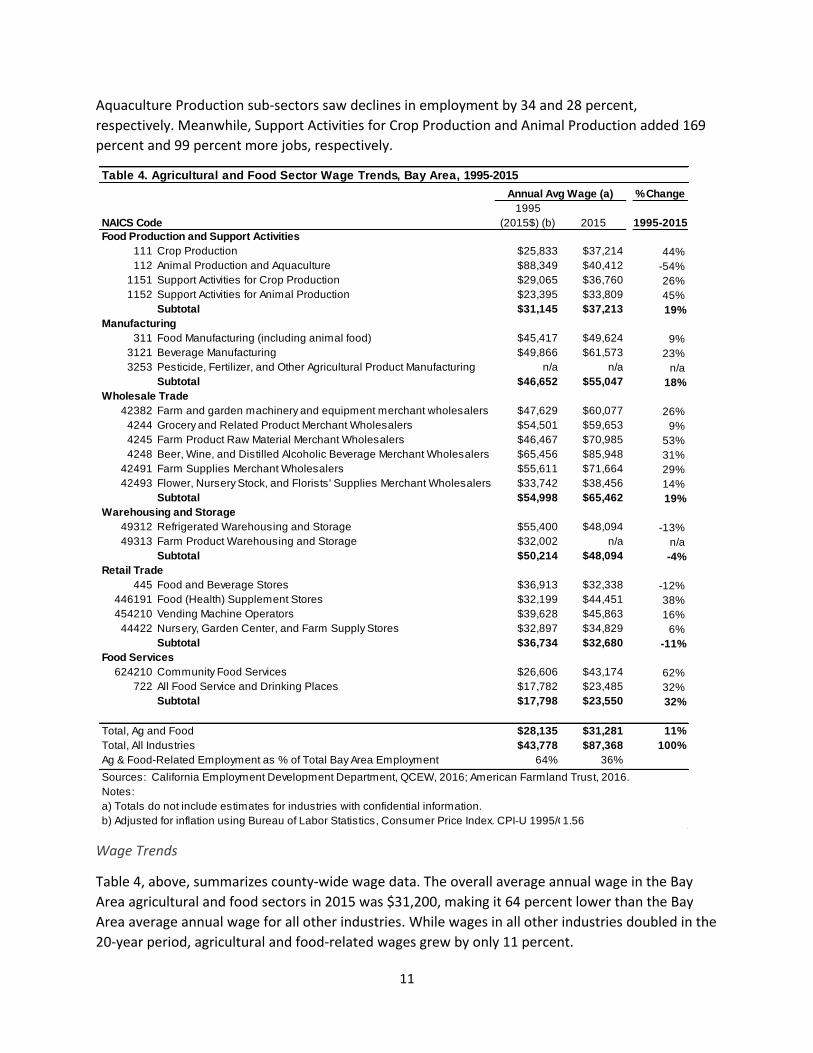
Wage Trends
Table 4, above, summarizes county-wide wage data. The overall average annual wage in the Bay
Area agricultural and food sectors in 2015 was $31,200, making it 64 percent lower than the Bay
Area average annual wage for all other industries. While wages in all other industries doubled in the
20-year period, agricultural and food-related wages grew by only 11 percent.
Table 4. Agricultural and Food Sector Wage Trends, Bay Area, 1995-2015
Annual Avg Wage (a) % Change
NAICS Code
1995
(2015$) (b) 2015 1995-2015
Food Production and Support Activities
111 Crop Production $25,833 $37,214 44%
112 Animal Production and Aquaculture $88,349 $40,412 -54%
1151 Support Activities for Crop Production $29,065 $36,760 26%
1152 Support Activities for Animal Production $23,395 $33,809 45%
Subtotal $31,145 $37,213 19%
Manufacturing
311 Food Manufacturing (including animal food) $45,417 $49,624 9%
3121 Beverage Manufacturing $49,866 $61,573 23%
3253 Pesticide, Fertilizer, and Other Agricultural Product Manufacturing n/a n/a n/a
Subtotal $46,652 $55,047 18%
Wholesale Trade
42382 Farm and garden machinery and equipment merchant wholesalers $47,629 $60,077 26%
4244 Grocery and Related Product Merchant Wholesalers $54,501 $59,653 9%
4245 Farm Product Raw Material Merchant Wholesalers $46,467 $70,985 53%
4248 Beer, Wine, and Distilled Alcoholic Beverage Merchant Wholesalers $65,456 $85,948 31%
42491 Farm Supplies Merchant Wholesalers $55,611 $71,664 29%
42493 Flower, Nursery Stock, and Florists' Supplies Merchant Wholesalers $33,742 $38,456 14%
Subtotal $54,998 $65,462 19%
Warehousing and Storage
49312 Refrigerated Warehousing and Storage $55,400 $48,094 -13%
49313 Farm Product Warehousing and Storage $32,002 n/a n/a
Subtotal $50,214 $48,094 -4%
Retail Trade
445 Food and Beverage Stores $36,913 $32,338 -12%
446191 Food (Health) Supplement Stores $32,199 $44,451 38%
454210 Vending Machine Operators $39,628 $45,863 16%
44422 Nursery, Garden Center, and Farm Supply Stores $32,897 $34,829 6%
Subtotal $36,734 $32,680 -11%
Food Services
624210 Community Food Services $26,606 $43,174 62%
722 All Food Service and Drinking Places $17,782 $23,485 32%
Subtotal $17,798 $23,550 32%
Total, Ag and Food $28,135 $31,281 11%
Total, All Industries $43,778 $87,368 100%
Ag & Food-Related Employment as % of Total Bay Area Employment 64% 36%
Sources: California Employment Development Department, QCEW, 2016; American Farmland Trust, 2016.
Notes:
a) Totals do not include estimates for industries with confidential information.
b) Adjusted for inflation using Bureau of Labor Statistics, Consumer Price Index. CPI-U 1995/CPI-U 2015 =1.56
12
The most notable changes are in those sub-sectors that represent the largest employment. The
food service and drinking places subsector, which represents 62 percent of total employment, has
by far the lowest wage - $23,485, which puts in perspective the 32 percent increase seen over the
last 20 years. The food and beverage stores subsector had a 12 percent decline in average wages,
which is significant given that this subsector represents 17 percent of all employment. On the more
positive side, the Food Production and Wholesale Trade sectors both had wage increases of 19
percent, the Manufacturing sector had a wage increase of 18 percent, and the Food Services sector
saw a 32 percent increase in wages.
IV. Economic Contributions
Establishments and Employment Overview
This section looks at the direct economic contributions of food sectors by category and by county
using individual firm-level data from Dun & Bradstreet for all Agricultural and Food Sector (food
system) establishments located in the nine-county Bay Area region. Dun & Bradstreet maintains an
up-to-date list of establishments, containing data relating to the establishment location, number of
employees, estimated annual revenue, and NAICs category, among others. These data will vary
from the information provided by the QCEW above, due to the different data collection methods
used for the two data sets. Dun & Bradstreet collects its establishment data from a number of
public and proprietary sources, including its own primary research conducted through interviews
with business representatives. Information for individual businesses is updated on a rolling basis, so
the data from Dun & Bradstreet represents the most recent business information available at the
time the Dun & Bradstreet database is accessed, rather than a snapshot of business activity as of a
specific point date in time. Nonetheless, this database provides a further understanding of the
economic activity associated with Bay Area businesses within the Agricultural and Food Sector
industries because it includes establishment level data with specific addresses and estimated
revenues, among other data points.
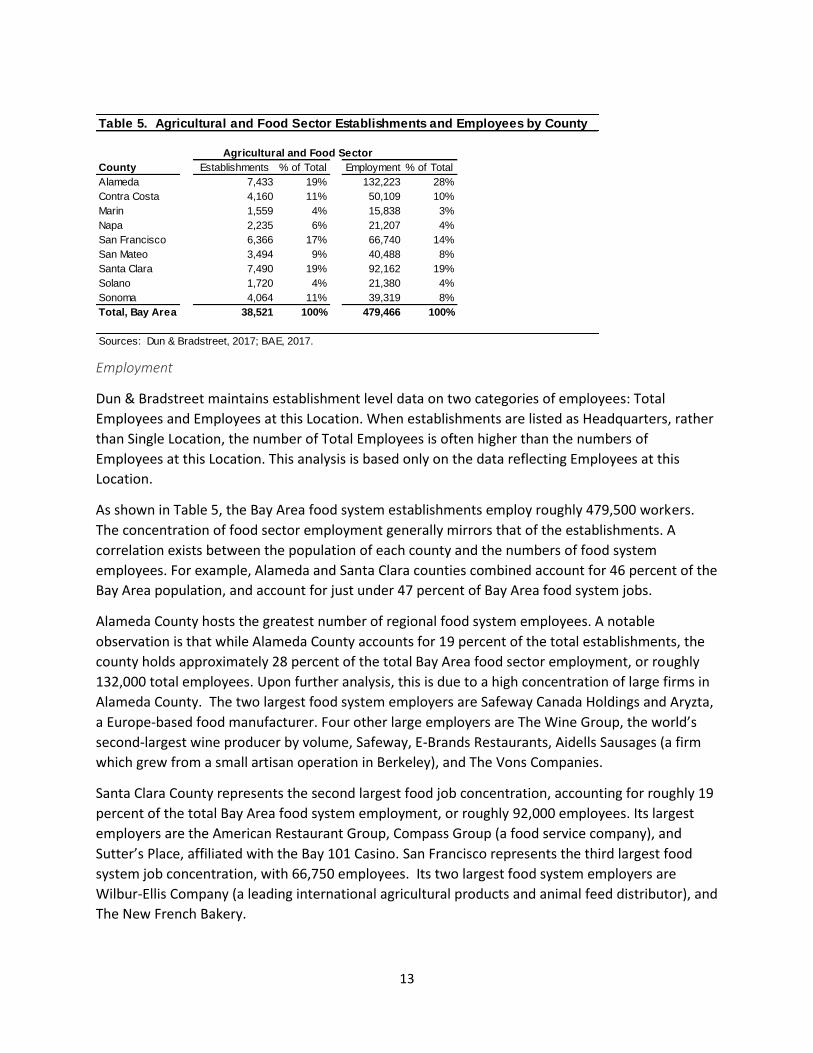
Establishments
According to the Dun & Bradstreet data shown in Table 5, a total of 38,521 Agricultural and Food
Sector establishments are located throughout the Bay Area. Alameda County and Santa Clara
County contain the highest number of food system establishments, both containing roughly 7,500
total establishments and 19 percent of the total Bay Area count each. San Francisco County
represents the third largest concentration, with approximately 6,400, or 16.5 percent of all Bay Area
food system establishments, followed by Contra Costa County and Sonoma County, both containing
approximately 4,100 establishments, and San Mateo County, with about 3,500 establishments.
Napa, Solano, and Marin counties contain relatively small numbers of food system establishments,
between 1,500 and 2,300 establishments per county. However, the food industry plays an
important role in the identity and economy of each of these counties.
13
Employment
Dun & Bradstreet maintains establishment level data on two categories of employees: Total
Employees and Employees at this Location. When establishments are listed as Headquarters, rather
than Single Location, the number of Total Employees is often higher than the numbers of
Employees at this Location. This analysis is based only on the data reflecting Employees at this
Location.
As shown in Table 5, the Bay Area food system establishments employ roughly 479,500 workers.
The concentration of food sector employment generally mirrors that of the establishments. A
correlation exists between the population of each county and the numbers of food system
employees. For example, Alameda and Santa Clara counties combined account for 46 percent of the
Bay Area population, and account for just under 47 percent of Bay Area food system jobs.
Alameda County hosts the greatest number of regional food system employees. A notable
observation is that while Alameda County accounts for 19 percent of the total establishments, the
county holds approximately 28 percent of the total Bay Area food sector employment, or roughly
132,000 total employees. Upon further analysis, this is due to a high concentration of large firms in
Alameda County. The two largest food system employers are Safeway Canada Holdings and Aryzta,
a Europe-based food manufacturer. Four other large employers are The Wine Group, the world’s
second-largest wine producer by volume, Safeway, E-Brands Restaurants, Aidells Sausages (a firm
which grew from a small artisan operation in Berkeley), and The Vons Companies.
Santa Clara County represents the second largest food job concentration, accounting for roughly 19
percent of the total Bay Area food system employment, or roughly 92,000 employees. Its largest
employers are the American Restaurant Group, Compass Group (a food service company), and
Sutter’s Place, affiliated with the Bay 101 Casino. San Francisco represents the third largest food
system job concentration, with 66,750 employees. Its two largest food system employers are
Wilbur-Ellis Company (a leading international agricultural products and animal feed distributor), and
The New French Bakery.
Table 5. Agricultural and Food Sector Establishments and Employees by County
Agricultural and Food Sector
County Establishments % of Total Employment % of Total
Alameda 7,433 19% 132,223 28%
Contra Costa 4,160 11% 50,109 10%
Marin 1,559 4% 15,838 3%
Napa 2,235 6% 21,207 4%
San Francisco 6,366 17% 66,740 14%
San Mateo 3,494 9% 40,488 8%
Santa Clara 7,490 19% 92,162 19%
Solano 1,720 4% 21,380 4%
Sonoma 4,064 11% 39,319 8%
Total, Bay Area 38,521 100% 479,466 100%
Sources: Dun & Bradstreet, 2017; BAE, 2017.

14
Contra Costa County has just over 50,000 food system employees. The largest employers are
PacPizza, C&H Sugar Company, Kellogg Company, and Nancy’s Specialty Foods (a frozen appetizer
manufacturer started by Nancy Mueller). San Mateo County and Sonoma County both have roughly
40,000 food system employees. Boething Treeland Farms (a wholesale nursery), Host (an airline
food service company), and See’s Candy are the largest employers in San Mateo County. Amy’s
Kitchen (a prepared-foods manufacturer), Constellation Brands (a wine, beer and spirits producer),
and Chick-Fil-A (a restaurant chain), are the largest employers in Sonoma County.
Similar to the distribution of establishments, Napa County, Solano County, and Marin County
account for the smallest number of food system jobs, though the three counties each host between
15,000 and 22,000 food system employees. In Napa County, the largest employers are in the wine
and hospitality sub-sector. In Solano County, the largest employers are a dried fruit packing
company and a convenience store headquarters. In Marin County, the largest employers are the
headquarters of a medium-sized grocery chain and the headquarters of a dessert-based restaurant
chain.
Establishment Size
While large employers can have a significant impact on local economies, collectively, smaller size
employers can have an equally important role in the local economy and are often considered
important for economic growth, innovation, and diversity. Smaller businesses can also contribute to
the social context of a place, since they often have deeper connections within a community by
virtue of having local ownership and other ties. It is instructive to look at the number of people
employed at establishments and understand the various types and sizes of these food businesses.
As shown in Table 6, the large majority (84 percent) of the region’s food businesses fall into the size
of 1-14 employees. Business with 15-49 employees represent another 12 percent of the region’s
food businesses. The Food Services sector tends to have largest concentration of businesses in the
smallest (under 14 employees) size category, while throughout the region almost half of large
businesses (over 100 employees) tend to be Retail establishments.
Revenue
Along with providing information about the total number of establishments and employees, the
Dun & Bradstreet database presents firm-level annual revenue figures. One notable element of the
revenue figures is that the Bay Area is home to many firm headquarter locations. The revenue
Table 6. Food Sector Establishments by Size, Bay Area
# of Employees Production Manufacturing Wholesale Warehousing Retail Food Services Total % of Total
1-14 3,386 2,385 3,315 18 6,914 16,403 32,421 84%
15-49 133 352 345 3 394 3,332 4,559 12%
50-99 43 94 89 1 310 502 1,039 3%
100-299 18 81 32 - 187 117 435 1%
300+ 3 20 12 - 15 17 67 0.2%
Total 3,583 2,932 3,793 22 7,820 20,371 38,521 100%
Sources: Dun & Bradstreet, 2107; SAGE, AFT, 2017
Number of Establishments
15
figures for the headquarters locations of most large firms reflect company-wide annual revenue
figures. As a result, the revenue figures presented for the affected sectors within a county may be
larger than anticipated. For example, as previously noted, Safeway Canada Holdings has its
headquarters location in Alameda County, translating to a significant annual revenue total in the
Food and Beverage Stores sub-sector in Alameda County. Similarly, See’s Candies, a major chocolate
confectionery manufacturer, has its headquarters in San Mateo County, thus increasing the revenue
figures in the Food Manufacturing industry sub-sector for San Mateo County. While these figures
likely overestimate the local and regional impact of the headquarters establishments, it is worth
noting that these headquarters locations do employ a large share of companies’ high-level
employees and generate significant amounts of economic activity within the greater Bay Area
through corporate spending.
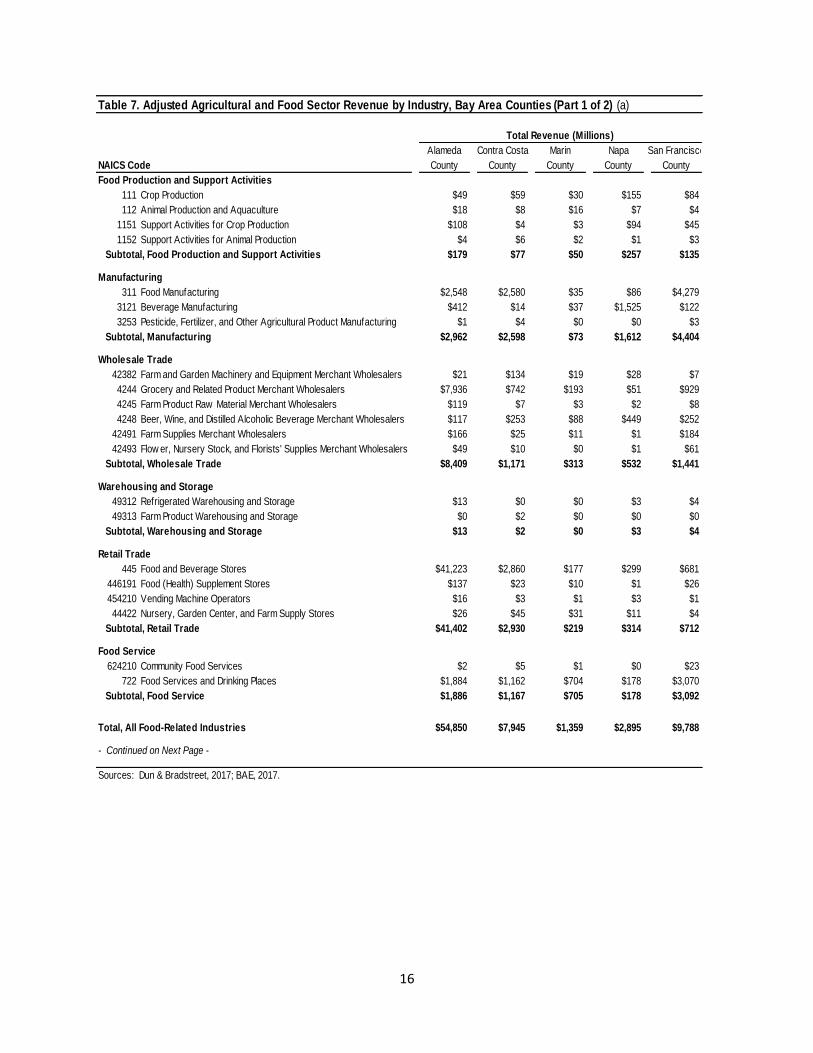
Based on the Dun & Bradstreet data provided in Table 7, food system establishments generate
roughly $113 billion in annual revenue across the entire Bay Area region.3 Food and Beverage
Stores generate roughly 42 percent of the regional food system revenue, while Grocery and Related
Product Merchant Wholesalers generate 28 percent, indicating that roughly 70 percent of the total
Bay Area food system revenue is generated by the retail and wholesale activity for grocery and
beverage products. Food Manufacturing establishments generate another 12 percent of the Bay
Area food system revenue, while about 8.6 percent is generated by Food Service and Drinking
Places, which includes food service companies, caterers, restaurants and bars. The remaining
industry sectors account for just nine percent of the total Bay Area food system revenue, the most
significant of which includes $3.3 billion in annual revenue from Beverage Manufacturing
establishments and $1.9 billion from all Food Production and Support Activities. Crop Production
and Animal Production subsectors produce just a little over one percent of the total revenues for
the Bay Area’s food system. However, this may understate the importance of the regional food
production activities, as food production is the beginning of the food chain, and locally sourced
ingredients are an important component of the growing artisan food products industry, whereas
much of the added value in the food chain is generated in processing, packaging, marketing,
distribution, and retail activities that depend on raw food products as inputs.
16
Table 7. Adjusted Agricultural and Food Sector Revenue by Industry, Bay Area Counties (Part 1 of 2) (a)
Total Revenue (Millions)
Alameda Contra Costa Marin Napa San Francisco
NAICS Code County County County County County
Food Production and Support Activities
111 Crop Production $49 $59 $30 $155 $84
112 Animal Production and Aquaculture $18 $8 $16 $7 $4
1151 Support Activities for Crop Production $108 $4 $3 $94 $45
1152 Support Activities for Animal Production $4 $6 $2 $1 $3
Subtotal, Food Production and Support Activities $179 $77 $50 $257 $135
Manufacturing
311 Food Manufacturing $2,548 $2,580 $35 $86 $4,279
3121 Beverage Manufacturing $412 $14 $37 $1,525 $122
3253 Pesticide, Fertilizer, and Other Agricultural Product Manufacturing $1 $4 $0 $0 $3
Subtotal, Manufacturing $2,962 $2,598 $73 $1,612 $4,404
Wholesale Trade
42382 Farm and Garden Machinery and Equipment Merchant Wholesalers $21 $134 $19 $28 $7
4244 Grocery and Related Product Merchant Wholesalers $7,936 $742 $193 $51 $929
4245 Farm Product Raw Material Merchant Wholesalers $119 $7 $3 $2 $8
4248 Beer, Wine, and Distilled Alcoholic Beverage Merchant Wholesalers $117 $253 $88 $449 $252
42491 Farm Supplies Merchant Wholesalers $166 $25 $11 $1 $184
42493 Flow er, Nursery Stock, and Florists' Supplies Merchant Wholesalers $49 $10 $0 $1 $61
Subtotal, Wholesale Trade $8,409 $1,171 $313 $532 $1,441
Warehousing and Storage
49312 Refrigerated Warehousing and Storage $13 $0 $0 $3 $4
49313 Farm Product Warehousing and Storage $0 $2 $0 $0 $0
Subtotal, Warehousing and Storage $13 $2 $0 $3 $4
Retail Trade
445 Food and Beverage Stores $41,223 $2,860 $177 $299 $681
446191 Food (Health) Supplement Stores $137 $23 $10 $1 $26
454210 Vending Machine Operators $16 $3 $1 $3 $1
44422 Nursery, Garden Center, and Farm Supply Stores $26 $45 $31 $11 $4
Subtotal, Retail Trade $41,402 $2,930 $219 $314 $712
Food Service
624210 Community Food Services $2 $5 $1 $0 $23
722 Food Services and Drinking Places $1,884 $1,162 $704 $178 $3,070
Subtotal, Food Service $1,886 $1,167 $705 $178 $3,092
Total, All Food-Related Industries $54,850 $7,945 $1,359 $2,895 $9,788
- Continued on Next Page -
Sources: Dun & Bradstreet, 2017; BAE, 2017.
17
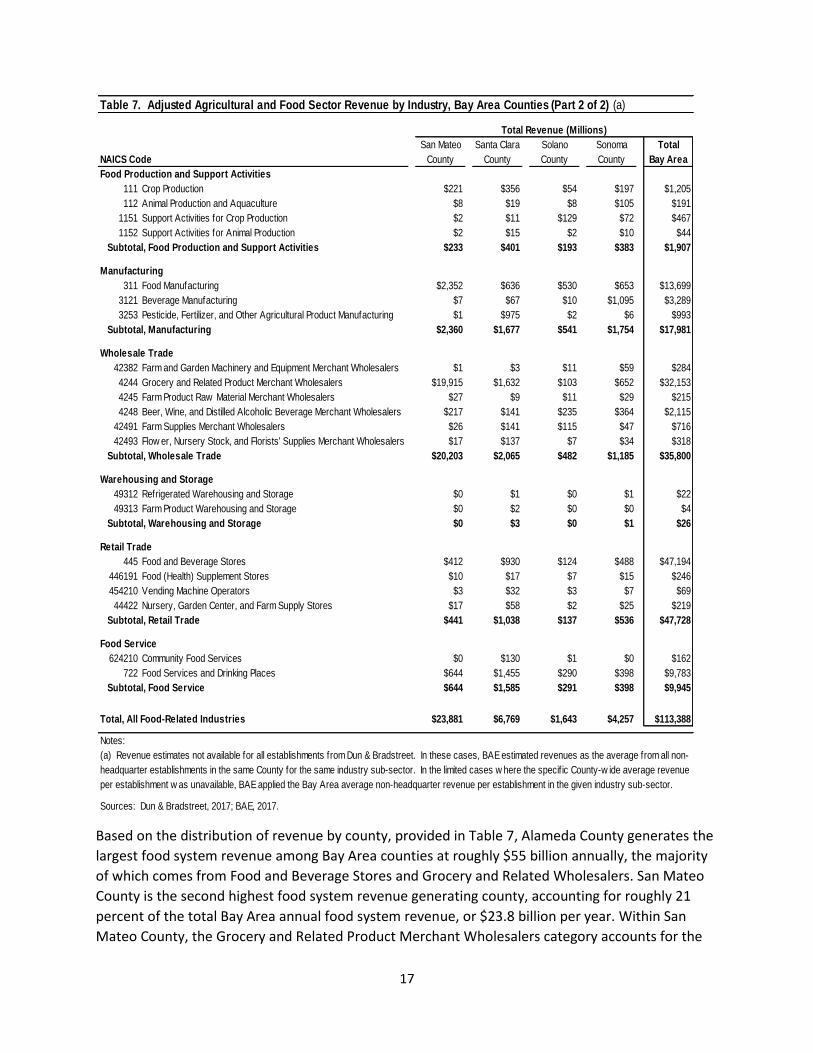
Based on the distribution of revenue by county, provided in Table 7, Alameda County generates the
largest food system revenue among Bay Area counties at roughly $55 billion annually, the majority
of which comes from Food and Beverage Stores and Grocery and Related Wholesalers. San Mateo
County is the second highest food system revenue generating county, accounting for roughly 21
percent of the total Bay Area annual food system revenue, or $23.8 billion per year. Within San
Mateo County, the Grocery and Related Product Merchant Wholesalers category accounts for the
Table 7. Adjusted Agricultural and Food Sector Revenue by Industry, Bay Area Counties (Part 2 of 2) (a)
Total Revenue (Millions)
San Mateo Santa Clara Solano Sonoma Total
NAICS Code County County County County Bay Area
Food Production and Support Activities
111 Crop Production $221 $356 $54 $197 $1,205
112 Animal Production and Aquaculture $8 $19 $8 $105 $191
1151 Support Activities for Crop Production $2 $11 $129 $72 $467
1152 Support Activities for Animal Production $2 $15 $2 $10 $44
Subtotal, Food Production and Support Activities $233 $401 $193 $383 $1,907
Manufacturing
311 Food Manufacturing $2,352 $636 $530 $653 $13,699
3121 Beverage Manufacturing $7 $67 $10 $1,095 $3,289
3253 Pesticide, Fertilizer, and Other Agricultural Product Manufacturing $1 $975 $2 $6 $993
Subtotal, Manufacturing $2,360 $1,677 $541 $1,754 $17,981
Wholesale Trade
42382 Farm and Garden Machinery and Equipment Merchant Wholesalers $1 $3 $11 $59 $284
4244 Grocery and Related Product Merchant Wholesalers $19,915 $1,632 $103 $652 $32,153
4245 Farm Product Raw Material Merchant Wholesalers $27 $9 $11 $29 $215
4248 Beer, Wine, and Distilled Alcoholic Beverage Merchant Wholesalers $217 $141 $235 $364 $2,115
42491 Farm Supplies Merchant Wholesalers $26 $141 $115 $47 $716
42493 Flow er, Nursery Stock, and Florists' Supplies Merchant Wholesalers $17 $137 $7 $34 $318
Subtotal, Wholesale Trade $20,203 $2,065 $482 $1,185 $35,800
Warehousing and Storage
49312 Refrigerated Warehousing and Storage $0 $1 $0 $1 $22
49313 Farm Product Warehousing and Storage $0 $2 $0 $0 $4
Subtotal, Warehousing and Storage $0 $3 $0 $1 $26
Retail Trade
445 Food and Beverage Stores $412 $930 $124 $488 $47,194
446191 Food (Health) Supplement Stores $10 $17 $7 $15 $246
454210 Vending Machine Operators $3 $32 $3 $7 $69
44422 Nursery, Garden Center, and Farm Supply Stores $17 $58 $2 $25 $219
Subtotal, Retail Trade $441 $1,038 $137 $536 $47,728
Food Service
624210 Community Food Services $0 $130 $1 $0 $162
722 Food Services and Drinking Places $644 $1,455 $290 $398 $9,783
Subtotal, Food Service $644 $1,585 $291 $398 $9,945
Total, All Food-Related Industries $23,881 $6,769 $1,643 $4,257 $113,388
Notes:
(a) Revenue estimates not available for all establishments from Dun & Bradstreet. In these cases, BAE estimated revenues as the average from all non-
headquarter establishments in the same County for the same industry sub-sector. In the limited cases w here the specif ic County-w ide average revenue
per establishment w as unavailable, BAE applied the Bay Area average non-headquarter revenue per establishment in the given industry sub-sector.
Sources: Dun & Bradstreet, 2017; BAE, 2017.
18
majority of the total revenue generated countywide, while Food Manufacturing also generates a
large amount of annual revenue. San Francisco County has the third highest food system revenue,
with establishments generating approximately $9.8 billion annually, accounting for roughly nine
percent of the total Bay Area food system revenue. Within San Francisco, Food Manufacturing
accounts for the largest food system revenue generating industry, at roughly $4.3 billion annually.
Although it is only the second-largest food system sector in San Francisco by annual revenues, the
Food Services and Drinking Places sector, with $3.1 billion in annual revenues, generates notably
higher revenues in San Francisco than in any other Bay Area county.
Contra Costa County has the fourth largest food system sector revenues by county, with just shy of
$8 billion in annual revenue. Similar to most counties, Contra Costa is dominated by the Food and
Beverages Stores, Food Manufacturing, and Food Services and Drinking Places industries, which
combined account for 83 percent of Contra Costa’s total food system revenue. Santa Clara County
food sector establishments generate $6.8 billion in annual revenue, accounting for six percent of
the total Bay Area revenue. Santa Clara County hosts Grocery and Related Product Merchant
Wholesalers generating significant amounts of annual revenue, roughly $1.6 billion, and Food
Services and Drinking Places, generating roughly $1.5 billion annually. It is worth noting that Santa
Clara County accounts for almost all of the Bay Area’s revenue generated in the Pesticide, Fertilizer,
and Other Agricultural Product Manufacturing sectors.
Sonoma County and Napa County account for $4.2 billion and $2.8 billion in annual revenue,
respectively. Both counties display similar distributions of food system revenue-generating
industries, with large concentrations in the Beverage Manufacturing, and Beer, Wine, and Distilled
Alcoholic Beverage Merchant Wholesalers industries as a result of the widely-recognized North Bay
wine industry.
Lastly, Solano County and Marin County each generate less than $2 billion in annual food system
revenue. Solano County has higher concentrations of establishment sales in the Food
Manufacturing and Wholesale Trade sectors, which account for 62 percent of the total Solano
Countywide food system revenue. Conversely, Marin County food system revenue is largely
concentrated in the Food Services and Drinking Places, and Food and Beverage Stores sub-sectors.
Indirect and Induced Economic Contributions
Many assessments of regional food economies include information about indirect and induced
economic contributions of industries within the local economy, often based on analysis using the
IMPLAN regional input-output model, which considers the economic multiplier effects of business
activities through spending in other related industries. While a full economic impact analysis for the
regional food system is beyond the scope of this white paper, several counties have conducted such
assessments for their agricultural sectors. For example, Santa Clara County estimated that its
agricultural industries sector had a multiplier factor of 1.5, which contribute $830 million annually
to the local economy in addition to the direct value of the County’s agricultural production.
More general analysis posits that for every 100 jobs in agriculture, including the food industry, there
are 94 additional jobs created throughout the state.4 Beyond the indirect and induced
19
contributions of the food economy, as described above in Section II, Defining the Food Economy,
the food supply chain has close linkages with many other industries, from closely allied industries
such as the production of farm inputs and food processing inputs, to broader industry sectors such
as hospitality, tourism, transportation, legal, marketing, and financial services.
Social and Environmental Contributions
While the economic contributions of the region’s food business are indicative of the robustness of
the Bay Area food economy, the social and environmental contributions, challenges, and
opportunities are interrelated and, to some degree, drive the economic factors. These
interconnected and codependent elements are evident as outlined in the SWOT Analysis in Section
VI.
The mini-profiles of the food sector businesses below are intended to highlight some of the
interrelated economic, social and environmental factors within the food system sectors, the critical
links between different sectors of the food supply chain, and the integration of the food system
with the region’s overall economy and sustainability. Given the fact that there are almost 40,000
food businesses in the Bay Area, these few profiles are hardly representative. However, they do
illustrate the kinds of businesses - the makers, connectors, transformers, and resource protectors -
that create the culture of the region’s food system. All quotes are from personal communication
with SAGE, unless otherwise noted.
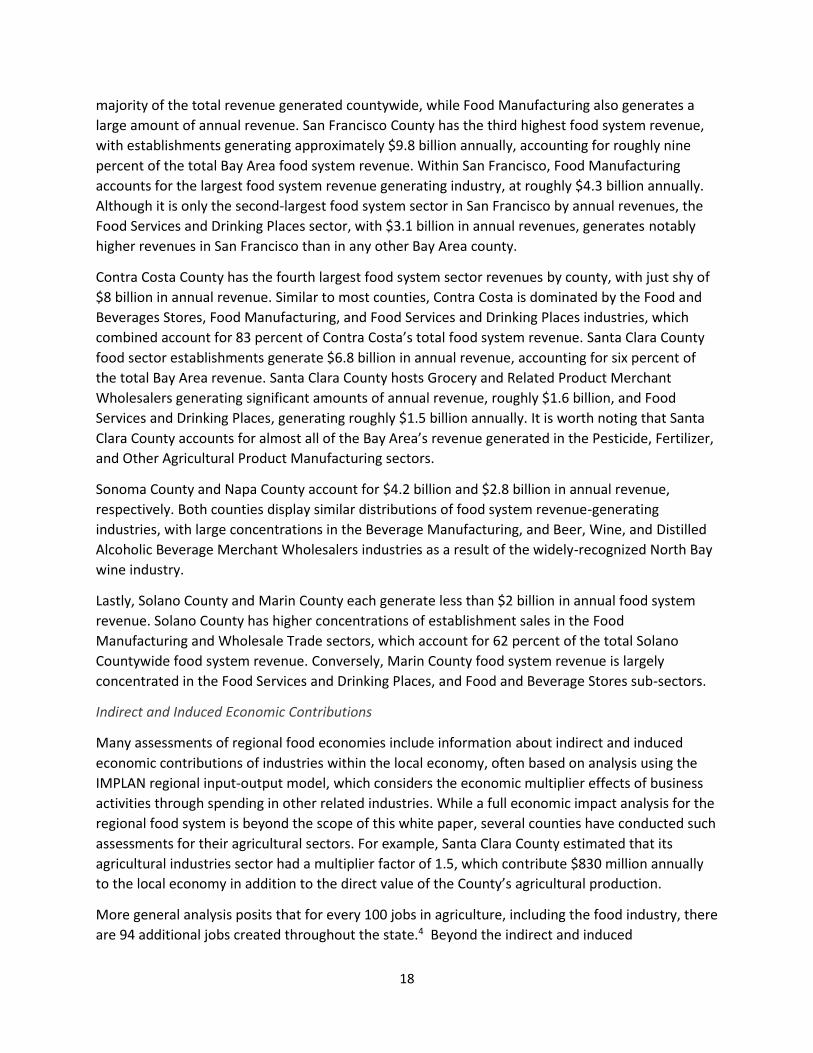
Taste Catering, San Francisco and San Mateo Counties
Established in 1978, Taste is women-owned and operated and has provided catering and event
planning services for private and corporate clients in the San Francisco Bay Area for almost 40
years. Taste maintains it original facility in San Francisco. However, in order to accommodate
growth (current annual revenues are in the tens of millions) and address challenges facing many
food production businesses, it recently moved its production facility to Millbrae.
Asset: “Having access to locally grown organic and sustainable product.”
Challenge: “How to help grow the supply of farmers.”
Frog Hollow Farm, Contra Costa and San Francisco Counties
From 14 acres of organic orchards in 1980, to over 200 acres today, this Brentwood farm has
become synonymous in the Bay Area with top-quality stone fruit. It also represents food supply
chain connectedness with its café in the Ferry Building, line of value-added products, and a ‘growing
new farmers’ program at the farm.
Asset: “Farming in an extraordinarily productive area and proximity to a market, highly receptive
to product quality.”
Challenge: “Invigorating ag-tourism and making on-farm direct marketing easier.”
20
Whole Foods, Northern California Division Headquarters, Alameda and Contra Costa Counties
In around 30 years, Whole Foods’ presence in Northern California has grown from a single store, to
a chain of 44 stores (most of them in the Bay Area) served by a 120,000 square foot distribution
center in Richmond that provides employment for over 9,000 people.
Challenges: “Our employees cannot afford to live where our stores are.” “Sufficient supply.”
“Education and awareness about the values of local, sustainable food supply.”
Russian River Brewing Company, Sonoma County
A company with 96 employees and a business model based on product scarcity, the Russian River
Brewing Company has experienced a four-fold increase in production after ten years in operation.
In 2016, the company’s two-week event in downtown Santa Rosa brought in over 16,000
attendees, which had nearly $5 million in economic impact on the local economy. The company
holds a month-long fundraiser in October to raise money for breast cancer research, and reports
raising over $100,000 each year.
Assets: “Our employees enjoy working in this environment as evidenced by the low turnover
numbers, which we believe is low relative to similar businesses.” “[We] are not focused on
expansion, but rather on upgrading the current equipment to improve the quality of our beers.
We are not believers in rapid growth, but rather we want to focus on sustainable growth by
remaining a boutique-type brewery and maintaining our commitment to quality.”5
Dixon Ridge Farms, Solano County
The 1,250-acre Dixon Ridge Farms is a leading organic walnut grower, buyer, and processor based
in Winters that works to grow, process, and market certified organic walnuts. The Lester family,
which processes 1,500 tons of organic walnuts annually (most of California’s market), has been in
the business of family farming in California since 1883. They are the first on-site farm to use the
BioMax 50, a 50kW biogas powered generator that converts walnut shells into renewable energy.
This energy is then used to fuel the drying facility in the fall, generate electricity year-round
including for its extensive freezer equipment, and heat buildings during the winter. They are also
innovators in water-conserving drip irrigation and waste management, and are experimenting with
adding the biochar byproduct to their orchard soils to enhance fertility and carbon sequestration.6
Asset: Taking a whole systems approach to sustainability.
Bi-Rite, San Francisco County
Bi-Rite Family of Businesses is an iconic chain of grocery stores, a creamery, a catering division, and
an organic farm that employs a total of 300 people. They are Certified B Corporation, which means
they align their business values to meet rigorous standards of social and environmental
performance, accountability, and transparency. The company offers all staffers, including part-
timers, health insurance, a 401(k) plan with a 4% match, and profit-sharing. As a pioneer in the
farm-to-grocery-store movement, in 1997 owner Sam Mogannam took over his family’s grocery
store that opened in the 1960’s. Within three years his business tripled and Bi-rite not only
21
transformed into a community institution showcasing California producers and specialty food
makers, but it helped transform a neighborhood that was once an area of high crime to one of the
most desirable neighborhoods in San Francisco. The market has been immensely popular, with
revenue of $44 million in 2016. The market’s impact on the community is significant, with 75% of
their revenue dedicated to local vendors, staff wages, or supporting local organizations.7,8,9
Asset: “We focus on local food, traditional food, and responsible food, but it’s about more than
food. Our goal is to create community through food. We’re creating honest, sincere, engaged,
deep relationships with our entire community. Our staff members are people who grow, make,
and craft our food. Our storefronts improve the neighborhoods.”10
San Francisco Wholesale Produce Market, San Francisco County
The San Francisco Wholesale Product Market is located near the intersection of Hwy 280 and Hwy
101 on land owned by the City of San Francisco. The market was built by the City when the
downtown Embarcadero location was razed to make way for the Embarcadero Center and related
buildings development in the early1960s. The 25-acre facility includes 400,000 square feet of
recently improved warehouse space and will total approximately 500,000 square feet, once the
Market’s Reinvestment Project is fully built out in the coming years. It is home to over 30 produce
businesses offering a variety of produce products. Many of these produce businesses have been in
operation for over 50 years. The Market has provided incubation space for companies that have
grown to move into their own dedicated facilities and become some of the largest distributors in
the Bay Area: Earls Organics, SF/LA Specialty Produce and Greenleaf Produce Company. The
organization itself, in 2013, became its own nonprofit and is developing & implementing a mission-
driven program that is supportive of farmers, work-force development, and food recovery.
Asset: “The Market provides affordable space for companies to start, grow and sometimes fail.”
Challenge: “Finding the resources (to secure funding for the funding gap for the approximately
$100M Reinvestment Project) to make the repairs and upgrades (Reinvestment Project) needed
for the Market to continue to provide industry positioned spaces for wholesale produce
businesses. Greater recognition of the value of these kinds of spaces.”
Bassian Farms, Santa Clara County
Bassian Farms / Pangea Packing is a family-run meat packing company established in 1990. The
company supplies grocers, food service companies and restaurants in Northern California with beef,
poultry, pork, and seafood products, which it sources from farmers and other suppliers in
California, the Midwest and internationally. It operates from a 20,000 square foot leased facility in
an industrial area of San Jose. The company has 60 employees, many of them long-term, and has
annual revenues of over $50 million. Bassian Farms prides itself on exceeding USDA meat-handling
standards and in partnering with farmers and ranchers who produce top meat quality and subscribe
to humane animal treatment, and livestock raised without the use of antibiotics or artificial growth
hormones.
22
Bassian Farms is growing at the rate of 10 to 20 percent per year, and expects to outgrow its
current facilities within the next couple of years. It is also concerned that its current location could
be converted to non-industrial uses. The company is actively seeking permanent space of around
40,000 square feet and has already set aside several million dollars toward a future move. The
company is open to being part of, investing in and helping develop a facility for multiple wholesale
food companies.
Challenge: “Finding affordable space that we can invest in and that will allow our business to stay
and continue to grow in San Jose.”
Acme Bread, Alameda, San Mateo and San Francisco Counties
Steven and Suzie Sullivan founded The Acme Bread Company in 1983 to bake bread for restaurants
and stores who wanted to offer better bread than was generally available on the wholesale market
at the time. Acme is principally a wholesale bakery with production facilities in Berkeley and in
South San Francisco from which it supplies bread to scores of restaurant and grocery store
customers around the Bay Area. It also has two retail shops, one in Berkeley and the other is in San
Francisco's Ferry Building Marketplace. The bakery offers more than a 100 different products, using
primarily organic ingredients, and supplied from local sources as much as feasible. Acme’s
environmentally friendly procedures and technology include: photovoltaic panels on the wholesale
facilities; fueling diesel trucks (and diesel generators) with “renewable diesel”; using only Certified
Organic flour in their bread; using only 40% post-consumer-waste-content paper packaging for
individual bread bags; and donating all leftover bread to charitable organizations, schools, and non-
profits, with the remainder going into organic livestock feed.
Asset: “We’re close to our production and distribution limits, making it difficult to accept new
customers. A potential new customer may need a bread that, given our capacity, we cannot make
more of at the time they need it, and we may not be in a delivery area at the time a customer
needs the bread. There are more and more good, small local artisanal bakeries opening up.”
Challenge: “It is harder to fill all shifts when unemployment is low; we look for people who are
interested in baking and willing to work the (evening and early morning) schedules.” “Congestion
pricing has actually contributed to worsening traffic conditions since peak traffic now spreads out
into the earlier and later hours when we do most of our deliveries.”
KitchenTown, San Mateo and San Francisco Counties
Located in an industrial area of San Mateo, KitchenTown offers food startups and innovators a
scale up production facility, and the opportunity to interact with a community of like-minded
peers, industry experts, and investors to help scale their businesses. The fully licensed food
production facility accommodates a wide variety of food and beverage product categories. From
packaged goods, meal kits, and fresh food concepts to plant-based and functional foods,
KitchenTown offers the necessary infrastructure for supporting the needs of food and beverage
innovation. KitchenTown also provides food entrepreneurs with expert know-how in areas from
supply chain management, to food safety, to sales and distribution. KitchenTown’s recently
opened innovation center in San Francisco has a Learning Lab which offers workshops and classes
23
for early stage companies, food policymakers, and others who want to learn more about food and
food business.
Challenge: “KitchenTown can provide space for only around 10 percent of the businesses that
apply for production space.”
SF/LA Specialty Produce, Alameda County
SF/LA Specialty Produce is a wholesale business that started in Los Angeles over thirty years ago.
About 20 years ago, the company added a Bay Area branch which was first located in the San
Francisco Wholesale Produce Market and then moved to its own 13,000 square foot facility in
Union City. In 2017, to accommodate continued growth, it is moving to a 260,000 square foot state
of the art facility in Hayward. In addition to produce, the company offers dairy, condiment, baking
and charcuterie products. The Bay Area branch buys products from small local farms as well as from
the region’s largest farmers. Selling exclusively to institutions and food service companies, it runs
over 60 routes per day. SF/LA Specialty Produce has around $500 million in annual sales.
Asset: “Our employees and company culture; and the Bay Area’s business climate.
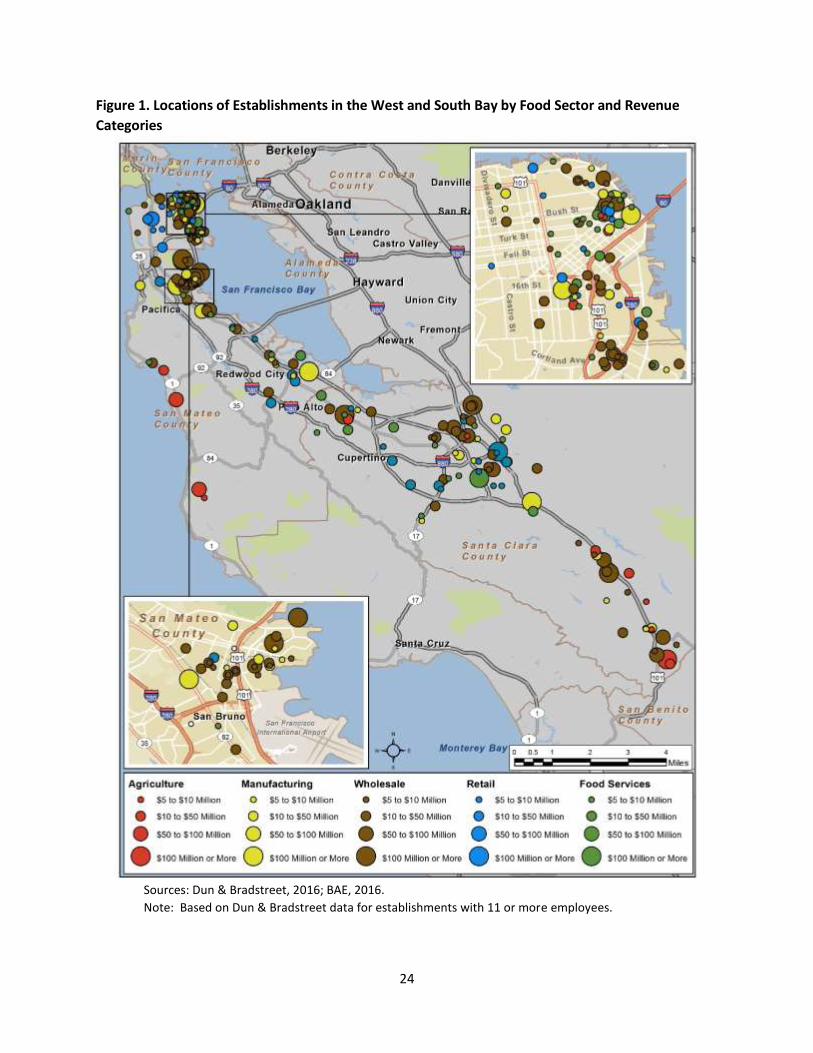
V. Geographic Distribution of Ag and Food Sector Businesses
The economic analysis in the Economic Contribution Section above shows that the highest
concentration of food sector establishments is in urban areas. The same is true for the
establishments with the largest revenues and highest number of employees. This is not
surprising, considering that grocery stores and restaurants are where urban residents get their
food every day.
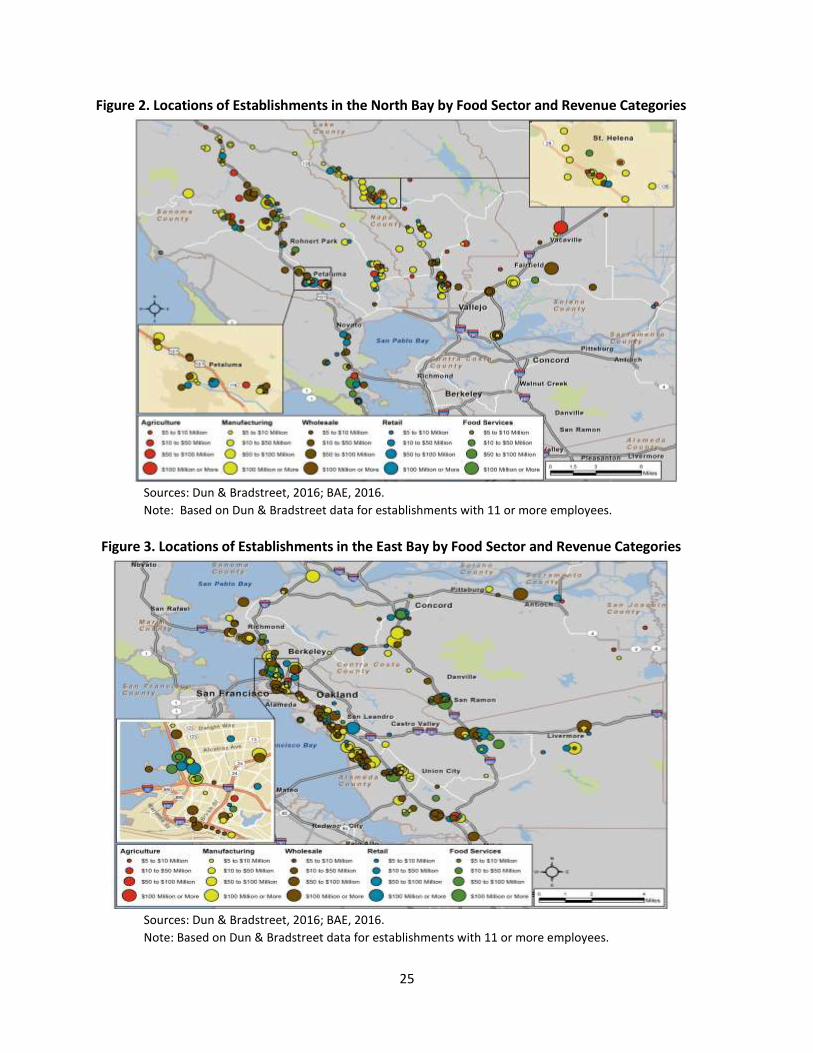
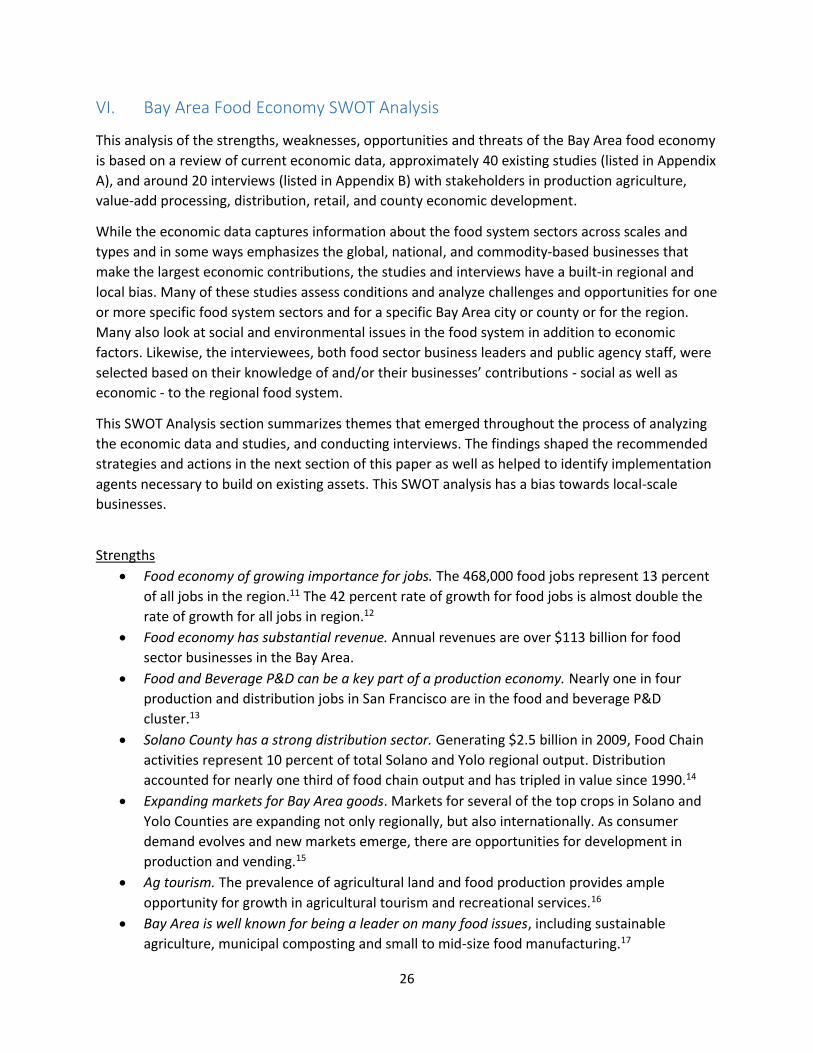
The three maps below illustrate the locations of establishments by food sector and by revenue
category. It is notable that, in addition to the concentration of establishments in urban cores (in
industrial, downtown and residential areas), there is also a considerable concentration of larger
establishments along transportation corridors. Follow-up research is needed to better
understand the relationship of the locations of food sector establishments, to industrial land
pressures, transportation pressures, jobs/housing pressures, distressed communities, and to
PCA, PDA and PPA designations.
24
Figure 1. Locations of Establishments in the West and South Bay by Food Sector and Revenue
Categories
Sources: Dun & Bradstreet, 2016; BAE, 2016.
Note: Based on Dun & Bradstreet data for establishments with 11 or more employees.
25
Figure 2. Locations of Establishments in the North Bay by Food Sector and Revenue Categories
Sources: Dun & Bradstreet, 2016; BAE, 2016.
Note: Based on Dun & Bradstreet data for establishments with 11 or more employees.
Figure 3. Locations of Establishments in the East Bay by Food Sector and Revenue Categories
Sources: Dun & Bradstreet, 2016; BAE, 2016.
Note: Based on Dun & Bradstreet data for establishments with 11 or more employees.
26
VI. Bay Area Food Economy SWOT Analysis
This analysis of the strengths, weaknesses, opportunities and threats of the Bay Area food economy
is based on a review of current economic data, approximately 40 existing studies (listed in Appendix
A), and around 20 interviews (listed in Appendix B) with stakeholders in production agriculture,
value-add processing, distribution, retail, and county economic development.
While the economic data captures information about the food system sectors across scales and
types and in some ways emphasizes the global, national, and commodity-based businesses that
make the largest economic contributions, the studies and interviews have a built-in regional and
local bias. Many of these studies assess conditions and analyze challenges and opportunities for one
or more specific food system sectors and for a specific Bay Area city or county or for the region.
Many also look at social and environmental issues in the food system in addition to economic
factors. Likewise, the interviewees, both food sector business leaders and public agency staff, were
selected based on their knowledge of and/or their businesses’ contributions - social as well as
economic - to the regional food system.
This SWOT Analysis section summarizes themes that emerged throughout the process of analyzing
the economic data and studies, and conducting interviews. The findings shaped the recommended
strategies and actions in the next section of this paper as well as helped to identify implementation
agents necessary to build on existing assets. This SWOT analysis has a bias towards local-scale
businesses.
Strengths
Food economy of growing importance for jobs. The 468,000 food jobs represent 13 percent
of all jobs in the region.11 The 42 percent rate of growth for food jobs is almost double the
rate of growth for all jobs in region.12
Food economy has substantial revenue. Annual revenues are over $113 billion for food
sector businesses in the Bay Area.
Food and Beverage P&D can be a key part of a production economy. Nearly one in four
production and distribution jobs in San Francisco are in the food and beverage P&D
cluster.13
Solano County has a strong distribution sector. Generating $2.5 billion in 2009, Food Chain
activities represent 10 percent of total Solano and Yolo regional output. Distribution
accounted for nearly one third of food chain output and has tripled in value since 1990.14
Expanding markets for Bay Area goods. Markets for several of the top crops in Solano and
Yolo Counties are expanding not only regionally, but also internationally. As consumer
demand evolves and new markets emerge, there are opportunities for development in
production and vending.15
Ag tourism. The prevalence of agricultural land and food production provides ample
opportunity for growth in agricultural tourism and recreational services.16
Bay Area is well known for being a leader on many food issues, including sustainable
agriculture, municipal composting and small to mid-size food manufacturing.17

27
Increased demand. Bay Area trends show increased demand of local food, organic
production, direct marketing, and agricultural tourism.18
Employment growth and training. Agriculture supply support, distribution, and processing
and packaging jobs in the Bay Area pay higher wages than any other region in the state.19
Career advancement. Food businesses can provide a career ladder for workers who may
have limited skills and experience, but can progress to higher skilled positions and even
business ownership. 20
Support organizations. A variety of organizations exist to assist agricultural producers and
food businesses with innovation, networking, business planning, and marketing, include UC
Cooperative Extension, resource conservation districts, open space districts, county farm
bureaus, small business development centers (SBDCs), economic development
corporations, community colleges, county agricultural commissioners, and others. These
resources have filled the role of economic development, training, and technical assistance
expertise in the agricultural and food sector.21
Remaining land base. Roughly 40 percent of the land in the Bay Area is comprised of
farmland and grazing land.22 The region has 570,000 acres of farms (40 percent of this is
irrigated prime farmland) and 1.7 million acres of ranchlands.
Provision of eco-systems services. Agriculture can be viewed as self-financing open space,
providing important ecosystem service values to Bay Area residents, including flood control,
ground water recharge, water quality, pollination, biodiversity, and open space.23
Policy support. Existing planning, policy and strategy documents for many jurisdictions
include references to the role of food and food-related activities in fostering public health,
environmental stewardship, community economic development, placemaking, resilience,
identity, culture and quality of life.
Weaknesses
Labor challenges. Labor is one of the five top five challenges identified by food and
beverage manufacturers in San Francisco. The issues are cost of labor on one hand, and
availability of skilled, low-wage workers on the other.24 One of the region’s largest food
service companies, with large operations in several counties, similarly reports that their
biggest challenge is labor, from managers and chefs to hourly employees. There is also a
shortage of skilled, low-wage labor in the agricultural and food service sectors.
Need for technical and financial assistance. There is a critical need for targeted technical
assistance for newer start-ups in food related businesses (business planning, basic
accounting, legal issues, cash flow management, bilingual general business counseling, etc.).
Investors are reticent to lend to new businesses with unconventional business models or
that do not exhibit basic business acumen.25
Transportation infrastructure. Potential for deterioration of transportation infrastructure, if
maintenance and expansion do not occur. The lack of convenient and well-kept roads,
highways, airports, ports, bridges will deter new businesses and industries from establishing
in the area.26
28
Traffic challenges. Distribution businesses are affected by the traffic pressures facing all
movement of goods in the Bay Area.
Opportunities
The food story. The food system is evolving towards delivering the “story behind the food”
and a full accounting about how food is produced, in response to growing consumer
demand.
Opportunities at all scales. The region is receptive to food supply chain businesses across all
sectors and is notable for having a wide range of businesses at scales that are economically
feasible, from owner/operator start-ups to international corporations
Agglomeration of Food and Beverage P&D firms adds value. Geographic concentrations of
interconnected food and beverage businesses, suppliers, service providers, and associated
institutions create added value for the industry.27
Growing demand for co-locating and co-packing operations. There are marketing,
equipment, labor, and other efficiencies that come with co-locating for food entrepreneurs
in operations such as brick and mortar incubator spaces; kitchens; and workforce
development programs with physical food production/manufacturing locations.28 Likewise,
co-packing facilities help enterprises to scale production and can save on start-ups costs for
equipment, rent, labor and certifications.
Institutional Purchasing Policy and Infrastructure. Large, “economies of scale” type
purchasers such as schools, hospitals and jails have the potential to greatly impact the
demand for local food. However, most are locked into low cost contracts through subsidized
government programs. Unlocking the potential with these large purchasers through
advocacy around “local purchase” targets can jumpstart investment in the entire value
chain. Focusing on aggregators who can tap local supply to meet institutional demand for all
food related products (not just produce) will provide stability for local food businesses.29
Better connecting farmers to local markets fosters increased revenue and diversified
revenue streams, e.g. through direct marketing, food hubs, institutional procurement of
local food, etc.30
Consumer demand. The research firm Mintel produces U.S. Food Service Reports that study
national industry trends in food service. In 2014, these reports suggested the biggest trends
are customer demand for speedy service; healthy and ethically sourced foods and
accommodation of dietary restrictions; incorporation of technology into the ordering,
serving, and outreach processes; and appealing to certain customer niches.31
A wide range of job opportunities. Occupations associated with these areas of business
activity represent an array of fields, levels of training, and earnings potential. In every
segment, training and requirements vary from on-the-job training to graduate degrees. For
example, in distribution, jobs range from machinists to logisticians. Additionally, with
changes in agriculture technology, there is a growing need for horticulturalists and chemical
engineers.32
A wide range of educational opportunities. The region offers a variety of vocational,
certificate and professional education and training programs that prepare for entry or
29
transition into food sector employment. In Solano County, there is a strong educational
infrastructure at each level of schooling to produce the workforce required by the county’s
expanding food sector.33 Still, educational programs need to keep pace with the evolving
skills needs of businesses and development programs to match those needs.
Better conditions and wages for farmworkers and food workers have potential to create a
more stable food sector workforce.
Threats
Competitive and expensive industrial real estate market. Food and Beverage P&D firms at all
business stages face a challenging real estate environment when seeking to start, remain, or
expand in the region’s largest cities. Industrial rents in San Francisco rose by 13 percent in
2013, and are roughly double the asking amount for equivalent spaces in Alameda and
Contra Costa Counties.34 Wholesale businesses often require 24-hour operations, large
building footprints, circulation for large trucks and access to freeways. Space for wholesale
and distribution businesses is being squeezed by low vacancy rates for industrial buildings,
demand from tech industries which can afford higher rental rates, and conversion of some
industrial zoned land to residential zoning. Vacancy rates for industrial land in San Jose are
around 1%.35
High land prices threaten agricultural viability. Farmers may see greater gains by selling
their land than by farming it. This often includes disinvestment in their farming operations –
either as a farmer, by forgoing capital improvements or investment in high-value crops, or
as a landlord, by not renewing leases to tenant farmers. As a result, the profitability of a
farm may decrease, selling the farm to a developer may become a more enticing option
than before, and speculative land purchasing by developers seeking to convert farmland to
other uses may increase.36
Urban development continues to impact farmland. In the past two decades, more than two-
thirds of the development in the Bay Area took place atop agricultural land, with losses of
the best-quality cropland outpacing the loss of lower quality cropland.37
Rural ranchette development. Agricultural Zoning (minimum lot sizes) has done little to dampen the infiltration of rural home sites and corresponding increases in agricultural land prices in the region.38
Implications for shifts in climate. In the Bay Area’s wine grape and forage production areas
(cattle ranching), climate change sensitivities will effect subtle nuances of production. In a
future with higher temperatures and altered precipitation patterns, ranchers will need to
consider management options for grazing shorter or less‐reliable seasons and for forage of
questionable nutritional content. Winegrowers will need to find ways to reduce heat stress
of their berries or face lower values for their product.39
30
VII. Key Strategies for the Agriculture and Food Sectors
The Bay Area is in a unique position to develop a regional economic development strategy for its
key clusters, including the food system sectors. Across the region, there are opportunities for city
and county policies and actions to spur economic activity all along the food value chain. As a region
of creativity and innovation, there are many other actors – food and allied businesses, advocacy
organizations, and educational and research institutions – to support pioneering business models
and approaches to food system challenges.
The region’s food sectors businesses and related business sectors are no exception to the regional
culture of innovation. They look for opportunities to add value to farm products, and they develop
technologies that add efficiencies across the supply chain and systems that meet demands of our
diverse and growing communities. This innovation is guided in part by the need to develop new
business models and operations systems that respond to labor supply issues, new regulations, and
infrastructure bottlenecks and barriers.
Advocacy organizations and their networks and educational and research institutions similarly
conduct analyses and propose solutions that address the many social and environmental challenges
of the region’s food system, including inequitable and insufficient food access, diet-related health
issues, strains on water supply, pressures on farmland from urbanization and climate change, and a
growing population.
The region has much to gain from tackling challenges and supporting opportunities with strategic
economic development and investment in the agriculture and food sectors.
The CEDS process includes key strategies and actions for its four overarching goals. The following
are proposed strategies specific to the regional food economy and are a synthesis of analyzing the
strengths, weaknesses, opportunities, and threats of the food system sectors. Each strategy and its
associated actions intend to build upon existing assets and address critical barriers to continued
economic prosperity among these sectors. The strategies are summarized in terms of the
established CEDS goals, with a set of recommended actions following each strategy.
A list of key implementation agents follows this section.
Goal 1. Business Climate
Objective 1.1. Support key clusters that drive the economy.
New Strategy. Facilitate connectivity between key clusters and between key clusters and
regional workforce, transportation, housing, workspace, and infrastructure
initiatives.
Action: Establish a regional agriculture and food economic development program
to facilitate knowledge-sharing and collaboration among cross-cutting
issues that impact agriculture and the food sector and to attract public
investment for agriculture and food sector infrastructure, land
conservation and public education.
31
New Strategy. Invest in catalytic Bay Area food and farming businesses that create and
expand market opportunities for regional agricultural and food operations.
Action: Raise private funds and leverage public investment to develop a private, nonprofit loan fund that fills that gap in the Bay Area lender landscape for debt capital to existing, start-up, and transformational food and agricultural operations (e.g. production, processing, storage, distribution, food service, and retail).
New Strategy. Recognize the important role the agriculture and food sector plays in the Bay
Area.
Action: Conduct a region-wide economic impact analysis for agricultural
production and food sector industries to demonstrate direct and indirect
economic contributions and to set a baseline for measuring progress.
Action: Develop a strategic plan and a regional roadmap for expanding
agricultural and food sector economic development opportunities that
includes regional and local priorities.
New Strategy. Support the development of business incubators for key clusters of the food
sector.
Action: Attract public and private investment and develop partnerships for incubators
that facilitate agricultural and food sector technical assistance and business
development and expansion.
Action: Develop designated agricultural enterprise areas that provide resources for a
critical mass of co-located farms, support businesses and public education
programs.
Objective 1.3. Strengthen the economic development capacity of local jurisdictions by sharing
best practices and data.
New Strategy. Promote best practices and policies that address barriers to retention and
growth of small businesses, especially those in key clusters (e.g. the food
sector).
Action: Create a regional clearinghouse to share information among jurisdictions
about existing food industry infrastructure, the needs of food businesses
and potential market opportunities, demand for certain types of facilities
(including for cannabis production and processing).
Action: Identify and analyze opportunities for agri-tourism and value-added
production and develop policies that promote these opportunities.

32
New Objective 1.4. Support value chain climate resilience to help regional industries manage
climate impacts, adopt best practices, innovate, and manage business risks and
opportunities associated with climate change.
New Strategy. Foster programs that work with businesses on addressing climate-related
risks throughout their value chains, identify where emerging market
opportunities exist, identify needed incentives, and take into account
community needs.
Action: Promote research and identify potential funding sources for technological
breakthroughs and facility design for increased efficiencies that save
businesses costs in energy and water use and treatment of wastewater and
other wastes.
Action: Promote carbon farming planning practices and seek investments that
allow agricultural operations to increase carbon sequestration and
reduce greenhouse gas emissions while improving soil health, water
holding capacity, and crop and forage production.
Action: Promote research of eco-systems services provided by farm and ranch
lands that support climate change adaptation and mitigation and
identify potential funding sources for eco-systems services payments.
Action: Analyze market opportunities and encourage best practices and incentives
for minimization of food waste.
Goal 2. Workforce
Objective 2.1. Enhance quality of K-12 education to meet the changing needs of the
population and businesses.
New Strategy. Support eco-literacy, nutrition and agricultural education programs.
Action: Identify organizations that provide training and education programs,
where eco-literacy, nutrition, and agricultural education could be
expanded with additional funding and resources.
Objective 2.2 Reform California’s higher education system to generate a globally
competitive workforce.
New Strategy. Support training and education programs to provide the workforce needed for continued success of the region’s food value chain.
Action: Identify organizations that provide training and education programs
where food value chain workforce training could be expanded with
additional funding and resources. Match business workforce needs to
those programs.
33
Objective 2.3 Support economic growth and economic mobility for low- and moderate-wage
workers of all.
New Strategy. Support career ladder approaches for jobs in the food value chain.
Action: Identify organizations and businesses that provide training and
education programs, where career ladder approaches could be expanded
with additional funding and resources.
Goal 3. Housing and Workspace
Objective 3.1. Enhance Plan Bay Area (PBA) to ensure a land use pattern with space for all
activities that contribute to the regional economy.
New Strategy. Gather information on land use issues of key cluster businesses and develop
a strategic approach to PDA, PCA and PPD designations that bolsters the
viability of these businesses.
Action: Identify PDR spaces that are suitable and affordable for agglomeration of
food manufacturing and distribution functions and identify unmet local and
regional needs for such spaces.
Action: Develop policies, facilitate private-public partnerships, and encourage
funding for supporting the development of dedicated space for co-located
food manufacturers and wholesalers.
New Strategy. Encourage the protection of the region's most productive agricultural lands
to support their economic viability.
Action: Identify priority prime farmland, funding gaps, and potential funding
sources for the permanent preservation of those lands.
Objective 3.2. Provide enough housing to meet the needs of the Bay Area’s current and
future population.
Strategy 3.2.3 Retain the existing stock of affordable housing and build additional
affordable housing.
Action: Conduct a regional farmworker housing study to identify needs,
evaluate best practices, identify funding sources, and support local
efforts for the development of safe and sufficient farm worker housing.
Objective 3.3. Ensure local regulations and permitting processes support retention and
expansion of local business and infill development.
34
Strategy 3.3.2 Develop more consistent and streamlined regulations and permitting
procedures across jurisdictions, while allowing flexibility for regional
differences and industry dynamics where appropriate.
Action: Promote best practices and policies to streamline development of on-
farm and mobile processing facilities for both livestock and crops.
Goal 4. Infrastructure
New Objective 4.6. Facilitate development and enhancement of goods movement
infrastructure, especially for key clusters.
New Strategy: Reduce barriers that impede goods movement for key clusters.
Action: Identify critical road deterioration and traffic issues that negatively impact
farming operations.
Action: Research two-way impacts of regional food goods movement and traffic
and pursue policy development to mitigate these impacts.
Action: Research best practices for food goods movement including solutions to last
mile distribution, off-peak time distribution, and adoption of green fleet and
autonomous vehicle technology, and facilitate information-sharing and
adoption.
Bay Area Food and Agriculture Sector Key Implementation Agents
Government
Association of Bay Area Governments Bay Area City and County Economic Development Departments Bay Area City and County Planning Dept’s Bay Area City and County Public Health Dept’s Bay Area County Agriculture Commissioners Bay Area County Boards of Supervisors Bay Area LAFCOs Bay Area Resource Conservation Districts California State Coastal Conservancy Napa-Sonoma Small Bus. Develop. Center Sonoma County Economic Develop. Board Santa Clara Valley Open Space Authority Sonoma County Agriculture and Open Space
Preservation District NGOs Ag Innovations
American Farmland Trust Bay Area Open Space Council Bay Area Farm Bureaus Bay Area land trusts California Climate & Agriculture Network California Farmlink Center for Ecoliteracy Changelab Solutions Committee for Green Foothills Community Alliance with Family Farmers Friends of the EarthGreenbelt Alliance Kitchen Table Advisors Natural Resources Defense Council PlaceMade Roots of Change; CA Food Policy Council SPUR Sustainable Agriculture Education (SAGE) TomKat Ranch Educational Foundation
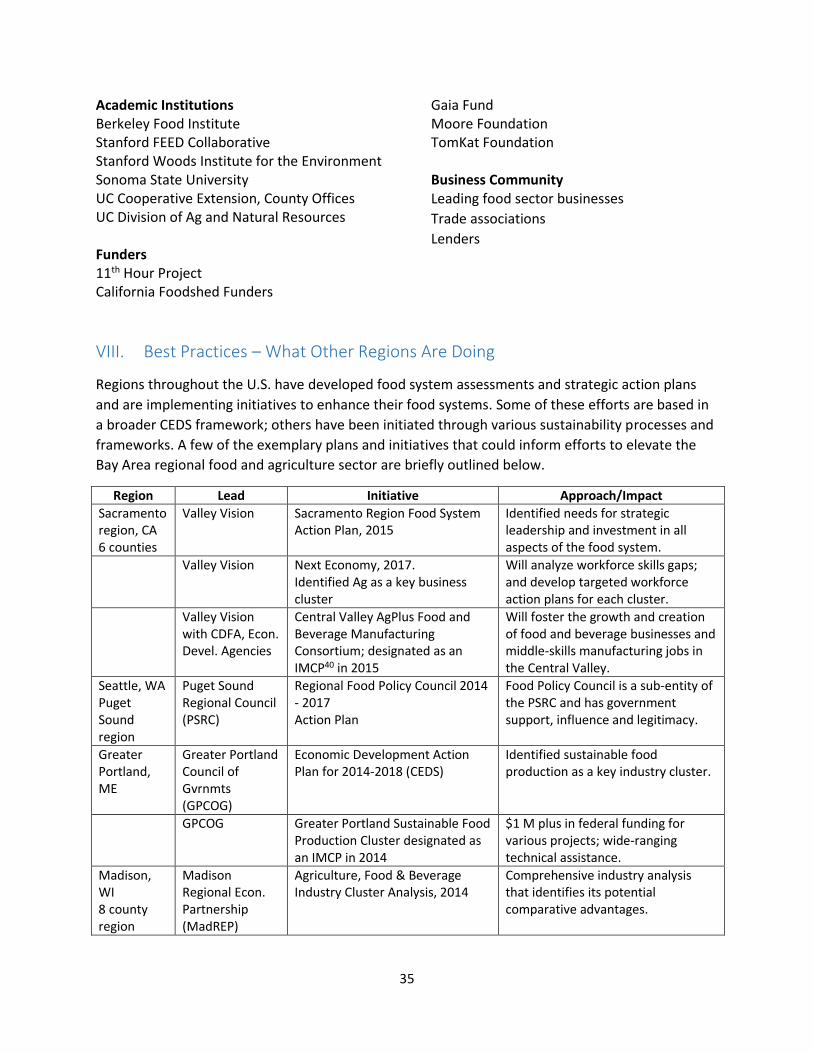
35
Academic Institutions Berkeley Food Institute Stanford FEED Collaborative Stanford Woods Institute for the Environment Sonoma State University UC Cooperative Extension, County Offices UC Division of Ag and Natural Resources Funders 11th Hour Project California Foodshed Funders
Gaia Fund Moore Foundation TomKat Foundation Business Community Leading food sector businesses
Trade associations
Lenders
VIII. Best Practices – What Other Regions Are Doing
Regions throughout the U.S. have developed food system assessments and strategic action plans
and are implementing initiatives to enhance their food systems. Some of these efforts are based in
a broader CEDS framework; others have been initiated through various sustainability processes and
frameworks. A few of the exemplary plans and initiatives that could inform efforts to elevate the
Bay Area regional food and agriculture sector are briefly outlined below.
Region Lead Initiative Approach/Impact
Sacramento region, CA 6 counties
Valley Vision Sacramento Region Food System Action Plan, 2015
Identified needs for strategic leadership and investment in all aspects of the food system.
Valley Vision Next Economy, 2017. Identified Ag as a key business cluster
Will analyze workforce skills gaps; and develop targeted workforce action plans for each cluster.
Valley Vision with CDFA, Econ. Devel. Agencies
Central Valley AgPlus Food and Beverage Manufacturing Consortium; designated as an IMCP40 in 2015
Will foster the growth and creation of food and beverage businesses and middle-skills manufacturing jobs in the Central Valley.
Seattle, WA Puget Sound region
Puget Sound Regional Council (PSRC)
Regional Food Policy Council 2014 - 2017 Action Plan
Food Policy Council is a sub-entity of the PSRC and has government support, influence and legitimacy.
Greater Portland, ME
Greater Portland Council of Gvrnmts (GPCOG)
Economic Development Action Plan for 2014-2018 (CEDS)
Identified sustainable food production as a key industry cluster.
GPCOG Greater Portland Sustainable Food Production Cluster designated as an IMCP in 2014
$1 M plus in federal funding for various projects; wide-ranging technical assistance.
Madison, WI 8 county region
Madison Regional Econ. Partnership (MadREP)
Agriculture, Food & Beverage Industry Cluster Analysis, 2014
Comprehensive industry analysis that identifies its potential comparative advantages.
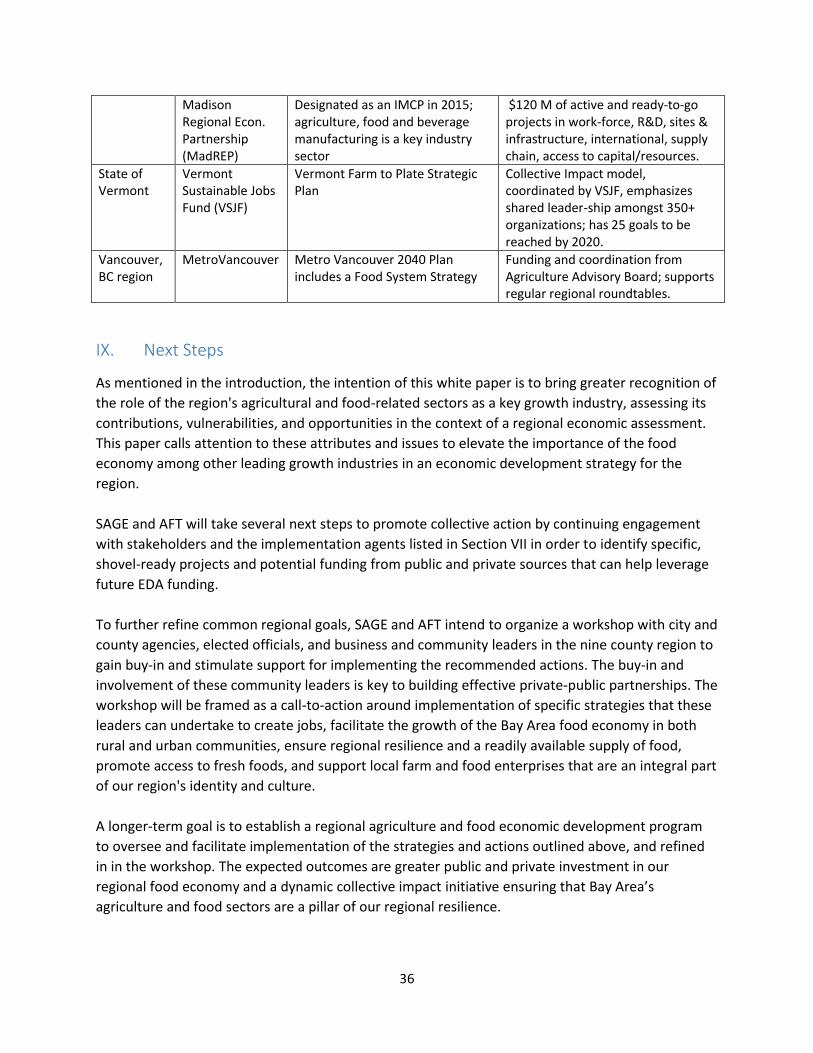
36
Madison Regional Econ. Partnership (MadREP)
Designated as an IMCP in 2015; agriculture, food and beverage manufacturing is a key industry sector
$120 M of active and ready-to-go projects in work-force, R&D, sites & infrastructure, international, supply chain, access to capital/resources.
State of Vermont
Vermont Sustainable Jobs Fund (VSJF)
Vermont Farm to Plate Strategic Plan
Collective Impact model, coordinated by VSJF, emphasizes shared leader-ship amongst 350+ organizations; has 25 goals to be reached by 2020.
Vancouver, BC region
MetroVancouver Metro Vancouver 2040 Plan includes a Food System Strategy
Funding and coordination from Agriculture Advisory Board; supports regular regional roundtables.
IX. Next Steps
As mentioned in the introduction, the intention of this white paper is to bring greater recognition of
the role of the region's agricultural and food-related sectors as a key growth industry, assessing its
contributions, vulnerabilities, and opportunities in the context of a regional economic assessment.
This paper calls attention to these attributes and issues to elevate the importance of the food
economy among other leading growth industries in an economic development strategy for the
region.
SAGE and AFT will take several next steps to promote collective action by continuing engagement
with stakeholders and the implementation agents listed in Section VII in order to identify specific,
shovel-ready projects and potential funding from public and private sources that can help leverage
future EDA funding.
To further refine common regional goals, SAGE and AFT intend to organize a workshop with city and
county agencies, elected officials, and business and community leaders in the nine county region to
gain buy-in and stimulate support for implementing the recommended actions. The buy-in and
involvement of these community leaders is key to building effective private-public partnerships. The
workshop will be framed as a call-to-action around implementation of specific strategies that these
leaders can undertake to create jobs, facilitate the growth of the Bay Area food economy in both
rural and urban communities, ensure regional resilience and a readily available supply of food,
promote access to fresh foods, and support local farm and food enterprises that are an integral part
of our region's identity and culture.
A longer-term goal is to establish a regional agriculture and food economic development program
to oversee and facilitate implementation of the strategies and actions outlined above, and refined
in in the workshop. The expected outcomes are greater public and private investment in our
regional food economy and a dynamic collective impact initiative ensuring that Bay Area’s
agriculture and food sectors are a pillar of our regional resilience.
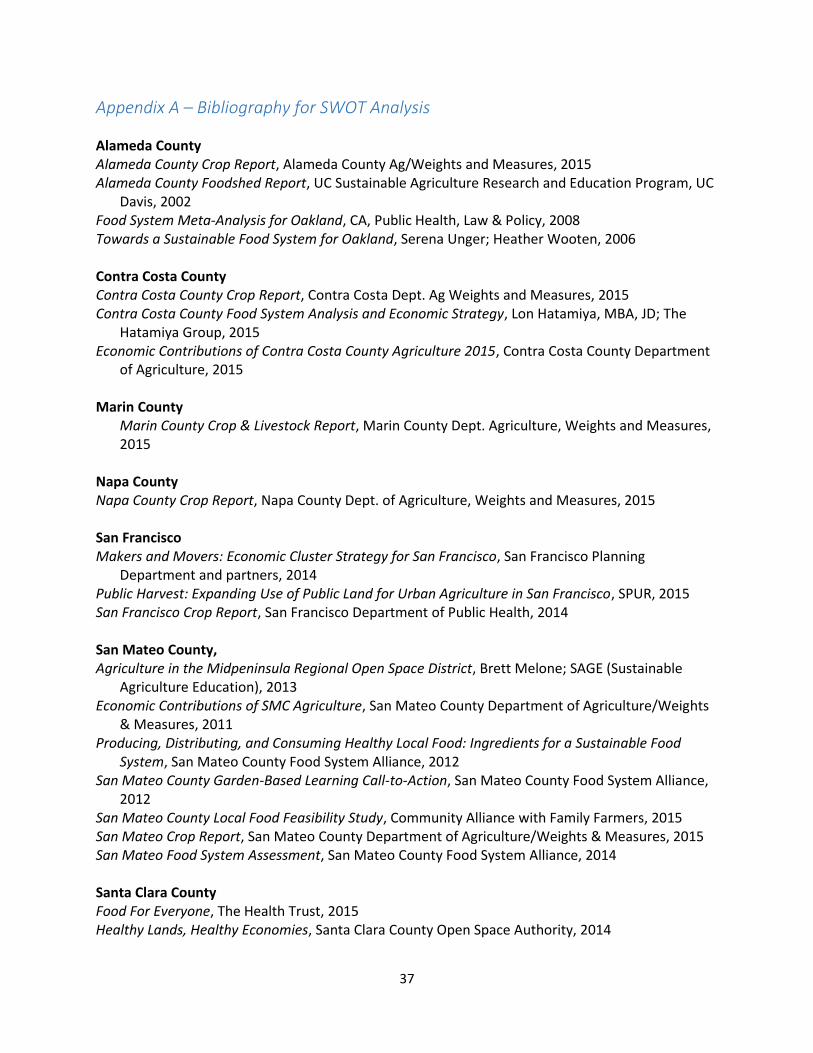
37
Appendix A – Bibliography for SWOT Analysis
Alameda County Alameda County Crop Report, Alameda County Ag/Weights and Measures, 2015 Alameda County Foodshed Report, UC Sustainable Agriculture Research and Education Program, UC
Davis, 2002 Food System Meta-Analysis for Oakland, CA, Public Health, Law & Policy, 2008 Towards a Sustainable Food System for Oakland, Serena Unger; Heather Wooten, 2006 Contra Costa County Contra Costa County Crop Report, Contra Costa Dept. Ag Weights and Measures, 2015 Contra Costa County Food System Analysis and Economic Strategy, Lon Hatamiya, MBA, JD; The
Hatamiya Group, 2015 Economic Contributions of Contra Costa County Agriculture 2015, Contra Costa County Department
of Agriculture, 2015 Marin County
Marin County Crop & Livestock Report, Marin County Dept. Agriculture, Weights and Measures, 2015
Napa County Napa County Crop Report, Napa County Dept. of Agriculture, Weights and Measures, 2015 San Francisco Makers and Movers: Economic Cluster Strategy for San Francisco, San Francisco Planning
Department and partners, 2014 Public Harvest: Expanding Use of Public Land for Urban Agriculture in San Francisco, SPUR, 2015 San Francisco Crop Report, San Francisco Department of Public Health, 2014 San Mateo County, Agriculture in the Midpeninsula Regional Open Space District, Brett Melone; SAGE (Sustainable
Agriculture Education), 2013 Economic Contributions of SMC Agriculture, San Mateo County Department of Agriculture/Weights
& Measures, 2011 Producing, Distributing, and Consuming Healthy Local Food: Ingredients for a Sustainable Food
System, San Mateo County Food System Alliance, 2012 San Mateo County Garden-Based Learning Call-to-Action, San Mateo County Food System Alliance,
2012 San Mateo County Local Food Feasibility Study, Community Alliance with Family Farmers, 2015 San Mateo Crop Report, San Mateo County Department of Agriculture/Weights & Measures, 2015 San Mateo Food System Assessment, San Mateo County Food System Alliance, 2014 Santa Clara County Food For Everyone, The Health Trust, 2015 Healthy Lands, Healthy Economies, Santa Clara County Open Space Authority, 2014
38
San Jose Food Works: Food System Conditions and Strategies for a More Vibrant, Resilient City, Sustainable Agriculture Education (SAGE), 2016
Santa Clara County Food System Assessment, Santa Clara County Food System Alliance, 2013 Santa Clara County Crop Report, Santa Clara County Department of Agriculture/Weights &
Measures, 2015 Santa Clara Valley Greenprint, Santa Clara Valley Open Space Authority, 2014 The Economic Contribution of Agriculture to the County of Santa Clara, Agricultural Commissioner's
Office, 2014 Solano County Solano County Crop Report, Solano County Dept. of Ag/ Weights and Measures, 2015 Solano-Yolo Food Cluster Study, Collaborative Economics, 2011 Sonoma County County Land for Food Production, County of Sonoma County Board of Supervisors, 2011 Sonoma County Crop Report, Sonoma County Department of Ag/Weights and Measures, 2015 Sonoma County Healthy & Sustainable Food Action Plan, County of Sonoma Department of Health
Service; Sonoma County Food System Alliance, 2012 Sonoma-Mendocino Comprehensive Economic Development Strategy (CEDS), Sonoma County,
Mendocino County, 2016 Regional Agricultural Economic Investment Strategy Feasibility Study for the San Francisco Bay Area, Applied
Development Economics; American Farmland Trust; Greenbelt Alliance; Sustainable Agriculture Education (SAGE), 2013
An Economic Development and Finance Commission, Concept Paper, American Farmland Trust, Greenbelt, 2011
Bay Area Food and Farming Fund, Market Research and Analysis, Fare Resources; Kitchen Table Advisors; Northern California Community Loan Fund, 2015
Bay Area Urban Manufacturing, SFMade Benefits of 21st Century Communications Infrastructure, Bay Area Council Economic Institute, 2014 California Agricultural Statistics Review, California Department of Food and Agriculture, 2014-2015 Climate Change and the Agricultural Sector in the San Francisco Bay Area,
California Energy Commission; University of California, Berkeley, 2012 Endangered Harvest, Greenbelt Alliance At Risk 2012, Greenbelt Alliance, 2012 Healthy Foods Within Reach, SPUR, 2014 Homegrown: Tools for Local Farms and Ranches, Greenbelt Alliance, 2015 Locally Nourished, SPUR, 2013 Regional Labor Market Assessment, Bay Area, Bay Area Center for Excellence, 2016 San Francisco Foodshed Assessment, American Farmland Trust, Sustainable Agriculture Education
(SAGE), 2008 Sustaining Our Agricultural Bounty, Greenbelt Alliance, 2011 State Agriculture Value Chain, Center for Excellence, California Community Colleges, 2011

39
California's Working Landscape, Center for Excellence, California Community Colleges, 2013 Food Manufacturing in California, Northern California Center of Excellence and the Office of
Economic Development at Cerritos College, 2010 The Economic Impact of Food and Beverage Processing in California, Richard Sexton, UC Davis, 2015
40
Appendix B – Interview Informants
Pete Aiello, Uesugi Farms, General Manager
Dan and Lee Bassian, Bassian Farms, Co-owners
Chris Charlesworth, SF Specialty Produce Company, Director
Al Courchesne, Frog Hollow Farm, Founder and Co-owner
Janet Griggs, Taste Catering, Co-owner
Michael Janis, San Francisco Wholesale Produce Market, General Manager
Al Lerma, Sonoma County Economic Development Board (SCEDB), Director of Business
Development and Innovation
David Lewis, University of California, Cooperative Extension Marin County, Director
Anni Minuzzo, Sonoma Napa Small Business Development Corporation, Specialty Food Specialist
Rusty Schwartz, KitchenTown, Co-Founder and CEO
Steve Sharp, Sonoma County Economic Development Board (SCEDB), Special Project Analyst
Steve Sullivan, Acme Bread Company, Founder and Co-Owner
Ric Tombari, Cooks Produce Company, Founder and Co-owner
Rob Twyman, Whole Foods Northern California Division, Regional President
41
End Notes
1 Bay Area Clusters White Paper, ABAG. 2 http://www.clustermapping.us/cluster 3 Note that the Dun & Bradstreet database does not include annual revenue estimates for approximately ten
percent of Bay Area food system establishments. For the purposes of this study, BAE estimated revenues for
these establishments as equal to the average annual revenues for other non-headquarters establishments in their
respective food system sub-sector located in the same county. This resulted in an approximately two percent
increase in total Bay Area food system revenues, compared to the unadjusted Dun & Bradstreet figures. 4 The Measure of California Agriculture. Agricultural Issues Center, University of California, 2009 5 Ibid 6 Profiles in Stewardship: How California Specialty Crop Growers are Producing a Better Environment, American
Farmland Trust, 2017. Website accessed on May 19, 2017: http://stewards.farmland.org/ 7 Case Studies in Community Grocery Movements, University of Virginia, 2014. Website accessed on May 19,
2017: https://pages.shanti.virginia.edu/CommFoodSystems2014/2014/02/10/case-studies-in-community-grocery-
movements/ 8 “Is the Responsible Food Trend Sustainable?” Shana Lynch, Insights by Stanford Business, August 2015. 9 Forbes Best Small Companies, 2017. Website accessed on May 19, 2017: https://www.forbes.com/companies/bi-
rite-market/ 10 “Is the Responsible Food Trend Sustainable?” Shana Lynch, Insights by Stanford Business, August 2015. 11 Dun & Bradstreet, 2017, BAE 12 QCEW, 2016, AFT 13 Movers and Makers, Economic Cluster Study. City of San Francisco, Consultants. 2014 14 The Food Chain Cluster: Integrating the Food Chain in Solano and Yolo Counties to Create Economic Opportunity and Jobs. Collaborative Economics on behalf of Solano and Yolo Board of Supervisors, 2011 15 Ibid 16 Ibid 17 Locally Nourished, How a Stronger Regional Food System Improves the Bay Area. SPUR, 2013 18 Ibid 19 Ibid 20 San Jose Food Works. SAGE, 2016 21 Sustaining Our Bounty, An Assessment of the Current State of Farming and Ranching in the San Francisco Bay Area.
American Farmland Trust, Greenbelt Alliance, Sustainable Agriculture Education (SAGE), 2011 22 American Farmland Trust, 2017 23 The Economic Contribution of Agriculture to the County of Santa Clara. Santa Clara County Agricultural
Commissioner’s Office, 2014 24 Movers and Makers, Economic Cluster Study. City of San Francisco, Consultants. 2014 25 Agricultural Economic Investment Strategy Feasibility Study for the SF Bay Area. Applied Development Economics,
commissioned by AFT, 2013 26 The Food Chain Cluster: Integrating the Food Chain in Solano and Yolo Counties to Create Economic Opportunity and
Jobs. Collaborative Economics on behalf of Solano and Yolo Board of Supervisors, 2011 27 Movers and Makers, Economic Cluster Study. City of San Francisco, Consultants. 2014 28 Bay Area Food and Farming Fund, Market Research and Analysis, Fare Resources, commissioned by NCCLF and
AFT, 2015 29 Agricultural Economic Investment Strategy Feasibility Study for the SF Bay Area. Applied Development Economics,
commissioned by AFT, 2013 30 Homegrown, Tools for Local Farms and Ranches. Greenbelt Alliance, 2015. 31 San Jose Food Works. SAGE, 2016 32 The Food Chain Cluster: Integrating the Food Chain in Solano and Yolo Counties to Create Economic Opportunity and
Jobs. Collaborative Economics on behalf of Solano and Yolo Board of Supervisors, 2011 33Ibid 34 Movers and Makers, Economic Cluster Study. City of San Francisco, Consultants. 2014 35 San Jose Food Works, SAGE, 2016 36 Locally Nourished, How a Stronger Regional Food System Improves the Bay Area. SPUR, 2013
42
37 Ibid 38 Ibid 39 Climate Change and the Agricultural Sector in the San Francisco Bay Area. Prepared for the California Energy
Commission by University of California, Berkeley, 2012 40 Investing in Manufacturing Communities Partnerships (IMCPs), a U.S. Economic Development Administration
(EDA) designation that awards grants and recognition to communities that demonstrate best practices in attracting
and expanding manufacturing. Regions awarded the designation are tasked with increasing investments in their
manufacturing ecosystem and receive the support of 11 federal agencies and preferential consideration for federal
funding opportunities ($1.3 B in 2015).