the b.e. journal of economic analysis & policyecon.ruc.edu.cn/upload/jl00051.pdf · we...
TRANSCRIPT

The B.E. Journal of EconomicAnalysis & Policy
TopicsVolume 9, Issue 1 2009 Article 38
Retail Return Policy, Endowment Effect, andConsumption Propensity: An Experimental
Study
Xianghong Wang∗
∗Renmin University of China, [email protected]
Recommended CitationXianghong Wang (2009) “Retail Return Policy, Endowment Effect, and Consumption Propensity:An Experimental Study,” The B.E. Journal of Economic Analysis & Policy: Vol. 9: Iss. 1 (Topics),Article 38.Available at: http://www.bepress.com/bejeap/vol9/iss1/art38
Copyright c©2009 The Berkeley Electronic Press. All rights reserved.

Retail Return Policy, Endowment Effect, andConsumption Propensity: An Experimental
Study∗
Xianghong Wang
Abstract
The impact of retail return policy on consumer behavior has not drawn enough attention fromresearchers. Lenient return policies insure consumers against having regret after purchasing, sothey may increase consumers’ likelihood of purchasing. The behavioral theory of endowmenteffect suggests that consumers may then have a harder time returning purchased goods becausepeople value objects more highly once they own them. We conducted a test of our hypotheses onhow return policy and endowment effect influence purchasing tendency and return rate. This ex-periment proved that endowment effect did affect the returning behavior of consumers. It showedthat lenient return policies significantly increased initial purchasing tendency but did not increasereturn rate. This suggests a potential to increase consumption by adopting lenient return policies.
KEYWORDS: retail return policy, endowment effect, consumption propensity
∗School of Economics, Renmin University of China, #59 Zhong Guan Cun Ave., Beijing, China100872. The author would like to thank the editor, two anonymous referees, as well as JackKnetsch, Talbot Page, and Stacy Wood for helpful comments and suggestions. The assistanceof Lei Huang, Xi Wang, and Dongyang Zhang in the experiment is appreciated. This study isfinancially supported by the “985” Social Sciences Innovations Project of Renmin University ofChina.

1. INTRODUCTION
This paper examines how retail return policies affect consumers’ likelihood of
purchasing goods and of returning those goods. In particular, we propose that
consumers’ likelihood of returning purchased goods may be affected by the
endowment effect, which refers to the tendency for people who own an object to
value it more highly than those who do not own it (Kahneman et al., 1991). This
implies that consumers will be reluctant to return goods once they have purchased
them. The combination of endowment effect and the signaling effect of a lenient
return policy has the potential to increase the net purchasing rate and the
consumption levels.
A lenient return policy allows consumers to return goods with money-back
guarantees. Previous studies have shown that manufacturers can use lenient return
policies to signal the quality of their products (Moorthy and Srinivasan, 1995).
Lenient return policies also allow consumers to sample the products before
deciding their preferences about them (Che, 1996). They are likely to increase
consumers’ purchasing propensity. This is because consumers are faced with
uncertainty and incomplete information at the time of purchasing.
Most of the existing research on return policy has focused on the business
side, especially on profit implications of return policies (Chang and Pao, 2007;
Pasternack, 1985). The impact of return policy on consumer behavior has not
been researched much. The studies on the signaling effect of return policy have
been mostly theoretical. The fact that retail industries in different countries
practice very different return policies makes it worthwhile to study empirically
the impact of these differences on consumer behavior and even on the economy as
a whole. It is possible that lenient return policies widely practiced in a country
contribute to higher consumptions and lower savings in that country. To provide
insight into this issue, we begin with a modest experiment with everyday
consumable goods. This serves as an exploratory study before further research can
be done along this line.
We tested our hypotheses about return policy and endowment effect with
an experiment in China. The experiment structured the return policy in three
levels: two return-guaranteed conditions with different return deadlines, and one
no-guarantee condition. This study contributes to the literature on endowment
effect, retail return policy, and consumer behavior in the following ways. First,
1
Wang: Return Policy, Endowment Effect, and Consumption Propensity
Published by The Berkeley Electronic Press, 2009

our experiment directly tested whether consumers’ tendency to purchase goods
was higher under return-guaranteed policies than under no-guarantee policy. This
provides an empirical testing of signaling effect of return policy.
Second, we tested endowment effect in varying ways. Earlier studies of
endowment effect have mostly focused on the differences between buyers’
willingness to pay and sellers’ willingness to accept immediately after the buyers
are endowed with an object. We replicated the existence of this endowment effect
with Chinese subjects in a typical setting of buyer and seller comparison. We also
put endowment effect into a real-world policy application by examining how it
affected the buyers’ tendency to return objects purchased under different return
policies. We allowed the buyers to own the object for a longer time, one day or
two weeks, before deciding on whether they wanted to return the object. This
made it possible to test endowment effect in a more realistic setting of economic
activity and to test the duration effect of ownership. Furthermore, with a novel
design for our experiment, we were able to compare the buyers’ returning
behavior under a lenient return policy to the “regret” level of the buyers who were
not given return guarantees at the time of purchase. If the buyers under these
conditions returned at similar rate, it means that those who increased purchases
under a lenient return policy were reluctant to give up their extra purchases.
Finally, our experiment showed that, due to signaling effect and
endowment effect, lenient return policies could increase the net purchasing rate of
consumers.
The rest of this paper is organized as follows. The second section reviews
the literature on return policies and the endowment effect, and derives the
hypotheses to be tested. The third section describes the experimental method and
design. The fourth section discusses the results. The fifth section concludes by
discussing the policy implications and future research.
2. BACKGROUND AND THEORY
2.1 Return Policy
The roles of return policy for consumers can be summarized as signaling and
regret avoidance. Consumers value lenient return policies that allow them to
change their minds, give them the flexibility of returning products at variable
2
The B.E. Journal of Economic Analysis & Policy, Vol. 9 [2009], Iss. 1 (Topics), Art. 38
http://www.bepress.com/bejeap/vol9/iss1/art38

times, and give them full and undisputed refunds. Since managing product returns
involves transaction costs, retailers have low incentive to provide money-back
guarantees for low-quality products1. Therefore, lenient return policies can signal
a high-quality product. Zeelenberg and Beattie (1997) also stressed that regret
expectation is important for decisions, and people are regret-minimizing rather
than risk–minimizing. Under restrictive return policies, consumers should engage
in greater deliberation (Janis and Mann, 1970) or avoid the decision altogether
(Luce et al., 1997). Therefore, lenient return policies should increase consumers’
purchasing propensity.
While retail managers may use a lenient return policy to signal the quality
of their products, they may also have concerns that a lenient return policy can
result in high returns and excess costs (Davis et al., 1998). They also worry about
possible abuse of the return policy by some consumers (Reynolds and Harris,
2008; Harris, 2008). Most research on return policy is from the business strategy
perspective. Hess and Mayhew (1997), for example, explored a method to control
returns by identifying either customers or products with high returns. Not much
has been done to examine the impact of return policy on consumer behavior.
The conflicting roles of return policy may have resulted in the wide range
of return policies in different countries. In some developed countries, like the
U.S., retailers tend to offer lenient product return policies as part of their
marketing strategy. According to Blodgett et al. (2006), retailers in the U.S. offer
the most lenient return policies compared with other countries. The “no-
questions-asked” full refund policy is common among U.S. retailers. In many
other countries, especially developing countries, returns are not normally accepted
(except under very restrictive conditions). For example, in China, the general
return policy is that products can only be returned within 7 days and only if the
products are defective. The obvious difference between these two types of
policies is that one is based on the standard of “satisfaction” and the other is based
on the standard of “quality.” For some products, consumer preferences are not
affected simply by the quality of the product. Che (1996) defined a group of
products as “experience goods” for which consumer preferences depend on their
sampling the products to gain more information about them. This means that even
1 It is assumed here that managers are not aware of the endowment effect on consumers. Research
has shown that people usually underestimate the endowment effect on others (Van Boven et al.,
2003).
3
Wang: Return Policy, Endowment Effect, and Consumption Propensity
Published by The Berkeley Electronic Press, 2009

if a product is not defective, consumers may experience preference change or
regret.
The differences between the economies of the U.S. and China in their
retail management policies, including return policies, may have had a nontrivial
impact on their consuming and saving behavior, but this has not been researched
on. Most economic studies of consumption propensity are based on traditional
theories of rational decision-making (Modigliani and Cao, 2004); they may be
limited in explaining actual consumer behavior. A survey conducted by Wang and
Wang (2008) in China suggests that restrictive return policies could reduce
consumer likelihood to purchase. Consumers in the survey rated the factors that
might influence their consumption likelihood, including some financial factors
and other factors related to shopping experience. These factors included income,
social insurance program, interest rate, retailer credibility, shopping environment
comfort, the retail return policy, and so on. Among nine factors, consumers rated
a lenient return policy as the highest in importance. Consumers in the survey
estimated that their consumption would increase by an average of 27% if a lenient
return policy had been available, ranging from 20% for durable goods to 30% for
apparels. Consumers indicated that they gave up purchasing opportunities 43% of
the time due to uncertainty. It seems that lenient retail policy can play an
important role in increasing purchasing propensity. Our experimental study will
complement the survey findings.
2.2 Endowment Effect
“Endowment effect” describes the tendency for people to value an object more
because they own it. This can reduce the number of trades in a market. For
example, in Knetsch’s (1989) experiment with mugs and chocolate bars,
undergraduate students were much more likely to keep the good they were
endowed with when they were given the opportunity to trade: 89 percent of those
originally endowed with a mug chose to keep the mug, and 90 percent of those
endowed with a chocolate bar decided to keep the chocolate bar. This has also
been tested in experiments by comparing the difference between the buyer’s
willingness-to-pay (WTP) and the seller’s willingness-to-accept (WTA)
(Kahneman et al., 1991). The endowment effect can be derived from loss
aversion, as incorporated in prospect theory (Kahneman and Tversky, 1979).
4
The B.E. Journal of Economic Analysis & Policy, Vol. 9 [2009], Iss. 1 (Topics), Art. 38
http://www.bepress.com/bejeap/vol9/iss1/art38

Some have debated that the cause of the WTP-WTA discrepancy is general loss
aversion instead of endowment effect (Brown, 2005); others have shown that
endowment effect was attenuated by the experience of traders even when their
experience was in trading different types of goods (List, 2003; List, 2004). Our
take on these debates is that endowment effect is consistent with loss aversion;2
the absence of endowment effect among experienced traders does not rule out its
impact on the general consumers.
Most of the experiments on endowment effect have examined the instant
endowment effect that is experienced immediately after an object is obtained.
Strahilevitz and Loewenstein (1998) extended the analysis to include adaptation
and duration effects. The value of gaining an object for an individual who does
not possess it is smaller than the value of not losing it for an individual who
already possesses it and has adapted to such possession. The adaptation may take
time to take effect fully. If people adapt to ownership gradually, an individual's
buy-back price for a previously owned object will increase as a function of how
long the person has owned the object. This was referred to as the “duration-of-
current-ownership-effect.” Their experiment validated such an effect by varying
endowment durations ranging from 20 minutes to 1 hour. In real situations,
ownership durations can be much longer than these treatments.
Endowment effect has implications for marketing. If consumers are
reluctant to return goods once they are purchased, then the retailers’ worry about
excess product returns under lenient return policies may be unwarranted. The
duration effect of ownership further implies that a long return period may reduce
return rate more than will a short return period.
The only behavioral study we found that examined endowment effect
under return policy was Wood’s (2001) experiment on remote purchasing. In
particular, Wood’s study tested how return policy and endowment effect
influenced consumer deliberation time for decision making: first, when they
ordered a product, and then when they received the product and decided on
whether or not to keep the order. The lenient return policy guaranteed full refund,
while restrictive return policy did not refund shipping costs for returns. The
endowment effect was facilitated by the time lag between product order and
product receipt. Wood’s main proposition was that, through reducing decision
2 Endowment effect is also consistent with status quo bias or laziness, but for the purpose of this
study, we include them all in endowment effect.
5
Wang: Return Policy, Endowment Effect, and Consumption Propensity
Published by The Berkeley Electronic Press, 2009

conflict and allowing the flexibility of return, lenient return policy would reduce
consumer deliberation time at the ordering stage. With no endowment effect,
consumers would then need to compensate this with a longer deliberation time for
decisions at the keep-or-return stage. With endowment effect, however,
consumers would fail to give sufficient deliberation to the decision to keep or
return the product because of their sense of ownership. The experiment confirmed
that lenient return policy reduced consumer deliberation time at the stage of
ordering and increased their rate to order the product, but it did not increase
consumer deliberation time at the stage for keep-or-return decisions.
The above experiment also showed that greater lenience in return policy
created higher quality expectations that remained higher than in restricted
conditions even after the subjects received the products. Subjects under a lenient
return policy were also less likely to continue product search for competing
alternatives. This evidence should reduce, if not get rid of, managers’ worries that
casual orders of products under a lenient return policy would lead to higher
returns at later stage. Wood’s experiment, however, did not formally test the
return rates in different conditions.
2.3 Hypotheses
This section explains how our study complements the existing studies on return
policy and endowment effect and outlines the hypotheses tested in our
experiment.
While Wood’s experiment provided evidence of positive effects of lenient
return policies on remote purchasing and endowment effect in consumers after
remote ordering, it failed to find similar results in their brick-and-mortar
conditions. Wood concluded that the positive effects of lenient return policies
were unique to remote vendors. We believe that this is due to the special
characteristics of food products used and the design of their experiment. Food is
easily evaluated by tasting, and consumers do not need the flexibility of returning
food products after tasting. Consumer evaluations of most other kinds of products
cannot be made as quickly as with the tasting of food. Research on this issue with
other products would be worthwhile.
The design of Wood’s experiment was to ask the subjects to make the
keep-or-return decision immediately after receipt of the product. This way, the
6
The B.E. Journal of Economic Analysis & Policy, Vol. 9 [2009], Iss. 1 (Topics), Art. 38
http://www.bepress.com/bejeap/vol9/iss1/art38

subjects in the brick-and-mortar condition did not have enough time to own the
product before making the keep-or-return decision. This does not seem to reflect
the real-world return environment where consumers usually take home purchased
goods and then make the decision to keep or return after some time. In fact, we
can also consider consumer decisions for regular store purchasing as being made
in two stages: stage one is to decide whether to purchase a good in the store; stage
two is to decide, after taking the product home, whether to return the product
before the return deadline. Our experiment consists of two sessions on different
days that reflect these two stages of decision-making by consumers.
Our study differs from Wood’s experiment in a few aspects. First, our
study is of “in-store” purchasing of everyday consumable goods when consumers
have the opportunity to examine the product in person, but not as far as tasting a
food product. Second, we provide three possible return policies: full return
guarantee with a long return deadline, full return guarantee with a short return
deadline, and no return guarantee. We consider it important to include the
condition of no return guarantee, which may better reflect the retail practices in
China. Our experiment does not include shipping costs or other costs for returning
a good. Third, we examine the effect of return policy on consumers by using
purchasing rates and return rates that were not formally tested in Wood’s
experiment. Deliberation time is probably not a complete measure of how
carefully consumers make decisions across different conditions. Decisions can be
made with varying degrees of caution within the same amount of time. Therefore,
the purchase and return decisions themselves are also important to study.
Our experiment contributes to the research on endowment effect in the
following ways. First, while most of the existing studies have been done in
Western countries, our experiment at the first stage helps to show whether the
same behavioral pattern exists with Chinese subjects in a typical setting of buyer
and seller comparison. Second, and more importantly, our two-stage experiment
puts the study of endowment effect into a real-world policy application. The
buyers at the first stage evaluate the objects under three different return policies.
This not only tests the signaling effect of return policies, but also offers the
opportunity to test whether return policy serves as a mechanism to break the
status quo of buyers and attenuate the gap between buyers’ and sellers’
valuations. After some buyer-subjects have bought the goods under different
return policies, they decide whether they want to keep or return the goods some
7
Wang: Return Policy, Endowment Effect, and Consumption Propensity
Published by The Berkeley Electronic Press, 2009

days later. This makes it possible to test endowment effect with duration of
ownership. The duration of one day or two weeks is more realistic for consumers’
return decisions than the duration offered in Strahilevitz and Loewenstein (1998).
A longer duration of ownership may adapt the consumers more to a product, thus
they will find it harder to part with a purchased product.
Based on the above analyses and the two-stage model with three policy
alternatives, we test the following hypotheses. The first two hypotheses are tested
on the first stage of the experiment when seller-subjects are endowed with an
object and buyer-subjects are not. They are both asked to evaluate the object.
Buyers’ purchasing decisions are subject to one of the three return policies.
H1: Instant endowment effect: People who are endowed with a good will
value it higher than will those who are not endowed. Therefore, buyers’
WTP is lower than sellers’ WTA.
H2: Signaling effect: Buyers’ initial valuations of the good are higher under a
lenient return policy than under a stringent return policy. Furthermore, a
long-return deadline may have a stronger signaling effect, so the initial
WTP values of buyers in the long-return treatment are higher than those
in the short-return treatment.
We call this positive effect on purchasing likelihood the “signaling effect”
even though it may include a combination of other factors such as assurance
against regret or preference reversal that can increase option values for
consumers.
The next three hypotheses are tested in the second stage of the experiment
when buyers (consumers) are asked to evaluate whether they would like to return
the purchased goods after a long or a short return period.
H3: Duration effect: Final evaluations by consumers are higher and return
rate is lower in a long-return period than in a short-return period.
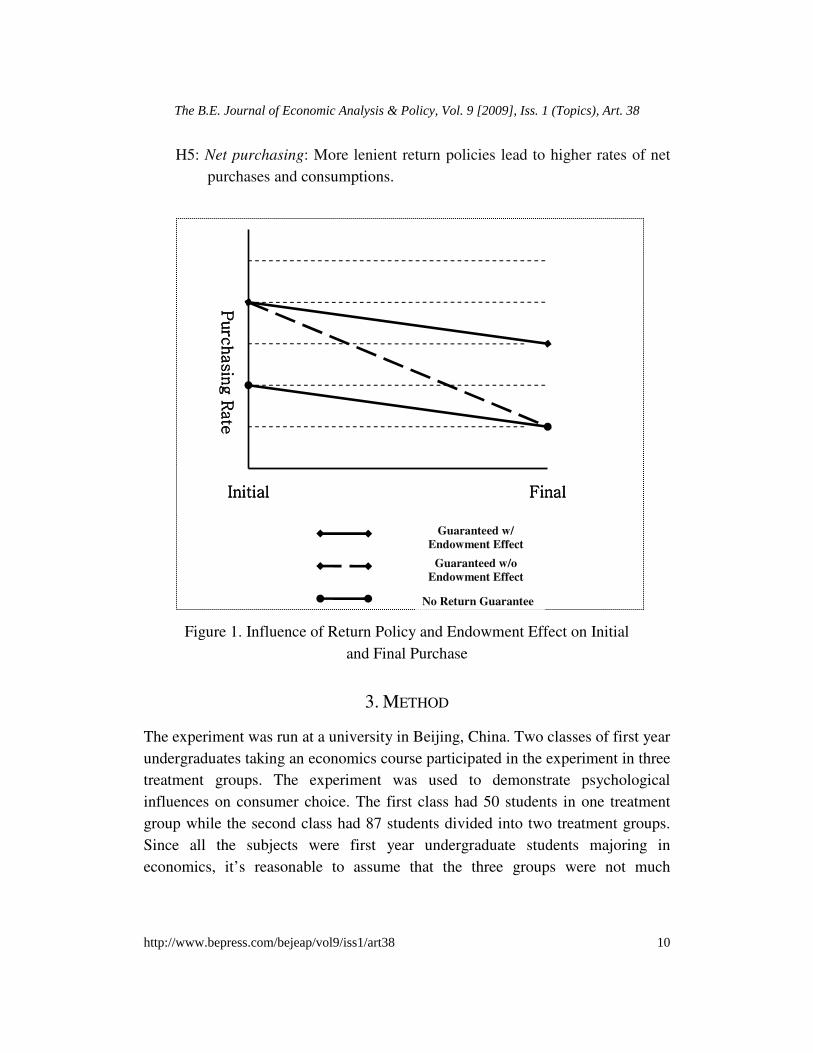
Figure 1 helps explain the rationale of our test of the endowment effect on
return behavior. The horizontal axis represents the two stages of the buyers’
decisions. The vertical axis represents purchasing rate. The bottom line in the
figure represents decisions of those buyers under no return guarantee. Their initial
8
The B.E. Journal of Economic Analysis & Policy, Vol. 9 [2009], Iss. 1 (Topics), Art. 38
http://www.bepress.com/bejeap/vol9/iss1/art38

purchasing rate is lower than those buyers under lenient return policies. After
purchasing at the first stage with incomplete information about the product, some
of them would have regret or change their preferences after experiencing the
product. If these buyers are not allowed to return the goods, they would have to
live with their “remorse”. The special design of our experiment makes it possible
to measure the likelihood of regret for these buyers. After they make initial
purchasing decisions under the no-return guarantee, we tell them later that our
return policy has changed so that they can return their purchases. Those buyers
with regret would now return their purchases at the second stage. The right end of
the line, representing final purchasing rate, is lower than the left end of the line.
The difference between the two ends of the line represents the return rate.
The top solid line and the middle dotted line in Figure 1 represent
decisions of the buyers under lenient return policy with endowment effect or
without endowment effect. Their initial purchasing rate is higher because these
buyers can inflate their valuations without costly regret. In case of no endowment
effect, represented by the middle dotted line, these buyers would return more
goods to correct their higher initial purchasing rate due to inflated initial
valuations. Assuming the buyers’ true preferences for the good (without
endowment effect) have the same distribution across condition groups, the lenient
policy group would return to the level that makes their final purchasing rate the
same as those under no return guarantee. With endowment effect, however, the
buyers will not return the extra purchases. Assuming here that the endowment
effect makes the buyers keep all extra purchases due to policy signals, they will
only return to the same level as the regret level of those under no-return
guarantee3. This will lead to a higher final purchasing rate under lenient return
policy, as represented by the top solid line. This can be seen more clearly with our
experiment design in the next section. The endowment effect discussed above can
be expressed by the following hypotheses.
H4: Endowment effect in return: The likelihood for buyers under a lenient
return policy to return purchased goods is the same as the likelihood for
buyers under a no-return policy to regret their purchase.
3 This will make the two solid lines parallel. In real life, the endowment effect is likely to make the
buyers keep some of the extra purchases but not all, so the top solid line is likely to be steeper than
the bottom solid line.
9
Wang: Return Policy, Endowment Effect, and Consumption Propensity
Published by The Berkeley Electronic Press, 2009
H5: Net purchasing: More lenient return policies lead to higher rates of net
purchases and consumptions.
Figure 1. Influence of Return Policy and Endowment Effect on Initial
and Final Purchase
3. METHOD
The experiment was run at a university in Beijing, China. Two classes of first year
undergraduates taking an economics course participated in the experiment in three
treatment groups. The experiment was used to demonstrate psychological
influences on consumer choice. The first class had 50 students in one treatment
group while the second class had 87 students divided into two treatment groups.
Since all the subjects were first year undergraduate students majoring in
economics, it’s reasonable to assume that the three groups were not much
Purc
hasin
g
Purc
hasin
g
Purc
hasin
g
Purc
hasin
g R
ate
Rate
Rate
Rate
FinalFinalFinalFinal InitialInitialInitialInitial
No Return Guarantee
Guaranteed w/o
Endowment Effect
Guaranteed w/
Endowment Effect
10
The B.E. Journal of Economic Analysis & Policy, Vol. 9 [2009], Iss. 1 (Topics), Art. 38
http://www.bepress.com/bejeap/vol9/iss1/art38

different in general consumption propensity for the small goods (highlight
markers and cups) used in our experiment.4
Each treatment group participated in two stages of the experiment on
different days, each taking place before a class lecture. The first stage resembled
the shopping stage in a store, where about one-third of the subjects (sellers) were
randomly endowed with a small good, while others (buyers) were not. The
purpose of the unequal number was to have more buyers so that we could test
return behavior. For each treatment group, we conducted the experiment with two
different goods as the endowment, first with highlight markers, and then with
cups,5 but no subjects received two goods. These two products were colorful and
were attractive to the students. Since we tried to distribute the good evenly across
the classroom, those who were not endowed with the good had the chance to
inspect it by looking at that of their neighbors. Everyone was then given a form to
fill out (see Appendix A). Those endowed with the good were asked the minimum
amount they were willing to accept (WTA) to give up their endowed good. Those
not endowed with the good were asked the maximum amount they were willing to
pay (WTP) to obtain the good, which they didn’t own.6 After the forms for the
highlight markers were collected, the second good, cups, was distributed to
another third of the subjects.
The price of the good was predetermined and sealed in an envelope. The
subjects were told that their valuations had no influence on the price, so it was in
their best interests to state their true values. If a buyer’s WTP was greater than the
price of the good, the buyer obtained the good and paid the predetermined price to
4 To make a stronger argument, it would be helpful to provide summary statistics of the subjects
such as gender, age, income, etc. We know from China’s enrollment system that the ages of
freshmen students are almost always the same. We did not have the income information, but the
enrollment of students was not expected to be dependent on their income levels. The class of 50
students met twice a week, making it possible to expose them to the short-return treatment to be
discussed later. The class of 87 met in the morning of the same day as the other class, except one
at 8:00am and the other at 10:00 am. We did not expect this to cause the students behave
differently in the experiment. Gender is likely to affect the subjects’ preferences for certain
products or the degree of endowment effect. We provide the gender distribution in our design and
analysis later on. 5 Before the experiment in these two classes, we ran a pilot experiment in another class with
highlight markers and wallet-size cardholders, to test whether the goods we chose were reasonably
desirable to the subjects. The cardholders received low evaluations, but we still found a significant
endowment effect in the pilot experiment. 6 The students were told to bring cash to class for the experiment so that they were not likely to be
budget-constrained. Also, they could get loans from the instructor if they didn’t bring cash.
11
Wang: Return Policy, Endowment Effect, and Consumption Propensity
Published by The Berkeley Electronic Press, 2009

the experimenter. If a seller’s WTA was lower than the price, the seller gave up
the good in exchange for cash. The buyer’s purchases were subject to different
return policies in each treatment. Exchanges and payments were processed with
the experimenter after forms for the second product – the cups – were collected.
This process was explained to the subjects at the beginning.7
Because the
experiment was conducted in class, the subjects did not receive a “show up fee.”
The return policy for the buyers was the main treatment variable. In the
long-return treatment, buyers were told they could return the good within two
weeks during which the class would meet twice. In the short-return treatment,
buyers were told they could return the good the next day in class. In the no-return
treatment, buyers were told at the first stage that goods purchased could not be
returned; in the next week, however, they were told that the return policy had
changed and they could return the purchased goods in the second week. The
policy change in the third treatment from no-return to could-return was important
for testing our hypotheses. The no-return part in the first stage allowed us to
examine the signaling effect of return policy. The change to could-return in the
second stage made it possible to examine the likelihood people regretted the
purchase or changed their minds when they, faced with no return guarantee in the
first stage, had supposedly made more careful decisions. This would provide a
benchmark of return rate for comparison with the return rate in the lenient return
treatments.
Even though the subjects were not restricted to class time to return
unwanted goods, it’s natural that nobody chose to make returns outside class time.
In the class, when the return deadline was up, all subjects were asked to fill out a
form that elicited their current valuation of the object, i.e., WTP for those who did
not own the goods at the moment and WTA for those who owned the goods at the
time. Those who bought a good earlier were asked whether or not they wanted to
return it. Those who returned their purchase were refunded with cash. Table 1
summarizes the experiment design. The gender distribution in each treatment
group is shown in Appendix B.8
7 To avoid the possible confusion that the trading might be between the owners and non-owners,
the instructions did not use the words “buyers” or “sellers” to describe the subjects’ roles.
Therefore, the subjects should have clearly understood that they would exchange the payments or
goods with the experimenter rather than with the other subjects. They would not have an incentive
to take a bargaining position. 8 We did not try to balance the gender distribution beforehand.
12
The B.E. Journal of Economic Analysis & Policy, Vol. 9 [2009], Iss. 1 (Topics), Art. 38
http://www.bepress.com/bejeap/vol9/iss1/art38

Table 1. Experiment Design
1. Long-Return 2. Short-Return 3. No-Return
Return Guarantee Yes Yes From No to Yes
Return Deadline Two weeks One day Two weeks
Table 2. WTP and WTA Comparison for Markers
Values in CNYa Long-Return Policy Short-Return Policy No-Return Policy Pooled
WTAb
(std. dev.)
(n)
5.41
(3.12)
(14)
5.19
(3.06 )
(15)
2.76
(1.36 )
(9)
4.69
(2.93)
(38) WTP
(std. dev.)
(n)
2.60
(1.04)
(30)
3.46
(2.49 )
(28)
1.97
(0.69 )
(22)
2.73
(1.73)
(80)
Difference 2.81 1.73 0.78 1.97
p-values for Pr > |t| 0.0053 0.0518 0.1313 0.0004
Note: When a test confirms equality of variance between variables, pooled t-test is reported.
Otherwise, Satterthwaite t-test is reported. a.
“CNY” represents the Chinese Yuan. b.A couple of
seller outliers gave valuations higher than 15 in the long-return and short return conditions. We
truncated them into 11. The same was true with cup sellers. This did not change any of our
conclusions.
4. RESULTS
4.1 Instant Endowment Effect
The first part of the experiment examined whether the endowment effect as
documented in previous literature can be replicated among Chinese subjects. The
instant endowment effect measures the differences between the buyers’ WTP and
sellers’ WTA values of an object immediately after the sellers were endowed with
that object in the first stage. Hypothesis 1 (H1) predicts that WTA values should
be higher than WTP values.
13
Wang: Return Policy, Endowment Effect, and Consumption Propensity
Published by The Berkeley Electronic Press, 2009

Table 3. WTA and WTP Comparison for Cups
Values are in
CNYa
Long-Return
Policy
Short-Return
Policy No-Return Policy Pooled
WTA
(std. dev.)
(n)
6.81
(3.11 )
(13)
4.65
(3.00)
(15)
2.78
(2.84 )
(9)
4.95
(3.32)
(37)
WTP
(std. dev.)
(n)
1.83
(1.28 )
(31)
2.16
(1.09 )
(28)
1.51
(0.78 )
(22)
1.86
(1.12)
(81)
Difference 4.98 2.49 1.27 3.10
p-values for
Pr > |t| 0.0001 0.0068 0.2213 <0.0001
Note: When a test confirms equality of variance between variables, pooled t-test is reported.
Otherwise, Satterthwaite t-test is reported. One or two extremely high WTA values in the long-
return and short-return conditions were truncated to 11. a.
“CNY” represents the Chinese Yuan.
Table 2 shows the result for the highlight markers including the mean
evaluations, the difference between sellers and buyers, and the significance level
of the difference. In all three treatments, WTA values of sellers were much higher
than WTP values of buyers. The difference between the two as shown in the
fourth row is statistically significant in the first two treatments (p<0.005 and
p<0.05) and nearly significant in the third treatment (p<0.13). The smaller
difference in the no-return treatment might be explained by the smaller sample
size in this group. When pooling together all three treatment conditions, the mean
WTA values were higher than WTP values by ¥1.966 (p<0.0004). The results are
consistent with the prediction of Hypothesis 1. The results for the cups are shown
in Table 3, which displays similar patterns for the cups as for the markers.
The above results are consistent with the findings of previous research.
The difference between the buyers’ WTP and sellers’ WTA is mainly due to the
sellers’ unwillingness to part with their endowment, rather than the buyers’
unwillingness to part with their cash (Kahneman et al., 1991). The sellers’ WTA
values in our experiment were much higher than the market prices of the goods
(about ¥2.00-3.00), while the buyers’ valuations were not that much lower than
the market prices. To examine whether there is a gender difference in endowment
14
The B.E. Journal of Economic Analysis & Policy, Vol. 9 [2009], Iss. 1 (Topics), Art. 38
http://www.bepress.com/bejeap/vol9/iss1/art38

effect, we compared female and male subjects in their valuations. We found that
there was no difference between the female and male subjects in their WTP
values for either good or their WTA values for cups, but male marker sellers’
WTA values (5.9) were much higher than female marker sellers’ WTA values
(3.5) (p<0.01). It seems that male sellers were more reluctant to part with their
endowed markers.
4.2 Signaling Effect
Hypothesis 2 (H2) predicts that a lenient return policy would increase the
subjects’ initial valuations of the objects at the first stage. Results for both
markers and cups are shown in Table 4. The second column reports the mean of
buyers’ evaluations with long-return and short-return policies pooled together:
3.02 for markers and 1.98 for cups. We pooled them together because we found
no significant difference between a long-return policy and a short-return policy,
both considered lenient return policies. The third column was the mean valuation
under no-return guarantee. The mean valuations under lenient return policies were
higher than those under no-return policy for both markers and cups (p<0.0006 and
p<0.04). This confirms the prediction of H2.
Although our main focus for the signaling effect was on the buyers, the
sellers’ WTA values were also higher under full return conditions as indicated in
Table 2 and Table 3. The mean of WTA values for the marker under full return
conditions was 5.3, compared with 2.8 under no-return condition (p<0.001).
Similarly, this difference was significant for cups (p<0.02). This might be because
we announced the return policy publicly and the lenient return policy had a
signaling impact on the sellers as well as the buyers.
15
Wang: Return Policy, Endowment Effect, and Consumption Propensity
Published by The Berkeley Electronic Press, 2009

Table 4. Return Policy and Initial Valuations
Values in CNYa Long-Return and
Short-Return
(n=58)
No-Return Policy
(n=22) Difference Pr > |t|
WTP for Markers
(std. dev.)
3.02
(1.92)
1.97
(0.69) 1.04 0.0006
WTP for Cups
(std. dev.)
1.98
(1.20)
1.51
(0.78) 0.48 0.0408
Note: a.
“CNY” represents the Chinese Yuan.
4.3 Final Evaluations and Duration Effect
At the return deadline, subjects were again asked to fill out a form and indicate
their current evaluations of the highlight markers or the cups. However, the
evaluations at this stage were not given incentive with cash payments, so we have
to keep this in mind when interpreting the results. We used two methods to study
the duration effect: first we compared final valuations between groups; second we
examined the changes of valuations over time.
Figure 2 compares the subjects’ evaluations of the markers in long-return
and short-return policy treatments. The marker buyers and sellers in Figure 2 were
the current owners who either bought the marker or were originally endowed with
the marker. It’s obvious and natural that their valuations were much higher than
those who did not buy the markers. The comparison between buyers in the two
treatments can be seen as the duration effect since they both guaranteed full
returns. Their average valuation was 3.4 in the long-return treatment and 3.1 in
the short-return treatment, but the difference was not significant (p=0.62).
16
The B.E. Journal of Economic Analysis & Policy, Vol. 9 [2009], Iss. 1 (Topics), Art. 38
http://www.bepress.com/bejeap/vol9/iss1/art38

0 0.5 1
1.5 2
2.5 3
3.5 4
4.5
Long duLong duLong duLong duration w/ration w/ration w/ration w/
rrrreturn guaranteeeturn guaranteeeturn guaranteeeturn guarantee Short duration w/Short duration w/Short duration w/Short duration w/ rrrreturn guaranteeeturn guaranteeeturn guaranteeeturn guarantee
BuyersBuyersBuyersBuyers
SellersSellersSellersSellers
NNNNonononon----buyerbuyerbuyerbuyer
Figure 2. Final Evaluation of Markers – Duration Effect
0 0.5 1
1.5 2
2.5 3
3.5 4
Long duration w/Long duration w/Long duration w/Long duration w/
return guarantee return guarantee return guarantee return guarantee
Long duration w/Long duration w/Long duration w/Long duration w/oooo
return guaranteereturn guaranteereturn guaranteereturn guarantee
BuyersBuyersBuyersBuyers
SellersSellersSellersSellers
NonNonNonNon----buyersbuyersbuyersbuyers
Figure 3. Final Evaluation for Markers – Return Policy Effect
Figure 3 compares the subjects’ final valuations of the markers under the
long-return condition and the no-return condition. Since both treatments had the
same duration of two weeks, their difference could be the result of the policy
difference. Their mean valuation was 3.3 in the no-return condition and 3.4 in the
17
Wang: Return Policy, Endowment Effect, and Consumption Propensity
Published by The Berkeley Electronic Press, 2009

long-return condition, which is not a significant difference (p=0.83). The results
for cups were similar in pattern to that of the markers.
Another way to examine the duration effect of ownership is to look at the
changes of valuations by object-owners from the first stage to the final stage. For
this purpose, the most appropriate valuations to use are from those who bought
the goods at the first stage. As shown earlier, due to instant endowment effect, the
sellers’ valuations were much inflated at the first stage. Those who bought the
goods could experience changes of valuations in two directions. On one hand,
information revealed after the purchasing of the goods might change the
preferences and lower the owners’ valuations; on the other hand, the duration
effect of ownership might increase the valuations. We found that the valuations of
those who bought the goods did not change significantly (mean change was -0.56;
p=0.17), but the valuations of those who bought cups increased nearly
significantly (mean change was 0.58; p<0.09). In contrast, buyer subjects who did
not buy the goods either reduced their valuations significantly (mean change was
-0.27 for markers; p < 0.004) or did not change their valuations (mean change was
-0.134 for cups; p=0.23).
To control for the effect of preference changes, comparing changes in
valuations between groups with different durations is more helpful in detecting
duration effect of ownership. Table 5 reports valuation changes of subjects by the
duration of their ownership for those who bought the marker or the cup. The long
duration (two-week) group included those in the long-return and no-return
conditions, while the short duration (one-day) group was from the short-return
condition. In general, valuations increased more for buyers in the long duration
group than for those in the short duration group. The difference is nearly
significant for marker buyers (p<.08), but not significant for cup buyers (p=0.26).
The above analyses of valuation changes provide some support for
Hypothesis 3 (H3) for duration effect with either the markers or the cups. A larger
sample size may strengthen the support.
18
The B.E. Journal of Economic Analysis & Policy, Vol. 9 [2009], Iss. 1 (Topics), Art. 38
http://www.bepress.com/bejeap/vol9/iss1/art38

Table 5. Change of Buyers’ Valuations
Long Duration Short Duration Difference Pr > |t| a
Marker Buyers
(n)
0.14
(21)
-1.33
(19) 1.47 0.08
Cup Buyers
(n)
0.94
(21)
-0.06
(18) 0.99 0.13
Note: a.
Satterthwaite t-test was reported since equality of variance test was rejected.
4.4 Purchasing Rate, Return Rate and Endowment Effect
We tested Hypotheses 4 (H4) and 5 (H5) by examining the subjects’ initial and
final purchases, and return rates under different policies. The test rationale is
explained by Figure 1 in Section 2.3. Returns in the no-return condition measured
the regret level from revealed information or preference changes.
Table 6 and Table 7 show the initial purchases, return rate, and net
purchases for markers and cups, respectively. As shown in the first row, the
number of initial purchases was much higher under the full-return policies than
under the no-return policy. Initial purchasing was essentially determined by
buyers’ initial evaluations of the good reported in Table 2, Table 3, and Table 4,
so we omit the comparison tests for initial purchase rates.
The second row reports the number of returns and the return rate. Since
both duration and return policy may affect a buyer’s tendency to return goods, it
makes sense to compare these three treatments separately. Hypothesis 4 predicts
that, because of endowment effect, return rate under the long-return condition is
the same as the return rate under no-return condition. After the same two-week
duration, the return rate for markers was 6.67% under the long-return policy and
33.33% under no-return policy (p=0.18); for cups, it was 8.33% under long-return
policy and 10.00% under the no-return policy (p=0.71). The return rates did not
differ significantly across the two conditions. This is consistent with Hypothesis
4. However, because the return rate was generally low, the sample size might
have been too small for a significant test for these differences. Further experiment
with a larger sample would help improve the test. The fact that subjects from the
19
Wang: Return Policy, Endowment Effect, and Consumption Propensity
Published by The Berkeley Electronic Press, 2009

no-return policy condition did return goods when they were allowed to return
proved that people did experience regret or changed their preferences even after
careful decisions. The fact that those under a full-return policy did not return
goods at a higher rate provided evidence that these subjects did not return more to
correct their inflated valuations from the initial purchasing stage. This implies the
presence of an endowment effect, and is consistent with Hypothesis 4.
Table 6. Purchases and Returns of Markers
Long-Return Policy
(n=30)
Short-Return Policy
(n=28)
No-Return Policy
(n=22)
Initial Purchase
(ratea)
16
(53.33%)
20
(71.40%)
8
(36.36%)
Number of Return
(rateb)
1
(6.67%)
3
(15.79%)
2
33.33%)
Net Purchase
(ratec)
15
(50.00%)
17
(60.71 %)
6
(27.27%)
Note: a.
The initial purchasing rate was computed by the number of buyers who bought the good
divided by the total number of buyers. b. The return rate was computed by the number of returns
divided by the number of initial purchases. Students who missed the class were not counted when
the return rate was computed, including one in the long-return condition, one in the short-return
condition, and two in the no-return condition. The return rate for the three conditions was
respectively 1/15, 3/19, and 2/6. c. The net rate was the number of final purchases divided by n, the
initial total number of buyer subjects.
In the long-return and no-return treatments, each had one subject who expressed a desire to return
the marker a week earlier but forgot to bring the marker; each had two subjects who expressed a
desire to return the cup but forgot to bring the cup.
Table 7. Purchases and Returns of Cups
Long Return Policy
(n=31)
Short Return Policy
(n=28)
No Return Policy
(n=22)
Initial Purchase
(rate)
15
(48.39%)
18
(64.29%)
10
(45.45%)
Returned
(rate)
1
(8.33%)
5
(27.78%)
1
(10%)
Net Purchase
(rate)
14
(45.16%)
13
(46.43%)
9
(40.91%)
20
The B.E. Journal of Economic Analysis & Policy, Vol. 9 [2009], Iss. 1 (Topics), Art. 38
http://www.bepress.com/bejeap/vol9/iss1/art38

Comparing the short-return and the long-return, the mean return rate was
15.79% for markers and 27.78% for cups under short-return treatment; 6.67% for
markers and 8.33% for cups under long-return treatment. The p-values for
Fisher’s exact tests of the differences between the two treatments were 0.40 for
markers and 0.20 for cups, indicating no significant differences.
The net purchasing rate in Table 6 and Table 7 represents the net result of
the policies’ signaling effect, change of preferences from acquired information,
and endowment effects on return. The results indicate that the net purchasing rate
under a full-return policy was either higher than or the same as that under a no-
return policy. For markers, the net purchasing rates of 50.00% and 60.71% in the
two full-return conditions were significantly higher than 27.27% in the no-return
condition, with p-values of 0.086 and 0.019 respectively for Fisher’s exact test.
This is consistent with Hypothesis 5. For cups, the differences were not
significant (p= 0.49 and 0.46).
5. CONCLUSION
This study examined how return policy and endowment effect affected
consumers’ purchasing and returning behavior. We proved that the positive
signaling effect of lenient return policy on purchasing likelihood found in Wood’s
remote purchasing environment is also strong in our “in-store” environment. With
our two small consumable goods in the experiment, the stakes were relatively low
and the features of products were easy to see at the initial inspection. With higher
stakes in real life or more complicated features in the goods, the quality issue can
be expected to be more important for consumers, so the signaling effect can be
even stronger.
Our experiment tested hypotheses about endowment in the setting of
returning purchased goods. We first confirmed the existence of an endowment
effect among Chinese subjects through the gap between WTA and WTP. This has
been the main focus of many existing studies on endowment effect. We focused
more on two other ways of testing. One was the duration effect of ownership. We
found weak support for the following: those who bought the cups increased their
valuations at the final stage compared with the first stage; those who bought the
markers in the long duration conditions increased their valuations more than those
in the short duration condition. More importantly, our experiment design made it
21
Wang: Return Policy, Endowment Effect, and Consumption Propensity
Published by The Berkeley Electronic Press, 2009

possible to examine whether buyers under lenient return policy, with their higher
initial purchasing rate, returned more than under no-return policy. The switch of
policy in the no-return condition allowed us to benchmark the return or “regret”
level of buyers when initial valuations were not inflated. With very low return
rates in general, we found weak support that return rate under lenient return policy
was similar to the return rate of buyers in no-return policy. One limitation of our
experiment is the relatively small sample size for analyzing return rate. The
results of the tests might be stronger with a larger sample size.
The combination of signaling effect and endowment effect resulted in
increased or similar net purchasing rate for the goods in our experiment under
lenient return policies compared with no-return policy. If the results can be
generalized, they have implications for marketing strategy of companies as well
as for public policy concerning consumer protection and aggregate consumption.
There are a few reasons why some retailers are not providing a lenient return
policy. First, retailers may underprovide lenient return policies because they have
monopoly power and fail to internalize the consumers’ benefits (Che, 1996).
Second, they may underestimate the endowment effect on consumers (Van Boven
et al., 2003). Third, retailers can reveal less information to consumers and cheat
more easily by practicing a restrictive return policy. If this is the case, then public
policy interventions that govern return policies may have the potential to increase
general consumption levels in economies like China that are characterized by
extremely high saving rate and low consumption rate.
There are several directions for future research. A field experiment in
retail industries similar to our design would help to further test our hypotheses.
The changing retail environment in China may provide such an opportunity. A
cross-country study can examine if the same degree of endowment effect is
observed among consumers in countries where different return policies have been
practiced. Are consumers less affected by the endowment effect after a long
exposure to lenient return policies? More studies should also examine the reasons
why retailers in different cultures offer different return policies for similar
products and what the consequences are for the economy.
22
The B.E. Journal of Economic Analysis & Policy, Vol. 9 [2009], Iss. 1 (Topics), Art. 38
http://www.bepress.com/bejeap/vol9/iss1/art38

APPENDIX A
INSTRUCTIONS8
For those endowed with a highlight marker in short-return treatment:
You now own the highlight marker that you can keep and take home.
You have the option of trading it for money. Please fill in the blank
below to specify the amount of money you are willing to trade for it. We
have predetermined a money amount for the cardholders. The amount is
written on a slip of paper in the envelope. When everyone has completed
the forms, the amount will be revealed. If the money amount we reveal is
higher than or equal to the amount you specify below, then you will give
up the highlight marker and we will give you the money. If the amount
we reveal is less than the amount you specify below, then you will keep
the highlight marker. All trades will take place immediately after the two
sessions of the experiment. Please note that what you specify will not
affect the amount written in the envelope. Therefore, it is in your interest
to indicate what the highlight marker is truly worth to you.
If the amount of money in the envelope is higher than or equal to
___________________, I will give up the highlight marker and take the
amount revealed in the envelope.
For those not endowed with a highlight marker in the short-return treatment:
You see we have some highlight markers you do not own now (we will
give you some other goods to own later in the second session of the
experiment). You have the option of getting it by paying money for it.
Please fill in the blank below to specify the amount of money that you
are willing to pay to get the highlight marker. We have predetermined a
money amount for the highlight markers. The amount is written on a slip
of paper in the envelope. When everyone has completed the forms, the
amount will be revealed. If the money amount we reveal is less than or
equal to the amount you specify below, you will take home the highlight
8 This was translated from Chinese.
23
Wang: Return Policy, Endowment Effect, and Consumption Propensity
Published by The Berkeley Electronic Press, 2009

marker and pay the amount of money revealed. If you do not want to
keep the highlight marker afterwards for whatever reason, you can return
it in the next class (tomorrow) and we will refund your payment. If the
amount we reveal is higher than the amount you specify below, then you
will not get the highlight marker.…Therefore, it is in your interest to
indicate what the highlight marker is truly worth to you.
If the amount of money in the envelope is less than or equal
to___________________, I will get the highlight marker and pay the
amount revealed in the envelope.
For those not endowed with a highlight marker in long-return treatment:
…If you do not want to keep the highlight marker/cup for whatever
reason, you can return it in the next two classes (within 13 days) and we
will refund your payment.
For those not endowed with a highlight marker in no-return treatment:
…Once you’ve bought the marker, you will not be able to return it.
This last restriction was actually relaxed one week after the first stage had
occurred.
24
The B.E. Journal of Economic Analysis & Policy, Vol. 9 [2009], Iss. 1 (Topics), Art. 38
http://www.bepress.com/bejeap/vol9/iss1/art38

APPENDIX B
GENDER DISTRIBUTION OF THE EXPERIMENT
1. Long-Return 2. Short-Return 3. No-Return
Female
(%)
23
(77)
15
(54)
9
(41) Marker
Buyers Male
(%)
7
(23)
13
(46)
13
(59)
Female
(%)
7
(50)
7
(47)
5
(56) Marker
Sellers Male
(%)
7
(50)
8
(53)
4
(44)
Female
(%)
20
(65)
12
(43)
11
(50) Cup
Buyers Male
(%)
11
(35)
16
(57)
11
(50)
Female
(%)
10
(77)
10
(67)
3
(33) Cup
Sellers Male
(%)
3
(23)
5
(33)
6
(67)
REFERENCES
Benartzi, Shlomo and Richard H. Thaler. (2004) “Save More Tomorrow: Using
Behavioral Economics to Increase Employee Savings,” Journal of Political
Economy, 112 (1), pp. 164-187.
Blodgett, Jeffrey, Donna Hill, Aysen Baker. (2006) “Cross-cultural Complaining
Behavior? An Alternative Explanation,” Journal of Consumer Satisfaction,
Dissatisfaction and Complaining Behavior, (1).
http://findarticles.com/p/articles/mi_qa5516/is_200601/ai_n21406177
Chang, Shu-Hui, Shih-Heng Pao. (2007) “Relative Effect of a Returns and a No-
returns Policy on the Unit Profit of Manufacturers Under Continuous
Demand Uncertainty,” International Journal of Management, 24 (2), pp. 376-
385.
Che, Yean-Koo. (1996) “Customer Return Policies for Experience Goods”, The
Journal of Industrial Economics, 44 (1) pp. 17-24.
25
Wang: Return Policy, Endowment Effect, and Consumption Propensity
Published by The Berkeley Electronic Press, 2009

Davis, Scott E., Michael Hagerty, Eitan Gerstner. (1998) “Return Policies and
Optimal Levels of Hassle,” Journal of Economics and Business, 50 (3), pp.
445-60).
Harris, Lloyd C. (2008) “Fraudulent Return Proclivity: An Empirical Analysis,”
Journal of Retailing, 84 (4) pp. 461–476.
Hess, James D., Glenn E. Mayhew. (1997) “Modeling Merchandise Returns in
Direct Marketing,” Journal of Direct Marketing, 11 (Spring), pp. 20-35.
Horioka, Charles Yuji, Junmin Wan. (2007) “The Determinants of Household
Saving in China: A Dynamic Panel Analysis of Provincial Data,” Journal of
Money, Credit and Banking, 39 (8), December, pp. 2077-2096.
Janis, Irving L., Leon Mann. (1970) Decision Making: A Psychological Analysis
of Conflict, Choice, and Commitment. New York: The Free Press.
Kahneman, D., Jack L. Knetsch, Richard H. Thaler. (1991) “Anomalies: The
Endowment Effect, Loss Aversion, and Status Quo Bias,” The Journal of
Economic Perspectives, 5 (1) Winter, pp. 193-206.
Kahneman, Daniel, Amos Tversky. (1979) “Prospect Theory: An Analysis of
Decision Under Risk,” Econometrica, (March) 47, pp. 263-291.
Knetsch, Jack L. (1989): “The Endowment Effect and Evidence of Nonreversible
Indifference Curves,” American Economic Review, 79, pp. 1277-1284.
Kuijs, Louis. (2005) “Investment and Saving in China” World Bank Policy
Research Working Paper Series 3633, June.
List, John A. (2003) “Does Market Experience Eliminate Market Anomalies?”
Quarterly Journal of Economics, 118, pp. 41-71.
List, John A. (2004) “Neoclassical Theory versus Prospect Theory: Evidence
from the Marketplace,” Econometrica, 72 (2), pp. 615-625.
Luce, Mary Frances, James R. Bettman, John W. Payne. (1997) “Choice
Processing in Emotionally Difficult Decisions,” Journal of Experimental
Psychology: Learning, Memory, and Cognition, 23 (March), pp. 384-405.
26
The B.E. Journal of Economic Analysis & Policy, Vol. 9 [2009], Iss. 1 (Topics), Art. 38
http://www.bepress.com/bejeap/vol9/iss1/art38

Modigliani, Franco, Shi Larry Cao. “The Chinese Saving Puzzle and the Life-
Cycle Hypothesis” Journal of Economic Literature, 42 (March 2004) pp.
145-170.
Moorthy, Sridhar, and Kannan Srinivasan. (1995). “Signaling Quality with
Moneyback Guarantees: The Role of Transaction Costs.” Marketing Science
14 (Fall 1995), pp. 442–466.
Pasternack, Barry A. (1985), “Optimal Pricing and Return Policies for Perishable
Commodities,” Marketing Science, 4 (2), pp. 166–176
Reynolds, Kate L., Lloyd C. Harris. (2005) “When Service Failure is not Service
Failure: An Exploration of the Types and Motives of ‘Illegitimate’ Customer
Complaining,” Journal of Services Marketing, 19 (5), pp. 321–335.
Spector, Robert, Patrick McCarthy. (2001) The Nordstrom Way: The Inside Story
of America's #1 Customer Service Company. John Wiley: New York.
Strahilevitz, Michal A., George Loewenstein. (1998) “The Effect of Ownership
History on the Valuation of Objects,” The Journal of Consumer Research, 25
(3), December, pp. 276-289.
Van Boven, Leaf, George Loewenstein, David Dunning. (2003) “Mispredicting
the endowment effect: Underestimation of owners’ selling prices by buyer’s
agents,” Journal of Economic Behavior & Organization, 51 (3), July, pp.
351-365 .
Wang, Xianghong, Xi Wang. (2008) Restrictive Return Policy Discourages
Consumptions: A Behavioral Theory and Consumer Survey, working paper,
Renmin University of China.
Wood, Stacy L. (2001) “Remote Purchase Environments: The Influence of Return
Policy Leniency on Two-Stage Decision Processes,” Journal of Marketing
Research, 38 (2) May, pp. 157-169.
Zeelenberg, Marcel, Jane Beattie. (1997) “Consequences of Regret Aversion 2:
Additional Evidence for Effects of Feedback on Decision Making,”
Organizational Behavior and Human Decision Processes, 72 (1) pp. 63-78.
27
Wang: Return Policy, Endowment Effect, and Consumption Propensity
Published by The Berkeley Electronic Press, 2009