the becher wetlands – a ramsar site || wetland sedimentologyandstratigraphy
Post on 14-Dec-2016
216 views
TRANSCRIPT

6. WETLAND SEDIMENTOLOGYAND STRATIGRAPHY
6.1 Introduction
Wetland formation and development on the Becher cuspate foreland commenced with the intersection of the topographically low basins within the beachridge swales by a rising regional groundwater table, induced by coastline progradation. These wetlands owed their origin to a combination of regional climatic patterns and other regional processes such as land progradation through beachridge and swale development, groundwater movement, and groundwater rise and fall, but, with regular waterlogging and inundation, soon began to develop site-specific wetland features and processes, such as colonisation by different plant species, and accumulation of incipient in situ sediments. Through gradual accumulation of wetland sediments, fills and stratigraphic sequences extant in the modern wetlands were produced, which exhibit characteristics that distinguish them from the surrounding beachridge landscape and soils.
The range of sediments that infill the Becher Suite wetlands, their stratigraphy, and their palaeo-sedimentology are the subjects of this chapter. In a geo-historical context the wetland sediments and stratigraphic sequences provide proxy information about the evolution and history of fill in the wetland. In a hydrological context, they act as small scale aquifers and play an important role in the hydrologic functions of wetlands. From an ecological viewpoint, they provide the foundation to understanding the soils that may determine vegetation distribution and maintenance.
Stratigraphy is concerned with the succession, form, distribution, lithologic composition, fossil content, geophysical and geochemical properties of sedimentary layers, and their interpretation, in terms of environment or mode of origin, and geologic history. Thus, stratigraphy is the foundation to reconstructing wetland origin and wetland history. Wetland basin fills provide the accretionary record of sedimentation (e.g., peat vs carbonate mud accumulation), style of fill (e.g., direct vertical accretion, cut and fill, lateral delivery to fill), rate of fill, processes of wetland deepening and shallowing, possible proxy indication of surrounding environmental conditions (e.g., vegetation assemblages, climate, hydrochemistry), and vegetation succession as determined by the occurrence of pollen.
The extant physical, chemical, and biological processes involved in sedimentation within the wetlands are referred to herein as sedimentology. In the context of the Becher Suite wetlands, these processes are those of formation (accumulation), movement (into or out of the wetland basin), alteration, and burial. Sedimentology is used as an adjunct to aid in the interpretation of stratigraphic features.
157

There are three overall objectives of this chapter:
to characterise the wetland fills in terms of sediment types and sequences; to describe the current sedimentological processes within the wetlands; and using stratigraphic sequences, sediment types, sedimentary structures, and diagenetic products, to reconstruct palaeo-environmental and palaeo-sedimentologic processes instrumental to wetland development.
The types, thickness, and stratigraphic relationships of sedimentary units are described for 20 wetlands, including sumplands and damplands, within the Becher Suite.
Terminology for wetland fills and basins is shown in Figure 5-11. The term “basal” is only applied when the layer is relatively thin with respect to the wetland fill.
6.2 Stratigraphic framework to wetland basins
The landscape that is host to the Becher Suite wetlands is the Becher cuspate foreland. Its Holocene stratigraphy is that of a simple shoaling sequence from deep water marine basin facies to beachridge and dune facies (Searle et al. 1988) (Fig. 3-4). Thissequence, or part thereof, comprising dune or humic dune sand, overlying beach sand, occurs under the ridges and inter-ridge depressions. The wetland sediments (also referred to herein as wetland fill), filling the inter-ridge depressions, are relatively shallow (D < 1 m). They overlie or are admixed with the upper parts of the littoral sediments in the inter-ridge depressions. Wetland sediments form two differentcontacts with the underlying parent sediments: a gradational contact, usually with the dune facies, and a sharper contact, usually with the beach facies.
6.3 Characterisation of wetland basin fills
In terms of physical/chemical characteristics, the wetland basin fills are described as follows:
1. occurrence of sedimentary bodies 2. geometry and thickness of sediment 3. types of sediment 4. vertical stratigraphic relationships 5. lateral stratigraphic relationships 6. small scale structures 7. granulometry8. sediment composition of grain fractions 9. biota
10. pedogenic and synsedimentary diagenetic overprints 11. age structure
158 C. A. SEMENIUK

6.3.1 Occurrence of sedimentary bodies The distribution of wetland sedimentary fill on the Becher cuspate foreland is as follows (Fig. 3-11):
• wetland sediments occur in inter-ridge depressions (or swales), but not every inter-ridge depression
• wetland deposits preferentially accumulate in the swales westward of large ridges • continuous bodies of wetland sediments form within some swales and
discontinuous bodies form within others • wetland sedimentary deposits are thickest in the older wetlands and in those
nearest the major axis of accretion of the cuspate foreland
In general, wetland deposits preferentially accumulate in the swales westward (seaward) of large ridges, e.g., wetlands WAWA, 135, 136, 142, although several examples occur either in depressions between bifurcating arms of a ridge, e.g., wetlands 161, 162, 163, or in hollows bounded by close parallel ridges of a transgressive parabolic dune or sand shadow, e.g., wetlands in swales between 135 and 72. Between the 2000 and 3000 year isochrons on the beachridge plain (Woods and Searle 1983, Searle and Woods1986, Searle et al. 1988), when the occurrence of large ridges begins to decrease, the wetland deposits accumulate westward of approximately every 7th ridge (Fig. 5-16). There is a relationship between the topographic height of the wetland fill relative to MSL, and the position of each 1000 year isochron as determined for the beach ridges. For example, older wetland sediments occur below 4 m AHD, but are restricted to <3.5 m AHD at approximately the position of the 3000 year isochron (Woods and Searle 1983, 1986). The complete listing is presented in Table 6.1 and illustrated in Figure 5-16.
Table 6.1 Height of basin floor in relation to geographic location
Location relative to beachridgeisochron
Height of basin floor above modernsea level(m) AHD
3000-4000 years BP <4 m 2000-3000 years BP <3.5 m 1000-2000 years BP <2 m
<1000 years BP <1 m
Wetland basin sediment fills may be either continuous or discontinuous along a swale. Continuous linear wetlands lie in close proximity to lines or chains of discrete wetland basins (Fig. 6-1A). Continuous linear wetlands have two types of fill: homogeneous and multiple. Basin sediment fill which is similar longitudinally, occurs in relatively flat floored linear wetlands. Multiple fills occur in continuous linear wetlands with
159WETLAND STRATIGRAPHY

Figure 6-1. Idealised diagram showing geometry of wetland fills, their distribution along the length of swales, and their nature of their homogeneity or heterogeneity.
160 C. A. SEMENIUK

undulating floors (Fig. 6-1B), where partitioning of the long basin provides scope for each sub-basin to have a slightly different stratigraphic history.
Wetland sedimentary deposits are best developed in the older wetlands and in those nearest the axis of cuspate foreland accretion. This pattern reflects and is explained by the model of wetland evolution described in the previous chapter.
Figure 6-2. The various three dimensional shapes of wetland fills.
6.3.2 Geometry and thickness of sediment The geometry of the wetland fills mirrors the morphology of the basins within the inter-ridge depression. Three types of swale morphology are host to wetlands and these produce similar suites of basins, each with similar dimensions. These are:
1. uninterrupted, relatively shallow swales encompassed by a 2000 m x 10 m x 0.3 m (L x W x D) frame;
2. small, shallow, discrete basins encompassed by the 10 m x 8 m x 0.5 m frame; and 3. well defined deeper basins encompassed by the 160 m x 25 m x 1 m frame.
The three dimensional geometry of the wetland fills is most often ribbon shaped, orientated north/south or northwest/southeast, following the swale, and with relatively steep, almost vertical east and west margins. Variations to this geometry result from undulations of the basin floor, (hence an undulation to the ribbon), and from the addition of a bench or narrow platform extending from one side of the wetland towards
161WETLAND STRATIGRAPHY

the centre, resulting in shallow irregular lenses, arcuate lenses, and circular lenses of wetland fill, all with relatively steep sides (Fig. 6-2).
The wetlands in the Becher Suite in the Cooloongup area are located in the southwestern portion of the Lake Cooloongup system, in the inter-ridge depressions formed by lateral spits. As such, the wetland fill of the Becher Suite wetlands in the Cooloongup area forms finger-like extensions from the main calcilutite mud fill of Lake Cooloongup itself (Fig. 6-2). The entire sedimentary body of Lake Cooloongup is a lens, oriented north-south, with the apex to the south. The wetland fill has a planar surface. Ingeneral, these planar bodies are mesoscale, being wider (70 m) than the wetlands on the Becher Cusp.
6.3.3 Types of sediments Sediments, which have accumulated in the wetland basins of the Becher Suite, consist of sand and mud, mixtures of which generate muddy sand. There are two end member compositional components to the mud: calcium carbonate mud and fine grained organic matter. Various admixtures of sand, calcium carbonate mud, and fine grained organicmatter, result in 7 main sedimentary types common to the study area.
These are:
1. peat2. peaty sand 3. organic matter enriched calcilutite and sandy organic matter enriched calcilutite 4. organic matter enriched calcilutaceous muddy sand 5. calcilutite6. calcilutaceous muddy sand 7. humic sand
Organic matter enriched calcilutite and sandy organic matter enriched calcilutite are aggregated in a single lithology and termed herein OME calcilutite. Descriptions of each sediment type, together with their distribution in each study wetland, are presented in Table 6.2 and Figures 6-3 to 6-23 A-E.
162 C. A. SEMENIUK

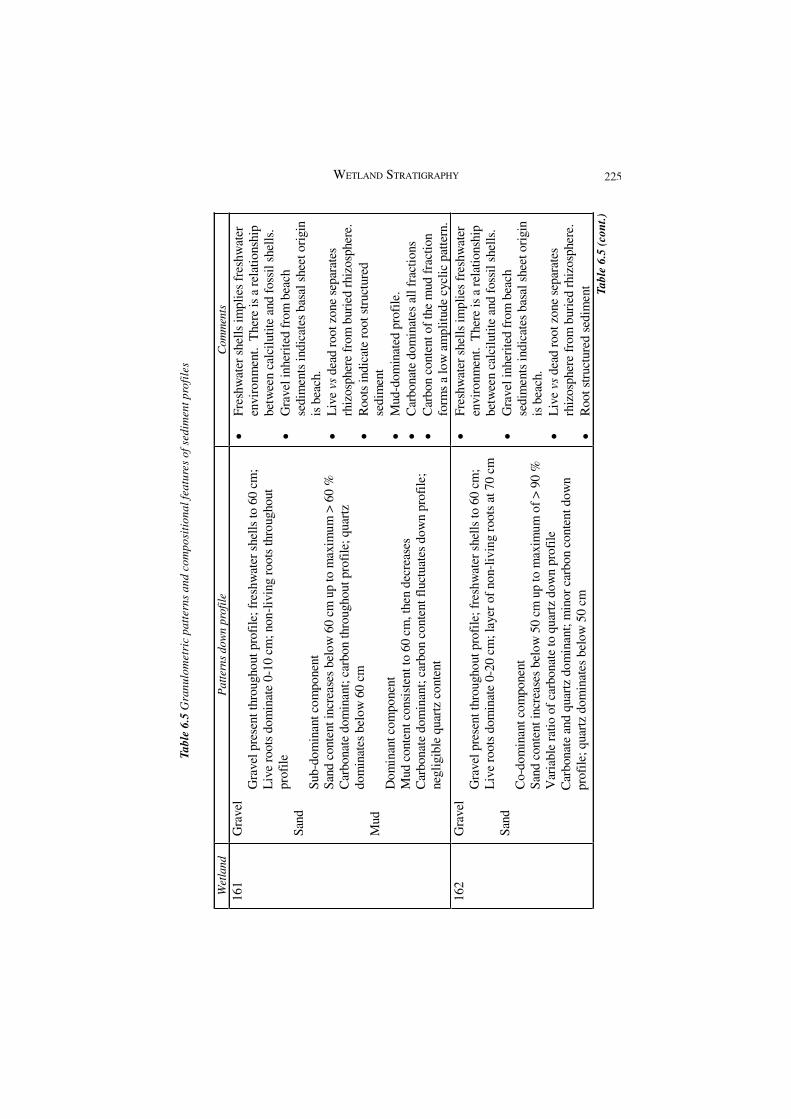
Table 6.2 Sediment descriptions
Sediment typepeat
peaty sand
OME calcilutite and sandy OMEcalcilutite
OME calcilutaceousmuddy sand
Description Site Thicknesscolour: black 161 10 cmstructure: root-structured WAWA 50 cmfabric: wackestonetexture: mud (80%), sand (11-17%), gravel (2-8%)composition: mud (peat), sand(seeds, shell, quartz)gravel (plant material andpulmonate snails - Glytophysa sp.and Gyraulus sp.)colour: black to dark greystructure: root-structured or homogeneousfabric: packstonetexture: mud, medium to fine sandcomposition: mud (peat), sand(quartz grains)colour: dark greystructure: root-structured, colourmottled, burrow mottled, texturemottledfabric: mudstone or wackestonetexture: mud, medium to fine sand,gravelcomposition: mud (calcite, organicmatter), sand (quartz), gravel(roots and pulmonate snails -Glytophysa sp. and Gyraulus sp.)
colour: dark greystructure: root structured,homogeneousfabric: packstonetexture: mud, coarse, medium, finesandcomposition: mud (calcite, organicmatter), sand (shell, quartz)
161162
WAWA13645
161163142135136724535
swiiswiii
Cool ACool C
161162
WAWA45swi
swiii
10 cm, atdepth
25-50 cm20 cm
5 cm, atdepth
60 cm40 cm20 cm15 cm10 cm20 cm50 cm30 cm10 cm20 cm5 cm 10 cm40 cm10 cm15 cm5 cm 5 cm 25 cm
Table 6.2 (cont.)
163WETLAND STRATIGRAPHY

Table 6.2 (cont.) Sediment type Description Site Thickness
calcilutite colour: light greystructure: homogeneous, colourmottled and burrow mottledfabric: mudstone to wackestone
composition: mud (calcite with
calcite), sand (shell, quartz),
Glytophysa sp. and Gyraulus sp.)
texture: mud (78-94%), sand
gravel (pulmonate snails -
(6-22%), gravel (0.2-2%)
minor aragonite and magnesian
161162135136142639
Cool A Cool B Cool C
50 cm 40 cm 30 cm 30 cm 10 cm 30 cm 75 cm
40-60 cm 100 cm
30 cm
calcilutaceousmuddy sand
colour: greystructure: homogeneousfabric: packstonetexture: mud, coarse, medium,fine sandcomposition: mud (calcite,aragonite and magnesian calcite),sand (shell, quartz)
162163142135136726345359
swiii
30 cm 20 cm 50 cm 15 cm 15 cm 30 cm 45 cm 35 cm 50 cm 25 cm 25 cm
humic sand colour: grey to blackstructure: root-structuredfabric: packstonetexture: mud, medium to finesand, gravelcomposition: mud (humus), sand(quartz grains), gravel (roots)
in all wetlands
10-25 cm
What is referred to as peat herein ranges from true peat to muck, a highly organic matter enriched sediment (Collins and Kuehl 2001). It comprises black mud sized to gravel sized particles of organic carbon and decayed plant remains (roots, seeds, leaves and stems). The development of pure peat horizons is restricted both in distribution and accumulation, commonly 10 cm thick, with the thickest accumulation of 50 cm at wetland WAWA. The peat is root structured and has 10-15% fibre content. It accumulates under the present established wetland communities of sedgelands and herblands, e.g., wetlands WAWA and 161.
The organic matter enriched calcilutite, most commonly approximates a homogeneous mixture, albeit, with varying proportions of organic matter and carbonate mud, although mottling does occur (wetlands 161, 135, Cooloongup B4). This deposit occurs in most
164 C. A. SEMENIUK

wetlands, with the exception of the northern basin of the most recent swale and the wetlands located at the tip of the Becher Cusp, and always at the surface. The layers are usually about 20 cm thick, but in wetlands 163 and 45, this sediment type dominates the stratigraphic profile.
The calcilutite deposits are thin, ranging from 20-100 cm. Calcilutite occurs in nearly all of the wetlands, with the exception of N2, swi, swii, 9-3, which are all damplands, and wetland WAWA, which is peat filled. Scanning by the electron microscope showed the grains to be predominantly skeletal, comprising remnants of charophytes, ostracods, and other undifferentiated grains.
The “muddy” sands are intermediate sediment types between sands and biogenic muds and usually form where mud accumulations are interspersed with the influx of sand from wetland basin margins, or at the basal transitional infiltrational zone where the fine-grained wetland sediment fill stratigraphically rests on the underlying basement sand. In the cases of peaty sand and calcilutaceous sand, the mud-sized components are interstitial to the grain-support sand framework. In the cases of sandy peat and sandy calcilutite, sand is dispersed in the mud-support matrix.
As described in Table 6.2, there are four types of matrix interstitial to muddy sand, the most common type being calcilutite. Within this category, more than any of the other types of muddy sand, there is a noticeable gradation from a sediment with only slight mud content to a sediment with interstices fully packed with mud. All these are termed muddy sand. Calcilutaceous muddy sands occur in both a texture mottled (wetlands 63, 72, 136, swii, swiii-4) and homogeneous structure (wetlands 9-3, 35-5).
Peaty sand occurs in a number of wetlands (161, 162, WAWA, 136, 45). It occurs as a thin horizon (10-20 cm) in three different settings: underlying the peat in the centre of the wetland, as a buried horizon at the base of the wetland fill, and at the surface of some wetland margins.
Calcilutaceous muddy sand that is organic matter enriched is both associated with and independent of similarly composed mud horizons and may be root structured or homogeneous.
The humic sands are composed of quartz and shell grains with interstitial organic matter, and occur in the vegetated swales of the beachridge plain under sedge, or Xanthorrhoea or Acacia heaths. The amount of humus in the sediment is dependent on the species composition of the vegetation cover and its density within the swale. Sediments under Xanthorrhoea preissii exhibit various development of humic horizons ranging in depth from 20-100 cm (Fig. 6-24) and organic content from 8-11% (Woods 1984).
165WETLAND STRATIGRAPHY

Figure 6-3. Description and interpretation of sedimentary stratigraphic sequences in wetland 161.
166 C. A. SEMENIUK

Figure 6-4. Description and interpretation of sedimentary stratigraphic sequences in wetland 162.
167WETLAND STRATIGRAPHY

Figure 6-5. Description and interpretation of sedimentary stratigraphic sequences
in wetland 163.
168 C. A. SEMENIUK

Figure 6-6. Description and interpretation of sedimentary stratigraphic sequences in wetland WAWA.
169WETLAND STRATIGRAPHY

Figure 6-7. Description and interpretation of sedimentary stratigraphic sequences
in wetland 142.
170 C. A. SEMENIUK

Figure 6-8. Description and interpretation of sedimentary stratigraphic sequences
in wetland 135.
171WETLAND STRATIGRAPHY

Figure 6-9. Description and interpretation of sedimentary stratigraphic sequences in wetland 136.
172 C. A. SEMENIUK

Figure 6-10. Description and interpretation of sedimentary stratigraphic sequences in wetland 72.
173WETLAND STRATIGRAPHY

Figure 6-11. Description and interpretation of sedimentary stratigraphic sequences in wetland 63.
174 C. A. SEMENIUK

Figure 6-12. Description and interpretation of sedimentary stratigraphic sequences
in wetland 45.
175WETLAND STRATIGRAPHY

Figure 6-13. Description and interpretation of sedimentary stratigraphic sequences in wetland 35.
176 C. A. SEMENIUK

Figure 6-14. Description and interpretation of sedimentary stratigraphic sequences in wetland 9-3.
177WETLAND STRATIGRAPHY

Figure 6-15. Description and interpretation of sedimentary stratigraphic sequences in wetland 9-6.
178 C. A. SEMENIUK

Figure 6-16. Description and interpretation of sedimentary stratigraphic sequences
in wetland 9-10.
179WETLAND STRATIGRAPHY

Figure 6-17. Description and interpretation of sedimentary stratigraphic sequences in wetland swi.
180 C. A. SEMENIUK

Figure 6-18. Description and interpretation of sedimentary stratigraphic sequences in wetland swii.
181WETLAND STRATIGRAPHY

Figure 6-19. Description and interpretation of sedimentary stratigraphic sequences
in wetland swiii.
182 C. A. SEMENIUK

Figure 6-20. Description and interpretation of sedimentary stratigraphic sequences in wetland 1N.
183WETLAND STRATIGRAPHY

Figure 6-21. Description and interpretation of sedimentary stratigraphic sequences in wetland Cooloongup A.
184 C. A. SEMENIUK

Figure 6-22. Description and interpretation of sedimentary stratigraphic sequences in wetland Cooloongup B.
185WETLAND STRATIGRAPHY

Figure 6-23. Description and interpretation of sedimentary stratigraphic sequences in wetland Cooloongup C.
186 C. A. SEMENIUK

Figure 6-24. Sediments, structures and textures in a vegetated swale colonised by grass trees (Xanthorrhoea preissii).
187WETLAND STRATIGRAPHY

6.3.4 Typical vertical stratigraphic sequences As noted previously, the general sequence filling the wetland basins (incorporating the mud and muddy sand) has been categorised as wetland fill. The bottom layer of the fill is herein termed the basal sheet and the underlying sediments, the basement sands.
Wetland fills can be categorised into three common stratigraphic sequences (Fig. 6-25). The contact between the various sediments is commonly gradational, but locally irregular due to vertical burrows. The contact between the OME calcilutite and the underlying calcilutite in Sequence 1 is fairly sharp. Muddy sand usually forms the basal sheet, however, this term can only be applied when the layer is relatively thin with respect to the wetland fill. If the layer becomes thicker because of continual sand input through sedimentation, then it forms a wetland filling sediment in its own right. Thus, there are thin basal sheets with overlying calcilutite, thick basal sheets with overlying calcilutite, and thick muddy sand.
Transverse profiles of each study wetland, generally west to east, are illustrated in Figures 6-26 to 6-43A showing the cross-section geometry of the wetland fill, the variation of sediment types, their vertical and lateral stratigraphic relationships, and the relationship to the underlying host parent material.
6.3.5 Lateral stratigraphic relationships Lateral stratigraphic relationships in these wetland fills are important because 1) theyshed light on the evolution of the wetland basin, and 2) they feature in the hydrologic exchange between wetland and upland. Lateral stratigraphic relationships between wetland fills and beachridge/dunes are of four types: vertical and sharp; vertical and gradational; onlapping; and interfingering (Figs. 6-26 to 6-43A). These lateral relationships are variably distributed in the area, and can differ on either side of the wetland.
Vertical sharp contacts occur as a consequence of the downward continuation of the steep vertical sides to the basin. For instance, on the western margin of wetlands 35 and 161, the wetland muds abut the sands of the beachridge/dune sediments in a sharp, cliff like contact (Figs. 6-26, 6-36 A). A second type of cliffed margin also occurs, where the sediment contact between beachridge and wetland sediments is steep and gradational. Here, there are 1-2 metres of calcilutaceous muddy medium sand forming a transitional contact between medium sand and calcilutite e.g., wetlands 162, 136, 9-5, and swiii (Figs. 6-27, 32, 38, 42 A). Onlapping relationships occur on both the eastern and western margin of some wetlands, where wetland sediments have been onlapped by dune sand e.g., wetlands 161, 163, WAWA, 135, 142, 72 (Figs. 6-26, 28, 29, 30, 31, 33 A). In wetlands swi, and swiii, these dune sands have partially encroached into the wetland, either mixing with autochthonous sediments or becoming subject to wetland processes. Interfingering of wetland and beachridge sediments occurs on the eastern margin of some wetlands, e.g., 161 and 163 (Figs. 6-26, 28 A).
C. A. SEMENIUK

Fig
ure
6-25
. The
thre
e co
mm
on s
eque
nces
in w
etla
nd fi
lls.
189WETLAND STRATIGRAPHY

6.3.6 Small scale structures within the sediments Small scale structures in the wetland sediments include in order of abundance: root structures, burrows, mottling, layering, fenestrae structures and brecciation. Theseare illustrated in Figures 6-3 to 6-23 B, C, D.
Most of the surface sediments are root structured, containing living and dead woody and non-woody roots. Although root structuring predominantly occurs in the top 10 cm of profiles, three other distributions were present. In some profiles, under shrub and tree species of Melaleuca e.g., wetlands 135, 136, 35 (Figs. 6-8, 9, 13 C, D), a second layer of root structuring occurs at approximately 35-40 cm depth. Somesediments, under grass tree (X. preissii) assemblages (Fig. 6-24), exhibit a high density of root structures from the surface to a depth of 50-60 cm. In some cores, relic roots were present in buried swale soil horizons [Figs. 6-3 to 6-6, 12, 15 C, D; wetlands 161 (110-120), 162 (60-70 cm), 163 (55-60 cm), WAWA (90-105 cm), 45 (51-55 cm), 9-6 (26-30cm)]. A more detailed description of root structures of the main wetland plant species is presented in Chapter 10.
There are a variety of sediment filled burrows within the sedimentary sequence (Fig. 6-14D). These are often small scale (1-2 cm diameter), however, there are larger burrow fills (Figs. 6-11, 18 D). The burrow fills contain mud in a muddy sand matrix or muddy sand in a sand or mud matrix. The burrows vary in orientation from vertical to horizontal (Figs. 6-5, 8, 10, 18 D).
Wetland sediments also exhibit undetermined texture and colour mottling (Figs. 6-9, 11, 15, 20 D), i.e., the mottling is not a recognisable burrow shape and does not occur in association with decaying root material.
Layering occurs in the sedimentary sequences and within individual beds but it is not a pronounced feature. Interlayering of sediment types produces primary layering at the stratigraphic scale within the sequence itself. Layering/lamination, usually <1 cmthick, is also evident within specific sediments due to colour, texture and compositional differentiation. Examples of white, cream and light brown colour differentiation occur in the calcilutite (Fig. 6-3C). Examples of texture differentiation between muddy sand and sandy mud occur in the intermediate horizons (Fig. 6-3D). Shell gravel layers occur within the calcilutite (Fig. 6-4D).
Fine laminoid fenestrae occur in cemented muddy sand of Cooloongup A2. These are fine scale horizontal thin partings in the cemented zone.
In several cores which contained calcilutite or calcilutaceous muddy sand (wetlands 142, 135, 35, swii), the surface layer (0-10 cm) exhibited a breccioid structure. InCooloongup A2, this feature also occurred at a depth of 60 cm (Fig. 6-21D).
190 C. A. SEMENIUK
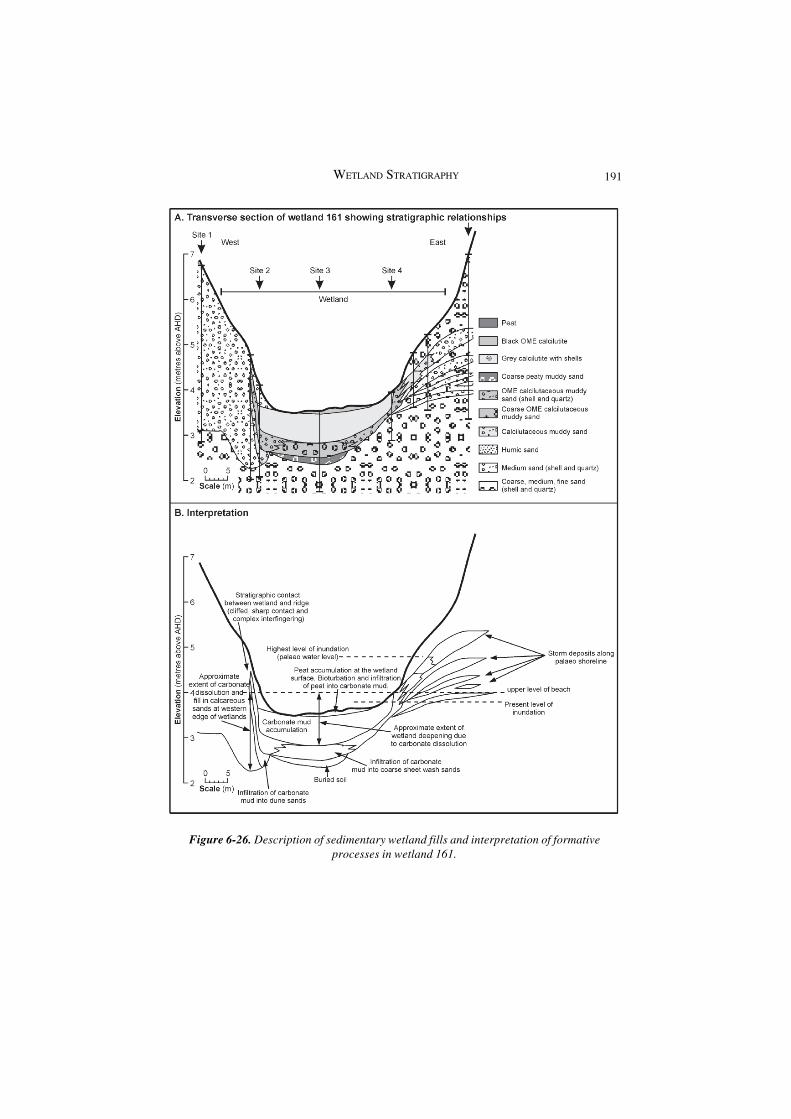
Figure 6-26. Description of sedimentary wetland fills and interpretation of formative processes in wetland 161.
191WETLAND STRATIGRAPHY

Figure 6-27. Description of sedimentary wetland fills and interpretation of formative processes in wetland 162.
192 C. A. SEMENIUK
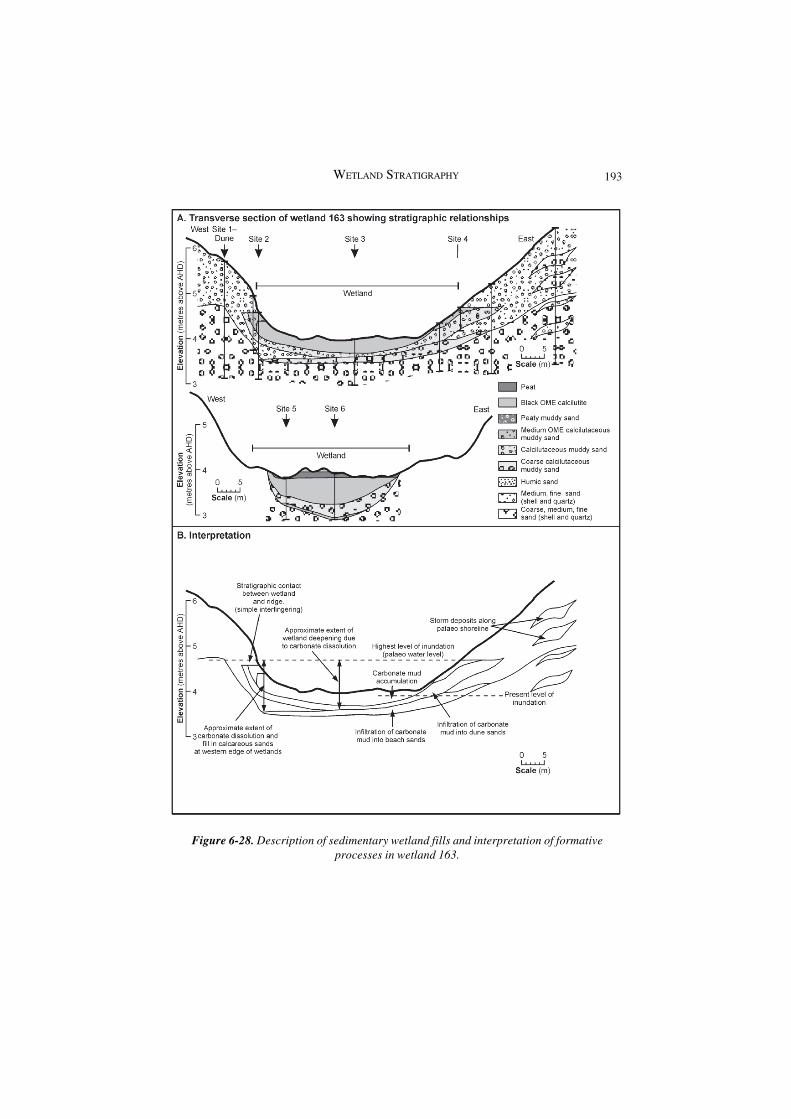
Figure 6-28. Description of sedimentary wetland fills and interpretation of formative processes in wetland 163.
193WETLAND STRATIGRAPHY

Figure 6-29. Description of sedimentary wetland fills and interpretation of formative processes in wetland WAWA.
194 C. A. SEMENIUK

Figure 6-30. Description of sedimentary wetland fills and interpretation of formative processes in wetland 142.
195WETLAND STRATIGRAPHY

Figure 6-31. Description of sedimentary wetland fills and interpretation of formative processes in wetland 135.
196 C. A. SEMENIUK

Figure 6-32. Description of sedimentary wetland fills and interpretation of formative processes in wetland 136.
197WETLAND STRATIGRAPHY

Figure 6-33. Description of sedimentary wetland fills and interpretation of formative processes in wetland 72.
198 C. A. SEMENIUK

Figure 6-34. Description of sedimentary wetland fills and interpretation of formative processes in wetland 63.
199WETLAND STRATIGRAPHY

Figure 6-35. Description of sedimentary wetland fills and interpretation of formative processes in wetland 45.
200 C. A. SEMENIUK

Figure 6-36. Description of sedimentary wetland fills and interpretation of formative processes in wetland 35.
201WETLAND STRATIGRAPHY

Figure 6-37. Description of sedimentary wetland fills and interpretation of formative processes in wetland 9-3.
202 C. A. SEMENIUK

Figure 6-38. Description of sedimentary wetland fills and interpretation of formative processes in wetland 9-6.
203WETLAND STRATIGRAPHY

Figure 6-39. Description of sedimentary wetland fills and interpretation of formative processes in wetland 9-10.
204 C. A. SEMENIUK

Figure 6-40. Description of sedimentary wetland fills and interpretation of formative processes in wetland swi.
205WETLAND STRATIGRAPHY

Figure 6-41. Description of sedimentary wetland fills and interpretation of formative processes in wetland swii.
206 C. A. SEMENIUK
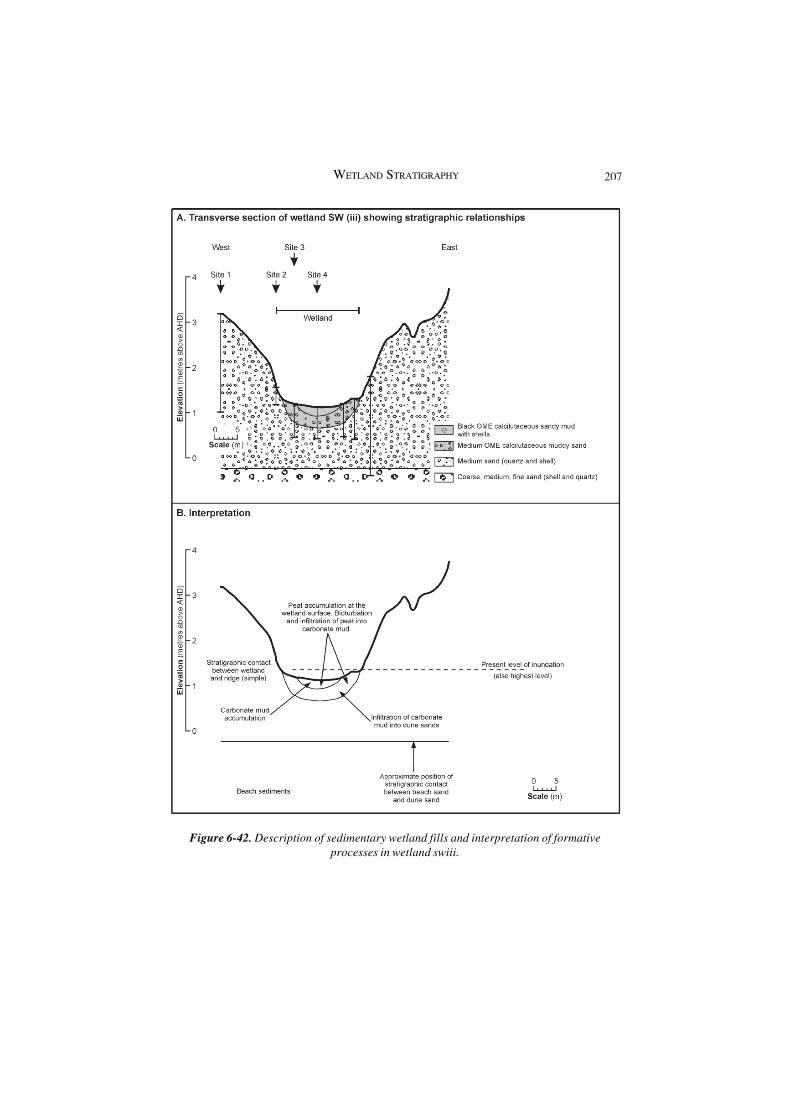
Figure 6-42. Description of sedimentary wetland fills and interpretation of formative processes in wetland swiii.
207WETLAND STRATIGRAPHY

Figure 6-43. Description of sedimentary wetland fills and interpretation of formative processes in wetland 1N.
208 C. A. SEMENIUK

The breccioid structure is due to the formation of gravel size platy clasts from the calcilutite which are arranged in random orientations.
6.3.7 Granulometry Granulometric separation of sediments down profile into major textural components of gravel, sand, and mud, was undertaken to characterise the sediment types (Figs. 6-44 to 6-56 A). The >2000 µm (gravel size) component was minor down profile across all wetlands, and did not occur at all in two of the wetlands (swii and swiii). It ranged from 0% to 8% by weight, with a mean of 2.4%. The 63-2000 µm (sand size) component ranged from 15% to 97% by weight, and was the dominant component in all but four of the wetlands. At a depth of approximately 60 cm (range 20-40 cm), there was a marked increase in the proportion of sand generally, signalling the beginning of the gradational contact with the basement sands. The <63 µm (mud size) component ranged from 6% to 88% by weight. It was dominant in wetlands 161, 162, 163, and WAWA and decreased in proportion in the younger wetlands. The mud component was greatest in the upper layers of each profile (0-50 cm), whether it was the dominant or sub-dominant component.
6.3.8 Composition of grain fractions To further characterise the sediment types, and to examine trends down profile, determination of the percentage composition (by weight) of calcium carbonate, humus and plant material, and quartz in each of the major textural components (gravel, sand, and mud), was undertaken (Figs. 6-44 to 6-56 B). On the basis of this analysis, wetlands were categorised as mud, sand, or muddy sand dominated groups. This categorisation was then used in ordination of environmental features and hydrological studies.
Root material comprised the major part of the >2000 µm fraction, followed by shell. The shell component often comprised one or two complete fossil shells of Glyptophysasp. and Gyraulus sp. Shells were distributed unevenly throughout the profiles, occurring predominantly in the surface horizons or in shell lag horizons.
In order of abundance, the sand fraction was composed of calcium carbonate (skeletal fragments), quartz grains, and plant material (seeds, stem and leaf detritus). The calcium carbonate content exceeded quartz in nearly all wetland sites to a depth of 60 cm and then the trend reversed (Table 6.5 and Figs. 6-48, 49, 52, 53). The exception was wetland WAWA in which the carbonate was negligible throughout.
Wetlands exhibited several patterns in calcium carbonate composition in the sand fraction down profile:
• a vertically consistent pattern e.g., wetlands 161, WAWA, 63, 35, swi,ii,iii, 1N • an expanding/contracting pattern e.g., wetlands 163, 135, 72, 45, 9-6 • a fluctuating pattern e.g., wetlands 162, 163, 142
209WETLAND STRATIGRAPHY

These patterns may be attributed to several processes, e.g., inundation frequency,carbonate dissolution, and carbonate buffering. The age of the wetland is also a factor, insofar as many of the processes are time dependent. In older wetlands (161, 162, 163, 142, 135, 72, 35, 9-6, WAWA), the percentage of calcium carbonate in the sands decreased with depth, while quartz increased. In younger wetlands (63, 9-11, swi, swii, swiii, 1N), the percentages of calcium carbonate and quartz remained relatively stable.
Below the top 10 cm, the carbon content of the sand was generally low with the exception of wetlands WAWA, 161, 45, 35, sites with a higher frequency of inundation.
The mud size component ranged from 6% to 88%. The mud fraction comprised calcium carbonate, peat and organic material, and quartz, with minor amounts of diatoms and traces of K-feldspar in the younger wetlands (Table 6.3 142, 9-5, swii). Calcium carbonate was dominant in all wetlands except WAWA, which was dominated by peat. Peat and organic material were minor overall, exhibiting maximum carbon content from 0-20 cm and thereafter remaining consistent down profile. Quartz content was variable: negligible in wetlands 161, 142, 72, 63, swii; consistent down profile in wetlands 162, 163, 35, 9-6, 9-11, swi, 1N; and increasing sharply at depth in wetlands WAWA, 135, 45, and swiii. The distribution of mud throughout the profiles was partly determined by the burrow mottled structure of the sediments, and the occurrence of specific structural or buried features.
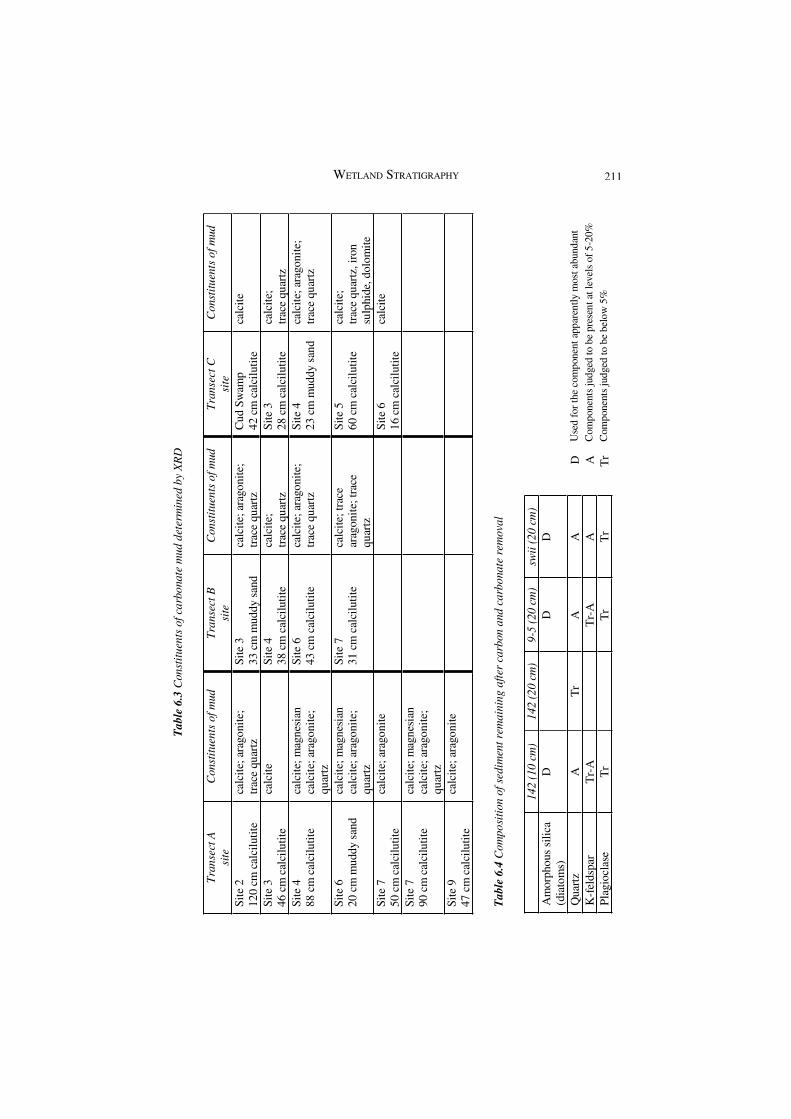
Selected samples of carbonate mud and associated fine grained components from wetlands along three different east/west transects were analysed by XRD to determine mineralogy. These data show that the components of mud determined by X-ray diffraction are mainly calcitic, with minor aragonite and traces of quartz (Table 6.3). The non-carbonate component from selected samples also was investigated. Afterdigestion of the carbon and carbonate in the mud, residues were analysed by XRD to determine their composition. Results are provided in Table 6.4.
The key gradational patterns for each wetland based on Figures 6-44 to 6-56, are described in Table 6.5. The data in Table 6.5 provide a link between the granulometry,the grain composition, and some sedimentary processes.
210 C. A. SEMENIUK
Tab
le 6
.3 C
onst
itue
nts
of c
arbo
nate
mud
det
erm
ined
by
XR
D
Tra
nsec
t Asi
te
Con
stitu
ents
of m
ud
Tran
sect
B
site
C
onst
ituen
ts o
f mud
Tr
anse
ct C
si
te
Con
stitu
ents
of m
ud
Site
212
0 cm
cal
cilu
tite
calc
ite; a
rago
nite
;tr
ace
quar
tz
Site
333
cm
mud
dy s
and
calc
ite; a
rago
nite
;tr
ace
quar
tz
Cud
Sw
amp
42 c
m c
alci
lutit
e ca
lcite
Site
346
cm
cal
cilu
tite
calc
ite
Site
438
cm
cal
cilu
tite
ca
lcite
;tr
ace
quar
tz
Site
328
cm
cal
cilu
tite
calc
ite;
trac
e qu
artz
Si
te 4
88 c
m c
alci
lutit
e ca
lcite
; mag
nesi
anca
lcite
; ara
goni
te;
quar
tz
Site
643
cm
cal
cilu
tite
ca
lcite
; ara
goni
te;
trac
e qu
artz
S
ite 4
23 c
m m
uddy
san
d ca
lcite
; ara
goni
te;
trac
e qu
artz
Site
620
cm
mud
dy s
and
calc
ite; m
agne
sian
calc
ite; a
rago
nite
;qu
artz
Site
731
cm
cal
cilu
tite
ca
lcite
; tra
ce
arag
onit
e; tr
ace
quar
tz
Site
560
cm
cal
cilu
tite
calc
ite;
trac
e qu
artz
, iro
nsu
lphi
de, d
olom
ite
Site
750
cm
cal
cilu
tite
calc
ite; a
rago
nite
Site
616
cm
cal
cilu
tite
calc
ite
Site
790
cm
cal
cilu
tite
calc
ite; m
agne
sian
calc
ite; a
rago
nite
;qu
artz
Si
te 9
47 c
m c
alci
lutit
e ca
lcite
; ara
goni
te
Tab
le 6
.4 C
ompo
sitio
n of
sed
imen
t rem
aini
ng a
fter
carb
on a
nd c
arbo
nate
rem
oval
142
(10
cm)
142
(20
cm)
9-5
(20
cm)
swii
(20
cm
) A
mor
phou
s si
lica
(dia
tom
s)
DD
D
Qua
rtz
A
Tr
AA
K-f
elds
par
Tr-
A
Tr-
A
AP
lagi
ocla
se
Tr
Tr
Tr
DU
sed
for
the
com
pone
nt a
ppar
ently
mos
t abu
ndan
t
AC
ompo
nent
s ju
dged
to b
e pr
esen
t at l
evel
s of
5-2
0%
Tr
Com
pone
nts
judg
ed to
be
belo
w 5
%
211WETLAND STRATIGRAPHY

Fig
ure
6-44
. Wet
land
161
: te
xtur
al a
nd c
ompo
siti
onal
ana
lyse
s.
212 C. A. SEMENIUK

Fig
ure
6-45
. Wet
land
162
: te
xtur
al a
nd c
ompo
siti
onal
ana
lyse
s.
213WETLAND STRATIGRAPHY

Fig
ure
6-46
. Wet
land
163
: te
xtur
al a
nd c
ompo
siti
onal
ana
lyse
s.
214 C. A. SEMENIUK

Fig
ure
6-47
. Wet
land
WA
WA
: te
xtur
al a
nd c
ompo
siti
onal
ana
lyse
s.
215WETLAND STRATIGRAPHY

Fig
ure
6-48
. Wet
land
142
: te
xtur
al a
nd c
ompo
siti
onal
ana
lyse
s.
216 C. A. SEMENIUK

.
Fig
ure
6-49
. Wet
land
135
: te
xtur
al a
nd c
ompo
siti
onal
ana
lyse
s.
217WETLAND STRATIGRAPHY

Fig
ure
6-50
. Wet
land
72:
text
ural
and
com
posi
tion
al a
naly
ses.
218 C. A. SEMENIUK

Fig
ure
6-51
. Wet
land
63:
text
ural
and
com
posi
tion
al a
naly
ses.
219WETLAND STRATIGRAPHY
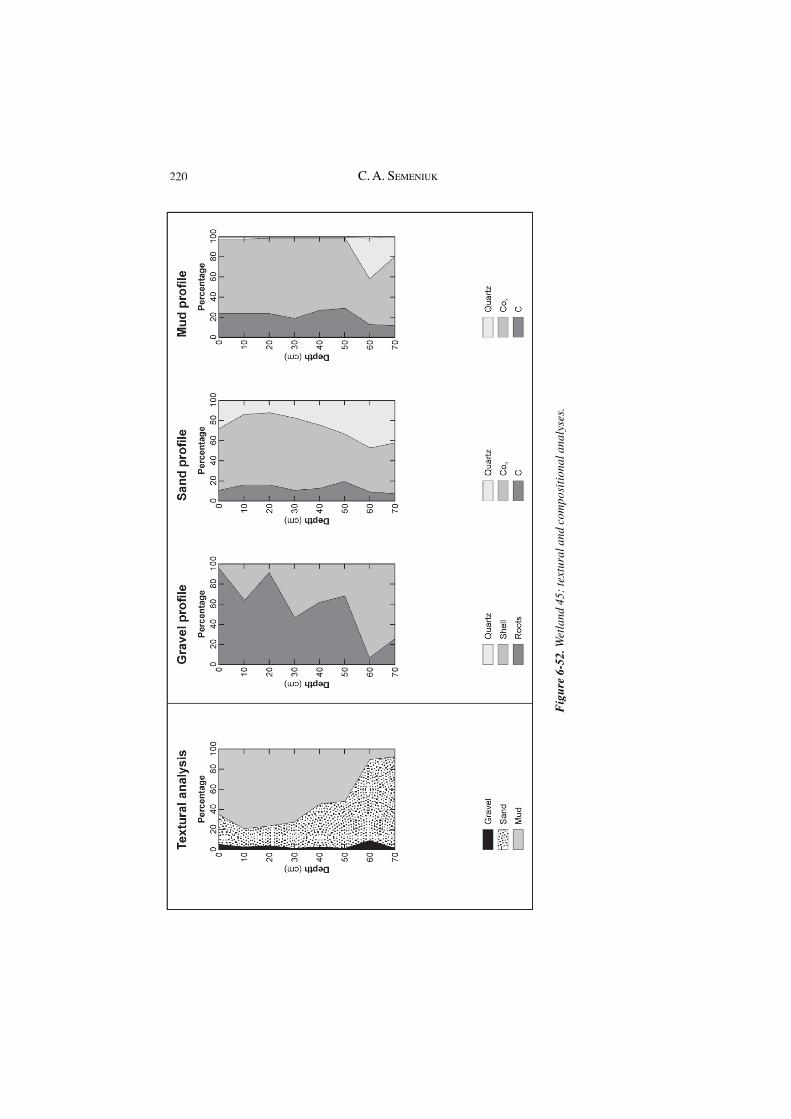
Fig
ure
6-52
. Wet
land
45:
text
ural
and
com
posi
tion
al a
naly
ses.
220 C. A. SEMENIUK

Fig
ure
6-53
. Wet
land
35:
text
ural
and
com
posi
tion
al a
naly
ses.
221WETLAND STRATIGRAPHY
Fig
ure
6-54
. Wet
land
s 9
(6)
and
9 (1
0):
text
ural
and
com
posi
tion
al a
naly
ses.
222 C. A. SEMENIUK

Fig
ure
6-55
. Wet
land
s sw
i and
sw
ii:
text
ural
and
com
posi
tion
al a
naly
ses.
223WETLAND STRATIGRAPHY

Fig
ure
6-56
. Wet
land
s sw
iii a
nd 1
N:
text
ural
and
com
posi
tion
al a
naly
ses.
224 C. A. SEMENIUK
Tabl
e 6.
5 G
ranu
lom
etri
c pa
tter
ns a
nd c
ompo
siti
onal
feat
ures
of s
edim
ent p
rofi
les
Wet
land
P
atte
rns
dow
n pr
ofil
e C
omm
ents
16
1G
rave
l G
rave
l pre
sent
thro
ugho
ut p
rofi
le; f
resh
wat
er s
hells
to 6
0 cm
; L
ive
root
s do
min
ate
0-10
cm
; non
-liv
ing
root
s th
roug
hout
prof
ile
Sand
Sub-
dom
inan
t com
pone
nt
Sand
con
tent
incr
ease
s be
low
60
cm u
p to
max
imum
> 6
0 %
C
arbo
nate
dom
inan
t; ca
rbon
thro
ugho
ut p
rofi
le; q
uart
z do
min
ates
bel
ow 6
0 cm
Mud
Dom
inan
t com
pone
nt
Mud
con
tent
con
sist
ent t
o 60
cm
, the
n de
crea
ses
Car
bona
te d
omin
ant;
carb
on c
onte
nt f
luct
uate
s do
wn
prof
ile;
negl
igib
le q
uart
z co
nten
t
• Fr
eshw
ater
she
lls im
plie
s fr
eshw
ater
en
viro
nmen
t. T
here
is a
rel
atio
nshi
p be
twee
n ca
lcilu
tite
and
foss
il sh
ells
.•
Gra
vel i
nher
ited
from
bea
chse
dim
ents
indi
cate
s ba
sal s
heet
ori
gin
is b
each
. •
Liv
e vs
dead
roo
t zon
e se
para
tes
rhiz
osph
ere
from
bur
ied
rhiz
osph
ere.
• R
oots
indi
cate
roo
t str
uctu
red
sedi
men
t •
Mud
-dom
inat
ed p
rofi
le.
• C
arbo
nate
dom
inat
es a
ll fr
acti
ons
• C
arbo
n co
nten
t of
the
mud
fra
ctio
nfo
rms
a lo
w a
mpl
itude
cyc
lic p
atte
rn.
162
Gra
vel
Gra
vel p
rese
nt th
roug
hout
pro
file
; fre
shw
ater
she
lls to
60
cm;
Liv
e ro
ots
dom
inat
e 0-
20 c
m; l
ayer
of
non-
livin
g ro
ots
at 7
0 cm
Sand
Co-
dom
inan
t com
pone
ntSa
nd c
onte
nt in
crea
ses
belo
w 5
0 cm
up
to m
axim
um o
f >
90 %
V
aria
ble
ratio
of
carb
onat
e to
qua
rtz
dow
n pr
ofile
C
arbo
nate
and
qua
rtz
dom
inan
t; m
inor
car
bon
cont
ent d
own
prof
ile; q
uart
z do
min
ates
bel
ow 5
0 cm
• Fr
eshw
ater
she
lls im
plie
s fr
eshw
ater
en
viro
nmen
t. T
here
is a
rel
atio
nshi
p be
twee
n ca
lcilu
tite
and
foss
il sh
ells
.•
Gra
vel i
nher
ited
from
bea
chse
dim
ents
indi
cate
s ba
sal s
heet
ori
gin
is b
each
. •
Liv
e vs
dead
roo
t zon
e se
para
tes
rhiz
osph
ere
from
bur
ied
rhiz
osph
ere.
• R
oot s
truc
ture
d se
dim
ent Ta
ble
6.5
(con
t.)
225WETLAND STRATIGRAPHY

Tab
le 6
.5 (
cont
.)
Wet
land
P
atte
rns
dow
n pr
ofil
e C
omm
ents
16
2 M
ud
Dom
inan
t com
pone
ntM
ud is
dom
inan
t to
50 c
m, t
hen
decr
ease
sC
arbo
nate
dom
inan
t; al
l com
pone
nts
cons
iste
nt d
own
prof
ile
• M
ud-d
omin
ated
pro
file
.•
Car
bona
te d
omin
ates
all
frac
tions
• C
ompo
sitio
nal p
ropo
rtio
ns a
re
rela
ted
to s
mal
l sca
le s
truc
tura
lfe
atur
es
163
Gra
vel
Gra
vel p
rese
nt in
laye
rs th
roug
hout
pro
file
; who
le f
resh
wat
ersh
ells
to 5
0 cm
; fra
gmen
ts to
90
cmL
ive
root
s do
min
ate
0-10
cm
; non
-liv
ing
root
s th
roug
hout
Sand
Sub-
dom
inan
t com
pone
nt; v
aria
ble
dow
n pr
ofile
Sa
nd in
crea
ses
belo
w 7
0 cm
up
to m
axim
um >
80
%C
arbo
nate
dom
inan
t to
50 c
m, t
hen
quar
tz d
omin
ant;
carb
onth
roug
hout
pro
file
M
ud
Dom
inan
t com
pone
nt to
70
cm, t
hen
decr
ease
sC
arbo
nate
dom
inan
t; ca
rbon
ate
and
carb
on c
onte
nt c
onsi
sten
t do
wn
prof
ile; q
uart
z co
nten
t inc
reas
es w
ith d
epth
• Fr
eshw
ater
she
lls im
plie
s fr
eshw
ater
envi
ronm
ent.
The
re is
a r
elat
ions
hip
betw
een
calc
ilutit
e an
d fo
ssil
shel
ls.
• G
rave
l inh
erite
d fr
om b
each
sedi
men
ts in
dica
tes
basa
l she
et o
rigi
nis
bea
ch.
• L
ive
vs d
ead
root
zon
e se
para
tes
rhiz
osph
ere
from
bur
ied
soil.
• R
oot s
truc
ture
d se
dim
ent
• M
ud-d
omin
ated
pro
file
.•
Car
bona
te d
omin
ates
san
d an
d m
ud
frac
tions
.
WA
WA
G
rave
l G
rave
l pre
sent
in la
yers
thro
ugho
ut p
rofi
le; n
o w
hole
fos
sil
shel
ls, o
nly
thin
fac
ades
. Liv
e ro
ots
dom
inat
e 0-
10 c
m; n
on-
livin
g ro
ots
in la
yers
thro
ugho
ut p
rofi
le
• L
ive
vs d
ead
root
zon
e se
para
tes
rhiz
osph
ere
from
bur
ied
rhiz
osph
ere.
•
Roo
t str
uctu
red
sedi
men
t.•
Mud
-dom
inat
ed p
rofi
le. Ta
ble
6.5
(con
t.)
226 C. A. SEMENIUK

Wet
land
P
atte
rns
dow
n pr
ofil
e C
omm
ents
W
AW
A
Sand
C
o-do
min
ant c
ompo
nent
Sand
con
tent
incr
ease
s do
wn
prof
ile u
p to
> 9
0 %
C
arbo
nate
min
or; c
arbo
n th
roug
hout
pro
file
; qua
rtz
dom
inan
tM
udC
o-do
min
ant c
ompo
nent
Mud
con
tent
dec
reas
es b
elow
40
cmC
arbo
n co
nten
t dom
inan
t, >
80%
; as
mud
con
tent
dec
reas
es,
quar
tz a
nd c
arbo
nate
bec
ome
dom
inan
t
• Q
uart
z do
min
ates
the
sand
fra
ctio
n•
Peat
dom
inat
es th
e m
ud f
ract
ion
• Q
uart
z pe
ak a
t bas
e of
mud
pro
file
po
ssib
ly d
ue to
aeo
lian
inpu
t
135
Gra
vel
Neg
ligib
le c
ompo
nent
; who
le f
resh
wat
er s
hells
to 4
0 cm
Liv
e ro
ots
dom
inat
e 0-
10 c
m; n
on-l
ivin
g ro
ots
thro
ugho
utSa
ndSu
b-do
min
ant c
ompo
nent
Sa
nd c
onte
nt f
luct
uatin
g do
wn
prof
ile; i
ncre
ases
in s
urfa
ce
laye
rs a
nd b
elow
60
cm u
p to
max
imum
90
%E
qual
am
ount
s of
car
bon,
car
bona
te a
nd q
uart
z in
sur
face
laye
r;ca
rbon
ate
dom
inan
t to
50 c
m; c
arbo
n th
roug
hout
pro
file
; qua
rtz
dom
inat
es b
elow
60
cm; s
ands
50-
70 c
m h
ave
equa
l par
ts q
uart
z an
d ca
rbon
ate
Mud
Dom
inan
t com
pone
ntD
omin
ant d
own
prof
ile to
60
cm, t
hen
decr
ease
s C
arbo
nate
dom
inan
t; ca
rbon
con
tent
min
or b
ut c
onsi
sten
t dow
n pr
ofile
; neg
ligib
le q
uart
z to
40
cm th
en f
luct
uatin
g
• Fr
eshw
ater
she
lls im
plie
s fr
eshw
ater
envi
ronm
ent.
The
re is
a r
elat
ions
hip
betw
een
calc
ilutit
e an
d fo
ssil
shel
ls.
• G
rave
l inh
erite
d fr
om b
each
sedi
men
ts in
dica
tes
basa
l she
et o
rigi
nis
bea
ch.
• L
ive
vs d
ead
root
zon
e se
para
tes
rhiz
osph
ere
from
bur
ied
rhiz
osph
ere.
• R
oot s
truc
ture
d se
dim
ent
• Sa
ndy
mud
-mud
dy s
and
dom
inat
ed
prof
ile.
• C
arbo
nate
dom
inat
es s
and
and
mud
fr
actio
ns.
• Sa
nd f
ill d
ilutin
g su
rfac
e m
ud la
yers
. •
Qua
rtz
peak
at b
ase
of m
ud p
rofi
le
poss
ibly
due
to a
eolia
n in
put.
Tabl
e 6.
5 (c
ont.)
Tab
le 6
.5 (
cont
.)
227WETLAND STRATIGRAPHY

Wet
land
P
atte
rns
dow
n pr
ofile
C
omm
ent
142
Gra
vel
Gra
vel p
rese
nt th
roug
hout
pro
file
in v
aria
ble
amou
nts;
who
le
fres
hwat
er s
hells
to 5
0 cm
Liv
e ro
ots
dom
inat
e 0-
10 c
m; n
on-l
ivin
g ro
ots
thro
ugho
utSa
ndC
o-do
min
ant c
ompo
nent
Sa
nd c
onte
nt f
luct
uate
s do
wn
prof
ile; i
ncre
ases
in s
urfa
ce la
yers
belo
w 4
0 cm
up
to m
axim
um 9
0 %
Car
bona
te d
omin
ant i
n up
per
laye
rs; c
arbo
n th
roug
hout
pro
file
;qu
artz
dom
inat
es b
elow
40
cmV
aria
ble
carb
onat
e to
qua
rtz
ratio
dow
n pr
ofile
M
udC
o-do
min
ant c
ompo
nent
D
omin
ant d
own
prof
ile to
40
cm, t
hen
decr
ease
sC
arbo
nate
dom
inan
t; ca
rbon
con
tent
min
or, v
aria
ble
dow
npr
ofile
; neg
ligib
le q
uart
z
• Fr
eshw
ater
she
lls im
plie
s fr
eshw
ater
en
viro
nmen
t. T
here
is a
rel
atio
nshi
p be
twee
n ca
lcilu
tite
and
foss
il sh
ells
.•
Gra
vel i
nher
ited
from
bea
chse
dim
ents
indi
cate
s ba
sal s
heet
ori
gin
is b
each
. •
rhiz
osph
ere
from
bur
ied
rhiz
osph
ere.
• R
oot s
truc
ture
d se
dim
ent
• Sa
ndy
mud
-mud
dy s
and
dom
inat
ed
prof
ile.
• C
arbo
nate
dom
inat
es m
ud f
ract
ion.
• V
aria
ble
carb
onat
e to
qua
rtz
ratio
do
wn
prof
ile.
• Sa
nd fi
ll di
lutin
g su
rfac
e m
ud la
yers
.
72
Gra
vel
Gra
vel m
inor
0-1
0 cm
, the
n ne
glig
ible
thro
ugho
ut p
rofi
le
Who
le f
resh
wat
er s
hells
to 3
0 cm
; Liv
e ro
ots
dom
inat
e 0-
10 c
mSa
ndD
omin
ant c
ompo
nent
Sa
nd c
onte
nt in
crea
ses
belo
w 2
0 cm
up
to m
axim
um >
80
%
Var
iabl
e co
mpo
sitio
n do
wn
prof
ile: c
arbo
nate
dom
inan
t in
uppe
r la
yers
; car
bon
cont
ent p
eak
at 3
0 cm
; qua
rtz
incr
ease
sw
ith d
epth
• Fr
eshw
ater
she
lls im
plie
s fr
eshw
ater
en
viro
nmen
t. T
here
is a
rel
atio
nshi
p be
twee
n ca
lcilu
tite
and
foss
il sh
ells
.•
Roo
t str
uctu
red
sedi
men
t•
Sand
y m
ud-m
uddy
san
d do
min
ated
pr
ofile
. •
Car
bona
te d
omin
ates
mud
fra
ctio
n.•
Var
iabl
e ca
rbon
, car
bona
te, q
uart
z ra
tios
in s
and
dow
n pr
ofile
Ta
ble
6.5
(con
t.)
Tab
le 6
.5 (
cont
.)
Liv
e vs
dea
d ro
ot z
one
sepa
rate
s
228 C. A. SEMENIUK

Wet
land
P
atte
rns
dow
n pr
ofil
e C
omm
ents
72
M
ud
Sub-
dom
inan
t com
pone
nt
Mud
con
tent
con
sist
ent t
o 20
cm
, the
n de
crea
ses
Car
bona
te d
omin
ant;
carb
on c
onte
nt c
onsi
sten
t dow
n pr
ofile
;ne
glig
ible
qua
rtz
cont
ent
• Sa
nd f
ill d
ilutin
g su
rfac
e m
ud la
yers
.
63
Gra
vel
Gra
vel m
inor
0-1
0 cm
, the
n ne
glig
ible
thro
ugho
ut p
rofi
le
Frag
men
ted
fres
hwat
er s
hells
to 3
0-50
cm
Liv
e ro
ots
dom
inat
e 0-
10 c
m; n
on-l
ivin
g ro
ots
30-4
0 cm
Sand
Dom
inan
t com
pone
ntSa
nd c
onte
nt in
crea
ses
dow
n pr
ofile
up
to m
axim
um >
80
%C
arbo
nate
dom
inan
t; ca
rbon
thro
ugho
ut p
rofi
le; c
arbo
nate
quar
tz r
atio
con
sist
ent d
own
prof
ile
Mud
Sub-
dom
inan
t com
pone
nt
Mud
con
tent
dec
reas
es s
tead
ily d
own
prof
ileC
arbo
nate
dom
inan
t; ca
rbon
con
tent
dec
reas
es 0
-20
cm, t
hen
cons
iste
nt d
own
prof
ile; n
eglig
ible
qua
rtz
cont
ent
• Fr
eshw
ater
she
lls im
plie
s fr
eshw
ater
envi
ronm
ent.
The
re is
a r
elat
ions
hip
betw
een
calc
ilutit
e an
d fo
ssil
she
lls.
• rh
izos
pher
e fr
om b
urie
d rh
izos
pher
e.
• R
oots
indi
cate
roo
t str
uctu
red
sedi
men
t •
Mud
dy s
and
dom
inat
ed p
rofi
le.
• C
arbo
nate
dom
inat
es m
ud a
nd s
and
frac
tions
.
45
Gra
vel
Gra
vel p
rese
nt th
roug
hout
pro
file
; who
le f
resh
wat
er s
hell
lam
inae
at 1
0, 3
0, a
nd 6
0 cm
Liv
e ro
ots
dom
inat
e 0-
20 c
m; n
on-l
ivin
g ro
ots
thro
ugho
utpr
ofile
• Fr
eshw
ater
she
lls im
plie
s fr
eshw
ater
envi
ronm
ent.
The
re is
a r
elat
ions
hip
betw
een
calc
ilutit
e an
d fo
ssil
she
lls.
• R
oot s
truc
ture
d se
dim
ent
• Sa
ndy
mud
-mud
dy s
and
dom
inat
ed
prof
ile..
Tabl
e 6.
5 (c
ont.)
Tab
le 6
.5 (
cont
.)
Liv
e vs
dea
d ro
ot z
one
sepa
rate
s
229WETLAND STRATIGRAPHY

Wet
land
P
atte
rns
dow
n pr
ofile
C
omm
ent
45
Sand
Su
b-do
min
ant c
ompo
nent
Sa
nd in
crea
ses
in s
urfa
ce la
yers
and
bel
ow 3
0 cm
up
to >
90
%
Car
bona
te d
omin
ant;
carb
on c
onte
nt f
luct
uate
s do
wn
prof
ile;
quar
tz in
crea
ses
in s
urfa
ce la
yer,
then
aga
in b
elow
20
cmM
ud
Dom
inan
t com
pone
ntM
ud c
onte
nt d
ecre
ases
sha
rply
bel
ow 5
0 cm
Car
bona
te d
omin
ant;
carb
on c
onte
nt f
luct
uate
s sl
ight
ly d
own
prof
ile; n
eglig
ible
qua
rtz
cont
ent t
o 60
cm
, the
n pe
ak
• C
arbo
nate
dom
inat
es m
ud a
nd s
and
frac
tions
. •
Sign
ific
ant c
arbo
n co
nten
t in
all
frac
tions
. •
Qua
rtz
peak
at b
ase
of m
ud p
rofi
le
poss
ibly
due
to a
eolia
n in
put.
35
Gra
vel
Gra
vel p
rese
nt in
laye
rs th
roug
hout
pro
file
, min
or 0
-10
cm,
then
neg
ligib
le; w
hole
fre
shw
ater
she
ll fr
agm
ents
to 5
0 cm
Liv
e ro
ots
dom
inat
e 0-
10 c
m a
nd 3
0 cm
; lay
er o
f no
n-liv
ing
root
s at
60
cmSa
ndD
omin
ant c
ompo
nent
Sand
incr
ease
s in
sur
face
laye
rs a
nd b
elow
30
cm u
p to
> 9
0 %
C
arbo
nate
dom
inan
t; ca
rbon
con
tent
min
or th
roug
hout
pro
file
; qu
artz
incr
ease
s in
sur
face
laye
r, th
en a
gain
bel
ow 2
0 cm
Mud
Su
b-do
min
ant c
ompo
nent
M
ud c
onte
nt d
ecre
ases
sha
rply
dow
n pr
ofile
bel
ow 1
0 cm
Car
bona
te d
omin
ant;
carb
on c
onte
nt p
eak
at 0
-10
cm, t
hen
cons
iste
nt d
own
prof
ile; n
eglig
ible
qua
rtz
cont
ent
• Fr
eshw
ater
she
lls im
plie
s fr
eshw
ater
envi
ronm
ent.
The
re is
a r
elat
ions
hip
betw
een
calc
ilutit
e an
d fo
ssil
shel
ls.
• R
oot s
truc
ture
d se
dim
ent
• Sa
ndy
mud
-mud
dy s
and
dom
inat
edpr
ofile
. •
Car
bona
te d
omin
ates
mud
fra
ctio
n.
• Sa
nd f
ill d
ilutin
g su
rfac
e m
ud la
yers
.
Tabl
e 6.
5 (c
ont.)
Tab
le 6
.5 (
cont
.)
230 C. A. SEMENIUK

Wet
land
P
atte
rns
dow
n pr
ofil
e C
omm
ents
9-
6 M
ud
Dom
inan
t com
pone
nt
Mud
con
tent
dec
reas
es s
harp
ly b
elow
30
cmC
arbo
nate
dom
inan
t; ca
rbon
con
tent
dec
reas
es 0
-10
cm, t
hen
cons
iste
nt d
own
prof
ile; n
eglig
ible
qua
rtz
to 5
0 cm
, the
n sh
arp
incr
ease
sw
i G
rave
l G
rave
l pre
sent
thro
ugho
ut p
rofi
le;
Bea
ch s
hell
frag
men
ts to
30
cmL
ive
root
s do
min
ate
0-10
cm
; non
-liv
ing
root
s at
30
cmSa
nd
Dom
inan
t com
pone
nt
Sand
con
tent
incr
ease
s be
low
20
cm u
p to
max
imum
> 7
0 %
C
arbo
nate
dom
inan
t; ca
rbon
pea
k at
0-1
0 cm
, the
n m
inor
thro
ugho
ut p
rofi
le; q
uart
z in
crea
ses
slig
htly
at 1
0 cm
, the
nco
nsis
tent
dow
n pr
ofile
M
ud
Sub-
dom
inan
t com
pone
nt
Mud
con
tent
dec
reas
es b
elow
20
cmC
arbo
nate
dom
inan
t; ca
rbon
con
tent
flu
ctua
tes
dow
n pr
ofile
; qu
artz
con
tent
flu
ctua
tes
dow
n pr
ofile
• Fr
eshw
ater
she
lls im
plie
s fr
eshw
ater
en
viro
nmen
t. T
here
is a
rel
atio
nshi
p be
twee
n ca
lcilu
tite
and
foss
il sh
ells
.•
Liv
e vs
dea
d ro
ot z
one
sepa
rate
s rh
izos
pher
e fr
om b
urie
d rh
izos
pher
e.•
Roo
t str
uctu
red
sedi
men
t•
Mud
dy s
and
dom
inat
ed p
rofi
le.
• C
arbo
nate
dom
inat
es m
ud a
nd s
and
frac
tions
. •
Sign
ific
ant c
arbo
n co
nten
t in
mud
.
swii
Gra
vel
Gra
vel n
eglig
ible
. L
ive
root
s do
min
ate
0-10
cm
Sand
D
omin
ant c
ompo
nent
• R
oot s
truc
ture
d se
dim
ent
• M
uddy
san
d do
min
ated
pro
file
.•
Car
bona
te d
omin
ates
mud
and
san
dfr
actio
ns.
Tabl
e 6.
5 (c
ont.)
Tab
le 6
.5 (
cont
.)
231WETLAND STRATIGRAPHY

Wet
land
P
atte
rns
dow
n pr
ofil
e C
omsw
ii Sa
nd
Sand
con
tent
incr
ease
s up
to m
axim
um >
90
%C
arbo
nate
dom
inan
t; ca
rbon
pea
k at
0-1
0 cm
; qua
rtz
cons
iste
nt d
own
prof
ile
Car
bona
te q
uart
z ra
tio c
onsi
sten
t dow
n pr
ofile
M
ud
Min
or c
ompo
nent
Mud
con
tent
dec
reas
es d
own
prof
ile
Car
bona
te d
omin
ant;
carb
on c
onte
nt s
igni
fica
nt; n
eglig
ible
quar
tz c
onte
nt
Car
bon
peak
at 0
-10
cm, t
hen
cons
iste
nt d
own
prof
ile
• Si
gnif
ican
t car
bon
cont
ent i
n m
ud.
swiii
G
rave
l G
rave
l min
or 0
-10
cm, t
hen
negl
igib
le th
roug
hout
pro
file
Fr
agm
ente
d fr
eshw
ater
she
lls to
0-2
0 cm
Liv
e ro
ots
dom
inat
e 0-
20 c
mSa
nd
Dom
inan
t com
pone
ntSa
nd c
onte
nt in
crea
ses
up to
max
imum
> 9
0 %
C
arbo
nate
dom
inan
t; ca
rbon
con
tent
con
sist
ent d
own
prof
ile;
quar
tz in
crea
ses
dow
n pr
ofile
M
ud
Min
or c
ompo
nent
Mud
con
tent
dec
reas
es d
own
prof
ile
Car
bona
te d
omin
ant;
carb
on c
onte
nt c
onsi
sten
t dow
n pr
ofile
;qu
artz
pea
k at
30
cm
• R
oots
indi
cate
roo
t str
uctu
red
sedi
men
t •
Mud
dy s
and
dom
inat
ed p
rofi
le.
• C
arbo
nate
dom
inat
es m
ud a
nd s
and
frac
tions
. •
Sign
ific
ant c
arbo
n co
nten
t in
mud
.•
Qua
rtz
peak
at b
ase
of m
ud p
rofi
le
poss
ibly
due
to a
eolia
n in
put.
Tabl
e 6.
5 (c
ont.)
Tab
le 6
.5 (
cont
.)
232 C. A. SEMENIUK

Wet
land
P
atte
rns
dow
n pr
ofil
e C
omm
ents
1N
G
rave
l G
rave
l pre
sent
thro
ugho
ut p
rofi
le 0
-20
cmL
ive
root
s do
min
ate
0-20
cm
Sand
Dom
inan
t com
pone
ntSa
nd c
onte
nt d
ecre
ases
0-1
0 cm
then
incr
ease
s up
to m
axim
um>
90 %
Car
bona
te d
omin
ant;
carb
on c
onte
nt m
inor
, dec
reas
es d
own
prof
ile; q
uart
z do
min
ates
bel
ow 6
0 cm
Car
bona
te q
uart
z ra
tio c
onsi
sten
t dow
n pr
ofile
M
udM
inor
com
pone
nt
Car
bona
te d
omin
ant;
carb
on c
onte
nt 0
-20
cm s
igni
fica
nt, b
utde
crea
sing
; var
iabl
e qu
artz
con
tent
• R
oots
indi
cate
roo
t str
uctu
red
sedi
men
t •
Mud
dy s
and
dom
inat
ed p
rofi
le.
• C
arbo
nate
dom
inat
es m
ud a
nd s
and
frac
tions
. •
Sign
ific
ant c
arbo
n co
nten
t in
mud
.
Tab
le 6
.5 (
cont
.)
233WETLAND STRATIGRAPHY

Important textural and compositional patterns are related to the wetlands in which they occur (Table 6.6).
Table 6.6 Summary of textural and compositional patterns in wetland sediments
The main textural and compositional patterns Wetlands in which these patterns occurAccumulation of organic matter insurface layers
161, 162, 163, WAWA, 135, 142, 63,45, 35, 9-11, 9-6, swi, swii, 1N
Significant quartz/carbonate ratio in sand 161, 162, 163, WAWA, 135, 142, 35,9-11
Mud sized quartz peaks at base of wetland fill
WAWA, 163, 135, 45, swiii
Freshwater shells 161, 162, 163, 135, 142, 72, 63, 45, 35, 9-6, swiii
Fragmented marine shell material 135, 142, 9-11Mud dominant profiles 161, 162, 163, WAWA, 135, 45, 9-6Sand dominant profiles 63, 9-11, swi, swii, swiii, 1N Buried humic horizon/rhizosphere 161, 162, WAWA, 45, 9-6
The main features of the Becher Suite wetlands deriving from the granulometric and compositional data are as follows:
• there are shallow rhizospheres • humus production occurs in the surface layers • organic mud size material has infiltrated into underlying layers • carbonate is the dominant component of mud and sand • there is a change in quartz/carbonate ratios down profile • freshwater shells occur in the calcilutite • marine and freshwater shell gravel layers occur in the calcilutite, and • down profile there is a gradation from mud to muddy sand near the basal sheet.
6.3.9 Biota There are two types of fossil shells in the wetland muds and muddy sands, which are distinct from beach shell material. They are the gastropods Gyraula sp. and Glyptophysa sp. The age of the gastropods, as determined by radiocarbon dating, ranges from circa 2,205-280 14C yrs BP. They occur scattered in the calcilutite, or form shell laminae beds. Both species are extant and endemic to the southwest of WesternAustralia, however, there has been little research about the habitat requirements of these snails. The species both appear to inhabit fresh to possibly brackish (?) shallow sumplands. They have been observed colonising macrophytes growing in fine loam or mud (Pers. Comm. S. Slack-Smith, WA Museum, 2000). They do not normally co-exist. A study of pulmonate snails in Nigeria revealed similar ecological requirements (Ndifon and Ukoli 1989). The species of Gyraula was found in seasonal freshwater
234 C. A. SEMENIUK

wetlands underlain by sand and muddy sand, with water shallow enough to support macrophytes. Also, the species most commonly occurred in isolation or with one other species of gastropod. Diatoms also occur in small numbers in the calcilutite e.g., wetlands 142 and swii.
6.3.10 Pedogenesis and synsedimentary diagenesis There are several pedogenic and synsedimentary diagenetic processes operating in the wetland sediments: generation of humus and organic matter from the current colonising vegetation; bioturbation; colour mottling; cementation; disintegration of carbonate grains; and leaching of calcium carbonate.
Humus and organic matter Humus is generated at the surface of damplands under aerobic conditions where organic matter decomposition increases with the degree of fragmentation. Sediment grains such as quartz and shell are coated with humus, and organic matter accumulates interstitial to the sand. Humus production is at its peak under the grass tree Xanthorrhoea preissii (Fig. 6-24), which tends to grow as monospecific clumps in incipient wetlands within the beachridge swales or in a ring on the outer edge of the wetlands. Soils under X. preissii exhibit various development of organic horizons ranging in depth from 20-100 cm. In wetland muds, organic matter is contributed predominantly by the sedges Lepidosperma gladiatum, Baumea articulata/Typhasp., and Gahnia trifida. The mean content of mud sized organic matter in the surface layers under selected wetland species is tabled below.
Table 6.7 Organic content of surface sediment under various species
Vegetation assemblage Mud size organicmatter content
Number of sites
Baumea articulata/ Typha sp. 49 ± 26 n = 2 Lepidosperma gladiatum 31 n = 1 Melaleuca teretifolia 19 ± 7 n = 5 Juncus kraussii 19 ± 4 n = 5 Centella asiatica 18 ± 6% n = 5Melaleuca rhaphiophylla 17 ± 6% n = 4 Baumea juncea 12 ± 2 n = 4
BioturbationBioturbation by plants and animals is evident both at the modern wetland surface and at depth. In the modern environment, in wetlands that are seasonally inundated and waterlogged, bioturbation commonly occurs in the dry part of the hydroperiod. Insects,such as ants and crickets, as well as some introduced vertebrate species, bioturbate
235WETLAND STRATIGRAPHY

the sandy sediments; other less common vertebrate burrowers such as the Southern Brown Bandicoot, are active only in some of the wetlands. Turn over of surface sediments by scratching or digging is to a depth of approximately 10 cm.
Within the stratigraphic profile, individual burrows are evident in the calcilutite layer.Bioturbation is expressed as texture mottling within a layer, or traversing a layer; as gradational contacts between some of the sediment types near the surface, and/or as homogeneous layers composed of mixed mud types. Layers of mixed composition are produced when infiltration of an overlying mud (type 1) into the lower horizon, composed of a second mud type (type 2), is followed by bioturbation.
Colour mottling Within the calcilutite layers there may be variable grey and brown colour mottling. This is associated with humic mud infiltration, iron staining, oxidation-reduction processes in gley sediments (Wright and Platt 1995), decomposition of plant material, and burrowing.
CementationWithin the wetland sediments there are two types of local cementation. The first is cementation within the muddy sand by fine grained calcite, associated with a buried “stromatolite” bed, and the second is cementation within muddy sand by calcrete. Both types of cementation occur within the zone of groundwater fluctuation (wetlands Cooloongup A and 9-3, 9-6).
In Cooloongup swale A, there is a buried cemented bed that resembles a “stromatolite”, at a depth of 30-60 cm below the surface. In wetland 9, the cementation is a precipitate of calcrete (Read 1974), occuring as an indurated lens, (5-15 cm thick), or nodule layer,30-50 cm deep within the muddy sand. The calcrete does not appear to be related to the current water level regime. The depth at which the calcrete layers occur (- 50 cm) corresponds roughly to the depth of the root system of Melaleuca rhaphiophylla, which is the only tree occurring in the wetland. Its occurrence, therefore, is best explained as a feature resulting from plant utilisation of vadose and phreatic waters causing precipitation of CaCO
3 (Semeniuk and Meagher 1981). This calcrete occurs at
the vadose/phreatic zone interface within the carbonate sequence.
6.3.11 Age structure and rate of sedimentation Radiocarbon dating was used to determine the Holocene age of the wetland deposits, the age structure of the sedimentary fills, the rates of accumulation of the various sediment types, and the variable ages of the compositional components in the mud-sized fraction of the sediment.
C. A. SEMENIUK

Fig
ure
6-57
. Age
str
uctu
re o
f wet
land
fill
s, a
nd in
terp
reta
tion
of r
ates
of s
edim
enta
tion
.
237WETLAND STRATIGRAPHY

Based on the oldest and youngest of the radiocarbon dates obtained for the calcilutite, it appears that deposition of calcilutite commenced east of Lake Cooloongup circa 5740 14Cyrs BP, west of Lake Cooloongup between the arms of the spit barrier circa 4590 14C yrs BP,(Cooloongup A2), and circa 4350 14C yrs BP, under the oldest wetland in the Becher Suite, and continues up to the present (surface of wetlands 162, 163, 9-6, and 9-14) (Table 5.4).
While the Becher beachridge plain ranges in age from circa 7000 years BP to modern (Searle et al. 1988), all wetlands in the study area are middle to late Holocene in age, i.e.,generally younger than the surrounding local landscape. The oldest dates were derived from the base of wetlands located in topographic low swales in the eastern parts of the beachridge plain. Although the majority of dates were derived from the base of wetlands to determine their period of initiation in the context of subregional wetland evolution within the prograding beachridge plain, a number were specifically obtained to determine the age structure of the sedimentary fills. Dates, derived from wetlands 161, 162, 163, 135, 35, and 9, show a progessive younging upwards of the wetland sedimentary fills. The range of 14C dates within several stratigraphic sequences provides a basis for determing the rates of sedimentation within the wetlands.
Rate of deposition of carbonate mud Calculations for the rate of deposition of interstitial carbonate mud are based on radiocarbon dates for the top and base of muddy sand in central wetland sites (Fig. 6-57), and are tabled below. Additional calculations for deposition rates of carbonate mud are separated into near pure calcilutite and OME calcilutite (Table 6.8).
Table 6.8 Rate of carbonate mud accumulation in mm/yr
Sediment type wetland 161 wetland 162 wetland 163 wetland 135muddy sand 0.23 mm 0.31 mm - 0.22 mmcalcilutite 0.11-1.23 mm* 0.19 mm
0.16 mm- ∼ 0.42 mm
OME calcilutite - 0.3 mm ∼ 0.16 mm -
Sediment type wetland 35 wetland 9-6 wetland 9-14muddy sand 0.36 mm 0.20 mm 0.13 mmcalcilutite - -OME calcilutite 0.29 mm 0.44 mm 0.58 mm
* rates of accumulation in interlayered calcilutite and peat
These data show a relatively consistent rate of infiltration in all wetlands during the phase of carbonate mud initiation, i.e., circa 0.2 mm/yr of sand sediment was plugged. The rates of accumulation of pure calcilutite in wetlands varied, beginning slowly and being not too dissimilar from the rate of mud formation during the infiltration phase,
238 C. A. SEMENIUK

.e.g., (circa 0.15 mm/yr) in wetlands 161 and 162 However, rates of accumulation increased in wetland 135 subsequent to 2000 years BP. The rate of mud accumulation in the sediment comprising mixed carbonate and organic material is two to four times that of pure calcilutite. Similar accumulation rates were extrapolated by Backhouse (1993) from cores of Holocene carbonate mud and peat in wetlands on Rottnest Island (offshore from Becher Point). Rates of accumulation were estimated to be 3 cm/100years in the Holocene carbonate mud and 10 cm/100 years in the upper and lower peat (Backhouse 1993).
Where there was mixed carbonate mud and organic matter, there was opportunity to separate these components and derive dates from each. Radiocarbon dating of both the carbonate and peat components within small segments of the stratigraphy was undertaken for four Becher wetlands (Table 6.9, Fig. 4-23).
Table 6.9 14C dates for two mud fractions (carbonate mud and organic carbon) at various wetlands
Sample type Wetland 161 Wetland 161 Wetland 162 Wetland 162(3-5 cm) (23-25 cm) (3-5 cm) (13-15 cm)
carbonate mud Modern630 ± 110 920 ± 110 380 ± 11050 ± 110
organic carbon Modern250 ± 110 990 ± 110 580 ± 110
Sample type Wetland 163 Wetland 135(3-5 cm) (13-15 cm)
carbonate mud Modern100 ± 110
640 ± 110
organic carbon Modern 480 ± 110
Since all these samples are from very young sedimentary accumulations, the measure of standard deviation is close to the determined age of the sample, recommending caution in interpretation. In addition, if the normal procedure of applying two standard deviations to radiometric dating is followed, then there is no significant difference between pairs. The discussion that follows assumes that the dates are valid based on one standard deviation. In wetlands 161 (3-5 cm), 162 (13-15 cm), and 135 (13-15 cm),the dates may be interpreted as indicating that the muds formed at different periods and that the current organic matter enriched carbonate mud is due to bioturbation in these layers. A period for each cycle of carbonate mud and organic matter accumulation of 70-380 years is suggested. In the other wetlands no significant difference in age could be determined.
WETLAND STRATIGRAPHY

Generally, climate controls the rate and nature of biogenic productivity, as well as influencing the rate and depth of penetration of illuviation. The variability in the rate of carbonate mud accumulation in wetland 161 may indicate that climate was gradually becoming wetter during the period 2500-1000 years BP. Radicarbon dates of 2600 and 1400 14C yrs BP from the base of carbonate mud horizons outside the current perimeter of wetlandsWAWA and 163, respectively, indicate that carbonate mud deposition still prevailed in these basins during this period of wetland expansion. Thus, it can be seen from these data, that the micro-environment associated with conditions at a particular site may be as important as the macro-climate variation in determining rates and style of accumulation.
6.4 Reconstruction of palaeo-environmental and palaeo-sedimentological processes
From the foregoing descriptions of the sediments and stratigraphic sequences in the Becher Suite wetlands, several evolutionary changes to the wetlands may be deduced. Inorder of presentation, the aspects of wetland evolution discussed in this section are: infiltration of sediments; fossil calcilutite deposits; peat and humus deposits; and wetland deepening through grain dissolution.
6.4.1 Infiltration of sediments Infiltration of mud, which has accumulated at the wetland surface under waterlogged or inundated conditions, into underlying sediments, is a common process in the Becher wetlands. Infiltration occurs in two ways: 1) illuviation and deposition, and 2) bioturbation.An early sedimentary process in wetland history was the alteration of the top of the beach or dune basement sand, i.e. the floor of the proto-wetland, through these wetland processes. Infiltration of carbonate mud into the basement sand formed a muddy sand basal sheet in all wetlands. In the intermediate layers, illuviation of surface mud by rainwater percolation and groundwater recession has resulted in compositional, textural and colour layering, e.g., the infiltration of peat into the light cream calcilutite in cores 161, 162, 142, Cooloongup B4 (Fig. 6-3, 6-4, 6-7, 6-22 D).
Burrows also play a part in the infiltration of one sediment into another. Burrows often are filled with material texturally distinct from the sediment horizon in which they occur (Figs. 6-10, 11, 18, 21 C, D, E). The end result of burrowing and bioturbation is a homogeneous layer intermediate to the mud and sands. Within a wetland basin, a single horizon may exhibit the complete gradation, i.e., burrows and thoroughly mixed compositional sediment.
Organic/carbonate horizons Several textural and compositional gradations were found in the organic matter enriched carbonate muddy sand layers. These gradational types were linked with one of the following three processes:
240 C. A. SEMENIUK

1. infiltration of overlying carbonate mud into the humic sand horizon
2. infiltration of peat and organic matter into the calcilutaceous sand horizon at the surface
3. sheet wash of sand into the OME calcilutite horizon
The first process occurred in sediment horizons at the base of the wetland fill. Thesehumic sands represent former soil surfaces of swales which have been buried by wetland fill and infiltrated by the overlying carbonate mud. The second process occurred in the modern surface at the centre and margins of wetlands. A change in sediment style, from carbonate mud accumulation to humus and peat production, is the underlying reason why this type of infiltration occurred. The third process occurred in horizons at the margins of the wetlands, following sheet wash of aeolian sediment into the wetland, or instances of disturbance to the beachridge slope (e.g., fire, erosion,trampling). In each case the result is a layer of humic/carbonate muddy sand. Theselayers, although lithologically similar, are not related stratigraphically, being diachronous sedimentary layers signifying independent stages of development from wetland to wetland.
6.4.2 Calcilutite The calcilutites in the wetlands of the Becher area are composed dominantly of calcite with subsidiary Mg-calcite and traces of aragonite. The particles of carbonate mud are silt- and clay-sized, 1-20 µm, with a range from 0.2 µm to 63 µm. Calcilutites from the Coolongup Suite are dominantly clay-sized, 0.4-2 µm in size, also with a range from 0.2 µm to 63 µm (Fig. 6-58). The muds have a porosity range of 0.49-0.6. SEMphotographs of the calcilutite show that the particles are skeletal in origin, composed of charophyte, ostracod, molluscan, and crustacean fragments (Fig. 6-59 A-L). Sincedeposition, the carbonate grains comprising carbonate mud have undergone disintegration and chemical corrosion. Disintegration is evident in the gradation of grain sizes from those of diameter 40 µm to 2 µm (Fig. 6-60). Chemical corrosion is evident in the pitted surface of the majority of grains (Fig. 6-61), such pitting being controlled by the skeletal grain architecture and calcite crystal cleavage.
The calcilutite sequence contains sedimentary structural features consistent with ephemeral wetlands (Platt and Wright 1992). Features consistent with periodic exposure include intercalations of allochthonous material, brecciation, pulmonate snails, layers of reworked shells, and thin zones of cementation. Features consistent with periodic inundation include burrows, fossil pulmonate snails reworked into layers, root structures, and colour mottling.
The calcilutite filling wetland basins is an intra-basinal accumulation, i.e., it does not occur under the beachridge/dunes, nor outside the margin of a given wetland. Itsmudstone fabric suggests low energy sedimentation. Absence of lamination and the abundance of root and burrow structures grading to homogeneous sediments, implies bioturbation of sediments, and low salinity, oxygenated, bottom waters (Platt 1989).
241WETLAND STRATIGRAPHY

Figure 6-58. Particle size distribution of carbonate mud in the Becher area. Size classes after Wentworth-Udden in Folk (1974).
242 C. A. SEMENIUK

Lake carbonates, formed through biogenic or bio-induced precipitation in shallow water elsewhere, suggest that carbonate production is the result of one of the following processes (Flugel 1982; Wetzel 1983; Scholle et al. 1983, Anadon et al. 1991):
1. bioherms built by blue/green algae and cyanobacteria 2. aggregates of molluscan or ostracod shell material 3. carbonate encrustation of reeds or other macrophytes through photosynthetic
uptake of carbon dioxide.
In the Becher Suite wetlands the mud is formed from the in situ disintegration of carbonate materials within the wetland basins. In scientific literature, the carbonate muds most closely approximating those at Becher were freshwater marls of Holocene age in an alluvial landscape in Maryland (Shaw and Rabenhorst 1997). The marl had formed in ponds through inorganic and biogenic processes associated with the green algae Chara sp. and contained gastropods, bivalves, and algae, resulting in extremely high calcium carbonate content. Chara sp. accumulates carbonate internally through metabolic processes and externally by photosynthetic removal of CO
2(Scholle et al.
1983). Much of the calcite formed from Chara may not be recognisable as biological remains, although the calcareous cortication tubules, reproductive organs and stems (Fig. 6-59) are preserved in low energy environments (Bathurst 1981, Scholle et al. 1983). In these settings, the stems can act as nucleation sites for precipitation of calcium carbonate, which overprints their original geometry. In Maryland, the marl development was intermittent and interspersed with buried soil horizons with higher organic content (Shaw and Rabenhorst 1997). This sedimentary sequence is similar to those in the Becher wetlands. The intermittent nature of the marl development is a plausible explanation for the occurrence of the calcilutaceous muddy sand layer underneath the buried soil in wetland 162. It appears that early in the development of this particular wetland, conditions conducive to calcilutite production temporarily ceased, and were replaced by organic accumulation as a result of macrophyte colonisation.
There were three phases of carbonate mud accumulation. The first phase, termed the inundation phase, denotes the period of regular seasonal wetland inundation as opposed to seasonal waterlogging. During this period, carbonate mud accumulated above the basement sands with the initial inundation of the proto-wetland. The second phase, termed the clogging phase, refers to the period in which the carbonate mud was subsequently washed into the underlying sand by rainfall and the fall of the water table, such that the pores of the basement sands became progressively filled with mud until illuviation was impeded. The third phase, termed the true fill phase, refers to the period in which the basement sands were relatively clogged and impermeable to illuviation, carbonate mud then began to accrete upwards.
243WETLAND STRATIGRAPHY

Figure 6-59. SEM photomicrographs showing various types of particles that comprise carbonate mud (silt and clay).
244 C. A. SEMENIUK

Fig
ure
6-60
. Seq
uenc
e of
SE
M p
hoto
mic
rogr
aphs
sho
win
g gr
adat
ion
of a
lgal
and
inve
rteb
rate
ske
leto
ns c
orro
ding
and
dis
inte
grat
ing
toca
rbon
ate
silt
and
cla
y.
245WETLAND STRATIGRAPHY
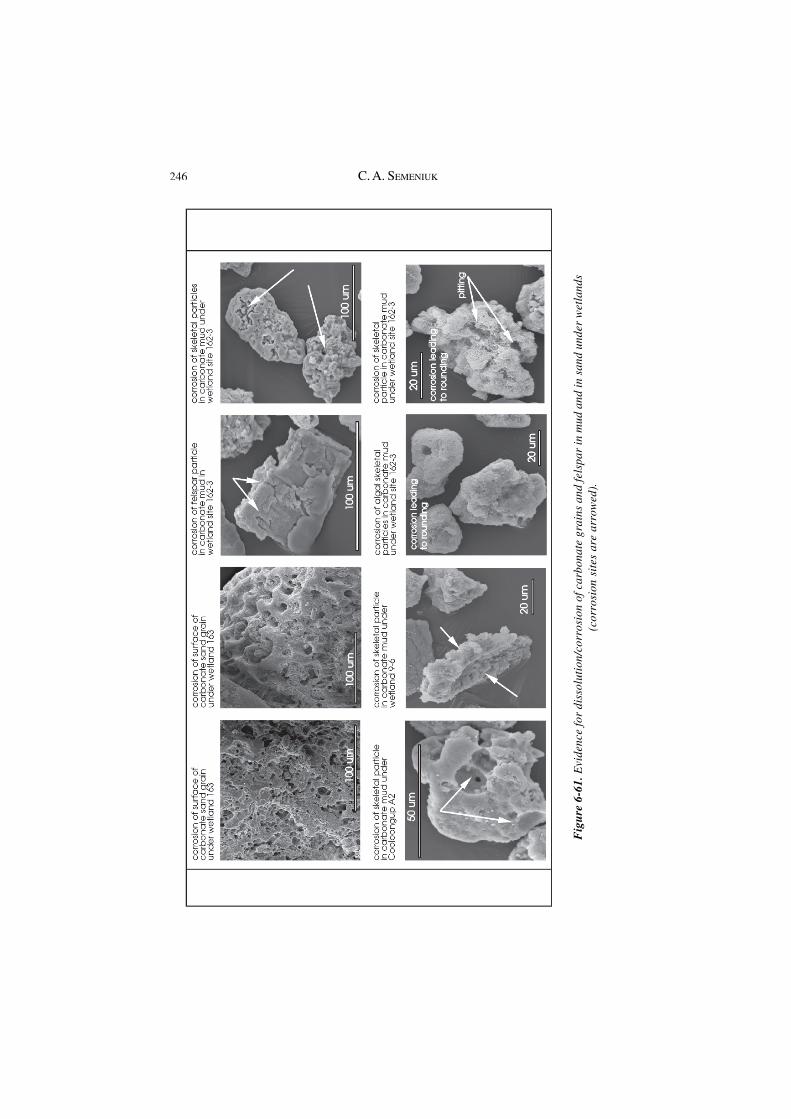
Fig
ure
6-61
. Evi
denc
e fo
r di
ssol
utio
n/co
rros
ion
of c
arbo
nate
gra
ins
and
fels
par
in m
ud a
nd in
san
d un
der
wet
land
s(c
orro
sion
sit
es a
re a
rrow
ed).
246 C. A. SEMENIUK

6.4.3 Peat and humus deposits Black mud sized decayed plant material (peat and humus) is currently being generated in all wetlands, covered by a 2-3 cm surface layer of decaying and undecayed stems, leaves and seeds. This decayed plant material forms peat in the sumplands and humus in the damplands. Minimum inundation required to maintain production of peat appears to be 6-7 months per year. As these conditions are not consistently fulfilled in all wetlands, the rate of accumulation is variable. In most wetlands, peat deposits are only 10 cm thick, however, in wetland WAWA, the peat fill is 50 cm. The rate of accumulation in wetland WAWA was 0.23 mm/year which is lower than the rate calculated for the surface sediments. The base of the peat in wetland WAWA was dated circa 2,200 14C yrs BP, however, this date does not represent the commencement of peat accumulation in all Becher Suite wetlands. Other wetlands at that time were environments in which calcium carbonate was accumulating, e.g., wetlands 135, 142, 35, 9, swi, swii, swiii.
The development and accumulation of peat is important in the history of a wetland in that its occurrence will alter the water chemistry within wetlands. Groundwater residing in the calcareous beach or dune sand, or the overlying wetland fill of carbonate mud deposits has pH 8-8.5. As the groundwater rises to the surface, there is a change from calcium carbonate saturated waters to waters containing humic acids resulting in pH 7-7.8.
6.4.4 Subsidence of wetland through dissolution of carbonate In the majority of wetlands, calcilutite accumulation has been replaced in near surface layers by varying thicknesses of peat and humus. This effect is attributed to a change in saturation with respect to the carbonate ion (indicated by a lower pH value) of the groundwaters. A coincident change in water penetrating the surface layers has also occurred. In the older wetlands, the oxidation of organic matter in the sediments has increased the hydrogen activity of the surface water, so that it is now approximately pH 7. Dissolution of carbonate is indicated by a decrease in pH to 7 and an increase in Ca ions (Scholle et al. 1983). When the pore fluids in the surface layers are undersaturated with respect to carbonate mineralogy, the carbonate sediments in and underlying these horizons undergo dissolution (Tucker and Wright 1990). AbundantCO
2 in solution and organic acids formed by decay dissolves carbonates. As a result,
there has been, for the Becher wetlands, an on-going loss of wetland sediment in the older wetlands through dissolution of carbonate grains. The geometry of the area or zone of dissolution suggests that this fluid moves as a plume through the wetland sediments and then westwards.
Evidence for this, involving relative heights of the contact between beach and dune sediments under beachridge/dunes and wetlands, comparison of carbonate to quartz grain ratios under beachridge/dunes and wetlands, wetland WAWA stratigraphy, and SEM photographs of carbonate mud particles, is described below.
247WETLAND STRATIGRAPHY

Evidence for dissolution and subsidence In the older wetlands, there is a difference between the upper level at which the beach sediments occur under the beachridge/dunes and that under the wetlands, with the contact lower under the wetlands. This difference ranges from 20-105 cm in wetlands 161, 162, 163, WAWA, 142, 135, 136, (Figs. 6-26 to 6-32B). In contrast, the younger wetlands exhibit a relatively consistent upper level of the beach sediments under beachridge and wetland (Figs. 6-33 to 6-42B). This difference in height of the upper level of beach sand solely under wetlands suggests subsidence and signals a stratigraphic thickening of wetland sediments.
Sediment samples were taken from the top of the beach horizon under the western ridge and the centre of four of the older and two of the younger wetlands. Three to five replicate samples were taken to investigate carbonate content in the sands, and to identify potential patterns, given the natural variability of grain composition in beach sediments. Theproportions, by weight, of carbonate grains, were ascertained for each site. Results are illustrated in Figure 6-62. Natural variability in carbonate content of beach and dune sands was quantified by sampling at various sites and depths within the present beach and foredune units (Fig. 6-63).
In the youngest of the wetlands sampled, (swiii), there was no clear difference between carbonate content under the ridge and the wetland. In all other wetlands sampled there was an important difference in mean carbonate content between sites, indicating loss of carbonate from the beach sediment under or within the wetland basal sheet. The maximum difference was found in wetland WAWA which has the greatest development of organicand peaty material. Natural variation in the beach and dune sediments between sites and down profile was < 3%. Variation in carbonate content between replicate sites under most wetlands (excluding swiii), was circa 10%, indicating that the dissolution process is incomplete. Again, the variation was greatest in wetland WAWA (93%).
Wetland WAWA contains 70 cm of mud, sandy mud and muddy sand. The sand fraction is quartz dominated (80%), with a small component of carbonate material. The mud fraction is dominated by peat throughout, again, with a small component of calcilutite and quartz. This composition starkly contrasts both with the composition of other older Becher Suite wetlands, such as wetlands 161, 162, and 163, and with the composition of the basement and beachridge sands. The development of a substantial body of peat, commencing circa2,200 14C yrs BP has influenced the water chemistry to the degree that carbonate dissolution and replacement in the buried beach sediment layer is almost complete in the central basin. Calcilutaceous muddy sand layers are still present as remnants at the margins and in the basal sheet of wetland WAWA (Fig. 6-29A, B).
In wetland WAWA, the pattern exhibits two different levels of the beach/dune contact under the wetland. A stepped pattern results where the stratigraphic sag is greatest under the central wetland, and intermediate under the wetland margins.
248 C. A. SEMENIUK

Figure 6-62. Comparison of calcium carbonate content in the upper beach horizons beneath ridges and wetlands.
249WETLAND STRATIGRAPHY

Fig
ure
6-63
. Car
bona
te c
onte
nt o
f rep
lica
te s
ampl
es o
f bea
ch a
nd d
une
sand
in s
hort
ver
tica
l pro
file
s (2
0 cm
dee
p) a
t Nor
th B
each
and
Sou
thB
each
.
250 C. A. SEMENIUK

This implies different rates of dissolution across the wetland. The different rates may be explained by the variation in the length of time (residency time) the peat has been present, and by the thickness of the peat deposits.
SEM photographs of sand grains under the wetlands and carbonate mud particles selected from various sites and levels within the calcilutite deposits showed evidence of dissolution (Fig. 6-61). A range of sampling sites and levels within the calcilutite deposit were selected to differentiate the effects of relative age of the calcilutite, and the proximity of the mud to peat (Table 6.10).
Table 6.10 Sites and levels sampled and criteria for selection
Collection site for calcilutite Criteria for selectionCooloongup A2 10-40 cm old, non-peat162-3 40-50 cm medium, non-peat9-6 20-30 cm young, minor peat 162-3 10-20 cm peat overlying calcilutite161-3 0-10 cm OME calcilutite
Carbonate grains at all sites showed varying degrees of dissolution. Surface features on the mud sized skeletal particles resulting from corrosion included layering, cavities, surface pitting and rounding (Fig. 6-61). A gradation was evident in grain size from medium to fine silt to clay as a result of continuing corrosion and disintegration of algal and invertebrate skeletons (Fig. 6-60). Visual comparison of the photomicrographs highlighted the variable degree of dissolution between the end member samples, i.e., there was less dissolution evident in non-peat samples, however, the effects of dissolution on samples 161-3, 162-3 (10-20 cm) and 9-6 could not be differentiated.
Dissolution of carbonate grains appears to be widespread. The process of dissolution is presently buffered at some sites by the relative thickness of the carbonate mud deposits. At other sites where the calcilutite deposits are shallow, or where the peat or humic material is well developed, the process is more significant. The result of dissolution grain by grain is a net removal of carbonate from carbonate mud and carbonate sand layers under wetlands, and a consequent subsidence of the wetland fill deposits. Locally, when the rate of subsidence is greater than the rate of fill by sediment accumulation, there may be deepening of the wetland. This, in turn, facilitates more frequent inundation, which increases the peat productivity and accelerates the process.
While there is abundant evidence for dissolution of carbonate grains, there is also some evidence of carbonate re-precipitation forming local crystallographic overgrowths evident as small carbonate crystal terminations. However, SEM photographs show that these also are later corroded.
251WETLAND STRATIGRAPHY

Fig
ure
6-64
. Pro
cess
es le
adin
g to
the
deve
lopm
ent o
f thr
ee ty
pes
of m
uddy
san
d ba
sal s
heet
s, v
iz.,
thin
bas
al s
heet
s, th
ick
basa
l she
ets,
and
thic
k ba
sal s
heet
s w
ith
vari
ably
pre
serv
ed b
urie
d hu
mic
san
d (s
oil)
laye
rs.
252 C. A. SEMENIUK

6.5 Discussion
Discussion centres around four points: the variety of wetland fills; their heterogeneous nature; wetland deepening through grain dissolution; and the effect on sedimentation of rainfall variability. The wetland deposits in the Becher Suite wetlands are shallow in comparison to many on the Swan Coastal Plain and elsewhere. Contemporaneouswetland fills as well as ancient palustrine carbonate deposits in the geological record, for instance, attain thicknesses of several to tens of metres (Gore 1983; Mitsch and Gosselink 1986; Platt 1989; Platt and Wright 1992). However, the small and shallow deposits in the Becher wetlands contain abundant and varied small scale sedimentary features which, through careful analysis, reveal subtle information about their processes and intra-basin environments over the course of the middle to late Holocene.
There are three distinct types of wetland fill, muddy sand dominated, carbonate mud dominated, and peat dominated, and each type can be related to hydrological processes. While the muddy sand of the basal sheet, whether thin or thick, is generally succeeded by calcilutite deposition, if sand input has been continuous and mixed with calcilutite, a thick sequence of muddy sand can result, extending to the current surface of the wetland. This gradation from thin to thick basal sheet to a deposit dominated wholly by muddy sand is characterised by the shift from dominant intra-basinal mud accumulation infiltrated into the parent sands to the addition of extra-basinal sediments through sheet wash. In the latter situation, the accretion of the basal sheet may result from on-going import of sand which is continually clogged by accumulating mud, or it may result from independent phases of mud accumulation and burial by sheet wash with the resulting sediments later mixed by bioturbation (Fig. 6-64). While the basal sheet underlies all wetland fill sequences, calcilutite is the next most common wetland fill sediment and ranges in thickness from 5-60 cm from youngest to oldest deposit. Itis wholly an intra-basinal deposit. Ongoing calcilutite accumulation requires regular inundation by carbonate bearing waters (Miller et al. 1985). In the Becher cuspate foreland setting, these conditions were linked to sub-regional rising groundwater which occurred in response to seaward progradation of the cuspate foreland, while relative local rises in groundwater occurred in individual basins topographically lowered by carbonate dissolution in the underlying sands. Accumulation of calcilutite through breakdown of calcareous algae and skeletons was concomitant with bioturbation and resulted in a largely structureless calcilutite deposit (Fig. 6-65). Currently accumulating peat sediments range from OME calcilutateous layers, (via processes of illuviation and bioturbation), to wholly peat deposits (Figs. 6-65, 66). Peat in this setting indicates inundation by groundwater diluted by meteoric water, therefore most peat related sediments occur at the surface, and include a component of quartz and skeletal sand from sheet wash. Similar patterns, linking soil characteristics and types of water flows, were described by Miller et al. (1985). In this previous study, landscape position was also identified as a related factor. In contrast to this situation, the changes in hydrology
253WETLAND STRATIGRAPHY

Fig
ure
6-65
. Sed
imen
tolo
gic
proc
esse
s le
adin
g to
the
accu
mul
atio
n of
the
thre
e co
mm
on s
eque
nces
of w
etla
nd fi
lls.
254 C. A. SEMENIUK

Figure 6-66. Sedimentologic processes leading to the accumulation of a peat-dominated wetland fill.
255WETLAND STRATIGRAPHY

in the Becher wetlands were related to the effects of sedimentation processes and diagenesis in combination with short and long term climatic conditions.
The detailed description of the sedimentary stratigraphic sequences demonstrates that the sediments are heterogeneous in almost every sediment property, structure, fabric, texture, and composition. Most of the surface sediments (0-30 cm) are root structured, but to varying depths and degrees; several are brecciated. Thesecharacteristics contrast with middle sediment layers (30-60 cm) which are variously colour mottled, layered or homogeneous, and burrow mottled. Colour mottling, indicative of alternating oxygen rich to oxygen poor conditions, thin accumulations of reworked fossil pulmonate snails within the mud, homogeneous mixed compositional sediments interpreted to be the end point of bioturbation, and burrows produced by benthic or terrestrial fauna, or by roots, create textural and compositional layering. The lower layers of the sedimentary profile (60-120 cm), are root structured, burrow mottled or homogeneous. The most common structure is homogeneous, which indicates that less biological activity occurs here. However, in some sequences there is evidence of a second level of root structuring. In some of these examples, the roots are related to a palaeo surface but in other examples the roots represent the lower extension of extant plant assemblages. Minor burrow mottling also occurs.
The fabric of the wetland fill sequence generally changes down profile from mudstone through packstone to grainstone. Similarly, the texture of the wetland fill down profile changes from mud dominated to sand dominated. This simple pattern is sometimes modified by the input of washed sand into the surface layers. There are also differences between the wetlands in the rate of change down profile between textural types and respective ratios of mud to sand in any single layer.
The end members of the wetland fill: 1) peat 2) calcilutite and 3) calcilutaceous sand occur as separate layers, interlayered, and mixes. What is referred to as peat mud herein ranges from true peat to muck, a highly organic enriched sediment (Collins and Kuehl 2001). The calcilutite is composed of silt to clay sized calcitic biogenic grains. The calcilutaceous sand is composed of quartz and skeletal fragments, the latter component ranging from 30-80% (Woods 1984, this study). Heterogeneity of the three compositional types is increased through diagenetic overprints such as cementation and carbonate dissolution.
Carbonate grain dissolution has been well documented in limestones (Logan 1974; Purser and Schroeder 1986; Rao 1996) and more recently in dune slacks (Grootjans etal. 1996), but has not previously been linked to wetland deepening. In the Becher wetlands, carbonate dissolution, sagging of the wetland floor, and organic sediment accumulation mimic the processes of cut and fill. The zone of dissolution is most pronounced under the centres of the wetlands where the topographic surface is lowest, inundation is more frequent (greater peat development) and vertical movement of water dominates. In two of the wetlands (161 and 135), the zone of dissolution is most
256 C. A. SEMENIUK

pronounced under the western margin of the wetlands, and it is here that there is evidence of wetland sag in the cliffed or stepped nature of the edge of the wetland fill (wetlands 161, 162, WAWA). The western edge in each of the wetlands cited is comparatively steeper than the corresponding eastern edge (Figs. 6-26, 27, 29B). Underthe eastern ridge of several wetlands, the occurrence of wetland sediments at levels higher than the present level of inundation, also testify to wetland sagging (Figs. 6-26, 27, 28, 31). Carbonate dissolution has occurred in all wetlands where accumulation of peat or organic matter has occurred, however, in the damplands (wetlands 142, 72, 63, swi, swii and 1N) and in the younger wetlands (swiii, and 9-3, 9-6, 9-14) subsidence, although occurring, has been subdued.
Another important effect on sedimentation and the distribution of sediment types in the wetlands has been rainfall variability. Variability in the rainfall this century has caused changes in seasonal cycles i.e., in frequency of inundation and length of hydroperiod. Periods of below average rainfall have changed annual seasonal inundation to annual seasonal waterlogging, i.e., sumplands have taken on the characteristics of damplands. During these drier periods, there has been a net import of sand into the wetland basins, through aeolian processes and sheet wash. Duringwetter periods, the frequency of such processes is likely to diminish as vegetation density increases on the adjacent beachridge/dunes, and more wetland basins are likely to experience regular and longer periods of inundation. Processes associated with inundation will proliferate, i.e., peat development, dissolution of carbonate materials.
Longer term variability in rainfall is also evident in the changing areal extent of wetland sedimentary deposits. Many of the wetland sediments extend beyond the current wetland boundary, e.g., WAWA and 163. Some of these sediments are buried and some are at the surface currently being modified by pedogenic processes. In wetlands where subsidence is minor (wetland 142, 136, 63, 9-11), sediments at levels above the current level of inundation or waterlogging indicate higher palaeo water levels. Inwetlands where subsidence is pronounced, this cannot be assumed, however, the greater lateral extent of wetland sediments in some wetlands does indicate periods in which wetland processes were more extensive. Similarly, there have been periods in which sheet wash from the beachridges has buried wetland sediments, contracting the size of the basin (wetlands 163, 135). During the subsequent return to more humid conditions, wetland processes have altered these dune sands through the accumulation of interstitial mud, bioturbation and infiltration (Fig. 6-64).
257WETLAND STRATIGRAPHY