the behavior of the trace elements in coal during pyrolysis archive/files/merge/vol-47... · the...
TRANSCRIPT

Fuel Chemistry Division Preprints 2002, 47(1), 201
THE BEHAVIOR OF THE TRACE ELEMENTS IN COAL DURING PYROLYSIS
Ruixia Guo, Jianli Yang, Dongyan Liu and Zhenyu Liu
State Key Laboratory of Coal Conversion, Institute of Coal Chemistry Chinese Academy of Sciences, P.O. Box 165, Taiyuan, Shanxi 030001,
P.R. China Introduction Coal is a cheap and the most commonly fuel in China. However, coal contains trace hazardous elements of environmental concerns in ppm order, such as As, Pb, Cr, Cd, and Mn. The presence of the elements can have a great influence on coal utilization processes. The most important effects are related to coal combustion and the environmental impact resulted from the thousands of tonnes of solid emitted into the atmosphere. For example, the release of the trace elements from coal as vapor or fine particles during combustion causes causes potentially toxic to plants, animals and human health and pollution to ecological environment under certain conditions and concentrations1-3. The formation of the technology for the coal utilization units requires the understanding of their occurrence in coal, their behavior during and prior to combustion and their form in the stack gas. Recently, many of researchers have concentrated on behavior of trace elements during combustion and post-combustion3-7. Their investigation on the transformation of trace elements during coal combustion have shown that the volatility of trace elements depends on their affinities and concentrations, and on the physical changes and chemical reaction of these elements with sulfur or other volatile elements during combustion. The main purpose of this study is to understand the transformation of As, Pb, Cr, Cd, and Mn during coal pyrolysis. The effects of pyrolysis temperature and coal type were investigated. In addition, thermodynamic analysis was also further carried out. Experimental
Three Chinese coals, Datong, Shenhua and Yima, were used in this study. The coals were crushed and sieved to 0.16~0.27mm, and then dried under vacuum at 110oC with a nitrogen purge. The properties of coals are given in Table 1.
Table 1. Analysis of coal samples•wt%
Proximate analysis
Ultimate analysis•daf Ash analysis Coal
sample Vad Ad M
C H N S Oa
Si Al
Shenhua 30.71 6.61 0.51 63.77 3.81 0.79 0.57 31.06 27.8 5.9
Yima 30.24 15.79 0.79 58.88 2.94 0.65 1.94 35.62 30.1 10.0
Datong 26.86 13.58 0.61 67.62 4.18 0.72 2.03 25.45 25.4 11.3 Note: a: by difference Pyrolysis experiment was conducted in a fixed bed quartz reactor under N2 stream with a heating rate of 20oC/min. The temperature ranges from 500oC to 1000oC. As, Pb, Cr, Cd, and Mn contained in char and raw coal were measured by inductively coupled plasma-atomic spectroscopy (ICP-AES). The concentrations of elements in three raw coals are presented in table 2. Bleeding ratio (BR) was defined as:
It was used to evaluate the change of the trace elements in coal during the treatment.
Table 2. The concentration of trace elements in three coals•µg/g coal
Coal sample As Pb Cr Cd Mn
Shenhua - 6.2 3.2 - 70.5
Yima 40.3 12.6 15.6 1.28 40.4
Datong 8.6 8.8 6.2 0.25 49
Results and discussion
Transformation of trace elements with temperature. As shown in Fig 1(a), the large amount of As and Cd is released from Datong coal at relative low temperatures of 500oC, while the temperature for lead release is above 800oC. The lesser emission of Cr and Mn during pyrolysis implies that these elements may be retained by aluminosilicate, or was initially existed as more stable forms in raw coal8. The bleeding ratio was plotted versus the yield of volatiles (tar +gas) in Fig 1(b) for Datong coal. The points are divided into two parts by the diagonal line l. The points at the upper part represent the char with a concentration of trace elements lower than that in raw coal and the points at the lower part represent the char with a concentration of the trace elements higher than that in raw coal. As shows that the concentration of As, Cd and Pb in char decreased to lower than that in raw coal with increasing the yield of volatiles. This indicates that the majority of these elements vaporized by heat treatment. Cr and Mn concentration in all the chars, however, are higher than that in raw coal, which indicate their relative non-volatility.
Effect of coal type. The bleeding ratio of trace elements in 1000oC char with coal type is shown in Fig 2. This was examined for Pb, Cr, Mn in three coals and for As, Cd in Yima and Datong coals.
%100coalin ionconcentrat
yieldchar charin ion concentrat-coalin ion concentratBR(%) ××=
Fig. 1 Effect of temperature on release of trace elements for Datong coal (ο) As; (∆) Cd; (×) Pb; (+) Cr; (∇) Mn
500 600 700 800 900 10000
10
20
30
40
50
60
a
blee
ding
rat
io,%
pyrolysis temperature,oC
0 10 20 30 40 50 600
10
20
30
40
50
60
ble
edin
g ra
tio, %
b
yield of volatiles,%

Fuel Chemistry Division Preprints 2002, 47(1), 202
As indicated the bleeding ratios of Pb, Cr, Mn for Shenhua coal were the highest. Among the five trace elements considered, Lead was the most volatile element at pyrolysis temperature of 1000oC. Arsenic and cadmium were next volatile elements with bleeding ratio of 51.8% and 38.8% for Datong coal and 30.1% and 27.2% for Yima coal. For a given element, the bleeding ratio varies with the coal type. This may be caused by the difference in the chemical composition of the raw coal, both element-containing compounds and the relative compounds
Thermodynamic behavior of trace elements.
The element volatility behavior is related with boiling point of the element and of the relative compounds. The high volatility of the element is often related to the low boiling points and compounds. Boiling points of trace elements considered and their relative important compounds are presented in table 3. It can be seen that boiling points for Mn element and compounds are higher than the pyrolysis temperature studied. It is consistent with the lower bleeding ratio of Mn. Although the high boiling points of oxides, sulfides for Pb, Cr and Cd are relatively high, the boiling points of chlorides for these elements plus As are lower than the pyrolysis temperature range studied. Thus it may conclude that the formation of chlorides during pyrolysis promotes the emission of the elements. Due to high boiling points of element, oxide and sulfide, Pb is non-volatility. However, it can be transformed into Chloride at high temperature of 1100K by gasification-agglomeration effect9. This accelerates Pb emission. Moreover, this is consistent with the experimental result that bleeding ratio of Pb increased quickly above 800oC. As and Cd are both volatile elements based on the boiling points of elements and their oxides.
Table.3. Boiling point of trace elementsand their compounds, oC
kind Element Oxide Sulfide Chloride
Pb 1740 1535 1281 953
As 814 461 707 130
Cd 765 >920 1382 964
Cr 2672 2275 1550 950
Mn 1900 1650 1190
Furthermore, formation of their chlorides can also result in more emission for As and Cd from coal. However, the elements did not release completely during pyrolysis. This suggests that some of As and Cd may be existed in more stable structure in coal or chlorine content
in coal is limited. Compared with Pb, As, and Cd, however, Cr is non-volatility element. This accords with the fact that high boiling points of element and compounds for Cr, especially that its chlorides is hardly to be formed at 1100K.
Conclusions The behavior of trace elements observed in this study was dependent upon both coal type and pyrolysis parameters. The amount of trace elements emissed during pyrolysis increased with increasing temperature. Although Pb, As and Cd were volatile, their volatility varies with coal type. This indicates that the volatility is related with the form of the elements occurred in raw coal. Cr and Mn were relatively non-volatile elements under the conditions tested. Further work identifying the relationship between volatile and elemental form in raw coal, particularly for the elements Pb, As, and Cd is clearly needed. Acknowledgement. The authors gratefully acknowledge the financial support from the Special Founds for Major State Basic Research Project, the Chinese Academy of Sciences, and the Natural Science Foundation of China
. References (1) Eble, C. F.; and Hower, J. C. Fuel, 1997, 76 (8), 711 (2) Feng, Xinbin.; Ni, Jianyu.; and Hong, Yetang. Environmental Chemistry,
1998, 17 (2), 148. (3) Swaine, D.J. J. Coal Qual. 1989, 8, 63 (4) Constance, L.S.; Lawrence, E.; Joseph, R.M. Fuel Processing Technology,
2000, 63, 109 (5) Querol, X.; Fernandez-Turiel, J.L.; and Lopez-Soler, A. Fuel, 1995, 74 (3),
331 (6) Querol, X.; Juan, R.; Lopez-Soler, A.; and etc. Fuel, 1996, 75, 821 (7) Palmer, C.A.; Mroczkowski, S.J.; Finkelman, R.B.; Crowley, S.S.; and
Bullock, J.H. In Proceedings of the Fifteenth Pittsburgh Coal Conference (CD-ROM); 1998
(8) Raask, E. In Mineral Impurities in Coal Combustion; Hemisphere Publishing; London, 1985; pp.293-312.
(9) Wang, Xifen.; Sun, Xuexin.; and Li, Min. Coal Conversion, 1999, 22(1), 58
As Cd Pb Cr Mn0
20
40
60
80
Ble
edi
ng r
atio
, % Yima coal
Datong coal Shenhua coal
Fig. 2 Effect of coal type on bleeding ratio of trace elements

Fuel Chemistry Division Preprints 2002, 47(1), 181
CATALYTIC PYROLYSIS OF N-HEXANE FORETHYLENE PRODUCTION OVER MORDENITE
ZEOLITES MODIFIED BY METAL OXIDES
Jian Zhenga, Jialu Dongb, Weifeng Zhangb, Qinhua Xub,Chunshan Songa
a The Energy Institute & Department of Energy & Geo-Environmental Engineering, Pennsylvania State University,209 Academic Projects Building, University Park, PA16802
b Department of Chemistry, Nanjing University,Nanjing 210093, P.R. China
IntroductionThermal cracking (pyrolysis, or so-called steam cracking) of
various hydrocarbons at high temperature (1073-1123 K) for theproduction of lower C2-C4 olefins has been one of the coreprocesses in the petrochemical industry. Besides the large amountof energy consumed in this pyrolysis process, anotherdisadvantage is the difficulty for this process to control theolefins formed, especially the lower yield to ethylene. Therefore,pyrolysis of hydrocarbons in the presence of catalysts1-6,allowing preparation of lower olefins at lower temperature andwith higher selectivity, is a subject of some studies.
The search for catalysts that promote hydrocarbon crackingstarted in the late 1960s. Till now, the catalysts found active todifferent extent can be typically classified into three types, i.e.,acidic catalysts (amorphous silica-alumina or zeolite crystalline),basic catalysts (such as CaO-SrO-Al2O3, KVO3/corundum etc.) andtransition metal oxide catalysts (e.g., Cr2O3/Al2O3), which are usedunder the non-aerobic or aerobic conditions3. Three catalyticpyrolysis processes, namely Vniios process in Russia (usingKVO3/corundum catalyst), Asahi process in Japan and the deepcatalytic cracking (DCC) process in China (both using ZSM-5zeolite modified with Al and Cr), have been developed6. However,they are still far from replacing the conventional pyrolysistechnique, and it is therefore worthy exploring approaches tofinding highly efficient catalyst system for preparing C2-C4
olefins.In this work, we studied the acid-base and catalytic properties
of a series of Mordenite zeolites for the pyrolysis of n-hexane, andmodified the least acidic Na+ type Mordenite by supporting basicmetal (such as alkali, alkaline earth) and reductive transition metaloxides. The reaction mechanisms for different catalysts have beendiscussed.
ExperimentalSample Preparation. Sodium-type Mordinite zeolite
(NaM, the unit cell composition: Na6.23H0.02Al6.25Si41.75O96) waspurchased from HongGuang Molecular Sieve Co., Dalian, China.Three NaHM zeolite samples with different H+ content wereproduced by ammonium ion exchange of NaM zeolite at 353 K fordifferent times, each time for one hour, followed by calcinations at773 K for 5 hours. Proper amount of alkali (Li, K, Cs), alkalineearth (Mg, Ca, Sr), and transition metals (Cu, Mo, Mn, Ag, etc.)oxides were introduced into NaM zeolite by impregantion of therespective metal nitrate solutions at 353 K, followed bycalcinations at 973 K for several hours.
Characterization. The acidic and basic properties ofMordenite zeolites with or without metal modification wereanalyzed using NH3-TPD and CO2-TPD, respectively. Before theTPD experiments, all samples had been treated at 773K in N2 forseveral hours. The adsorption of NH3 or CO2 was saturated at roomtemperature, followed by purging with N2 at 333 K for at least onehour. TPD was then carried out at a heating rate of 12 K/min. Thereduction of transition metal oxides was characterized by
conventional TPR. All temperature-programmed studies werecarried out using a TCD detector, and the TPD or TPR peak signalswere recorded and calculated quantitatively.
Cata lys i s . Catalytic pyrolysis of n-hexane was performedin a continuous flow micro-reactor. N-hexane flew continuouslythrough the catalyst together with steam, with thesteam/hydrocarbon weight ratio to be 0.9 and the space velocity(WHSV) to be 3.6 h-1. The reactor temperature was 808K for barezeolite catalysts and 890K for metal oxide modified NaMcatalysts. The reaction products after TOS of 1 h were analyzed byon-line gas chromatography with a TCD detector and Porapak Qcolumn. Results were reported as conversions calculated as theweight percent of n-hexane reacted, molecular selectivity andyields, especially to ethylene.
Results and DiscussionThe curves of ammonia thermal desorption for NaM and three
NaHM zeolites (figures not shown) exhibit mainly two peaks:low-temperature peak with Tmax at 497 K, typically representativeof weak Lewis acid centers or cationic sites, and high-temperaturepeak with Tmax at 813 K, corresponding to strong Brönsted acidcenters. It is found that, the higher temperature peak increaseswith the proton content in the NaHM zeolites, while the samepeak can hardly be found in the case of NaM zeolite. Figure 1shows the catalytic pyrolysis results over the zeolites as afunction of acidic amount, which was calculated from the amountof the NH3-TPD peak at higher temperature. There is a clear trendthat, with the increase of zeolite acidity, the activity increaseswhile both the selectivity of ethylene and the ratio of (C1+C2)/C3
decrease. This is due to the well-known cracking reaction on acidiccatalysts, possibly via carbenium ion mechanism: the strongBrönsted acidic sites of NaHM zeolites protonate n-hexane to formcarbenium ions, followed by β-scission to form smallermolecules. According to this mechanism, C3 hydrocarbon andalkane would be the predominant cracking products rather thanethylene. Meanwhile, secondary undesirable reaction such asaromatization might occur between the olefin products and thecarbenium ion intermediates, and coke formation becomes severewith the increase of strong acidity.
Figure 1. Catalytic pyrolysis (808 K) results of n-hexane overMordenite zeolites with different acidic amount.� : Conversion of n-hexane; � : Yield of ethylene✧ : (C1+C2)/C3 Ratio.
0
10
20
30
40
0 0.5 1 1.5 2 2.5 3
Acidic Amount (mmol/g)
Con
v &
Sele
cti
vit
y (
%)
0
1
2
3
(C1+
C2)/
C3 R
ati
o

Fuel Chemistry Division Preprints 2002, 47(1), 182
In order to increase the ethylene selectivity, non-acidic NaMzeolite was selected, and basic metal oxide such as alkali (Li, K,Cs) and alkaline earth (Mg, Ca, Sr) were incorporated.
Figure 2 shows results of catalytic pyrolysis over metalsupported NaM zeolite catalyst as a function of base amount,which was calculated from the peak amount of the CO2-TPD(pictures not shown). It is interesting to find that with theincreasing basic sites introduced, both the activity and the yield toethylene increase. This is because the catalytic cracking over non-acidic or basic catalysts with steam conditions follows a freeradical mechanism, where the selectivity to alkene, especiallyethylene, increases when compared with the carbenium ionmechanism on acidic catalysts.
Figure 2. Catalytic pyrolysis (890 K) results of n-hexane overalkali and alkaline earth metal oxide supported Mordenite zeoliteswith different basic amount.� : Conversion of n-hexane; � : Yield of ethylene.
TPR profiles of different transition metal oxide supported onNaM zeolites (pictures not shown) differ from one another becauseof the difference in both the electronic state and the reducibility ofeach metal oxide. For example, the reduction of CuO/NaM starts atabout 500 K, while MoO3/NaM can only be reduced at temperaturehigher than 870 K. It’s therefore our intention to compare thecatalytic cracking results of these catalysts as a function of theirreducibility.
Figure 3 shows the results of the catalytic pyrolysis overtransition metal (Ag, Cu, Mn, Mo) oxides supported NaM zeoliteas a function of the starting temperature of respective TPR peaks.It can be found that, the metal oxides that are easier to be reduced(except MnO) show approximately higher catalytic acitivity andyields to alkenes including ethylene. It has been reported that,catalytic cracking over non-reducible transition metal oxidecatalysts such as Cr2O3/Al2O3 under aerobic conditions, i.e.,oxidative catalytic cracking, follows a free radical mechanism,where activated oxygen species abstract hydrogen fromhydrocarbons to form radicals3. Accordingly, high yields ofethylene would be expected3. The present work does not involveO2 during the catalytic pyrolysis. However, lattice oxygen inreducible transition metal oxide supported catalysts may exhibitthe similar free-radical oxidative catalytic cracking of n-hexane.The easier the metal oxide to be reduced, the higher extent of thisoxidative effect might have.
We also found that, if the transition metal oxide was reduced tometal, the catalytic activity decreased greatly. For example, the
conversion of n-hexane over PbO2/NaM and VO3/NaM catalystsare 57.2% and 37.0%, respectively. But for Pb/NaM and V/NaM,they are only 10.8% and 3.6%, respectively. This shows again theimportance for the existence of oxidative cracking.
Table 1 shows the catalytic pyrolysis over the sametransition metal oxide supported catalysts with or without steam.It can be seen that, in the presence of steam, the catalytic activityand ethylene selectivity decrease greatly. This indicates that steamplays an important role in keeping the transition metal oxides athigher oxidation state and therefore exhibiting the oxidativecatalytic pyrolysis for n-hexane.
Figure 3. Catalytic pyrolysis (890 K) results of n-hexane overalkali and alkaline earth metal oxide supported Mordenite zeoliteswith different basic amount.� : Conversion of n-hexane; � : Yield of ethylene.✧ : Total yields of alkenes.
Table 1. Results of catalytic pyrolysis of n-hexaneover MxO supported NaM in N2 or H2O
(890 K, WHSV 3.6 h-1, H2O/henxae ratio 0.9, TOS 1h)Conversion (%) XC2H4 (%)* Yalkene (%)*Cat.
a b a b a bAg2O/NaM 28.0 53.0 34.3 33.6 19.8 40.6
CuO/NaM 28.6 48.5 20.2 36.0 19.4 38.2
MnO/NaM 26.3 51.4 31.0 35.5 19.4 43.7
MoO/NaM 11.8 37.5 38.8 41.0 8.5 30.4
*XC2H4: Selectivity to ethylene; Yalkene: Yield of alkenes.a: Reaction in N2; b: Reaction in H2O
Acknowledgement . We are grateful for the financial supportsfrom National Natural Science Foundation of China, SINOPEC, andthe Pennsylvania State University.
References(1) Le Van Mao, R.; Melancon, S.; Gauthier-Campbell, C.; Kletnieks, P.
Catal. Lett. 2001, 73, 181-186.(2) Erofeev, V. I.; Adyaeva, L. V.; Ryabov, Yu. V. Russ. J. Appl. Chem.
2001, 74, 235-237.(3) Yoshimura, Y. et. al. Catal. Surv. Japan, 2000, 4, 157-167.(4) Shi, Z.; Zhang, F.; Liu, S. U.S. Patent 6,211,104, April 3, 2001.(5) Xie, C.; Li, Z.; Shi, W.; Wang, X. U.S. Patent 6,210,562, April 3, 2001.(6) Picciotti, M. Oil & Gas J. 1997, 97, 53-58.
10
20
30
40
50
60
0 0.1 0.2 0.3 0.4 0.5 0.6 0.7
Basic Amount (a.u.)
Con
ver
sio
n (
%)
0
10
20
30
40
50
Eth
yle
ne
Yie
ld (
%)
LiK
CsMg
Ca
Sr
0
10
20
30
40
50
60
300 400 500 600 700 800 900 1000
Reducible Temperature (K)
Co
nv
& Y
ield
(%
)
Ag Cu MnMo

Fuel Chemistry Division Preprints 2002, 47(1), 173
A COMPARISON OF PRODUCT PROFILESFROM AQUEOUS PYROLYSIS OF SELECTED
BIOMASS AND WASTE MATERIALS.
Tanja Barth
Department of Chemistry, University of Bergen, Allégaten 41, N-5007 Bergen, Norway
IntroductionConversion of biomass and waste into fluids could provide a
sustainable alternative to increased use of fossil fuels.Alternatively, synthetic chemicals could be produced fromrenewable resources instead of petroleum, with a positiveenvironmental effect. However, many types of widely researchedprocesses of biomass pyrolysis do not give liquid products that arecompatible with petroleum fluids. Since this would make theintroduction of alternative fuels and raw materials much easier, astudy of pyrolysis in an aqueous reaction medium aimed atoptimising the yield of hydrocarbon-rich fluid products has beenmade.
Three types of clean vegetable biomass and five types oforganic rich waste materials have been pyrolysed in batch reactorsin the presence of excess water. Experimental designs covering arange of conditions with regard to temperature, duration, watercontent and catalysts have been used with the aim of maximisingthe yields of liquids, and providing a maximum of the hydrocarbonfractions or petroleum compatible liquids. The gas, organic-,aqueous and solid phase products have been fractionated, quantifiedand analysed to provide yield profiles and mass balances.
ExperimentalBatch pyrolysis experiments were performed in 21 ml
stainless-steel autoclaves. The pyrolysis conditions were variedin the ranges given in Table 1. The biomass samples were cleanwood and Miscanthus, various sewage sludges and industrial by-products. A fractional factorial design was used for each biomasstype. 1 M aqueous solutions of KOH or NaOH were used ascatalysts. Addition of zeolites and other solid catalysts were alsotested. More than 200 experiments have been performed.
Table 1: Pyrolysis ConditionsParameter Range———————————————————————————Temperature 320 - 500 °C (mostly 340-380 °C)Duration 3 - 96 hours (mostly 6 and 17 hours)Amount of biomass 0.2 - 4 g (mostly 0.5 -3 gram)Amount of water 0.5 -15 ml (mostly 2.2 - 9 ml)Catalysts———————————————————————————
The fluids were extracted and quantified gravimetrically, andfractionated into asphaltenes and oils by n-hexane precipitationand further separated in a silica micro-column to givehydrocarbons and a polar fraction. The coke yield was determinedby weight and TOC measurements. The gas-phase and aqueousproducts were also analysed and quantified. A mass sum ofrecovered products was calculated from each experiment.Multivariate data analysis is used to relate the yield profiles to theexperimental conditions.
Results and DiscussionThe product profiles are a function of the experimental
conditions, with a high water-to biomass ratio giving a high yield
of liquids relative to coke. The biomass stating material is ,however, the dominating factor for the products. The maximumliquid yields are obtained from degraded sludges with high organiccontents, while vegetable biomass produces more coke andasphaltenes, and relatively more of the polar fractions in theliquids. Figure 1 shows the liquid yields from 1 gram of fourbiomass types after pyrolysis at 380 ºC for 17 hours.
The reaction conditions can alternatively be optimised togive aqueous short-chain organic acids as the major product.Addition of a base together with excess water suppresses cokeformation completely, but increases thee yields of aqueous organicacids and CO2 by “capture” in the aqueous phase. Hydrocarbongases are minor products at all conditions tested.
Addition of homogenous and heterogeneous catalystschanges the yield profiles significantly, but the effects are oftennot the same for the different starting materials. The addition of abase improves the yields from the vegetable biomasses, but has aslight negative effect for the sludges. The presence of potassiumion results in significantly improved hydrocarbon yields in mostsystems.
0
50
100
150
200
250
300
350
400
450
500
1 2 3 4
mmmmgggg////gggg oooorrrrggggaaaannnniiiicccc mmmm....
H-C
Polars
AsphCoke
Figure 1. Examples of liquid yields from four biomass types at380 ºC for 17 hours, with 1 g of dry biomass to 9 ml water in a 21 mlreactor.H-C: Hydrocarbon fraction.Sample 1: Clean woody biomass with 1 M KOHSample 2: Miscanthus stem with 1 M KOHSample 3: Sewage sludge from a chemical treatment plant with 1 M NaOHSample 4: Sludge from an industrial bio-filter with 1 M NaOH
C o n c l u s i o n sSolid biomass and organic wastes are converted to liquids in
high yields by pyrolysis in autoclaves in excess water. Theproduct is a petroleum-like fluid, but contains more non-hydrocarbon compounds than crude oils. However, thecomposition of the fluid is very dependent upon which rawmaterial is being used, and on the reaction conditions. Thefollowing systematic relationships are observed from theexperimental designs:
• The initial biomass composition determines the reactionpathways and product spectrum in pyrolysis in aqueousconditions.
• Degraded biomasses give the highest yields of fluids.• Excess water as reaction medium increases the fluid
yields for most biomass types.• High carbohydrate biomass types produce high coke
yields in the absence of potassium and base.• Degraded biomass gives high fluid yields with no base
added.Further optimisation on specific raw materials has a good
potential for providing petroleum compatible sustainable fuels.

Fuel Chemistry Division Preprints 2002, 47(1), 174
Acknowledgement . Funding from the European energyresearch program JOULE (Contract JOR3-CT97-0176) is gratefullyacknowledged.

COPROCESSING OF YANZHOU COAL WITH A
FCC SLURRY In order to understand the interaction between coal and slurry,
Yanzhou coal was coprocessed with the FCC slurry at two different coal/slurry ratios(2:1 and 1:2) under the four reaction conditions mentioned above. The THF and T conversions of coal alone and product yields (based on the overall feed) under different conditions were determined to reveal the effects of slurry. The conversions of the coal are summarized in Table 3.
Z. J. Wang, J. L. Yang, Z. Y. Liu
State Key Lab. of Coal Conversion, Institute of Coal Chemistry
Chinese Academy of Sciences, P.O. Box 165, Taiyuan, P.R.China Table 3. THF and T Conversion of Coal under Four Different
Reaction Conditions Introduction Although a number of processes for direct coal liquefaction
and coprocessing of coal with petroleum resid have been developed to produce liquid fuels, the liquids produced are still expensive compared with petroleum[1]. Principal factors responsible for the high cost of coal derived liquids are the high cost of hydrogen, the severe liquefaction conditions and the use of expensive catalysts, which are essential for high yield of liquids[2]. Recently, a partial liquefaction concept was proposed [3],with characteristics of low-severity conditions and comprehensive utilization of all liquefaction products. In the partial liquefaction concept, high coal conversion to liquids is no longer necessary, highly active but expensive catalysts are no longer needed, however, use of the heavy liquefaction product becomes a key issue in the overall process. Following this thought, we recently studied the heavy liquefaction product and found that asphalt produced from coprocessing of coal and fluidized catalytic cracking (FCC) slurry under mild conditions meets the properties of high grade paving asphalt[4]. FCC slurry, produced from fluidized catalytic cracking process at oil refineries, has a relatively high polycyclic aromatics content. It is costly to further process it to produce distillates, but it is an effective solvent for coal liquefaction and is good for production of high grade paving asphalt[4,5].
Conditions THF conversion% T conversion% coal * (2:1) * (1:2) * coal (2:1) (1:2) N2, without cat 16.9 17.3 32.0 15.8 16.5 1.5 N2, with cat 15.5 16.5 21.1 14.4 15.3 8.2 H2, without cat 38.3 62.8 71.8 35.3 44.8 27.4 H2, with cat 57.5 70.8 85.2 44.2 48.2 42.7 * (coal) means the results determined coal alone , (2:1) and (1:2) denote the coal/slurry ratios in the feed.
It can be seen that the THF conversion increases with increasing slurry content in the feed concentration. The slurry enhanced dissolution and dispersion abilities to coal radicals and preventing them to combine together to form solid unreactive residue, which results in increased THF conversions. It is also observed that the increase in THF conversion is more obvious in H2 atmosphere than in N2 atmosphere, which may be caused by the good H-shuttling capacity of FCC slurry. However, it is somewhat surprising that the T conversion at coal/slurry of 1:2 is far lower than that at coal/slurry of 2:1. Possible reasons are that: At coal/slurry of 1:2 condition, the high content of slurry provides good dissolving and dispersing ability for coal and more coal radicals are stabilized as preasphaltene, which could not undergo further cracking and results in decrease of T conversion. This work investigates the coprocessing of coal with a FCC
slurry under different reaction conditions. Coal conversions and product yields are studied to reveal the interaction between the coal and the slurry. The roles of catalyst and hydrogen are also discussed.
Change of product yields in coprocessing under different reaction conditions.
In order to further understand the interaction of coal and slurry in coprocessing, theoretical product yields are calculated according to the product yields when coal and slurry are treated individually under the same reaction conditions. The differences between the experimental and the theoretical values, obtained by subtracting the theoretic value from the experimental value, are summarized in Tables 4 and 5.
Experimental Yanzhou coal (Yanzhou, China) and a FCC slurry
(Shijiazhuang oil refinery, China) were used. Their characteristics were shown in Tables 1 and 2. Table 1. Proximate and Ultimate Analyses of Yanzhou Coal Table 4. Differences in product yields between experimental
value and theoretical calculation in N2 atmosphere Proximate anal. W/% Ultimate anal.W/% daf Mad Ad Vdaf C H N S O* H/C 2.49 7.14 45.43 81.80 5.86 1.25 3.49 7.60 0.86
Table 2. Ultimate Analyses of FCC Slurry C H N S O* H/C 89.77 7.86 0.42 0.75 0.50 1.05
Condition THF i preasph- asphalt oil <220oC (2:1)* without cat -0.2 -0.1 -10.2 2.6 8.0 (2:1)* with cat -0.6 0.1 -13.0 1.6 11.9 (1:2)* without cat -4.8 9.5 -8.4 0.5 3.2 (1:2)* with cat -1.7 3.7 -9.1 1.3 5.8
* by difference * The meaning of (2:1) and (1:2) are the same as in Table 3. Coprocessing experiments were performed under the
following conditions: (1) N2 atmosphere without catalyst, (2) N2 atmosphere with a ferrous sulfate-based catalyst impregnated on coal[6], (3) H2 atmosphere without catalyst, (4) H2 atmosphere with a ferrous sulfate-based catalyst impregnated on coal. During a typical run, 100g mixture of coal and slurry were charged into a 1-liter autoclave. The reactor was filled with N2 or H2 to a pressure of 4 MPa and then heated up to 400 oC for reaction. After one hour reaction at 400 oC, the autoclave was cooled with a fan to room temperature and the gases were vented. The liquid and solid products were collected and extracted with tetrahydrofuran(THF) and toluene(T) in sequence. The products were divided into following fractions: THF i(THF insolubles), preasphaltene(THF solubles, T insolubles), asphalt(>320 oC fraction of T solubles), oil(220-320 oC fraction of T solubles) and <220 oC fraction(including gases).
In N2 atmosphere (Table 4), less asphalt and more oil and <220 oC fraction are obtained in coprocessing, which means that there is a synergistic effect between the coal and the FCC slurry on production of oil and <220 oC fraction. It is also observed that, at coal/slurry ratio of 1:2, less THF insolubles and more preasphaltene were obtained, compared to those at coal/slurry ratio of 2:1, which suggests increased stabilization ability for coal radicals at high slurry content. However, more slurry also confines further cracking of coal radicals and leads to increased preasphaltene yield. It was found that addition of catalyst had no significant effect on changes of product yields in N2 atmosphere. Table 5. Differences in product yields between experimental value and theoretical calculation in H2 atmosphere Condition THF i preasph- asphalt oil <220oC (2:1)* without cat -15.8 9.2 4.4 1.7 0.5 (2:1)* with cat -7.7 5.6 4.5 -1.8 -0.6 (1:2)* without cat -10.0 13.2 -0.5 -2.0 -0.7 (1:2)* with cat -7.9 9.0 -5.8 0.4 4.3
The THF and T conversions of coal were calculated based on coal(dry and ash free) and by subtracting contributions of the slurry. Product yields were obtained based on overall feedstock. * The meaning of (2:1) and (1:2) are the same as in Table 3. Results and discussion Table 5 shows the differences in product yields in H2
atmosphere. Results suggest that the coal and the FCC slurry have THF and T conversions of coal
Fuel Chemistry Division Preprints 2002, 47(1), 192
Fuel Chemistry Division Preprints 2002, 47(1), 193
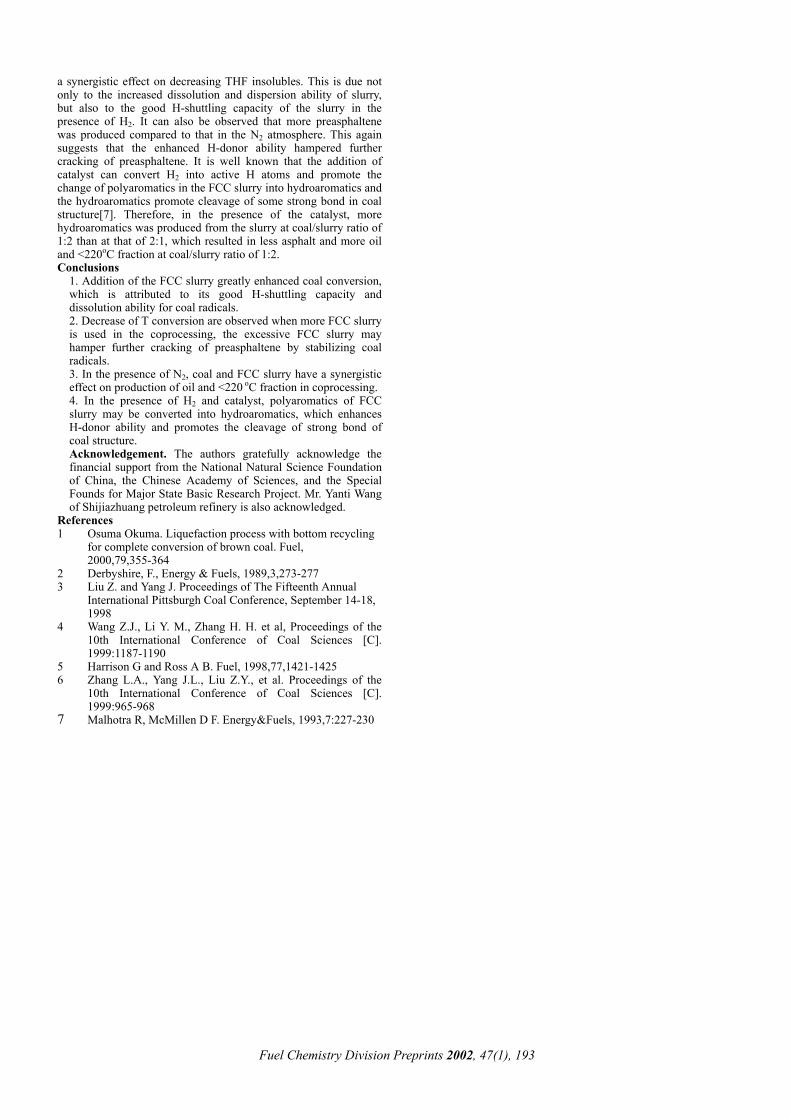
a synergistic effect on decreasing THF insolubles. This is due not only to the increased dissolution and dispersion ability of slurry, but also to the good H-shuttling capacity of the slurry in the presence of H2. It can also be observed that more preasphaltene was produced compared to that in the N2 atmosphere. This again suggests that the enhanced H-donor ability hampered further cracking of preasphaltene. It is well known that the addition of catalyst can convert H2 into active H atoms and promote the change of polyaromatics in the FCC slurry into hydroaromatics and the hydroaromatics promote cleavage of some strong bond in coal structure[7]. Therefore, in the presence of the catalyst, more hydroaromatics was produced from the slurry at coal/slurry ratio of 1:2 than at that of 2:1, which resulted in less asphalt and more oil and <220oC fraction at coal/slurry ratio of 1:2. Conclusions
1. Addition of the FCC slurry greatly enhanced coal conversion, which is attributed to its good H-shuttling capacity and dissolution ability for coal radicals. 2. Decrease of T conversion are observed when more FCC slurry is used in the coprocessing, the excessive FCC slurry may hamper further cracking of preasphaltene by stabilizing coal radicals. 3. In the presence of N2, coal and FCC slurry have a synergistic effect on production of oil and <220 oC fraction in coprocessing. 4. In the presence of H2 and catalyst, polyaromatics of FCC slurry may be converted into hydroaromatics, which enhances H-donor ability and promotes the cleavage of strong bond of coal structure. Acknowledgement. The authors gratefully acknowledge the financial support from the National Natural Science Foundation of China, the Chinese Academy of Sciences, and the Special Founds for Major State Basic Research Project. Mr. Yanti Wang of Shijiazhuang petroleum refinery is also acknowledged.
References 1 Osuma Okuma. Liquefaction process with bottom recycling
for complete conversion of brown coal. Fuel, 2000,79,355-364
2 Derbyshire, F., Energy & Fuels, 1989,3,273-277 3 Liu Z. and Yang J. Proceedings of The Fifteenth Annual
International Pittsburgh Coal Conference, September 14-18, 1998
4 Wang Z.J., Li Y. M., Zhang H. H. et al, Proceedings of the 10th International Conference of Coal Sciences [C]. 1999:1187-1190
5 Harrison G and Ross A B. Fuel, 1998,77,1421-1425 6 Zhang L.A., Yang J.L., Liu Z.Y., et al. Proceedings of the
10th International Conference of Coal Sciences [C]. 1999:965-968
7 Malhotra R, McMillen D F. Energy&Fuels, 1993,7:227-230

Fuel Chemistry Division Preprints 2002, 47(1), 175
DEVELOPMENT OF GASIFICATION/MELTING PROCESS FOR COAL AND COMBUSTIBLE WASTES
Yongseung Yun and Ji Sun Ju
Plant Engineering Center
Institute for Advanced Engineering 633-2, Goan-ri, Baegam-myeon
Yongin, Gyeonggi-do, 449-863 Korea Introduction
With recent widespread urgency in solving environmental problems, local environmental contamination in the past has become a serious worldwide problem in such forms as greenhouse effects, acid rain, and ozone depletion. In order to cope with these problems, many countries are trying to mandate to curb the amount of CO2 emission, to install facilities for reducing SOx, NOx in addition to regulate the use of CFC materials. Since the gasification can solve many of the current environmental problems even with energy recovery for wastes, many processes are unveiled during the last decade. In particular, recent interest in the gasification process itself that has been renewed in many developed countries yielded several noteworthy process developments for unconventional feedstock like biomass and municipal solid wastes.
Gasification research has been existed in Korea from late 1940’s without much success. As in other developed countries, renewal of the technology starts just after the 1st oil crisis in the early 1970’s even though they were basic studies. From 1990’s, after the potential impact of IGCC (Integrated Gasification Combined Cycle) technology on the coal-utilizing power plants was recognized after the Cool Water project in USA, Korea started the small-scale process research. From 1993, pilot-scale gasification facilities were constructed in Korea and since then high-pressure gasification for the nine imported coals were performed. With the accumulated knowledge regarding the gasification, application area is being explored for waste feedstock from late 1990’s in Korea.
Environmental concerns regarding the old-style coal-utilization and waste treatment technologies have prompted the development and application of gasification processes that produce far less pollutants like SOx, NOx and dioxins while recovering energy mainly as a chemical energy of CO and hydrogen. In Korea, coal needs to make up at least 1/3 of total generated electricity while waste incineration faces many challenges in convincing its environmental cleanness, especially with respect to dioxins and possibility of heavy metal leaching from the combustion ash. During the last eight years, Korea has prepared the application possibilities of gasification process into coal and wastes in that process cost and system availability were the main obstacles. In this paper, current research status of gasification research using coal and combustible wastes is discussed. Gasification Facilities
A dry-feeding entrained-bed type gasification facility, that is located at Ajou University in Suwon, Korea and can treat 3 ton/day at maximum 30 bar, 1650oC has been built in April 1995. Figure 1 shows the facility (8 m x 17 m x 20 m) located in 30 m x 50 m space and the corresponding 3-dimensional PDS (Process Design System) picture. Main target feeds are subbituminous and bituminous coals, but petroleum coke is also possible to gasify. Coal feed is identical size with that of conventional power plants using pulverized coal, as 80-90% passing -200 mesh. Pulverized coal is pneumatically conveyed with nitrogen gas at dense-phase into the feeding nozzle system, where 99%-purity oxygen and steam are mixed with the coal
powder. Steam is injected separately from the oxygen and coal powder.
Normal operation consists of the preheating, pressurization, transient operation, normal gasification operation, and the shutdown steps. LPG burner at the bottom of the gasifier did preheating of the gasifier at least for 20 hours. Then, nitrogen is introduced to pressurize the gasifier till the operating pressure range in less than 30 min, after this step, oxygen and coal powder are being fed into the gasifier. Coal supply is first started at the low feeding range in order not to cause any sudden pressure buildup in the gasifier and thus causing any back pressurization into the coal feeding lines. This step takes normally less than one hour. Normal hot test operation step for obtaining gasification data is maintained at the steady state for at least 4 hours to provide enough gas, slag, and other process data.
Figure 2 show the view of the gasification facility that was being developed for the liquid or slurry type combustible wastes. Maximum pressure and temperature for the operation are 10 bar and 1550oC, respectively. Left-side view shows the waste-oil feeding facility including the heating lines for waste oils. Right-side view illustrates the main gasifier and the carbon scrubbing system.
Figure 1. View of the 3 ton/day gasifier system and the corresponding 3-D design view.
Figure 2. Feeding facility (Left) and the gasifier section (Right) of the 1 ton/day-class waste-oil based gasification facility.
Results and Discussion
Total 9 coals were tested under the high-pressure conditions of 12-29 bars and high temperature of 1400-1550oC. Important gasification parameters like carbon conversion and cold gas efficiency for the tested coals showed above 95% and 65-80%, respectively, depending on the coal used. 1
Among coal properties influencing the gasification process, the removal rate of surface moisture content after drying was more important than the total moisture content in the coal feeding system. In the aspect of ash in coal, since most gasifiers remove ash as a molten slag, ash characteristics are one of the most important

Fuel Chemistry Division Preprints 2002, 47(1), 176
parameters. Among the attributes of ash characteristics grasped in the study, a certain amount of ash in coal exhibits more favorable performance when judging from the experimental point of view.
From experiments that applied in coals of 2-11% ash content, due to satisfactory slag shapes and reasonable shape in coating refractory wall by tested coals, ash content of the coals proved to be in reasonable range for the application in the dry-feeding gasifier. Also, ash-melting temperature applicable in the dry-feeding gasifier was estimated to be better in the range of 100oC lower value than the gasifier reaction zone temperature of 1400-1500oC. That is, coals showing ash-melting temperature in the range of 1300-1400oC were thought to be best candidate coals for the slagging gasifier.
Most coals of bituminous and subbituminous rank, except coals of high fuel ratio (fixed carbon/volatile matter) and high ash content like Australian Curragh (VM 20.0%, FC 56.8%, Ash 16.1% as-received) and Russian Denisovsky (VM 20.1%, FC 59.1%, Ash 12.1% as received) coals, were all successfully applicable in the dry-feeding slagging-type gasifier.
Wastewater sludge was melted under combustion conditions yielding slags as shown in Figure 3. Left-side slag was obtained from the as-received feed (CaO/SiO2=0.11) whereas the right-side slag that exhibits lower flow viscosity was produced after adjusting CaO/SiO2 ratio as 1.0. Through the tests, self-reacting calorific value for the waste water in the facility was determined as 4,100 kcal/kg-ds, which is more or less higher than reported 3,500 kcal/kg-ds 2 probably due to the insulation depth of the reactor.
Figure 3. Slags obtained from wastewater sludge (unit: cm).
Inner structure of slag after gasification and ash after combustion
was analyzed by XRD for the samples obtained from Australian Drayton coal as shown in Figure 4. While combusted ash samples show the crystal structure of CaSO4, SiO2, etc., slag samples exhibit an amorphous structure where all crystal structures in mineral matter were melted without much crystalline nature. Slags that were formed after melting under high temperature gasification temperature and solidification by cooling appear to bind the heavy metal components into the slag structure during the process. As demonstrated in Figure 4, heavy metal components appear to be intertwined with melted mineral matter components, so that the inner structure of slag is amorphous. According to the leaching tests on slags, Cu, Cr, Pb, Cd, As, Hg that are regulated as a heavy metal pollutants in a leached water in Korea were not detected at all. Thereby, coal slag can be safely utilized as a construction material or filler for road asphalt and proves not to cause any secondary pollution. Usually coal flyash from a boiler causes a secondary pollution by leaching.
One of the main focuses in the waste-oil based gasification is in minimizing soot production with minimum additional fuel to treat heavy metal containing wastes. More than 50% of waste-oil is reused through simple distillation as a fuel oil in Korea only for the designated boilers as a public bath place. Current obtained carbon
conversion was 93% while the cold gas efficiency reached 71% for the waste oil. Another point is the control of residence time for different waste characteristics of melting temperature and slag viscosity for smooth slag discharge.
Figure. 4. XRD results of ash and slags from Drayton coal: combustion ash (Top) and slags (Middle: from 3 ton/day gasifier, Bottom: from commercial-scale gasifier). Conclusions
Slagging coal gasification pilot plant has provided the fundamental technologies that was a basis for the development of slagging combustor/gasifier using the waste feed like a sludge and waste oil. Coal gasification system yielded carbon conversion of above 98% and above 70% cold gas efficiency for the Indonesian subbituminous coals that were the best-suitable coals for gasification among the tested nine imported coals. Wastewater sludge was successfully treated at the developed combustion/melting process with above 90% slag-conversion and without any leaching problems of heavy metal components in slags. Gasification/melting process utilizing the calorific value of waste oil as a heating energy in melting has been installed and tested, in that powder-type wastes are converted into environmentally benign products with minimum extra fuel consumption. Developed combustion/melting process proved that designated-waste sludges can be treated cheaply compared to incineration, although general-waste-class sludges are yet to be competitive with conventional land-filling. Wide application of the technology requires more stringent environmental regulation that will in turn stimulate advanced process developments. Acknowledgement
This work was supported by KISTEP as one of National Research Lab. Projects in Korea under contract 2000-N-NL-01-C-224. References 1. Yun, Y.; Yoo, Y.D., Korean J. of Chem. Eng., 2001, 18(5), 679-685. 2.Greenhut, D.A.; Prepr. Pap.-Society of Mining Engineers of AIME, 1991, pp. 1-12.
2 0 2 5 3 0 3 5 4 0 4 5 5 0 5 5 6 0 6 5 7 0 7 5 8 00
5 0 0 0
1 0 0 0 0
1 5 0 0 0
2 0 0 0 0
2 5 0 0 0
3 0 0 0 0
3 5 0 0 0
4 0 0 0 0
4 5 0 0 0
5 0 0 0 0
Inte
nsi
ty (
I/I1)
2 - T H E T A
( 2 )
( 1 )
C r y s t a l l i n e
( 1 ) C a S O 4( 2 ) S i O 2
2 0 2 5 3 0 3 5 4 0 4 5 5 0 5 5 6 0 6 5 7 0 7 5 8 00
5 0 0
1 0 0 0
1 5 0 0
2 0 0 0
2 5 0 0
A m o r p h o u s
Inte
nsi
ty (
I/I1)
2 - T H E T A
2 0 3 0 4 0 5 0 6 0 7 0 8 00
5 0 0
1 0 0 0
1 5 0 0
2 0 0 0
A m o r p h o u s
Inte
nsi
ty(I/
I1)
2 - T H E T A

EFFECT OF GASEOUS ADDITIVES ON DESULFURIZATION OF COAL THROUGH
PYROLYSIS
Long Xu, Jianli Yang, Yunmei Li, Zhenyu Liu
State Key Laboratory of Coal Conversion, Institute of Coal Chemistry, Chinese Academy of Sciences,
Taiyaun 030001 P. R. China Introduction
With the increasing environmental concerns on SO2 emission from coal combustion, use of high sulfur coals becomes more and more difficult. Development of sulfur removal process from coal prior to combustion is very important for continued used of high sulfur coals. Pyrolysis is likely to be an effective way to transform sulfur in coal to the gas and liquid phases, and to generate low sulfur content char for clean combustion.
Researches show that the efficiency of sulphur removal from coal through pyrolysis depends on many factors, such as temperature [1-3], heating rate [2], nature of atmosphere [3-6], residence time and coal type [6]. Pyrolysis of coals in nitrogen, hydrogen and steam indicates that H2 atmosphere results in better sulphur removal efficiency than others, but the char yield is low, and the sulphur content of the char usually does not show significant decrease compared to the raw coal. To reach the goal of simultaneous sulphur removal and production of chars of high heating value, selective sulphur removal from coal is preferred. It is possible that addition of other chemicals are required to selectively reduce the strength of sulphur-carbon bonds and/or to stabilise the sulphur containing radicals to prevent them to form solid products, however, a little work is available in the literature in this field.
In this study, ethanol and acetone as well as nitrogen and hydrogen were used to constitute different atmospheres for pyrolysis of coal to evaluate their effect on sulphur removal. The results obtained are useful for understanding of sulphur removal mechanism from coal and for development of novel sulphur removal technologies. Experimental
A Spanish coal (Mequinenza) and three Chinese coals (Yanzhou, Datong and Xianfeng) were used in this study. All samples were ground to less than 0.25mm before use. Ultimate and sulfur-form analyses of the coals are presented in Table 1.
Table 1. Ultimate and Sulfur-form analyses of sample coals
Samples Yanzhou Datong Xianfeng Mequinenza Ultimate( wt%, daf) C 81.80 82.76 66.98 61.64 H 5.86 5.07 5.73 7.45 N 1.25 0.82 1.50 1.39 S 3.49 2.42 1.16 12.03 O (diff.) 7.60 8.93 25.63 17.49 Sulfur-form (wt% total ) Pyritic 44.70 64.32 2.59 3.82 Sulfate 0.57 3.01 14.66 9.39 Organic 54.73 32.67 82.76 86.79
Pyrolysis runs were carried out in a fixed bed quartz tube
reactor (70cm length, 1.4cm i.d.). Coal samples were heated from room temperature to 500oC or 700oC at a heating rate of 10°C/s. Ethanol or acetone was fed into the reactor by a pulseless pump, vaporised and then carried to the pyrolysis area by nitrogen. As a reference, hydrogen atmosphere was also used in the study. And the flow rate of nitrogen or hydrogen was 30ml/min. In order to compare
the effects of different atmospheres, the same amount of organic reagents as that of hydrogen (in mol) were introduced. The amounts of these reagents actually fed into the reactor were 0.05ml/min for methanol, 0.08ml/min for ethanol and 0.10ml/min for acetone in the liquid state.
The sulfur content of raw coals and the pyrolysis chars were analysed by a sulfur detector (model WDL-3C). Results and Discussion
Figures 1(a, b, c, d) is the desulfurization results of these four coals at 700oC. In the figure, X-axis represents the percentage changes of the weight loss of coal (weight lose%), and Y-axis is the corresponding efficiency of desulfurization (De-S%). By this way, the degree of desulfurization can be reasonable evaluated. For a pyrolysis in which De-S% is equal to the weight loss%, in other words, the sulfur content in char (Schar%) is as same as that in coal, then the result is represented by a point on the diagonal line.
Figure 1(a) is the effect of atmospheres on desulfurization of Yanzhou coal. It shows that for Yanzhou coal the order of the effect on De-S% is as following H2>N2> C2H5OH> CH3COCH3. However, the value of weight loss% is also with the similar order. Furthermore, the values of Schar% are 2.56% for H2, 2.77% for N2, 2.54% for ethanol, 2.79% for methanol, and 2.87% for acetone. Although the values of Schar% for hydrogen and ethanol atmospheres are very similar, the yield of char for ethanol is about 7 percentage points higher than that for H2 atmosphere. This suggests that ethanol atmosphere is much more selective to sulfur removal than H2 atmosphere. It is also interesting to note that introduction of acetone also results in higher char yields compared to that in H2 and N2 atmospheres. Figure 1(b) is the desulfurization results of Datong coal. Among the four atmospheres, ethanol results in the highest char yield and the highest De-S%. While De-S% and the char yield observed for H2 atmosphere are nearly 20 and 7percentage points lower than that for ethanol, respectively. Figure 1(c) is the pyrolysis results of Xianfeng coal. Again, ethanol atmosphere results in almost the highest De-S% and nearly the lowest weight loss%. Figure 1(d) is the results of Mequinenza coal. Similar to the Chinese coals, ethanol atmosphere gives the highest char yield and the highest De-S%. Although H2 atmosphere yields a De-S% value very close to that of ethanol atmosphere, its weight loss% and Schar% are higher than that in ethanol atmosphere.
In general, Figures 1 shows that introduction of ethanol and acetone does alter the pyrolysis of the coals, and usually results in the chars with high yields and low sulfur contents. Hydropyrolysis, on the other hand, usually promotes devolatillazation of coal but is ineffective to generate low sulfur-containing chars.
Although detailed mechanism on the effect of the atmospheres is not clear by now, it is certain that this effect is related to the state of sulfur in coal as well as the type of the coal. The differences in weight loss% between ethanol and hydrogen for Yanzhou, Datong, Xianfeng and Mequinenza are 7.21%, 6.94%, 3.17% and 3.18%, respectively. The four coals studied can be divided into two groups, one group are lignites, including Mequinenza and Xianfeng, the other are bituminous coals, while the differences mentioned can also be divided into two groups, 3% for lignites and 7% for bituminous coals. The phenomena may indicate that the influence of ethanol on yield of char is related to the type of coal or carbon content in raw coal. Comparing the desulfurization efficiency of these coals, it was observed that the improvement of De-S% by ethanol atmosphere is much more than those by hydrogen atmosphere for Datong coal. It suggests the possible existence of the special sulfur containing structures in Datong coal, which interact strongly with ethanol during pyrolysis.
Fuel Chemistry Division Preprints 2002, 47(1), 198

(a) (b)
(c) (d) Figure 1. Effect of gaseous additives on desulfurization of four coals during pyrolysis. (a) Yanzhou coal (b) Datong coal (c) Xianfeng coal (d) Mequinenza coal
In order to see clearly the effects of the gaseous additives at different temperature ranges during pyrolysis, a variables FT is used in this study. FT and is calculated according to the following equation: FT(T1~T2)=[(De-S%T2-De-S%T1)/(Weight loss%T2-Weight loss%T1)]-1 Based on the equation, if the change of De-S% is dominant, then FT will be more than zero, but if the change of Weight loss% is dominant, then it will be less than zero. Here two temperature ranges, ≤500oC and 500~700oC, are studied separately. Figure 2 is the change of FT for Yanzhou coal in different pyrolysis atmospheres. It is observed that: (1) Below 500oC, the value of FT is more than zero only for ethanol, zero for acetone and less than zero for the others. That is to say, in the atmosphere of ethanol more sulfur can release than volatile matter does. While in other atmospheres the emission of volatile matter is dominant; (2) From 500oC to 700oC, all FT is more than zero. That is to say, sulfur releasing is dominant in this temperature range for all atmospheres. And in hydrogen the desulfurization effect is the best. In acetone and ethanol there are similar effect on desulfurization; (3) In hydrogen the gap of FT between these two temperature ranges is the widest, while in ethanol the gap is the narrowest. The atmosphere of hydrogen is the most sensitive to temperature, while ethanol is a relative mild atmosphere for desulfurization. Of course, FT is only the overall effect in the temperature range, and if the temperature range is narrow enough, the nature of each atmosphere will be discovered more clearly. Figure 2. The change of FT for Yanzhou coal under different
pyrolysis atmospheres. The promotion on sulfur removal by the introduction of ethanol
depends not only on the sulfur structure in coal, but also on the decomposition of itself during pyrolysis. As known, pyrolysis generates free radicals from coal under a broad range of temperatures. Combination of large radicals produces heavy products such as char, and combination of small radicals produces volatile products such as gas and tar. If there is not enough small radicals to stabilizing the sulfur-containing radicals from coal, the sulfur-containing radicals released from coal may react with large radicals to form char, which reduces the sulfur removal effect. Pyrolysis of the organic reagents added may produce more small radicals including hydrogen redicals, to stabilize the sulfur containing radicals, and to increase the amount of sulfur in the volatile products. The proposed decomposition mechanisms of ethanol and acetone are shown in the following along with the decomposition energy for each substance.
30 40 50 6030
35
40
45
50
55
60
65
N2 H2 C2H5OH CH3COCH3
De-S
%
Weight loss%20 25 30 35 40 45 50 55
20
25
30
35
40
45
50
55
N2 H2 C2H5OH CH3COCH3
De-
S%Weight loss%
40 45 50 55 6040
45
50
55
60
N2 H2 C2H5OH CH3COCH3
De-
S%
Weight loss%40 45 50 55 60 65 70 75 80
40
45
50
55
60
65
70
75
80
N2 H2 C2H5OH CH3COCH3
De-
S%
Weight loss%
C2H4 + H·
91 ↑39 → ·OH + C2H5· C2H5OH . → H· + CH3CHOH 93 ↓27 H· + CH3CHO ↓82 CH3·+ CHO· ↓18 CO + H·
CH2CO + H· 80 ↑43 CH3COCH3 → CH3CO · + CH3· ↓14 CO + CH3·
D298o(kcal •mol-1)
Comparing these reactions, it is observed that ethanol can generate more small free redicals, especially hydrogen redicals, than acetone. Among these free radicals, hydrogen redicals may be the main one promoting the sulfur removal reaction. Studies, however, are needed for further exploration on this subject. Conclusions
Compared to pyrolysis and hydropyrolysis of coals, the introduction of ethanol and acetone into the reaction atmosphere selectively promotes sulfur removal from coal, which results in chars of low sulfur content and high yield, especially for ethanol. In addition, there is a symmetrical and promotive effect on desulfurization at a wide temperature range in ethanol.
Acknowledgement. The project is subsidised by the Special Founds for Major State Basic Research Project, the Chinese Academy of Sciences, and the Natural Science Foundation of China and Shanxi Province, and the State Key Laboratory of Coal Conversion.
-0.5
0.0
0.5
1.0
1.5
2.0
H2 N2CH3COCH3 C2H5OH
~500oC 500~700oC
F T
Pyrolysis Atmosphere
References (1) Kelemen, S. R.; Gorbaty, M. L.; Geoge, G. N.; Kwiatek, P. J.; Sansone,
M. Fuel, 1991, 70, 396-402. (2) Sugawara, K.; Tozuka, Y.; Sugawara, T.; Nishiyama, Y. Fuel
Processing Technology, 1994, 37, 73-85. (3) Liao, H. Q.; Li, B. Q.; and Zhang, B. J. Fuel, 1998, 77, 1643-1646. (4) Chen, H. K.; Li, B. Q.; Yang, J. L.; Zhang, B. J. Fuel, 1998, 77, 487-
493.
Fuel Chemistry Division Preprints 2002, 47(1), 199

Fuel Chemistry Division Preprints 2002, 47(1), 200
(5) Robert, S.; and VanMeurs, P. Fuel, 1980, 59,458-464. (6) van Heek, K. H.; and Hodek, W. Fuel, 1994, 73, 886-896.

Fuel Chemistry Division Preprints 2002, 47(1), 187
ELECTROCHEMICAL PROPERTIES OF MCMBS AS ANODE FOR LITHIUM ION BATTERY
Baohua Li, Ruixia Guo, Kaixi Li, Chunxiang Lu, Licheng Ling
State Key Laboratory of Coal Conversion, Institute of Coal Chemistry, Chinese Academy of Sciences, P.O. Box 165, Taiyuan, Shanxi 030001,
P.R. China
Introduction It is recognized that lithium secondary batteries using lithium
metal exhibit problems, which make it difficult for their wide usage in consumer market. The problem is the unsafe characteristic, such as combustion and explosion due to dendrites formed at the surface of lithium metal during charge-discharge cycles. To solve this problem, a “rocking-chair” battery, which uses another intercalation compound as the anode for the lithium secondary battery, has been proposed. Among the alternative materials, which could replace lithium metal as the anode, the carbon materials are very desirable from the viewpoints of being abundant. Carbon materials have received much attention as anode material for lithium ion batteries since 1990. Various carbon materials have been investigated and shown good performances as the host for lithium [1-7]. They have high reversible capacity, high cyclic efficiency(ca,100%) , low electrochemical potential (•1V vs .Li/Li+ ) and long cycling life.
The theoretical lithium storage capacity of a graphite anode for a lithium secondary battery has been considered to be 372mAh/g, corresponding to the first stage Li-GIC (Lithium-graphite intercalation compound, LiC6). To further increase the energy density of lithium secondary batteries requires increasing the specific capacities of the electrode materials. Mesophase microbead (MCMB) prepared from petroleum pitch or coal tar is one of the candidate carbon materials available commercially. since it has high specific capacity(•500 mAh/g) and a spherical structure[4] which can be easy for closely packing, resulting in high density of electrode. Its low surface area can also minimize the side reactions during charge-discharge process. The present work studied the charge-discharge properties of MCMBs with different mean diameter and size distribution.
2 Methods
2.1 Preparation of MCMB. MCMB was prepared by heat-treating coal tar pitch with 3.7%wt pyridine insoluble fraction (PI) at 723K for 1~4h under autogenous pressure. Mesophase pitch was filtrated at 423K. The residue was then extracted by pyridine to get MCMB, which was further carbonized at 973K for 1h under N2.
2.2 Analyses of SEM. The surface morphology of the isolated spherule after heat-treatment at 973K was observed under scanning electron microscope (Hitach H-600).
2.3 Electrochemical measurement. Working electrodes were fabricated by mixing MCMB with 10% wt of binder poly- [tetrafluroethylene](PTFE) and were dried at 433K under vacuum for 12 h in a dry box.
Electrochemical measurements were performed by using three-electrode cells. Carbon electrode was used as work electrode. Lithium metal was used as a counter electrode and a reference electrode. The electrolyte was 1MLiPF6-EC/DEC (volume1: 1) solution. All the operations on the cells assembled were carried out in the glove box filled with argon gas. Galvanostatic cycle was carried out at a constant current density of 15mA/g, and the cut off range is from 0.001 to 2V vs Li/Li+.
3 Results and discussion 3.1Features of isolated spherules (MCMB). SEM photographs
of MCMBs prepared under different conditions are shown in Fig1 (a)-(d), and the diameter distributions of MCMBs are shown in Fig 2. Fig1 shows that the diameter of MCMBs increased significantly with increasing reaction time. Fig2 shows that the diameter distribution of samples a, b and d are almost normal frequency distribution, while sample c has a few small MCMBs and large number of relatively big MCMBs.
Fig. 1 SEM photographs of MCMBs prepared under At 723K for different time, a 1h, b 2h, c 3h, d 4h.
a b
c d
0 2 4 6 8 10 12 140
5
10
15
20
25
30
35Fr
eque
ncy/
%
b
2 4 6 80
5
10
15
20
25
Freq
uenc
y/%
a
Diameter/µm Diameter/µm
2 4 6 8 10 12 140
5
10
15
20
25
30
Freq
uenc
y/%
c
5 10 15 20 250
5
10
15
20
25
30
35
Freq
uenc
y/%
d
Diameter/µm Diameter/µm
Fig 2. The diameter distribution of the MCMBs derived from coal tar pitch at 723K for different time, a 1h, b 2h, c 3h, d 4h.

Fuel Chemistry Division Preprints 2002, 47(1), 188
3.2 Electrochemical properties of MCMBs . Fig 3 showed the first cycle charge-discharge profiles of MCMBs. The plateau observed at 0.8V vs Li/Li+ during charge was attributed to the formation of solid electrolyte interface film (SEI) by the decomposition of electrolyte. Fig3 showed that the discharge profiles of MCMBs had a large hysteresis and a potential plateaus appearing at approximately 1V vs Li/Li+, while the charge profiles had no potential plateaus appearing at approximately 1V vs Li/Li+. Accordingly, the plateau is not due to a side reaction such as electrolyte decomposition but the cavities, which came into being when MCMBs were heat-treated at 973K. Lithium ions stored in the cavities were de-inserted at about 1V Li/Li+[4].
Table 1 summarized some properties of MCMB anode., The first reversible capacity increased from 246 to 541 mAh/g with increasing of the mean diameter. And the first coulombic efficiencies were respectively 66.4%, 66.0%, 75.7%, and 68.3%. Since small MCMB has large specific surface area, resulting in more SEI, the first coulombic efficiencies increased with increasing of the mean diameter of MCMB. However, for the large MCMB, the numbers of rupture and defects will increase. When lithium ion diffuses into the large particle, it is probable to come across more ruptures and defects, making the diffusion dynamics process difficult. This gave rise to more irreversible capacity. Moreover, the interface of MCMBs decreases with increasing of particle size, which may reduce the electrical conductivity of MCMB. Consequently MCMB’s cyclical property draws down. For example, the second discharge capacities of sample a, b, c and d, are respectively 8, 14, 22, 80 mAh/g less than the first cycle. If proper proportion of small MCMBs is added to big MCMBs, the electrical conductivity will be improved. This can be noted in Figure 3 and Table 1.The size distribution of sample c makes charge-discharge property fine. The first/second discharge capacity was 424/402 mAh/g and the first coulombic efficiency was 71.7%.
Table 1. Some properties of MCMBs prepared from coal tar at
723K
Code Heattreatment
time (h)
Mean
diameter
( µm)
First
/second
Cr(mAh/g)
First Cirr
(mAh/g)
First coulomic
efficiency(%)
a 1 3.2 246/238 124 66.4
b 2 6.5 425/411 219 66.0
c 3 8.9 424/402 167 71.7
d 4 13.8 541/461 243 68.3 Cr- reversible capacity Cirr-irreversible capacity
4 Conclusions
MCMB is one of the promising carbon materials as anode for lithium secondary battery among commercially available carbon
materials. The MCMBs heat-treated at 973K had higher reversible capacity than the theoretical lithium storage capacity of a graphite anode. This suggests that there be a cavity mechanism for the charge-discharge reaction. The mean diameter and size distribution of MCMBs have influence on the charge-discharge properties of MCMBs.
Acknowledgements.The project is supported by Shanxi Province Natural Science Foundation • 991068 • and Chinese Academy of Sciences Foundation and State Key Laboratory of Heavy Oil Processing in the University of Petroleum•199901•
Reference (1). Pled, E.; Menzchem,C.; BarTow, D. and Melman, A.. J. Electrochem .Soc,
1996, 143(1), L4-L7 (2). Ishikawa,M.; Kamobara,H.; Morita M. et al, Journal of Power Sources,
1996, 62, 229-232 (3). Buiel, E.; and Dahn, J.R. J. Electrochem.Soc, 1998,145(6), 1977-1981 (4). Mabuchi,A.; Tokumisu, K.; Fujimoto, H.; and Kasuh, T. J. Electrochem.
Soc, 1995,142(4), 1041-1046 (5). Naji, A.; Willmann, P.; and Billaud, D. Carbon, 1995,33(9), 1347-1352 (6). Liu,Y.; Xue, J.S.; Zheng, T.; and Dahn, J.R. Carbon , 1996,34(2),193-200 (7). Bondarenko, G.N.; Nalimova,V.A.; Fateev, O.V. Carbon, 1998,36(7-8),
1107-1112
Fig 3. The first charge-discharge curves of MCMB heat-treated at 973K
0 100 200 300 400 500 6000.0
0.5
1.0
1.5
2.0 a
b
d
cPo
ten
tial
vs
Li/L
i+ /V
The first discharge capaciy� �mAh/g)
Pot
entia
l vs
Li/L
i+ /V
0 100 200 300 400 500 600 700 800
0.0
0.5
1.0
1.5
2.0
2.5
3.0
3.5
ad
cb
Pot
entia
l vs
Li/L
i+ /V
The firsr Charge capacity(mAh/g)
Pot
entia
l vs
Li/L
i+ /V

Fuel Chemistry Division Preprints 2002, 47(1), 171
Hydrotreatment of tar formed in gasification of
biomass
M. Hernelind+ and B. Gevert*
Department of Applied Surface Chemistry, ChalmersUniversity of Technology, S-412 96 Göteborg, Sweden.+Present address: Perstorp AB, S-284 80 Perstorp, Sweden.*Corresponding author. Tel.: +4631-7722956; fax: +4631-160062; e-mail: [email protected]
IntroductionGasification of biomass leads to more or less production
of a tar. A lot of research has bean done to crack this tar intocarbon monoxide and hydrogen. In this paper we will present analternative way of using the tar. The purpose with here is topresent some results of stabilizing tar from gasification ofbiomass by hydrotreatment with a commercial CoMoS-catalyst.We are here focusing on finding the optimum temperature forhydrodeoxygenation (HDO) of the tar. The effects of pressure andliquid hourly space velocity (LHSV) are also studied. The resultsare based on five analysis methods: elemental analysis, 1H-NMR,FT-IR, GC and water content analysis.
ExperimentalThe raw material for this study was tar formed in a
gasification plant in Tervola, Finland. The type of gasifier was amixture of up- and down-draught. To pump the tar through thecontinuous hydrotreating system a piston pump was used. The tarwas filtered with three sieves with the mesh sizes of 710 µm, 125
µm and 45 µm. In this study a commercial CoMo catalyst calledAkzo Ketjenfine 702 was used. The catalyst was sulfided in thereactor by exposing the catalyst to a gas mixture of H2/H2S90/10% by volume. The hydroprocessing system study consistedof a feed tank, a reactor and a separator, which were connected toeach other by _-inch stainless steel pipes (REF REACYTOR).Since Baker et al. (1) used up-flow mode for upgrading flashpyrolysis tar in their hydroprocessing apparatus to prevent reactorbed blocking, that mode was also used here. The reactor was filledwith 40 ml of catalyst.
Results and DiscussionAnalysis of the gasification tar. The properties
of the feed tar formed in gasification of biomass are reported inTable 1. The water content was 8.14 %, which is relatively lowcompared to bio-oils produced by fast pyrolysis. The water in thetar together with the water produced by the hydrodeoxygenationreactions deactivates the hydrotreating catalyst in two ways.Water molecules may, according to Furimsky (3), adsorb to anionvacancies and thereby block active sites and Grange et al. (4)reports that water also alters the structure of γ-Al2O3 support
materials. If the γ-Al2O3 is hydrated into the boehmite
Table 1. Properties of gasification tarElemental analysis(on wet basis)
Weightpercent
GCanalysis
Mole % ofcarbon
C 64.46 Gasoline ∼0H 7.21 Kerosene 11.5N ∼0 Gas oil 61.0
O (by difference) 28.33 Residue.369°C+ 27.5
phase the characteristic porous structure will be lost. The reactantswill then have reduced access to active elements in the supportmaterial. However, water in bio-oils also lowers the viscosity andmakes the bio-oils more stable. Moreover the elemental analysesshowed that the tar contained less oxygen than bio-oils from fastpyrolysis, which have a typical oxygen content of 44-46% byweight including the oxygen in the water. The GC analysis showedthat the amount of compounds in the lighter fractions of the tarwas relatively small. In the IR spectrum of the tar, which isreported in Fig. 2, it can be seen that the tar was a cocktail ofdifferent hydrocarbons. Since the objective was to remove as muchorganically combined oxygen as possible the most interestingpeaks for this study were: alcohols at 3550-3200 cm-1 (O-Hstretching) and above all carboxylic groups at 1780-1630 cm-1
(C=O stretching).
Hydrodeoxygenation of gasification tar bycatalytic hydrotreatment. The first hydrotreating run wasperformed at high temperature (370°C) and pressure (10.0 MPa).The reactor was quickly blocked with coke and therefore it wasconfirmed that the tar must be pre-stabilized to be able to treat it attemperatures of about 400°C. In the last run the temperature and
pressure were set to 300°C and 11.0 MPa. Then the reactor bed wasalso blocked by coke. Therefore the pre-Hydroprocessing oftemperature of the tar must be in the temperature interval 200-300°C in similar way as for bio-oil produced by flash pyrolysis(1). The elemental analysis of untreated tar showed that itcontained 28.3-weight percent oxygen, including the oxygenatoms in water. In Fig. 1 the elemental analyses show that theoxygen content of the tar clearly decreased with increasinghydrotreating temperature, as expected. The explanation for thisresult is that the higher the temperature the higher HDO reactionrates. The oxygen content decreased from 28.3 weight percent to24.4% at the 7.0 MPa pressure level and to 21.6% at the 11.0 MPapressure level when the temperature was increased from 200 to280°C. It might seem like a small reduction of oxygen-containingcompounds in the tar. But one must remember that the mostreactive species have been deoxygenated. The influence ofpressure on the HDO of tar, see the results from the elementalanalyses in Fig. 1 was that the oxygen content decreased withincreasing pressure. This is logical since the higher the hydrogengas pressure the higher the concentration of active hydrogenatoms on the surface of the catalyst, which in turn leads to higherHDO reaction rates. The dependence of the pressure is not asstrong as the temperature dependence.
21
23
25
27
29
180 220 260
Temperature /
Weight % oxygen
7.0 MPa
11.0 MPa
untreated ta
Linear trend MPa
Linear trend
MPa
Figure 1. Elemental analysis: Effect of temperature on theoxygen content in hydrotreated tar. LHSV: 2.2 ± 0.3 h-1.
At the lower pressure 7 MPa the same results werereceived as for the 11 MPa case. In Fig. 2 the carbonylic peaks in

Fuel Chemistry Division Preprints 2002, 47(1), 172
the FT-IR spectra for untreated tar and hydrotreated tar at 7 MPa iszoomed in. It is clearly seen that the carbonylic absorptiondecreases with increasing hydrotreating temperature. Since thecarbonylic absorption is a measure of the concentration ofcarbonylic compounds in the tar it is concluded that amount ofC=O groups decrease with increasing temperature. Forhydroprocessing at 11 MPa the results were similar.
200°C
Untreated tar
260°C
280°C
1850 1800 1750 1700 1650 1600 1550
0.000
0.04
0.08
0.12
0.16
0.20
0.24
0.28
cm-1
A
Figure 2.Comparison of FT-IR spectra for untreated tar andhydrotreated tar. Conditions: 7.0 MPa, LHSV= 2.2 ± 0.3 h-1.
In the beginning of the test series a run with the followingsettings was performed: 10.0 MPa; 200°C; LHSV= 4.5 h-1. Toexamine if the catalyst was deactivated during the experiments, arun with approximately the same hydrotreating conditions asabove was carried out at the end of the test series: 10.0 MPa;200°C; LHSV= 4.6 h-1. The FT-IR analysis showed that thecarbonylic peak heights of the two samples were 0.1995 and0.1997 Absorbance units, respectively. Therefore approximatelyno deactivation of the catalyst could be indicated from the FT-IRanalyses. Total time on tar stream was 42 hrs. Whenhydroprocessing tar from high-pressure liquefaction Gevert (5)found that the deactivation was quick during the first hours andleveled out to be constant. The same behavior is found here.
The results from the GC analyses in Fig. 3 show that thefraction of compounds with relatively low boiling points increaseon the expense of compounds with high boiling points when thegasification tar was hydrotreated. This result is general for all thisresult is general for all hydroprocessing conditions analyzed. Theexplanation is that when the oxygen-containing compoundsbecome hydrodeoxygenated the effect of hydrogen bonding anddipole-dipole interactions will decrease, which in turn means thatthe boiling points of hydrodeoxygenated compounds will belowered. It is also interesting that the kerosene fraction increasesfrom ∼10 to ∼20 mole percent already at 200°C, since the definiteaim with this project is to produce aviation fuel from biomass.One possible reason to why the effects of LHSV and pressure fromthe FT-IR analyses were inconclusive could be that these effectsonly were studied at 200°C. At such mild conditions very few HDOreactions occur and it is therefore hard to say in what way differentparameters influence the result. However, high hydrogen gaspressure and high LHSV counteracts coke formation and in thatway the catalyst lifetime can be prolonged. The optimum
hydrotreating condition for hydrodeoxygenation of the tar wasthereby found to be 280°C, 11.0 MPa and LHSV=2.3 h-1. Shouldthe definite objective with this project fail, which is if it isdifficult to produce aviation fuel components from tar formed ingasification of biomass with aid ofhydrotreatment/hydrocracking, the product could be used toreplace fuel oil. Then the value of the product would be lower butthe environmental profits would remain.
010203040506070
untreated tar
200
220
240
260
280
Temperature /
Mole %
Gasolin
Kerosen
Gas oil
Residue
Figure 3. GC analysis: Effect of temperature on the yield ofdifferent fractions in hydrotreated tar and unhydrotreated tar.Pressure: 11.0 MPa, LHSV: 2.2 ± 0.3 h-1
C o n c l u s i o n sTar from gasification of biomass can be
hydroprocessed.. The oxygen content of the tar decreased withincreasing hydrotreating temperature. At temperatures >300°C thehydrotreating reactor was blocked with coke. Therefore it wasconcluded that the maximum (optimum) hydrotreating temperaturewas 280°C.The elemental analysis showed a tendency fordecreasing oxygen with increasing pressure.The FT-IR analysescould not indicate any deactivation of the catalyst.Optimumhydrotreating condition was found to be: 280°C; 11.0 MPa; LHSV= 2.3 h-1.
Acknowledgement. The authors would like to thankSwedish National Board for Industrial and Technical Development(NUTEK) and CF's Environmental foundation for financialsupport, Long Feixiang for assistance with the hydrotreatingapparatus and Anders Mårtensson for help with FT-IR analyses.
References(1) Baker, E.; Elliott, D. In: Soltes, E.J.; Milne, T.A. (Eds).
Pyrolysis oils from biomass: producing analysing andupgrading; ACS 376, Washington, DC, 1988; pp. 228-240.
(2) Ying Zhong-Shu, Börje Gevert, Jan-Erik Otterstedt,Johan Sterte, Applied Catalysis A, 153 (1997), 69-82.
(3) Furimsky, E., Catalysis reviews science andengineering. 1983, 25, 421-458.
(4) Grange, P.; Ceteno, A.; Maggi, R.; Delmon, B. In:Bridgwater, A.V.; Hogan, E. (Eds). Bio-oil productionand utilization, 1996; pp. 186-197
(5) Gevert, B. In Bridgewater A.V. (Ed). Advances in ThermoChemical Biomass Conversion, Blackie, London, 1994,1424-1431.

Fuel Chemistry Division Preprints 2002, 47(1), 203
Influence of thermal treatment conditions ontransformation behavior of trace elements in coals
Ruixia Guo, Jianli Yang, Baohua Li, Dongyan Liu, Zhenyu Liu
State Key Laboratory of Coal Conversion, Institute of CoalChemistry, Chinese Academy of Sciences, P.O. Box 165, Taiyuan,
Shanxi 030001, P.R. China
Introduction Coal contains harmful elements of environmental concerns inppm order, such as Na, K, Pb and Mn. Release of these elements fromcoal as vapor or fine particles during coal combustion causes severeproblems to the turbine blades, human health and ecologicalenvironment [1-3]. Therefore, a full detailed understanding on thechemical and thermal stability of Na, K, Pb and Mn during coalprocessing is desirable in guiding their effective control prior tocombustion. Recently, many researchers have studied the forms of Na, K, Pband Mn in coal and their fate during coal combustion [3-7]. However,the information on the transformation of the elements duringpyrolysis is limited. The attempt was made in this paper is tounderstand the transformation of Na, K, Pb and Mn during thermaltreatments under different conditions. The effects of the temperature,pressure, and atmosphere were investigated. The pyrolysistemperature was found to be the most influential factor for Na, K, Pband Mn evolution.
Experimental 2.1 Coal sample. Two Chinese coals, Shenhua and Yima, wereused in this study. The coals were crushed and sieved to0.16~0.27mm, and then dried under vacuum at 110oC with a nitrogenpurge. The properties of the coals are given in Table 1.
Table 1. Analysis of coal samples wt%Proximate
analysisUltimate analysis daf
AshanalysisCoal
sampleVad Ad M C H N S Oa Si Al
Shenhua 30.71 6.61 0.51 63.77 3.81 0.79 0.57 31.06 27.8 5.9
Yima 30.24 15.79 0.79 58.88 2.94 0.65 1.94 35.62 30.1 10.0
2.2 Apparatus and Procedure. A schematic representation ofexperimental apparatus is shown in Fig 1. It consists mainly of arotary furnace and a pyrolysis reactor. Prior to a reaction about 5gof coal sample was placed at the top of the reactor. Then it was sealed
and filled with a desired gas to a pressure of 0.1 MPa or 5.0 MPa.During these processes, the reactor was maintained at horizontalposition. After heating up the reactor to a desired temperature, thefurnace, along with the reactor, was quickly turned to verticalposition to allow fast pyrolysis. After 2 minutes, the reactor waspulled out from the furnace and quenched in the cold water. Char wascollected from the bottom of the reactor. Amount of gases producedwas determined by the weight difference of the reactor with thesamples before and after the reaction. Amount of tar produced wascalculated by subtraction.
2.3 Trace element analysis. The forms of Pb and Mn containedin the coals were defined as the following: H2O solubles, HClsolubles and residues. Deionised water and aqueous solutions of 1Nhydrochloric acid (HCl) were used for H2O solubles and HClsolubles seperation. The use of HCl removed acid soluble mineralssuch as calcite (CaCO3), dolomite (CaMg [CO3] 2), and siderite(FeCO3). Clay (aluminosilicates), quartz (SiO2), and pyrite (FeS2) asresidue remained in the solid. The content of Na, K, Pb and Mn inraw coal, char and solutions was measured by inductively coupledplasma – atomic emission spectroscopy (ICP-AES).
Results and Discussion3.1 Release behavior of the elements in Shenhua and Yima
coal. Tables 2 and 3 show changes of Na, K, Pb and Mn content inchars with temperature during pyrolysis in a nitrogen atmosphere.Although contents of all the four elements decreased with increasingpyrolysis temperature, the initial emission temperature for Shenhuacoal (400oC) is lower than that for Yima coal (600oC). The content ofNa, K, Pb and Mn in chars varies with coal type. This indicates thatthe transformation of the elements is related to their forms in thecoals and the environment around them. Larger amounts of Si, Al andS in Yima coal than those in Shenhua coal suggests that the elementsin Yima coal may be existed as sulphate, aluminate and silicate ofthermal stable forms. Due to high boiling point of these thermallystable compounds, their decomposition and transformation aredifficult [6,7,11]. This resulted in the lower emission of the elementsfrom Yima coal.
Table 2. char yield (wt%) and the contents of elements forShenhua coal g/g coal
Temperature Rawcoal
400 500 600 700
Char yield 97.75 93.65 87.80 81.41
Na 1334.2 1334.2 1331.5 1328.9 1299.1
K 2963.1 2963.1 2963.1 2960.1 2927.5Pb 13.1 13.1 13.1 12.5 11.8
Mn 41.8 41.8 41.8 41.7 40.8
Table 3. char yield (wt%) and the contents of elements for Yimacoal g/g coal
Temperature Rawcoal
400 500 600 700
Char yield 93.61 91.41 86.70 81.00
Na 893.2 846.6 843.0 835.0 823.3
K 627.0 610.1 605.7 604.4 595.7
Pb 6.2 5.8 5.7 5.5 5.3
Mn 70.6 67.2 67.1 66.9 66.5
P
1 2 3
4
5
1 furnace, 2 reactor, 3 gas in and out, 4 coal sample 5 thermocoupleFig 1. The schematic of high pressure closed fast pyrolysis apparatus

Fuel Chemistry Division Preprints 2002, 47(1), 204
In order to further demonstrate the relationships between thebehavior of the elements during heating and their chemical forms inthe coals, the distribution of the forms for the elements in Yima andShenhua coals were investigated. Results obtained for the elementsPb and Mn are presented in Table 4. It can be seen that Pb ispredominantly present as H2O solubles and residues in Shenhua coal.However, the residues are the main forms of Pb in Yima coal. It isconsistent with that Pb is often reported to be strongly associatedwith sulfur and Pb sulfides are H2O insoluble. In the experimentaltemperature range, residues are non-volatile compounds. This maylead to lower release of the elements from coals. H2O solubles of Pbwere found in Shenhua coal but not in Yima coal. This results in thedifference of initial emission temperature between two coals.However, percentage of Pb emitted (14.1%) up to 700oC is lowerthan that of H2O solubles (23%) based on total content in Shenhuacoal. This suggests that the H2O solubles of Pb is not released to gascompletely and partly converted into other forms during thermaltreatment. In addition, Mn in both coals is distributed in all the threeforms but H2O solubles fraction is negligible. This agrees with thenon-volatile behavior of Mn.
Table 4. Analysis of elements forms g/g coal
Pb Mnsolubles
Shenhua Yima Shenhua YimaH2O 1.7 0 1.2 0.1HCl 0 1.1 57.8 0.3
Residue 4.6 11.8 11.6 40.3
3.2 Influence of atmosphere. Fig 2 (a) and (b) show thechanges in content of Na, K, Pb and Mn in Shenhua coal duringpyrolysis in N2, H2 and CO2 atmospheres. Among the threeatmospheres, H2 results in the least elements retention and CO2 thehighest elements retention. The polymerization between siliceouschar and volatile compounds is favorable in oxidizing atmosphere [8].This may transform volatile compounds of Na, K, Pb and Mn intothermally stable compounds. In contrast, the high yield of volatile
compounds (gas +tar) under H2 (shown in Fig 3) increases theemission of the elements by transferring thermally stable compoundsinto low boiling point of compounds (such as chloride) [9]. As a result,H2 and CO2 resulted in obvious distinction on emission of the fourelements.
3.3 Influence of pressure. The effects of pressure on theretention of Na, K, Pb and Mn in Shenhua coal during pyrolysis weregiven in Fig 4. Although lesser amounts of the elements werereleased at 5MPa than at 0.1MPa, the effect of pressure is small. Twoimportant steps may affect the release of the elements: breaking ofchemical bonds and transfer of the volatiles from the coal pore to thegas phase. Generally speaking, the former is not sensitive to thepressure, but the latter is affected by the pressure. The higherpressure restrains the transfer of volatile compounds from the pore ofcoal and increases the possibility of the element retention in the char.The thermodynamic analysis also confirmed this [10].
Conclusions The effects of atmosphere, pressure and temperature on traceelements release behavior during thermal treatment were investigated.The elements studied are Na, K, Pb, and Mn. The order ofatmosphere influence on the emission of the elements is H2> N2>CO2. Although the effect of pressure is not significant, the higherpressure results in the lesser element emission. The emission of thefour elements is mainly dependent on temperature and their forms incoal. Acknowledgement. The authors gratefully acknowledge thefinancial support from the Special Founds for Major State BasicResearch Project, the Chinese Academy of Sciences, and the NaturalScience Foundation of China.
References(1). Manzoori, A. R.; Pradeep, K.; and Agarwal. Fuel, 1992, 71 (5), 513.(2). Peterson, J. R.; Lucke, V. H. Combustion, 1979, 50 (7), 29.(3). Feng, X.B.; Ni, J.Y.; Hong, Y.T.; Zhu, J.M.; Zhou, B.; Wang, Y.
Environmental Chemistry, 1998, 17 (2), 148.(4). Helble, J.J. Fuel Processing Technology, 1994, 39(1), 159(5). John Hodges, N. D.; and Richards, G. Fuel, 1989, 68(1), 440.(6). Han, C.l.; Zhang, J.; Liu, K.L.; Xu, Y.Q. Journal of fuel chemistry and
technology, 1999, 27(6), 575.(7). Huang, W.H.; and Yang, Q. Geological Science and technology
information, 1999, 18(1), 71.(8). Zhang, J.; Han, C.L.; and Liu, K.L. Journal of Engineering for Thermal
Energy and Power, 1999, 14(2), 83.(9). Enders, M.; Wilenborg, W.; Albrecht, J.; Putnis, A Fuel Processing
Technology, 2000, 68(1), 57.(10) Wang, X.F.; Sun, X.B.; and Li, M. Coal Conversion, 1999, 22(1), 58.(11). Sugawara, K.; Inoue, H.; Enda, Y.; Sugawara, T.; Shirai, M.In The 7th
China-Japan Symposium on Coal and C1 Chemistry Proceedings;P.R.China, 2001; pp.367-370
400 500 600 700450
500
550
600
800
850
900
950
1000
a
Na
K
Na
and
K c
onte
nt in
ch
ar(m
g/kg
-co
al)
Pyrolysis temperature(oC)
400 500 600 7004
5
6
65
70
75
80
b
Pb
Mn
Pb
and
Mn
cont
ent i
n ch
ar(m
g/kg
-coa
l)
Pyrolysis temperature(oC)
Fig 4. The effects of temperature and pressure on evolve of elements forShenhua coal in H2: Filled symbol, 0.1MPa; Open symbol 5Mpa.
a: The effect on Na and K; b: The effect on Pb and Mn
400 500 600 7000
5
10
15
20
25
N2
CO2
H2
yie
ld o
f v
ola
tile
(%
)
pyrolysis temperture(oC)
Fig 3. Yield of volatile for Shenhua coal during pyrolysis at 0.1MPa
0 100 200 300 400 500 600 700550
600
650
800
850
900
950
a
K
Na
N2
H2
CO2
Na
and
K c
onte
nt (
mg/
kg-c
oal)
Pyrolysis temperature(oC)
0 100 200 300 400 500 600 7004
5
6
60
65
70
75
b
Pb
Mn
N2
H2
CO2
Pb
and
Mn
cont
ent
(m
g/kg
-coa
l)
Pyrolysis temperature(oC)
Fig 2.The effect of atmosphere on evolve of elements in Shenhua coala The effect on Na and K b The effect on Pb and Mn

NITROGEN AND SULFUR RELEASE DURING HIGH TEMPERATURE PYROLYSIS OF COALS
Naoto Tsubouchi and Yasuo Ohtsuka
Institute of Multidisciplinary Research for Advanced Materials
Tohoku University Katahira, Aoba-ku, Sendai 980-8577, Japan
Introduction
The fate of the nitrogen and sulfur in coal during pyrolysis has been studied extensively with different reactors under various conditions1-5, since it is related with NOx and SOx emissions in the subsequent combustion process. However, most of researchers have paid no attention to the release of these heteroatoms from char after devolatilization. There have been only a few papers on this topic so far6-8.
It is of interest to make clear what factors can control such behavior during high temperature pyrolysis. The present work focuses on examining the influences of some factors on the nitrogen and sulfur release during coal pyrolysis at high temperatures of ≥ 1000oC, and on elucidating possible mechanisms. Experimental
Coal Samples. Ten coals with different ranks from different countries were used in this work. All the samples were air-dried at room temperature, ground and sieved to coal particles with size fraction of 150-250 µm. Their carbon, nitrogen, and sulfur contents ranged from 66 to 80 wt%, 0.9 to 2.0 wt%, 0.1 to 1.3 wt% on a dry ash-free basis, respectively.
Ca catalyst was loaded on the coal by using a saturated aqueous solution of Ca(OH)2 in a rotary evaporator at room temperature9. The Ca content in the dried sample was 3 wt%.
Pyrolysis. Pyrolysis runs were carried out with a fixed bed quartz reactor4, except for the use of a free-fall type quartz pyrolyzer under rapid heating conditions (104-105oC/s). After precautions against leakage, about 0.5 g of the sample was heated in a stream of high purity He (>99.9999%) at 400oC/min up to 1000oC-1350oC, soaked for 2 min, and then quenched to room temperature.
Nitrogen and Sulfur Analysis. Pyrolysis products were separated into gas, tar, and char in the same manner as described elsewhere4. N2 in the gas was detected with a micro gas chromatograph, and the HCN and NH3 were analyzed with a FT-IR equipped with a long-path gas cell. The nitrogen in the tar (tar-N) or in the char (char-N) was determined with conventional combustion-type elemental analyzers. H2S was analyzed by the Gastec standard tube. Yield of each nitrogen species or H2S is expressed in percent of total nitrogen or sulfur in feed coal, respectively.
Char Characterization. The XRD measurements of samples after pyrolysis were carried out with Ni-filtered Cu-Kα radiation (40kV, 30mA) to clarify crystalline forms and dispersion states of inherent minerals and added Ca. The average crystalline size of CaO was calculated by the Debye-Scherrer method.
Results and Discussion
Pyrolysis Temperature. When the changes in yields of N-containing products between 1000oC and 1350oC were examined with all the coals used, N2 was the dominant species and the yield increased almost linearly with increasing temperature with a corresponding decrease in char-N. On the other hand, yields of volatile-N (tar-N, HCN, and NH3) were almost unchanged.
The increase in N2 yield between 1000oC and 1350oC is plotted as a function of the decrease in char-N yield in Figure 1. There was a strong reverse correlation between N2 and char-N, though some data
were scattered at a larger extent of the decreased yield of char-N. The N/C ratios in the 1200oC and 1350oC chars, normalized to that in the 1000oC char, were lower at a higher temperature, irrespective of coal type. Thus, these observations point out that the N2 increased arises mostly from char-N after devolatilization.
0
10
20
30
40
0 10 20 30 4
Decreased yield of char-N, %
Incr
ease
dyi
eld
ofN
2,%
0
Figure 1. Relationship between N2 and char-N. Typical examples of H2S release between 1000oC and 1350oC
are illustrated in Figure 2, where H2S yield is given for AD, LP, and TG coals. The yield increased with increasing temperature, and the increment depended on coal type. Although recent XPS and XANES studies have shown a clear trend of a larger proportion of thiophenic sulfur at a higher carbon content in coal10, the increase in H2S yield observed between 1000oC and 1350oC was almost independent of coal rank. It is suggested that H2S formation under such conditions can not be correlated with the distribution of sulfur functional groups in coal.
0
20
40
60
80
100
1000 1200 1400
AD
LP
TG
Temperature, oC
H2S
yie
ld, %
Figure 2. Temperature dependence of H2S yield.
Fuel Chemistry Division Preprints 2002, 47(1), 196

Solid Residence Time. The dependence of yields of N2 and H2S for AD coal on solid residence time at 1300oC is illustrated in Figure 3, where heating rate is 104-105oC/s. Weight loss was almost unchanged with the time. Volatile matter in the present rapid pyrolysis was the same as or higher than that from proximate analysis, indicating complete release of volatile matter.
As is seen in Figure 3, a small amount of N2 was observed at time of 0 s. The yield increased with increasing time and reached 37% at 120 s. On the other hand, char-N decreased with time, as expected. H2S showed almost the same time dependence as N2, and H2S yield increased considerably from 38% at 0 s to 82% at 120 s.
Figure 3 also shows the H/C ratio in the char after pyrolysis at time of 30 s or 120 s, normalized to that at 0 s. The ratio was smaller at a longer time. There was a reverse correlation between the decrease in H/C and formation of N2 or H2S. Since the decrease means the occurrence of aromatization reactions of char, it is likely that the formation of N2 and H2S proceeds in the process of carbon crystallization.
Figure 3. Effect of solid residence time on normalized H/C and yields of N2 and H2S under rapid heating conditions.
Calcium Addition. Table 1 shows the effect of Ca addition on the changes in yields of N2, char-N, and H2S between 1000oC and 1350oC. The Ca2+ ions added on AB and AD coals enhanced N2 yield at high temperatures of ≥ 1000oC, but decreased char-N yield. The Ca on AD coal catalyzed N2 formation more remarkably. This would
be ascribed to the difference in the content of inherent Ca between both coals, that is, 1.8 wt%Ca for AB and 0.2 wt%Ca for AD, since the Ca added to a low rank coal with the higher content does not work efficiently. No changes in H2S yield for AB and AD coals by Ca addition were observed. In other words, the Ca suppressed H2S formation.
The XRD measurements after pyrolysis revealed that the Ca existed predominantly as CaO with the average size of 15-30 nm in the 1000oC chars derived from Ca-loaded AB and AD coals and promoted carbon crystallization at high temperatures above 1000oC. When temperature was raised to 1350oC, the sizes increased slightly. Thus, the reaction between CaO particles and char-N may occur in the process of carbon crystallization. The small peaks of CaS were also observed. These observations indicate that the highly dispersed CaO catalyzes efficiently conversion reactions of char-N to N2 at solid phase, and captures H2S evolved and/or reacts organic sulfur in the char.
A small XRD peak of CaO was also detectable in the chars from AB coal, though it was not observed for AD coal because probably of low content of inherent Ca. Therefore, the mineral-derived CaO can catalyze carbon crystallization, as observed in Figure 3. It is likely that N2 formation from char-N and sulfur capture by CaO occur through the same mechanism as in the pyrolysis of Ca-loaded coal.
0
20
40
60
80
100
0
0.2
0.4
0.6
0.8
1.0
0 20 40 60 80 100 120
N2
H2S
Residence time, s
Yie
ldof
N2
orH
2S,%
Nor
mal
ized
H/C
Conclusions
To make clear nitrogen and sulfur release from char after devolatilization, ten coals have been pyrolyzed at high temperatures of ≥ 1000oC with both a fixed bed reactor and a free fall type reactor. Yields of N2 and H2S increase with increasing temperature and solid residence time, whereas char-N decreases. The addition of 3 wt%Ca to low rank coals enhances N2, whereas it decreases yields of char-N and H2S. The Ca is transformed to fine particles of CaO, which catalyzes carbon crystallization. CaO particles may not only promote N2 formation through solid phase reactions of char-N but undergo sulfur capture reactions. Acknowledgment
This work was supported in part by the Basic Research Associate for Innovative Coal Utilization (BRAIN-C) Program, sponsored by the New Energy and Industrial Development Organization (NEDO), Japan. The authors gratefully acknowledge Ms. Hazuki Satake for her assistance in carrying out experiments. References 1. Solomon, P. R., Colket, M. B., Fuel 1978, 57, 749-755. 2. Chen, J. C., Castagnoli, C., Niksa, S., Energy Fuels 1992, 6,
264-271. 3. Bassilakis, R., Zhao, Y., Solomos, P. R., Serio, M. A., Energy
Fuels 1993, 7, 710-720. 4. Wu, Z., Ohtsuka, Y., Energy Fuels 1997, 11, 477-482. 5. Sugawara, T., Sugawara, K., Nishiyama, Y., Sholes, M. A., Fuel
1991, 70, 1091. 6. Tsubouchi, N., Ohshima, Y., Xu, C., Ohtsuka, Y., Energy Fuels
2001, 15, 158-162. 7. Tsubouchi, N., Ohtsuka, Y., Fuel, in press. 8. Garcia-Labiano, F., Hampartsoumian, E., Williams, A., Fuel
1995, 7, 1072-1079. 9. Ohtsuka, Y., Asami, K., Catal. Today 1997, 39, 111-125. 10. George, G. N., Gorbaty, M. L., Kelemen, S. R., Sansone, M.,
Energy Fuels 1991, 5, 93-97.
Table 1. Effect of Ca Addition on formation of N2 and H2S Change in yield between 1000oC-1350oC (%)
Coal Ca loading (%) N2 char-N H2S
AB 0 +13 -14 +4 AB 3 +15 -16 ±0
AD 0 +27 -32 +11 AD 3 +32 -35 ±0
Fuel Chemistry Division Preprints 2002, 47(1), 197

NOVEL METHOD TO SYNTHESIZE CARBON MOLECULAR SIEVES WITH PETROLEUM COKES
Ya LIU, Zi-Feng YAN *
State Key Laboratory for Heavy Oil Processing,
Key Laboratory of Catalysis, CNPC,
University of Petroleum, Dongying 257061, P R China
Introduction
Since Emmet found carbon molecular sieves (CMS) in 1948,
various starting materials, such as coal, polymer, nuts shell and so on,
have been used to synthesize CMS. Generally, the preparation
process consists of two steps as followed:
(1) Prepare carbon precursor with initial pore system by
carbonization or activation.
(2) Modify the pore texture of precursor by carbon deposition of
organic substance to satisfy different separation[ 1].
Petroleum cokes, especially ordinary cokes, are the main waste
residue of refinery and have not been made full use of so far.
Petroleum cokes contain high carbon content and low ash content,
which are expected to be the potential carbon resources. Developing
the application field of petroleum cokes is favorable to both of
environment and economy.
By now, there are many reports concerning the preparation of
high surface activated carbon from petroleum cokes. What we now
are interested in is how to control the pore texture of the porous
carbon for different purpose. In this paper, petroleum cokes were
used as starting material to prepare microporous carbon with sieving
ability and the product has been tentatively applied in air separation.
Experimental
Preparation of carbon precursor. The petroleum cokes were
crashed to particle of 20~40 mesh and then impregnated in
concentrated KOH aqueous solution in which the weight ratio of
KOH to cokes was 1.5. The mixture was dried at 373 K in drying
oven for several hours to form slurry and then moved into the reactor
to activate thermally. In nitrogen atmosphere, the sample was heated
at the rate of 10 K/min to a final temperature (1053~1123 K) and held
isothermally for a period of time (60~120 min). Finally, the sample
was cooled in nitrogen, washed to pH~7 and dried.
Modification of pore texture. The precursor was placed into
tubular flowing reactor and was heated to 1053 K in nitrogen
atmosphere and held isothermally for 60 min to get rid of surface
functional groups from precursor. Afterward, the reactor was cooled
to a certain pyrolysis temperature and then the hydrocarbon stream
was introduced. The precursor was exposed to the hydrocarbon for a
specified period. Following this treatment, the sample was degassed
in nitrogen at the same temperature for 60 min and then cooled to
ambient condition.[2]
Characterization of pore texture. The adsorption of nitrogen at
77 K was performed on Micromeritics ASAP2010 instrument to
characterize the pore texture. Data of micropore and transitional pore
were calculated by H-K and BJH method respectively.
Evaluation of sieving ability. Air separation was performed on
small-scale single volume PSA apparatus to evaluate the sieving
ability of the product. The size of the adsorption volume is 3.5×300
mm and the weight of adsorbent was about 1 g. The operating
procedures were as followed:
(1) Vacuumize for 3min.
(2) Introduce air and perform adsorption at ambient pressure
(3) Repeat the above two steps for several times to attain the
average result
Result and discussion
Influence of activation condition on the pore texture of
carbon precursor. Effect of activation time. Fig.1 and 2 showed
that micropore diameter of precursor increases initially and then
decreases along with activation time while the micropore volume
decreases at first and then increases with activation time. Furthermore,
the activation time correspondent with the minimum micropore
volume and the largest micropore diameter is coincidently in
agreement. It was speculated that the micropore forms initially and
then activation reagents gradually diffuse into the nanopore system
and continue erode and enlarge the wall of the micropore during the
activation, which leads to the increase of micropore volume and size.
Meanwhile, some micropores become so larger that they could turn
into transitional pore even macropores or connect with each other to
become larger, so the micropore volume decreases and micropore
becomes small. However, the subsequent corruption of the wall of the
larger pores results in the new micropore with smaller size, which
may increase micropore volume. The other reason why micropore *Corresponding author. E-mail: [email protected]
Fuel Chemistry Division Preprints 2002, 47(1), 189

diameter decreased may be the fragment of organic substance from
cokes blocked the micropore.
Fig. 4 Effect of activation temperature on the micropore volume
Fig. 1 The effect of activation time on the micropore size Modification of the textural properties by carbon deposition.
Pyrolysis of LPG. While liquefied petroleum gas was applied as
nanopore modifer of precursor, the operating condition, such as the
concentration of LPG, the pyrolysis temperature and pyrolysis time
were extensively investigated, unfortunately, it was in vain. The
modified product showed very weak air separation ability. Meanwhile,
it was found that the BET surface area and pore volume decrease
with the increase of pyrolysis temperature or pyrolysis time. Of
interests were that the loss of micropore volume is always more
severe than that of transitional pore (illustrated by Fig. 5) and that
micropore diameter became larger with the loss of micro pore volume
after carbon deposition (illustrated by Fig. 6).
Fig. 2 The effect of activation time on the micropore volume
Effect of activation temperature. Fig.3 and 4 illustrated that
both of micropore diameter and micropore volume increased initially
and then decreased as temperature rose. However, the culmination
temperature is not the same. It means that higher activation
temperature accelerated the process of nanopore or micropore
generation, but excessive high temperature resulted in the shrinkage
of the micropore. The key to synthesize ideal precursor is to optimize
activation temperature.
Fig. 5 Profile of pore volume loss percentage
Fig. 3 The effect of activation temperature on the micropore size
Fig. 6 Relation between micropore diameter and volume loss Nanopore structure. Sample AC-3# bears abundant and smaller
size micropore with rather narrower nanopore distribution (Table 1),
which was the selected carbon precursor that subjected to further
treatment. It means that thermal activation assisted by KOH is
feasible to synthesize optimum carbon precursor with initial nanopore
structure. Of course, the activation condition must be seriously
controlled.
According to a widely accepted pore texture modal, porous
carbon bears macropore, transitional pore and micro pore.
Transitional pore is branched off from macropore and micropore is
branched off from transitional pore. Macropore and transitional pore
serve as a passage of gas molecular and micropore practices
separation in deed. Gas-solid heterogeneous reaction such as carbon
deposition consists of external diffusion, internal diffusion,
Fuel Chemistry Division Preprints 2002, 47(1), 190

Fuel Chemistry Division Preprints 2002, 47(1), 191
adsorption, surface reaction, desorption, internal diffusion and
external diffusion. Simultaneously, the homogeneous pyrolysis of
hydrocarbon must be taken into account. So where the carbon
deposition will occur depends on the relative speed of each step.[3]
Therefore it was speculated that hydrocarbon molecular (or the
product of homogenous pyrolysis) could easily enter the transitional
and micropore. The carbon from pyrolysis either filled the micro pore
or congested the opening of the micro pore located on the wall of the
transitional pore. Moreover carbon molecular perhaps occurred on
the wall of transitional pore, diminished the size of the pore and
formed new micropore. Because smaller micropore tends to be
blocked and the size of newly formed micropore is larger, so in
general the average diameter of micropore increases.
Pyrolysis of butene. The available results were indicated in Table 2.
Compared with the pyrolysis of LPG, butene is rather feasible to
modify the nanopore of carbon molecular sieve samples. The
nanoporous CMS sample indicated the favorable air separation ability.
It means that the complexity of LPG constitute and too lighter lead to
be difficult to control the pyrolysis reation.
The air separation performance of a commercial CMS was
compared on the same apparatus under the same operating conditions.
The concentration of nitrogen was 92.751%. We will also investigate
the influences of butene concentration, flow velocity, cracking time
and temperature.
Effect of carbon precursor. Another carbon precursor (AC-7,
showed in Table 1) was used to repeat the above experiment of
butene. The product exhibited no air separation ability. It means that
the nanopore properties of precursor is very important to do
subsequent modification of nanopore.
Conclusions
(1) Petroleum cokes were feasible to be the starting material for
producing carbon molecular sieves.
(2) Nanoporous carbon precursor could be synthesized by thermal
activation assisted by KOH activator.
(2) During the carbon deposition procedure, the kind of hydrocarbon
and the pore texture of precursor are critical. Butene might be the
optimum feed to modify the nanopore structure of CMS samples.
(3) The theory concerning the gas-solid heterogeneous reaction
should be tentatively introduced to elucidate carbon deposition
mechanism.
Acknowledgement. This program was financially supported by Key
Teacher Foundation, Department of Education, China. Prof. Qian L.,
Song C.-M. And Dr. Liu X.-M., who give many beneficial
discussions on this paper, were acknowledged.
Reference
(1) Shaoping, Xu; Shucai, Guo. Coal Conversion,1995,18(3),43
(2) S.K.Verma; P.L.Walker,Jr. Carbon, 1993, 31(7), 1203
(3) M.M.A.Fereitas; J.L.Figueiredo. Fuel, 2001, 80,1
Table 1. The Properties of Carbon Precursor
Activation
temp. (K)
Activation time (min)
Micro-pore
diameter (nm)
Micro-pore
Volume (cm3/g)
Micropore volume/
total pore volume
(%) AC-3 1053 120 0.74 0.29 80.78 AC-7 1123 60 0.80 0.23 76.73
Table 2. The Carbon Deposition of Butene
Sample Cracking temperature (K)
Concentration of nitrogen (vol.%)
CD-1 CD-2 CD-3 CD-4
Commercial CMS
973 993 1013 1033 ----
83.31 84.67 83.52 83.79 92.75

Fuel Chemistry Division Preprints 2002, 47(1), 185
PYROLYSIS YIELDS OF COAL TAR PITCHES:EFFECT OF POLYMERIZATION ADDITIVES
M. Mercedes Maroto-Valer, Yinzhi Zhang,Brandon N. Shaffer and John M. Andrésen
Department of Energy and Geo-Environmental Engineering andThe Energy Institute, The Pennsylvania State University,
University Park, PA 16802.
IntroductionThe pyrolysis of coal tar pitches is associated with the
emission of hazardous and carcinogenic polyaromatichydrocarbons (PAHs) resulting in strong environmental andcommercial challenges from the carbon industry (1). In order toprevent the shortcomings of the weight loss of coal tar pitchesduring pyrolysis, while optimizing their properties, a series ofadditives are routinely used to achieve high carbon yields uponbaking or pyrolysis (2, 3). These additives typically includesulfur compounds that promote the polymerization of coal tarpitches and therefore increase the carbon yields. Although thesesulfur additives effectively increase the carbon yields, they alsoevolve detrimental sulfur species upon baking. Accordingly, thiswork compares the pyrolysis yields of conventional sulfuradditives as well as a series of alternative additives on basis of thepitch yield.
ExperimentalThe coal tar pitch and calcined coke samples used for this
study were supplied by Carbone of America. Thethermogravimetical analysis (TGA) were carried out on a PerkinElmer TGA-7 with a heating rate of 5°C/min from ambient up to900°C, using about 10 mg of sample under a flow of N2. Theproduction of green carbon bodies was conducted following aprotocol previously established by the investigators (4). Thepaste mix was heated to ~130°C and pressed into pellets to producecarbon bodies with dimensions of ~ 27mm in diameter and 15mmin height. The absolute densities of the pellets were measured byusing a Quantachrome MVP-1 Multi Pycnometer and employinghelium as density medium. The green bodies were baked in aclosed system by placing them inside crucibles and covering themwith calcined petroleum coke. The crucibles were then placedinside a muffle furnace and the baking program used was asfollows: (1) 25-500°C at 10°C/hour; (2) 500-1075°C at 25°C/hour;and (3) held at 1075°C for 16 hours, providing an overall length ofaround 5 days for a completed baking and cooling cycle. Closedenvironments and slower baking programs have been previouslyreported to result in significant higher pitch yields and apparentand helium densities than those reported for open systems (5).
Results and DiscussionComparison of pyrolysis pitch y ie ld . The thermal
gravimetric profiles of the pitch alone and its mixtures withadditives A1 and A2 are shown in Figure 1. The investigated pitchstarted losing weight at temperatures above 150°C and lost around62 wt% during its carbonization at temperatures up to 850°C.When the pitch was mixed with different concentrations of theadditive A1, the weight loss at 850°C was reduced, indicating animprovement in the solid yield, compared to that of the pitchalone. Furthermore, the pitch yield increased with the amount ofadditive at concentrations up to 10 wt% addition of A1 (3). Theinitial weight loss observed for the pitch/additive mixture wasattributed to weight loss directly associated with the additive A1,
as also indicated by the fact that the mixture with the highestadditive content started losing weight at lower temperatures.
40
50
60
70
80
90
100
Wei
ght r
emai
ning
/ %
0 200 400 600 800
Temperature / °C
Pitch+10%A1+1%A2
Pitch+1%A2
Pitch+10%A1
Pitch
Figure 1. Comparison of the pyrolysis TGA traces for the coaltar pitch alone and mixed with additives A1 and A2.
A second additive A2 was also investigated and showed thatwhen the pitch was mixed with only 1 wt% of A2, the weight lossat 850°C was reduced, indicating an improvement in the solidyield, compared to that of the pitch alone. Therefore, lowerconcentrations of additive A2 produced similar pitch yields tothose observed at higher concentrations of additive A1. When thepitch is mixed with hybrid additives (10 wt% of A1 and 1 wt% ofA2) the weight remaining at temperatures above 400°C is higherthan when using only A1 or A2 (Figure 1). As previouslyobserved for single additives, the pitch/additive A1+A2 mixturestarted to lose weight at temperatures lower than the pitch alone(120°C vs. 150°C) and presented larger weight loss than the pitchalone in the temperature range 120°C-300°C, due to weight lossdirectly associated with the additives (3). The pitch yieldsobserved for the hybrid mixture were higher than those reportedfor the single additives, indicating that a possible synergisticeffect takes place when adding both additives.
Sulfur additives, namely S1 and S2, were also tested tocompare their performance with the alternative polymerizationadditives A1 and A2. When adding 1 wt% of S1, the pitch weightloss decreased from 62 wt% to around 58 wt% at 850°C. Similarpyrolysis pitch yield was reported when adding 1 wt% of A2,indicating that the additive A2 has similar performance in terms ofpitch yield to S1. However, the mixture of pitch with sulfuradditive S1 presents very similar weight loss profile to that of thepitch alone at temperatures <200°C, while the additives A1 and A2presented higher weight loss in that temperature range. Thepyrolysis pitch yields at 850°C of all the additives mixtures arecompared in Figure 2. The alternative additives A1 and A2, have atleast equal or superior performance in terms of pitch yields thanconventional sulfur additives S1 and S2. Furthermore, the mixtureof pitch with 10 wt% additive A1 presented higher pitch yield thanthe other mixtures, including those of the sulfur additives S1 andS2. The pitch yields observed for the hybrid mixture were higherthan those reported for the sulfur additives. Finally, the pitchyields obtained from the thermogravimetric studies are generallylow, due to the open system used as well as the high heating rates(5).
Fuel Chemistry Division Preprints 2002, 47(1), 186
30
35
40
45
50
Pyro
lysi
s pi
tch
yiel
d / w
t%
Pitch P+10%A1 P+1%A2 P+1%S1 P+1%S2
Figure 2 . Pyrolysis pitch yields for the pitch alone and themixtures with the different additives.
Comparison of pyrolysis pitch baking yields f o ralternative additives and sulfur addit ives . Carbonbodies were prepared using the alternative additives A1 and A2 aswell as the sulfur additives S1 and S2 to compare their pitch yields.The green carbon bodies prepared with S1 and S2 contained sevendifferent particle size coke fractions, while the green carbonbodies prepared with the A1 and A2 additives only contained twocoke fractions. Table 1 shows that the apparent and heliumdensities of all the green carbon bodies prepared with the differentadditives were very similar, indicating that the additives did nothave any impact in the density of the carbon body produced.
Table 1. Apparent and helium densities for the green carbon bodies.
I. D. Apparent Density g/cc Helium Density g/cc
CB 1.574 1.783
CB-A1* 1.762 1.829
CB-A2* 1.764 1.843
CB-S1 1.683 1.791
CB-S2 1.710 1.752
* Formulation comprises two coke fractions, while the otherformulations comprise seven coke fractions.
Table 2 shows the pyrolysis pitch yields and the heliumdensities of the baked carbon bodies prepared with the additivesA1, A2, S1 and S2. The baking temperature was 1075°C, aspreviously described. The helium densities of all the baked bodiesare in the range 2.031-2.097g/cc (Table 2).
Table 2. Pyrolysis pitch baking yields and helium densities for the bakedcarbon bodies.
I. D.Baking
Temperature
°C
PitchYield
%
HeliumDensity
g/cc
CB-1075 1075 69.5 2.077
CB-A1-1075* 1075 73.4 2.097
CB-A2-1075* 1075 75.8 2.093
CB-S1-1075 1075 72.7 2.057
CB-S2-1075 1075 72.5 2.031* Formulation comprises two coke fractions, while the other formulationscomprise seven coke fractions.
Figure 3 shows the pyrolysis pitch baking yields of thecarbon bodies. When using the A1 and A2 additives, the pyrolysisyields are slightly higher than the yields of the bodies prepared
using the S1 and S2 sulfur additives. One caveat in thiscomparison is the different formulations used, where the carbonbodies prepared with the S1 and S2 sulfur additives containedseven different coke fractions, while the green carbon bodiesprepared with the A1 and A2 additives only contained two cokefractions. Accordingly, further studies will be conducted to assessthe effect of the coke formulation and also to investigate higherconcentrations of S1 and S2 additives.
60
65
70
75
80
Pyr
olys
is p
itch
bak
ing
yiel
d / w
t%No Add 10%A1 1%A2 1%S1 1%S2
Figure 3. Pyrolysis pitch baking yields for the carbon bodies.
C o n c l u s i o n sThere is a clear need to reduce the emissions of PAHs from
coal tar pitches by improving the pyrolysis yield. This study hasshown that all the polymerization additives tested thus far increasethe pitch yields, with the highest pitch yields corresponding tothe hybrid additives A1+A2. The polymerization additives tested,A1 and A2, present higher yields than the S1 and S2 sulfuradditives tested. The helium and apparent densities of the greenand baked carbon bodies are very similar, regardless of the type ofadditive used.
Acknowledgements . The authors would like toacknowledge the Carbon Research Center of The PennsylvaniaState University for support.
References(1) Cirovic D.; Brereton R.G.; Walsh P.T., Ellwood J.A.;
Scobbie E. Analyst, 1996, 121(5), 575.(2) Zhang, Y.; Maroto-Valer, M.M.; Andrésen, J., Proc. of
Carbon’01, July 14-19, 2001, CD paper.(3) Andrésen, J.M.; Zhang, Y.; Jensen, K.; Rusinko, F.J.;
Schobert, H.H.; Prepr. Am. Chem. Soc. Div. Fuel Chem.,2001, 46(1), 292-293.
(4) Maroto-Valer, M.M.; Andrésen, J.M.; Andrésen, C.A;Battista, J.J., 1999 Int. Ash Utilization Symposium, 534-540.
(5) Maroto-Valer, M.M., Andrésen, J.M., and Zhang, Y., 2001,Carbon Research Center, Tech. Transfer Session ProgressReport, The Pennsylvania State University, May, 2001.

Fuel Chemistry Division Preprints 2002, 47(1), 183
Ruthenium ion catalyzed oxidation as a tool for thecharacterization of pyrolysis non-volatile products
Marco Antonio G. Teixeira, Maria Luísa A. Gonçalves, RosanaC. L. Pereira
PETROBRAS R&D Center/ChemistryCidade Universitária, 21949-900, Rio de Janeiro, RJ, Brazil
IntroductionProcessing high-density petroleum feeds, that are
nowadays very important in the scenario of fossil fuel supplies,brings naturally the challenge of dealing with abundances ofheavy ends and coke precursors. On the other hand, theoptimization of refining facilities to deal with such feeds bringseconomical competitiveness, since these oils have low prices inthe international market.
Studies on pyrolysis mechanisms are quite importantunder this aspect. Coking units, for example, which havetraditionally been the second places among refining units, afterFCC, may have their operation optimized with deeper knowledgeon the pyrolysis mechanisms. Even the operation of FCC units,specially the ones processing distillation residua as part of theirfeed or its integrality, may take advantage of pyrolysis studies,since in these cases a meaningful portion of the coke formed in thereversible deactivation of the catalysts may come from thermaldegradation of the feeds. In summary, as previouly stated bySpeight (1), the key for optimization in the conversion of heavyresidua lies on the understanding of coking phenomena, thoughthe understanding of the main coke percursors, which areasphaltenes. In a previous study of thermal decomposition ofasphaltenes, that author (2) had worked on the thermaldecomposition of asphaltenes from 300 to 900ºC, and observedthe occurrence of low molecular weight species in the volatileproducts. The most complex aromatic systems remain as coke, thenon-volatile residue (45 % in weight).
Many efforts on the understanding of pyrolysismechanisms can be found described in literature, and a maintechinque for that is thermogravimetry, mainly if coupled to GC-MS; however, most of them are dedicated to the study of thevolatile products formed (3-9). Of course those fractions are themost important ones from the economical point of view, sincethese are the ones that can be converted to valuable fuel products;nevertheless, the fact that completely established analyticalapproaches for the characterization of the coke formed do not existis a major limitation to the study of this fraction, which is quiteimportant to bring a full comprehensive analysis of pyrolysisphenomena.
This paper brings a novel approach for that aim.Ruthenium ion catalyzed oxidation (RICO) is employed to allow abetter characterization of the coking process. That reagent allowsselective oxidation of aromatic structures. CO2 is the product ofthese oxidations in aromatic carbons. Alkyl side branches yieldcarboxylic acids, while naphtheno-aromatics and chainsconnecting two aromatic nuclei yield dicarboxylic acids.Condensed aromatics yield mainly dicarboxylic aromatic acids (e.g., the main product of the oxidation of naphthalene is phthalicacid).
Since coke is basically constituted by aromatic nucleiwith aliphatic branches, the relative yields and the distribution ofproducts can be expected to be an indication of coke structure.This was confirmed in the present work. The application proposedwas employed for the monitoration of the different structures of
coke generated by the pyrolysis of asphaltenes at severaldecomposition temperatures.
So, conditions were proposed to execute the RICO reactionwith coke. The strategy considered here is to employ thischaracterization scheme as a complimentary source of informationto the study of volatile product formation, which can be monitoredby some of the techniques mentioned above.
Experimental Procedures and ResultsFor a perfect control of the conditions of pyrolysis of
asphaltenes, a TG oven was employed. The collection of volatilematerial was achieved by passing the effluent gas stream intodichloromethane. Previous experiences employing TG-GC-MSshowed that interface optimization can be necessary for that. Thescope of this work did not aim the characterization of theseproducts; that has been discussed elsewhere (10).
Asphaltenes from a Brazilian oil obtained by IP-143 were thematerial chosen to undergo pyrolysis . Table 1 shows theelemental analysis and aromaticity (ratio of the area of theenvelope in the range of 160-100 ppm and total area of solid state13C NMR spectra) of those asphaltenes and cokes obtained aftertheir pyrolysis at several temperatures.
Table 1. Characterization of Asphaltenes Submitted toPyrolysis and Cokes Obtained at Several Temperatures
Temperature(°C)
Coke(weight %)
%C %H % aromaticcarbon
Atomic ratio(C/H)
-* -* 85.8 8.4 55.5 0.85
320 94 85.9 7.8 60.9 0.92
380 90 86.2 7.6 66.8 0.95
400 87 86.3 7.2 67.8 1.00
440 65 85.7 6.2 75.5 1.15
480 53 88.7 4.1 82.3 1.80
550 51 87.0 3.3 97.8 2.20
580 50 86.4 2.7 99.0 2.67*original asphaltenes
The RICO reaction was performed using an adaptation fromliterature (11,12). The procedure consists of stirring, 150 mg ofasphaltenes or pyrolysis residues obtained at each temperature, at40ºC for 24 hours with CCl4 (20 mL), NaIO4 (3.4 mg), H2O (30mL), acetonitrile (20 mL) and RuCl3.H2O (7 mg).
The resulting two layers are separated and the organic phase,after being concentrated, was mixed with excess of etherealdiazomethane.
The ethereal solution was analyzed submitted by a gaschromatography/mass spectometry (GC/MS) for methyl esteranalysis. Samples were injected with the previous addition of aninternal standard in splitless mode using a 5%-phenyl 95%-methyl siloxane capillary column (30 m x 0.25 cm x 0.25 µm) andhelium as carrier gas. Mass spectrometer was operated in electronimpact ionization mode (70 eV) and scanned from 15 to 450 m/z.
As long as similar conditions were employed in all of theoxidation procedures, a comparison by the absorbance at the samewavenumber of the esters obtained after oxidation and reactionwith diazomethane could be considered an indication of therelative yields. This was possible by doing equal dilutions ofisolated materials after each reaction and recording the infraredspectra of the solutions.
Table 2 shows a comparison the ratios of the total responses ofthe esters of the cokes obtained at different temperatures to the

Fuel Chemistry Division Preprints 2002, 47(1), 184
total responses of the esters obtained form the asphaltenes byGC/MS (total ion area with corrections were made using the areasof the internal standard) and infrared spectrophotometry(absorbances). These data cannot be taken as quantitative orstrictly comparable ones, since it is well known that MSresponses and infrared absortivities vary with the distribuiton ofcomponents in each sample, and the analyses refer to the reactionproducts, which are mixtures of different components dependingon pyrolysis temperature. However, it can be seen that there arebasically 3 groups into which the pyrolysis temperatures can bedivided: before 380ºC there is no meaningful variation, while after440ºC there are no more appreciable amounts of nonpolycondensed aromatic material. In fact, kinetic studies (10)show that the temperature in which pyrolysis has its maximumspeed is 425°C.
Table 2. Indications Of Relative Yields Of Esters From TheOxidation Of Cokes (Ratio To The Responses From
Asphaltene Oxidation) By 2 TechniquesTemperature
(°C)Infrared MS
320 0,95 0,94
380 0,47 0,76
400 0,45 0,69
440 0,13 0,04
480 0,11 0,04
550 n.r.* 0,01
580 n.r. * n.r. *
*negligible responses
Figure 1 summarizes the main classes of esters found by MSand shows the relative abundance of each of these classes, in termsof the ratios of their collective area in total ion chromatograms tothe area of the internal standard (raid). It can be seen that linearchain esters are the most important ones in asphaltenes and in lowtemperature coke, indicating the abundance of linear aliphatic sidechains in these samples.
0.0
10.0
20.0
30.0
40.0
asphaltenes 320 380 400 440 480 550 580
area R-COOCH3
R-(COO)2CH3
C6H5-(COO)2CH3
Figure 1. Yields of esters after RICO of cokes obtained byasphaltene pyrolysis at several temperatures
Figure 2 shows that, as a general tendency, the higherthe number of carbons, the lower the temperature the side chainsundergoes pyrolysis.
0
0.5
11.5
22.5
33.5
4
4.5
5
C7 C9C11 C13 C15 C17 C19 C21 C23 C25
number of carbons in ester chain
raid
Asphaltenes
320
380
400
440
480
550
580
Figure 2. Distribution of monoesters after RICO of cokes obtainedby asphaltene pyrolysis at several temperatures
ConclusionsRICO followed by esterification of the oxidation
products is a useful tool to the study of pyrolysis material (coke).It allowed some important inferences, about the fact that the profileof remaining components after heating asphaltenes dramaticallychanges in temperatures above 440°C, about the distribution ofaliphatic chain lengths in cokes obtained at different temperatures,and about the tendency of ease of the alkyl groups bonded toaromatic nuclei to undergo pyrolysis according to the number ofcarbons in the chain. Future studies by the authors aim theintegration of the data into a reasonable pyrolysis pathway.
References(1) Speight,, J. G., . Prepr. Pap. - Am. Chem. Soc., Div. Fuel Chem, 1994,
39(2), 200.(2) Speight, J.G., In Characterization of heavy crude oil and petroleum
residue, Ed. Technip: Paris, 1984, pp.29-32.(3) Wilhems, A., Larter, S.R., E Schulten, H.R., Org. Geochem., 20(7),
1993, 1049.(4) Skjevrak, I., Larter, S. Graas, G.V., Jones, M. Berger, E., Org.
Geochem., 1993, 22(3/5), 873.(5) Eglinton,T.I., Larter, S.R., Boonmj.J., J. Anal. Appl. Pyr., 1991, 20, 25.(6) Jones, D.M., Douglas, A.G., Energy & Fuels, 1987, 1, 468.(7) Bestougeff, M.A., Guiochon, G., Jaqueé, J. Compt. Rend., 1962, 254(2),
266.(8) Nicksic, S.W., Jeffries-Harris, M. J., J. Inst. Petrol., 1968, 54(532), 107.(9) Calderon, J.L., Cotte, E., Rev. Tec. INTEVEP, 1983,3(1), 69.(10) Gonçalves, M. L. A., Teixeira, M. A. G., Pereira, R. C. L.,
Mercury, R. L. P., Matos, J. R., J. Therm. Anal. Cal., 2001, 64, 697.(11) Strausz, O.P., Mojelsky, T.W., Montgomery, D.S., Aostra J. Res.,
1985, 2(2), 131(12) Murata, S., U-Esaka, K., Ino-Eu, H. Nomura, M., Energy &
Fuels, 1994, 8(6), 1379.255-274.

Fuel Chemistry Division Preprints 2002, 47(1), 169
SIMULTANEOUS COAL GASIFICATION AND CO2
SEQUESTRATION USING A FLUIDIZED BED OFACTIVATED SERPENTINE
Zhong Tang, M. Mercedes Maroto-Valer, Yinzhi Zhang,Matthew E. Kuchta, John M. Andrésen and Scott A. Bair
209 Academic Projects Building, The Energy InstituteThe Pennsylvania State University, University Park, PA 16803
IntroductionCoal has been the main energy supplier over a century and
will continue being an important energy source in the 21stcentury. Unfortunately, all the coal utilization technologies usedtoday, such as combustion and gasification, are inevitablyassociated with CO2 emissions, and subsequently linked to thegreenhouse effect and climate change by the public opinion.Therefore, the greatest challenge to achieve no environmentalimpact or zero emission in the 21st Century Energy Plant i sprobably the elimination of greenhouse gases emissions.1
Mineral carbonation, that involves the reaction of CO2 withnon-carbonate minerals, such as serpentine, to form stable mineralcarbonates, has been lately proposed as a promising CO2
sequestration technology due to the vast natural abundance of theraw minerals, the long term stability of the mineral carbonatesformed, and the overall process being exothermic, and therefore,potentially economic viable.2 Furthermore, mineral carbonationtechnologies could potentially provide a direct path to removeCO2 when integrated with other systems, such as gasificationprocesses. Using CO2 sequestration as a part of the gasificationprocess can be a highly efficient, environmental friendly andeconomical alternative to combustion technologies, since thevolume of fuel gas in gasification is significantly lower than thatof flue gas generated by combustion. In addition, theconcentration of CO2 is higher in fuel gas than in flue gas3.
In the present study, a lab-scale fluidized bed gasificationunit was used to investigate the effect of in-bed carbon dioxideremoval during coal gasification using activated serpentine,which was produced by the novel active carbonation concept. 4
ExperimentalChar Samples. For this study, a char was chosen instead of a
coal to prevent problems that may arise from the evolution of tarswithin the gasifier bed. The char used was collected from thecyclone of a coal combustor unit. Table 1 lists both the proximateand ultimate analysis for the coal char investigated. Apetrographic study showed that the char contained mainlyanisotropic carbon.5 The char was grinded and the particle fractionbetween 60-100mesh (150~250µm) was collected and used for thegasification experiments.
Table 1. Proximate and ultimate analysis for the coal charinvestigated (dry ash basis).
C H N S+O* Moist. Ash VM FC
84.76 0.02 1.22 0.26 0.17 13.74 1.97 84.30
* Calculated by difference.
Serpentine Samples. The serpentine samples come from theCedar Hills, USA. The particle size of the serpentine was less than100mesh. Both the raw serpentine and activated serpentine (A-SP) samples were characterized by N2 adsorption isotherms usinga Quantachrome Aotusorb-1 at 77K. The raw and activated
serpentine samples were placed in the fluidized bed gasifier andused simultaneously as fluidizing and carbonation agents.
Gas analysis. An Agilent 3000A Micro GC was used toanalyze on-line the gas composition. The instrument has twochannels with thermal conductivity detectors (TCD) that arecapable of performing gas analyses within seconds. There is a10m×0.32mm MolSieve 5A PLOT column and an 8m×0.32mmPLOT U column in channel A and B, respectively. Channel Auses Argon as carrier gas and Channel B uses Helium as carriergas. The column temperature is 100 and 90oC for channel A and B,respectively.
Gasification experiments. The gasification tests wereconducted in a lab scale bench fluidized bed gasifier. The diameterof the gasifier was 45mm. Typically, around 20g char or 20g charand 2g serpentine was put into the gasifier for each run. Thereactor was heated up to the desired temperature under N2, andthen steam mixed with N2 was fed into the gasifier to conduct thegasification reaction. In present study, the operation temperaturewas 950oC and the total gas flow rate was 1,475mL/min(67.73%vol steam). The composition of the produced gas was on-line analyzed using the Agilent 3000A Micro GC.
Results and DiscussionCharacterization of raw and activated serpentine samples.
Figure 1 shows the N2-77K adsorption isotherms for the raw andactivated serpentine samples. For the activated serpentine, theadsorbed volume increases rapidly at low relative pressure, but i tkeeps increasing progressively, and there is a distinct hysteresisloop in the isotherm, which indicates that the sample porosity is amixture of micropores (<2nm in width) and mesopores (2-50nm inwidth). Compared to the raw serpentine, the activated sample hasdeveloped significant microposity. The adsorbed volumeincreases significantly for the activated sample compared to that ofthe raw serpentine sample, indicating that the activation processhas increased the surface area of the activated sample. Indeed, theBET surface area has gone up an order of magnitude to 142m2/gcompared to only~16m2/g for the raw serpentine.
0000
22220000
44440000
66660000
88880000
111100000000
0000....0000 0000....2222 0000....4444 0000....6666 0000....8888 1111....0000
P/Po
V, m
l/g
Serpentine, raw <100meshActivated Serpentine
Figure 1. N2 77K isotherms of the raw and activated serpentinesamples.
Char gasification with and without activated serpentineaddition. Figure 2 shows the variation of the gas compositionwith reaction time for the char gasification experiment withoutserpentine. It can be seen that the concentrations of H2, CO andCO2 are lower than previously reported by the authors for coalgasification.6 This could be due to the low reactivity of the coalchar used. The water decomposition ratio here was just 16.67%,which is much lower than average 30% level. 6 In addition, agasification experiment of the char mixed with activated serpentinewas conducted at the same operation conditions as for the charalone gasification (Figures 3-4).

Fuel Chemistry Division Preprints 2002, 47(1), 170
0000
22220000
44440000
66660000
88880000
111100000000
0000 22220000 44440000 66660000 88880000 111100000000
Reaction Time(min)
Volu
me%
HHHH2222 CCCCOOOO CCCCOOOO2222 NNNN2222
Figure 2. Variation of the gas concentration with reaction time forthe char alone gasification experiment.
Figures 3 and 4 show the variation of CO2 and CO+H2
concentrations in the fuel gas with reaction time for the char andactivated serpentine (A-SP) gasification compared to that of thechar alone gasification. As expected, the CO2 concentrationdecreased for the char+A-SP gasification experiment, and at thesame time, the CO+H2 concentration increased compared to that ofthe char alone gasification. During the relative steady gasificationperiod (between 15~70mins), for the char+A-SP gasification, theaverage CO2 concentration was 4.61%vol, and the average CO+H2
concentration was 27.03%vol. For the char only gasification, theaverage CO2 and CO+H2 concentrations were 5.14%vol and26.44%vol, respectively. Therefore, the CO2 concentrationdecreased about 10% (from 5.14% to 4.61%), while the CO+H2
concentration increased about 3.25% (from 26.44% to 27.30%) forthe char gasification when activated serpentine was added. Thisindicates that the activated serpentine could have reduced theCO2 concentration in the fuel gas, possibly due to mineralcarbonation reactions. Further characterization studies of theactivated serpentine minerals after gasification are beingconducted to understand its role during the gasification process.
0000
2222
4444
6666
8888
11110000
0000 22220000 44440000 66660000 88880000
Reaction Time(min)
CO
2%
CCCChhhhaaaarrrrCCCChhhhaaaarrrr ++++ AAAA----SSSSPPPP
Figure 3. Variation of CO2 concentration in the fuel gas withreaction time for the char and activated serpentine (A-SP)gasification compared to that of the char alone gasification.
0000
11110000
22220000
33330000
44440000
0000 22220000 44440000 66660000 88880000
Reaction Time(min)
(CO
+H2)
%
CharChar + A-SP
Figure 4. Variation of CO+H2 concentrations in the fuel gas withreaction time for the char and activated serpentine (A-SP)gasification compared to that of the char alone gasification.
The water shift reaction (H2O + CO ↔ CO2 + H2), which willdetermine the gas composition is a crucial reaction duringgasification process. Accordingly, the rate constants of water gasshift for the char alone and char+A-SP gasification experimentswere calculated, and Figure 5 shows the variation of the rateconstant with reaction time. It was found that the rate constantwas higher at the beginning of the gasification and then decreasedslowly with gasification process, keeping virtually constant forreaction times over 75 minutes. The rate constant for the char+A-SP gasification is lower than that for the char alone gasification.The rate constants reported here are lower than the theoreticalequilibrium constant (about 0.45 at 950oC). The variation of thereaction rate constant with different operation conditionsindicates the magnitude of the driving force for the water gas shiftreaction to occur in the positive direction. When activatedserpentine is used in the gasifier bed, there is a reduction of theCO2 concentration in the flue gas, suggesting that mineralcarbonation of the activated serpentine during the gasificationprocess could potentially produce high quality syngas (CO+H2)with low CO2 content.
0
0.1
0.2
0.3
0.4
3 15 27 39 51 63 75 87
Reaction Time(min)
[CO
2][H
2]/[C
O][
H2O
] Char +A-SP
Char
Figure 5. Variation of rate constant for the water shift reactionwith reaction time.
ConclusionsIn this work, a lab-scale fluidized bed gasification unit was
used to investigate the effect of in-bed carbon dioxide removalduring coal gasification using activated serpentine. There was animprovement in the quality of the fuel gas produced (reduction ofCO2 concentration and an increase in the CO+H2 content) whenactivated serpentine was added in the gasifier bed. It seems thatthe carbonation reaction may have occurred during thegasification process in order to reduce the CO2 concentrations.Further work is underway to study the reaction mechanisms ofsimultaneous gasification and carbonation, and to develop aprocess that can integrate gasification and sequestration in orderto produce high purity H2 with zero emission of CO2.
Acknowledgements. The authors wish to thank the Department ofEnergy and Geo-Environmental Engineering and the at PennState University for supporting this work.
References1. DOE/NETL, Version 21 Program Plan, Office of Fossil Energy, U.S.
DOE, 1999.2. DOE/OS-FE, Carbon Sequestration. State of Science, Office of Fossil
Energy, DOE, 19993. Tang, Z. and Wang, Y., Fuel Processing Technology, 2000, 62(2-3),
137-141.4. Maroto-Valer, M.M., Fauth, D., Kuchta, M., Zhang, Y., Andrésen, J. and
Soong, Y., Eighteenth Annual International Pittsburgh Coal Conference,December 2001, Australia.
5. Maroto-Valer, M.M., Zhang, Y., Andrésen, J. and Morrison, J., Proc. ofCarbon’01, July 14-19, 2001, CD paper 34-3.pdf.
6. Tang, Z., PhD dissertation, The Institute of Coal Chemistry, ChineseAcademy of Sciences, 1997.

Fuel Chemistry Division Preprints 2002, 47(1), 179
SIMULTANEOUS CO-CARBONIZATION OF COALAND DECANT OIL: THE EFFECT OF VARYING
PROCESS PARAMETERS
Mark Badger, Gareth Mitchell, Nate Herman, Brian Senger andHarold Schobert.
The Energy Institute,The Pennsylvania State University,
University Park, PA, 16802.
IntroductionThe practice and rationale behind the simultaneous co-
carbonization of coal and decant oil, or co-coking, has beendescribed at length elsewhere (1-5). However, the main goals ofthe research into co-coking at Penn State are to develop a coal-based liquid that may be upgraded into a thermally stable jet fuel,and to produce a value-added carbon product of uniqueproperties. To this end, recent efforts have been undertaken toscale up the co-coking process from static small laboratory-scaletubing bomb experiments to a semi-continuous small pilot-scaledelayed coker unit.
The delayed coker unit was designed and built in-house byresearchers and staff at The Energy Institute after a similar unitoperated by PARC Technical Services, Harmaville, PA. The unithas a coke drum with internal dimensions of 7.5cm ID by 102.5 cmhigh, giving a volume of around 4.5 liters. The unit is capable ofoperating under typical delayed coking process conditions. Thesystem pressure, temperature and flow rates are monitored by anumber of computer-controlled devices, and data from thesedevices is recorded throughout the run.
The data presented in this preprint concentrates on varyingthe processing parameters, and studying what affect this has onthe yield and composition of the products.
ExperimentalThis study used Powellton coal, that had been deep cleaned
to remove the majority of mineral matter, and low sulfur decant oil.Proximate and ultimate analyses for these feedstocks are shown inTable 1.
Table 1. Proximate and Ultimate Analysis of the FeedsUsed in this Study.
Coal Decant Oil
Proximate analysis a
Ash (%) 1.9 0.0
Volatile matter (%) 29.4 -
Fixed carbon (%) 68.7 -
Ultimate analysis a
Carbon (%) 86.3 89.7
Hydrogen (%) 5.2 9.3
Nitrogen (%) 1.5 0.2
Sulfur (%) 0.9 0.8
Oxygen (by diff.) (%) 6.1 - a. Values reported on a dry basis
Table 2 shows experimental conditions for each of the testsperformed in this study. At least two runs were performed undereach of the test conditions. During each run liquid samples weretaken at selected intervals. Simulated distillation (SimDis) GC
was performed on these samples to study what effect theconditions had over the time of the run on the boiling range. Theinstrument used was a HP 5890 GC-FID fitted with a MXT-500Sim Dist column supplied by Restek Corp. After the conclusionof the run a coring bit was used to take a representative sample ofthe coke bed along its entire height. Proximate and ultimateanalysis was performed on the coke samples. In addition,petrographic analysis was conducted on the coke formed in theruns, following a method described previously (5).
Table 2. Matrix of Tests Performed in this Study.
Coal(Wt%)
DecantOil (Wt%)
Coke drumpressure (psig)
Waterfeed rate*
Sampleset
10 90 25 2% A10 90 50 2% B20 80 25 2% C10 90 25 1% D
* The water feed rate is a percentage of the feedstock feed rate. Forthe purposes of this study the feedstock feed rate was set to 1kg/hr. The water is used for steam injection.
Results and Discussion Table 3 shows data on the product yields derived for the co-
coking under varying process conditions.
Table 3. Average Product Yields for Co-coking Runs withVarying Operating Conditions.
Sample set Coke yield (wt%) Liquid yield(wt%)
A 18.5 61.6B 25.7 66.9C 24.0 65.2D 20.2 65.4
Taking sample set A as the base line set of runs observationscan be made, with respect to the product yields. With an increasein coke drum pressure, there was an increase in coke yield. This i swholly consistent with results previously reported in theliterature (2,6). The corresponding increase in liquid yield is anindication that there was an enhancement of cracking reactions ofthe higher molecular weight species. This is also exemplified inthe data shown on Table 4. With an increase in coal in thefeedstock, there was an increase in coke yield. This result is asexpected. The ability to accurately determine how much of thecoke is coal-derived has not yet been determined. The goal is toderive this value through yield calculations, with back up,concurring results from optical microscopy and other instrumentalmethods. With the increase in coal to the feedstock, there was anincrease in the liquid yield. This result would indicate that thevolatiles, from coal, evolved during the coking process wereresistant to thermal cracking, and so did not decompose togaseous compounds. A 50% decrease in water feed rate, and thussteam to the coker, resulted in an increase in coke and an increasein liquid yield. The coke increased because the lower steam rateresulted in less medium volatile compounds being swept from thecoke drum. And so these medium volatiles subsequently coked.As there was an increase in liquid yield too, then the coking ofthe medium volatiles must have partially decomposed tointermediate lower boiling liquids, and to a lesser extent producegaseous products.

Fuel Chemistry Division Preprints 2002, 47(1), 180
Table 4 shows the results of SimDis GC analyses of liquidsamples taken in successive periods during the different co-coking experiments.
Table 4. Yield of Liquids in Specific Boiling RangesSampled at Different Times During the Co-Coking Runs.
Liquid Sample
1 2 3Sample Boiling Range (oC) Boiling Range (oC)Boiling Range (oC)
Set -360360-500500+ -360360-500500+-360 360-500500+A 22.1 65.8 8.6 29.5 61.1 5.8 31.9 59.3 5.5B 36.9 51.6 3.9 38.9 49.0 4.3 40.3 50.8 4.7C 31.7 58.7 4.9 30.2 58.3 6.2 28.9 61.7 7.4D 27.3 63.1 6.6 28.4 61.6 5.2 32.4 58.9 5.7
For the decant oil feed –360 oC, 360-500 oC, and +500 oC cutswere 14.3%, 65.9% and 18.8%, respectively.
The most important observation that can be made from thisdata is that as the length of the run progresses the conversion ofliquids to lighter boiling material is increased. The main reasonfor this phenomenon is that the coke bed facilitates the cracking ofthe high molecular weight species to lower molecular weightspecies, that boil at lower temperatures. As a run progresses thesize of the bed increases, and therefore the time in which theliquids may be in contact with the bed also increases. Thusincreasing the propensity for cracking reactions. The exception tothis was when the coal loading was increased to 20 wt%.Although the overall liquid yield was increased, (see Table 3) theconversion to lower boiling species decreased over time. Thismay be because the increase in coal-derived material to liquidproducts may be resistant to decomposition through thermalcracking. As the majority of the coal-derived species may be of ahigh molecular weight this would explain the small increase incompounds boiling above 360 0C as the run progressed.
Petrographic analyses of coke textures derived from coal/decant oil blends in the laboratory-scale delayed coker, suggestedthat coal materials were being concentrated near the inlet of thecoker and decreased in concentration with increasing bed height(see Table 5). The presence of coal in increasing concentrationlocally decreased the size of the isochromatic textures derived fromthe decant oil. The Powellton coal appeared to interact bothphysically and chemically with decant oil during co-coking andresulted in a significant improvement in the size of the coal-derived isochromatic textures. Changes in other operatingconditions with respect to steam injection rate, drum pressure andcoal addition, appeared to have an influence. Reduction of steamrate from 2.8 to 0.3 mL/min had a profound influence on increasingthe size of isochromatic areas derived from the decant oil. Cokegenerated at the lowest steam injection rate (0.14 mL/min) andwith doubled drum pressure, resulted in a significant amount ofisotropic carbon derived from the decant oil. However based onearlier results, it is unclear whether operating conditions alonecan be blamed for these changes in coke properties. Increasing theamount of coal in the feed to 20 wt.% had a predictable effect oncoke properties, in that more enhanced coal-derived material wasobserved near the bottom of the core and decreased inconcentration and enhancement with increasing distance from theinlet.
Table 5. The Proportions of Textures Derived fromCoal and Decant Oil Compared with the Normalized
Concentration of Decant Oil Textures (Vol. %).
*. Dom. = Domain
Conclusions.Changing the experimental parameters can have a marked
effect on the quality and yield of the products produced in the co-coking of coal and decant oil. Increasing the quantity of coal inthe feed mix does not seem to have a detrimental effect. However,lowering the water feed rate results in a coke product of poorquality if it was to be used as a value-added carbon. Increasingthe drum pressure has a disproportionate effect: The yield ofliquids increases with increasing pressure, along with the yield oflow boiling liquids. Conversely, the high degree of isotropiccarbon reduces the quality of the coke.
References(1) Badger, M.W.; Fickinger, A.E.; Martin, S.C.; Mitchell, G.D.;
Schobert, H.H. Prepr. Pap. - AIE 8th Australian Coal ScienceConference, 1998, 245.
(2) Fickinger, A.E.; Badger, M.W.; Mitchell, G.D.; Schobert,H.H. Prepr. Pap. - ACS Div. Of Fuel Chem. 2000, 45, (3),299.
(3) Fickinger A.E. “Laboratory-Scale Coking of Coal/PetroleumMixtures” Masters Thesis. The Pennsylvania StateUniversity. July 2000
(4) Badger, M.W.; Fickinger, A.E.; Mitchell, G.D.; Adams, A.A.;Schobert. H.H. Proceeding of the 26th InternationalTechnical Conference on Coal Utilization and FuelSystems. 2001, 149.
(5) Badger, M.W.; Mitchell, G.D,; Karacen, C.O.; Wincek, R.T.Prepr. Pap. - ACS Div. Of Fuel Chem. 2001, 46, (2), 564.
(6) Hossain, T., Zaman, N., Jahan, S.T., Podder, J., Rashid, M.A.J. Mech. Eng. Res. & Dev. 1994, 16, 47.
Distancefrom
Bottom ofCore, mm
%Coal
derived
%Petrol.derived
%Isotropic
%Mosaic
%SmallDom.*
%Dom.*
%Flow
Dom.*
10% Powellton Coal; 20 wt% water feed rate0 -21 11.6 88.4 0.0 37.3 60.6 1.6 0.5
26 - 44 11.3 88.7 0.3 27.6 67.7 2.4 2.0Sample Set A
0 - 14.5 25.9 74.1 0.0 38.5 50.5 8.6 2.4102 - 127 12.6 87.4 0.3 10.1 61.9 22.1 5.6280 - 305 5.6 94.4 0.0 5.6 72.1 19.2 3.1356 - 381 4.2 95.8 0.0 14.2 52.0 14.6 19.2
Sample Set B0 - 34 5.4 94.6 28.9 21.0 42.2 7.1 0.845 - 70 4.1 95.9 12.9 17.7 55.8 8.8 4.8
115 - 140 5.4 94.6 17.3 17.3 59.8 3.7 1.9Sample Set C
0 - 20 17.7 82.3 0.1 67.2 27.5 3.9 1.370 - 95 3.5 96.5 0.3 19.0 65.4 9.3 6.0
356 - 381 0.1 99.9 0.0 7.9 80.3 7.1 4.7Sample Set D
0 - 26 14.4 85.6 3.9 45.2 47.9 2.2 0.852 - 72 7.2 92.8 85.1 12.7 2.0 0.2 0.0
127 - 150 5.8 94.2 4.8 20.9 57.6 13.6 3.1

Fuel Chemistry Division Preprints 2002, 47(1), 177
THE USE OF COAL PYROLYSIS PRODUCTSFOR THE DEVELOPMENT OF
THERMALLY STABLE JET FUELS
James J. Strohm, Suchada Butnark, Terry L. Keyser, John M. Andrésen, Mark W. Badger, Harold H. Schobert
and Chunshan Song
The Energy Institute and The Department of Energy and Geo-Environmental Engineering, The Pennsylvania State University,
209 Academic Project Bldg., University Park, PA 16802.
IntroductionConventional paraffin based jet fuels are solely derived from
petroleum and are, in addition to serving as the fuel source,designed to act as coolants for the engines and electrical parts ofthe aircraft at temperatures up to 300°C (1). Lately there has beena driving force towards the development of jet planes that canoperate at speeds reaching several Mach (2). The increased heat-load generated by friction with air on the body of the jet plane, theneed for compressed air during combustion and higher rate of fuelinjection into the engine will result in the fuel experiencingextreme temperatures when acting as coolants (3). Thesetemperatures can reach levels around 500°C or above, and canresult in severe coking of the fuel in the fuel-line although thecontact time will be on the order of a few seconds. This problemhas been identified especially for paraffinic based jet fuels, whilenaphthenic based jet fuels with a natural content of hydrogendonor compounds have shown improved thermally stability atthese high temperatures (4). Correspondingly, feedstocks that canyield both naphthenes and hydrogen donor compounds will yieldjet fuels with improved thermal stability.
One such route is outlined in Scheme 1. Pyrolysis of coalgenerates tars and liquids with a high content of aromaticcompounds. From the pyrolysis product a stream with a tailoredcomposition of aromatic compounds can be obtained.Hydrotreating and hydrogenation of such streams can yieldnaphthenic (cycloalkane-rich) liquids that have jet fuelcharacteristics. One such example is refined chemical oil (RCO)that is obtained from coal tar from by-product coke ovens (5, 6).Although aromatic streams can also be obtained from petroleum,such as light cycle oils, the high degree of alkylation of thearomatic rings lowers the thermal stability of the hydro-treatedproducts from these streams compared to coal derived streams (7).From Scheme 1 other possible routes for the use of coal pyrolysisproducts are also outlined. Partial hydro-treatment of the aromaticstreams from coal pyrolysis generate streams high in hydrogendonor compounds, such as tetralin, that could either be used as afuel on its own, or used as thermal stability boosters for paraffinicderived fuels from petroleum or synthesized from coal gasificationproducts. In addition, fully saturated naphthenic streams may alsoshow high thermally stability in itself, or when partially mixedwith the hydrogen donor containing stream.
Accordingly, in this study a refined chemical oil and twohydro-treated products with varying contents of aromatic,hydroaromatic and naphthenic compounds, were characterized andprobed for their thermally stable properties. The various chemicalcompositions of the hydrotreated pyrolysis products were testedfor their function as thermally stable jet fuels in the pyrolyticregime. In particular, the coal-derived jet fuels were able towithstand temperatures up to 820°C at short contact times even inthe presence of dissolved air, while the paraffinic structure of thepetroleum-derived jet fuel started decomposing below 720°C. Therole of the chemical composition of the coal pyrolysis product
towards the thermal stability of the resultant hydrotreated liquidswas also investigated.
Coal Petroleum
Predominantly paraffinic compounds
Highly aromatic liquids
Selection of naphthalene rich fraction
Fully saturated decalin rich liquids
Partially hydrotreated tetralin rich liquids
Paraffin based jet fuel with hydrogen donor
Naphthenic based jet fuel
Hydrogen donor based jet fuel
Naphthenic based jet fuel with hydrogen donor
Pyrolysis
Gasification and synthesis
Hydrotreatment
Scheme 1. Scheme of the possible use of coal and petroleum forthe production of thermally stable jet fuels, highlighting the roleof coal pyrolysis.
ExperimentalA refined chemical oil (RCO) was hydro-treated in two steps:
(i) severe hydro-treatment of the RCO at 385°C to produce thepartially hydro-treated HDT-RCO, and (ii) further saturation anddearomatizing at 315°C to yield SAT-RCO. The jet fuel sampleswere produced in a pilot plant facility by PARC (8). The flowreactor setup has been characterized elsewhere (9). The GC-MSwas performed on a Shimadzu GC-174 coupled with a Shimadzu QP-5000 MS detector.
Results and DiscussionCharacterization of samples. The overall
chemical makeup of the original refined chemical oil (RCO), itshydrotreated derivative (HDT-RCO) and its fully dearomatizedfraction (SAT-RCO) is compared with the standard petroleum-derived jet fuel, JP-8P, in Figure 1. The original RCO is, asexpected, highly aromatic and mainly a mixture of naphthaleneand its alkylated derivatives, with about 10% alkylated benzenesand around 15% of aromatic compounds with three rings or more.The severe hydrotreatment at 385°C produces a range ofhydroaromatics such as tetralin and hexahydroacenaphthalene(HDT-RCO). However, still there are some aromatic compoundsremaining. Also, upon hydrotreatment virtually all of the 3+aromatic rings compounds have one or more of the ringshydrogenated, transforming them into hydro-aromatics. A similarchange was found for the naphthalenes, where the majorhydroaromatic was tetralin and its alkylated derivatives. Thealkyl-benzenes were transformed to cyclo-alkanes. When fully

Fuel Chemistry Division Preprints 2002, 47(1), 178
dearomatized into SAT-RCO, essentially all the aromatics andhydroaromatics have been converted to cyclo-alkanes, whichaccount for over 98% of this fraction. The dearomatization of thecoal-derived liquid causes a dramatic conversion to decalins,mostly the trans-decalin isomer, but also a considerable content ofthe cis- isomer. Figure 1 also compares the chemical structure ofthe petroleum-derived jet fuel, JP-8P to that of the three coal-derived streams. As expected, the JP-8P is dominated by a highcontent of long-chain paraffins. Also, JP-8P does not contain anyhydro-aromatic structures such as tetralin, and all the aromaticcompounds are alkylated benzenes or alkylated naphthalenes.
Lon
gcha
in-a
lkan
es
Cyc
lo-a
lkan
es
Alk
enes
Hyd
roar
omat
ic
Alk
yben
zene
s
Bip
heny
ls
Nap
htha
lene
s
(3+)
Aro
mat
ic R
ingsRCO
HDT RCO
SAT RCO
JP8P
0%
20%
40%
60%
80%
100%
Vol
ume
%
Figure 1 . The overall chemical makeup of the coal-derivedrefined chemical oil (RCO), its hydro-treated (HDT-RCO) and fullydearomatized (SAT-RCO) fractions, compared to that of thestandard petroleum derived jet fuel, JP-8P.
Thermal stability of the jet fuels. Figure 2shows the changes in the chemical composition as detected byGC/MS of the saturated RCO stream when purged with oxygen andheated to 771°C in the flow reactor. The coal-derived fuel, SATRCO, can be heated to these temperatures with very little thermaldecomposition of the structure.
Figure 2. The change in chemical composition as detected byGC/MS of the saturated RCO stream when purged with oxygen andheated to 771°C in flow reactor.
In comparison, when the petroleum-derived jet fuel JP-8P is purgedwith oxygen and heated to 771°C in the flow reactor severethermal cracking is observed resulting in a nearly completetransformation of long-chain paraffins into aromatic compounds.
Solid deposition in fuel line. Figure 3 comparesthe changes in coke deposits along the fuel line of the flow-reactorrelated to the bulk-fuel temperature. Very little solid deposition i sobserved in the tube in the temperature range 25 to 450°C. Thiswas unexpected, since the fuels may form gums, especially JP-8P,due to the presence of oxygen in the fuel. The gums are formed inthe autoxidative regime from 150 to 350°C. However, due to thehigh flow rate in the system (LHSP of 450) the gums may notprecipitate before 500°C. This can explain the growth in soliddeposit peak for JP-8P at 700°C and the subsequent decrease at750°C before pyrolytic solid deposition increases rapidly athigher temperatures. The coal-derived SAT-RCO jet fuel may haveformed some gums at 550°C but does not form pyrolytic soliddeposit before 800°C.
0
500
1000
1500
2000
2500
3000
3500
100 200 300 400 500 600 700 800
Temperature along tubing / °CC
arbo
n D
epos
ition
(mic
rogr
ams/
cm^2
)
SAT RCO, Oxygen
JP-8P, Oxygen
Figure 3. Changes in coke deposits along the fuel line of theflow-reactor related to the bulk-fuel temperature.
C o n c l u s i o n sA jet fuel derived from a refined chemical oil, obtained from
coal pyrolysis, was found to be thermally stable up to 771°C in aflow-reactor. Compared to the petroleum-derived jet fuel, JP-8P,that showed extensive thermal cracking at these temperatures, thecoal-derived jet fuel was superior in suppressing the formation ofsolid deposit in the fuel line.
Acknowledgements . The authors wish to thank theUSAF/WPAFB for their support, Koppers and PARC for the RCOsample and preparation.
References(1) Yoon, E.M.; Selvaraj, L.; Song, C.; Stallman, J.B and Coleman, M.M.,
Energy & Fuels, 1996,10, 806.(2) Ben-Yakar, A. and Hanson, R.K., J. Propulsion and Power, 2001, 17
(4), 869.(3) Edwards, T., Prepr. Pap. - Am. Chem. Soc., Div. Petr. Chem., 1996,
41(2), 481.(4) Song, C.; Eser, S.; Schobert, H.H.; and Hatcher, P.G. Energy & Fuels,
1993, 7, 234.(5) Butnark, S.; Badger, M.W.; Schobert, H.H., Prepr. Pap. - Am. Chem.
Soc., Div. Fuel Chem., 1999, 44 (3), 662.(6) Butnark, S., Hydrogenation of Coal Tar Fractions and Refinery
Streams. Master Thesis. Pennsylvania State University, December1999.
(7) Andrésen; J.M., Strohm; J.J, Sun, L. and Song, C, Energy & Fuels, 2001,15, 714.
(8) Wilson, G. R. Project Report on AFOSR-Subcontract for AdvancedThermally Stable Coal-Based Jet Fuels for the Pennsylvania StateUniversity. PARC Technical Services Inc. (Pittsburgh, PA) toPennsylvania State University, May 2000.
(9) Andrésen, J.M.; Strohm, J.J.; Boyer, M. L.; Song, C.; Schobert, H.H.;and Butnark, S., Am. Chem. Soc., Div. Fuel Chem., 2001, 46(1), 208.

Fuel Chemistry Division Preprints 2002, 47(1), 194
VOLATILIZATION OF Na DURING PYROLYSISOF A VICTORIAN BROWN COAL AT
ELEVATED PRESSURES
Chirag Sathea,b, Jun-ichiro Hayashib, Chun-Zhu Lia andTadatoshi Chibab
aCRC for Clean Power from Lignite, Department of ChemicalEngineering, Monash University, Clayton, AustraliabCenter for Advanced Research of Energy Technology
Hokkaido University, Sapporo, Japan
IntroductionVolatilization of Na during pyrolysis/gasification has been
known to cause severe problems of erosion/corrosion of heat-exchanger tubes and high-temperature rotating parts in a gasturbine, affecting the steady operation of the plant. On the otherhand, retention of Na in the char would enhancecombustion/gasification processes due to its catalytic activity.The volatilization of Na is likely to be dependent on the reactionconditions. This paper examines the effects of changes inpressure, heating rate and temperature on the release of Na duringpyrolysis of a Victorian brown coal (Loy Yang).
ExperimentalCoal sample . A sample of "as-mined" brown coal was
obtained from the Loy Yang field in Latrobe Valley, Australia. Thesample was partially dried at low temperature (<35°C) and thenpulverized and sieved to obtain a fraction sample of particle sizesbetween 106 and 150 µm. The properties of the coal sample are: C,68.5; H, 4.8; N, 0.6 and S, 0.3 wt% on a daf basis with 0.13 wt%of Na (db).
Pyrolysis. Pyrolysis experiments were carried out in a wire-mesh reactor1. For experiments at elevated pressures, a reactorvessel made of stainless steel (instead of glass) was used togetherwith a specially designed gas distributor and a tar trap. Less than10 mg of the air-dried sample was used in each experiment. Thedetails of tar collection, char and tar quantification have beengiven elsewhere2,3. All the pyrolysis experiments were carried outin helium (purity >99.999%). A gas flow rate of 2.5 L min-1
(measured at 25°C and 1 bar) was used for experiments atatmospheric pressure. For experiments at pressures from 6 bar to20 bar, a gas flow rate of 4 L min-1 (measured at 25°C and 1 bar)was used to maintain an upward flow direction of the volatiles.Experiments using a higher flow rate of 8 L min-1 at elevatedpressures (20 bar) did not show any discernible changes in productyields. For very high pressure up to 61 bar, a gas flow rate of 10 Lmin-1 was used.
Quantification of Na. Detailed procedure for thequantification of Na is given elsewhere2. In brief, after thepyrolysis experiment, a portion of the char was ashed in athermogravimetric analyzer at 600°C (with 30 min holding time)in O2. The ashing conditions were controlled to ensure completecombustion without ignition2. The ash was then digested with amixture of HNO3 and HF solution. After evaporating HNO3 and HFthe sample was re-dissolved in 20 mM CH3SO3H prior to injectioninto an ion chromatograph to quantify Na concentrations.
Results and DiscussionPyrolysis experiments using the raw coal sample were carried
out at pressures of 1, 3, 6, 11, 20, 36 and 61 bar. Two heatingrates were used: 1 and 1000°C s-1 with a holding time of 10 s. Asindicated previously4, the introduction of pressure greatly affectsthe mass-transport mechanism of volatiles and changes the tar
yield. A brief summary on the effect of pressure on the tar yield i sgiven here in the form of Figure 1 at 700 and 900°C. At the fastheating rate of 1000°C s-1 the tar yield decreases with increases inpressure up to 11 bar. Further increase in pressure to 20 bar resultsin substantial increases in the tar yield. At a slow heating rate of1°C s-1, the tar yield remains unaffected by pressure up to 6 bar, butnearly doubles at 11 bar and remains unchanged up to 20 bar.
0
5
10
15
20
25
30
0 10 20 30 40 50 60 70
Tar yield, wt% (db)
Pressure, bar
Figure 1. Effect of pressure on the tar yield at 700 (l and ° )and 900°C (n and o) with a holding time of 10 s at: 1000°C s- 1
(filled symbol) and 1°C s-1 (open symbol).
In our previous study2 at atmospheric pressure, thevolatilization of Na was found to be a function of temperaturealone. Changes in the heating rate (1 and 1000°C s-1) had noapparent effect on the release of Na. When the pressure is increasedin the present study from 1 to 11 bar at 700°C at the fast heatingrate, the Na retention in the char decreases gradually, as shown inFigure 2. When the pressure is increased to 20 bar, the Naretention increases substantially which is followed by noessential increase with pressure up to 61 bar. More than 85% of Napresent in the coal sample is retained in the char at pressures of 20bar and higher.
40
50
60
70
80
90
0 10 20 30 40 50 60 70
% Na retention (db)
Pressure, bar
700°C
900°C
Figure 2. Na retention as a function of pressure at 700 and 900’C at a fastheating rate of 1000°C s-1 with a holding time of 10 s.
Interestingly, Figs. 1 and 2 suggest that at 700°C the Naretention followed the path of the tar yield with changes inpressure. At a higher temperature of 900°C, the Na retention showssimilar behavior to that at 700°C with increases in pressure up to

Fuel Chemistry Division Preprints 2002, 47(1), 195
11 bar. However, the difference between the Na retention at 700and 900°C decreases with increases in pressure. At 11 bar, the Naretention is same at both temperatures. Further increase in pressureto 20 bar at 900°C causes a significant reduction in the retentionand remains unchanged with further increases in pressure up to 61bar. It appears from Figs. 1 and 2 that at a higher temperature of900°C, the temperature has played a significant role in thevolatilization of Na from the coal.
When the coal particles are heated slowly at 1°C s-1, the Naretention for both temperatures decreases with pressure to 6 barand then remains nearly unchanged up to 11 bar, as shown inFigure 3. However, at 20 bar the retention increases and matchesthe value at 1 bar. This behavior of Na at 900°C is in sharpcontrast to that at fast heating rate. It is also to be noted that thedifference between the retention at 700 and 900°C remained nearlyunchanged with increasing pressure.
40
50
60
70
80
90
0 5 10 15 20 25
% Na retention (db)
Pressure, bar
700°C
900°C
Figure 3. Na retention as a function of pressure at 700 and900°C at a slow heating rate of 1°C s-1 with a holding time of 10 s.
It is supposed that when the generation of volatiles in theparticle is rapid the evolution of the volatiles out of the particlecan be affected by pressure5. As discussed in detail elsewhere4, withchanges in pressure, the diffusion flow due to the concentrationgradient and/or the forced flow due to the pressure gradient wouldbe the main mass transport mechanism for the release of volatilesout of the particle during rapid pyrolysis. This in turn could affectthe release of alkali and alkaline earth metallic species (AAEM).Thus, the release of AAEM species was speculated to depend ontheir transformation during pyrolysis.
It is known that the carboxylates in coal will undergodecomposition at relatively low temperatures6. In the absence ofoxygen, some AAEM species associated with the –COO- groupsmight leave the particle together with the –COO group. With therelease of CO2, Na originally associated with a –COO group mightstill be bonded to coal/char matrix (CM),
(-COO-Na) + (CM’) => CM-Na + CO2 (1)The strength of this newly formed bond will depend on thetemperature alone. Increasing temperature would generate volatilematter (VM’) from the coal/char matrix,
CM-VM => CM’ + VM’ (2)and could also break the bond between CM and Na,
CM-Na => CM’ + Na’ (3)In the diffusion controlled mass transport regime, theconcentration of the VM inside the particle increases withincreasing pressure. This will allow for the further interactionbetween the VM’ and Na’,
VM’ + Na’ => VM-Na (4)
It is speculated that the Na could be released along with VM. Thechances of Na being released by reaction (3), even after thecompletion of the release of tar and major volatiles, are notexcluded. On the other hand, if the forced flow is the maincontrolling mass transport mechanism for the release of volatiles,the concentration as well as the time spend by VM’ inside theparticle would reduce considerably. This, in turn, would reduce thepossibility of the interaction between VM’ and Na’.
At 700°C the thermal dissociation (reaction 3) would not be animportant process for the volatilization of Na. In the diffusioncontrolled mass transport process regime (up to 11 bar), reactions(2) and (4) would play a vital role and result in more release of Nawith increasing pressure. When forced flow becomes the mainmass transport mechanism (at 20 bar), there are neither enoughNa’ species and/or the VM’ nor the time available for the progressof reaction (4) to cause volatilization of Na. The Na retentionincreased substantially when the pressure is increased to 20 bar(Fig 2). At 900°C, the reaction (3) would intensify and irrespectiveof the mass transport regime would cause further volatilization ofNa with increasing pressure (up to 20 bar). At higher pressures (36and 61 bar), the data in Fig. 2 suggest that the release of Na hasreached a plateau value at 900°C.
When the generation of volatiles is slow and is the rate-limiting process, as in the case with 1°C s-1, increasing pressurewould further increase the concentration of VM inside the particle.The net result of reactions (2), (3) and (4) is a gradual release of Nawith increasing pressure. The data in Figs. 1 and 3 for 20 bar aresomewhat ambiguous. The slow generation of volatiles is thoughtto negate the effect of increasing pressure on the release ofvolatiles. However, the increase in the tar yield as well as the Naretention at 20 bar suggest the forced flow could be the main masstransport mechanism for the release of volatiles, resulting inhigher retention of Na during pyrolysis. Further work is beingcarried out to understand the effect of pressure on the release of Naduring slow heating.
C o n c l u s i o n sTar yield is found to be sensitive to changes in pressure and
heating rate. Volatilization of Na is found to depend on pressure,temperature and heating rate. At atmospheric pressure, the releaseof Na is only temperature dependent. Increasing pressure alters themass transport mechanism of the generated volatiles and in turnaffects the volatilization of Na. At fast heating rate, higherpressure and higher temperature result in substantial volatilizationof Na. At slow heating rate, the volatilization of Na is mainly afunction of temperature.
Acknowledgement . The financial and other supportreceived for this research from the Cooperative Research Center(CRC) for Clean Power from Lignite (Australia) is gratefullyacknowledged. The authors also thank the partial financial supportby the New Energy and Industrial Technology DevelopmentOrganisation (NEDO) in Japan.References(1) Sathe, C.; Pang, Y.; and Li, C.-Z. Energy & fuels, 1999, 13, 748-755.(2) Li, C.-Z.; Sathe, C.; Kershaw, J. R.; and Pang, Y. Fuel, 2000, 79, 427.(3) Kershaw, J. R.; Sathe, C.; Hayashi, J.-i.; Li, C.-Z; and Chiba, T. Energy
& Fuels, 2000, 14, 476-482.(4) Sathe, C.; Hayashi, J.-i.; Li, C.-Z. submitted to Fuel, 2001.(5) Gavalas, G.R. Coal Pyrolysis, Elsevier Scientific Publication:
Amsterdam, 1982; Chapter 5.(6) Schafer, H.N.S. The Science of Victorian brown coal, Editor, Durie,
R.A.; Butterworth-Heinmann, 1991; Chapter 7.