the behaviour of low-cost passive solar energy efficient
TRANSCRIPT

8
The Behaviour of Low-Cost Passive Solar Energy Efficient House, South Africa
Golden Makaka*, Edson L. Meyer, Sampson Mamphweli and Michael Simon
University of Fort Hare, Institute of Technology, Alice, South Africa
1. Introduction
A comfortable indoor environment is one of the main requirements of a well-designed house yet most of the low-cost houses are characterised by poor thermal performance. Mainly poor design, sub-standard building materials and poor craftsmanship contribute to the poor performance. The inclusion of energy-efficient passive solar design features in the construction of affordable housing offers many benefits which include; reduced operating costs, reduced energy related greenhouse emissions, and reduced need for expensive heating and cooling of the house and above all, improved comfort. The basic natural processes used in passive solar energy are the thermal energy flows associated with radiation, conduction, and natural convection. When solar radiation strikes a building, the building materials can reflect, transmit, or absorb the solar radiation [Makaka, Meyer; 2008]. Additionally, solar energy causes air movement that can be predictable in designed spaces. These basic responses to solar heat lead to design elements, material choices and placements that can provide heating and cooling effects in buildings. The thermal state is determined by the difference of the sums of the heat gains and heat losses. Bricks form the about 80% of the building materials and their physical properties play a role in determining the indoor thermal behaviour. These properties include thermal conductivity, water absorption, sound dumping and compressive strength. The addition of fly ash to clay in a defined ratio can really improves these properties and at same time reducing the manufacturing process. South Africa produces about 90 tones of fly ash annually posing a huge problem on the disposal management of fly ash. The use of fly ash in the manufacturing of bricks is one of the ways of the management of this waste.
The aim of this chapter is to establish the impact of passive solar design and building materials properties on the indoor temperature and to establish a statistical correlation of the indoor temperature with outdoor weather parameters [Makaka, Meyer; 2008]. It seeks to develop an understanding of the criteria used for the selection of an appropriate passive solar architecture that is sensitive to both energy use and climatic conditions, i.e., it gives the details of the design and the selection of building materials used, energy efficient design optimization using ECOTECT building design software and ventilation efficiency. Most of
* Corresponding Author
www.intechopen.com

Solar Power
134
computer based prediction models are complicated for an average trained builder this results in the construction of poor thermal performing buildings. In this chapter a statistical method is used to develop a simple indoor temperature predicting model.
2. Principles of passive solar design
The building design phase integrates the site, floor plan, building orientation, landscaping, materials, mechanical systems and architectural characteristics. The design of an energy-efficient house requires a careful analysis and evaluation of all proposed design alternatives throughout the different design stages. The central issue in passive solar design is to minimize the energy required for heating, cooling and artificial day lighting. This can be achieved through the use of a range of different features that improve the building’s thermal and lighting performance. The properties of the building materials vary and selection must be in accordance with the climate of specific regions [Makaka, Meyer; 2008]. The decisions of the architect and builders in the early stages of the design process are fundamental to a holistic approach in constructing a passive solar house (PSH). In the schematic design phase of the PSH, prior to making any sizing of windows, wall thickness, etc., decisions on broader issues such as building orientation and the appropriate spatial organization of the building must be made. As the design is developed, more accurate investigations are needed to obtain the appropriate size of building components based on design criteria and objectives that are determined at the outset. Passive solar design integrates several issues that can be rather contradictory; larger glazing to achieve solar gains can result in overheating, and an airtight building can produce bad indoor air quality [Wray et al., 1979]. These issues must be dealt with carefully by seeking the best balance between the passive solar design requirements and the budget. Consequently, in the Southern Hemisphere, the house must be oriented north to maximize the heat gain of the low north winter sun but eliminating the possible indoor solar radiation penetration in summer. The direction of the prevailing winds determined the layout of major outdoor features and the placement of windows to enhance optimal natural ventilation. The basic components of passive solar design are discussed in the following sections.
3. Advantages of energy efficient design features
A whole-house “system” approach to design and construction is the appropriate method of
developing energy-efficient and sustainable houses. A system approach considers the
interaction between the site, building envelope, mechanical systems, occupants, and other
factors. This system recognizes that the features of one component of the house can greatly
affect others. Energy efficient houses are more comfortable because of stable indoor
temperature. The indoor humidity is better controlled and drafts are reduced. Energy-
efficient houses protect the planet and offers greater fire safety. Energy efficient houses
experience less condensation, which protects framing, windows and finish materials
[Kunzel et al, 2003].
4. Fly ash bricks
Bricks of different proportions of clay and fly ash were molded and compressive strength,
water absorption and thermal conductivity were measured. The amount of fly ash was
www.intechopen.com

The Behaviour of Low-Cost Passive Solar Energy Efficient House, South Africa
135
increased in steps of 10% (in volume). The clay-fly ash ratio which produced a brick with
high compressive strength, low water absorption and low thermal conductivity was then
used to mold bricks for the construction of a passive solar house. The ratio of 1:1 (clay : fly
ash) was found to produce a brick with the ideal properties, i.e., low water absorption
capacity, low thermal conductivity, high heat capacity, high compressive strength and high
sound damping. Table 1 shows the chemical composition of fly ash collected from two
different sites. The properties of fly ash bricks depend mainly on two factors: (i) the energy
content of the fly ash used and (ii) the chemical composition of the fly ash [Makaka, Meyer,
2008]
Site Sulphate
(as 2-4SO )
Phosphate
(as 3-4PO )
Silicate
( 2-2SiO )
Calcium (2Ca )
Magnesium
( 2Mg )
Potassium
( K )
Aluminum
( 3Al )
A 0.3 <0.1 20.3 0.36 0.05 1.63 14.1
B 0.2 0.1 20.9 2.15 0.12 2.68 19.6
Table 1. Percentage chemical composition of fly ash [Makaka, Meyer, 2008]
The other constituents include FeO, Na2O, K2O and unburnt carbon that form the bulk part of the fly ash. The South African fly ash has high-energy content, making it excellent for manufacturing bricks. Chemical composition of the fly ash and the temperature attained during burning determine the brick colour.
Figure 1 shows the variation of thermal conductivity with the increase percentage of fly ash
in the brick composition, i.e., the insulating property of the fly ash brick increases with the
increase of the amount of fly ash. The fly ash bricks are observed to have high heat making
them ideal for use as thermal mass. From figure 1, it can be seen that thermal conductivity
decreases with increase in the proportion of fly ash with a minimum value of about 0.0564
W/mK, which correspond to a mixing proportion of 50% fly ash to 50% clay by volume. The
mixing proportion of 50% fly ash to 50% clay result in 93% reduction in thermal
conductivity as compared to a pure clay bricks. The fly ash bricks are very light in weight
(density 400-1190 kgm-3) making it much easier to transport the bricks [Makaka, Meyer;
2008]. As the carbon in the brick burns the trace elements melts thus sintering the brick and
at the same time small-unconnected cavities are created, giving the brick effective heat
insulating properties (low conductivity). Above 50% of fly ash, the cavities start to decrease
in size and number as the metallic elements starts to dominant, thus increasing the thermal
conductivity of the brick. The fly ash bricks have an added advantage of being very smooth
with an attractive colour thereby doing away with the need for external plastering and
painting.
Water is associated with deterioration processes affecting masonry materials. Its presence
within the interior pore structure of masonry can result in physical destruction if the
material undergoes wet/dry or freeze/thaw cycles [Raman et al., 2001]. The freeze/thaw
process is particularly damaging if the masonry material has high water absorption. The
high water absorption results in high expansion and contraction thus weakening the brick.
Because of these factors, the water permeability of a masonry material is related to its
durability.
www.intechopen.com

Solar Power
136
Fig. 1. The variation of thermal conductivity.[Makaka, Meyer; 2008]
Figure 2 shows the variation in water absorption as the amount of fly ash in the brick increases. Water absorption of fly ash bricks decreases with increase in fly ash. A mixing proportion of 50% fly ash to 50% clay produces a brick with minimum water absorption. According to the South African Building Standard Code (SABSC), the brick water absorption must be less than 20% by weight [Agrement South Africa, 2002].
Fig. 2. Water absorption of fly ash bricks [Makaka, Meyer; 2008].
From figure 2 it is clear that the addition of 20% fly ash by volume reduces the water absorption by 32%, while the addition of 50% fly ash lowers the water absorption by 62%. Since the created cavities are unconnected, permeability and porosity are reduced. The reduction in permeability and porosity implies the reduction in freezing/thawing damage of the brick since there will be minimal amounts of water in the brick. As the content of fly ash increases beyond 50%, the amount of unburnt carbon increases and upon burning a
www.intechopen.com
The Behaviour of Low-Cost Passive Solar Energy Efficient House, South Africa
137
significant proportion of the brick will be burnt [Makaka, Meyer; 2008]. In this case the trace metallic elements are insufficient to bind the remaining proportion thereby creating connected cavities, which results in high water absorption bricks with low compressive strength. During brick firing the unburnt carbon enhance the burning process raising the temperature higher thus initiating the vitrification process to take place.
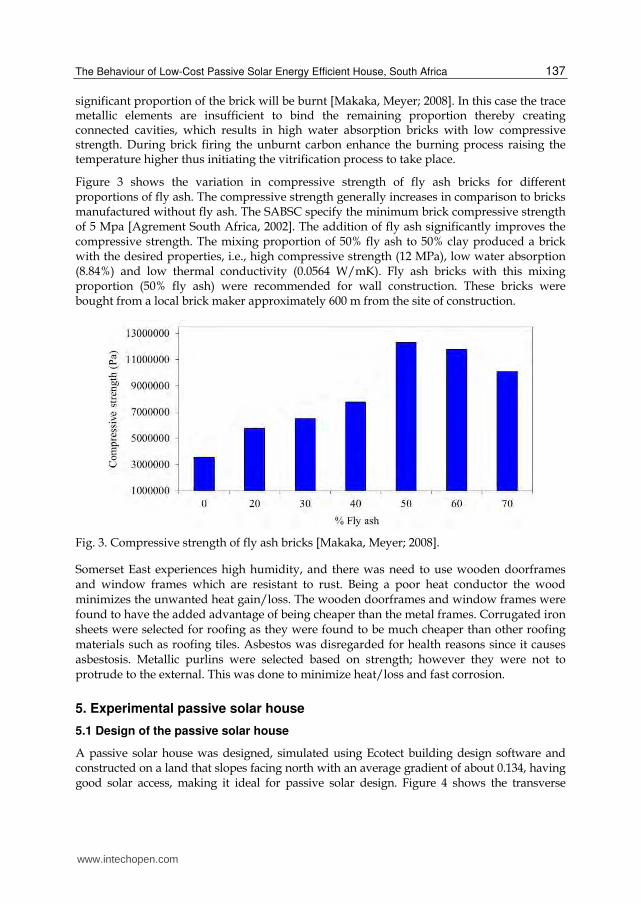
Figure 3 shows the variation in compressive strength of fly ash bricks for different proportions of fly ash. The compressive strength generally increases in comparison to bricks manufactured without fly ash. The SABSC specify the minimum brick compressive strength of 5 Mpa [Agrement South Africa, 2002]. The addition of fly ash significantly improves the compressive strength. The mixing proportion of 50% fly ash to 50% clay produced a brick with the desired properties, i.e., high compressive strength (12 MPa), low water absorption (8.84%) and low thermal conductivity (0.0564 W/mK). Fly ash bricks with this mixing proportion (50% fly ash) were recommended for wall construction. These bricks were bought from a local brick maker approximately 600 m from the site of construction.
Fig. 3. Compressive strength of fly ash bricks [Makaka, Meyer; 2008].
Somerset East experiences high humidity, and there was need to use wooden doorframes and window frames which are resistant to rust. Being a poor heat conductor the wood minimizes the unwanted heat gain/loss. The wooden doorframes and window frames were found to have the added advantage of being cheaper than the metal frames. Corrugated iron sheets were selected for roofing as they were found to be much cheaper than other roofing materials such as roofing tiles. Asbestos was disregarded for health reasons since it causes asbestosis. Metallic purlins were selected based on strength; however they were not to protrude to the external. This was done to minimize heat/loss and fast corrosion.
5. Experimental passive solar house
5.1 Design of the passive solar house
A passive solar house was designed, simulated using Ecotect building design software and constructed on a land that slopes facing north with an average gradient of about 0.134, having good solar access, making it ideal for passive solar design. Figure 4 shows the transverse
www.intechopen.com
Solar Power
138
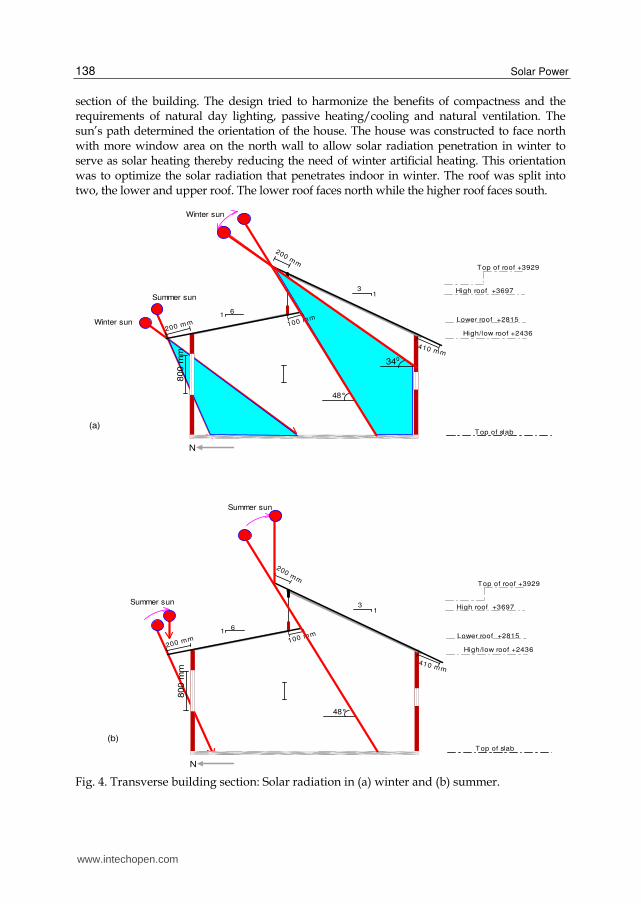
section of the building. The design tried to harmonize the benefits of compactness and the requirements of natural day lighting, passive heating/cooling and natural ventilation. The sun’s path determined the orientation of the house. The house was constructed to face north with more window area on the north wall to allow solar radiation penetration in winter to serve as solar heating thereby reducing the need of winter artificial heating. This orientation was to optimize the solar radiation that penetrates indoor in winter. The roof was split into two, the lower and upper roof. The lower roof faces north while the higher roof faces south.
31
61
Top of slab
Top of roof +3929
High roof +3697
Lower roof +2815
High/low roof +2436
N
Winter sun
410 mm
200 mm
200 mm
48°
Winter sun
Summer sun
340
100 mm
800 m
m
31
61
Top of slab
Top of roof +3929
High roof +3697
Lower roof +2815
High/low roof +2436
N
Summer sun
410 mm
200 mm
200 mm
48°
Summer sun
100 mm
800 m
m
(a)
(b)
Fig. 4. Transverse building section: Solar radiation in (a) winter and (b) summer.
www.intechopen.com
The Behaviour of Low-Cost Passive Solar Energy Efficient House, South Africa
139
This was done in order to enable the insertion of clerestory windows making it possible to direct solar radiation to the desired rear zone (floor and southern wall) and to maximize day lighting, thus minimizing the use of electricity during the day. The northern roof is ideal for mounting photovoltaic modules as active solar energy converters.
5.2 Operation of the passive solar house
In summer, the sun almost rises from the east and sets in the west. In this case, the roof overhangs were made long enough (simulation was done ECOTECT) to eliminate the possibility of sunrays penetrating indoor. With reference to the clerestory windows, the upper roof was extended out by 200 mm while the lower roof was extended in by 100 mm. This eliminates the possible direct penetration of the solar radiation in summer while allowing maximum penetration in winter.
In winter (May to August) the sun rises almost northeast, but following a low northern path in the sky and then set in the northwest. From May to August the daily maximum angle of the sun ranges from 34° to 48° and this maximum angle occurs at around 12h15 with June 21st having the smallest angle. Thus, the north facing windows allows solar radiation to penetrate indoor, while the clerestory windows allow the south wall and the far south floor (thermal mass) to receive solar radiation. The thermal masses of high heat capacity (i.e. concrete floor of 100 mm thickness and the wall made from fly ash bricks) absorb solar radiation during the day.
The thermal masses used are of high heat capacity thus absorbing large amounts of solar energy with minimal temperature variation. This prevents overheating of the indoor environment, thus keeping the indoor temperature within the comfort levels. At night, as the outdoor temperature decreases; the thermal mass slowly radiates long-wave radiation heating the indoor air therefore keeping the indoor air temperature within the thermal comfort levels. Since the window glazes are opaque to the long wave thermal radiation, the thermal radiation emitted by the thermal mass is trapped indoor, and heat loses are minimized.
Somerset East experiences westerly prevailing winds in summer, so the small windows on the west and east make it possible to control the ventilation rate. The clerestory windows and the south windows enhance controllable natural ventilation rate and helps to maintain temperature within the comfort levels (16°C to 28°C).
6. Predicted performance of the passive solar house
The mathematical description of thermal behaviour of building systems is complex. It involves the modelling of several interconnected subsystems, each containing long-time constants, non-linearities and uncertainties such as convection coefficients, material properties, etc. Moreover, external unpredicted perturbations, i.e., external weather (e.g. temperature and humidity), soil temperature, radiation effects and other sources of energy, such as people, illumination and equipments, should also be taken into account.
The analysis of the different design alternatives was carried out by averages of an hourly dynamic simulation using EcotectTM Building Design Software [Marsh, 2004]. Many building energy simulation software packages use the thermal zones concept to define thermal
www.intechopen.com

Solar Power
140
properties for the simulation. The effects of building parameters on the façade thermal performance were studied through the simulations. Building models were built in the simulation program. The South African Building Standard Code specifies the lower and upper comfort levels to be 16°C and 28°C respectively and relative humidity levels of 30% to 60%.
Figure 5 shows the simulation results of the PSH. The simulation results indicate that the indoor temperature of the passive solar house was within the limits of the comfort levels for about 98% of the total period (380 hours) tested. However, the outdoor was outside the comfort levels for 44% of the period with 30% being above the upper comfort level (28°C) and 14% below the lower comfort level (16°C). With reference to figure 5, the PSH was observed to have an average thermal time lag of 3 hours and a decrement factor of 0.67.
Fig. 5. Indoor and outdoor air temperature of the PSH simulated over a 380 h period (Summer).
The maximum indoor temperature attained was about 28°C and a minimum of 17°C giving a temperature swing of 10°C, while the outdoor temperature swing was about 31°C.
However, it must be noted that the actual performance of the house is not only restricted to design and materials used, but also to the operation of the house on the part of the occupants.
7. Ventilation
7.1 Ventilation efficiency
Natural ventilation provides a cheaper and simpler way of cooling buildings. Low cost energy efficient passive solar buildings rely on natural ventilation and the building
ventilation components must be positioned to capture the prevailing winds. Pollutants can build up to levels that may negatively impact human health unless they are removed or diluted with fresh outside air. The natural ventilation efficiency and air quality of the passive solar house was measured using the carbon dioxide tracer gas method. Reducing air
leakage from the house envelope is one of the ways to reduce energy use, as well as improve
www.intechopen.com

The Behaviour of Low-Cost Passive Solar Energy Efficient House, South Africa
141
the comfort, health and building durability. Traditionally, residential construction greatly relied on air infiltration through the building envelope, i.e. through the unintended gaps in walls, roofs, windows, doors, and other construction elements to provide ventilation. Low
cost energy efficient passive solar buildings rely on natural ventilation and the building ventilation components must be positioned to capture the prevailing winds [Myers, 2004].
House operation plays a key role in controlling a comfortable indoor environment. Somerset
East experiences westerly prevailing winds (W (60 15) N) and the passive solar house was
designed to make use of these winds to control the indoor environment, i.e., indoor
temperature and humidity, which are the key factors that determine thermal comfort. The
South African Residential Ventilation Building Code [Agrement South Africa] recommends
an average natural specific air exchange rate of 0.35 h-1 and an indoor carbon dioxide
concentration less than 0.500%.
Equivalent outdoor airflow rate corresponds to the outdoor airflow rate that would result in the same CO2 concentration in the measured room without inter-zone air flows.
An adult person produces on average (i.e. quiet or doing light work, about 100 W metabolic rate) carbon dioxide at about 20 l/h. At steady state, assuming that occupants are the only CO2 sources, the equivalent airflow rate per person, Qe, is related to CO2 concentration (Cin indoors and Cout outdoors) by [Roulet, 1991]:
ein out
SQ
C C [m3 /h] (1)
where S is the CO2 source rate, i.e. about 20 l/h. Assuming a steady state (constant carbon dioxide concentration), equation 6.1 can be used to assess the equivalent outdoor airflow rate per person.
Another way is to use the CO2 concentration records when there is no CO2 source in the
building. During these periods, the concentration decays down to the background
concentration, by dilution with the outdoor air flow. If there is good mixing and if the
outdoor air flow rate is constant, the decay is exponential and the factor corresponds to the
air change rate and the concentration at any time t, is given as [Penman, 1982]:
0tC C e (2)
where is the specific air exchange rate [h-1] 0C is the initial concentration above the
background concentration. Taking logarithms both sides of equation 2 and differentiating
with respect to time the specific air exchange rate can be approximated by the following
expression:
( ( ))In C
t (3)
If the outdoor airflow rate is not constant, the decrement calculated from two measurements
of concentration taken at time 1t and 2t provides an unbiased estimate of the average
equivalent outdoor specific airflow .
www.intechopen.com

Solar Power
142
7.2 Ventilation rate
Tracer gas tests were conducted over a period of time to measure actual air change rates. Figure 6 shows the indoor air currents due to the westerly prevailing winds. Carbon dioxide was injected into the house and its concentration monitored over time to determine how quickly the gas dissipates through the house’s envelope. The west side ventilation components were used to control the indoor environment by regulating the amount of air flowing into the house. A carbon dioxide sensor was placed in the centre of the house at a height of about 0.45 m above the floor.
Air currentsWesterly winds
Stove
Warm air exhausted
through clerestory
windows
N
Fig. 6. Air current movements.
A fan was used to pump the indoor air into the sensor at a rate of about 300 ml/min. To investigate the effects of each of the ventilation component configurations, i.e., windows and doors, the ventilation rate tests were done in four configurations. A carbon dioxide sensor connected to a CR1000 datalogger and a computer was used to monitor carbon dioxide concentration in the house.
Configuration I
The carbon dioxide gas was injected into the house when all doors and windows were closed and a fan was used to mix the air in the house for about 5 minutes. The operation of the fan was intended as a contingency plan to evenly distribute the initial tracer dose throughout the space for the calculation of exchange rates. The windows and doors were then opened and carbon dioxide concentration was recorded at 1-minute time intervals until a constant concentration was achieved.
Configuration II
Carbon dioxide was injected into the house with doors and windows closed; a fan was switched on for 5 minutes to mix the air. Windows were then opened but keeping the doors closed and carbon dioxide concentration readings taken at 1-minute intervals.
www.intechopen.com

The Behaviour of Low-Cost Passive Solar Energy Efficient House, South Africa
143
Configuration III
The procedure of configuration II was repeated but doors were opened and windows closed and the carbon dioxide concentration recorded at a 1-minute intervals.
Configuration IV
The procedure cited in phase 2 was repeated but all windows and doors were closed and carbon dioxide concentration recorded at 1-minute interval.
In all the above cases it was not possible to inject equal amounts of the tracer gas as the equipment used could not allow the measurement of the amount of gas injected.
7.3 Ventilation rate
The tracer gas technique was used to measure the air exchange rate. Figures 7 and 8
illustrate the tracer gas concentration profiles measured for different ventilation component
configurations, i.e., opening and closing of doors and windows. The average indoor and
outdoor temperatures during these tests were, Tin = 20 °C and Tout =17 °C, and an average
wind speed of 0.5 m/s blowing from W(600 150)N. Figure 7 show the tracer gas
concentration variation for configuration I, i.e., when both windows and doors were open.
Results indicate that the concentration decays exponentially to the background
concentration within a period of 16 minutes. Assuming that the west window and door are
the only paths through which the westerly winds enter the house, then the mass air flow
rate through the door and window is approximated by equation 2dm C A P . Taking
the average air density to be 1.2 kg/m3 and an average indoor and outdoor pressure
difference of 4 Pa. For wide-open windows and doors, the opening area is the sum of the
windows and doors areas, which gives 2.06 m2, and taking the discharge coefficient dC = 0.6,
the average mass airflow was found to be approximately 3.83 kg/s.
Fig. 7. Tracer gas concentration decay for configuration I and II [Makaka, Meyer; 2008].
www.intechopen.com

Solar Power
144
From figure 7 it was observed that the closing of doors significantly reduced the carbon
dioxide concentration decay rate implying a reduction in the ventilation rates achieved
when both doors and windows were open. Opening windows and closing doors reduced
the mass flow rate to 3.16 kg/s (i.e. a reduction of 17%). This means doors play a significant
role in the ventilation of the PSH.
Figure 8 illustrates the decay of the tracer gas concentration for configurations III and IV,
i.e., for open doors and closed windows, and for when both windows and doors were
closed. Comparing configurations I and III it was found that the opening of doors and
closing windows reduced the mass flow rate from 3.83 kg/s to 0.67 kg/s (i.e. a reduction of
82%). Configuration IV produced the minimum tracer gas concentration decay rate. It took
approximately 69 minutes for the tracer gas to decay to the background concentration.
When both doors and windows were closed, the infiltration and exfiltration airflow was
through the unintended gaps, such as, gaps between floor and door, roof and wall, etc.
Fig. 8. Tracer gas concentration decay for configuration III and IV [Makaka, Meyer; 2008].
With reference to figures 7 and 8 and taking a reference initial tracer gas concentration of
0.28% the time taken for the tracer gas concentration to decay to the background
concentration varied depending on the type of the ventilation components in use. Table 2
summarizes the time taken for the carbon dioxide concentration to decay from 0.28% to the
background concentration. From Table 2 it can be seen that windows have a higher
ventilation effect (shorter decay time) than doors. However this depends on the wind speed
and direction and the orientation of the ventilation component with respect to the wind
direction.
Somerset East experience W(600 150)N prevailing winds, and when windows are open and
doors closed, the west side windows capture the prevailing winds which then escape
through the east and south windows, and to a lesser extent through the north side windows.
This gives an effective controllable air inflow and outflow by adjusting the opening area of
windows.
www.intechopen.com

The Behaviour of Low-Cost Passive Solar Energy Efficient House, South Africa
145
In the case where windows are closed and doors open, the west side door captures the prevailing winds. Since the prevailing winds are not purely westerly, components of the inflow air currents also penetrate through the north side door. These currents are then opposed by the inflow air current through the west side door which will try to escape though the north side door as it is the only designed escape path under this configuration. This results in reduced concentration decay time, implying a reduced air exchange rate as compared to when windows are open and doors closed.
Ventilation components state Decay period (minutes)
Configuration I: All windows closed and doors open 16
Configuration II: All doors closed and windows open 17
Configuration III: All doors and windows open 13
Configuration IV: All windows and doors closed 69
Table 2. Decay periods for different ventilation components status.
7.4 Air quality
Several decay periods can be observed from figures 12 through 13. For each period, the initial and final times were determined and a normalized concentration, Cn, was calculated for each measurement time:
0
( ) (0)
(0)n
C t CC
C C
(4)
where C(0) is the initial concentration at the beginning of the decay period and 0C is the
background concentration and was found to be 0.234%. This background concentration was first deducted from the carbon dioxide concentration to get the increase resulting from the instant of injection. Figures 9 and 10 show the graphs of Ln(Cn) versus time for different ventilation component configurations. The air change rate, which is the slope of the line that represents Ln(Cn) versus time was calculated for each graph.
Fig. 9. Logarithmic graph of concentration: configuration I and II [Makaka, Meyer; 2008].
www.intechopen.com

Solar Power
146
Fig. 10. Logarithmic graph of concentration: configuration III and IV [Makaka, Meyer; 2008].
Table 3 shows the calculated specific airflow exchange rates ( ) for different ventilation
component configurations. In this table, the confidence intervals were calculated from the dispersion of the concentration measurements around the regression line, using 0.1% probability (99.9% confidence). When all the designed ventilation components were closed (configuration IV) the least specific air exchange rate ( ) of (0.29 0.03) h-1 was observed
as compared to other ventilation component configurations. The equivalent outdoor airflow rates ( eqM ) for each ventilation component configurations were calculated using the
expression: eqM V , where V is the volume of the house. The house has a volume of 34.56
m3 and an envelope area of 61.1 m2. Assuming that the flows are due to the envelope
leakage the specific leakage rate ( LS ) was obtained using the expression: eq
L
MS
A where A
is the area of the envelope and results are summarized in table 3
Configuration Ventilation component
status
Specific air exchange
rate (h-1)
Equivalent outdoor air flow rate eqM (m3/h)
Specific leakage rate LS
(m3/h.m2)
Rate of ventilation
heat flow vQ
(J/s) I Doors and
windows open9.58 0.04 331.08 1.38 5.42 772
II Doors closed and windows
open
1.74 0.02 60.13 0.69 0.98 140
III Doors open and windows closed
0.84 0.04 29.03 1.38 0.48 68
IV Doors and windows closed
0.29 0.03 10.02 1.04 0.16 24
Table 3. Specific airflow rates calculated from the various CO2 concentration decays [Makaka, Meyer,; 2008]
www.intechopen.com

The Behaviour of Low-Cost Passive Solar Energy Efficient House, South Africa
147
The ventilation rate determines the indoor environment as the incoming air carries with it
thermal energy. If the outdoor temperature is higher than the indoor, and as the outdoor air
flows indoors, the tendency is to raise the indoor temperature. The rate of ventilation heat
flow is approximated by equation. 1200v eqQ M T . Taking the average indoor-outdoor
temperature difference T to be 7°C and the ventilation rates from Table 3, the ventilation
heat flow rates were calculated. Table 3 also shows the summary of results for the rate of
ventilation heat flows for different ventilation component configurations. Depending on the
indoor and outdoor temperature difference, configuration I, which has the highest rate of
ventilation heat flow, can result in excess heat gains or losses. However, adjusting the
effective open areas of the ventilation components can regulate the heat gain/loss, thus
keeping the indoor environment within the comfort levels.
It must be noted that the rate of ventilation heat flow for configuration IV is through the unintended ventilation path ways, i.e. through gaps between doors and floors, etc, since all designed ventilation components were closed.
8. Indoor temperature variation
8.1 Prediction of indoor temperature
The mathematical description of thermal behaviour of building systems is a complex
process. It involves the modelling of several interconnected subsystems, each containing
long-time constants, non-linearities and uncertainties such as convection coefficients,
material properties, etc. The indoor temperature is affected by a number of stochastic
parameters, which include, wind speed and direction, relative humidity, solar radiation and
outdoor temperature. The random infiltration rate and thermophysical properties (such as
thermal conductivity of the walls and heat capacity of the room) have an impact on the
indoor temperature.
The statistical approach allows estimating the probabilistic future thermal behaviour of
buildings based on monitored statistical information, such as outdoor temperature, relative
humidity, etc. The stochastic behaviour of the occupants in operating the ventilation
components and other indoor human activities greatly affects the thermal performance of
buildings. Some can even choose to close doors to avoid pets to get indoor thus
compromising the thermal performance of the house. These parameters sometimes are
uncertain and in some cases are difficult to find the exact information.
8.2 Correlating Tin and Tout
Figure 11 shows the best-fit linear regression correlations of the indoor and outdoor
temperatures for summer. It was seen that the indoor and outdoor temperatures had
different correlations for low temperatures (less than 28°C), and for high temperatures
(greater than 28°C). At low temperatures the correlation factor was found to be 2 0.8064R
while for high temperatures the correlation factor was 2 0.6028R . At low temperatures the
correlation was found to be stronger implying that at low temperatures there is less
dependence on other parameters such as relative humidity as compared to high
temperatures. At high temperatures relative humidity was found to be very low (minimum),
www.intechopen.com

Solar Power
148
while the solar radiation was maximum. This suggests that relative humidity and solar
radiation have significant influence on the indoor temperature at high outdoor
temperatures. The peak indoor temperatures were found to occur during cooking periods
and thus creating a departure from the low temperature variation trend. A departure of
about 57% was observed from the low temperature variation trend to high temperature
variation trend and this departure is indicated in figure 11 by a double arrow. This
departure can be due to indoor heat sources, such as heat from stove. At low temperatures
the correlation between the indoor and outdoor temperature was found to be:
0.691 11.67in outT T (5)
while at high temperatures it was found to be:
1.088 0.308in outT T (6)
Fig. 11. Summer: Correlation of indoor and outdoor temperature [Makaka, Meyer; 2011].
Figure 12 shows the best-fit correlation of the indoor to the outdoor temperature for winter
period. At high outdoor temperatures (above 28°C) the correlation factor was found to be 2 0.4568R while at low temperatures (less than 28°C) it was 2 0.7391R . At low
temperatures the correlation is relatively stronger than at high temperatures implying that
the outdoor temperature has a greater influence on the indoor temperature at low
temperatures. The departure from the low temperature variations trend was found to be
about 62% and is indicated in figure 19 by a double arrow. This departure may be attributed
to indoor heating and activities which are independent to the outdoor temperature.
At low temperatures the correlation function between the indoor and the outdoor temperature was found to be:
Tin = 0.657Tout + 8.671 (7)
www.intechopen.com

The Behaviour of Low-Cost Passive Solar Energy Efficient House, South Africa
149
while at high temperatures it was found to be:
1.052 1.449in outT T (8)
From the correlation functions for summer and winter it was observed that the outdoor
temperatures have significant influence on the indoor temperature. It must also be noted
that, if a change occurs in the comfort parameters (e.g., temperature) that might result in
discomfort, occupants react in a way that tend to restore their comfort, and there is no
precise temperature at which one opens a window, but as the temperature rises there is an
increase in probability that windows need to be opened. In figure 12, a significant number of
data points appear as outliers. Although the occupants never used a proper heater, it is
highly likely that at times they used a two-plate electrical stove to heat the indoor
environment, thus giving rise to outliers. It must be noted that the outliers are above the
trend line, confirming that at times a heating system was used. However the occupants
never reported the use of a heater or fan.
Fig. 12. Winter: Correlation of indoor and outdoor temperature [Makaka, Meyer; 2011].
The wide dispersion of the points about the trend line also indicates that the indoor
temperature is not affected by the outdoor temperature only but by other factors such as
ventilation rate, relative humidity, wind speed and solar radiation. The correlations also
suggest that the passive solar house is freeze resistance since when the outdoor temperature
is 0ºC, the indoor temperature would be about 8°C in winter and much higher (about 12°C)
in summer. From the measured data it was observed that on the 29/5/29 at around 06h30
the outdoor temperature dropped to about 1.6°C and the indoor temperature only dropped
to 9.4°C. This indicates the high heat retention capacity of the thermal mass (fly ash bricks),
such that when the outdoor temperature drops to zero, the stored thermal energy in the wall
continue to heat the indoor air keeping it at a temperature above 8°C.
www.intechopen.com

Solar Power
150
8.3 Correlating Tin and outdoor relative humidity
Figure 13 shows the correlation of indoor temperature to outdoor relative humidity for
summer. The data points were found to follow two distinct distribution trends, i.e., at low
(less than 34%) and high (greater than 34%) relative humidity. The correlations factors
were found to be very weak, for low relative humidity the correlation factor was found to
be, 2 0.2774R while for high relative humidity it was found to be 2 0.3099R . The
differences in correlation strength at low and high relative humidity suggest that there are
other variables which dominate at low relative humidity and not at high relative
humidity. At low relative humidity solar radiation was found to have a greater influence
on the indoor relative humidity variation. The low correlation factors indicate that there
are other parameters which have a higher impact on the indoor temperature than the
outdoor relative humidity. At low outdoor relative humidity (less than 34%) the
correlation was found to be:
0.3395( ) 40.464in outT RH
(9)
while at high relative humidity the correlation was:
0.1184( ) 33.389in outT RH (10)
Figure 14 shows the correlation of the indoor temperature and outdoor relative humidity for
the winter period. The data points were found to be more scattered than for the summer.
The high scatter is due to the variability of the Somerset East weather, which can change two
to three times a day and a change of indoor activities due to the change of season. The
dependence of the indoor temperature with the outdoor relative humidity was found to be
different for low and high outdoor relative humidity. For low relative humidity the
correlation factor was found to be 2 0.2657R while for high relative humidity the
correlation factor was2 0.4027R . Low relative humidity was found to correspond to high
temperatures, which is directly related to the solar radiation. High solar radiation was found
to correspond to low relative humidity. At low relative humidity the correlation function
was found to be:
0.6862( ) 36.65in outT RH (11)
while at high relative humidity the correlation function was found to be:
0.1004( ) 22.70in outT RH (12)
8.4 Effect of solar radiation on indoor temperature
Figure 15 shows the correlation of the indoor temperature and solar radiation. The
correlation factor was found to be 2 0.5873R . It must be noted that the indoor temperature
is affected by a number of factors, which include heat generated by the occupants and from
equipments such as stove and refrigerator.
www.intechopen.com

The Behaviour of Low-Cost Passive Solar Energy Efficient House, South Africa
151
Fig. 13. Summer: Correlation of indoor temperature and outdoor relative humidity
Fig. 14. Winter: Correlation of indoor temperature and outdoor relative humidity.
Fig. 15. Evolution of indoor temperature with solar radiation [Makaka, Meyer; 2011].
www.intechopen.com
Solar Power
152
The indoor and outdoor temperature difference gives the direction of heat flow. High solar
radiation was found to be associated with low indoor and outdoor temperature differences.
Maximum indoor temperatures were found to occur at around 14h00. In summer the roof
was found to attain high temperatures and the roof being of iron sheets (good thermal
conductor) contributed significantly to the indoor temperature distribution. The high
roof temperature diminishes the indoor and outdoor temperature difference. The correlation
function between indoor temperature and solar radiation, I, was found
to be:
0.0075 21.27inT I (13)
Equation (13) shows that when the solar radiation is zero (at night), the indoor temperature
would be within the thermal comfort levels (about 21ºC). During the day the thermal mass
would have absorbed solar radiation and releases it at night thus keeping the indoor
environment within the comfort levels.
8.5 Temperature modeling
The generalized mathematical model for predicting indoor temperature of any building has
to take into account two types of data: on one hand the climatic conditions to which the
building is exposed and, on the other hand, the thermal properties of the building. In an
unoccupied house one can have a complete control over the conditions of the house,
whether to open or close; shade or unshade the windows, etc. During the experimental
period, the ventilation components can be maintained at the same configuration without
indoor heat generation or cooling.
In occupied buildings the situation is very different, as the occupants have complete
freedom to change the conditions according to their changing needs or desires. The activities
of the occupants have a significant influence on the indoor temperature distribution.
Predicting the indoor temperature is a very difficult and complex process, as random
variables come into play, such as the closing and opening of the ventilation components.
Outdoor weather variables such as wind speed, temperature, solar radiation and relative
humidity are key determinant factors of the indoor temperature. However it must be noted
that the indoor temperature is also linked to the heat fluxes generated in the house by
appliances.
The performance of the house was observed to depend on how the occupants operate the
house, and the thermal behaviour of the house in winter was seen to be different from that
in summer. Based on the monitored results, the first stage in the development of the
experimental predictive model was to analyze the patterns between (i) inT and outT (ii) inT
and I (iii) inT and outRH (iv) inT and wV . Taking into account these possible dependences
predictive models for the indoor temperature for summer and winter were developed. A
linear dependence was proposed as the above relation patterns were observed to be linear.
1 2 3 4 5in out out wT a * T a * RH a * I a * V a (14)
Where:
www.intechopen.com
The Behaviour of Low-Cost Passive Solar Energy Efficient House, South Africa
153
inT = Indoor temperature
outT = Outdoor temperature
wV = Wind speed
I = Solar radiation
outRH = Outdoor relative humidity
ia = Regression coefficient
The constant 5a takes into account heat generated indoors either by appliances or occupants.
The above-proposed model is a simplification of a complex dependence. It must be noted
that all the parameters involved are not independent. For example, the outdoor temperature
greatly depends on irradiance and wind speed. Using regression analysis, the coefficients in
equation (14) were determined.
For summer the following model was obtained:
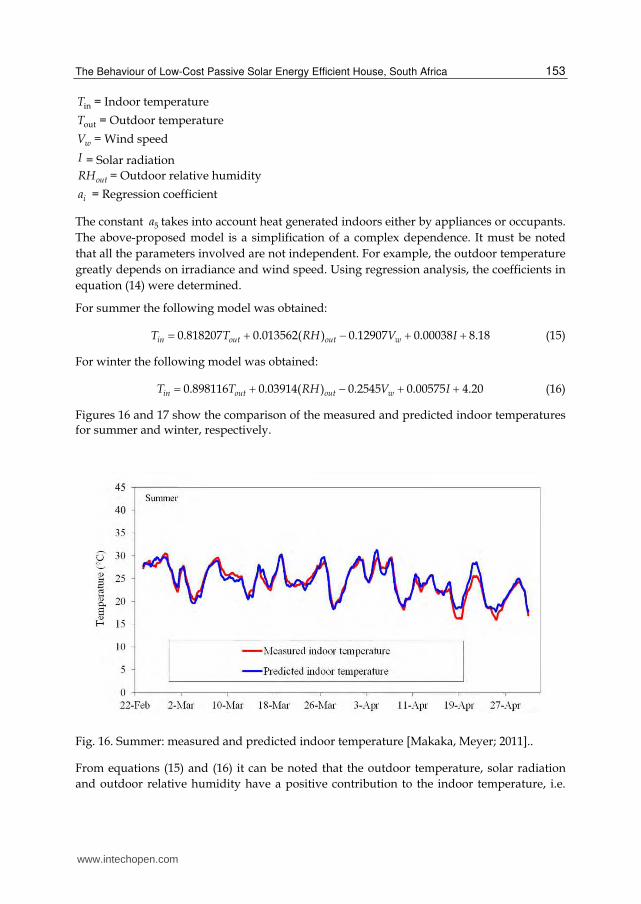
0.818207 0.013562( ) 0.12907 0.00038 8.18in out out wT T RH V I (15)
For winter the following model was obtained:
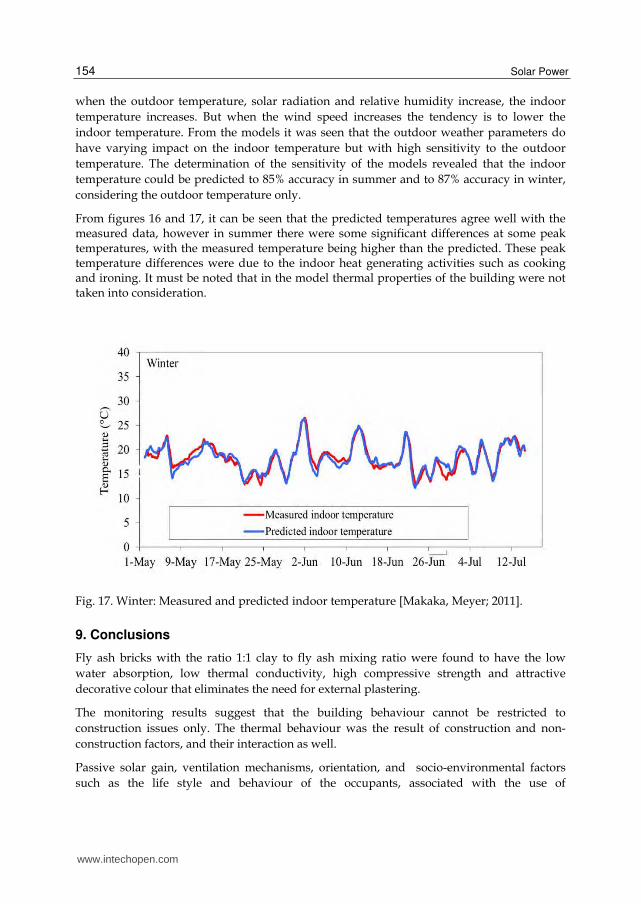
0.898116 0.03914( ) 0.2545 0.00575 4.20in out out wT T RH V I (16)
Figures 16 and 17 show the comparison of the measured and predicted indoor temperatures for summer and winter, respectively.
Fig. 16. Summer: measured and predicted indoor temperature [Makaka, Meyer; 2011]..
From equations (15) and (16) it can be noted that the outdoor temperature, solar radiation
and outdoor relative humidity have a positive contribution to the indoor temperature, i.e.
www.intechopen.com
Solar Power
154
when the outdoor temperature, solar radiation and relative humidity increase, the indoor
temperature increases. But when the wind speed increases the tendency is to lower the
indoor temperature. From the models it was seen that the outdoor weather parameters do
have varying impact on the indoor temperature but with high sensitivity to the outdoor
temperature. The determination of the sensitivity of the models revealed that the indoor
temperature could be predicted to 85% accuracy in summer and to 87% accuracy in winter,
considering the outdoor temperature only.
From figures 16 and 17, it can be seen that the predicted temperatures agree well with the measured data, however in summer there were some significant differences at some peak temperatures, with the measured temperature being higher than the predicted. These peak temperature differences were due to the indoor heat generating activities such as cooking and ironing. It must be noted that in the model thermal properties of the building were not taken into consideration.
Fig. 17. Winter: Measured and predicted indoor temperature [Makaka, Meyer; 2011].
9. Conclusions
Fly ash bricks with the ratio 1:1 clay to fly ash mixing ratio were found to have the low
water absorption, low thermal conductivity, high compressive strength and attractive
decorative colour that eliminates the need for external plastering.
The monitoring results suggest that the building behaviour cannot be restricted to
construction issues only. The thermal behaviour was the result of construction and non-
construction factors, and their interaction as well.
Passive solar gain, ventilation mechanisms, orientation, and socio-environmental factors
such as the life style and behaviour of the occupants, associated with the use of
www.intechopen.com

The Behaviour of Low-Cost Passive Solar Energy Efficient House, South Africa
155
complementary heating, operative heating (cooking, metabolic heat production), were
found to have a significant impact on the indoor temperature distribution. The house
performed differently in summer and winter. The indoor temperature followed the outdoor
temperature implying that the solar radiation has a great impact on the indoor temperature
variation.
The ventilation rate was found to depend on the ventilation component in use, windows
were found to have a higher ventilation effect than doors. Correct opening and closing of
windows can regulate the air infiltration thus controlling the indoor air quality.
When the day-to-day indoor temperature variations and the outdoor weather parameters
are known, it is possible to reconstruct an approximate indoor temperature patterns during
a given period. An indoor temperature prediction formula was modelled; it was shown that
knowing the outdoor weather data parameters, the indoor temperature could be predicted.
Outdoor temperature was found to have the largest impact on the indoor thermal
environment. Significant differences were noted during cooking periods when a lot of heat
was generated indoors, resulting in much higher measured indoor temperature than the
model can predict. It is worth mentioning that the activities of the occupants play an
important role in indoor temperature distribution.
10. References
[1] Agrement South Africa, (2002), Assessment criteria: Building and walling systems:
Acoustics performance of buildings, http://www.agrement.co.za/.
[2] Kunzel, H. M, Zirkelbach, D. and Sedlbaur, (2003), Predicting indoor temperature and
humidity conditions including hygrothermal interactions with the building
envelope. Published in proceedings of the 1st International Conference on
sustainable Energy and Green Architecture., Building Scientific Research Centre
(BSRC), King Monkut’s University Thornburi, Bangkoki 8-10 Oct. 2003.
[3] Makaka, G and Meyer, E. (2008), Thermal behaviour and ventilation efficiency of low-
cost passive solar energy efficient house, Renewable energy 33 (2008), page 1959-
1973
[4] Marsh, A., (2004), www.squ1.com
[5] Myers, E and George, F., (2004), Effect of ventilation rate and board loading on
formaldehyde concentration: a critical review of literature. Forest products journal
2004, Vol. 34, number 10.
[6] Penman, R., (1982), Experimental determination of airflow in a naturally ventilated room
using metabolic CO2: Building and Environment, 17, 4.
[7] Raman, P., Mande, S. and Kishore, V. V. N., (2001), A passive solar system for thermal
comfort conditioning of buildings in composite climates. Tata Energy Research
Institute, Darbari Seth Block, Habitate place, Lodhi Road, New Delhi, India.
[8] Roulet, C. A., (1991), Simple and cheap air change rate measurement using
CO2 concentration decays. Air infiltration and ventilation centre Technical Note:
34.
www.intechopen.com

Solar Power
156
[9] Wray, W., Balcomb, J.D., and Macfarland, R.D., (1979), A Semi Empirical method for
estimating the performance of direct gain passive solar heated buildings. Proc. 3rd
National Passive solar conference, San Jose California.
www.intechopen.com

Solar PowerEdited by Prof. Radu Rugescu
ISBN 978-953-51-0014-0Hard cover, 378 pagesPublisher InTechPublished online 15, February, 2012Published in print edition February, 2012
InTech EuropeUniversity Campus STeP Ri Slavka Krautzeka 83/A 51000 Rijeka, Croatia Phone: +385 (51) 770 447 Fax: +385 (51) 686 166www.intechopen.com
InTech ChinaUnit 405, Office Block, Hotel Equatorial Shanghai No.65, Yan An Road (West), Shanghai, 200040, China
Phone: +86-21-62489820 Fax: +86-21-62489821
A wide variety of detail regarding genuine and proprietary research from distinguished authors is presented,ranging from new means of evaluation of the local solar irradiance to the manufacturing technology ofphotovoltaic cells. Also included is the topic of biotechnology based on solar energy and electricity generationonboard space vehicles in an optimised manner with possible transfer to the Earth. The graphical materialsupports the presentation, transforming the reading into a pleasant and instructive labor for any interestedspecialist or student.
How to referenceIn order to correctly reference this scholarly work, feel free to copy and paste the following:
Golden Makaka, Edson L. Meyer, Sampson Mamphweli and Michael Simon (2012). The Behaviour of Low-Cost Passive Solar Energy Efficient House, South Africa, Solar Power, Prof. Radu Rugescu (Ed.), ISBN: 978-953-51-0014-0, InTech, Available from: http://www.intechopen.com/books/solar-power/the-behaviour-of-low-cost-passive-solar-energy-efficient-house-south-africa

© 2012 The Author(s). Licensee IntechOpen. This is an open access articledistributed under the terms of the Creative Commons Attribution 3.0License, which permits unrestricted use, distribution, and reproduction inany medium, provided the original work is properly cited.