the benefit of gis-reporting in the context of water-related health
DESCRIPTION
The benefit of GIS-reporting in the context of Water-related Health. Dr. Ina Wienand (MSc GIS). Why using GIS in the context of Water & Health?. Water-related health is a matter of spatial aspects - PowerPoint PPT PresentationTRANSCRIPT

Institute for Hygiene and Public Health, University of Bonn, GermanyWHO Collaborating Centre for Health Promoting Water Management
and Risk Communication
The benefit of GIS-reporting in the context of
Water-related Health
Dr. Ina Wienand (MSc GIS)

Institute for Hygiene and Public Health, University of Bonn, GermanyWHO Collaborating Centre for Health Promoting Water Management
and Risk Communication
Why using GIS in the context of Water & Health?
Water-related health is a matter of spatial aspects• high interoperability with environmental conditions
like precipitation, soil, aquifer, geology, temperaturechemical aspects
• water infrastructure• epidemiology of water-related diseases
GIS is able to show the spatial distribution of water-related health data as thematic maps with different layers while using tables and data in the background
Institute for Hygiene and Public Health, University of Bonn, GermanyWHO Collaborating Centre for Health Promoting Water Management
and Risk Communication
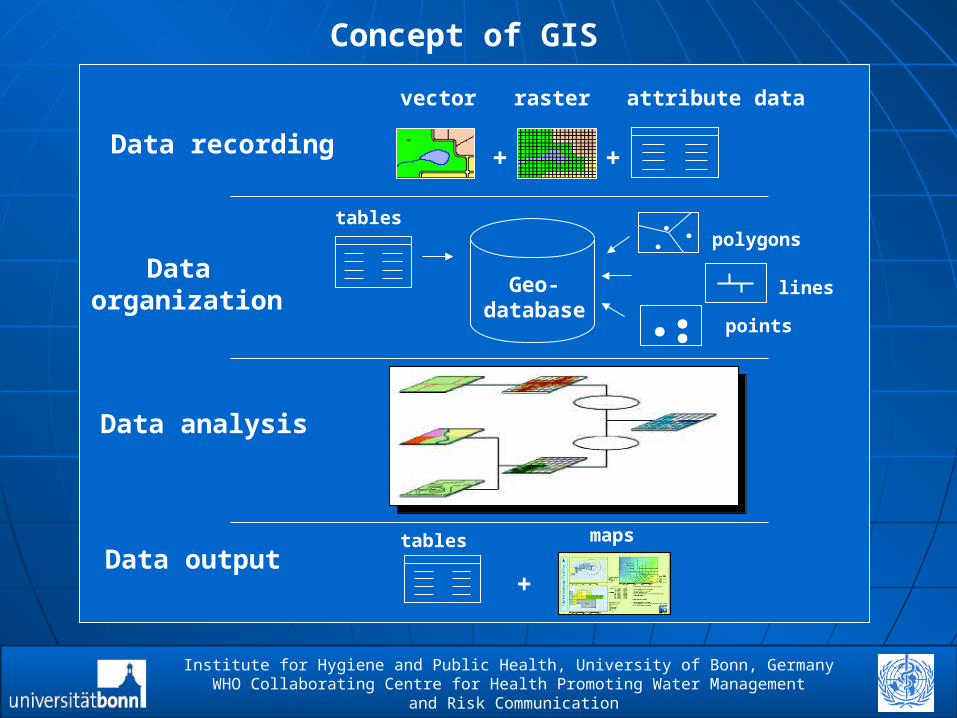
Concept of GIS
Geo-database
.. .
...
Data recording
Data organization
+ +
Data analysis
Data output
tables
lines
+
points
polygons
vector raster attribute data
tables maps

Institute for Hygiene and Public Health, University of Bonn, GermanyWHO Collaborating Centre for Health Promoting Water Management
and Risk Communication
Desktop-GIS versus Web-GIS
Geo-database
Storing data in a geodatabase
Implementing datainto a desktop GIS
Implementingdata into
the Web-GIS
Desktop-GIS: ArcGIS 9

Institute for Hygiene and Public Health, University of Bonn, GermanyWHO Collaborating Centre for Health Promoting Water Management
and Risk Communication
What are the advantages of GIS reporting?
• GIS presentation, layout and classification can be easily modified and adopted towards
individual data
• GIS include an extensive list of functions for analyzing and visualizing spatial data
• GIS can be permanently updated and maps can beproduced in a very short time
• GIS can be used by advanced professionals and distributed to a large audience (e.g. internet)
• GIS software does not have to be expensive

Institute for Hygiene and Public Health, University of Bonn, GermanyWHO Collaborating Centre for Health Promoting Water Management
and Risk Communication
Web-GIS mapping on a cross-national level
Getting information for theselected country

Institute for Hygiene and Public Health, University of Bonn, GermanyWHO Collaborating Centre for Health Promoting Water Management
and Risk Communication
Web-GIS mapping on a cross-national level

Institute for Hygiene and Public Health, University of Bonn, GermanyWHO Collaborating Centre for Health Promoting Water Management
and Risk Communication
Development of a Web-GIS approachon a cross-national level
Differences to other static internet maps
• selecting different layers (overlay layers)
• zooming in and out (dynamic map)
• selecting a specific region on a map
• getting information of a specific country which is
stored in the background for all years
• labeling layers

Institute for Hygiene and Public Health, University of Bonn, GermanyWHO Collaborating Centre for Health Promoting Water Management
and Risk Communication
Desktop-GIS mapping on a national level
Giardiasis incidence inGermany on the districtlevel from 2001 to 2003

Institute for Hygiene and Public Health, University of Bonn, GermanyWHO Collaborating Centre for Health Promoting Water Management
and Risk Communication
Desktop-GIS mapping on a national level
Extreme values of Giardiasis incidencein Germany
Spatial statistical analysis(poisson distribution)

Institute for Hygiene and Public Health, University of Bonn, GermanyWHO Collaborating Centre for Health Promoting Water Management
and Risk Communication
Desktop-GIS mapping on a national level
Surface water abstractionper inhabitant in theyear 2001 in Germany

Institute for Hygiene and Public Health, University of Bonn, GermanyWHO Collaborating Centre for Health Promoting Water Management
and Risk Communication
Desktop-GIS mapping on a national level
Inhabitants per drinking water extracting plantin Germany in 2001
Institute for Hygiene and Public Health, University of Bonn, GermanyWHO Collaborating Centre for Health Promoting Water Management
and Risk Communication
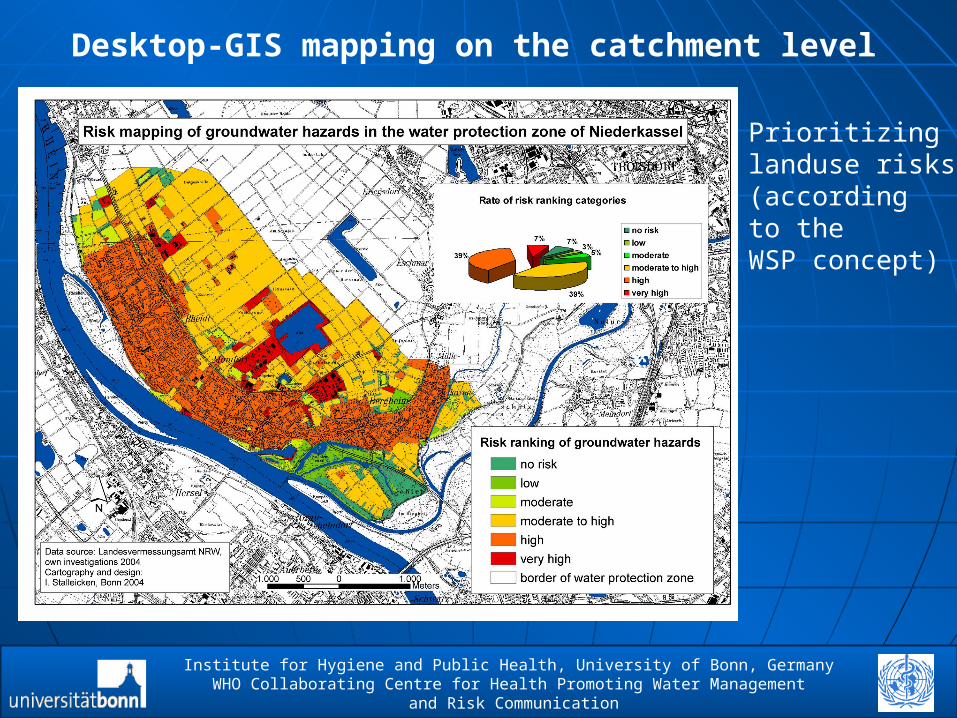
Desktop-GIS mapping on the catchment level
Prioritizinglanduse risks (according to the WSP concept)

Institute for Hygiene and Public Health, University of Bonn, GermanyWHO Collaborating Centre for Health Promoting Water Management
and Risk Communication
Desktop-GIS mapping on the catchment level

Institute for Hygiene and Public Health, University of Bonn, GermanyWHO Collaborating Centre for Health Promoting Water Management
and Risk Communication
Desktop-GIS mapping on the catchment level
Vulnerablepopulationgroups andresidents

Institute for Hygiene and Public Health, University of Bonn, GermanyWHO Collaborating Centre for Health Promoting Water Management
and Risk Communication
• Data required by the progress monitoring system
of the Protocol on Water and Health have a spatial
component -> GIS is an ideal reporting tool
• GIS is flexible in respect of integrating and combining
other additional information into one reporting system
• There are GIS standards available (OGC -> Open
Geospatial Consortium) which provide a platform for
interchanging data, models and results
Results and future prospects I

Institute for Hygiene and Public Health, University of Bonn, GermanyWHO Collaborating Centre for Health Promoting Water Management
and Risk Communication
Results and future prospects II
• GIS analysis shows the identification of critical areasand provides therefore political action on a local basis
• GIS reporting can be fully adopted in the Water Safety Plan approach (WSP)
• GIS forms the basis of an effective publiccommunication tool
• Costs can be mitigated by using Open Source software and moving from desk-top applications to Web-based GIS systems

Institute for Hygiene and Public Health, University of Bonn, GermanyWHO Collaborating Centre for Health Promoting Water Management
and Risk Communication
• The level of data collection differs between countries (e.g. district or catchment areas)
• Methods measuring, collecting and preprocessingdata have to be standardized
• Data descriptions have to be included into the metadata or refer to an external file of definition
• As a result data can be analyzed on a cross-nationallevel and allow conclusions which cannot be reached
on local basis
Future needs for GIS reportingon a cross-national level?
Institute for Hygiene and Public Health, University of Bonn, GermanyWHO Collaborating Centre for Health Promoting Water Management
and Risk Communication
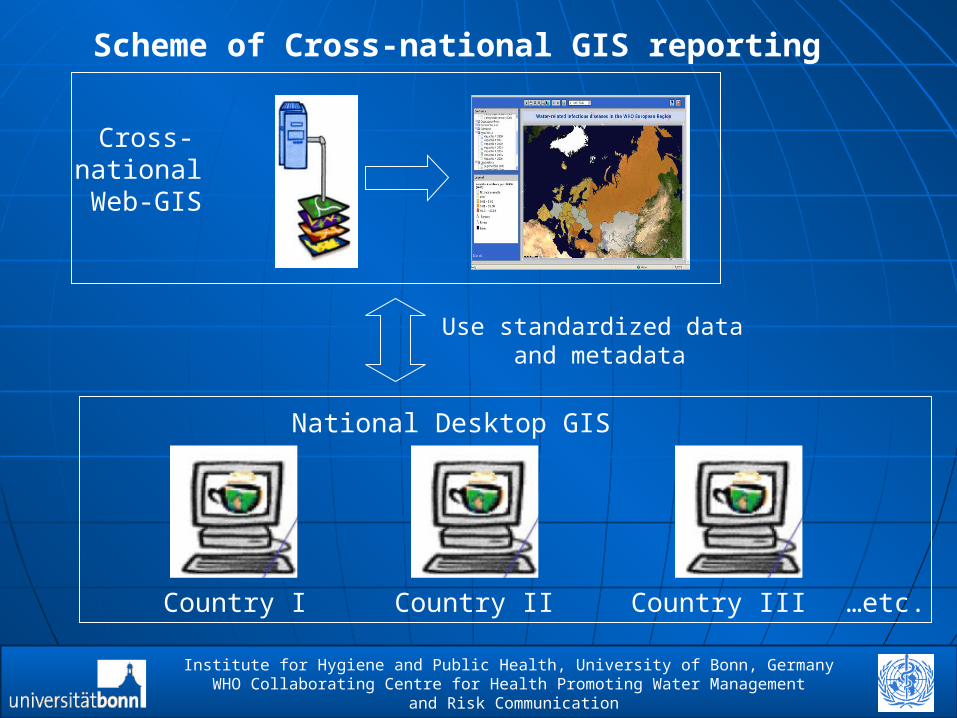
Scheme of Cross-national GIS reporting
Country I Country II Country III
National Desktop GIS
Cross-national Web-GIS
…etc.
Use standardized data and metadata

Institute for Hygiene and Public Health, University of Bonn, GermanyWHO Collaborating Centre for Health Promoting Water Management
and Risk Communication
Thank you for your attention! Questions?