the benefits of graphic design
DESCRIPTION
It's the annual report on my findings on graphic design. Although still on the brink of completion, it will be updated every half year. With any problem on graphic design, this will be your manual to success.TRANSCRIPT


PAGE 6 PAGE 14
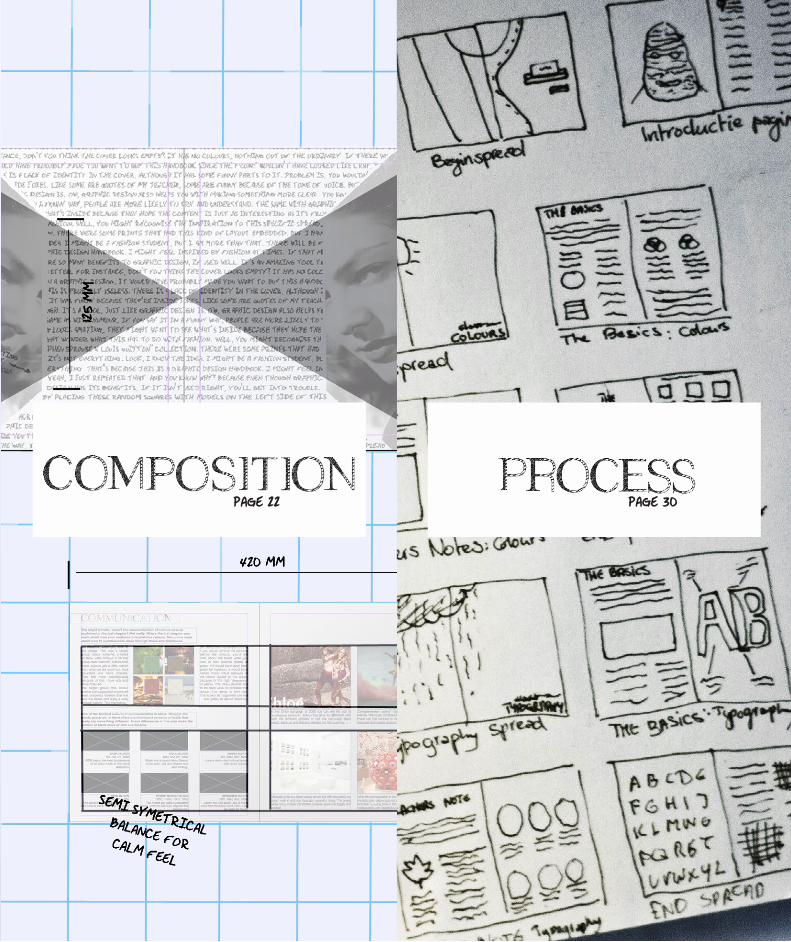
PAGE 22 PAGE 30


With colour, there is no wrong or right. It is all about what you want to say and how much strength you want to give that message. This does not make it an easy matter thou, since even the slightest dif-ference in colour can make a difference. The following chapters will explain the subtleties within the world of colour.
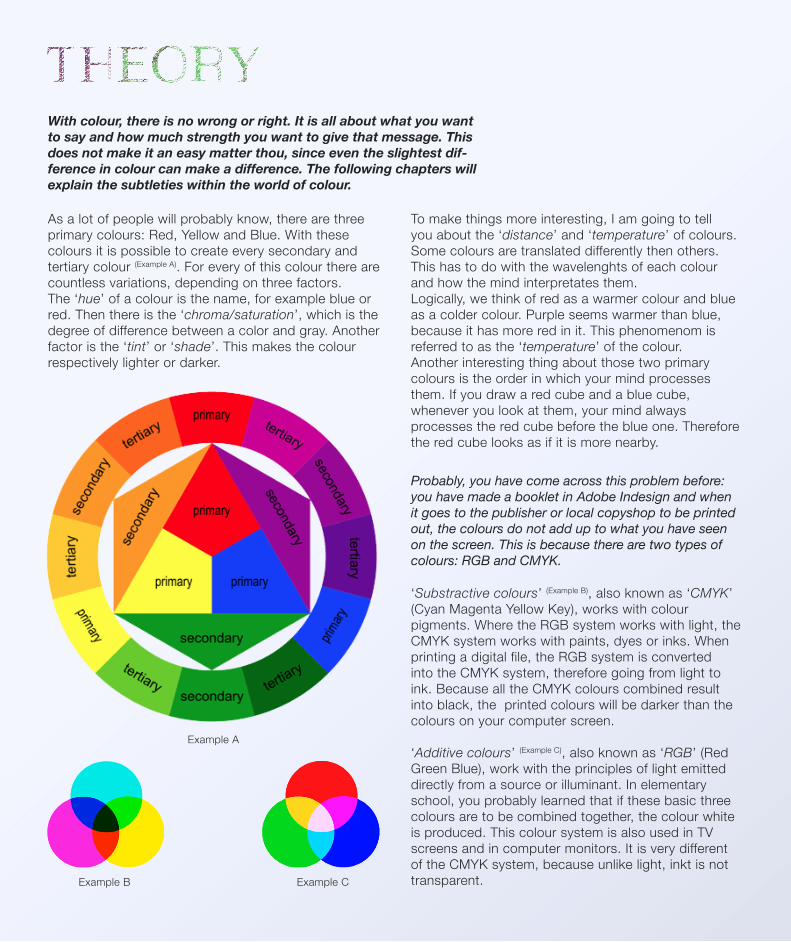
As a lot of people will probably know, there are three primary colours: Red, Yellow and Blue. With these colours it is possible to create every secondary and tertiary colour (Example A). For every of this colour there are countless variations, depending on three factors.The ‘hue’ of a colour is the name, for example blue or red. Then there is the ‘chroma/saturation’, which is the degree of difference between a color and gray. Another factor is the ‘tint’ or ‘shade’. This makes the colour respectively lighter or darker.
To make things more interesting, I am going to tell you about the ‘distance’ and ‘temperature’ of colours. Some colours are translated differently then others. This has to do with the wavelenghts of each colour and how the mind interpretates them. Logically, we think of red as a warmer colour and blue as a colder colour. Purple seems warmer than blue, because it has more red in it. This phenomenom is referred to as the ‘temperature’ of the colour. Another interesting thing about those two primary colours is the order in which your mind processes them. If you draw a red cube and a blue cube, whenever you look at them, your mind always processes the red cube before the blue one. Therefore the red cube looks as if it is more nearby.
Probably, you have come across this problem before: you have made a booklet in Adobe Indesign and when it goes to the publisher or local copyshop to be printed out, the colours do not add up to what you have seen on the screen. This is because there are two types of colours: RGB and CMYK.
‘Substractive colours’ (Example B), also known as ‘CMYK’ (Cyan Magenta Yellow Key), works with colour pigments. Where the RGB system works with light, the CMYK system works with paints, dyes or inks. When printing a digital file, the RGB system is converted into the CMYK system, therefore going from light to ink. Because all the CMYK colours combined result into black, the printed colours will be darker than the colours on your computer screen.
‘Additive colours’ (Example C), also known as ‘RGB’ (Red Green Blue), work with the principles of light emitted directly from a source or illuminant. In elementary school, you probably learned that if these basic three colours are to be combined together, the colour white is produced. This colour system is also used in TV screens and in computer monitors. It is very different of the CMYK system, because unlike light, inkt is not transparent.
Example A
Example B Example C

“If you see a tree as blue, then make it blue...”“If you see a tree as blue, then make it blue...”Paul Gaugain
Now this still does not solve your problem. Your prints are still darker than on screen, and all your hard work doesn’t really show because the colours aren’t the way you intended them to be.
very easy. Every year Pantone releases a guide with a vast collection of colours. Pantone recommends that the PMS Colour Guides be purchased annually as their inks become more yellow over time. When you’re working on a graphic design and you need the guarantee that one specific colour remains the way you intended it to be, you find this colour in the PMS Colour Guide and show it to your local copy shop. He then will mix the inks so that the specific colour will apear on your print.
Interesting fact about the Pantone Colour Matching System: In January 2003, the Scottish Parliament debated a petition to refer to the blue in the Scottish flag as ‘Pantone 300’. Countries such as Canada and South Korea and organizations such as the FIA have also chosen to refer to specific Pantone colors to use when producing flags. U.S. states including Texas have set legislated PMS colors of their flags.Pantone also collaborated with Fine Paints of Europe to design a new line of interior and exterior paints.
This is a problem that was not solved untill a small printing company called Pantone Inc. created a system that made it possible to convert the RGB colour model into the CMYK colour model. Now imagine, Photoshop was created in 1990 and the Pantone Colour Matching System was released in 2001. The system works
If you have a design where you want your colours to have a vibrant and energetic feel, without creating chaos, you will need to make use of ‘complementary colours’. When placed next to each other, comple-mentary colors make each other appear brighter and intense. For example, if you look at the colour wheel on the opposite page, you’ll see that the colours are aran-ged in a certain way. The outer ring looks very balanced and in harmony, while the hexagon in the center doesn’t at all. This is because, when looking at the hexagon,
the secondary colour aiming in the opposite dirrection of the primary colour are complementary colours (Red and green, orange and blue, magenta and yellow). The outer ring is a collection of ‘analogous colours’. These colours don’t form a contrast, but actually go in perfect harmony with each other and make your layout feel calm. For instance, when looking at green, you’ll find that that hue is in perfect harmony with the yellow green and the darker green. This also works for orange, red orange and yellow orange.

With colour, there is no wrong or right. It is all about what you want to say and how much strength you want to give that message. This does not make it an easy matter thou, since even the slightest difference in colour can make a difference. The following chapters will explain the subtleties within the world of colour.
Blue (Light)Promotes creati-vity, boyish
Blue (Regular)Encourages sleep, calming, coolness, effici-ency, intelligent, cold, masculinity
YellowImproves me-mory, judgement, understanding, organized, pro-motes optimism
TurquoiseFacilitates com-munication
Green (Mint)Refreshning
Green (Regular)Conforting, re-laxing, wellness, close to nature, fosters peace of mind
BrownComforting, close to nature, woods
OrangeStimulates diges-tion, promotes self-asteem, for-givingness, good humour, stability
RedEncouraging, warm, sensual, irritating, masculi-nity, danger, pro-motes ambition
WhiteCreates feeling of openness, purity, order, innocence
PinkLove, flirting, girlish, sweet, nurturing
VioletHealing, antisep-tic, treats fear, feminity, promotes mental equilibri-um, luxury
GreySophistication, depression, nutru-al, lack of energy
BlackProvides feeling of protection, mys-terious, autority, power, death

You might wonder, wasn’t the communication of colour already explaines in the last chapter? Well, not really, for the last chapter merely explained how your audience interpretates colours, this one will explain more about ways to communicate with the information given on the previous pages.
For instance, when you look at this image. This is a tribe colour scheme, created to show what colours fit best to a certain focus group. Notice that these colours are a little darker than regular, less saturated and more shaded. They feel more sophisticated because of this, more rich and more matured.The target group this colour scheme was supposed to portrait were succesful families that live near a forest and enjoy a walk through nature. The interesting part about this visualisation is that
if you would remove the pictures behind the colours, you would still think about the forest when you look at that specific shade of green. If it would have been limegreen for instance, it would have looked more active because of
the yellow added to the green. This is because of the low ‘fre-quency’ and high ‘wavelength’ of yellow. The ciliary muscle has to flex harder than normal to pro-cess colours with a frequency lower than 550. This is why all magazines use red and yellow to
attract your attention.
One of the hardest colours in communication is black. Through the whole spectrum of black there are 6 different versions of black that really say something different. These differences in hue make the version of black more or less sustainable.
BASIC BLACK0C, 0M, 0Y, 100K
The most plain and sustainable tone of black
RICK BLACK63C, 52M, 51Y, 100K
Ink black, deep and second least sustainable of all shades of black
REGISTRATION BLACK100C, 100M, 100Y, 100KMost of the time used for
allignment, least sustainable
COOL BLACK60C, 0M, 0Y, 100K
Black with a bluish tone. Seems more calm, but distant and cold
WARM BLACK0C, 60M, 30Y, 100K
A warm and inviting shade of black, with more energy
DESIGNER BLACK70C, 50M, 30Y, 100K
Close to rich black, but more blue and therefore more calm

In this Chloe campaign of 2006 you can see the use of ‘analogous colours’. Everything gets its attention and with the different shades of red, the campaign feels warm, sensual and therefor perfect for the spring and summer.
Although white is a clean colour, let one kid with strawberry icecream walk in and you have got yourself a mess. The overall white tones make this Waffles sneaker store look bigger and more well-ordered.
‘Complementary colours’ make each other appear more intense. This Ksubi commercial that came out in May this year made use of that contrast to make sure that the coloured skinny jeans stood out.
While the low saturation in the colours of the wall give an artistic feel, the light pink, yellow and red tones give a warm, childish and innocent tone to this Louis Vuitton store. It fitted the collaboration between LV and artist Takeshi Murakami.


SLAB SERIFSCRIPTDECORATIVEBLACKLETTERMODERN
Typography is what language looks like. First off, thank you Ellen Lupton for that quote, since a lot of people forget that fact. In its purest form, the use of typography is to tell something and not, as some people use it, to make nice figures with it. But first, let me tell you about some interesting terms.
AlphabetThis are all letters, numbers and symbols with which we make text.
TypefaceAn interpretation of the alphabet. Examples of typefaces are Helvetica, Garamond, Comic Sans, Papyrus.
FontA style within such a typeface. For example Helvetica Light, Helvetica Bold.
GlyphA glyph is either an individual character within a typeface: a number, a letter or a symbol.
ReadabilityThe degree to which glyphs in text are understandable or recognizable based on appearance.
Cicero1⁄6 of the historical French inch, a measurement used in typography.
X-HeightThe height of a lower case x in a typeface.
AllignmentDirection in which the text flows. This can be either left, right, centered or justified.
River of JustificationWhen text is alligned in justified, spacing between words can be uneven, which creates gaps decreasing readability. Try to avoid.
Optical CorrectionEditing a font so that it appears more correct to the eye.
Small CapsUppercase letters reduced to the size of lower case letters so that they don’t pop out.
OrphanA word or very short line that appears through autocorrection at the end of a column. It looks really weird and unusual, so try to avoid.
WidowAn orphan that falls at the beginning of the following column. Again, try to avoid.
BaselineWhere both the cap-height and x-height start.

ARM
AS
CE
ND
ER
DE
SC
EN
DE
R
COUNTER
SERIF
STE
M
CA
P H
EIG
HT
BARB
BARB
SPINE

When you start with analysing a ‘typeface’, most people look at whether it is a sans-serif or a serif. This is proba-bly because these are the only things they know when it comes to typography. They are the comic sanse and papyrus users among us.
This book will help you to understand the more subtle differences in typefaces. These might not be so easy to recognize in a single sentence, but when zoomed in on the individual ‘glyphs’, one can see the differences quite clearly. This is why it’s so hard to recognize typefaces.
goes for Garamond, which seems to have the same differences with these glyphs. For Universe and Impact, you can see the difference in every glyph when zoomed in. Both seem like a ‘condensed bold’, both the same x-height, but Impact has a thicker stem than Univers.
When you look at the Didot and Bodoni typefaces, both ‘modern’ typefaces, you will find that there is not any-thing that distinguishes one from another. Although when looking at the individual glyphs, you will find that the Q and the W are very different from each other. The same
Every typeface has it’s category. It’s like every music has it’s genre and every animal or fruit has a family of which it originates. This will laregly tell how to use these typefaces and with what to combine.

But let’s not forget about the numbers. An alphabet doesn’t only consist of 26 letters, but also contains ‘symbols’ and ‘figures’. Figures are numeral typesets that, just as with letters, also have a variation in style. The variation in different styles is not as vast as with let-ters though. While there are countless different styles for letters, figures only have two: ‘Old Style Figures’ (Example A)
and ‘Lining Figures’ (Example B). The main difference between an Old Style figure and a Lining figure is that Old Style figures have descenders and ascenders. This is because most of the Old Style figures are based on old French typography, which used to have this type of figuring. Lining figures are all ascender height or cap heigh, based on the more modern typefaces.
For this subject, I have been doubting for a long time whether to put this subject in theory, communication or perception. Why I put it here is because of the reason why you need to know this. Once in a while, a typeface gets so overused that it starts to look ugly or just looks amaturistic. This is because a large percentage of the population has access to this typeface and see it as a
standard for certain graphic designs. As I joked around before, these are the comic sans and papyrus users. Even though the typeface isn’t that bad, the perception of the typeface has a negative connotation because it has been overused in too many wrong ways. If you have no idea what I’m talking about, look below for an example of a horrible and great use of comic sans.
Example A Example B
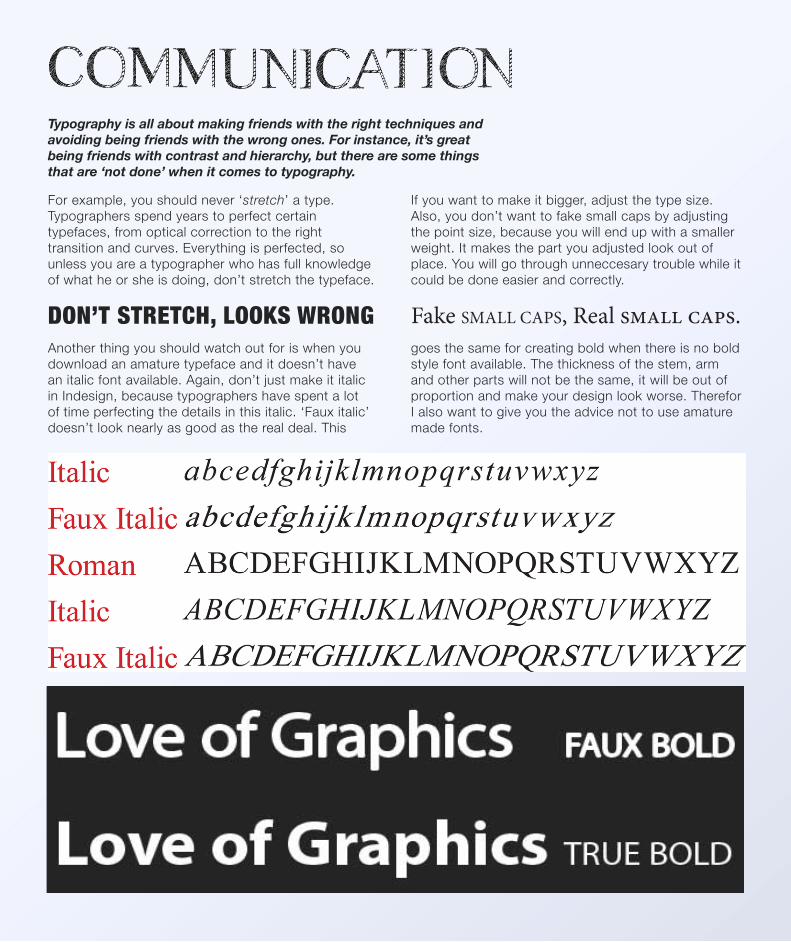
Typography is all about making friends with the right techniques and avoiding being friends with the wrong ones. For instance, it’s great being friends with contrast and hierarchy, but there are some things that are ‘not done’ when it comes to typography.
For example, you should never ‘stretch’ a type. Typographers spend years to perfect certain typefaces, from optical correction to the right transition and curves. Everything is perfected, so unless you are a typographer who has full knowledge of what he or she is doing, don’t stretch the typeface.
If you want to make it bigger, adjust the type size. Also, you don’t want to fake small caps by adjusting the point size, because you will end up with a smaller weight. It makes the part you adjusted look out of place. You will go through unneccesary trouble while it could be done easier and correctly.
DON’T STRETCH, LOOKS WRONG Fake SMALL CAPS, Real small caps.Another thing you should watch out for is when you download an amature typeface and it doesn’t have an italic font available. Again, don’t just make it italic in Indesign, because typographers have spent a lot of time perfecting the details in this italic. ‘Faux italic’ doesn’t look nearly as good as the real deal. This
goes the same for creating bold when there is no bold style font available. The thickness of the stem, arm and other parts will not be the same, it will be out of proportion and make your design look worse. Therefor I also want to give you the advice not to use amature made fonts.
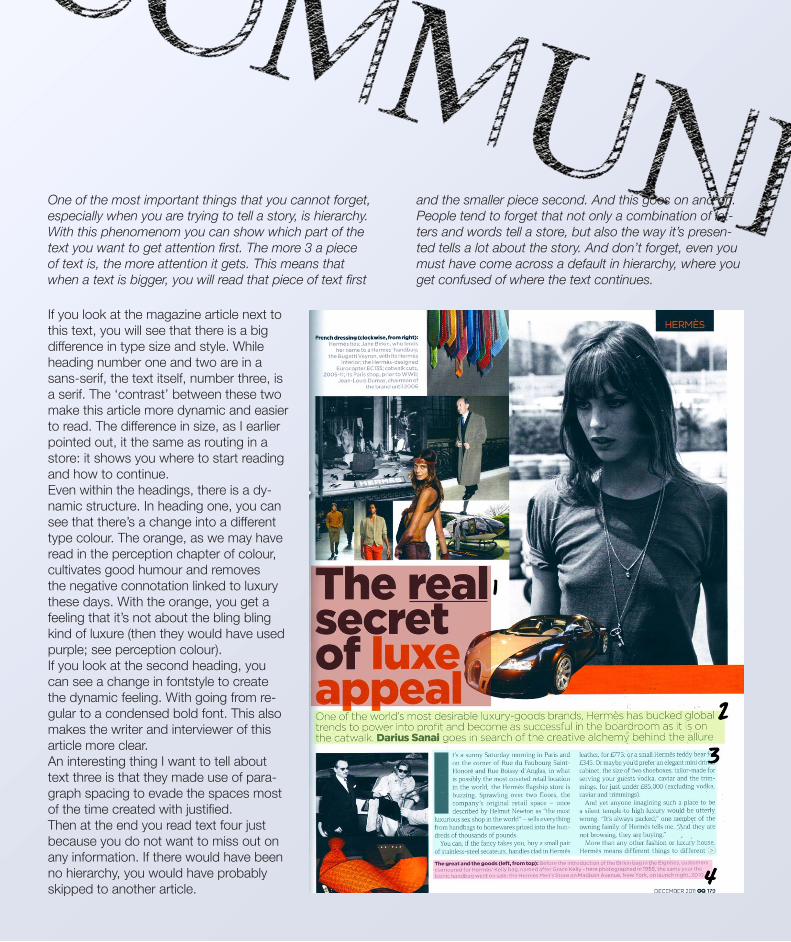
and the smaller piece second. And this goes on and on. People tend to forget that not only a combination of let-ters and words tell a store, but also the way it’s presen-ted tells a lot about the story. And don’t forget, even you must have come across a default in hierarchy, where you get confused of where the text continues.
One of the most important things that you cannot forget, especially when you are trying to tell a story, is hierarchy. With this phenomenom you can show which part of the text you want to get attention first. The more 3 a piece of text is, the more attention it gets. This means that when a text is bigger, you will read that piece of text first
If you look at the magazine article next to this text, you will see that there is a big difference in type size and style. While heading number one and two are in a sans-serif, the text itself, number three, is a serif. The ‘contrast’ between these two make this article more dynamic and easier to read. The difference in size, as I earlier pointed out, it the same as routing in a store: it shows you where to start reading and how to continue. Even within the headings, there is a dy-namic structure. In heading one, you can see that there’s a change into a different type colour. The orange, as we may have read in the perception chapter of colour, cultivates good humour and removes the negative connotation linked to luxury these days. With the orange, you get a feeling that it’s not about the bling bling kind of luxure (then they would have used purple; see perception colour).If you look at the second heading, you can see a change in fontstyle to create the dynamic feeling. With going from re-gular to a condensed bold font. This also makes the writer and interviewer of this article more clear. An interesting thing I want to tell about text three is that they made use of para-graph spacing to evade the spaces most of the time created with justified. Then at the end you read text four just because you do not want to miss out on any information. If there would have been no hierarchy, you would have probably skipped to another article.

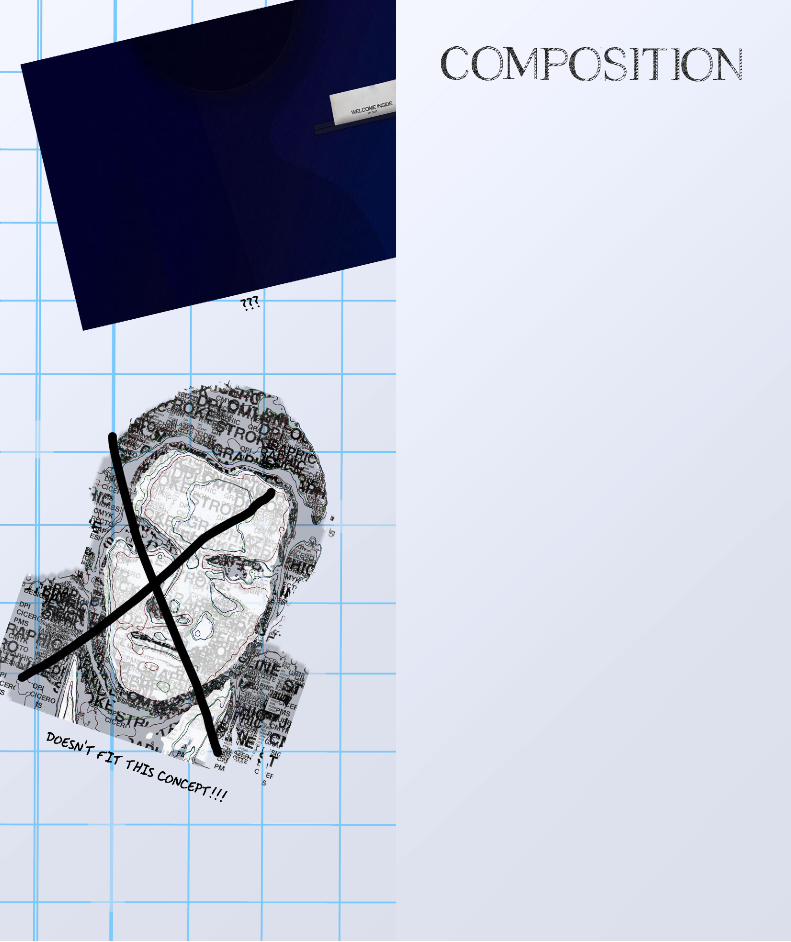

Sometimes, understanding the bigger picture is more important than getting the details perfect. Composition is the art of combining multiple elements and finding a balance between these objects, so that they form one whole.
The thing that makes composition one of the more complex parts of graphic design is the fact that the mind has such a big part in it. To understand composition and layout design, you must also understand how the mind works. Knowledge of psychology therefor is a must, especially the visual part of the brain. To test this, look at the image on the right of this text. The picture refers to ‘Rubins Vase’. Normally, your mind works with a hierarchy in which, when working with a black and white image, the black is the object and the white is the background. But with this image, your mind is confused on whether you should see a vase or two people. Your mind does the same with all other images. First, it seeks the ‘positive spaces’, this being shapes, images or words that the mind recognizes as an object. When the mind identified that element as a positive space, it will see the rest as background, also known as ‘negative space’. Knowing this, it is possible to play with the hierarchy in your mind, just like Rubin did.There are many tools and mathematical algorithms that make a layout work well and make it feel balanced. As a graphic designer, I have learned that tools aren’t always the right way to a great composition, but they are the easy way to an okay balanced composition. This is because most of these tools are so well known and vastly used that the composition doesn’t seem that interesting.I will however explain one of these tools, because most of the time this tool is used without knowing. One is the use of lines within a layout. The thing with lines is that they seperate, they distract and direct the flow of the layout. Lines force someone into a specific direction. They are however more a tool than an element in the layout, unless they form a part of your concept. If you find yourself in doubt about your layout and this is solved with a few lines, then there is still a problem with your layout. A few lines can’t make a layout stand out or solve any irregularities in a layout. Your solution should be a thoroughly thought through grid. If you have that, you won’t find yourself in need of lines. The flow will be directed by the hierarchy and everything will feel natural.
Another interesting phenomenom in composition is the ‘Fibonacci spiral’, a semi logaritmic spiral that resembles the golden spiral. Same as with the golden spiral, the Fibonacci spiral is a mathematical algorith. Every time when a square is cut out of the image, a rectangle remains that has one side with the same measurements as the cube. The spiral can be used for proportional and harmonious compotitions. Creating a grid in the shape of a Fibonacci spiral will be a guarentee for a calm and stable layout.

In the layout design above, a semi-symmetrical compo-sition is used. Even though the composition isn’t exactly in balance, it does give the impression that it is. This is because the overall shape looks almost alike on the right and left side. ‘Symmetry’ is a specific composition where all the elements are in balance. It’s like the left page is the mirror image of the right page. An example of symmetry is the Yin and Yang sign, which is the chinese symbol for balance and structure.The opposite composition of symmetry is ‘asymmetry’. This is when the right side of the page, also known as ‘recto’, and the left side of the page, also know as ‘verso’, do not have the same composition.
The purple lines you see in the image are the ‘grid’, a collection of ruler lines that act as guidelines for your composition. If a grid is used correctly, all text will stay inside these boundries. The distances between the end of the page and the grid is called the ‘margin’. The margin helps to define where a line of text or image begins and ends. They function as boundries.

As explained in the previous chapter, a certain graphic design can be made unique if you have an understanding of composition. With this composition, and the understanding of negative and positive spaces, you can play with peoples minds and with their expectations and, with this, catch people of guard with your design.
Louis Vuitton has always had an intrest in art. You can see this in their collaborations, their choice of buildings and architecture, their interior design. You can see this in every little detail of the brand. Why do I tell you this? Inspiration comes from every-where. If you look to the image on the left, you will see the roof of the Louis Vuitton store in Paris, seen from the ground. The repeating pattern that you see in the metal pipes hanging from the sealing, create a certain move-ment in the image. This is called ‘visual rhythm’. When you see a series of objects that have a similar shape,
your mind subconsciously starts to connect them and try to search for a pattern. While searching for this harmo-nious pattern, your mind sees the pattern as something dynamic and instantly tries to find the rhythm, since this is also a pattern. Your subconscious is a funny thing. We are acting on it all the time, but never seem to notice it. Such is with space. We always experience shape in relation to the space that it occupies and compare it to the shapes also standing in that room. For a lot of people, this

makes the background less important. But for example, when looking at the logo on the Fed-Ex bus below, you can see that the background between the E and the X form an arrow, which stands symbol for the rapid de-livery. This simple but ingenious form of optical illusion has everything to do with ‘Gestalt psychology’. Gestalt psychologt says that if the mind is insecure of which is the object and which is the background, we can both see black and white as the object and the background. In the Fed-Ex logo, both the Ex and the arrow are the object. With this little ‘easter egg’, Fed-Ex won fourty
awards so far for the best logo design. Rolling Stone Magazine has also ranked it as one of the 8 best logos of the past thirty-five years. It’s refreshning and funny. Now another interesting part of the Gestalt psychology is the law of addition. This law says that people have the urge to, whenever we see lines or shapes that aren’t closed, to fill in the gaps. This can be a handy tool during graphic design. The black and white image of the man down below, do you recognize the person in the abstracted picture?
If you don’t, then focus on the dots on his head for fourty seconds and then blink your eyes rappidly. What will apear is a man that changed the face of fashion, became an idol and an icon for his look. This graphic design was simple to make, but you just need to know the psychology behind it. It’s like that with a lot of things in graphic design, because a lot of our opinions about composition, layouts, colours and typography are already formed in our mind subcon-sciously. But enough about psychology, let’s move on to the next stage of composition.

This amazing graphic design finds it’s power in a smart concept, but an even smarter composition. In these posters by Stefan Asfati, the brands logo is created with the logo of the competition. Because of the recognizable composition, the friendly tagline combined with the tongue-in-cheek humour, you will never forget
this graphic design. The designer made sure that the brands that he chose were well known enough for this to work. These mash-ups of ubiquitous corporate logos beg one important question: just how different is both the product and identity of big commercial brands such as Pepsi and Coca Cola?
What is important when you want to create a good layout? How do I choose a composition or grid? A lot of the answers lie in the context, most important is your goal and your medium, since there are a lot of different rules in the world of graphic design.

There are countless of interesting designs I could show you, with different stories behind them. A good composition doesn’t need words. It only needs shapes to tell a story, to show its true feathers. Colours only emphasize it, words could too, but its basis lies in the composition and the story it tells.
This story does differ per medium. For example, there is a huge difference between magazines and books. If you look at a magazine layout and how it differs from page to page, you’ll find that the most important tools in magazine design are contrast and tempo. Not only because the subject of matter changes all the time,
as it goes from politics to fashion, from economy to cooking, they also have a lot of advertising in them. So to keep things interesting, there has to be a highly dynamic flow that compensates with the interruption caused by magazines.There’s also a difference in target group. Where the group of book readers doesn’t expect to be surprised, the avarage magazine reader wants to be stimulated and inspired by what he or she sees in the magazine. The flow has to be consistent, because one reader might start with the content page and read every article in the order that it was put in the magazine, while another reader might go directly to the page he wants to read. This is also why every page is as important, that every page has to have recognition in design and consistency in the flow of the magazine.Illustrated books however do ask for more variation, because the reader does expect some visuals. The difference with a magazine is that in an illustrated book, not every page has an illustration, so there are less things you have to think of. Still talking about magazines, but then about online magazines, different rules apply. The on-screen interaction between typeface and image is far more directer than on paper. One big difference, for example, is that the reader is reading from top to bottom, scrolling down instead of flipping a page. The layout will not change, so the flow should change in interaction such as headers that move and sounds that emphasize certain emotions. Another big difference is that you can lose your readers immediately. It’s so easy to get distracted and to loose track of where he was, so hierarchy is even more important in online design.Of course a large amount of rules still apply to online magazines, but with the different devices one can read a magazine from now, there are a lot of new challenges graphic designers will come across. There’s a big difference whether someone is reading his magazine on his Ipad, on her computer or even on their television.


So you have learned about colours, found out about typography, seen what you can do with the right composition and learned what the look and feel of a layout means. Still, there is one more thing that you need to learn before you can sit in front of your computer and start with your project: a good work ethic.
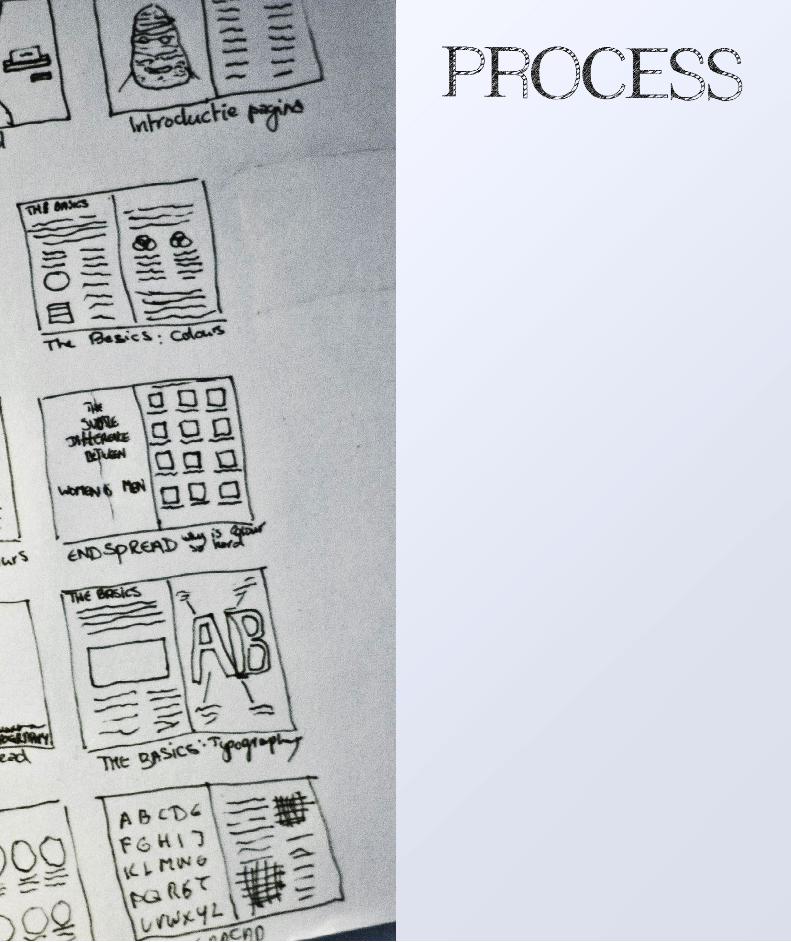
First of all, write everything down. In the proces of creating and designing the book, you might loose track of what the book is really about, so a blueprint or a guide could be handy. Before you go to work, think of what purpose your book has. Is it educational, is it inspiring or maybe amusing? If you decide what purpose your book has, write this down. The purpose of the book influinces the design a lot, both in colour, typography and composition. If you want your book to be inspiring, you would be best of creating a more experimental composition than when the purpose of the book is educational.
After finding out the purpose of your book, you should start with thinking of a concept or a certain blueprint. This gives you a direction. Also write this down.
When starting your research, try to keep your sources broad. Don’t only search for inspiration, information and material in magazines or the internet, there is a lot of inspiration to be found in architecture, museums, movies and even in the smaller things in life. And don’t forget that your own experience is a form of information and inspiration too.
When you have collected a lot of typefaces, images, quotes and other things you might incorperate in your design, lay everything on your floor. Start shifting things, try to find connections and write those ideas down. Do these ideas fit the concept or purpose of the book? Does your material have the same look and feel or does everything feel incohesive?
After some brainstorms, repeating the whole process over and over again untill you can connect enough dots to start on the graphic design, start sketching a grid, maybe a few ideas for composition.
After having sketched the basic layout and order in which everything is going to be presented in your book, you can finally start your computer. Make three folders, naming them ‘Design’, ‘Text’ and ‘Images’. Be very strict in the naming of files in the folder images. Most efficient way would be to give the file you scanned or downloaded the name of its source. This makes it easier to retrieve when making the source list. Every text that you write, make sure this text is also copied into a word document. This way, when something happens with the original file, you don’t loose all your writings.
This is the moment that you are fully prepared, have everything written down, the blueprint of your book ready and most of the imagery and ideas ready to be imported.
When you start in Indesign, first create a grid. You can also download these, but like fonts, it’s hard to find an amature grid that works for your concept. When creating an own grid, go to ‘Layout’ in the menu and select ‘Create Guides’. A screen will pop up, asking how many ‘columns’ and ‘rows’ you want for your grid. Columns go in horizontal direction, rows go in vertical direction. You could also change the ‘gutter’, which is the distance between every column and row, but the standard size of 5 mm is sufficient enough and I recommend not to change this.
This is where you finally begin. After having collected all your information, worked out the concept and created a basic grid, you are now ready to start!
A piece of advice: while working on a project in Indesign, save your file every half hour and create a new savefile every now and then. You wouldn’t be the first to have lost it all thanks to a mistake in saving, which leads to file corruption.
1.
2.
3.
4.
5.
6.
7.
8.
9.
Now that everything is ready to export to PDF, there are still some things to think about. Do you want to downsample your images or will you stay far away from any form of compression. Are all my ima-ges in RGB or in CMYK? Did I use the right black for my text and did I miss anything?
First of all, understand that the beautiful blue colour of the sea that you have on your computer screen is gonna look a little darker on paper. So if you have a specific colour in mind, make it a little brighter to compensate.
When you are preparing documents before going to your local copyshop, be aware of your bleed area and your trim line. Paper can shift in the printer and there might be a chance that the printed page on the back isn’t on the same position as the one on the front of your paper.
Make sure every one of your images has the right resolution. For normal books, a resolution of 300 dpi is neccessary. For billboards or other objects that you normally see from far away, a dpi of 72 will be sufficient.
I’ve seen this happen a million times, but having a content page refering to page numbers only works if you actually have page numbering in the book. Make sure these are all correct!
For your text, use plain black. If you will use rich or registration black or any other black with enriched CMYK colours and the page shifts while printing, you will see ugly colour shiftings. Imagine your text being black with a line of red and blue.
When placing Illustrator files into your Indesign, be sure to create an outline for your text. Vector files need this. Also, expand all your strokes and effects. That way there’s less of a chance that you’ll have a compatibility problem.
Always ask a lot of questions to the people who work at the copyshop where you will print your file. How do they want the file delivered? Can they print on that beautiful paper you found in that special store you always go to? Do they even have time to print out your order and is there any discount when you order more copies?
Don’t downsample your images. When exporting, make a custom export setting that doesn’t compress any of your files.
Be sure to upload the file you want to print out and send this to your mail, but also put this on a usb-stick. If the internet is out or the computer at the copyshop doesn’t recognise your usb, you have to go back.
The day before you want to print, try a test print on the paper you choose. Some kinds of paper don’t work with the inkt used in the copyshop.
1.
2.
3.
4.
5.
6.
7.
8.
9.
10.

bustler.netwunderbuzz.co.ukhighsnobiety.comaustinentrepreneurnetwork.org
thedanettes.typepad.com/s-frackelton0912-dp.blogspot.com/
GQ UK December 2011hanbeen.com

davidarchuletavn.comtokyofashiongirls.blogspot.compedestrian.tvbustler.net
community.livejournal.combehance.net/stefanasaftielectronicsupplyltd.comthedanettes.typepad.com/


