the better life index of the organisation for economic … · organisation for economic...
TRANSCRIPT

STUDIES
518
IIn this analysis I would like to introduce therecurrent or apparently exceptional events ineconomic phenomena related to well-being. I summarise the new interactive index entitledBetter Life of the online publication of theOrganisation for Economic Co-operation andDevelopment, which aims to measure the well-being and satisfaction of various countries.The index compares 34 countries based on 11factors.
According to the concept of the “pursuit ofhappiness” found in the text of the AmericanDeclaration of Independence, today, inter alia,the democratic world is preoccupied with “theRight ... [to] ... the pursuit of happiness”. In
addition to housing conditions and health, theindex refers to other things affecting quality oflife such as income, the labour market, com-munity cohesion, education, the state of theenvironment, the quality of governance, safety,work-life balance and life satisfaction.
Via numerous projects, studies (OECD,2001; OECD, 2008) and initiatives the OECDis at the forefront of the international review ofthis set of issues, and of the inception of newindicators. In 2004 it held the first WorldForum entitled Statistics, Knowledge and Policyin Palermo. In 2007 and 2009 in Istanbul andBusan, respectively, the OECD organised twomore forums, which led to the launch of theGlobal Project on Measuring the Progress ofSocieties. Thanks to these and other efforts,
Ádám Kerényi
The Better Life Index of theOrganisation for EconomicCo-operation and DevelopmentSUMMARY: Among economists the following questions arise: Will new measures of well-being1 be any more meaningful than tradi-
tional indicators? Is the new focus on quality of life a welcome recognition that governments can and should promote happiness?
In my study I introduce the OECD’s so-called Better Life Index, which was launched on 24 May 2011 and aims to measure well-
being and progress. The index allows citizens to compare well-being1 across 34 countries in 11 topics – housing, income, jobs,
community, education, environment, governance, health, life satisfaction, safety and work-life balance – giving their own weight to
each of the topics. In this document I tend to focus on and show charts relating to the data and ranks concerning Hungary. Over the
past 50 years, the OECD has developed a rich set of recommendations on policies that can best support economic growth. The task
for economists is to develop an equally rich menu of recommendations on policies to support societal progress: better policies for
better lives. The success of the OECD’s recent publication depends on its application and on its ability to give coherent shape to
incoherent reality and asymmetric public policy objectives. Surely the quality of life, as people experience it, has got to be a key
measure of progress and a central objective for any government.
KEYWORDS: well-being, indicators, OECD
JEL CODES: H11, I10, I20, I38
E-mail address: [email protected]

STUDIES
519
well-being and progress measurement are nowat the forefront of the agenda of national andinternational statistical and political pro-grammes. Well-being is important not only fordeveloping countries, but for every govern-ment in the world. The purpose of this work isnot simple measurement, but much rather toprovide a foundation and collect evidence forvarious policies. The more precise measure-ment of well-being may facilitate a betterunderstanding of societal progress. Better map-ping of the comparative performance of coun-tries measured across various areas may enablethe development of better strategies for over-coming differences. In addition to the OECD,Nobel Prize winning economists and theUnited Nations have released similar publica-tions involving indices (Stiglitz – Sen, 2008;UN, 2009; UN, 2010).
Obstacles to self-actualisation and happinesscan be divided into two groups: those stem-ming from the individual and those arisingfrom the individual’s surroundings. Put simply,Abraham Maslow’s fundamental theorem statesthat self-actualisation may be achieved if thelower order needs are already satisfied.According to László Garai (Garai 1998: 113),Maslow’s theory is often quoted uncritically,even though it has received much criticismsince its introduction. The five different levelsof needs have not been successfully identifiedby empirical studies, nor has the hypothesisconcerning their existence been theoreticallyproven. A maximum of two levels could be dis-tinguished: the level of biological and sociolog-ical needs. However, no relationship could befound to support the idea that the satisfactionof lower level needs presupposes the satisfac-tion of higher level ones.
In contrast to the famous, so-called Maslowpyramid, (Maslow, 1970), the OECD BetterLife Index juxtaposes factors affecting well-being against one another, rather then arrang-ing them hierarchically. This means that all 11
factors are similarly weighted in the compositeindex. Uniquely, each reader has the option ofindividually weighting, instantaneously chang-ing, or even excluding certain factors from theindex.
However, economic indicators to date havenot, or not accurately, specified the happinessof a country’s population. It has long been amatter of serious debate among economists(Jones and Klenow, 2010; Economist, 2011)whether it is at all reasonable or necessary tointroduce such an index.
A NEW ECONOMIC INDEX: A VISUALAPPROACH TO REPRESENTING WELL-BEING
Everyone knows what happiness is. We cananswer the question of whether we are happyor not. According to Mária Kopp happiness is:“being in harmony with myself and with oth-ers, having a vision for the future, having long-term goals and feeling that I have a place in theworld, in the country, and in the family. Weexamined who among people with a low levelof education, poor people, and old people arehealthier, happier, and live longer lives. Thesurvey covers the entire Hungarian population;hour-long interviews were conducted by healthvisitors and social workers at the addresses pro-vided, mainly in the countryside. The resultswere surprising: those people were healthier,lived longer and were happier who were able togive to others, who considered themselves reli-able, and who were not plagued by a sense ofguilt.” (Kopp, 2007)
Katalin Martinás (Martinás, 2011) seeks tounderstand why the number of unhappy peopleincreases parallel to the increase in the standardof living, and why the level of unhappiness doesnot decrease substantially along with theincrease in the standard of living. Since the1990s, a number of studies have dealt with therelationship between happiness and well-being.

STUDIES
520
They measure the subjective feeling of happi-ness is by means of questionnaire surveys.They generally arrive at the same old banal con-clusion: human relationships are more impor-tant than material goods. The most commonquestions:
• All things considered, how happy do youfeel?
• All things considered, how satisfied doyou feel?
Respondents are asked to select the valuebest reflecting their feeling on a discrete scale,e.g. on a scale of 0 to 10 or 1 to 7. The studiesshow that the responses correlate well, amongother factors, with the ratio of pleasant andunpleasant memories evoked by the individual,the frequency of smiling, and the characterisa-tion of the respondent by those living in hissurroundings, and even with the activity of thebrain’s “happiness centre”. So there is a subjec-tive feeling, subjective well-being, of whichthere exists an impression that can be capturedobjectively also in physiological terms.
According to Aristotle (1971), happiness inthis sense of the word does not represent acondition (which people may possess) or expe-rience, but activity. The fundamental purposeof human existence is the fullest possible exer-cise of human functions.
According to the father of utilitarianismJeremy Bentham (1781), the primary purposeof government is to bring about a higher levelof happiness for an ever increasing number ofpeople. Happiness was deemed to be measura-ble on the basis of pleasure and joy.Accordingly, a thing’s utility was presumed tobe equivalent to the happiness it caused, i.e. thejoy resulting from its acquisition (utilisation).It was from this that later preferences evolved.Bentham used this interpretation of utility notonly for consumer goods, but for every area ofhuman life, including the evaluation of politicaldecisions. According to Bentham, for example,what impact an act or policy had on a person’s
individual well-being can be defined by thequantity of joy that the policy induced in theindividual. The impact that a policy has on col-lective well-being can be calculated by subtract-ing from the total quantity of joy of the peopleaffected by the policy their total quantity ofpain. It was with this thought that JeremyBentham introduced utility. But it has sincebeen found that joy is not measurable.Happiness has many components; consequent-ly, is not possible to create a real situation inwhich only the quantity of goods and nothingelse changes that could affect the sense of joy.The train of thought is at best conducive toconfirming the relationship between joy andvalue by self-observation.
How should well-being be measured?Money is not everything. A person’s life isshaped by many more factors. For example,how comfortable is one’s housing situation?How clean and safe is one’s environment? Ishe/she able to take part in political and socialevents? Do public institutions perform theirduties and fulfil their functions? To whatextent is the individual able to avail of qualityhealth and education services? What is thevalue of services that households produce forthemselves, services such as caring for childrenand elderly family members?
In Hungarian society today it is expresslyinternal values that people consider important;for example they deem good social relationsmuch more important than being in a goodfinancial situation. The current crisis shockreached Hungarian society in a condition inwhich solidarity and the sense of responsibilityin people toward one another had dropped toan extremely low level. This fact is a very seri-ous health deteriorating factor as well as athreat to the economy (Kopp, 2008).
According to the OECD Better Life Indexthe achievement of well-being is best measuredagainst result indicators, as opposed to factorsresponsible for enhancing well-being, which

STUDIES
521
can be measured against input and output fac-tors. People’s well-being has both objective andsubjective aspects, which are important inunderstanding people’s well-being, whilerecognition by others must also be taken intoaccount.
In the examined area the OECD publicationdistinguishes between current material livingconditions and standard of living, and their sus-tainability over time.
Material living conditions (or “economicwelfare”) determine people’s opportunities forconsumption and the availability of resources.This is determined prominently by GDP, butGDP also includes activities that do not con-tribute to individual well-being (e.g. activitiesaimed at averting the negative consequences ofeconomic development). However, it does notexamine those off-market activities whichbroaden people’s possibilities for consumption.
Back in March of 1968, as part of a speech hegave at the University of Kansas, RobertKennedy put it like this: “Too much and for toolong, we seemed to have surrendered personalexcellence and community values in the mereaccumulation of material things.” Our GrossNational Product [...] counts air pollution andcigarette advertising, and ambulances to clear ourhighways of carnage. It counts special locks forour doors and the jails for the people who breakthem. [...] It counts napalm and counts nuclearwarheads and armored cars for the police to fightthe riots in our cities. [...] Yet the Gross NationalProduct does not allow for the health of our chil-dren, the quality of their education or the joy oftheir play. It does not include the beauty of ourpoetry or the strength of our marriages, the intel-ligence of our public debate or the integrity of ourpublic officials. [...] It measures everything inshort, except that which makes life worthwhile.”(Braun, 2011)
Quality of life, determined as the sum ofindividuals’ non-material factors affectingtheir opportunities and life chances, and
meaning different things in different culturesand contexts.
The sustainability of social, economic andnatural systems in which people live and workis critical on account of the durability of well-being. Sustainability depends on how currenthuman activities affect various (natural, eco-nomic, human and social) reserves. However,the indicators necessary to define thesereserves remain lacking in many areas.
The framework described emphasises theselection of indicators in every dimension ofwell-being. Indicators are selected against twoqualitative criteria, namely “conceptual sound”(e.g. the significance among the entire popula-tion of expressions measuring and monitoringwell-being with regard to the information ofpolicies), and highly reliable underlying data(e.g. practical substantiation based on well-established standards and codes). The indica-tors were established following extensive con-sultations with the leading experts of nationalstatistical offices and the OECD.
In recent years, concerns have intensifiedthat macroeconomic data do not give a properindication of how ordinary people perceivetheir own lives. It is essential to address theseconcerns, not just because of the credibilityand accountability of public policies, but muchrather to facilitate the viability of our democra-cies. As Péter Nádas writes, “it is clear thateveryone always wants to live better. The ques-tion of whether this is possible cannot be decidedon the basis of demands for party politics or eco-nomic organisation, solely on the principle ofdemocratic election. These are geological, ecolog-ical, and not least anthropological questions,which could only be made the subject of demo-cratic debates and decisions if at the same timeeveryone had the opportunity to form opinionsand decide according to their own liking on ques-tions of mathematics, chemistry and physics.”(Nádas, 2006)
Economics is the art of choosing the lesser

STUDIES
522
evil; the thinking of economists these days isfocused more on technical issues of economicorganisation and finance. That is despite along-standing ambition of economists todevelop a metric to complement the grossdomestic product, i.e. GDP. Various indicesmeasuring and describing social well-beingalready exist; e.g. the ISEW is an index of sus-tainable economic welfare, whereas the GPIalso takes green economic development intoaccount.
However, an omniscient aura has formedaround the objectivity of GDP, as a result ofwhich any change to it is considered taboo. Asa result, the GDP myth has yet to be debunked.Scientifically, it is exact definition that matters.The variations of indicators aimed at defininghappiness can be proven time and time again.Therefore, if this relatively broad conceptual/emotional range is compared with thedescribed detail, the uncertainty of the descrip-tion – distortion – is revealed.
METHODOLOGY
The creation of the composite index referred toas the Better Life Index involved the followingsteps:
defining the dimensions affecting well-being to be measured,
specifying the indicators which bestreflect the selected dimensions,
determining the databases to assign to theindicators,
establishing norms,defining the measurement and aggrega-
tion of indicators,performing sensitivity analysis on the
reliability of the selected indicators,visually displaying the results obtained,
and weighting and comparing them as required.The fact that countries of differing cultures
attribute different levels of importance to indi-
vidual indicators affecting well-being posed amajor problem. The established frameworkplaces particular emphasis on data quality.Accordingly, consultation took place with thestatistical offices of member countries regard-ing the selected indicators. A forthcomingstudy from the OECD Statistics Division isgoing to present the methodology in detail.
The OECD gives users the unique ability toweight the individual dimensions themselves.The points awarded for each category are com-piled on the basis of statistical analysis.Hungary is 29th out of the 34 countries, fol-lowed by stragglers Portugal, Estonia, Chile,Mexico and Turkey (see Chart 1 and 2).According to the life satisfaction indexHungarians are the unhappiest.
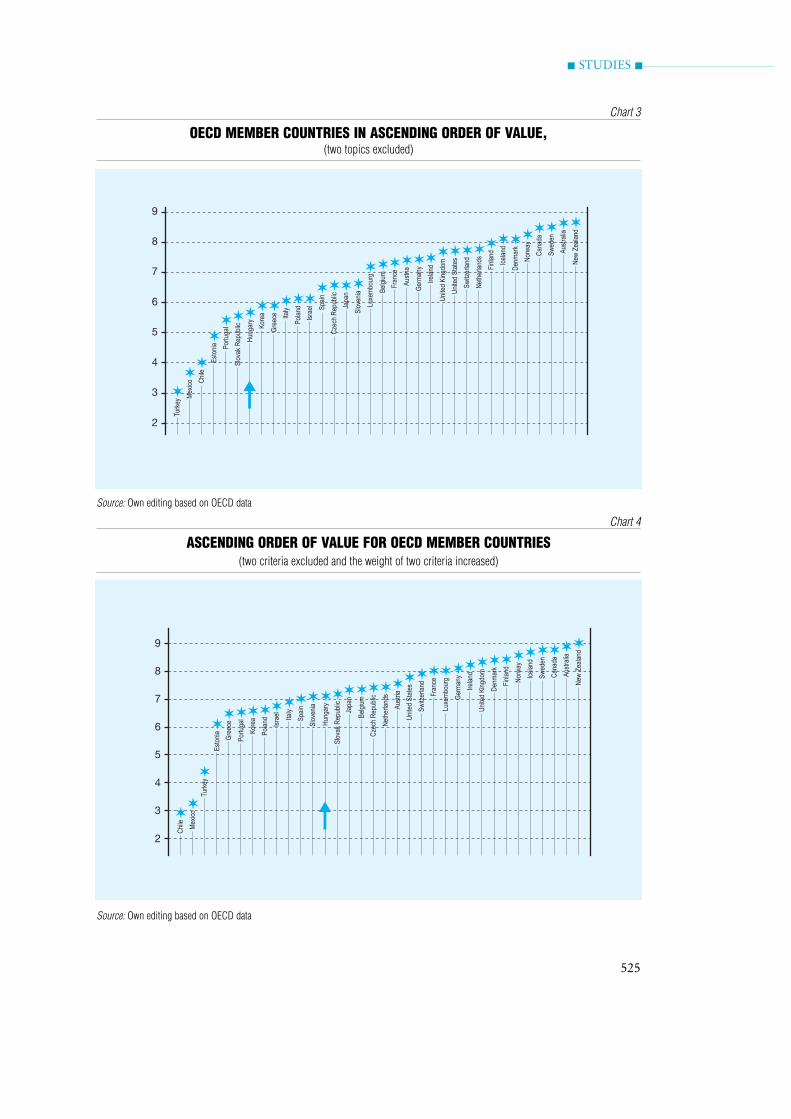
A sort of interactive tool, the new indicatorprovides an opportunity for people to comparecountries based on the criteria important totheir own lives. If, for example, safety and theenvironment are set as having the highest pos-sible weight and life satisfaction is disregarded,then Hungary shoots up to 22nd place (seeChart 3 and 4). The difference is visibly appre-ciable.
Henceforth, in the future member countrieswill also have the option of stating what theyconsider most important to measure. InFrance, for example, employment and the stateof healthcare are considered the most impor-tant. The organisation hopes that the new formof measurement will enable efforts to deter-mine what the best practices are in individualareas, and that statistical data collections of thisnature will help politicians gain a better under-standing of which areas are struggling.
TOPICS AND THE BEST AND WORSTCOUNTRIES
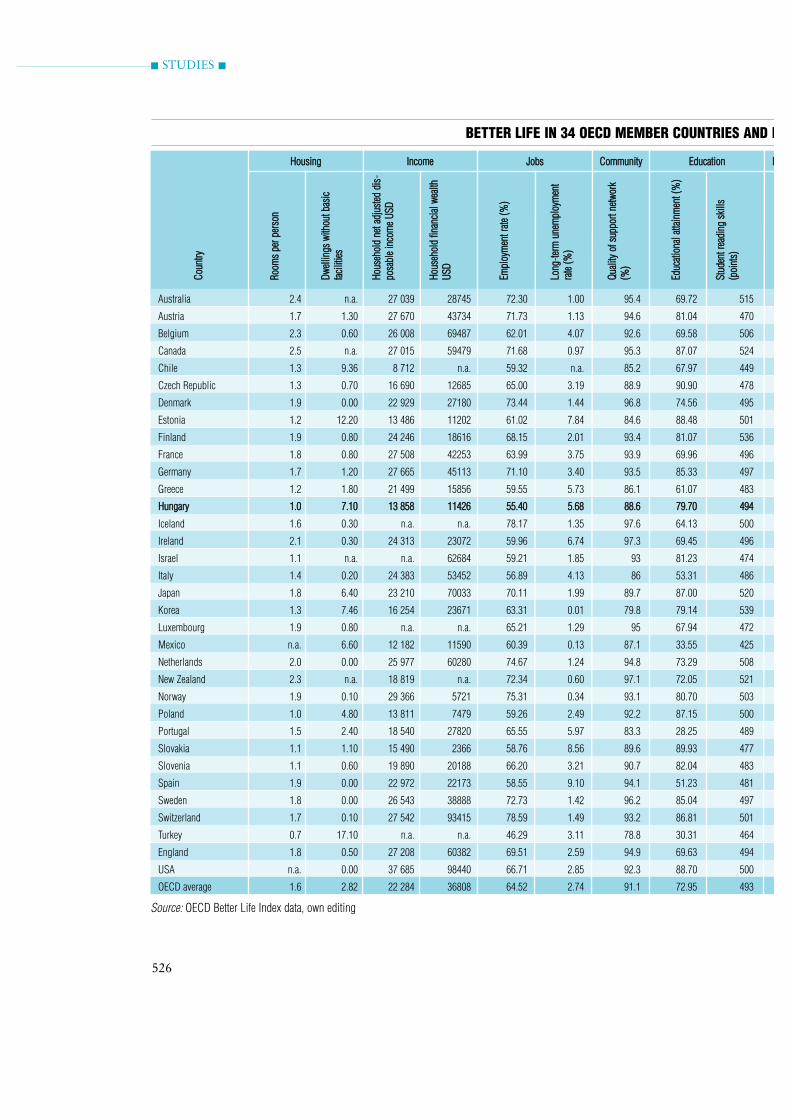
Table 1 shows the values of the indicators foreach country in detail. The ranking is illustrat-

STUDIES
523
ed in excerpts across four bar graphs (Chart 5,6, 7 and 8), with Hungary represented using adifferent colour. The 20 indicators of the 11topics are shown in excerpt form.
Topics
HousingHousing ranks at the top of the hierarchy ofmaterial needs. Housing costs (overheadexpenses) represent the lion’s share of house-hold expenditure. If someone does not live inhygienic conditions, it can have a major impacton their life, e.g. it is much easier for them toget sick.
Rooms per person2 The values assigned to indi-vidual countries are shown in brackets.
Top ranking countries in the topic:Canada (2.5), Australia (2.4), NewZealand (2.3) and Belgium (2.3)Lowest ranking countries in the topic:Hungary (1), Poland (1), Slovakia (1.1),Slovenia (1.1) and Turkey (0.7).
Dwellings without basic facilities3 The valuesassigned to individual countries are shown inbrackets.
Top ranking countries in the topic:Denmark, the Netherlands, Spain andSweden (all with a value of 0).Lowest ranking countries in the topic:Korea (7.46), Chile (9.36), Estonia (12.20)and Turkey (17.10).
IncomeIncome provides a source of funding for recur-ring and ad hoc expenditures. The higher theincome the individual has at their disposal, thegreater the extent to which they can indulgethe limits of their personal well-being. In theevent the individual is able to put money aside,the coverage for unforeseen costs is increased,
allowing them to support their environmentand enhance their social status. Between gener-ations the finding may be said to apply that asa general rule young people and women haveless income at their disposal (OECD, 2007;OECD, 2010a).
Household net adjusted disposable income4 Thevalues assigned to individual countries areshown in brackets.
Top ranking countries in the topic:United States (USD 37,685), Norway(USD 29,366), Austria (USD 27,670) andGermany (USD 27,665).Lowest ranking countries in the topic:Poland (USD 13,811), Estonia (USD13,486), Mexico (USD 12,182) and Chile(USD 8,712).
Household financial wealth5 The valuesassigned to individual countries are shown inbrackets.
Household financial wealth amounts to theaverage total value of a household’s financialassets minus their liabilities.
Top ranking countries in the topic:United States (USD 98,440), Switzerland(USD 93,415), Japan (USD 70,033) andBelgium (USD 69,487).Lowest ranking countries in the topic:Estonia (USD 11,202), Poland (USD 7,479),Norway (sic) (USD 5,721) and Slovakia(USD 2,366).
It is important to highlight that (OECD,2011) in Hungary no significant shift has takenplace in the last twenty years in terms of differ-ences in income.
JobsHaving a job which provides an adequatesource of income contributes to one’s well-being. A workplace provides an environmentwhich can offer sufficient motivation, theopportunity to develop one’s skills, build a

STUDIES
524
Chart 1
VALUES FOR OECD MEMBER COUNTRIES IN ALPHABETICAL ORDER
Source: Own editing based on OECD data
Chart 2
ASCENDING ORDER OF VALUE FOR OECD MEMBER COUNTRIES
Source: Own editing based on OECD data
STUDIES
525
Chart 3
OECD MEMBER COUNTRIES IN ASCENDING ORDER OF VALUE, (two topics excluded)
Source: Own editing based on OECD data
Chart 4
ASCENDING ORDER OF VALUE FOR OECD MEMBER COUNTRIES(two criteria excluded and the weight of two criteria increased)
Source: Own editing based on OECD data
STUDIES
526
Australia 2.4 n.a. 27 039 28745 72.30 1.00 95.4 69.72 515
Austria 1.7 1.30 27 670 43734 71.73 1.13 94.6 81.04 470
Belgium 2.3 0.60 26 008 69487 62.01 4.07 92.6 69.58 506
Canada 2.5 n.a. 27 015 59479 71.68 0.97 95.3 87.07 524
Chile 1.3 9.36 8 712 n.a. 59.32 n.a. 85.2 67.97 449
Czech Republic 1.3 0.70 16 690 12685 65.00 3.19 88.9 90.90 478
Denmark 1.9 0.00 22 929 27180 73.44 1.44 96.8 74.56 495
Estonia 1.2 12.20 13 486 11202 61.02 7.84 84.6 88.48 501
Finland 1.9 0.80 24 246 18616 68.15 2.01 93.4 81.07 536
France 1.8 0.80 27 508 42253 63.99 3.75 93.9 69.96 496
Germany 1.7 1.20 27 665 45113 71.10 3.40 93.5 85.33 497
Greece 1.2 1.80 21 499 15856 59.55 5.73 86.1 61.07 483
Hungary 1.0 7.10 13 858 11426 55.40 5.68 88.6 79.70 494
Iceland 1.6 0.30 n.a. n.a. 78.17 1.35 97.6 64.13 500
Ireland 2.1 0.30 24 313 23072 59.96 6.74 97.3 69.45 496
Israel 1.1 n.a. n.a. 62684 59.21 1.85 93 81.23 474
Italy 1.4 0.20 24 383 53452 56.89 4.13 86 53.31 486
Japan 1.8 6.40 23 210 70033 70.11 1.99 89.7 87.00 520
Korea 1.3 7.46 16 254 23671 63.31 0.01 79.8 79.14 539
Luxembourg 1.9 0.80 n.a. n.a. 65.21 1.29 95 67.94 472
Mexico n.a. 6.60 12 182 11590 60.39 0.13 87.1 33.55 425
Netherlands 2.0 0.00 25 977 60280 74.67 1.24 94.8 73.29 508
New Zealand 2.3 n.a. 18 819 n.a. 72.34 0.60 97.1 72.05 521
Norway 1.9 0.10 29 366 5721 75.31 0.34 93.1 80.70 503
Poland 1.0 4.80 13 811 7479 59.26 2.49 92.2 87.15 500
Portugal 1.5 2.40 18 540 27820 65.55 5.97 83.3 28.25 489
Slovakia 1.1 1.10 15 490 2366 58.76 8.56 89.6 89.93 477
Slovenia 1.1 0.60 19 890 20188 66.20 3.21 90.7 82.04 483
Spain 1.9 0.00 22 972 22173 58.55 9.10 94.1 51.23 481
Sweden 1.8 0.00 26 543 38888 72.73 1.42 96.2 85.04 497
Switzerland 1.7 0.10 27 542 93415 78.59 1.49 93.2 86.81 501
Turkey 0.7 17.10 n.a. n.a. 46.29 3.11 78.8 30.31 464
England 1.8 0.50 27 208 60382 69.51 2.59 94.9 69.63 494
USA n.a. 0.00 37 685 98440 66.71 2.85 92.3 88.70 500
OECD average 1.6 2.82 22 284 36808 64.52 2.74 91.1 72.95 493
Source: OECD Better Life Index data, own editing
Stud
ent r
eadi
ng s
kills
(poi
nts)
Educ
atio
nal a
ttain
men
t (%
)
Qual
ity o
f sup
port
netw
ork
(%)
Long
-tterm
une
mpl
oym
ent
rate
(%)
Empl
oym
ent r
ate
(%)
Hous
ehol
d fin
anci
al w
ealth
USD
Hous
ehol
d ne
t adj
uste
d di
s-po
sabl
e in
com
e US
D
Dwel
lings
with
out b
asic
faci
litie
s
Room
s pe
r per
son
Coun
try
EEducationCommunityJobsIncomeHousing
BETTER LIFE IN 34 OECD MEMBER COUNTRIES AND I

STUDIES
527
14.28 10.50 95 81.5 84.9 7.5 1.2 2.1 0.14 70.50 15.12
29.03 7.13 82 80.5 69.6 7.3 0.5 3 0.10 71.05 15.23
21.27 4.50 91 79.8 76.7 6.9 1.8 7.3 0.04 62.74 16.61
15.00 10.50 60 80.7 88.1 7.7 1.7 1.4 0.04 71.10 14.97
61.55 2.00 88 77.8 56.2 6.6 8.1 9.5 0.08 n.a. n.a.
18.50 6.75 64 77.3 68.2 6.2 2 3.5 0.09 70.51 n.a.
16.26 7.00 87 78.8 74.3 7.8 1.4 3.9 0.02 77.50 16.31
12.62 3.25 62 73.9 56.3 5.1 6.3 6.2 0.03 73.89 14.94
14.87 9.00 74 79.9 67.7 7.4 2.5 2.4 0.04 76.04 15.95
12.94 3.50 84 81 72.4 6.8 1.4 4.9 0.09 65.97 16.06
16.21 4.50 78 80.2 64.7 6.7 0.8 3.6 0.05 65.93 16.14
32.00 6.50 74 80 76.4 5.8 1.1 3.8 0.06 51.72 n.a.
15.60 7.88 64 73.8 55.2 4.7 1.5 3.8 0.03 58.89 15.39
14.47 5.13 84 81.3 80.6 6.9 0 2.7 n.a. 86.50 n.a.
12.54 9.00 67 79.9 84.4 7.3 2 2.7 0.03 55.18 15.24
27.57 2.50 65 81.1 79.7 7.4 2.4 3.1 0.23 n.a. n.a.
23.33 5.00 81 81.5 63.4 6.4 1.2 4.7 0.05 48.91 15.66
27.14 7.25 67 82.7 32.7 6.1 0.5 1.6 n.a. 65.90 14.33
30.76 10.38 63 79.9 43.7 6.1 2.3 2.1 n.a. n.a. 15.46
12.63 6.00 57 80.6 74 7.1 1.5 4.3 0.04 57.23 n.a.
32.69 9.00 59 75.1 65.5 6.8 11.6 14.8 0.24 n.a. 13.56
30.76 6.13 80 80.2 80.6 7.5 1 5 0.01 74.59 16.06
11.93 10.25 79 80.4 89.7 7.2 1.3 2.3 0.13 75.30 15.13
15.85 8.13 77 80.6 80 7.6 0.6 3.3 0.03 n.a. 16.05
35.07 10.75 54 75.6 57.7 5.8 1.2 2.2 0.08 59.46 15.35
21.00 6.50 64 79.3 48.6 4.9 1.2 6.2 0.05 67.37 n.a.
13.14 6.63 55 74.8 31.1 6.1 1.7 3.5 0.06 64.74 n.a.
29.03 10.25 63 78.8 58.8 6.1 0.5 3.9 0.07 74.39 15.29
27.56 7.25 75 81.2 69.8 6.2 0.9 4.2 0.07 56.66 15.71
10.52 10.88 82 81.2 79.1 7.5 0.9 5.2 0.01 76.10 15.48
22.36 8.38 48 82.2 80.95 7.5 0.7 4.2 0.06 78.60 n.a.
37.06 5.50 84 73.6 66.8 5.5 2.9 6 0.45 24.17 15.32
12.67 11.50 61 79.7 76 7 2.6 1.9 0.12 67.27 15.60
19.40 8.25 90 77.9 88 7.2 5.2 1.6 0.11 73.20 15.13
21.99 7.28 72 79.2 69 6.7 2.1 4.1 0.08 66.20 15.46
Tim
e de
vote
d to
leis
ure
and
pers
onal
car
e (h
ours
)
Empl
oym
ent o
f wom
en w
ithch
ildre
n (%
)
Empl
oyee
s wo
rkin
g m
ore
than
50
hour
s (%
)
Assa
ult r
ate
Hom
icid
e ra
te
Life
Sat
isfa
ctio
n
Self-
rrepo
rted
heal
th
Life
exp
ecta
ncy
(yea
rs)
Vote
r tur
nout
(%)
Cons
ulta
tion
on ru
le-mm
ak-
ing
Air p
ollu
tion
(PM
10 c
once
n tra
tion)
Work-LLife BalanceSafetyHealthGovermanceEnviroment
Table 1
IN HUNGARY (VALUES ASSIGNED TO EACH COUNTRY)

STUDIES
528
Chart 5
ROOMS PER PERSON
Source: Own editing based on OECD data
Chart 6
HOUSEHOLD NET ADJUSTED DISPOSABLE INCOME
Source: Own editing based on OECD data

STUDIES
529
Chart 7
EMPLOYMENT RATE
Source: Own editing based on OECD data
Chart 8
STUDENT READING SKILLS
Source: Own editing based on OECD data

STUDIES
530
career and exercise one’s profession. In gener-al, societies with higher levels of employmenttend to be wealthier and politically more stable.Losing one’s job is one of the most destructivepossible life experiences for an individual. Thelonger it takes to reintegrate into the work-force, the greater the psychological damage theindividual can suffer. In general, findingemployment is harder for those with a lowerlevel of education. (OECD, 2010b).
Employment rate6 (percentage of people, aged 15to 64, currently in a paid job) The valuesassigned to individual countries are shown inbrackets.
Top ranking countries in the topic:Switzerland (78.59%), Iceland (78.17%),Netherlands (74.67%) and Norway(75.31%).Lowest ranking countries in the topic:Spain (58.55%), Italy (56.89%), Hungary(55.40%) and Turkey (46.29%).
Long-term unemployment rate7 (percentage ofpeople, aged 15 to 64, who are not working buthave been actively seeking a job for over a year)The values assigned to individual countries areshown in brackets.
Top ranking countries in the topic:Korea (0.01%), Mexico (0.13%) (sic),Norway (0.34%) and New Zealand(0.60%).Lowest ranking countries in the topic:Ireland (6.74%), Estonia (7.84%),Slovakia (8.56%) and Spain (9.1%).
CommunityThe frequency of community contact is a cru-cial determinant of human well-being. Beingtogether with colleagues, loved ones andacquaintances is a source of pleasure for indi-viduals. People feel better if they share experi-ences with others. Furthermore, a social net-work can provide emotional support, which
can be utilised in other areas of life as well.Community is an important confidence-build-ing unit (OECD, 2001; OECD, 2010g).
Quality of support network8 (percentage of peo-ple who have friends or relatives to rely on in caseof need, data based on self-declaration) The val-ues assigned to individual countries are shownin brackets.
Top ranking countries in the topic:Iceland (97.6%), Ireland (97.3%), NewZealand (97.1%) and Denmark (96.8%).Lowest ranking countries in the topic:Estonia (84.6%), Portugal (83.3%), Korea(79.8%) and Turkey (78.8%).
EducationEducation is a fundamental need and an enor-mous opportunity for the individual. It has amajor impact on personal well-being. Thosewith higher qualifications have a better chanceof landing a position which enables them toearn more. One’s social environment is deter-mined partly by contact with former classmates.It is important to note that where people havehigher qualifications, there is a lower incidenceof crime (OECD, 2010e; OECD, 2010f).
Educational attainment9 (percentage of people,aged 25 to 64, having at least an upper-secondary(high school) degree) The values assigned toindividual countries are shown in brackets.
Top ranking countries in the topic:Czech Republic (90.90%), Slovakia(89.93%), United States (88.70%) andEstonia (88.48%).Lowest ranking countries in the topic:Spain (51.23%), Mexico (33.55%), Turkey(30.31%) and Portugal (28.25%).
Student reading skills10 (average reading per-formance of students aged 15, according to PISA)The values assigned to individual countries areshown in brackets.

STUDIES
531
Top ranking countries in the topic:Korea (539 points), Finland (536 points),Canada (524 points) and New Zealand(521 points).Lowest ranking countries in the topic:Austria (470 points), Turkey (464 points),Chile (449 points) and Turkey (425 points).
EnvironmentAn individual’s environment has a decisiveinfluence on their well-being. Nowadays, itmay impact on health as well with increasingfrequency.
Air pollution11 (average concentration of partic-ulate matter (PM10) concentration in cities withpopulations of at least 100,000) The valuesassigned to individual countries are shown inbrackets.
Top ranking countries in the topic:Sweden (10.52), New Zealand (11.93),Ireland (12.54) and Estonia (12.62).Lowest ranking countries in the topic:Mexico (32.69), Poland (35.07), Turkey(37.06) and Chile (61.55).
GovernancePolitics, which in many ways has a decisiveimpact on community life, is capable of influ-encing the individual’s life, including, for exam-ple, in the field of public services. Having a sayin politics is not only a way of exercising a fun-damental right, but can have a crucial role inenhancing the performance of public decisionmakers. If they do a poor job, there is a chancethat at the next election others will take theirplace (OECD, 2009).
Voter turnout12 (percentage of all citizens eligibleto vote who availed of their right to do so) Thevalues assigned to individual countries areshown in brackets.
Top ranking countries in the topic:Australia (95%), Belgium (91%), United
States (90%) and Chile (88%). Lowest ranking countries in the topic:Luxembourg (57%), Slovakia (55%),Poland (54%) and Switzerland (sic)(48%).
Consultation on rule-making13 (composite indexof the formal consultation process) The valuesassigned to individual countries are shown inbrackets.
Top ranking countries in the topic:United Kingdom (11.50), Sweden (10.88),Poland (10.75), Australia and Canada(10.50). Lowest ranking countries in the topic:France (3.50), Estonia (3.25), Israel (2.50)and Chile (2.00).
HealthHealth is one of the most valuable aspectsdetermining people’s lives. Surveys of numer-ous countries suggest that the factor whichmost affects living conditions, outside ofemployment, is health. People’s health is initself important; however, it has a decisiveimpact on activities in other areas of life as well.For example, it is difficult, if not impossible,for sick people to go to school or work(OECD, 2010c; OECD, 2010d).
Life expectancy14 The values assigned to indi-vidual countries are shown in brackets.
Life expectancy at birth is a standard indica-tor based on statistical mortality rates. Lifeexpectancy can apply not only to the momentof birth, but to any age.
Top ranking countries in the topic:Japan (82.7 years), Switzerland (82.2years), Australia and Italy (81.5 years).Lowest ranking countries in the topic:Slovakia (74.8 years), Estonia (73.9 years),Hungary (73.8 years) and Turkey 73.6(years).

STUDIES
532
Self-reported health15 The values assigned toindividual countries are shown in brackets.
Top ranking countries in the topic:New Zealand (89.7), Canada (88.1)United States (88) and Australia (84.9).Lowest ranking countries in the topic:Portugal (48.6), Korea (43.7), Japan (sic)(32.7) and Slovakia (31.1).
Life Satisfaction16
According to the psychologist (Kahneman –Krueger, 2006; Kahneman et. al., 1999), NobelPrize in economics in hand, the best indicatorin this topic may be subjective self-assessment.This self-reflective assessment may relate tohow things are going for the individual in life ingeneral.
Top ranking countries in the topic:Denmark (7.8), Canada (7.7), Norway(7.6), Australia, the Netherlands, Swedenand Switzerland (7.5).Lowest ranking countries in the topic:Turkey (5.5), Estonia (5.1), Portugal (4.9)and Hungary (4.7).
SafetyPersonal security is a core element for thewell-being of individuals. Crime frequencycan seriously destroy a community’s sense ofsecurity and endanger the property of a com-munity.
Homicide rate17 (average number of reportedhomicides per 100,000 people) The valuesassigned to individual countries are shown inbrackets.
Top ranking countries in the topic:Iceland (0), Japan, Slovenia and Austria (0.5).Lowest ranking countries in the topic:United States (5.2), Estonia (6.3), Chile(8.1) and Mexico (11.6).
Assault rate18 (percentage of people who reporthaving been assaulted in the previous year) The
values assigned to individual countries areshown in brackets.
Top ranking countries in the topic:Canada (1.4), the United States and Japan(1.6) and the United Kingdom (1.9).Lowest ranking countries in the topic:Portugal and Estonia (6.2), Belgium (7.3),Chile (9.5) and Mexico (14.8).
Work-Life BalanceStriking the right balance between workresponsibilities and personal life is central tohuman life. Too little work prevents the indi-vidual from earning sufficient income to sus-tain their quality of life. Too much work can bedetrimental to the individual’s well-being.Among other things, it can lead to sickness andcreate a vacuum in the individual’s social rela-tions. It is important to note that men workmore in the workplace, whereas for women it isthe household which can generate an abun-dance of tasks (OECD, 2011a).
Employees working very long hours19 (percentageof employees working more than 50 hours a weekon average) The values assigned to individualcountries are shown in brackets.
The two groups representing the twoextremes in this topic:Australia (0.14%), Israel (0.23%), Mexico(0.24%) and Turkey (0.45%).Sweden and the Netherlands (0.01%),Denmark (0.02%) and Estonia (0.03%).
Employment rate of women with children20 (per-centage of mothers with school-age children whohave a paid job) The values assigned to individ-ual countries are shown in brackets.
Top ranking countries in the topic:Sweden (76.10%), Denmark (77.50%),Switzerland (78.60%) and Iceland (86.50%).Lowest ranking countries in the topic:Ireland (55.18%), Greece (51.72%), Italy(48.91%) and Turkey (24.17%).

STUDIES
533
Time devoted to leisure and personal care21
(average number of minutes per day spent onleisure and personal care) The values assigned toindividual countries are shown in brackets.
The two groups representing the twoextremes in this topic:The Netherlands (16.06), Germany (16.14),Denmark (16.31) and Belgium (16.61).Canada (14.97), Estonia (14.94), Japan(14.33) and Mexico (13.56).
The housing conditions are not very good;whereas in OECD countries there are on aver-age 1.6 rooms per person, the figure forHungary is 1. By contrast, in Hungary 95% ofresidential property is inhabited by owners, asopposed to the OECD average of 23%.Unfortunately, employment is the biggest prob-lem in Hungary. 55.4% of the active populationis employed. In addition, among the 34 OECDcountries Turkey is the only country with ashorter life expectancy than Hungary. The figurefor Hungary is 73.8 years, 5.2 years less than theOECD average. Only 55 percent of Hungarianrespondents reported to be healthy, much worsethan the average of 69 percent. Unfortunately,Hungary is a straggler as far as life satisfaction isconcerned. In fact, it is very difficult to highlighta topic in which Hungary can set an example forother OECD member countries. With regard toair pollution and safety, Hungary belongs to theupper third (see Table 2).
SUMMARY
Scores of economic newspaper articles andpoliticians refer to GDP. In this study I tried todraw attention, by presenting a new indicator,to how this is really not a relevant indicator asfar as the specific situation of a macroeconomyis concerned. Especially from the standpoint ofthe comfort of the population, as the popula-tion is not or is only somewhat consoled by
profits rising (the components of GDP) whiletheir standard of living is not.
That GDP does not measure accurately isnot the only problem. The world has changedto such a great extent in technical terms that amuch lower level of GDP growth is necessaryin developed countries. Consequently, mitigat-ing the negative impacts of growth (e.g. air pol-lution) is also important to people.
Unfortunately, some time inconsistency canbe discerned in the data. I find it unfortunatethat rankings in certain topics are based onsource data of different periods. An example:the social network data in the case of Island arefor 2008, while with other countries they arefor 2010. This is problematic because Icelandranks first in this topic.
Another discrepancy appears to exist in rela-tion to the topic of health. Here Japan leads thelist based on life expectancy; however, on thebasis of their subjective health Japanese citi-zens rank next to last.
The indicators of the publication are oftenthe substitutes of such broad results for whichideal metrics are as yet lacking. It is certainthat in the future these will be refined by theeconomists of the OECD. Of course in thefuture the components of the indicators aregoing to change as better values are estab-lished, and as member countries agree on thoseindicators which do a better job of summaris-ing the conditions of the various dimensionsof human life.
It is hard for me to believe that a sensitiveperson can see the world in the same way afterlearning of the Better Life Index as before-hand. This index and its underlying contentbring about a perspective, which disintegratespreviously held opinions from within.Regardless of whether one likes it or not orconsiders it good or not, it makes visiblesomething which cannot be seen from anyother viewpoint, or which could not be seenpreviously in the same way.

STUDIES
534
Table 2
ABSOLUTE VALUES FOR HUNGARY, AS WELL AS HUNGARY'S RANKING RELATIVE TO THE OECD AVERAGE
HousingRooms per person Average number of rooms per person 1 1.6 30 61.3Dwellings without basic facilities Percentage of people in dwellings without basic
sanitation 7.1 2.8 26 251.7IncomeHousehold net adjusted disposable income USD (PPP adjusted) 13 857.60 22 283.70 26 62.2Household financial wealth USD (PPP adjusted) 11 425.90 36 807.90 25 31JobsEmployment rate Percentage of people, aged 15 to 64, currently in a paid job 55.4 64.5 33 85.9Long-term unemployment rate Percentage of people, aged 15 to 64, who are not working
but have been actively seeking a job for over a year 5.7 2.7 27 207.5CommunityQuality of support network Percentage of people who have friends or relatives to
rely on in case of need 88.6 91.1 26 97.3EducationEducational attainment Percentage of people, aged 25 to 64, having at least an
upper-secondary (high school) degree 79.7 73 16 109.3Student reading skills Average reading performance of students aged 15,
according to PISA 494.2 493.4 21 100.1EnvironmentAir pollution Average concentration of particulate matter (PM10)
concentration in cities with populations of at least 100,000 15.6 22 22 71GovernanceConsultation on rule-making Composite index of the formal consultation process 7.9 7.3 15 108Consultation on rule-making The percentage of all citizens eligible to vote who availed
of their right to do so 64.4 72.3 23 89.1HealthLife expectancy Average life expectancy 73.8 79.2 33 93.2Self-reported health Percentage of people who report their own health as
“good” or “excellent” 55.2 68.9 30 80.1Life SatisfactionLife Satisfaction Average value for life satisfaction on a scale of 10 4.7 6.7 34 70.1SafetyHomicide rate Average number of reported homicides per 100,000 people 1.5 2.1 19 70.3Assault rate Percentage of people who report having been assaulted
in the previous year 3.8 4.1 18 91.7Work-LLife BalanceEmployees working very Percentage of employees working more than 50 hours long hours a week on average 3 8 26 39.9Employment rate of women Percentage of mothers with school-age children who have with children a paid job 58.9 66.2 23 89Time devoted to leisure and Average number of minutes per day spent on leisure personal care and personal care 15.4 15.5 13 99.5
Source: OECD Better Life Index data, own editing
Hung
ary'
s ra
te c
om-
pare
d to
the
OECD
av
erag
e (%
)
Hung
ary'
s ra
nkin
g
OECD
ave
rage
Valu
e fo
r Hun
gary
UnitTopic
Indicator
STUDIES
535
1 The subjective term ‘well-being’ used in the eco-
nomics of happiness is broader than the term ‘wel-
fare’, i.e. the two are not synonymous.
2 Source: EU-SILC for European countries and
comparable national surveys for non-EU countries
2000 data for Turkey, 2001 data for Chile, and 2009
data for the majority of the countries.
3 Source: EU-SILC and the National Statistical
Offices (NSO) of Chile, Japan, Mexico, Turkey
and the United States. 2000 data for Turkey, 2001
data for Chile, and 2009 data for the majority of
the countries.
4 Source: OECD National Accounts at a Glance.
Data are for 2008; accordingly, the effects of the
crisis are not included.
5 Source: OECD National Accounts at a Glance.
Data are for 2009; accordingly, the effects of the
crisis are included.
6 Source: OECD Employment Outlook. In the case
of Israel, the data are for 2009. However, with the
rest of the countries they are for 2010; accordingly,
they include the effects of the crisis on employment.
7 Source: OECD Employment Outlook. Data are
for 2010; accordingly, they include the effects of
the crisis on employment.
8 Source: OECD Factbook and Gallup World Poll.
Data on Iceland are for 2008, which is problematic
because Iceland ranks first in this topic. Data on
the other countries are for 2010.
9 Source: OECD Education at a Glance. 2008 data.
10 Source: OECD PISA Results. 2009 data.
11 Source: OECD Environmental Outlook and
World Bank. 2008 data.
12 Source: International Institute for Democracy
and Electoral Assistance (IDEA).
13 Source: OECD Regulatory Management Systems’
Indicators Surveys 2005, 2008 and 2009, OECD,
Paris
14 Source: OECD Health Database; OECD Health
at a Glance: Europe; OECD Health at a Glance
Asia/Pacific
15 Source: OECD Health Database; OECD Health
at a Glance: Europe; OECD Health at a Glance
Asia/Pacific
16 Source: OECD Society at a Glance and OECD
Factbook. In the case of a few countries, data are
for 2008 and 2009. However, with the majority of
countries, data are for 2010; accordingly, they
include the effects of the crisis.
17 Source: UNODC; Eurostat; Crime and Criminal
Justice Statistics are the source for Austria,
Denmark, Ireland and the Netherlands.
The success of the OECD’s recent publica-tion lies rather in its consequences and appli-cability, in the extent to which it is capable ofgiving a coherent form to the incoherencestemming from reality and to asymmetricgoals.
Individual segments of happiness are mere
symptoms, behind which deeper reasons lie.In any case, it would be very important forthe citizens and prevailing leaders of devel-oped countries, including those of Hungary,to see exactly what causes are to be treated.This is what this initiative may contribute toachieving.
NOTES
STUDIES
536
18 Source: Gallup World Poll
19 Source: OECD Family Database and Doing
Better for Families
20 Source: OECD Family Database and Doing
Better for Families
21 Source: OECD Society at a Glance
Doing Better for Families http://www.oecd-ili-
brary.org/social-issues-migration-health/doing-bet-
ter-for-families_9789264098732-en
Economist 2011 http://www.economist.com/
debate/ overview/204&sa_campaign=debateseries/
debate79/alert/round/winner
Maslow-piramis http://hu.wikipedia.org/wiki/
Maslow-piramis
OECD Better Life index http://www.oecdbetter-
lifeindex.org/
OECD National Accounts at a Glance
http://www.oecd-ilibrary.org/economics/national-
accounts-at-a-glance-2010_9789264095885-en
OECD Employment Outlook: http://www.oecd-
ilibrary.org/employment/oecd-employment-outlook-
2010_empl_outlook-2010-en
OECD Fact book: http://www.oecd-ilibrary.
org/economics/oecd-factbook_18147364
OECD Education at a Glance: http://www.oecd-
ilibrary.org/education/education-at-a-glance-
2010_eag-2010-en
OECD PISA Results: http://www.oecdilib-
rary.org/education/pisa-2009-results-learning-
trends_9789264091580-en
OECD Environmental Outlook: http://www.
oecd-ilibrary.org/environment/oecd-environmental-
outlook-to-2030_9789264040519-en
OECD Regulatory Management Systems’
Indicators Surveys 2005, 2008 and 2009, OECD. Paris.
http://www.oecd.org/document/27/0,3746,en_2649_
34141_44587035_1_1_1_1,00.html
OECD Health at a Glance: Europe; OECD Health
at a Glance Asia/Pacific. http://www.oecd-
ilibrary.org/social-issues-migration-health/health-at-
a-glance-europe-2010_health_glance-2010-en
OECD Society at a Glance http://www.oecd-ili-
brary.org/social-issues-migration-health/society-at-a-
glance-2011_soc_glance-2011-en
WEB ADDRESS
LITERATURE
ARISTOTLE (1971): Nikomachosi etika (Nicomac-
hean Ethics). Magyar Helikon, Budapest
BENTHAM, J. (1781): Principles of Morals and
Legislation. http://www.econlib.org/library/Bentham/
bnthPMLCover.html.
BRAUN, R. (2011): A politika védelmében (In
Defense of Politics). In Élet és Irodalom, Year LV,
Issue 39, 30 September 2011.
GARAI, L. (1998): Emberi potenciál, mint tõke.
Bevezetés a gazdaságpszichológiába (The human

537
STUDIES
potential as capital: An approach by the economic psy-
chology). Aula Kiadó
JONES, CH. I. – KLENOW, P. J. (2010): Beyond
GDP? Welfare across Countries and Time. Working
Paper 16352; http://www.nber.org/papers/w16352
NATIO-NAL BUREAU OF ECONOMIC
RESEARCH
KAHNEMAN, D. – DIENER, E. – SCHWAARZ, N.
(eds.) (1999): Well-being. The Foundations of
Hedonic Psychology, Russel Sage Foundation, New
York
KAHNEMAN, D. – KRUEGER, A. B. (2006):
Developments in the Measurement of Subjective
Well-Being. Journal of Economic Perspectives 20 (1).
KOPP, M. – SKRABSKI, Á. (2009): Magyar lelkiál-
lapot az ezredforduló után (The Hungarian State of
Mind After the Turn of the Millennium). Távlatok,
Christmas 2009
KOPP, M. (2007): Hová repült a boldogság?
(Where Did Happiness Go?) Hetek. 2 November
2007, Year IX, Issue 44.
KOPP, M. (2008): Magyar lelkiállapot 2008
(Hungarian State of Mind 2008). Semmelweis Kiadó
MARTINÁS, K. (2011): Örömteli boldogság (Joyful
Happiness). Kézirat (Manuscript)
MASLOW, A. (1970): Motivation and personality.
Harper and Row. New York
NÁDAS, P. (2006): Boldogságról és boldogulásról
(Of Happiness and Prosperity). Élet és Irodalom. Year
L, Issue 46, 17 November 2006.
STIGLITZ, J. – SEN, A. (2009): Vers de nouveaux sys-
tèmes de mesures. Commission sur la mesure des per-
formances économique et du progrès social (Towards
new systems of measurement. Commission on the
measurement of economic performance and social
progress)
Economist (2011): See among the Web
addresses
OECD (2001): The Well-Being of Nations – the
role of human and social capital. OECD. Paris
OECD (2007): Understanding National Accounts.
OECD. Paris.
OECD (2008): Handbook on Constructing
Composite Indicators – Methodology and User guide.
OECD. Paris.
OECD (2009): Government at a Glance. OECD.
Paris.
OECD (2010a): National Accounts at a Glance.
OECD. Paris
OECD (2010b): Employment Outlook 2010,
Moving Beyond the Jobs Crisis. OECD Paris
OECD (2010c): Health Data – Statistic and
Indicators. OECD. Paris
OECD (2010d): Health Care Systems: Efficiency
and Policy Settings. OECD. Paris
OECD (2010e): PISA 2009 Results. OECD.
Paris
OECD (2010f): Education at a Glance. OECD.
Paris
OECD (2010g): Society at a Glance. 2009.
OECD. Paris
OECD (2011a): Doing Better for Families.
OECD. Paris

STUDIES
538
OECD (2011): Growing Income Inequality in
OECD Countries: What Drives it and How Can
Policy Tackle it?
OECD FORUM ON TACKLING INEQUALI-
TY Paris, 2 May 2011 http://www.oecd.org/dataoecd/
32/20/47723414.pdf www.oecd.org/els/ social/inequality
United Nations (2009): Measuring Sustainable
Development. New York
United Nations (2010): 2010 Human
Development Report – The Real Wealth of Nations:
Pathways to Human Development, United Nations.
New York