the biology of antibiotic resistance plasmidsetheses.bham.ac.uk/6083/1/saw15phd.pdf · the biology...
TRANSCRIPT

THE BIOLOGY OF ANTIBIOTIC
RESISTANCE PLASMIDS
by
HOWARD THIEN HUI SAW
A thesis submitted to the University of Birmingham for the degree of
DOCTOR OF PHILOSOPHY
School of Immunity and Infection
College of Medical and Dental Sciences
University of Birmingham
April 2015
University of Birmingham Research Archive
e-theses repository This unpublished thesis/dissertation is copyright of the author and/or third parties. The intellectual property rights of the author or third parties in respect of this work are as defined by The Copyright Designs and Patents Act 1988 or as modified by any successor legislation. Any use made of information contained in this thesis/dissertation must be in accordance with that legislation and must be properly acknowledged. Further distribution or reproduction in any format is prohibited without the permission of the copyright holder.

ABSTRACT
Plasmids confer genes encoding clinically relevant antibiotic resistance. It was hypothesised
that the AcrAB-TolC multidrug resistance efflux pump was required for clinically relevant
levels of carbapenem resistance. However, carbapenemase-producing Salmonella TolC
mutants were less susceptible to carbapenems. In the presence of the efflux inhibitor phe-arg-
β-naphthylamide (PAβN), wildtype bacteria and 36/86 non-replicate clinical isolates of
carbapenem-producing Enterobacteriaceae were ≥4-fold less susceptible to ertapenem.
Experimental data suggested that OmpF repression conferred the increased carbapenem MICs.
Two blaKPC-encoding plasmids have been isolated in the UK; pKpQIL-UK was found in K.
pneumoniae, but its variant, pKpQIL-D2 was also found in other species. Therefore, it was
hypothesised that a region of pKpQIL-D2 either conferred a broader plasmid host range
and/or a fitness benefit to the host bacterium. Fitness studies measuring growth rates, ability
to form biofilm, conjugation frequency and plasmid persistence showed that both plasmids
affected the host bacterium but in different ways. Compared to pKpQIL-UK, pKpQIL-D2 did
not confer a significant fitness advantage to its host under the conditions tested. RNA-
sequencing showed both plasmids affected a different set of genes related to metabolism. The
understanding of the factor(s) contributing to the persistence and dissemination of successful
plasmids may help to control antibiotic resistance.

Acknowledgements
Firstly, I would like to thank both of my supervisors, Laura Piddock and Mark Webber for
their great guidance and support throughout my PhD studies.
I am also grateful for the presence of many kind colleagues in the Antimicrobial
Research Group. The help and advice provided by them during my studies are very much
appreciated.
The constant motivation from my friends in England and also those from Malaysia,
Melbourne and Singapore has kept me moving even during very harsh times.
I appreciate the help provided by many of our collaborators namely, Neil Woodford,
Michel Doumith, Shazad Mushtaq, Mark Sutton and Matthew Wand in Public Health England.
I am thankful for the help that has been provided by the staffs and colleagues in the
School of Immunity & Infection, and Institute of Microbiology & Infection.
Lastly, I would like to thank the University of Birmingham for awarding me the Elite
Doctoral Researcher Scholarship which funds my PhD studies in England.

Table of Contents
CHAPTER ONE: INTRODUCTION ...................................................................................... 1
1.1 Bacteria ......................................................................................................................... 1
1.1.1 Salmonella Typhimurium as a Model Organism ......................................... 3
1.2 β-lactam Antibiotics ..................................................................................................... 4
1.2.1 Mechanism of Action of β-lactams .............................................................. 8
1.2.2 Carbapenems .............................................................................................. 10
1.3 Antibiotic Resistance .................................................................................................. 13
1.3.1 Burden of Antibiotic Resistance ................................................................ 14
1.3.2 Antibiotic Resistance Mechanisms ............................................................ 15
1.3.3 Carbapenemase-mediated Antibiotic Resistance ....................................... 19
1.3.4 Antibiotic Resistance Which Requires AcrAB-TolC ................................ 23
1.3.5 Efflux Inhibitors ......................................................................................... 25
1.4 Spread and Acquisition of Antibiotic Resistance ....................................................... 27
1.4.1 Lateral Gene Transfer (LGT) in Dissemination of Antibiotic Resistance . 27
1.5 Plasmid-mediated Antibiotic Resistance .................................................................... 29
1.5.1 The blaKPC-encoding pKpQIL Plasmid ..................................................... 30
1.6 Factors Important in Plasmid Dissemination in Enterobacteriaceae .......................... 32
1.6.1 Plasmid Stability and Segregation ............................................................. 32
1.6.2 Inhibition of Plasmid Transfer ................................................................... 34
1.7 Plasmid-mediated Antibiotic Resistance and Fitness ................................................. 35
1.8 Background to This Project ........................................................................................ 37

1.8.1 Plasmid pCT .............................................................................................. 37
1.8.2 Plasmid pKpQIL-UK & pKpQIL-D2 ........................................................ 38
1.9 Hypotheses to be Investigated in This PhD Project ................................................... 43
1.10 Aims & Objectives ..................................................................................................... 43
CHAPTER TWO: METHODS .............................................................................................. 44
2.1 Bacterial Strains, Plasmids & Culture Conditions ..................................................... 44
2.1.1 Bacterial Identification .............................................................................. 44
2.2 Plasmid Extraction ..................................................................................................... 56
2.3 Polymerase Chain Reaction ........................................................................................ 56
2.4 DNA Gel Electrophoresis ........................................................................................... 57
2.5 DNA Sequencing ........................................................................................................ 57
2.6 Insertional Inactivation of Plasmidic Genes ............................................................... 62
2.6.1 Primer design ............................................................................................. 62
2.6.2 Electrocompetent Cell Preparation and Electroporation ........................... 62
2.6.3 Gene Inactivation by Homologous Recombination ................................... 63
2.7 β-lactamase Assay ...................................................................................................... 64
2.8 Hoechst 33342 Accumulation Assay ......................................................................... 65
2.9 Outer Membrane Protein Extraction .......................................................................... 66
2.10 Sodium Dodecyl Sulphate Polyacrylamide Gel Electrophoresis (SDS-PAGE) ........ 67
2.11 Selection of Rifampicin Resistant Bacteria ................................................................ 67
2.12 P22 Transduction ........................................................................................................ 68
2.13 Conjugation ................................................................................................................ 69

2.14 Growth Kinetics ......................................................................................................... 70
2.15 Determination of Conjugation Frequency .................................................................. 71
2.16 Minimum Inhibitory Concentration (MIC) Determination ........................................ 72
2.17 Biofilm Assay ............................................................................................................. 72
2.17.1 Biofilm Formation on Plastic in Microtitre Tray ....................................... 72
2.17.2 Biofilm Formation on Glass Under Flow .................................................. 73
2.18 Plasmid Persistence .................................................................................................... 75
2.19 Pairwise Competition Assay ...................................................................................... 76
2.20 Galleria mellonella Infection Model .......................................................................... 77
2.21 RNA Sequencing ........................................................................................................ 77
2.21.1 RNA Extraction ......................................................................................... 77
2.21.2 Ribosomal RNA (rRNA) Reduction .......................................................... 79
2.21.3 RNA Library Preparation ........................................................................... 79
2.21.4 Sequencing ................................................................................................. 80
2.21.5 Data Analyses ............................................................................................ 81
CHAPTER THREE: THE CELL ENVELOPE AND CARBAPENEM RESISTANCE ...... 83
3.1 Background ................................................................................................................ 83
3.2 Hypothesis and Aims .................................................................................................. 84
3.3 Carbapenem Resistance by blaKPC is Seen Even in the Absence of the Tripartite
AcrAB-TolC Multidrug Resistance Efflux Pump ...................................................... 84
3.3.1 Strain Constructions ................................................................................... 84
3.3.2 The MICs of Antibiotics in Strains Lacking a Component of the AcrAB-
TolC Efflux Pump .................................................................................... 103
3.4 The Salmonella TolC Mutant is Less Susceptible to β-lactam Antibiotics and This is
Not Specific to Carbapenemase ............................................................................... 106
3.5 Increased Carbapenem Resistance is Not Associated with Passive Release of
Carbapenemase from the Periplasmic Space of the Salmonella Efflux Mutant ....... 108
3.6 Efflux Inhibitor Alters Susceptibility to Some β-lactam Antibiotics ....................... 113
3.6.1 PAβN Reduces β-lactam Antibiotic Susceptibility in K. pneumoniae, E.
coli and Salmonella .................................................................................. 113
3.6.2 PAβN Increases Carbapenem Resistance in Clinical Isolates of
Enterobacteriaceae ................................................................................... 118
3.7 PAβN and Lack of TolC Alter the Porin Profile and Confers Decreased
Susceptibility to β-lactam Antibiotics ...................................................................... 124
3.7.1 Outer Membrane Protein Mutants Showed Reduced Susceptibility to
Ertapenem ................................................................................................ 124
3.7.2 PAβN Reduces Outer Membrane Protein Expression in Salmonella Strains
................................................................................................................. 129
3.7.3 Outer Membrane Protein Profile of Clinical Isolates of Enterobacteriaceae .
................................................................................................................. 131
3.8 Discussion ................................................................................................................ 133
3.9 Future Work ............................................................................................................. 142
3.10 Key Findings ............................................................................................................ 144
CHAPTER FOUR: COMPARISON OF PLASMIDS pKpQIL-UK WITH pKpQIL-D2 .. 145
4.1 Background .............................................................................................................. 145
4.2 Hypothesis and Aims ................................................................................................ 145

4.3 Comparison of the Genetic Sequence of pKpQIL-UK with that of pKpQIL-D2 .... 145
4.4 Transfer of Plasmid into Different Species of Enterobacteriaceae .......................... 146
4.5 Growth Rates of Enterobacteriaceae pKpQIL-UK and -D2 .................................... 149
4.6 Plasmid Persistence .................................................................................................. 156
4.7 Pairwise Competition of K. pneumoniae Ecl8 carrying pKpQIL-UK and -D2 ....... 160
4.8 Conjugation Frequencies of the Plasmids into Various Enterobacteriaceae ............ 164
4.9 Biofilm Formation .................................................................................................... 169
4.9.1 Biofilm Formation on Plastic ................................................................... 169
4.9.2 Biofilm Formation under Constant Flow of Medium .............................. 169
4.10 Infection of Galleria mellonella by Plasmid Carrying K. pneumoniae ST258 ........ 174
4.11 Minimum Inhibitory Concentration of Antibiotics for Various Plasmid-bearing Hosts
.................................................................................................................................. 176
4.12 Summary of Phenotypes Conferred by Carriage of pKpQIL-UK vs -D2 ................ 183
4.13 Gene Expression Profiling of Plasmid Carrying K. pneumoniae ST258 with RNA
Sequencing ............................................................................................................... 183
4.13.1 Determination of Growth Phase for RNA Extraction .............................. 183
4.13.2 Optimisation of Total RNA Extraction .................................................... 187
4.13.3 Ribosomal RNA Depletion and Library Preparation ............................... 191
4.13.4 RNA Sequencing ..................................................................................... 191
4.14 Discussion ................................................................................................................ 207
4.15 Future Work ............................................................................................................. 216
4.16 Key Findings ............................................................................................................ 218

CHAPTER FIVE: OVERALL DISCUSSION .................................................................... 219
REFERENCES ....................................................................................................................... 226

List of Figures Chapter One
Figure 1.1 Differences between Gram-positive and Gram-negative bacteria cell wall
2
Figure 1.2 Distribution of antibiotic usage in Europe 6
Figure 1.3 Structures of β-lactam antibiotics 7
Figure 1.4 Simplified scheme of peptidoglycan macromolecule 9
Figure 1.5 Structures of carbapenem antibiotics 12
Figure 1.6 Alignment of plasmid pKpQIL-UK and variants 39
Figure 1.7 Comparison of the substitution fragment of pKpQIL-UK and -D1 41
Figure 1.8 Comparison of the substitution fragment of pKpQIL-UK and -D2 42
Chapter Two
Figure 2.1 BioFlux system 74
Figure 2.2 RNA sequencing data analyses workflow 82
Chapter Three
Figure 3.1 Growth kinetics of rifampicin-susceptible/resistant mutants of K. pneumoniae Ecl8 and its efflux mutants
86
Figure 3.2 PCR amplification of rpoB of rifampicin-susceptible/resistant E. coli BW25113 for DNA sequencing
88
Figure 3.3 PCR verification of inactivated acrB and tolC genes in rifampicin-resistant mutants of Keio Collection strains
89
Figure 3.4 Growth kinetics of rifampicin-susceptible/resistant mutants of E. coli BW25113 and its efflux mutants
90
Figure 3.5 PCR amplification of rpoB of rifampicin-resistant S. Typhimurium ATCC14028s for sequencing and mutant verification
93
Figure 3.6 Growth kinetics of rifampicin-susceptible/resistant mutants of S. Typhimurium 14028s and its efflux mutants
94
Figure 3.7 PCR verification of K. pneumoniae Ecl8, acrAB, Ecl8Rif/pKpQIL-UK and Ecl8Rif acrAB/pKpQIL-UK
97
Figure 3.8 PCR verification for the presence of pKpQIL-UK in the E. coli BW25113Rif and isogenic efflux mutants
98
Figure 3.9 PCR verification of 14028sRif/pKpQIL-UK transconjugants 99
Figure 3.10 PCR verification of 14028sRif acrAB/pKpQIL-UK, 14028sRif tolC/pKpQIL-UK and 14028sRif acrAB/pKpQIL-D2
100
List of Figures (Continued) Chapter Three
Figure 3.11 PCR verification of 14028sRif/pKpQIL-D2 and 14028sRif tolC/pKpQIL-D2
101
Figure 3.12 PCR verification of 14028sRif acrAB/pKpQIL-D2 transconjugants 102
Figure 3.13 PCR verification of transconjugants of 14028sRif and its mutants carrying the plasmid pNDM-HK
109
Figure 3.14 β-lactamase activity assay for pKpQIL-UK carrying Salmonella and isogenic efflux pump component mutants
112
Figure 3.15 Hoechst 33342 accumulation assay for PAβN and varying concentrations of Compound A and NMP
117
Figure 3.16 PCR verification of SL1344 porin mutants carrying pKpQIL-UK 125
Figure 3.17 PCR verification of SL1344 porin mutants carrying pKpQIL-UK 126
Figure 3.18 Outer membrane protein profile of Salmonella Typhimurium SL1344 and its isogenic efflux pump mutants
127
Figure 3.19 Outer membrane protein of E. coli clinical isolates in the presence and absence of 25 µg/ml PAβN
132
Figure 3.20 Outer membrane protein of Enterobacter spp. clinical isolates in the presence and absence of 25 µg/ml PAβN
134
Figure 3.21 Outer membrane protein of Klebsiella spp. clinical isolates in the presence and absence of 25 µg/ml PAβN
135
Chapter Four
Figure 4.1 Alignment of pKpQIL-UK and -D2 with pKPN5 147
Figure 4.2 PCR verification of the E. coli DH10B transformants for the presence of pKpQIL-UK and -D2
150
Figure 4.3 PCR verification of the Salmonella SL1344Rif transconjugants carrying pKpQIL-UK and -D2
151
Figure 4.4 PCR verification of the E. coli 10418Rif transconjugants carrying pKpQIL-UK and -D2
152
Figure 4.5 PCR verification of the rifampicin-resistant E. cloacae and S. marcescens transconjugants carrying pKpQIL-UK and -D2
153
Figure 4.6 Repeat PCR verification of the rifampicin-resistant S. marcescens transconjugants carrying pKpQIL-UK
154

List of Figures (Continued) Chapter Four
Figure 4.7 PCR verification of the K. pneumoniae ST258 transconjugants carrying pKpQIL-UK and -D2
155
Figure 4.8 Growth kinetics of various Enterobacteriaceae carrying pKpQIL-UK vs -D2
157
Figure 4.9 The percentage of pKpQIL-UK vs -D2 carrying cells in growth over a period of 20 days without antibiotic selection
159
Figure 4.10 PCR verification of the E. coli DH10B transformants for the presence of blaKPC inactivated pKpQIL-UK and -D2
161
Figure 4.11 PCR verification of the K. pneumoniae Ecl8 transconjugants for the presence of blaKPC inactivated pKpQIL-UK and -D2
162
Figure 4.12 Pairwise competition of pKpQIL-UK vs -D2 163
Figure 4.13 Growth rates of rifampicin-resistant K. pneumoniae Ecl8 carrying pKpQIL-UK & -D2 in the presence & absence of blaKPC
165
Figure 4.14 Conjugation frequencies of pKpQIL-UK and -D2 from their respective clinical isolates into Enterobacteriaceae species
167
Figure 4.15 Biofilm formation on plastic for the various plasmid carrying Enterobacteriaceae strain
170
Figure 4.16 Images of biofilm formation in microfluidic channel at various time points
171
Figure 4.17 Percentage area of coverage by biofilm in microfluidic channel after 48 hours under constant flow of LB broth (without salt)
175
Figure 4.18 Virulence assay of Galleria mellonella infected by pKpQIL-UK and -D2 carrying K. pneumoniae ST258
177
Figure 4.19 Outer membrane profile of S. marcescens and K. pneumoniae Ecl8 carrying pKpQIL-UK and -D2
180
Figure 4.20 Growth kinetics of K. pneumoniae ST258/pKpQIL-UK vs -D2 in the presence of doripenem
182
Figure 4.21 Growth kinetics of K. pneumoniae ST258 and plasmid carrying isogenic strains in MOPS minimal medium, and blaKPC expression
185
Figure 4.22 Purification of RNA from K. pneumoniae ST258 in the presence and absence of pKpQIL-UK and -D2
188
Figure 4.23 Purification of RNA from increasing volume of K. pneumoniae ST258 culture
190
Figure 4.24 Purification of RNA using RiboPureTM RNA Purification Kit 192
Figure 4.25 Validation of DNA contamination in DNAse-treated RNA samples 193

List of Figures (Continued) Chapter Four
Figure 4.26 Depletion of ribosomal RNA 194
Figure 4.27 Validation of cDNA libraries 195
Figure 4.28 Quality check of RNA sequencing reads 196
Figure 4.29 Chromosome alignment of K. pneumoniae ST258 chromosome sequences with MGH78578
198
Figure 4.30 Alignment of RNA sequencing reads from K. pneumoniae ST258 carrying pKpQIL-UK on to substituted region on pKpQIL-UK DNA sequence
203
Figure 4.31 Alignment of RNA sequencing reads from K. pneumoniae ST258 carrying pKpQIL-UK on to substituted region on pKpQIL-D2 DNA sequence
204
Figure 4.32 Alignment of RNA sequencing reads from K. pneumoniae ST258 carrying pKpQIL-D2 on to substituted region on pKpQIL-D2 DNA sequence
205
Figure 4.33 Alignment of RNA sequencing reads from K. pneumoniae ST258 carrying pKpQIL-D2 on to substituted region on pKpQIL-UK DNA sequence
206
Figure 4.34 Amino acid alignment of ParA pKpQIL-UK vs -D2 208
Figure 4.35 Amino acid alignment of ParM pKpQIL-UK vs -D2 209
List of Tables Chapter One
Table 1.1 Function of genes involved in conjugation 33
Table 1.2 Distribution of pKpQIL-UK and variants from medical centres in
North Western England Region
40
Chapter Two
Table 2.1 List of antibiotics used in this study 45
Table 2.2 Plasmids 46
Table 2.3 Bacterial strains 47
Table 2.4 Morphological appearance on differential and selective agar 55
Table 2.5 Primers used in this study 58
Chapter Three
Table 3.1 Generation times of rifampicin-susceptible/resistant K. pneumoniae Ecl8 and its isogenic acrAB mutant
87
Table 3.2 Generation times of rifampicin-susceptible/resistant E. coli BW25113 and its isogenic efflux pump mutants
91
Table 3.3 Generation times of rifampicin-susceptible/resistant S. Typhimurium 14028s and its isogenic efflux pump mutants
95
Table 3.4 MIC values of various antibiotics for efflux pump component mutants carrying the pKpQIL-UK plasmid
104
Table 3.5 Protein sequence homology of AcrAB-TolC efflux system 107
Table 3.6 MIC values of various antibiotics for efflux pump component
mutants carrying various plasmids
110
Table 3.7 Effects of PAβN and CCCP on MIC of β-lactam antibiotics 114
Table 3.8 Effects of PAβN and CCCP on MIC of β-lactam antibiotics 116
Table 3.9 Ertapenem MIC in the presence of various efflux inhibitors 119
Table 3.10 Changes in ertapenem resistance of clinical isolates in the presence of PAβN
122
Table 3.11 The changes in MIC50 and MIC90 of the clinical isolates in the absence and presence of PAβN
123
Table 3.12 Effects of PAβN and CCCP on MIC of β-lactam antibiotics 128
Table 3.13 Ertapenem MIC in the presence of various efflux inhibitors 130

Chapter Four
Table 4.1 Rifampicin-resistant mutants of five species of Enterobacteriaceae 148
Table 4.2 Generation time of various Enterobacteriaceae carrying pKpQIL-UK vs -D2
158
Table 4.3 Generation times of rifampicin-resistant K. pneumoniae Ecl8 carrying pKpQIL-UK & -D2 in the presence & absence of blaKPC
166
Table 4.4 Conjugation frequencies of pKpQIL-UK and -D2 into various Enterobacteriaceae
168
Table 4.5 Minimum inhibitory concentration of pKpQIL-UK and -D2 carrying hosts
178
Table 4.6 Relative abundance of the major outer membrane proteins in the plasmid-carrying strains of S. marcescens and K. pneumoniae
181
Table 4.7 Summary of the fitness experiments for the various plasmid carrying Enterobacteriaceae
184
Table 4.8 Generation times of plasmid carrying K. pneumoniae ST258 in MOPS minimal medium
186
Table 4.9 Differentially expressed chromosomal genes in the presence of pKpQIL-UK vs -D2
199
Table 4.10 Differentially expressed plasmidic genes 202
1
CHAPTER ONE: INTRODUCTION
1.1 Bacteria
The earliest evidence for the existence of bacteria dates back to about 3.5 billion years
(Schopf, 1993). Besides being ubiquitous, these microscopic organisms share an intimate
relationship with humans. Newly born infants are colonised with a normal flora within days
of birth (Hall et al., 1990). The presence of a normal flora has been suggested to benefit the
host in many ways, such as modulation of host gene expression important in intestinal
functions (Hooper et al., 2002), provision of vitamins (Hill, 1997), absorption of minerals
(Younes et al., 2001), intestinal epithelial cell differentiation (Gordon et al., 1997),
development of the immune system (Umesaki et al., 1993) and preventing colonisation of the
host by harmful bacteria (Bernet et al., 1994). Although many bacteria benefit their hosts,
there are also others which cause diseases.
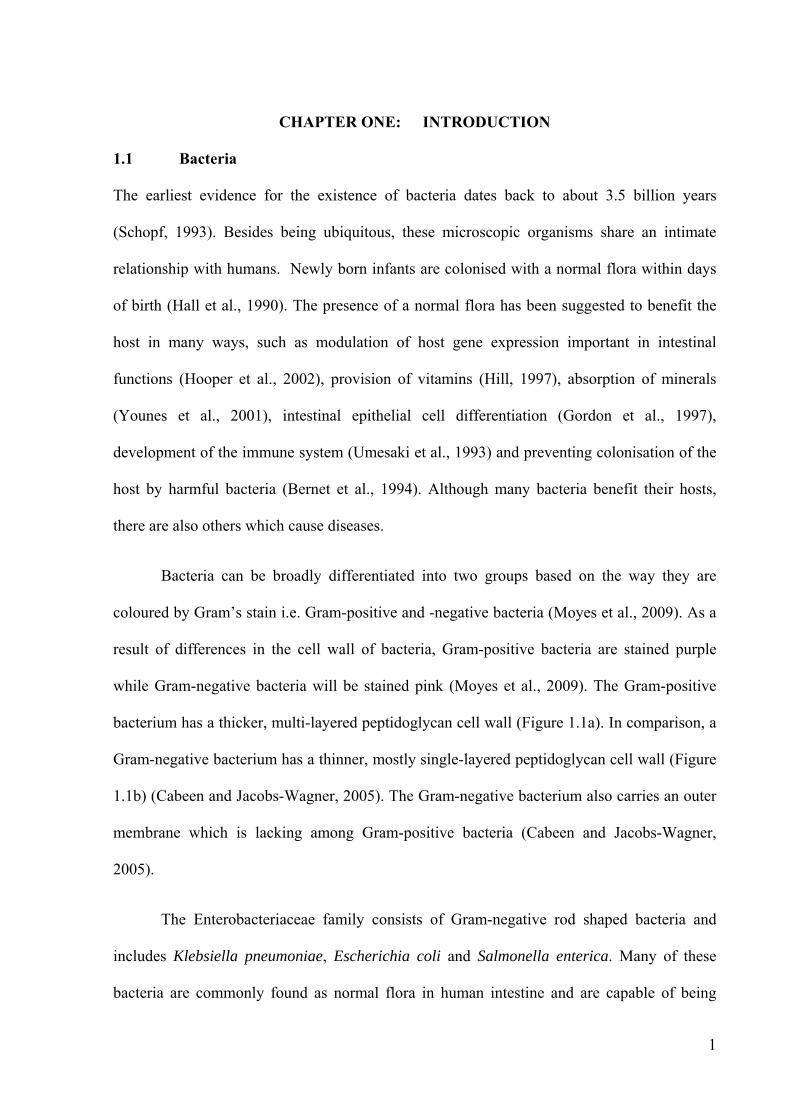
Bacteria can be broadly differentiated into two groups based on the way they are
coloured by Gram’s stain i.e. Gram-positive and -negative bacteria (Moyes et al., 2009). As a
result of differences in the cell wall of bacteria, Gram-positive bacteria are stained purple
while Gram-negative bacteria will be stained pink (Moyes et al., 2009). The Gram-positive
bacterium has a thicker, multi-layered peptidoglycan cell wall (Figure 1.1a). In comparison, a
Gram-negative bacterium has a thinner, mostly single-layered peptidoglycan cell wall (Figure
1.1b) (Cabeen and Jacobs-Wagner, 2005). The Gram-negative bacterium also carries an outer
membrane which is lacking among Gram-positive bacteria (Cabeen and Jacobs-Wagner,
2005).
The Enterobacteriaceae family consists of Gram-negative rod shaped bacteria and
includes Klebsiella pneumoniae, Escherichia coli and Salmonella enterica. Many of these
bacteria are commonly found as normal flora in human intestine and are capable of being

2
(b)
Thin peptidoglycan
cell wall
Cytoplasmic membrane
Outer
membrane
Periplasmic space
Porin
Efflux pump
β-lactamase
Thick peptidoglycan
cell wall
(a)
Cytoplasmic membrane
Teichoic acid
Figure 1.1 Differences between Gram-positive and Gram-negative bacteria cell wall
(a) The cell wall of a Gram-positive bacterium is made up of multiple layer of peptidoglycan polymer. Teichoic acids are found embedded in the cell wall to increase its rigidity. (b) Gram-negative bacterium possesses a thinner peptidoglycan in the space between the outer membrane and cytoplasmic membrane called the periplasmic space. The porin in the outer membrane acts as a non-specific channel for passive exchange of solutes between the extracellular environments with the bacterial cell. The efflux pump functions to extrude compounds in the cell to the external environment. β-lactamase enzymes inactivate β-lactam antibiotics allowing the bacterium to be resistant to the antibiotic.

3
opportunistic pathogen which cause nosocomial- and community-acquired infections
(Nordmann et al., 2012a, Hurrell et al., 2009). Opportunistic pathogen refers to organisms
which are living within a host (e.g. human) or originate from the environment and which are
able to cause diseases upon successfully infecting their host (Brown et al., 2012).
Among the more notable of the bacteria which cause mortality and morbidity in both
the clinical and community settings include E. coli, K. pneumoniae, Enterobacter spp. and
Proteus spp. (Boucher et al., 2009, ECDC, 2013a). Being ubiquitous among humans and
vertebrates, E. coli and K. pneumoniae are also the leading causative agents of urinary,
respiratory and bloodstream infections worldwide (WHO, 2014). Salmonella is the leading
cause of food borne outbreaks and the most frequent cause of enteric infection after
Campylobacter in the EU (ECDC, 2015). In Europe, it was reported that about 3.2 million
patients have at least one healthcare-associated infection annually (ECDC, 2013a). These
include respiratory tract infections, surgical site infections, urinary tract infections and
bacteraemia (ECDC, 2013a). The need to treat infection caused by pathogenic bacteria has
driven medical research that has resulted in the discovery and development of various
antibacterial compounds.
1.1.1 Salmonella Typhimurium as a Model Organism
Salmonella Typhimurium is a motile rod shaped Gram-negative bacterium and a member of
the Enterobacteriaceae family. This facultative anaerobic bacterium is an important cause of
food-borne diarrhoeal diseases (Fàbrega and Vila, 2013). Phylogenetic analyses using various
genetic markers such as 16S RNA, rpoB and initiation factor 2, have shown that members of
the Enterobacteriaceae family share high genetic similarities (Drancourt et al., 2001,
Hedegaard et al., 1999, Moran et al., 2005, Roggenkamp, 2007). These analyses have also
shown close phylogenetic relationship between E. coli and S. Typhimurium (Hedegaard et al.,

4
1999, Roggenkamp, 2007). About 72% of the genes in S. Typhimurium are homologous to
that found in E. coli and K. pneumoniae, and these protein share on average, about 89%
sequence identity (McClelland et al., 2001). Being the most studied laboratory organism for
decades, E. coli has been the reference and model organism for studying various biochemical
pathways and biological processes in other organisms (Keseler et al., 2005, Holden, 2002,
Salgado et al., 2004). Although widely studied, there is a lack of suitable infection model
available for this bacterium (Allen et al., 2006, Savkovic et al., 2005, Zhang et al., 2008).
Similar to E. coli, S. Typhimurium is a highly tractable organism which has simple nutritional
requirements, rapid growth rates and it is easy to genetically manipulate this bacterium (Garai
et al., 2012). Due to the availability of various in vitro and in vivo infection models, S.
Typhimurium is also an ideal model organism especially in studying host-pathogen
interactions and bacterial pathogenesis (Garai et al., 2012).
1.2 β-lactam Antibiotics
One of the first antimicrobials to be discovered was penicillin in the late 1920s, which was
found to exhibit a potent antibacterial effect (Fleming, 1929). For the next few decades, a
range of novel antibacterial compounds of different classes were discovered, such as
streptomycin, tetracycline, chloramphenicol, neomycin, gentamicin, erythromycin,
vancomycin and rifampicin (Hopwood et al., 2007). The term ‘antibiotic’, which means
‘against life’ was coined by Salman Waksman no less than a decade after the discovery of
penicillin to describe substances produced by microorganisms which possess growth
inhibitory effect on other microorganisms (Waksman, 1973). At present, the definition of
‘antibiotic’ has been expanded to include semi- and fully-synthetic antibacterial agents, and is
generally used to refer to compounds used clinically to treat human infections. This

5
distinguishes antibiotics from biocides which are antimicrobial but not suitable for systemic
use in humans (Yoneyama and Katsumata, 2006).
In 2009, antibiotics sales generated an estimated revenue of USD 42 billion globally
(Hamad, 2010). Although there are a plethora of antibiotic classes being marketed, the β-
lactam antibiotics are the largest class of antibiotic being manufactured and has the highest
share in terms of sales, as they are widely used to treat Gram-positive and -negative bacterial
infections (ECDC, 2013a, Hamad, 2010, Kresse et al., 2007, Woo et al., 2003). In most
European countries, β-lactam antibiotics comprised of more than 50% of the antibiotics
prescribed in the community and hospital settings (Figure 1.2) (ECDC, 2013a).
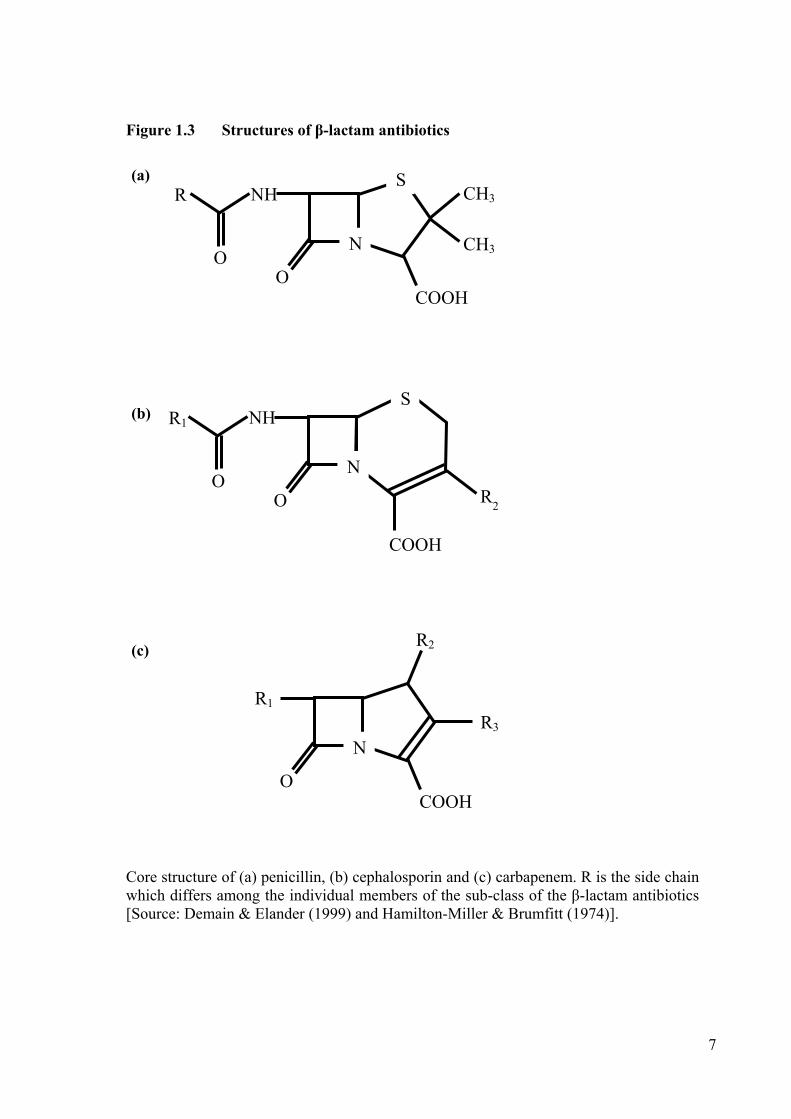
The β-lactam class of antibiotics encompasses several sub-classes such as penicillins
(Fleming, 1929), cephalosporins (Burton and Abraham, 1951), clavams (Brown et al., 1976),
carbapenems (Kahan et al., 1979) and monocyclic β-lactams (also known as monobactams
(Aoki et al., 1976). These antibiotics are produced by fungi and prokaryotes, e.g. Penicillium
spp., Aspergillus nidulans, Cephalosporium spp. and Streptomyces spp. (Demain and Elander,
1999). A common chemical structure i.e. the four-membered lactam ring, also termed β-
lactam ring is shared among the sub-classes and plays an essential role in this antibacterial
activity (Figure 1.3) (Demain and Elander, 1999, Donetz et al., 1984). Modification of
chemical groups attached to the lactam ring results in changes in the antibacterial activity and
stability of the antibiotic against inactivating enzymes as well as pharmacological properties
(Yoshida, 1980, Chantot et al., 1992, Nayler, 1971).
Due to their high clinical efficacy and low toxicity, β-lactam antibiotics play a major
role in both clinical and veterinary medicine (Hornish and Kotarski, 2002, Timmerman et al.,
2006). Therefore, β-lactam antibiotics are often the first choice for treating bacterial infections

6
Antibiotic usage in the (a) hospital and (b) community setting, according to individual European countries [Source: ECDC (2013)]. ‘DDD’ refers to the ‘defined daily dose’ of an antibiotic.
Figure 1.2 Distribution of antibiotic usage in Europe
(a)
(b)
7
Figure 1.3 Structures of β-lactam antibiotics
Core structure of (a) penicillin, (b) cephalosporin and (c) carbapenem. R is the side chain which differs among the individual members of the sub-class of the β-lactam antibiotics [Source: Demain & Elander (1999) and Hamilton-Miller & Brumfitt (1974)].
N
SNH R
O O
CH3
CH3
COOH
(a)
(b)
(c)
N
R1
O
R3
R2
COOH
N
SNH R1
O O R
2
COOH

8
and are the most widely prescribed antibiotics in hospitals (Jovetic et al., 2010, Nicolau, 2008,
Plüss-Suard et al., 2011, Liew et al., 2011). Broad-spectrum penicillins and cephalosporins
are also used for growth promotion, disease and prophylactic treatments for animals, although
this is country dependent (Timmerman et al., 2006, Phillips et al., 2004, Graham et al., 2007,
Paphitou, 2013).
1.2.1 Mechanism of Action of β-lactams
All Gram-positive and -negative bacterial cells are separated from their surroundings by a cell
wall made up of peptidoglycan which is important for preventing the cell from lysis due to the
higher internal osmotic pressure of the cell relative to the external environment (Scheffers and
Pinho, 2005). Peptidoglycans are made up of glycan chains which consist of N-
acetylglucosamine (GlcNAc) and N-acetylmuramic acid (MurNAc) subunits. Through
transglycosylation reaction, these subunits are joined together by β-1,4-glycosidic bonds to
form long polymer chains (Figure 1.4a) (Holtje, 1998). Peptide cross-links are formed
between the glycan polymers through a reaction called transpeptidation, this allows the
formation of a three dimensional structure that gives rise to the bacterial cell wall (Figure 1.4b)
(Holtje, 1998, Scheffers and Pinho, 2005).
Both the transglycosylation and transpeptidation reactions are required for the
development of the peptidoglycan cell wall. The reactions are catalysed by transglycosylase
and transpeptidase enzymes (Scheffers and Pinho, 2005). Such enzymatic activities can be
found on a group of proteins called penicillin-binding proteins (PBPs), identified for their
binding affinity towards penicillin, from which they have been given the name (Blumberg and
Strominger, 1974). The types of PBPs found in a particular bacterial cell vary across species
(Georgopapadakou, 1993). Some PBPs, such as PBP2 and PBP3 are monofunctional, hence

9
(a) The peptidoglycan cell wall of bacteria is made up of glycan polymers which consist of N-acetylglucosamine (GlcNAc) and N-acetylmuramic acid (MurNAc) monomers linked together by β-1,4-glycosidic bonds through a process called transglycosylation. The glycan polymers are arranged in a three-dimensional structure via the peptide cross-links. (b) The cross-linking of the glycan chains occurs via transpeptidation catalysed by penicillin-binding proteins which forms the peptide cross-link between the peptide side chains of the GlcNAc and MurNAc monomers.
GlcNAc MurNAc GlcNAc MurNAc GlcNAc MurNAc P
epti
de
Pep
tid
e
Pep
tid
e GlcNAc MurNAc GlcNAc MurNAc GlcNAc MurNAc
Pep
tid
e
Pep
tid
e
Pep
tid
e
β-1,4-glycosidic bond
Glycan polymer Peptide
cross-link
Figure 1.4 Simplified scheme of peptidoglycan macromolecule
MurNAc GlcNAc
Pep
tid
e
GlcNAc MurNAc
Pep
tid
e
MurNAc GlcNAc
Pep
tid
e
GlcNAc MurNAc
Pep
tid
e
Peptide cross-link Transpeptidase
+
(a)
(b)

10
they are only capable of catalysing the transpeptidation reaction (Ghuysen, 1997, Goffin et al.,
1996), whereas PBP1A and PBP1B are bifunctional, acting both as a transpeptidase and
transglycosylase (Ishino et al., 1980, Nakagawa et al., 1979).
The PBPs’ important role in maintaining cell integrity has been shown in many studies
(Nelson and Young, 2000, Spratt, 1975, Wei et al., 2003). As the name of these enzymes
suggest, they are the targets of β-lactam antibiotics. The antibiotic inhibits the
transpeptidation step of bacterial cell wall synthesis (Tipper and Stroming, 1965). Naturally,
the peptide stem of two peptidoglycan monomer would undergo transpeptidation to form the
peptide cross-link. But in the presence of β-lactam antibiotics, the compound act as
competitive substrates for the PBPs. During transpeptidation, the antibiotics are covalently
linked to the PBPs and render the transpeptidase enzyme inactive (Tipper and Stroming, 1965,
Holtje, 1998). These antibiotics have been shown to affect cell growth via binding to PBPs
which may lead to cell death (Lleo et al., 1987, Tuomanen et al., 1986).
1.2.2 Carbapenems
All β-lactam antibiotics share a similar mechanism of action by inhibiting bacterial cell wall
biosynthesis. However, among all the β-lactam antibiotics, carbapenems are known to have a
better efficacy against a broader spectrum of bacteria. The United States Food and Drug
Administration (FDA) approved carbapenems are imipenem, meropenem, ertapenem and
doripenem, with the latter being the newest member to this sub-class of β-lactam antibiotics
(Hilas et al., 2008).
Unlike most other β-lactam antibiotics for which their antibacterial activities are
restricted by bacterial growth rate, carbapenem killing activity is growth-independent (Cozens
et al., 1989, Eng et al., 1991). Carbapenems also outrank other β-lactam antibiotics in terms of
bacterial cell penetration and stability against most β-lactamases (Franceschini et al., 2002,

11
Iaconis et al., 1997, Yang et al., 1995). Carbapenems also retain antibacterial activity against
various genera of bacteria producing a range of extended-spectrum β-lactamases (Schwaber et
al., 2005). Due to its low toxicity, high efficacy and ultra-broad spectrum activity against
many Gram-positive, -negative and anaerobic bacteria, carbapenems are often regarded as the
last line of defence we have for severe bacterial infections (Papp-Wallace et al., 2011). Hence,
these antibiotics are not easily prescribed to patients to avoid the selective pressure on
carbapenem resistant bacteria (Fong et al., 2012, Mohr, 2008). However, when an infection is
caused by extended-spectrum β-lactamase (ESBL) producing bacteria, carbapenems are often
the first line of treatment options employed (Colardyn, 2005, Moellering et al., 1989, Mohr,
2008, Hawkey and Livermore, 2012).
Carbapenems mainly differ from each other in the side chains they have. Compared to
other β-lactam antibiotics (Figure 1.3), all carbapenems have a unique hydroxyethyl group
(Figure 1.5; Orange circle) which provides better stability against β-lactamases (Hammond,
2004). Meropenem and ertapenem possess a C1 methyl group which confers stability to renal
dehydropeptidase (DHP-I) (Figure 1.5a & c; Red circles) (Drusano, 1997, Blumer, 1997,
Musson et al., 2003). The lack of this methyl group causes imipenem to be easily degraded by
this enzyme (Figure 1.5b). Hence, imipenem is prescribed with cilastatin (DHP-I inhibitor)
(Blumer, 1997). The presence of the C2 moiety confers meropenem with enhanced activity
against Enterobacteriaceae, including P. aeruginosa (Figure 1.5a; Blue circle). The side chain
in this position also results in the difference in activity between meropenem and imipenem
where the latter is more active against Staphylococcus spp. (Drusano, 1997). The benzoate
side chain in ertapenem (Figure 1.5c; Green circle) increases its protein binding ability which
leads to a longer half life (4 hours) when compared to meropenem (1 hour) and imipenem (1
hour) (Hammond, 2004).

12
Figure 1.5 Structures of carbapenem antibiotics
Structure of (a) meropenem, (b) imipenem and (c) ertapenem. Unlike other β-lactam antibiotics, carbapenems have a unique hydroxyethyl group which allows better stability against β-lactamases (Orange circle). The methyl group (Red circle) in meropenem and ertapenem confers stability to renal dehydropeptidase-I. The C2 moiety (Blue circle) in meropenem confers enhanced activity against Gram-negative bacteria, including P. aeruginosa. The benzoate group in ertapenem (Green circle) confers ertapenem with a longer half life [Source: Demain & Elander (1999) and Hamilton-Miller & Brumfitt (1974)].
(b)
NH N
N
OH
O
S
COOH
CH3
H
(a)
N
OH
O
S
COOH
CH3
CH3
N
O
N
CH3 CH3
(c)
N
OH
O
S
COOH
CH3 NH
CH3
N
O
O
OH
13
1.3 Antibiotic Resistance
The introduction of antibiotics into clinical therapy has successfully reduced the mortality rate
associated to bacterial infections (IDSA, 2011). Antibiotic resistance is an evolutionary
process of bacteria to overcome the inhibitory effects of antibiotics since their introduction
into clinical therapy. This was supported by a study showing most clinical isolates collected
from various continents before the antibiotic era were antibiotic susceptible (Hughes and
Datta, 1983). However, a more recent study has provided evidence of antibiotic resistance
existing long before the history of mankind when β-lactam, glycopeptides and tetracycline
resistance genes were identified in 30,000-year old Beringian permafrost sediment (D'Costa et
al., 2011). Since its introduction, the therapeutic effects of antibiotics have been countered by
the emergence and expansion of antibiotic resistant bacteria (Hopwood et al., 2007).
Unlike the number of methicillin-resistant Staphylococcus aureus (MRSA) which is
stabilising or showing downward trends in the EU, the reports of multidrug-resistant K.
pneumoniae and E. coli have been increasing in one third of the EU countries (ECDC, 2013a).
Non-susceptibility (i.e. intermediate and resistant) to third-generation cephalosporins and
carbapenem in Enterobacteriaceae was reported to be 33.4% and 7.6%, respectively. In both
cases, K. pneumoniae showed the highest percentage of non-susceptibility among the isolates
tested (ECDC, 2013a). In 2014, the World Health Organisation (WHO) reported the detection
of third generation cephalosporin resistant E. coli in 86 (44%) of its Member States. Similarly,
resistance to third generation cephalosporin and carbapenem in K. pneumoniae was reported
in 87 (45%) and 71 (37%) of WHO Member States, respectively (WHO, 2014). In these data,
the countries which were included in the figures were only considered to have significant
antibiotic resistant bacteria when studies were available showing more than 30% of the tested
isolates were resistant. This depicts the dire situation where the standard intravenous

14
treatments with cephalosporins have been rendered ineffective and the last line therapy with
carbapenem is also being threatened (WHO, 2014).
1.3.1 Burden of Antibiotic Resistance
With infectious disease being one of the leading causes of death around the world, the
presence of antibiotic resistant bacteria further increases the burden of infectious diseases. In
2007, 25,000 deaths per year in the European Union (EU) were estimated to be due to
infections caused by antibiotic resistant bacteria (ECDC and EMEA, 2009). Of note, about
67 % of this value is due to infection with Gram-negative bacteria. As only five antibiotic
resistant bacteria, i.e. methicillin-resistant S. aureus (MRSA), vancomycin-resistant
Enterococcus faecium, carbapenem-resistant Pseudomonas aeruginosa, third-generation
cephalosporin resistant E. coli and K. pneumoniae, were taken into account in the survey, the
total number of deaths by antibiotic resistant bacteria is underestimated. In the same report,
the estimated financial cost related to infections caused by the antibiotic resistant bacteria
amounted to EUR 1.5 billion annually. The cost included outpatient care cost (~EUR 10
million/annum), productivity losses due to absence of work (~EUR 150 million/annum), and
productivity losses due to deaths (~EUR 450 million/annum). The infections were also
associated with an extra 2.5 million days of hospitalisation.
In the US, the medical cost of a single patient infected with an antibiotic-resistant
bacterial infection in a Chicago teaching hospital was estimated to be between USD 18,588 to
USD 29,069 in 2000 (Roberts et al., 2009). The studies also estimated the mortality rate
associated with antibiotic resistant infections to be 6.5% and the societal cost to be between
USD 10.7 to 15.0 million per annum. Patients with antibiotic-resistant infections also had
between 6.4 to 12.7 excess days of hospitalisation per annum. Extrapolation of these data
indicates the excess healthcare and societal cost associated with antibiotic-resistant infections

15
in the US to be approximately USD 20 billion and USD 35 billion per annum, respectively,
with an excess of 8 million hospitalisation days per annum (Bush et al., 2011). Every year,
there are approximately 2 million healthcare-associated infections with a majority of the
infections contributed by antibiotic-resistant bacteria and resulting in almost 99,000 deaths in
the US (Klevens et al., 2007).
In 2006, a national survey showed 300,000 of the infections reported in the United
Kingdom (UK) annually were healthcare-associated infections and the cost for the treatment
of the patients amounted to over GBP 1 billion per annum (NAO, 2009). The estimated
number of excess deaths attributed to MRSA and third-generation cephalosporin resistant E.
coli in the UK was 1,600 cases in the 2007 (de Kraker et al., 2011). In the same study, the
excess number of days of hospitalisation and excess cost due to these antibiotic-resistant
bacteria were approximately 73,000 days and EUR 17 million (de Kraker et al., 2011).
With these data combined, it can be seen that antibiotic-resistant bacteria cause a
significant burden to the society. Moreover, studies have shown association of higher death
rates with infections caused by antibiotic-resistant bacteria in certain clinical situations such
as bloodstream infection and infection during liver transplant (Esterly et al., 2012, Kalpoe et
al., 2012). In particular, carbapenem-resistant Enterobacteriaceae associated infections have
been shown to cause significantly higher mortality compared to infections caused by the
corresponding susceptible species (Falagas et al., 2014). If the antibiotic resistance
phenomenon is left unchecked, it is estimated that by 2050, there will be about 10 million
deaths per annum associated to antibiotic resistant infections (O'Neill, 2014).
1.3.2 Antibiotic Resistance Mechanisms
Bacteria employ a myriad of mechanisms to survive the stresses imposed by the presence of
antibiotics (Fisher et al., 2005). As the target of all β-lactam antibiotics is essentially the PBPs

16
involved in cell wall synthesis (Blumberg and Strominger, 1974), alteration of the target
proteins resulting in lower affinity towards the antibiotics can confer the host cell with
resistance to the antibiotics. This has been reported in various bacteria such as Neisseria
gonorrhoeae (Ropp et al., 2002), Neisseria meningitidis (Antignac et al., 2001) and
Haemophilus influenzae (Matic et al., 2003).
In addition to the cytoplasmic membrane and peptidoglycan cell wall that Gram-
positive bacteria have, Gram-negative bacteria also possess an outer membrane which is
impermeable to hydrophobic compounds (Nikaido, 2003). Hence, Gram-negative bacteria
possess hydrophilic protein channels also called porins which allow non-specific exchange of
small hydrophilic solutes such as glucose, sucrose, amino acids and some antimicrobial
compounds across the outer membrane (Lugtenberg and Van Alphen, 1983, Yoshimura and
Nikaido, 1985). The major porins found in Gram-negative bacteria are from the outer
membrane protein F (OmpF) and OmpC families (Pages et al., 2008). These porins are non-
specific to the solutes which pass through them. However, they are more efficient in allowing
the diffusion of cation compounds (Nikaido and Rosenberg, 1983). Both porins can be
transcriptionally and post-transcriptionally regulated in response to external signals which
include medium osmolarity, pH, nutrient limitation and temperature (Nikaido, 2003, Pages et
al., 2008). In general, OmpF has a larger pore size compared to OmpC (Nikaido and
Rosenberg, 1983). In E. coli, the pore sizes of OmpF and OmpC are 1.2 nm and 1.1 nm,
respectively (Pratt et al., 1996). Hence the repression of OmpF and the increase expression of
OmpC will impair the influx of larger solutes across the bacterial outer membrane (Nikaido
and Rosenberg, 1983).
Two major types of porins i.e. OmpK35 (OmpF homologue) and OmpK36 (OmpC
homologue) are found in K. pneumoniae (Albertí et al., 1995, Hernandez-Alles et al., 1995).
17
The artificial expression of OmpK35 porin in an antibiotic-resistant K. pneumoniae strain
lacking both of the major porins was shown to reduce the minimum inhibitory concentration
(MIC) values of carbapenems, fluoroquinolones, second-, third- and fourth-generation
cephalosporins (Domenech-Sanchez et al., 2003). The expression of OmpK36 in the same
study also resulted in a decrease in the MIC values of a range of antibiotics tested but to a
lesser extent when compared to the effects of OmpK35 expression. As most non-ESBL
producing strains of K. pneumoniae express both of the major porins whereas the ESBL
producing strains of this bacterium only expresses the OmpK36 porin, the possibility of an
interplay between the expression of ESBL and the selective loss of porin expression to result
in an increase in antibiotic resistance of the bacteria cannot be excluded (Hernandez-Alles et
al., 1999, Martínez-Martínez et al., 2002).
The sub-inhibitory intracellular concentrations of antibiotics resulting from the
restricted entry of antibiotics imposed by down-regulation of porin expression can also be
achieved by the up-regulation of efflux pumps (Nikaido, 2001). Efflux pumps can be
categorised into five families, i.e. major facilitator superfamily (MFS) (Marger and Saier Jr,
1993), adenosine triphosphate (ATP)-binding cassette (ABC) superfamily (Schneider and
Hunke, 1998), small multidrug resistant (SMR) family (Paulsen et al., 1996), resistance-
nodulation-cell division (RND) superfamily (Saier et al., 1994), and multidrug and toxic
compound extrusion (MATE) family (Brown et al., 1999). Efflux is an active process which
utilises energy in the form of ion or proton gradient or ATP for active transportation of
compounds across the cell barrier (Kumar and Schweizer, 2005).
Amongst the best characterised efflux pumps are the AcrAB-TolC system of E. coli
and the MexAB-OprM system of P. aeruginosa (Nikaido, 1998, Poole, 2000). Both are
pumps of the RND superfamily and they are comprised of a tripartite system which includes

18
an inner membrane transporter protein (AcrB and MexB), efflux adaptor protein (AcrA and
MexA) and the outer membrane protein (TolC and OprM) spanning both the inner and the
outer membrane of Gram-negative bacteria (Symmons et al., 2009). Through kinetic studies,
the E. coli AcrAB-TolC has been shown to have a high efflux capacity for penicillins (Lim
and Nikaido, 2010). This tripartite pump system has been found to be a major efflux system
among members of the Gram-negative Enterobacteriaceae (Poole, 2005). Other studies in K.
pneumoniae and S. Typhimurium have also implicated this efflux system with resistance to β-
lactam antibiotics (Nikaido et al., 1998, Pages et al., 2009).
Among the 12 predicted RND efflux systems on the genome of P. aeruginosa, a
clinically important nosocomial bacterium, MexAB-OprM is the efflux system which has
been studied most extensively (Stover et al., 2000, Gillis et al., 2005). The MexAB-OprM
efflux pump has been associated with carbapenem resistance in one study where clinical
isolates with the loss of OprD porin expression showed increased resistance to meropenem
(Pai et al., 2001). The porin has been shown to act as a channel allowing diffusion of
carbapenem across the cell barrier of P. aeruginosa (Wolter et al., 2004). However, another
study found no correlation between OprD or MexAB-OprM expression and carbapenem
resistance (El Amin et al., 2005).
Shortly after the introduction of penicillin into clinical use, the first β-lactamase
enzyme, termed penicillinase was isolated (Abraham and Chain, 1940). The β-lactamase
enzymes are one of the major mechanisms of resistance in Gram-negative bacteria and have
been classified into four classes on the basis of protein sequence (Ambler Class A to D) and
by their substrate and inhibitor profile (Group 1 to 3) (Bush et al., 1995, Ambler, 1980). The
enzymes of clinical relevance can be generally differentiated into ESBLs, AmpC β-lactamases
and carbapenemases. Although there is no specific definition of an ESBL, it is normally a β-

19
lactamase which can hydrolyse penicillins, cephalosporins (first-, second- and third-
generations), and aztreonam; but is susceptible to β-lactamase inhibitors (Paterson and
Bonomo, 2005). The ESBL-producing Gram-negative bacteria are becoming increasingly
prevalent worldwide, albeit showing different antibiotic susceptibility depending on
geographical locations (Reinert et al., 2007, Nijssen et al., 2004, Kallen et al., 2011). As
ESBLs show no significant activity against carbapenems (Paterson and Bonomo, 2005), these
antibiotics are often the preferred choice of therapy for ESBL-producing Gram-negative
bacterial infections (Rupp and Fey, 2003). AmpC β-lactamases have similar activities to
ESBLs but are resistant to inhibitors such as clavulanic acid (Bush et al., 1995). Lastly, the
carbapenemases consist of various enzymes which are mostly resilient to β-lactamase
inhibitors and possess varying hydrolytic ability against all β-lactam antibiotics including
carbapenems (Queenan and Bush, 2007, Thomson, 2010).
Although each mechanism can individually confer resistance to β-lactam antibiotics,
bacteria sometimes employ a combination of these mechanisms to achieve extremely high
level of resistance to the antimicrobial compound, such as the mutations in PBP3 and elevated
expression of AcrAB efflux pump in H. influenzae (Kaczmarek et al., 2004). Similarly, the
production of β-lactamases (e.g. CTX-M-15) and deficiencies in porins (OmpK35 and
OmpK36) confer high carbapenem resistance in K. pneumoniae (Jacoby et al., 2004, Poulou
et al., 2013, Ruiz et al., 2012), and over-expression of MexAB-OprM efflux pump in the
absence of OprD porin confers P. aeruginosa with carbapenem resistance (Pai et al., 2001).
1.3.3 Carbapenemase-mediated Antibiotic Resistance
Infectious disease is one of the leading causes of death worldwide, with pneumonia and
diarrhoeal disease as the main global causes of deaths (WHO, 2011). The efforts in place to
overcome infectious disease have been hampered by the worldwide emergence of antibiotic

20
resistant bacteria (Arias and Murray, 2009). Few antibiotics remain active for the treatment of
severe and life-threatening infections by Gram-negative bacteria (Spellberg et al., 2004,
Piddock, Gould, 2008). The increase in numbers of antibiotic resistant Gram-negative bacteria
has been further exacerbated with the lack of new efficacious agents in the pipeline (Piddock,
2012).
Gram-negative bacteria are associated with the major types of infections, i.e.
pneumonia and urinary tract infection (Gaynes et al., 2005, Hidron et al., 2008). The number
of antibiotic resistant Gram-negative bacteria such as E. coli has increased in European
countries (Gagliotti et al., 2011) and elsewhere e.g. Taiwan (Chuang et al., 2010). Among the
commonest Gram-negative bacteria causing infections are E. coli, K. pneumoniae,
Enterobacter spp., Serratia marcescens, P. aeruginosa and Acinetobacter spp. (Gaynes et al.,
2005, Chuang et al., 2010). Although Enterobacter cloacae and S. marcescens associated
infections occur less frequently as compared to E. coli and K. pneumoniae, but E. cloacae is
able to cause a wide range of infections (including bacteraemia, endocarditis, septic arthritis,
etc.) while S. marcescens is associated with sepsis, meningitis and lung inflammation in
neonates that can be fatal (ECDC, 2013b, Pages and Davin, 2015, Polilli et al., 2011). The
spread and persistence of ESBL-producing bacteria has driven more usage of carbapenems in
treatment, but the emergence of carbapenemase-producing bacteria has threatened these ‘last-
line’ defence agents in clinical therapy against bacterial infections.
Carbapenemases are categorised into Class A, B and D following the Ambler class
system (Jean et al., 2015). Class A and D carbapenemases possess a serine residue in their
active site while Class B requires a divalent ion for it to hydrolyse β-lactam antibiotics (Jean
et al., 2015). The members of the Class A carbapenemase include K. pneumoniae
carbapenemase (KPC), Guiana extended spectrum enzyme (GES), not metalloenzyme

21
carbapenemase (NMC), imipenem-hydrolysing β-lactamase (IMI) and S. marcescens enzyme
(SME). Class B metallo-β-lactamase is consists of imipenemase (IMP), Verona integron-
encoded metallo-β-lactamase (VIM), German imipenemase (GIM), Sao Paulo metallo-β-
lactamase (SPM), Seoul imipenemase (SIM) and New Delhi metallo-β-lactamase (NDM).
The Class D carbapenemases are mainly oxacillinases (OXA-23-like, OXA-24-like, OXA-48-
like and OXA-58-like) (Jean et al., 2015). The classes of carbapenemases vary in their
spectrum of activity on β-lactam antibiotics. Class A carbapenemases can hydrolyse all sub-
classes of β-lactam antibiotics but are susceptible to β-lactamase inhibitors. The Class B
metallo-β-lactamases are only susceptible to aztreonam while Class D carbapenemases can
hydrolyse all β-lactam antibiotics but they have weak hydrolytic activity on cephalosporins
and carbapenems (Nordmann, 2014). Carbapenemases which are closely associated with
mobile elements (such as plasmids) are able to spread widely across various countries and
cause serious hospital outbreaks (Jean et al., 2015, Nordmann, 2014). Two carbapenemase
enzymes of current clinical concern are the KPC and NDM enzymes (Yigit et al., 2001, Yong
et al., 2009).
The KPC enzyme was first discovered in 1996 in a K. pneumoniae isolated from a
hospital in North Carolina (Yigit et al., 2001). The ca. 32 kDa enzyme is encoded by an 879
bp coding region, blaKPC-2 (originally called blaKPC-1) (Yigit et al., 2008) and confers
resistance to penicillin, cephalosporin, carbapenem and monobactam antibiotics. The
hydrolytic activity of KPC-2 is not influenced by ethylenediaminetetraacetic acid (EDTA) or
zinc (II) chloride (ZnCl2), but is inhibited by clavulanic acid. Amino acid sequence homology
and the presence of known or suggested catalytic residues places the KPC-2 enzyme as a
member of the Class A family of β-lactamases. Among all the antibiotics tested, this enzyme
had the highest activity against meropenem (Yigit et al., 2001).
22
Currently, there are 22 variants of KPC enzymes (www.lahey.org). In contrast to the
first discovered KPC enzyme, most KPC enzymes identified recently are associated with
conjugative plasmids (Moland et al., 2003, Naas et al., 2005, Woodford et al., 2004, Yigit et
al., 2001). This carbapenemase has developed to become the most common carbapenemase in
the US (Gupta et al., 2011). Although the geographical location of K. pneumoniae-producing
KPC enzymes was initially in the US, these bacteria are now found around the world
(Bradford et al., 2004, Naas et al., 2005, Leavitt et al., 2007). The enzyme is also found in
other species of Gram-negative bacteria, such as E. coli (Morris et al., 2011), Salmonella spp.
(Miriagou et al., 2003, Rodríguez et al., 2014), S. marcescens (Cai et al., 2008), Pseudomonas
putida (Bennett et al., 2009), Citrobacter freundii (Rosa Gomez-Gil et al., 2010) and E.
cloacae (Zavascki et al., 2009). The blaKPC gene is located within a ca. 10 kb Tn4401
transposon (Gootz et al., 2009). At least seven isoforms (a – f; 2 variants of isoform ‘d’) have
been reported (Bryant et al., 2013). These isoforms contain varying length of deletions
upstream of blaKPC which affect the expression of the carbapenemase gene (Bryant et al.,
2013, Seecoomar et al., 2013). This blaKPC carrying transposon is known to be mobile and
have been found in various plasmid backbones contributing to the dissemination of this
carbapenemase gene among Gram-negative bacteria (Partridge, 2014).
A more recently identified carbapenemase is the NDM enzyme which was first
identified in K. pneumoniae isolated from the urine of an Indian patient in 2008 (Yong et al.,
2009). The enzyme, designated as NDM-1 is encoded by a gene of 807 bp, producing a
protein of 269 amino acids with a molecular mass of ca. 27.5 kDa. The 180 kb plasmid
carrying the blaNDM-1 gene in this patient, named pNDM-1 was shown to be conjugative.
Interestingly, a carbapenem resistant E. coli was also isolated from the faecal sample of the
patient, carrying a smaller, 140 kb plasmid which also harbours the blaNDM-1 gene. This led

23
the authors to suggest the possibility of in vivo conjugation and arrangement of the plasmid
between the species resulting in two different plasmid sizes. The transfer of the pNDM-1
plasmid to E. coli J53 via in vitro conjugation conferred the recipient cell with resistance to
penicillins, monobactam, carbapenems, first-, second-, third- and fourth-generation
cephalosporins (Yong et al., 2009). Since the discovery of the NDM-1 enzyme, 15 other
variants have been identified (www.lahey.org). Over a short period of time since its discovery,
this enzyme and its variants have been isolated in various species of bacteria in countries such
as Kenya (Poirel et al., 2011), Australia (Poirel et al., 2010), China (Chen et al., 2011), Japan
(Yamamoto et al., 2011), Norway (Samuelsen et al., 2011), Belgium (Bogaerts et al., 2011),
UK (Jain et al., 2014) and the USA (CDC, 2010).
The emergence of antibiotic resistant bacteria has been further compounded by the
isolation and possible zoonotic transmission of these bacteria from companion animals (CDC,
2001, Shaheen et al., 2011). Advances in aviation industry contributing to increase
international travel and the distribution of food have also played against the human race by
facilitating rapid dissemination of multidrug-resistant bacteria (Kenyon et al., 1996, Fey et al.,
2000, Hawkey, 2015). Poor hygiene practices observed in healthcare services may further
encourage the spread of such bacteria (Pittet et al., 1999).
1.3.4 Antibiotic Resistance Which Requires AcrAB-TolC
Although target alterations have been known to generate antibiotic resistant strains of bacteria
(Lambert, 2005); at times, this mechanism itself does not confer clinically relevant resistance
level. Through multiple steps of selection in increasing concentration of enrofloxacin, S.
Typhimurium mutants with increase resistance to ciprofloxacin were obtained (Giraud et al.,
2000). Fluoroquinolone resistance has been shown to arise from mutation in the DNA gyrase
gene which affects the binding of the antibiotic to the gyrase-DNA complex (Willmott and

24
Maxwell, 1993). However, Giraud et al. (2000) showed a mutant (BN18/21) had increased
ciprofloxacin resistance compared to the parent Salmonella (BN18) strain without having any
mutations in the DNA gyrase or topoisomerase gene. Moreover, two other mutants (BN18/41
and BN18/71) which had an identical substitution (Gly81Cys) in DNA gyrase (gyrA) showed
four-fold difference in ciprofloxacin susceptibility. Immunoblotting showed that the increase
in ciprofloxacin resistance correlated to the increase expression of efflux pump protein
(AcrA), suggesting the role of active efflux in the reduce susceptibility towards ciprofloxacin
(Giraud et al., 2000).
In another study, multidrug resistant S. Typhimurium strain which exhibited high level
resistance towards various fluoroquinolones was also found to have no mutations in any of the
DNA gyrase and topoisomerase subunit genes (Baucheron et al., 2004). In this study, it was
shown that other strains carrying substitutions in gyrA were slightly more resistant to the
antibiotics tested. Inactivation of the acrB and tolC genes in the multidrug resistant strains
decreased the level of resistance towards the fluoroquinolones. Addition of efflux pump
inhibitor, phenyl-arginine-β-naphthylamide (PAβN) also increased the susceptibility of these
Salmonella strains (Baucheron et al., 2004). In addition to fluoroquinolone resistance,
tetracycline resistance conferred by Tet(A) protein encoded on a pBR322 plasmid also
showed large reduction in tetracycline MIC in the E. coli host with non-functional AcrAB-
TolC efflux pump (180 µg/ml to 30 µg/ml) (de Cristóbal et al., 2006).
It has been well established that AcrAB-TolC efflux pump is associated with
resistance to some β-lactam antibiotics, including penicillins and cephalosporins (Nikaido et
al., 1998, Opperman et al., 2014, Piddock, 2006a, Poole, 2004). Data from a study have
suggested a possible synergistic effect of AcrAB-TolC and β-lactamase enzymes in
conferring resistance to β-lactam antibiotics in K. pneumoniae (Pages et al., 2009). In this

25
study, it was observed that various clinical isolates carrying the chromosomal SHV-1 β-
lactamase enzyme showed increasing susceptibility to piperacillin in the presence of
tazobactam (β-lactamase inhibitor) and PAβN (Pages et al., 2009). In the presence of
tazobactam, the MIC values of piperacillin of the various isolates decreased 4- to 8-fold.
However, in the presence of tazobactam and PAβN, the susceptibility of these isolates
increased further by 4-fold. The authors suggested that tazobactam was possibly a substrate of
the AcrAB-TolC efflux system. Hence, the inhibition of the efflux system by PAβN increased
the intracellular concentration of tazobactam, allowing a stronger effect of the β-lactamase
inhibitor on the SHV-1 enzyme (Pages et al., 2009). However, it has been previously shown
that inactivation of AcrAB-TolC in E. coli resulted in 16-fold increase in susceptibility of the
bacterium to piperacillin (Opperman et al., 2014). Therefore, it is also possible that the larger
increase in susceptibility of the K. pneumoniae isolates to piperacillin in the presence of
tazobactam and PAβN was a result of the combined loss of the functions of the SHV-1 β-
lactamase and the efflux system.
These studies with others showed the synergistic role played by active efflux in the
background for conferring clinically significant resistance in the presence of other resistance
mechanisms (Chen et al., 2007).
1.3.5 Efflux Inhibitors
With the dwindling number of efficacious antibiotics against severe infections, search has
been initiated for other treatment options. One of these is compounds which are able to
potentiate the activity of currently available antibiotics (Fernebro, 2011). As efflux pump
confers resistance to a broad spectrum of structurally distinct antibiotic classes and are in
certain cases a pre-requisite for antibiotic resistance related mutations, studies are underway
26
to develop inhibitors for this particular resistance mechanism (Ricci et al., 2006, Van
Bambeke et al., 2006).
An ideal efflux inhibitor (EI) will have to possess one or more characteristics which
includes being inactive against eukaryotic cells, inexpensive to manufacture, stable against
proteolysis, high specificity and efficacy towards targets, and low toxicity to human
(Bhardwaj and Mohanty, 2012). Various strategies of efflux inhibition can or have been
explored, such as newer antibiotic molecules which are less susceptible to efflux (e.g.
tigecycline); blockage of substrate binding site (e.g. PAβN); allosteric site modulators of
efflux pump which affects the conformation of the substrate binding sites; un-coupler of
efflux pump’s energy source; blockers for outer membrane protein found in Gram-negative
bacteria which is an important channel for antibiotics to exit the bacterial cell membrane;
inhibitors which affects the assembly of efflux pumps; and inhibitors which reduce or abolish
expression of the efflux pumps (Poole and Lomovskaya, 2006).
Through a screening of synthetic compound and fermentation extract using P.
aeruginosa overexpressing various efflux pumps, a peptide-like compound (peptidomimetic)
known as PAβN (previously, MC-207,110) which acts as an EI against Mex family of efflux
pumps was discovered (Renau et al., 1999). This inhibitor was further examined for its
activity as an EI (Lomovskaya et al., 2001). Lomovskaya et al. (2001) showed that PAβN
fulfilled many of the criteria set to be an ideal inhibitor. PAβN showed no significant
antibacterial activity but significantly decreased the MIC values for levofloxacin of P.
aeruginosa overexpressing various efflux pumps. Moreover, the EI successfully decreased
spontaneous mutant selections in wildtype P. aeruginosa similar to the level observed when
efflux pumps were deleted from the bacterium (10-7 to <10-11 cfu/ml) (Lomovskaya et al.,

27
1999, Lomovskaya et al., 2001). Further studies of structurally similar peptidomimetic
compounds also yielded similar inhibition activity (Renau et al., 2002).
1.4 Spread and Acquisition of Antibiotic Resistance
The development of antibiotic resistant bacteria can occur through two ways, i.e. spontaneous
mutation or lateral gene transfer (LGT) (MacLean et al., 2010). For bacteria which are
intrinsically resistant to many antibiotics, such as P. aeruginosa, these mechanisms can
increase the resistant levels to the antibiotics, in addition to acquisition of new resistance
phenotypes (Nicas and Hancock, 1983, Sacha et al., 2008). On the other hand, spontaneous
chromosomal mutations have been associated with resistance to various β-lactam antibiotics
due to increase of AmpC β-lactamase activity (Raimondi et al., 2001), inhibition of antibiotic
target affinity via target alteration (Katayama et al., 2004, Sreevatsan et al., 1996) and
decreased antibiotic accumulation due to regulatory mutations that alter porin production and
increase efflux activity (Yoneyama and Nakae, 1993, Chuanchuen et al., 2001).
1.4.1 Lateral Gene Transfer (LGT) in Dissemination of Antibiotic Resistance
While spontaneous mutation confers resistance to a particular bacterium and its progeny by
cell division, LGT allows acquisition and dissemination of antibiotic resistance genes from
and to other bacteria via transfer of genetic material (Mitsuhashi et al., 1967). The three
mechanisms, whereby LGT occurs are: transformation which involves the uptake and
subsequent incorporation of naked DNA from the environment into the genome of a
competent host cell; transduction, in which the DNA from a bacterium is packaged into a
bacteriophage and transferred into a recipient cell during infection by the bacteriophage; and
conjugation which requires cell-to-cell contact for the transfer of genetic material from the
donor to the recipient cell (Davison, 1999). An alternative pathway involving genetic material
enclosed in membrane vesicles has also been described (Yaron et al., 2000). Such membrane
28
vesicles have been shown to be produced by E. coli, N. gonorrhoeae, P. aeruginosa and
Acinetobacter baumannii (Pérez-Cruz et al., 2015, Yaron et al., 2000). These vesicles contain
chromosomal DNA, plasmid and various proteins (Pérez-Cruz et al., 2015, Yaron et al., 2000).
These membrane vesicles have been shown to be able to successfully transfer virulence and
antibiotic resistance genes that are then expressed in the recipient cells (Yaron et al., 2000).
However, the importance of such membrane vesicles and the mechanisms involving the
packaging of the DNA in the vesicles remain unclear.
Although transformation is a very common methodology used in molecular biology
research to confer a detectable trait in artificially competent host cells, this process also occur
in the natural environment among naturally competent bacteria (Lorenz and Wackernagel,
1994). In the natural environment, DNA is released to the surrounding environment by
excretion from viable cells and cellular lysis (Lorenz et al., 1991, Sinha and Iyer, 1971). Even
though DNA is prone to degradation by nucleases, DNA adsorbed on to groundwater aquifer
material is 1000 times more resistant to DNase I. This suggest that extracellular DNA found
in the natural environment bound to mineral material containing inorganic precipitates and
organic matter can be readily available for natural transformation (Romanowski et al., 1993).
Acquired β-lactamase resistance via natural transformation has been demonstrated in Gram-
negative bacteria such as Helicobacter pylori and N. gonorrhoeae (Kwon et al., 2003, Ohnishi
et al., 2010).
Although evidence of transduction as a major method for antibiotic resistance
dissemination between Gram-negative bacteria is lacking, a few studies have shown the
occurrence of various β-lactamase genes in phage particles, suggesting the possibility of
bacteriophage as a reservoir for these resistance determinants in the natural environment
(Muniesa et al., 2004, Colomer-Lluch et al., 2011). As naked DNA is susceptible to

29
degradation in the natural environment, the organisation of DNA into a bacteriophage capsid
may be protective and allow transduction to be an efficient process for the spread of antibiotic
resistance genes (Colomer-Lluch et al., 2011). Some in vitro studies have also supported this
notion where transduction carried out with bacteria such as P. aeruginosa and S.
Typhimurium conferred antibiotic resistance to recipient cells (Schmieger and Schicklmaier,
1999, Blahová et al., 1999).
In conjugation, genetic material is transferred from the donor to the recipient cell,
either as a conjugative plasmid, which is able to effect its own transmission between cells; or
a mobilisable plasmid, which is non-self-transmissible but can be transferred to the recipient
cell with the help of a conjugative plasmid; or via a conjugative transposon (Clewell et al.,
1995, Davison, 1999). Plasmids are self-replicating covalently closed circular double-stranded
extrachromosomal DNA molecules (Actis et al., 1999). Although not usually essential for the
survival of host bacteria, plasmids can confer beneficial traits to its host, such as resistance to
antimicrobial compounds, hence of benefit in terms of survival in a particular ecological niche
(Foster, 1983). Similar to plasmids, conjugative transposons also play an important role in the
carriage and dissemination of antibiotic resistance genes either by their own mobilisation or
by effecting the transmission of non-conjugative plasmids (Clewell et al., 1995).
1.5 Plasmid-mediated Antibiotic Resistance
A study on Enterobacteriaceae found in the cultures collected by E.D.G Murray from 1917 to
1954 was carried out to compare the conjugative plasmids present during the ‘pre-antibiotic’
era and the period after introduction of antibiotics, which is believed to be the driving force
for dissemination and proliferation of bacteria carrying plasmids with resistance determinants
(Anderson, 1965, Hughes and Datta, 1983). Hughes and Datta (1983) showed at least 19% of
the strains collected from various geographical locations, including Europe, Malta, India,

30
Northern Russia, the Middle East and North America, before the antibiotic era harboured
conjugative plasmids. Of note, none of these conjugative plasmids carried any antibiotic
resistance determinants (Hughes and Datta, 1983). By incompatibility (Inc) testing, most of
these conjugative plasmids were in the same Inc groups as modern resistance plasmids (Datta
and Hughes, 1983).
As conjugative plasmids were commonly found in Enterobacteriaceae during the ‘pre-
antibiotic’ era and these plasmids belong to the same groups as the resistance plasmids
observed after the usage of antibiotics, it is hypothesised that the modern resistance plasmids
are of the same lineages as the former and were derived via the acquisition of resistance
determinants by existing vectors and not simply by the selection of rare resistance plasmids
due to antibiotic usage. This finding also suggests plasmids have a high rate for acquisition
and dissemination of genes amongst bacteria (Datta and Hughes, 1983). The discovery of
antibiotic resistance genes being at least 30,000 years old further supports the possibility of
plasmids as a vehicle to acquire and spread antibiotic resistance determinant (D'Costa et al.,
2011).
1.5.1 The blaKPC-encoding pKpQIL Plasmid
The KPC enzyme was first detected in North Carolina in 1996 (Yigit et al., 2001). In the
following decade, this carbapenemase has successfully spread across most of the states in the
USA and across the globe (Arnold et al., 2011). In Israel, this enzyme was reported in 2005
and 2006, where 93% of the 46 carbapenem-resistant K. pneumoniae clinical isolates from
various sites of infection carried this enzyme (Leavitt et al., 2007). Most isolates were from
the same pulsotype determined by pulsed-field gel electrophoresis, designated as clone Q and
carried the blaKPC-3 gene. During the same period, a similar outbreak of carbapenem-resistant
K. pneumoniae carrying blaKPC-3 in patients from different clinical specialties was

31
documented in a nearby hospital (Samra et al., 2007). Clone Q was later found to be a hyper-
epidemic clone carrying a common plasmid causing a nationwide outbreak in Israel. This
clone was genetically related to the outbreak strains of K. pneumoniae isolated from the US
(Navon-Venezia et al., 2009). This clone was later determined as multilocus sequence type
(ST) 258 (Kitchel et al., 2009).
The common plasmid which was associated with carbapenem resistance of the K.
pneumoniae ST258 isolates in Israel was named pKpQIL (Leavitt et al., 2010b). The plasmid
was shown to be conjugative and harboured a blaTEM-1 and blaKPC-3 β-lactamase genes (Leavitt
et al., 2010b). Sequencing of the plasmid determined it to be a 113,637 bp IncFII-like plasmid
(Leavitt et al., 2010a). The majority of pKpQIL (86,610 bp) shares 99% identity with the
pKPN4 plasmid from multidrug-resistant K. pneumoniae MGH 78578 (ATCC 700721). The
blaKPC-3 gene is organised within the Tn4401 transposon as previously described (Naas et al.,
2008). The plasmid was stable without apparent changes during the two years of the outbreak
(Leavitt et al., 2010b). Recently, pKpQIL or its derivatives were detected in a majority of
Polish blaKPC-producing Klebsiella spp. clinical isolates (Baraniak et al., 2011). A pKpQIL-
like plasmid has also been found to be involved in hospital outbreak in Italy, Korea and Czech
(García-Fernández et al., 2012, Richter et al., 2012, Hrabák et al., 2013, Lee et al., 2014). A
recent study suggested that the pKpQIL plasmid may have originated from the US as similar
plasmids were identified from various Enterobacteriaceae isolated as early as 2003 (Chen et
al., 2014a, Tang et al., 2014). These suggest the possibility of the success of pKpQIL
plasmids across geographical borders since its isolation in the US and its stability as a
platform for the dissemination of blaKPC genes.

32
1.6 Factors Important in Plasmid Dissemination in Enterobacteriaceae
Although plasmid DNA can be transferred between bacterial cells via natural transformation
and transduction (Garzon et al., 1995, Chamier et al., 1993), conjugation is the major
mechanism of plasmid transfer (Barlow, 2009). Conjugation occurs in three steps: DNA
substrate processing, substrate recruitment and translocation of substrate to recipient cell
(Alvarez-Martinez and Christie, 2009). In conjugation, a nucleoprotein complex is formed
between a relaxase and other auxiliary proteins with the origin of transfer (oriT) sequence on
the plasmid DNA. This complex is termed the relaxosome and results in the nicking of the
supercoiled plasmid to produce a relaxed form. The relaxosome then translocates across the
conjugative pore into the recipient cell, where re-circularisation and establishment of the
plasmid occurs (Frost and Koraimann, 2010).
Plasmids such as those from the IncF group contain a transfer region encoding more
than 30 transfer (tra) genes, which play an important role in DNA metabolism, type IV
secretion system (T4SS) and regulation of the plasmid transfer potential (Frost and
Koraimann, 2010). There are eight core genes involved in regulation of conjugation (Table
1.1).
1.6.1 Plasmid Stability and Segregation
In the presence of a selective pressure such as antibiotics, plasmid-harbouring cells which
possess the beneficial trait such as resistance to the antibiotic would survive in the population.
However, in the absence of the selective pressure, the plasmid may incur a metabolic burden
on its host cell (Jakobsen et al., 2006, Loftie-Eaton and Rawlings, 2010). In order to avoid
itself from being lost when the host cells are actively dividing, plasmids have acquired
properties such as toxin-anti-toxin systems and active segregation machineries to allow
plasmid persistence in the host (Engelberg-Kulka and Glaser, 1999, Greenfield et al., 2000).

33
Table 1.1 Function of genes involved in conjugation
Gene Function traM Processing of DNA for transfer
Regulation of its own promoter, Pm
traJ Activator of tra gene expression Activates Py
traY Processing of DNA prior to transfer Regulation of its own promoter, Py and activates Pm
finP Antisense RNA inhibitor of TraJ
finO Stabilises FinP to avoid degradation by RNase E
hfq Promotes TraJ degradation, hence reducing transfer potential
arcA May be involved in activation of Py ArcAB represses succinate dehydrogenase (sdhABCD)
sdhABCD May be involved in reduction of transfer potential by regulation of TraJ
Adapted from Frost and Koraimann (2010). The tra locus of a conjugative plasmids may contain about 30 genes which are involved in the conjugation process. Eight genes which play the core regulative functions of conjugation are listed in the table.

34
Plasmid encoded toxin-anti-toxin systems play a role in postsegregational killing. In
the presence of the plasmid, both the stable toxin and labile anti-toxin are produced. When the
plasmid is lost, the host bacterium is unable to survive as there is no production of the labile
anti-toxin to inhibit the effects of the more stable toxin still present in the cell. This ensures
the permanent linkage between survival of the host cell with the presence of the plasmid
(Yamaguchi and Inouye, 2011). Disruption of the interaction between the toxin and anti-toxin
therefore eliminates the plasmid by killing the cell (Lioy et al., 2010).
Although high-copy number plasmids may stably propagate by random segregation
during cell division, low-copy number plasmids require an active partitioning system to
ensure each daughter cell carries at least one copy of the plasmid. Most of the active
partitioning systems are comprised of three components, i.e. ParA (a nucleotide-binding
motor element), ParB (a DNA-binding adaptor protein), and a centromere-like region. In
general, the ParB protein binds to the centromere-like region to form a nucleoprotein complex,
which then interacts with the ParA motor element to allow the active partitioning of the
plasmid at the opposite pole of the cell to ensure the persistence of the plasmid in each
daughter cell after cell division (Ghosh et al., 2006, Salje, 2010).
1.6.2 Inhibition of Plasmid Transfer
Due to their importance in dissemination of antibiotic resistance, plasmids have been targeted
by strategies designed to prevent the spread of plasmid DNA (Williams and Hergenrother,
2008).
An in vitro study has shown that targeting F plasmid relaxase, the enzyme important
for the formation of the relaxosome which allows the translocation of plasmid into the
recipient cell, inhibits conjugation and selectively kills bacteria harbouring the conjugative
plasmids through an unknown mechanism (Lujan et al., 2007). The authors showed that the
35
inhibition of relaxase was achieved using bisphosphonates, etidronate and clodronate, which
are clinically approved for bone loss treatment. The results suggest an opportunity for the
combination therapy between the bisphosphonates with antibiotics for the treatment of
bacterial infections (Lujan et al., 2007). However, this hypothesis has yet to be investigated in
vitro.
Plasmid incompatibility has also been exploited as a possible mechanism for the
elimination of specific plasmids as those with the same incompatibility group cannot stably
co-segregate into the daughter cells (Novick, 1987). The replication of IncB plasmids is
regulated by the RepA protein which in turn is regulated by RNA I (Thomas et al., 2005).
Screening of various aminoglycosides found apramycin to mimic the function of RNA I, by
inhibiting the translation of RepA protein, which in turn inhibits plasmid replication and
subsequently resulting in plasmid elimination and increased susceptibility of the host cell to
antibiotics (Thomas et al., 2005, DeNap et al., 2004).
1.7 Plasmid-mediated Antibiotic Resistance and Fitness
A study competing plasmid RSF2124-carrying E. coli against plasmid-free E. coli without
antibiotic showed an initial decrease in fitness of the plasmid-carrying strain (Helling et al.,
1981). However, after 18 generations of growth, it was found that the plasmid-carrying strain
possess a better fitness relative to the plasmid-free strain. When the evolved plasmid after 18
generation was introduced into the initial plasmid-free E. coli, no fitness advantage was
observed. Hence, the authors concluded that adaptive changes in the host chromosome
conferred the fitness advantage after a certain number of generations of growth (Helling et al.,
1981).
A similar study also compared the fitness of plasmid-carrying and plasmid-free E. coli
(Bouma and Lenski, 1988). The authors showed that E. coli carrying the pACYC184 plasmid

36
which encodes resistance determinants for chloramphenicol and tetracycline possessed a
higher fitness cost compared to the plasmid-free strain. Interestingly, after the E. coli carrying
the plasmid was grown for 500 generation (75 days) in the presence of chloramphenicol, the
evolved host (H500) carrying the ancestral plasmid (H500P0) showed significant increase in
fitness compared to plasmid-free host (H500) in the absence of antibiotic. This study also
suggested the adaptive changes were found only on the host chromosome (Bouma and Lenski,
1988).
Further investigation was pursued to identify the determinants on the plasmid
pACYC148 which resulted in the fitness cost of the naive host (H0) and the resulting fitness
benefit of the pACYC148 coevolved host (H500) (Lenski et al., 1994). By constructing various
deletions on the pACYC148 plasmid, the authors were able to show that the chloramphenicol
resistance gene was responsible for the fitness cost incurred on the naive host. As the evolved
host carrying the plasmid devoid of the chloramphenicol resistance still possesses a fitness
advantage against plasmid-free evolved host, this suggested the chloramphenicol resistance
gene was not involved in the fitness advantage observed. When the tetracycline resistance
cassette was deleted, it was found that this function had a major role in the fitness advantage
observed in the coevolved host as the coevolved host carrying this plasmid had a fitness cost.
However, the importance of the tetracycline resistance gene in the evolution which
ameliorates the fitness cost is unclear (Lenski et al., 1994).
In contrast to the above experiments which were using non-conjugative laboratory
plasmids, similar study was conducted on natural conjugative plasmids (ca.100 kb plasmid R1
and ca. 60 kb plasmid RP4) in E. coli to assess the fitness impact of natural conjugative
plasmids on their host (Dahlberg and Chao, 2003). Serial propagation of the plasmids with
their host over a period of 166 days (ca. 1100 generation), showed the initial fitness cost
37
exhibited by the plasmid-carrying host was reduced significantly at the end of the study.
Unlike the previous studies (Bouma and Lenski, 1988, Lenski et al., 1994), the compensatory
adaptation was suggested to be in both the chromosome and plasmids. Although the
chromosomal compensatory mutation was not determined, but the changes in the plasmids
which led to a lower fitness cost were found to be deletions of loci associated with plasmid
transfer function and antibiotic resistance (Dahlberg and Chao, 2003). Under the conditions
tested, this study also found that the host which evolved in the absence of the plasmid was
able to reduce the cost of the plasmids introduced into it. This suggests that the fitness cost
alleviating adaptation which occurred in the host was also in part due to its own response to
its growth conditions (Dahlberg and Chao, 2003).
1.8 Background to This Project
1.8.1 Plasmid pCT
An IncK plasmid carrying a single blaCTX-M-14 ESBL gene was isolated from scouring
(diarrhoea) cattle in the UK (Liebana et al., 2006). The pCT plasmid and pCT-like plasmids
have since been detected in human clinical isolates from the UK, Spain, Australia and China
(Cottell et al., 2011, Dhanji et al., 2012). Previous study of the pCT plasmid by inactivation of
the blaCTX-M-14 ESBL gene found that it carries no fitness benefit or cost on its host in the
presence or absence of antibiotic selection pressure (Cottell et al., 2012). Inactivation of
various genes on the pCT plasmid also found no significant effect on the maintenance of the
plasmid in the bacterial cell or in a bacterial population when compared to the wildtype
plasmid (Cottell et al., 2014). This finding challenges the dogma which relates the persistence
of antibiotic resistance gene carrying plasmids to antibiotic selective pressure (Anderson,
1965).

38
1.8.2 Plasmid pKpQIL-UK & pKpQIL-D2
Carbapenemase-producing Enterobacteriaceae was first isolated in the UK in 2003. However,
it was not until 2008 that a drastic increase in the number of annually reported
carbapenemase-producing isolates was observed. Until the second quarter of 2011, the
dominant carbapenemase, i.e. blaKPC accounted for 384 (58%) of 657 carbapenemase-
producing Enterobacteriaceae isolates reported since 2003. Although the KPC enzymes have
spread within some UK hospitals, this carbapenemase has been a problem particularly in the
North Western (NW) region of England (HPA, 2011).
A study by Public Health England on 17 blaKPC-harbouring clinical isolates referred
by various referral centres in the NW England region showed that 14 of the isolates carried
the plasmid pKpQIL and its variant (Figure 1.6), with the remaining three isolates
undetermined (Table 1.2). Most of the isolates were K. pneumoniae with the rest being other
species of the Enterobacteriaceae family. Sequence analyses showed that most of the plasmids
were similar to the one reported in Israel (henceforth, termed pKpQIL-UK). Five from the 14
isolates harboured a derivative plasmid of pKpQIL-UK (Table 1.2). One derivative, named
pKpQIL-D1 carries a new ca. 19 kb DNA segment which replaces the original ca. 11 kb
segment beginning from the truncated blaOXA-9 to the vagC gene in the pKpQIL-UK (Figure
1.7). Another derivative, named pKpQIL-D2 had a ca. 20 kb DNA segment between vagC
and stbA of the pKpQIL-UK substituted with a new ca. 16 kb DNA segment (Figure 1.8).
While most pKpQIL-UK plasmids were found in K. pneumoniae ST258, its derivative, i.e.
pKpQIL-D2 was found in other Enterobacteriaceae species and sequence types of K.
pneumoniae. It is possible the substitution with the new ca. 16 kb DNA segment has provided
the variant plasmid with the ability to better disseminate across the species barrier.

39
Figure 1.6 Alignment of plasmid pKpQIL-UK and variants
The diagram was generated using Blast Ring Image Generator. It shows the plasmid alignments of pKpQIL-UK with pKpQIL-D2, pKpQIL-D1 and pSLMT. From the inner most ring, (1) Size of the plasmid, (2) GC content of the sequence, (3) pKpQIL-UK (red), (4) pKpQIL-D2 (purple), (5) pKpQIL-D1 (yellow), (6) pSLMT (orange) and (7) plasmid genes of pKpQIL-UK (black) (Source: Woodford, N. Public Health England).

Table 1.2 Distribution of pKpQIL-UK and variants from medical centres in North Western England Region
Isolates Species ST-type Centre blaKPC Inc_type Plasmid Name
T4 K. pneumoniae 258 Centre_6 2 FIIK2 pKpQIL-UK
T6 K. pneumoniae 258 Centre_2 3 FIIK2 pKpQIL-UK
T8 K. pneumoniae 258 Centre_7 2 FIIK2 pKpQIL-UK
T11 K. pneumoniae 258 Centre_8 2 FIIK5 ND
T13 K. pneumoniae 11 Centre_1 3 FIIK2 pKpQIL-UK
T19 K. pneumoniae 11 Centre_1 2 FIIK2 pKpQIL-D1
T27 K. pneumoniae 258 Centre_5 2 FIIK2 pKpQIL-UK
L16 K. pneumoniae 258 Centre_3 2 FIIK2 ND
L19 K. pneumoniae 258 Centre_1 2 FIIK2 pKpQIL-UK
L33 K. pneumoniae 468 Centre_3 2 FIIK2 pKpQIL-UK
L27 K. pneumoniae 321 Centre_1 2 FIIK2 pKpQIL-D2
L37 K. pneumoniae 491 Centre_1 2 FIIK2 ND
L38 K. pneumoniae 490 Centre_1 2 FIIK2 pKpQIL-D2
LENT Enterobacter spp. ND Centre_1 2 FIIK2 pKpQIL-D2
LESC E. coli ND Centre_1 2 FIIK2 pKpQIL-D2
I2 Escherichia coli ND Centre_4 2 FIIK2 pKpQIL-UK I1 K. pneumoniae ND Centre_4 2 FIIK2 pKpQIL-UK
ND: Not determined The pKpQIL-UK and -D2 plasmids used in this PhD study were from the clinical isolate L33 and L27, respectively. Source: Woodford, N. Public Health England
40

Figure 1.7 Comparison of the substitution fragment of pKpQIL-UK and -D1
pKpQIL-UK
pKpQIL-D1
The diagram shows the 11 kb region on pKpQIL-UK which has been substituted with a new 19 kb fragment to form the pKpQIL-D1 plasmid. The open reading frames (ORF) include genes encoding resistance (Red), transposable elements (Blue), plasmid replicon (Purple), genes with no significant homologies to infer functions (White) and other plasmid genes (Yellow). Hypothetical protein (White) had no significant hit when analysed with BlastP (to search for protein homology), PROSITE (to detect conserved protein motif) and PSORT (protein localisation predictor).
41

Figure 1.8 Comparison of the substitution fragment of pKpQIL-UK and -D2
pKpQIL-UK
pKpQIL-D2
The diagram shows the 20 kb region on pKpQIL-UK which has been substituted with a new 16 kb fragment to form the pKpQIL-D2 plasmid. The open reading frames (ORF) include genes encoding resistance (Red), transposable elements (Blue), plasmid replicon (Purple), genes with no significant homologies to infer functions (White) and other plasmid genes (Yellow). The fragment on pKpQIL-D2 (highlighted with brown bracket) shares 98% DNA sequence identity with pKPN5 plasmid from K. pneumoniae MGH78578. Hypothetical protein (White) had no significant hit when analysed with BlastP (to search for protein homology), PROSITE (to detect conserved protein motif) and PSORT (protein localisation predictor).
pKPN5
42
43
1.9 Hypotheses to be Investigated in This PhD Project
Although the use of antibiotics has a role in the dissemination of antibiotic resistance
plasmids, this may not account for the spread of all antibiotic resistance currently observed,
especially since conjugative plasmids without any resistance determinants were already
common among bacterial strains prior to the antibiotic era (Datta and Hughes, 1983, Hughes
and Datta, 1983). The blaKPC gene has been observed to be transmitted by the pKpQIL
plasmid in various countries around the world. The emergence of pKpQIL-D2 in the UK
along with the original pKpQIL-UK plasmid warrants further investigation on both of these
plasmids. The hypotheses to be investigated in this project are as follow:
i) The ca. 16 kb substitution region in pKpQIL-D2 confers a fitness benefit to the
plasmid and/or plasmid-carrying host when compared to pKpQIL-UK.
ii) A functional AcrAB-TolC efflux pump is required to confer carbapenemase-
producing bacteria with high carbapenem resistance.
1.10 Aims & Objectives
The objective of the research was to investigate plasmid mediated carbapenemase resistance
and identify the differences in effects caused by the two plasmids (pKpQIL-UK and pKpQIL-
D2) on the host. The specific aims were:
1. To evaluate the role of a functional AcrAB-TolC efflux pump in plasmid-
mediated carbapenem resistance.
2. To assess the fitness cost or benefit of pKpQIL-UK and -D2 on their hosts.
3. To identify the potential gene(s) involved in conferring the fitness cost or
benefit in the host.

44
CHAPTER TWO: METHODS
2.1 Bacterial Strains, Plasmids & Culture Conditions
Bacterial strains were routinely cultured in Luria Bertani (LB) agar (Sigma-Aldrich, Missouri,
USA, Catalogue No.: L2897) and LB broth (Sigma-Aldrich, Missouri, USA, Catalogue No.:
L3022) at 37°C. All bacterial cultures were stored on Protect Microorganisms Preservation
System Beads (Thermo Fisher Scientific, Massachusetts, USA, Catalogue No.: TS80) at -
80°C (Salmonella strains were kept at -20°C). When required, a Protect Bead was used to
streak the bacteria of interest on to LB agar to obtain single colonies. The culture was then
incubated overnight (12 – 16 hours) at 37°C. When liquid cultures were required, a single
colony was used to inoculate 10 ml LB broth and incubated at 37°C with shaking (200 rpm)
for 12 – 16 hours. Temperature for incubation was reduced to 30°C for temperature sensitive
strains and plasmids. When necessary, growth medium was supplemented with the relevant
antibiotics (Table 2.1). All experiments involving bacterial cultures were carried out
aseptically. The plasmids and bacterial strains used in this study are listed in Table 2.2 and
Table 2.3, respectively.
2.1.1 Bacterial Identification
In order to ensure the bacterial strains used in the study were correct, the strains were
frequently grown on differential and selective media such as Xylose-Lysine-Deoxycholate
(XLD) agar (Oxoid, Massachusetts, USA, Catalogue No.: CM0469) and MacConkey agar
(Oxoid, Thermo Fisher Scientific, Massachusetts, USA, Catalogue No.: CM0007). The
bacterial strains were differentiated by their morphological appearance on the differential agar
according to the manufacturer’s descriptions (Table 2.4). Gram staining (Sigma-Aldrich,
Missouri, USA, Catalogue No.: 77730) was also used as a rapid test to confirm the type of
bacteria as all the strains used in this study were Gram-negative bacteria. When a mutant

45
Table 2.1 List of antibiotics used in this study Antibiotic Supplier Catalogue No. Solvent
Ampicillin Calbiochem, Darmstadt, Germany
171254 Sterile water
Biapenem Sigma-Aldrich, Missouri, USA
SL0306 Sterile water
Cefotaxime Sigma-Aldrich, Missouri, USA
C7912 Sterile water
Ceftazidime Sigma-Aldrich, Missouri, USA
C3809 Sterile water
Cephalothin Sigma-Aldrich, Missouri, USA
C4520 Sterile water
Chloramphenicol Sigma-Aldrich, Missouri, USA
C0378 70% (v/v) ethanol in water
Doripenem Sigma-Aldrich, Missouri, USA
32138 Sterile water
Ertapenem MSD, New Jersey, USA FR3843 Sterile water
Erythromycin Sigma-Aldrich, Missouri, USA
E5389 70% (v/v) ethanol in water
Imipenem Sigma-Aldrich, Missouri, USA
I0160 Sterile water
Kanamycin Sigma-Aldrich, Missouri, USA
60615 Sterile water
Meropenem Sigma-Aldrich, Missouri, USA
M2574 Sterile water
Piperacillin Cambridge Bioscience, Cambridge, UK
P3462 100% DMSO
Rifampicin Sigma-Aldrich, Missouri, USA
R3501 100% DMSO
Tetracycline Sigma-Aldrich, Missouri, USA
T3383 70% (v/v) ethanol in water
DMSO: Dimethyl-sulfoxide (Sigma-Aldrich, Missouri, USA, Catalogue No.: D8418)

Table 2.2 Plasmids Plasmid Antibiotic
Resistance Gene
Description Source
pKpQIL-UK blaKPC-2 Plasmid pKpQIL [Leavitt et al. (2010)] which was isolated in the UK Woodford, N.
pKpQIL-UK blaKPC::aph Plasmid pKpQIL-UK with the inactivated blaKPC-2 carbapenemase This study
pKpQIL-D2 blaKPC-2 A variant of plasmid pKpQIL-UK Woodford, N.
pKpQIL-D2 blaKPC::aph Plasmid pKpQIL-D2 with the inactivated blaKPC-2 carbapenemase This study
pNDM-HK blaNDM-1 IncL/M plasmid isolated in Hong Kong carrying a blaNDM-1
carbapenemase gene Ho, et al. (2011)
pUC18 blaTEM-1 Cloning vector Norrander, et al. (1983)
pCT blaCTX-M-14 IncK plasmid encoding a blaCTX-M-14 isolated from scouring calves Teale, et al. (2005)
46

Table 2.3 Bacterial strains Strains Code Description Source
K. pneumoniae
K. pneumoniae ST468/pKpQIL-UK
ST468/pKpQIL-UK
Clinical isolate of K. pneumoniae ST468 carrying plasmid pKpQIL-UK, Dor0.25
Woodford, N.
K. pneumoniae ST321/pKpQIL-D2
ST321/pKpQIL-D2
Clinical isolate of K. pneumoniae ST321 carrying plasmid pKpQIL-D2, Dor0.25
Woodford, N.
K. pneumoniae ST258 ST258 Carbapenemase susceptible K. pneumoniae, Kan50 Kreiswirth, B.
ST258/pKpQIL-UK - ST258 transconjugants carrying pKpQIL-UK, Kan50 & Dor0.25 This study
ST258/pKpQIL-D2 - ST258 transconjugants carrying pKpQIL-D2, Kan50 & Dor0.25 This study
K. pneumoniae Ecl8 Ecl8 - Forage & Lin (1982)
Ecl8 acrAB::aph - Ecl8 which the efflux pump acrAB has been inactivated Veleba, et al. (2012)
Ecl8Rif - Rifampicin-resistant mutant of K. pneumoniae Ecl8, His537Leu, Rif100
This study
Ecl8 Rif acrAB - Rifampicin-resistant mutant of K. pneumoniae Ecl8 acrAB::aph, His537Leu, Rif100
This study
Ecl8Rif/pKpQIL-UK - Ecl8Rif transconjugants carrying pKpQIL-UK, Rif100 & Dor0.25 This study
Ecl8 Rif acrAB/pKpQIL-UK
- Ecl8 Rif acrAB transconjugants carrying pKpQIL-UK, Kan50 & Dor0.25
This study
Where necessary growth media were supplemented with Rif100 (100 µg/ml rifampicin), Kan50 (50 µg/ml kanamycin), Dor0.25 (0.25 µg/ml doripenem)
47

Table 2.3 Bacterial strains (Continued) Strains Code Description Source
K. pneumoniae
Ecl8Rif/pKpQIL-UK blaKPC::aph
- Ecl8Rif transconjugants carrying pKpQIL-UK blaKPC::aph, Rif100 & Kan50
This study
Ecl8Rif/pKpQIL-D2 - Ecl8Rif transconjugants carrying pKpQIL-D2, Rif100 & Dor0.25 This study
Ecl8Rif/pKpQIL-D2 blaKPC::aph
- Ecl8Rif transconjugants carrying pKpQIL-D2 blaKPC::aph, Rif100 & Kan50
This study
E. coli
E. coli SW105 - mcrA [mrr-hsdRMS-mcrBC] 80dlacZM15 lacX74 recA1 endA1 araD139 [ara, leu]7697 galU pgl8 rpsL nupG ʎ(cI857ind1) (cro-bioA) )<>araC-PBAD flpe8
Warming, S. et al. (2005)
E. coli NCTC 10418 10418 Control strain for antibiotic susceptibility testing National Collection of Type Cultures (NCTC)
10418Rif - Rifampicin-resistant 10418, Ser531Phe, Rif100 This study
10418Rif/pKpQIL-UK - E. coli 10418Rif transconjugant carrying pKpQIL-UK, Rif100 & Dor0.25 This study
10418Rif/pKpQIL-D2 - E. coli 10418Rif transconjugant carrying pKpQIL-D2, Rif100 & Dor0.25 This study
Where necessary growth media were supplemented with Rif100 (100 µg/ml rifampicin), Kan50 (50 µg/ml kanamycin), Dor0.25 (0.25 µg/ml doripenem) 48

Table 2.3 Bacterial strains (Continued) Strains Code Description Source
E. coli
E. coli BW25113 BW25113 Parental strain of Keio Collection Baba, T. et al. (2006)
BW25113 acrB::aph - BW25113 with inactivated acrB efflux pump gene, Kan50 Baba, T. et al. (2006)
BW25113 tolC::aph - BW25113 with inactivated tolC efflux pump gene, Kan50 Baba, T. et al. (2006)
BW25113Rif - Rifampicin-resistant BW25113, Pro574Leu, Rif100 & Kan50 This study
BW25113Rif acrB - Rifampicin-resistant BW25113 acrB::aph, Pro574Leu, Rif100 & Kan50
This study
BW25113Rif tolC - Rifampicin-resistant BW25113 tolC::aph, His526Tyr, Rif100 & Kan50
This study
BW25113Rif/pKpQIL-UK - BW25113 Rif transconjugant carrying pKpQIL-UK, Rif100 & Dor0.25
This study
BW25113Rif acrB/pKpQIL-UK - E. coli BW25113Rif acrB transconjugant carrying pKpQIL-UK, Kan50 & Dor0.25
This study
BW25113Rif tolC/pKpQIL-UK - E. coli BW25113C tolC transconjugant carrying pKpQIL-UK, Kan50 & Dor0.25
This study
Where necessary growth media were supplemented with Rif100 (100 µg/ml rifampicin), Kan50 (50 µg/ml kanamycin), Dor0.25 (0.25 µg/ml doripenem) 49
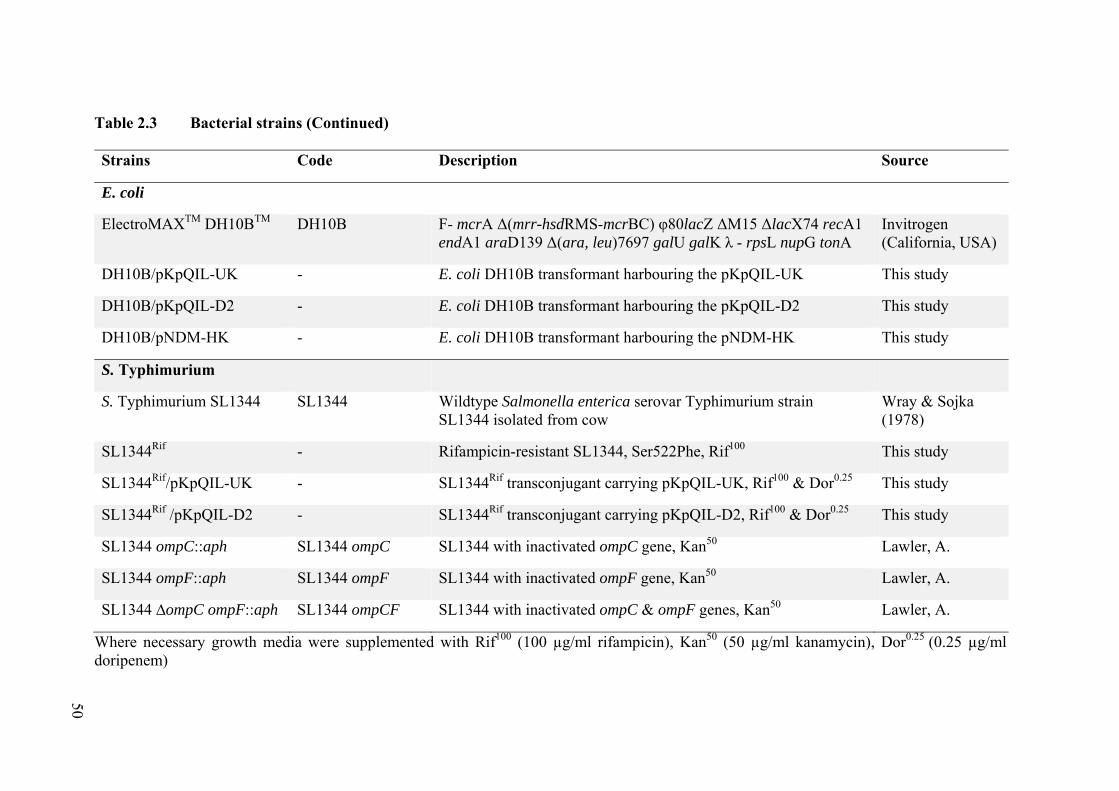
Table 2.3 Bacterial strains (Continued) Strains Code Description Source
E. coli
ElectroMAXTM DH10BTM DH10B F- mcrA Δ(mrr-hsdRMS-mcrBC) φ80lacZ ΔM15 ΔlacX74 recA1 endA1 araD139 Δ(ara, leu)7697 galU galK λ - rpsL nupG tonA
Invitrogen (California, USA)
DH10B/pKpQIL-UK - E. coli DH10B transformant harbouring the pKpQIL-UK This study
DH10B/pKpQIL-D2 - E. coli DH10B transformant harbouring the pKpQIL-D2 This study
DH10B/pNDM-HK - E. coli DH10B transformant harbouring the pNDM-HK This study
S. Typhimurium
S. Typhimurium SL1344 SL1344 Wildtype Salmonella enterica serovar Typhimurium strain SL1344 isolated from cow
Wray & Sojka (1978)
SL1344Rif - Rifampicin-resistant SL1344, Ser522Phe, Rif100 This study
SL1344Rif/pKpQIL-UK - SL1344Rif transconjugant carrying pKpQIL-UK, Rif100 & Dor0.25 This study
SL1344Rif /pKpQIL-D2 - SL1344Rif transconjugant carrying pKpQIL-D2, Rif100 & Dor0.25 This study
SL1344 ompC::aph SL1344 ompC SL1344 with inactivated ompC gene, Kan50 Lawler, A.
SL1344 ompF::aph SL1344 ompF SL1344 with inactivated ompF gene, Kan50 Lawler, A.
SL1344 ∆ompC ompF::aph SL1344 ompCF SL1344 with inactivated ompC & ompF genes, Kan50 Lawler, A.
Where necessary growth media were supplemented with Rif100 (100 µg/ml rifampicin), Kan50 (50 µg/ml kanamycin), Dor0.25 (0.25 µg/ml doripenem) 50

Table 2.3 Bacterial strains (Continued) Strains Code Description Source
S. Typhimurium
SL1344 ompC/pKpQIL-UK - SL1344 ompC transconjugant carrying pKpQIL-UK, Kan50 & Dor0.25 This study
SL1344 ompF/pKpQIL-UK - SL1344 ompF transconjugant carrying pKpQIL-UK, Kan50 & Dor0.25 This study
SL1344 ompCF/pKpQIL-UK
- SL1344 ompCF transconjugant carrying pKpQIL-UK, Kan50 & Dor0.25 This study
SL1344/pUC18 - SL1344 carrying pUC18 plasmid, Amp100 Blair, J.
SL1344 acrA::aph/pUC18 - SL1344 with inactivated acrA gene carrying pUC18 plasmid, Amp100 & Kan50
Blair, J.
SL1344 acrB::aph/pUC18 - SL1344 with inactivated acrB gene carrying pUC18 plasmid, Amp100 & Kan50
Blair, J.
SL1344 tolC::aph/pUC18 - SL1344 with inactivated tolC gene carrying pUC18 plasmid, Amp100 & Kan50
Blair, J.
S. Typhimurium ATCC 14028s
14028s Wildtype Salmonella enterica serovar Typhimurium strain ATCC14028s isolated from chicken
American Type Culture Collection
14028sRif - Rifampicin-resistant 14028s, Ser522Tyr , Rif100 This study
Where necessary growth media were supplemented with Rif100 (100 µg/ml rifampicin), Kan50 (50 µg/ml kanamycin), Dor0.25 (0.25 µg/ml doripenem), Amp100 (100 µg/ml ampicillin) 51

Table 2.3 Bacterial strains (Continued) Strains Code Description Source
S. Typhimurium
14028s acrAB::cat 14028s acrAB 14028s with inactivated acrAB efflux pump gene, Cm15 Nishino, et al. (2006)
14028s tolC::cat 14028s tolC 14028s with inactivated tolC efflux pump gene, Cm15 Nishino, et al. (2006)
14028sRif acrAB::cat - Transductant of 14028sRif with acrAB::cat, Rif100 & Cm15 This study
14028sRif tolC::cat - Transductant of 14028sRif with tolC::cat, Rif100 & Cm15 This study
14028sRif/pKpQIL-UK - 14028sRif transconjugant carrying pKpQIL-UK, Rif100 & Dor0.25 This study
14028sRif acrAB/pKpQIL-UK
- 14028sRif acrAB transconjugant carrying pKpQIL-UK, Cm15 & Dor0.25 This study
14028sRif tolC/pKpQIL-UK - 14028sRif tolC transconjugant carrying pKpQIL-UK, Cm15 & Dor0.25 This study
14028sRif /pKpQIL-D2 - 14028sRif transconjugant carrying pKpQIL-D2, Rif100 & Dor0.25 This study
14028sRif acrAB/pKpQIL- D2
- 14028sRif acrAB transconjugant carrying pKpQIL-D2, Cm15 & Dor0.25 This study
14028sRif tolC/pKpQIL- D2 - 14028sRif tolC transconjugant carrying pKpQIL-D2, Cm15 & Dor0.25 This study
Where necessary growth media were supplemented with Rif100 (100 µg/ml rifampicin), Dori0.25 (0.25 µg/ml doripenem), Amp100 (100 µg/ml ampicillin)
52

Table 2.3 Bacterial strains (Continued) Strains Code Description Source
S. Typhimurium
14028sRif /pNDM-HK - 14028sRif transconjugant carrying pNDM-HK, Rif100 & Dor0.25 This study
14028sRif acrAB/pNDM-HK - 14028sRif acrAB transconjugant carrying pNDM-HK, Cm15 & Dor0.25 This study
14028sRif tolC/pNDM-HK - 14028sRif tolC transconjugant carrying pNDM-HK, Cm15 & Dor0.25 This study
14028sRif/pCT - 14028sRif transconjugant carrying pCT, Rif100 & Ctx8 This study
14028sRif acrAB/pCT - 14028sRif acrAB transconjugant carrying pCT, Cm15 & Ctx8 This study
14028sRif tolC/pCT - 14028sRif tolC transconjugant carrying pCT, Cm15 & Ctx8 This study
14028sRif/pCT blaCTX::aph - 14028sRif transconjugant carrying pCT blaCTX::aph, Rif100 & Kan50 This study
14028sRif acrAB/pCT blaCTX::aph - 14028sRif acrAB transconjugant carrying pCT blaCTX::aph, Cm15 & Kan50
This study
14028sRif tolC/pCT blaCTX::aph - 14028sRif tolC transconjugant carrying pCT blaCTX::aph, Cm15 & Kan50 This study
Where necessary growth media were supplemented with Rif100 (100 µg/ml rifampicin), Kan50 (50 µg/ml kanamycin), Dor0.25 (0.25 µg/ml doripenem), Cm15 (15 µg/ml chloramphenicol), Ctx8 (8 µg/ml cefotaxime) 53

Table 2.3 Bacterial strains (Continued) Strains Code Description Source
E. cloacae
E. cloacae NCTC10005 Ecloacae E. cloacae isolated from cerebrospinal fluid NCTC
EcloacaeRif - Rifampicin-resistant E. cloacae, Ser328Ala, Rif100 This study
EcloacaeRif/pKpQIL-UK - EcloacaeRif transconjugant carrying pKpQIL-UK, Rif100 & Dor0.25 This study
EcloacaeRif/pKpQIL-D2 - EcloacaeRif transconjugant carrying pKpQIL-D2, Rif100 & Dor0.25 This study
S. marcescens
S. marcescens NCTC10211 Serratia S. marcescens isolated from pond water NCTC
SerratiaRif - Rifampicin-resistant S. marcescens, Asp516Gly, Rif100 This study
SerratiaRif/pKpQIL-UK - SerratiaRif transconjugant carrying pKpQIL-UK, Rif100 & Dor0.25 This study
SerratiaRif/pKpQIL-D2 - SerratiaRif transconjugant carrying pKpQIL-D2, Rif100 & Dor0.25 This study
Where necessary growth media were supplemented with Rif100 (100 µg/ml rifampicin), Dor0.25 (0.25 µg/ml doripenem)
54
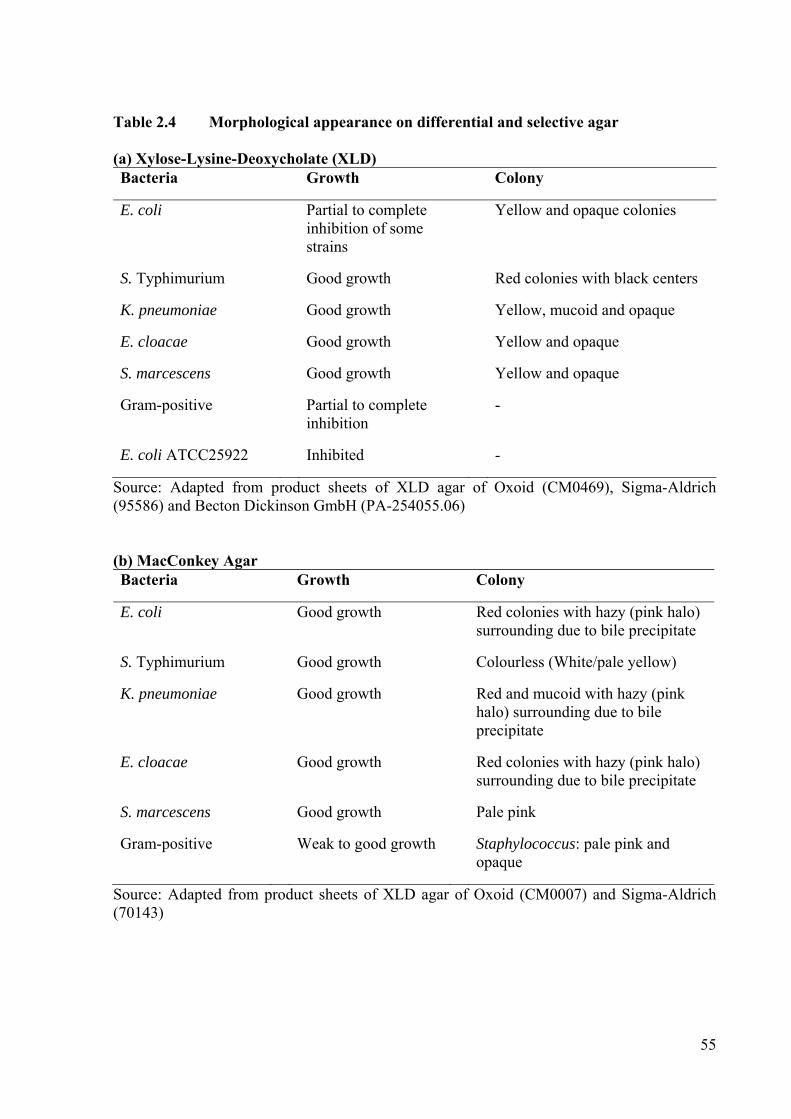
55
Table 2.4 Morphological appearance on differential and selective agar (a) Xylose-Lysine-Deoxycholate (XLD) Bacteria Growth Colony
E. coli Partial to complete inhibition of some strains
Yellow and opaque colonies
S. Typhimurium Good growth Red colonies with black centers
K. pneumoniae Good growth Yellow, mucoid and opaque
E. cloacae Good growth Yellow and opaque
S. marcescens Good growth Yellow and opaque
Gram-positive Partial to complete inhibition
-
E. coli ATCC25922 Inhibited -
Source: Adapted from product sheets of XLD agar of Oxoid (CM0469), Sigma-Aldrich (95586) and Becton Dickinson GmbH (PA-254055.06) (b) MacConkey Agar Bacteria Growth Colony
E. coli Good growth Red colonies with hazy (pink halo) surrounding due to bile precipitate
S. Typhimurium Good growth Colourless (White/pale yellow)
K. pneumoniae Good growth Red and mucoid with hazy (pink halo) surrounding due to bile precipitate
E. cloacae Good growth Red colonies with hazy (pink halo) surrounding due to bile precipitate
S. marcescens Good growth Pale pink
Gram-positive Weak to good growth Staphylococcus: pale pink and opaque
Source: Adapted from product sheets of XLD agar of Oxoid (CM0007) and Sigma-Aldrich (70143)

56
strain has been constructed, the strain was checked using API® 20E Gram-negative
Identification Strip (Biomérieux, France) according to manufacturer’s recommendation. This
strip is used to distinguish the different species of Enterobacteriaceae using results from a
panel of biochemical assays.
2.2 Plasmid Extraction
In order to extract plasmids, bacterial strains carrying the plasmids were inoculated into 10 ml
of LB broth supplemented with the necessary antibiotics. Cultures were then incubated
overnight at 37°C, with shaking at 200 rpm. Plasmids were extracted using the GeneJETTM
Plasmid Miniprep Kit (Fermentas, Ontario, Canada, Catalogue No.: K0503) according to
manufacturer’s instructions.
2.3 Polymerase Chain Reaction
The polymerase chain reaction (PCR) was used to routinely amplify various DNA targets
with MyTaqTM Red Mix (Bioline, London, UK, Catalogue No.: BIO-25044) according to the
manufacturer’s instructions.
The reactions used the following thermal cycling conditions:
Initial denaturation 95°C for 5 min
Cycling conditions (30 cycles)
i) Denaturation 95°C for 15 sec
ii) Annealing (Ta) 15 sec (Temperature used is primer dependent)
iii) Extension 72°C (10 sec per 1 kb)
Storage 4°C (Indefinite)

57
Where the amplicon was larger than 2 kb, a different polymerase, MyFiTM Mix
(Bioline, London, UK, Catalogue No.: BIO-25050) was used with the same thermal cycling
conditions with a modification in the extension time. The extension time using MyFiTM Mix
was estimated as 60 sec per 1 kb amplicon. All primers (Table 2.5) used in this study were
designed using Vector NTI AdvanceTM 11.5 (Life Technologies, USA).
2.4 DNA Gel Electrophoresis
Whenever DNA (plasmid or PCR amplicons) needed to be visualised, the DNA was separated
using electrophoresis in 1% (w/v) agarose gels (Sigma-Aldrich, Catalogue No.: A9539).
Midori Green nucleic acid stain (Labgene Scientific, Fribourg, Switzerland, Catalogue No.:
MG02) was added into molten agarose (ca. 60°C) to give a final concentration of 1X (Stock
concentration: 50,000X) before pouring the molten agarose into the electrophoresis gel tray.
The DNA sample mixed with loading buffer (1 μl of 5X buffer per 4 μl of sample) was
separated at 150 volts until the indicator dye has migrated 75% of the length of the gel. The
separated DNA was visualised and images captured using G:Box Gel Documentation System
(Syngene, Cambridge, UK).
2.5 DNA Sequencing
Where a nucleotide sequence was required, PCR amplicons were purified using the
QIAquick® PCR purification Kit (Qiagen, Maryland, USA, Catalogue No.: 28104) or
QIAquick® Gel Extraction Kit (Qiagen, Maryland, USA, Catalogue No.: 28704) according to
manufacturer’s instructions. The purified amplicons were quantified using the Qubit® dsDNA
HS Assay Kit (Life Technologies, USA, Catalogue No.: Q32854). Then, the sequencing
reaction was prepared as instructed by and sent to the Genomics Laboratory, School of
Biosciences, College of Life and Environmental Sciences, University of Birmingham. The

Table 2.5 Primers used in this study Primer Name Amplicon
(bp) Ta (°C) Sequence (5’ to 3’) Description Source
RpoB-F1 4482 56 ACACTGTTTGACTACTGCTGTGC To amplify S. Typhimurium
SL1344/ATCC14028s rpoB
This study
RpoB-R1 4482 56 CTCAGGTTTGAACGTACGGTAGT This study
RpoB-R2 - - GGCATTGCGGAAAGTGT For sequencing of S.
Typhimurium rpoB
This study
RpoB-F3 - - GCGAAGCCAGAGCAATT This study
RpoB-R3 - - TCGCCAATACCTTTCGCAG For sequencing of S.
Typhimurium rpoB
This study
RpoB-F4 - - ACGCCAAGCCGATTTCC This study
RpoB-F5 - - TTCCACGGCATGAACGC For sequencing of S.
Typhimurium rpoB
This study
RpoB-R4 - - ATGTGTGTCTCTGGGCGAG This study
RpoB-R5 - - AAACGCCGTATCCAGCC For sequencing of S.
Typhimurium rpoB
This study
RpoB-R2 - - TGAGGCATCAGGGTATCCA This study
RpoB-Ecoli-F1 4288 56 GGCATTGCGGAAAGTGT To amplify E. coli rpoB This study
RpoB-Ecoli-R1 4288 56 GCGAAGCCAGAGCAATT This study
RpoB-Ecoli-F2 - - CGCATCTTTTGACATCGA For sequencing of E. coli rpoB This study
RpoB-Ecoli-R2 - - GTAAGGCATATCTTCGATCG This study
RpoB-Ecoli-F3 - - ACGCACAAACGTCGTATC For sequencing of E. coli rpoB This study
RpoB-Ecoli-R3 - - GTTGTAACCATTCCACGG This study
Ta: Annealing temperature
58
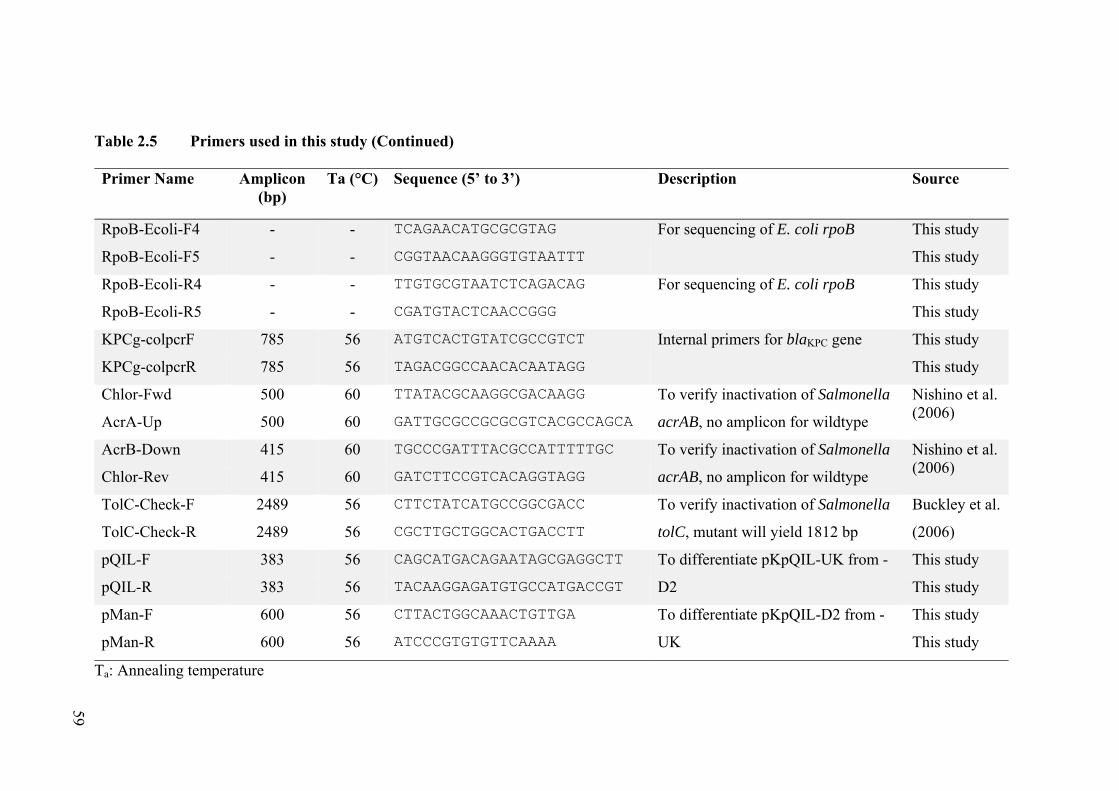
Table 2.5 Primers used in this study (Continued) Primer Name Amplicon
(bp) Ta (°C) Sequence (5’ to 3’) Description Source
RpoB-Ecoli-F4 - - TCAGAACATGCGCGTAG For sequencing of E. coli rpoB This study
RpoB-Ecoli-F5 - - CGGTAACAAGGGTGTAATTT This study
RpoB-Ecoli-R4 - - TTGTGCGTAATCTCAGACAG For sequencing of E. coli rpoB This study
RpoB-Ecoli-R5 - - CGATGTACTCAACCGGG This study
KPCg-colpcrF 785 56 ATGTCACTGTATCGCCGTCT Internal primers for blaKPC gene This study
KPCg-colpcrR 785 56 TAGACGGCCAACACAATAGG This study
Chlor-Fwd 500 60 TTATACGCAAGGCGACAAGG To verify inactivation of Salmonella
acrAB, no amplicon for wildtype
Nishino et al. (2006)
AcrA-Up 500 60 GATTGCGCCGCGCGTCACGCCAGCA
AcrB-Down 415 60 TGCCCGATTTACGCCATTTTTGC To verify inactivation of Salmonella
acrAB, no amplicon for wildtype
Nishino et al. (2006)
Chlor-Rev 415 60 GATCTTCCGTCACAGGTAGG
TolC-Check-F 2489 56 CTTCTATCATGCCGGCGACC To verify inactivation of Salmonella
tolC, mutant will yield 1812 bp
Buckley et al.
(2006) TolC-Check-R 2489 56 CGCTTGCTGGCACTGACCTT
pQIL-F 383 56 CAGCATGACAGAATAGCGAGGCTT To differentiate pKpQIL-UK from -
D2
This study
pQIL-R 383 56 TACAAGGAGATGTGCCATGACCGT This study
pMan-F 600 56 CTTACTGGCAAACTGTTGA To differentiate pKpQIL-D2 from -
UK
This study
pMan-R 600 56 ATCCCGTGTGTTCAAAA This study
Ta: Annealing temperature
59

Table 2.5 Primers used in this study (Continued) Primer Name Amplicon
(bp) Ta (°C) Sequence (5’ to 3’) Description Source
NDM1-colpcrF 578 56 TTGATGCTGAGCGGGTG To verify the presence of blaNDM
gene
This study
NDM1-colpcrR 578 56 CTGTCCTTGATCAGGCAGC This study
pHK-F 1407 56 TTTTCATCGCGTATGCTCCC To verify the presence of pNDM-HK
plasmid
This study
pHK-R 1407 56 AATACCGCTAAACCGCAACG This study
acrB fwd 3482 51 CGGATGACAAAGTGGAAACC To verify inactivation of E. coli
acrB, mutant would yield 1659 bp
Morris, F
acrB rvs 3482 51 CGTATGAGATCCTGAGTTGG Morris, F
tolC fwd 2131 51 CCGCGATAAAGTGTTTCTCG To verify inactivation of E. coli tolC,
mutant would yield 1976 bp
Morris, F
tolC rvs 2131 51 TTCAGCGCATTGTTGTACGC Morris, F
OmpC-F 1927 53 TCGATACCAACCACGCTCAC To verify inactivation of ompC, 2207
bp (+aph), 753 bp (∆ompC)
Lawler, A
OmpC-R 1927 53 TCTTACGAACGGTGCAGCAG Lawler, A
OmpF-F 780 53 CCGTCAATGCCGAGATAGTT To verify inactivation of ompF, no
amplicon for wildtype
Lawler, A
OmpF-R 780 53 CAGTCATAGCCGAATAGCCT Lawler, A
gyrB-F 273 45 GTACCTGGTGGAAGGGGACT To check for DNA contamination in
RNA samples
Blair, J
gyrB-R 273 45 AACAGCAGCGTACGGATG Blair, J
KpQIL-KPC-F 1580 56 AGCTACCGCTTGAAGGACAA To sequence the entire blaKPC gene This study
KpQIL-KPC-R 1580 56 GGATTGCGTCAGTTCAGCAT This study
Ta: Annealing temperature
60
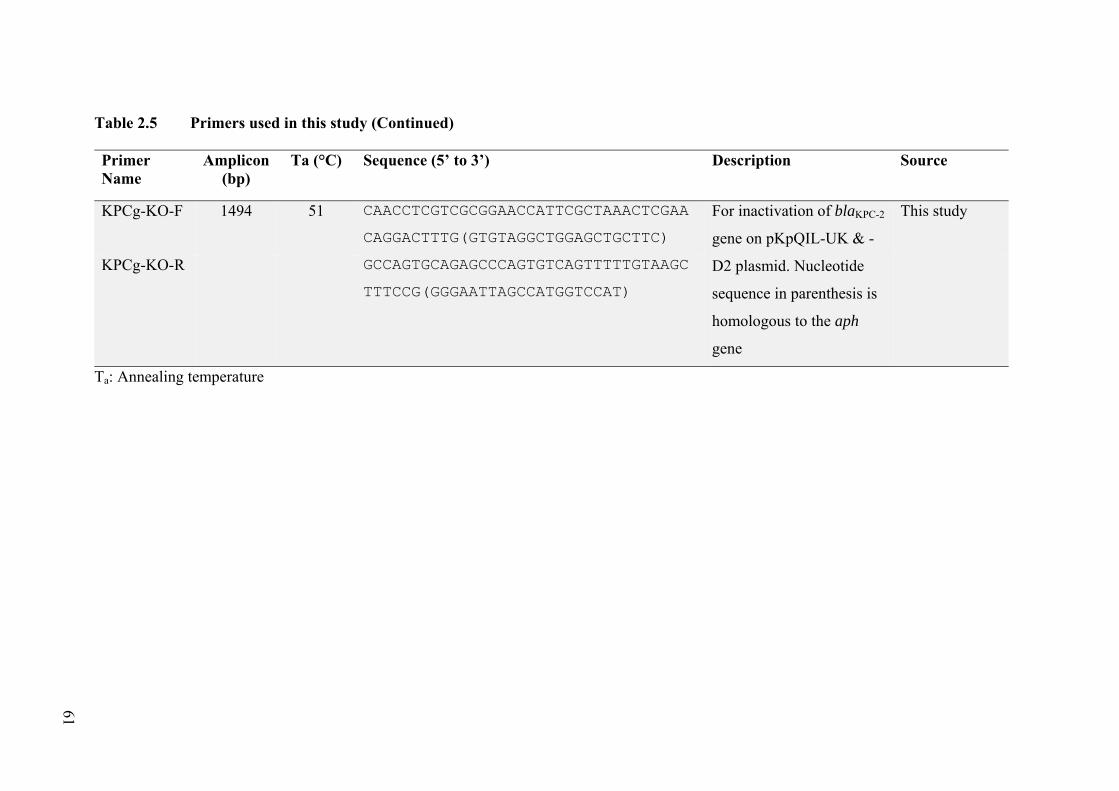
Table 2.5 Primers used in this study (Continued) Primer Name
Amplicon (bp)
Ta (°C) Sequence (5’ to 3’) Description Source
KPCg-KO-F 1494 51 CAACCTCGTCGCGGAACCATTCGCTAAACTCGAA
CAGGACTTTG(GTGTAGGCTGGAGCTGCTTC)
For inactivation of blaKPC-2
gene on pKpQIL-UK & -
D2 plasmid. Nucleotide
sequence in parenthesis is
homologous to the aph
gene
This study
KPCg-KO-R GCCAGTGCAGAGCCCAGTGTCAGTTTTTGTAAGC
TTTCCG(GGGAATTAGCCATGGTCCAT)
Ta: Annealing temperature
61

62
sequencing services provided used BigDye terminator chemistry. The obtained nucleotide
sequence was analysed using Vector NTI AdvanceTM 11.5 (Life Technologies, USA).
2.6 Insertional Inactivation of Plasmidic Genes
The method used to inactivate plasmidic genes by insertion of an antibiotic resistance marker
in the target gene and was done as previously described (Sharan et al., 2009, Cottell et al.,
2014, Cottell et al., 2012) with some modifications as listed below.
2.6.1 Primer design
The primers used to amplify the aminoglycoside phosphotransferase (aph) or
chloramphenicol acetyltransferase (cat) antibiotic resistance marker conferring kanamycin
and chloramphenicol resistance, respectively, consisted of 40 bp of sequence homologous to
the target plasmid gene either side of 20 bp of sequence homologous to the antibiotic
resistance marker i.e. aph or cat gene.
2.6.2 Electrocompetent Cell Preparation and Electroporation
Where plasmids needed to be transferred into E. coli SW105 which contained a
chromosomally encoded λ-Red recombinase gene for inactivating plasmidic genes (Warming
et al., 2005), electrocompetent cells were prepared by inoculating an overnight culture of the
bacteria into 50 ml fresh LB broth at a 1:50 dilution and incubated at 30°C (to avoid
expression of the recombinase genes) with shaking at 200 rpm. When the culture achieved
mid-logarithmic phase i.e. an optical density at a wavelength of 600 nm (OD600) of
approximately 0.6, the culture was chilled in ice slurry for 15 min. Then, the culture was
centrifuged at 4°C, 2,500 x g, 15 min. The cell pellet was resuspended in 50 ml of sterile 15%
(v/v) ice-cold glycerol (Sigma-Aldrich, Missouri, USA, Catalogue No.: G5516), followed by
centrifugation at 4°C, 2,500 x g, 15 min. This washing step was repeated twice and the cell
pellet was resuspended in 100 µl ice-cold 15% glycerol. A volume of 50 µl of

63
electrocompetent cells was used for each electroporation. About 20 – 100 ng plasmid DNA
was mixed with the electrocompetent cells and the cell suspension was left on ice for 15 min.
The electroporation parameters used were 13 kV/cm, 25 µF, 200 Ω and 5 ms. Immediately
after electroporation, 1 ml of pre-warmed (30°C) LB broth was added to the cells and mixed
gently by pipetting. The transformants were recovered at 30°C with shaking at 200 rpm for 3
hours. Then, 100 µl of the transformants were spread on the surface of LB agar supplemented
with appropriate antibiotics (Table 2.2) and incubated overnight at 30°C. The transformants
were verified by PCR to carry the plasmid of interest.
2.6.3 Gene Inactivation by Homologous Recombination
Plasmids harbouring target genes were transferred into E. coli SW105 (Warming et al., 2005)
by electroporation (Section 2.6.2). The amplicons generated using the chimeric primers were
purified by the QIAquick® PCR Purification Kit or QIAquick® Gel Extraction Kit. Two 50 ml
LB broths were inoculated with overnight cultures of E. coli SW105 carrying the plasmid of
interest at a dilution of 1 in 50 and were allowed to grow at 30°C until an OD600 of 0.6. One
of the cultures was then incubated at 42°C with shaking for 15 min to activate the λ-Red
Recombinase. The other culture was left at 30°C as the non-activated control. After the
incubation, both cultures were immediately cooled in ice-slurry for 15 min. The cells were
made electrocompetent and electroporation was also done as in Section 2.6.2. The amplicons
were electroporated into E. coli SW105 carrying the plasmid of interest. Depending on the
resistance cassette use for gene inactivation, the transformants were selected on LB agar
supplemented with 50 µg/ml kanamycin or 25 µg/ml chloramphenicol. Successful
inactivation of the target gene was further verified by PCR and sequencing using appropriate
primers (Table 2.5). The recombinant plasmid was then extracted and transferred into
64
Invitrogen MegaX DH10BTM T1R ElectrocompTM cells (Invitrogen, California, USA,
Catalogue No.: C6400-03) by electroporation following manufacturer’s instructions.
2.7 β-lactamase Assay
β-lactamase activity was studied by measuring the hydrolysis of nitrocefin evident as a colour
change. An overnight culture was diluted 1 in 50 in 100 ml of fresh LB broth and allowed to
grow until an OD600 of 0.6 at 37°C with shaking (200 rpm). The culture was centrifuged at
2,500 x g for 10 min at 4°C. The cell pellet was resuspended in 3 ml of ice-cold sodium
phosphate buffer pH 7.0. The cell suspension was sonicated in ice slurry (Soniprep 150, MSE,
UK) at an amplitude of 5 micron for 30 seconds four times with 30-second intervals to avoid
overheating of the cell lysates. The cell lysate was centrifuged at 12,000 x g for 10 min at 4°C.
The supernatant which contains the β-lactamase was transferred into a new microfuge tube.
The amount of total protein was determined using the Bradford Reagent (Sigma-Aldrich,
Missouri, USA, Catalogue No.: B6916) by mixing 10 μl of the samples with 990 μl of the
reagent and measuring the absorbance at a wavelength of 595 nm. The values were compared
against a series of bovine serum albumin (Sigma-Aldrich, Missouri, USA, Catalogue No.:
P0914) of known concentrations (0.05 – 0.5 mg/ml). A total of 15 µg of total protein in 50 μl
sodium phosphate buffer was transferred into wells of 96-well plate (Appleton Woods,
Birmingham, UK, Catalogue No.: CC653) in triplicates. Freshly prepared nitrocefin (Oxoid,
Massachusetts, USA, Catalogue No.: SR0112) was added into the reservoir of the injector of
a FLUOstar Optima plate reader (BMG Labtech, Ortenberg, Germany). The injector was set
to inject 10 μl of nitrocefin after 10 seconds incubation and the absorbance was monitored at a
wavelength of 482 nm every minute for 5 minutes. The changes in absorbance were then
plotted against time. The slopes of the initial reaction (where the graph was linear) were
65
compared against the S. Typhimurium 14028s crude lysate control. The experiment was
repeated three times and significant difference was analysed using Student’s t-test (p<0.05).
2.8 Hoechst 33342 Accumulation Assay
The activity of efflux pumps was inferred by measuring accumulation of Hoechst 33342
efflux substrate in the absence and presence of efflux inhibitors as previously described
(Webber and Coldham, 2010). An overnight culture of the strain of interest was diluted with
fresh LB broth to give a 4% inoculum in 10 ml. The culture was allowed to grow at 37°C with
shaking (200 rpm) until it achieved an OD600 of 0.6. The cultures were centrifuged at 2,500 x
g for 10 min at room temperature. The supernatant was discarded and the cell pellet was
resuspended in 3 ml sterile phosphate saline buffer (PBS) (Life Technologies, California,
USA, Catalogue No.: 14190-094). The OD600 of the suspension was determined again and
each cell suspension was diluted to an OD600 of 0.1 with PBS. Then, 180 μl of the diluted cell
suspension was transferred into three wells in a black 96-well plate (Appleton Woods,
Birmingham, UK, Catalogue No.: CC708). Three replicates (176 μl) of the same cell
suspension were added into three more wells and 4 μl of 50X efflux inhibitor was added (e.g.
if a final concentration of 25 µg/ml PAβN was needed, then 4 μl of 1250 µg/ml PAβN was
added into the wells). For positive control, 200 μl of boiled overnight culture was transferred
into three wells. For negative control, 200 μl PBS was transferred into three wells and 180 μl
PBS was added into another three wells. The fluorescence of each well was monitored at
37°C using FLUOstar Optima plate reader (BMG Labtech, Ortenberg, Germany). The
reservoir of the injector was added with 25 μM Hoechst 33342 (Sigma-Aldrich, Missouri,
USA, Catalogue No.: B2261). The injector was set to inject 20 μl of Hoechst 33342 into wells
containing 180 μl of cell suspension. The fluorescence was measured at an excitation and
emission wavelengths of 355 and 465 nm, respectively for 30 cycles (1 min per cycle). The
66
fluorescence of the samples at the 30th cycle were compared using Student’s t-test with
p<0.05 considered as significant.
2.9 Outer Membrane Protein Extraction
Bacterial outer membrane proteins were purified as previously described (Piddock et al.,
1990). Briefly, an overnight culture of the bacteria of interest was diluted 1 in 50 in 90 ml of
fresh LB broth and allowed to grow until an OD600 of 0.6. The cultures were centrifuged at
2,500 x g and 4°C for 15 min. The supernatant was discarded and the cell pellet was
resuspended in 30 ml of 50 mM sodium phosphate buffer pH 7.0 to wash the cells. The cell
suspension was centrifuged again at 2,500 x g and 4°C for 15 min. The washed cell pellet was
resuspended in 1 ml of 50 mM sodium phosphate buffer pH 7.0 and transferred into a sterile
microfuge tube and froze overnight at -80°C. After freezing, the cell suspension was thawed
on ice then homogenised by sonication in ice slurry (Soniprep 150, MSE, UK) at 5 micron
amplitude for 30 seconds for four times with 30-second intervals to avoid overheating of the
cell lysates. The cell lysates were centrifuged at 6,000 x g for 1 min at 4°C to discard larger
cell debris. The supernatant was transferred into a microfuge tube and centrifuged again at
12,000 x g for 30 min at 4°C. Then, the supernatant was discarded. The pellet was
resuspended vigorously in 200 μl 2% sarcosyl (Sigma-Aldrich, Missouri, USA, Catalogue No.:
L5125) and incubated at room temperature for 30 min. The samples were centrifuged again at
12,000 x g for 30 min at 10°C. All the supernatant was carefully removed to ensure most of
the detergent containing solution had been removed. The protein pellet was resuspended in
100 μl of 50 mM sodium phosphate buffer pH 7.0 and centrifuged at 12,000 x g for 10 min at
4°C to remove residual detergent from the outer membrane protein preparations. The
supernatant was discarded and the extracted outer membrane proteins were resuspended in 50
μl of 50 mM sodium phosphate buffer pH 7.0. The amount of total protein in each samples
67
were quantified using Bradford Reagent (Sigma-Aldrich, Missouri, USA, Catalogue No.:
B6916) against a series of bovine serum albumin standards (Sigma-Aldrich, Missouri, USA,
Catalogue No.: P0914) of known concentrations (0.05 – 0.5 mg/ml).
2.10 Sodium Dodecyl Sulphate Polyacrylamide Gel Electrophoresis (SDS-PAGE)
The extracted outer membrane proteins were separated by SDS-PAGE using a PROTEAN®
II xi Electrophoresis Cell (Bio-Rad, California, USA). A 16 x 20 x 0.1 cm discontinuous gel
(4% stacking gel and 10 % resolving gel) was prepared according to the manufacturer’s
instruction for the separation of protein samples. Sample loading buffer (Sigma-Aldrich,
Missouri, USA, Catalogue No.: 161-0747) was added to the protein samples and the protein
samples were heated at 95°C for 10 min. A total of 2 µg of total protein was loaded per lane
for separation. The electrophoresis was done using 1X Tris/Glycine/SDS buffer (Sigma-
Aldrich, Missouri, USA, Catalogue No.: 161-0732). Once the protein samples had been
loaded into the wells, electrophoresis was started using 100 volts (constant) until the samples
migrated into the resolving gel where the voltage was increased to 200 volts. The protein
samples were allowed to separate until the dye front reached the end of the gel. The gel was
then carefully removed from the electrophoresis tank and stained with PhastGel® Blue R
(Sigma-Aldrich, Missouri, USA, Catalogue No.: B4921) for 1 hour with gentle shaking. Then,
the protein gel was de-stained using de-staining buffer [10% (v/v) methanol and 5% (v/v)
acetic acid in water] overnight with gentle shaking. The de-stained protein gel was visualised
and image taken using G:Box Gel Documentation System (Syngene, Cambridge, UK).
2.11 Selection of Rifampicin Resistant Bacteria
To determine the conjugation frequency of plasmids or to transfer the plasmids into different
bacterial strains, recipient strains required a selection marker to differentiate the
transconjugants from the donor strain. Selection of rifampicin resistant mutants was used to
68
gain strains suitable for selection. A single colony of the desired recipient strain was
inoculated into 10 ml of Iso-sensitest broth (Oxoid, Massachusetts, USA, Catalogue No.:
CM0473) and incubated overnight at 37°C, 200 rpm. The overnight bacterial culture was sub-
cultured into 100 ml of Iso-sensitest broth at a dilution of 1:100 and incubated overnight at
37°C (shaken at 200 rpm). A volume of 100 µl of the culture at various concentrations and
dilutions (100X, 10X, 1X, 0.1X and 0.01X) was then spread on Iso-sensitest agar (Oxoid,
Massachusetts, USA, Catalogue No.: CM0471) supplemented with 100 µg/ml rifampicin. The
culture was also serially diluted and spread on antibiotic-free Iso-sensitest agar to determine
the viable count. The mutation frequency of the rifampicin resistant strain was determined as
the number of rifampicin-resistant mutants [colony forming unit (cfu)/ml] divided by the total
number of colonies (cfu/ml) of the strain determined by viable counting.
2.12 P22 Transduction
Bacteriophage P22 was used to transfer genes inactivated by insertion of antibiotic resistance
genes (e.g. acrAB::cat and tolC::cat) into different S. Typhimurium strains. An overnight
culture of the strain carrying the genes to be transferred by P22 was diluted 1 in 100 in 5 ml
LB broth supplemented with filter-sterilised 10 mM magnesium (II) sulphate (MgSO4)
(Sigma-Aldrich, Missouri, USA, Catalogue No.: M7506) and 5 mM calcium (II) chloride
(CaCl2) (Sigma-Aldrich, Missouri, USA, Catalogue No.: C1016). The culture was incubated
for 30 min at 37°C with shaking, 200 rpm. Then, 5 μl of P22 stock was added to this culture
and left to incubate overnight at 37°C with shaking. After the overnight incubation, 1 ml of
chloroform (Sigma-Aldrich, Missouri, USA, Catalogue No.: C2432) was added to the culture
and mixed with vigorous shaking. The lysed cells were centrifuged at 2,500 x g for 15 min at
4°C. The supernatant was transferred into a sterile glass bottle and 200 μl of chloroform was
added. This phage stock was stored at 4°C until further use.

69
In order to transfer genes containing markers into the strain of interest, 5 ml overnight
culture of the recipient strain was centrifuged at 2,500 x g for 15 min at room temperature.
The cell pellet was resuspended in 1 ml LB broth supplemented with 10 mM MgSO4 and 5
mM CaCl2. Then, various volumes (5, 10, 50 and 100 μl) of the prepared phage stock were
added to 100 μl aliquots of the resuspended cell pellet. The cell suspension was incubated at
37°C for 15 min. To stop the transduction, 1 ml of LB broth and 100 μl of filter-sterilised 1 M
sodium citrate (Sigma-Aldrich, Missouri, USA, Catalogue No.: C7254) were added to the cell
suspensions (transductants). The mixtures were incubated at 37°C for 45 min. The
transductants were spread on LB agar supplemented with the relevant antibiotics (Table 2.3)
and incubated at 37°C for 24 – 48 hours.
2.13 Conjugation
The plasmids used in this study are large. Hence, filter conjugation was frequently used to
transfer the plasmids between bacterial strains and species. A volume of 1 ml of overnight
liquid culture of donor and recipient strains grown with the appropriate antibiotics were
centrifuged at 12,000 x g for 1 min. The cell pellets were washed with 1 ml of fresh LB broth
and centrifuged again to remove traces of antibiotic from the overnight culture. The donor and
recipient cell pellets were each resuspended in 50 µl of LB broth and mixed together. The cell
suspension was transferred on to a sterile 0.45 µm 25 mm nylon membrane filter (Millipore,
Massachusetts, USA, Catalogue No.: HNWP02500) placed on LB agar and incubated
overnight at 37°C to ensure the plasmids have been successfully transferred. Then, the
membrane filter was transferred into a sterile microfuge tube and 1 ml of LB broth was added.
The cells were detached from the membrane by vigorous agitation. The filter membrane was
removed after the cell suspension was centrifuged at 12,000 x g for 1 min. The supernatant
was removed and the cell pellet was resuspended in 1 ml of LB broth. The cell suspension

70
was serially diluted and spread on LB agar supplemented with the necessary antibiotics (Table
2.3) to obtain single colonies.
2.14 Growth Kinetics
Bacterial growth rate at the logarithmic phase was used to determine the fitness of the strain
when a particular mutation or plasmid had been introduced into the strain (Cottell et al., 2014).
To do this, a single colony was inoculated into LB broth supplemented with the appropriate
antibiotic and incubated overnight at 37°C, 200 rpm. The overnight culture was diluted with
fresh LB broth to give a final inoculum of 4% (v/v). A volume of 200 µl of this diluted culture
was transferred into wells of 96-well microtitre plate (Sterilin, Catalogue No.: 612U96). Three
biological replicates and four technical replicates were used per experiment. The growth of
the cultures was monitored at OD600 at 10 min intervals per cycle for 100 cycles using the
FLUOstar Optima plate reader (BMG Labtech, Ortenberg, Germany). The growth rates
(generation time) for the bacteria were calculated from the logarithmic phase of growth using
the following formula:
Generation time 3.3
Where, t1 – t0 is the difference in minutes between the estimated time when the logarithmic
growth phase ends and starts. The variables, n1 and n0 are the estimated number of cells at the
end and the beginning of the logarithmic growth phase obtained by multiplication of the
OD600 reading with a constant of 106. The experiment was repeated three times. The
generation times were compared using a Student’s t-test, p values less than 0.05 were
considered statistically significant.
71
2.15 Determination of Conjugation Frequency
The conjugation frequency of plasmids from their original clinical isolates was determined as
previously described (Cottell et al., 2014). Overnight cultures of the donor and recipient
bacterial strains were prepared from single colonies. Overnight cultures of the donor and
recipient strains were then used to inoculate fresh 20 ml LB broth cultures at a dilution of 1 in
50. This fresh culture was allowed to incubate at 37°C with shaking (200 rpm) until they
reached an OD600 of 0.6. Then, 1 ml of the culture was transferred into sterile microfuge tubes.
The donor and recipient strains were centrifuged at 12,000 x g, 1 min and the supernatants
were discarded. The donor was resuspended in 100 μl LB broth while the recipient strain was
resuspended in 50 μl LB broth. Then, 50 μl of the donor strain was mixed with 50 μl of the
recipient strain so that the donor:recipient ratio was 1:2. This was done to ensure that all
donor cells were in contact with at least one recipient cell. The suspension was then
transferred on to sterile 0.45 μm nylon filters placed on LB agar. The conjugation mixture was
then left to incubate at 37°C for 3 hours. After the incubation period, the filter was aseptically
transferred into a sterile microfuge tube and 1 ml of LB broth was added. The transconjugants
were liberated from the filters by vigorous agitation. The transconjugants were serially diluted
and plated on LB agar supplemented with relevant antibiotics. The transconjugants were left
to incubate overnight at 37°C. The conjugation frequency of the plasmids was calculated
according to the formula below. Conjugation frequencies were determined on three separate
occasions and differences were deemed significant when p<0.05 by Student’s t-test.
Conjugation Frequency Number of transconjugants (cfu/ml)12 Number of donors (cfu/ml)
72
2.16 Minimum Inhibitory Concentration (MIC) Determination
The MIC of various antibiotics against the strains used in this study was routinely determined.
The values were determined using the guidelines recommended by the British Society for
Antimicrobial Chemotherapy (BSAC) (Andrews, 2001). E. coli NCTC10418 was used as a
control strain for susceptibility testing. Where the MIC values of the control strain were not
within 2-fold dilution of those reported in the BSAC guidelines, all the MIC values for that
particular experiment were disregarded. Similarly, a difference in MIC value of more than 2-
fold dilution was considered significant according to BSAC guidelines.
2.17 Biofilm Assay
2.17.1 Biofilm Formation on Plastic in Microtitre Tray
The impact of plasmid carriage on biofilm formation by bacterial strains was assessed in 96-
well microtitre trays as previously described (Baugh et al., 2012). Briefly, overnight cultures
of the bacterial strains were diluted in fresh LB broth without sodium chloride [10 g/L
tryptone (Oxoid, Catalogue No.: LP0042) and 5 g/L yeast extract (Oxoid, Catalogue No.:
LP0021)] to give a final inoculum of 4% (v/v). It has been shown that Salmonella strains are
able to form biofilm more efficiently in LB broth without salt (Jain and Chen, 2007). Hence,
this condition was chosen and used throughout the biofilm assays. A total of 200 μl of the
diluted liquid culture was transferred into the wells of the microtitre tray. The microtitre tray
was incubated at 30°C with gentle shaking for 48 hours. After incubation, the cultures were
decanted from the tray and the biofilm formed in the wells was stained with 0.1% (w/v)
crystal violet solution (Sigma Aldrich, Missouri, USA, Catalogue No.: C6158) for 15 min.
Then, the dye was removed and the microtitre tray was washed with sterile water to remove
the excess dye. The crystal violet stain was solubilised in 200 μl of 70% (v/v) ethanol (Analar
Normapur, Pennsylvania, USA, Catalogue No.: 20821.330) with gentle shaking for 15 min.

73
The intensity of the solubilised crystal violet which relates to the amount of biofilm formed
was measured at OD600. In each experiment, three biological and four technical replicates
were included for each strains tested. The biofilm formation of each strain was determined in
three independent experiments. The data were analysed using Student’s t-test and p<0.05 was
considered as significant.
2.17.2 Biofilm Formation on Glass Under Flow
The ability of the plasmid carrying bacteria to form biofilms was also assessed under constant
flow of liquid media in glass microfluidic flow cells as previously described (Baugh et al.,
2014) with some modifications. In order to prime the BioFluxTM 200 48-well low shear plate
(0-20 dynes/cm2) (Fluxion Biosciences, California, USA), 200 μl of LB broth (without salt)
was added into the output well (used for waste collection) (Figure 2.1a). The BioFluxTM
interface was tightly fastened on to the 48-well plate. Flow tubes were attached to the
BioFluxTM interface and the settings (LB broth at 19°C, flow rate = 5 dynes/min) were
selected on the BioFluxTM system software. The flow of LB (without salt) was started by
applying air pressure at the output well to allow the flow channel to be primed with broth for
5 min. Overnight cultures of the strains were diluted into an OD600 of 0.1. The excess broth
was removed from the input and output wells (Dark blue) (Figure 2.1a). This left a small
amount of broth in the inner region (Orange) of the input and output wells. About 50 μl of LB
broth (without salt) was added to the input well. An equal volume of diluted bacteria was
added into the output well. Then, the BioFluxTM interface was attached and the air pressure
was applied on the output well again at a flow rate of 3 dynes/min for 3 seconds. The flow
was then stopped immediately. The presence of bacteria in the flow cell (Light blue) (Figure
2.1a) was verified with a LabtechScope LTSi-1000 inverted microscope (Labnet, New Jersey,
USA) at 400X magnification. The 48-well plate was then incubated on a heating block

74
Each microfluidic system consists of a paired inlet and outlet well, and a channel which links the two.
Input Wells Output Wells
Observation Area
(a)
(a) The general layout of the BioFlux system (Top view). (b) The functions of the individual components of the BioFlux system (Side view). The air pressure will force the LB broth (no salt) in the input well (1) to slowly flow through the microfluidic channel into the output well (2) at a constant flow rate. This will provide constant nutrients to the bacteria and mimic the conditions within blood vessels. The Bioflux interface (3) creates an airtight environment between the wells and the environment. The cover glass bottom (5) allows bacterial cells (6) to attach and form the biofilm. An inverted microscope can be used to observe the biofilm in the observation area (4). Source: Adapted from BioFluxTM instruction manual.
Figure 2.1 BioFlux system
(b)
Microscope
Observation area
Attached bacterial cells
Output wellInput well
Air pressurePressure interface
Cover glass bottom

75
(AccuBlockTM, Labnet) set at 30°C for 2 hours. This is to allow the bacteria to attach to the
surface of the microfluidic channel (Figure 2.1b). After incubation, the excess broth was
removed from the output well and 1 ml of fresh LB broth (without salt) was added into the
input well. The flow rate was set to a constant 0.3 dynes/min by applying air pressure on the
input well and the plate was incubated on the heating block for 48 hours. The biofilms were
observed at 6, 12, 24 and 48-hour time points at 400X magnification. The area of coverage by
the biofilm in the microfluidic channel was determined using image analysis software, ImageJ
(http://imagej.nih.gov/ij/). The student’s t-test was used to determined whether a significant
difference (p<0.05) was observed in the area of coverage.
2.18 Plasmid Persistence
The proportion of the bacterial population which retains a plasmid was determined over a
period of 20 days as previously described (Cottell et al., 2014). A single colony was
inoculated in 10 ml LB broth supplemented with 0.25 µg/ml doripenem. The culture was
incubated overnight at 37°C with agitation, 200 rpm. On the next day, the culture was sub-
cultured into 10 ml of fresh LB broth without antibiotics at a dilution of 1 in 100. This step
was repeated daily for 20 days. At appropriate intervals (e.g. day 5, 10, 15 and 20), the culture
was serially diluted and plated on LB agar and incubated overnight at 37°C. On the following
day, the colonies were replica plated using sterile velveteen squares on to LB agar
supplemented with 0.25 µg/ml doripenem. The retention of the plasmid in a particular
bacterial strain was calculated as a percentage of doripenem resistant colonies over the total
number of colonies observed on the antibiotic-free LB agar. The experiment was repeated on
three separate occasions. To determine the number of generations the bacterial strains had
achieved after 24 hours of incubation, viable counting was done to determine the number of
cfu/ml of bacteria after the sub-culturing step of 1 in 100 and after the 24-hour incubation

76
period. The number of generations the bacteria had achieved after 24 hours were calculated
using the following formula:
Number of generations log P log Q
P is the number of cfu/ml of the culture after 24 hours of incubation whereas Q is the number
of cfu/ml after the initial dilution of the overnight culture.
2.19 Pairwise Competition Assay
Single colonies of pKpQIL-UK and pKpQIL-D2 blaKPC::aph carrying K. pneumoniae Ecl8Rif
strains were inoculated into 10 ml LB broth supplemented with 0.25 µg/ml doripenem and the
cultures were incubated overnight at 37°C (shaken at 200 rpm). The overnight cultures were
diluted with fresh LB broth into an OD600 of 0.1. Then, 50 μl of each bacterial culture was
inoculated into 10 ml of fresh LB broth without antibiotic selection. The cultures were
incubated overnight at 37°C with agitation (200 rpm). On the following day, the culture was
sub-cultured into 10 ml of fresh LB broth to give a 1 in 100 dilution. This step was repeated
20 days to allow both bacterial strains to compete against each other over the duration of the
experiment. To determine the ratio of both of the plasmid carrying strains within the
population, the culture was serially diluted and plated on LB agar and incubated overnight at
37°C at appropriate intervals (e.g. day 5, 10, 15 and 20). On the following day, the colonies
were replica plated using sterile velveteen squares on to two LB agar each supplemented with
0.25 µg/ml doripenem and 50 µg/ml kanamycin. The competition experiment was repeated on
three separate occasions. The competition index of the bacterial strains was calculated using
the following formula (Luo et al., 2005):
Competition Index X YX Y
77
X is the average proportion of pKpQIL-D2 carrying K. pneumoniae Ecl8Rif in the total
bacterial population whereas Y is the equivalent for the pKpQIL-UK carrying strain at the end
of the experiment. A positive value indicates that the pKpQIL-D2 carrying strain is fitter than
the pKpQIL-UK carrying strain. A negative value indicates the opposite.
2.20 Galleria mellonella Infection Model
Overnight cultures of K. pneumoniae ST258 and its pKpQIL-UK and -D2 carrying strains
were prepared by inoculating a single colony of the bacterial strain into 10 ml LB broth
supplemented with 0.25 µg/ml doripenem. Viable counting was done to determine the cfu/ml
of the overnight cultures of the K. pneumoniae ST258 and its pKpQIL-UK and -D2 carrying
strains. The Galleria mellonella Wax Moth larvae were purchased from Livefood UK Limited
(www.livefoods.co.uk). The larvae were placed in groups of 10 into sterile petri dishes. The
larvae used were about 2 cm in length. Using the data from the viable counting, the overnight
cultures of the bacterial strains were diluted in sterile PBS to obtain an inoculum of 107 cfu/ml.
A total of 105 cfu in 10 μl was injected into each larva at the last right proleg. The larvae were
incubated in the dark at 37°C. The percentage of survival of the larvae was recorded every 24
hours over a period of five days. The larva was considered dead when it was black in colour
and no movement was observed when the larva was gently agitated. The experiment was
repeated on two separate occasions. Log-rank (Mantel-Cox) test was used to determine
whether a significant difference (p<0.05) was observed between the groups of larvae infected
with the different strains.
2.21 RNA Sequencing
2.21.1 RNA Extraction
In order to understand the effects of plasmids on host bacterium gene expression, RNA
sequencing was used. Five overnight cultures (biological replicates) of the strains of interest

78
(K. pneumoniae ST258, K. pneumoniae ST258/pKpQIL-UK and K. pneumoniae
ST258/pKpQIL-D2) were grown in MOPS minimal medium (Teknova, California, USA,
Catalogue No.: M2101) at 37°C with shaking, 200 rpm. The strains were then sub-cultured
into fresh MOPS medium the next day at a dilution of 1 in 50 and allowed to grow until the
OD600 reached 0.6. Then, three OD units of the culture were centrifuged at 12,000 x g, 1 min.
RNA was extracted from the cell pellets using the RiboPureTM RNA Purification Kit (Ambion,
California, USA, Catalogue No.: AM1925) according to the manufacturer’s instructions.
Instead of using a vortex mixer as instructed by the manual, bacterial cells were homogenised
three times using a RiboLyser (Hybaid, Basingstoke, UK) at 6.5 meters/sec for 45 sec (with 1
min interval to avoid overheating) to disrupt the capsular cells. The extracted RNA was
diluted 1 in 10 and quantified using a Qubit® RNA HS Assay Kit (Life Technologies,
Catalogue No.: Q32852). Undiluted RNA was also quantified for the presence of
contaminating DNA using a Qubit® dsDNA HS Assay Kit (Life Technologies, Catalogue No.:
Q32854). The percentage of DNA over the total amount of nucleic acid (DNA+RNA) was
calculated. Where the percentage of DNA exceeded 5%, RNA samples were treated with
TURBOTM DNase (Ambion, Catalogue No.: AM1907). DNase treatment was repeated until
the percentage of DNA was less than 5%. Contamination with genomic DNA will reduce the
efficiency of ribosomal RNA (rRNA) removal and affect RNA library preparation. The
presence of DNA was also confirmed using PCR (40 cycles) to amplify the gyrase gene
(gyrB). The quality of the DNAse-treated RNA samples was analysed using a 2100
Bioanalyzer (Agilent, California, USA) with the RNA 6000 Nano Kit (Agilent, California,
USA, Catalogue No.: 5067-1511).
79
2.21.2 Ribosomal RNA (rRNA) Reduction
To avoid rRNA saturation of the RNA sequencing experiment, rRNA depletion is needed.
The efficiency of the rRNA removal can be affected by the presence of contaminating salts
and solvents from the reagents of the RNA extraction and DNAse treatment kits. Hence,
samples with no detectable DNA contamination were purified to remove salts or solvents
using the RNA Clean & ConcentratorTM-5 Kit (Zymo Research, California, USA, Catalogue
No.: R1015). The RNA was eluted with RNAse-free water in the final step of the clean-up
process. The ribosomal RNA in the purified total RNA samples was depleted using the Ribo-
ZeroTM rRNA Removal Kit (Gram-negative bacteria) (Epicentre, Wisconsin, USA, Catalogue
No.: MRZGN126) according to the manufacturer’s instructions. Although the kit’s manual
stated a maximum of 5 µg total RNA can be used per reaction, a lesser amount ca. 2 – 4 µg
was used to avoid overloading of the reaction which would result in reduced rRNA removal
efficiency. The rRNA-depleted RNA samples were concentrated into 7 μl total volume using
the RNA Clean & ConcentratorTM-5 Kit in RNAse-free water. Then, the samples (1 μl each)
were analysed using 2100 Bioanalyzer (Agilent, California, USA) with the RNA 6000 Pico
Kit (Agilent, California, USA, Catalogue No.: 5067-1513) which can detect a lower
concentration of RNA compared to the RNA 6000 Nano Kit.
2.21.3 RNA Library Preparation
Four RNA samples from each of the three strains (K. pneumoniae ST258, K. pneumoniae
ST258/pKpQIL-UK and K. pneumoniae ST258/pKpQIL-D2) which possessed the correct
quantity (10 – 400 ng) and quality (no detectable rRNA, DNA contamination and RNA
degradation) were chosen for library preparation. The library preparation used the TruSeq®
Stranded mRNA Sample Preparation Kit (Illumina, California, USA, Catalogue No.: RS-122-
2102). The kit is designed for library preparation with eukaryotic mRNA. Therefore, the
80
initial stages of mRNA purification stated in the manufacturer’s manual were replaced with
rRNA-depletion (Section 2.21.2). For each sample, a volume of 5 μl of concentrated rRNA-
depleted RNA (10 – 400 ng) was used for library preparation. The process began with
fragmentation of the RNA transcripts to smaller fragments by heating and priming with
random hexamers at 94°C. The fragmented RNA was then converted to cDNA
(complementary DNA) using reverse transcriptase and then into double stranded cDNA. Each
of the 12 samples (cDNA) was then ligated with different adapters which possessed unique
nucleotide sequences. The adapters were needed to differentiate all the 12 samples during
sequencing. The double stranded cDNA linked with adapters were selectively enriched by
PCR and purified as instructed in the manufacturer’s manual. The quality of the prepared
libraries for each sample were determined using the 2200 TapeStation (Agilent, California,
USA) with the D1000 ScreenTape Kit (Agilent, California, USA, Catalogue No.: 5067-5582).
A successful library preparation yielded a single major peak representing a majority of 260 bp
amplicons on the electropherogram. The libraries were also diluted 1000 times in nuclease-
free water and quantified using the KAPA Library Quantification Kit for Next-Generation
Sequencing (KAPA Biosystems, Massachusetts, USA, Catalogue No.: KK4824). This kit
quantifies the library by measuring their amplification signals using qRT-PCR against a
standard curve. All the libraries were then normalised to 10 nM and pooled together.
2.21.4 Sequencing
Before the sequencing step, the pooled library was diluted to 1 nM in nuclease-free water. A
volume of 20 μl of the 1 nM library was mixed with 20 μl sodium hydroxide (0.2 N) (Sigma-
Aldrich, Missouri, USA, Catalogue No.: 72082) to denature the library into single stranded
cDNA. The mixture was incubated at room temperature for 5 min. Then, 40 μl of 200 mM
Tris pH 7.0 was added to stop the denaturation process. The library was further diluted 10X in

81
HT1 (Hybridisation) buffer (Illumina, California, USA) to obtain a library at a final
concentration of 25 pM for sequencing. The sequencing was done using a MiSeq® Sequencer
(Illumina, California, USA) and MiSeq® Reagent Kit v3 (Illumina, California, USA,
Catalogue No.: MS-102-3003). The sequencing parameters were set at 200 bp paired-end for
400 cycles.
2.21.5 Data Analyses
The RNA sequencing data was analysed using a variety of programmes hosted in Galaxy
(https://usegalaxy.org). The general workflow is summarised in Figure 2.2. Briefly, the format
of the sequencing files was converted into Sanger FASTQ format which was compatible with
the analysis software on the website using ‘FASTQ Groomer’. The converted forward and
reverse reads of each sequence were then mapped on to a reference sequence (K. pneumoniae
MGH78578 Accession No.: CP000647, pKpQIL-UK or pKpQIL-D2) using ‘Tophat2’. As the
sequences were of fragmented transcripts, the ‘Cufflinks’ programme was used to associate
reads (sequences) to genes. The output from the ‘Cufflinks’ programme was then used to map
the sequences on to known annotated genes on the reference sequence using ‘Cuffcompare’.
Finally, ‘Cuffdiff’ was used to detect the genes which were differentially expressed between
the three different strains. The ‘Cuffdiff’ programme provides a list of genes which were the
expression was significantly different between the three strains (K. pneumoniae ST258,
ST258/pKpQIL-UK and ST258/pKpQIL-D2). The protein sequences of the genes were
checked for known homology using the BlastP database. Then, the genes were categorised
into their respective Clusters of Orthologous Groups (COG) (http://www.microbesonline.org/).

82
Figure 2.2 RNA sequencing data analyses workflow
Sequencing output files (FASTQ)
Convert format with ‘FASTQ Groomer’
Map sequencing reads to reference genome with ‘Tophat2’
Associate read fragments into full length genes with ‘Cufflinks’
Map reads to annotated reference genome with ‘Cuffcompare’
Identify differentially expressed genes with ‘Cuffdiff’
Check gene products with known proteins by BlastP
Categorised genes into Clusters of Orthologous Groups (COG)

83
CHAPTER THREE: THE CELL ENVELOPE AND CARBAPENEM RESISTANCE
3.1 Background
Detection of carbapenemase-producing Enterobacteriaceae (CPE) is usually carried out by
susceptibility testing. However, this phenotypic test is not always accurate. Some CPE
isolates are inhibited by a carbapenem MIC value in the susceptible range even in the
presence of carbapenemases, resulting in false susceptible reports (Jain et al., 2014, Voulgari
et al., 2013, Moland et al., 2003, Psichogiou et al., 2008, Scoulica et al., 2004, Bratu et al.,
2005, Landman et al., 2010, Landman et al., 2011, Hrabák et al., 2013, Nahid et al., 2013,
Tijet et al., 2013). Although the Clinical and Laboratory Standards Institute (CLSI)
carbapenem recommended breakpoint concentration values were revised in 2010, so that
isolates which were previously classified as carbapenem susceptible are now classified as
carbapenem non-susceptible, there is the still possibility of false negative reports arising from
the detection methods used (Doern et al., 2011, Zavascki et al., 2014). BSAC
(http://bsac.org.uk/) and EUCAST (http://www.eucast.org/) which recommend higher MIC
breakpoint concentrations also do not address this problem. The heterogeneity in carbapenem
MIC values ranging from susceptible to resistant observed in these isolates may be associated
with a combination of resistance mechanisms present in each isolate. Porins have been shown
to affect the susceptibility of carbapenemase-producing K. pneumoniae to carbapenems via
the OmpK35 (OmpF homologue) and OmpK36 (OmpC homologue), where the latter has
been reported to play a more significant role (Tsai et al., 2011, Landman et al., 2009). Not
much is known about the contribution of the AcrAB-TolC efflux system to carbapenem
resistance in the presence of carbapenemases. However, this system is required for resistance
to fluoroquinolones conferred by mutations in the DNA gyrase genes, and also to various β-
lactam antibiotics (Piddock, 2006b).

84
3.2 Hypothesis and Aims
It was hypothesised that a functional AcrAB-TolC efflux system is required for the
elaboration of resistance to clinically important carbapenem antibiotics in carbapenemase-
producing Enterobacteriaceae. Therefore, the aims of this study were:
1. To transfer carbapenemase-encoding plasmids into AcrAB and TolC efflux pump
component deletion mutants of K. pneumoniae, E. coli and Salmonella.
2. To determine the susceptibility of the plasmid carrying strains in the presence and
absence of AcrAB or TolC to clinically relevant carbapenem antibiotics.
3.3 Carbapenem Resistance by blaKPC is Seen Even in the Absence of the Tripartite
AcrAB-TolC Multidrug Resistance Efflux Pump
3.3.1 Strain Constructions
To investigate the function of the AcrAB-TolC efflux system in carbapenem resistance, a set
of isogenic efflux mutants (AcrAB and TolC) were used. The carbapenemase gene encoding
plasmids pKpQIL-UK and pKpQIL-D2 are large (ca. 114 kb) and transfer to new bacterial
host strains via transformation is difficult (Hanahan, 1983, Ohse et al., 1995). Therefore,
conjugation was used as the mode of transfer. To do this, the host bacterium K. pneumoniae
Ecl8 and its isogenic AcrAB mutant needed a resistance marker so that the transconjugants
carrying the plasmids could be selected from the donor bacterium. Unfortunately, despite
repeated requests for a K. pneumoniae TolC mutant from T. Schneiders, the strain was not
provided due to not being confirmed as the correct strain in her laboratory. Rifampicin-
resistance was the chosen marker for the recipient strains as this is easily selected in vitro
(Miller et al., 2002). The rifampicin-resistant K. pneumoniae Ecl8 and AcrAB mutants were
selected at a frequency of 8.6 x 10⁻⁹ and 8.5 x 10⁻¹⁰, respectively. This suggested a single point
mutation during the selection of the mutants (Miller et al., 2002). No difference in generation

85
times was observed between the parental and the isogenic efflux mutant strain (Figure 3.1 &
Table 3.1). The rpoB gene which encodes for the subunit of bacterial RNA polymerase is a
known target for rifampicin and mutation in this gene can lead to resistance to this antibiotic
(Miller et al., 2002).
A set of efflux deletion mutants was also constructed in E. coli BW25113. Rifampicin-
resistant mutants were selected from the E. coli strain and its isogenic efflux mutants
concurrently. The E. coli BW25113 and its isogenic efflux mutants (acrB::aph and tolC::aph)
from the Keio Collection were used for this experiment (Baba et al., 2006). Rifampicin-
resistant mutants of E. coli BW25113 (to give E. coli BW25113Rif), E. coli BW25113
acrB::aph (to give BW25113Rif acrB) and E. coli BW25113 tolC::aph (to give BW25113Rif
tolC) were selected at a frequency of 2.3 x 10⁻⁸, 1.3 x 10⁻⁸ and 1.1 x 10⁻⁸, respectively.
Sequencing of the purified rpoB gene PCR amplicon (Figure 3.2) showed a single point
mutation in all the three strains. E. coli BW25113Rif and its AcrB mutant possess a single
C1691T (Pro574Leu) substitution, whereas the E. coli BW25113Rif tolC mutant contained a
single C1576T (His526Tyr) substitution. The rifampicin-resistant mutants of the E. coli strain
set were then verified by PCR to ensure that the correct efflux pump component genes were
inactivated (Figure 3.3). Due to the difference in the mutation found in the rpoB gene, the
generation time of the three strains were investigated. Without the rifampicin-resistant marker,
there was no difference in generation time of the Keio Collection strains with/without AcrB or
TolC (Figure 3.4a, Table 3.2). Compared to the E. coli BW25113Rif, the rifampicin-resistant
mutants with the inactivated efflux pump component genes had the same significant, but
slower generation time (p<0.05) (Figure 3.4b). Despite this, the slower growth rate of the
rifampicin-resistant mutants is unlikely to have a significant impact on carbapenem activity as

86
Growth kinetics was done to compare the growth of the rifampicin-susceptible and -resistant K. pneumoniae Ecl8 and its isogenic acrAB mutant. Absorbance values were recorded as mean ± standard deviation of three independent experiments. Generation times were recorded in Table 3.1.
Figure 3.1 Growth kinetics of rifampicin-susceptible/resistant mutants of K. pneumoniae Ecl8 and its efflux mutants
(a)
(b)

87
Table 3.1 Generation times of rifampicin-susceptible/resistant K. pneumoniae Ecl8 and its isogenic acrAB mutant
K. pneumoniae Strain Generation Time (min) Student’s t-test
Ecl8 27.4 ± 3.8 -
Ecl8 acrAB::aph 29.1 ± 2.3 0.54
Ecl8Rif 28.7 ± 1.0 -
Ecl8Rif acrAB::aph 27.2 ± 1.3 0.25
Generation time was determined to assess the fitness impact of the rifampicin resistant marker in the K. pneumoniae Ecl8 and its isogenic acrAB mutant. Generation time is shown as a mean ± standard deviation of three independent experiments. Student’s t-test was used to analyse the generation times (p<0.05).

88
Figure 3.2 PCR amplification of rpoB of rifampicin-resistant E. coli BW25113 for DNA sequencing
5000 bp bp4288
MWildtype BW25113
BW25113Rif acrB::aph
BW25113Rif tolC::aph
The rpoB genes of the various E. coli BW25113 strains were amplified. The amplicons were purified for sequencing to determine the mutation in the rpoB gene. M: Hyperladder I (Bioline); Primers: RpoB-Ecoli-F1/R1; Expected amplicon: 4288 bp.
BW25113Rif

89
Figure 3.3 PCR verification of inactivated acrB and tolC genes in rifampicin-resistant mutants of Keio Collection strains
The various rifampicin-resistant mutants of E. coli BW25113 were verified by PCR for the presence of the inactivated tolC gene. M: Hyperladder I (Bioline); Lane 10: BW25113 tolC::aph genomic DNA (Positive control); Lane 11: BW25113 genomic DNA (Negative control); Lane 12: Water (Contamination control). Primers: tolC fwd/rev; Expected amplicon: 1976 bp (mutant), 2131 bp (wildtype).
(b) PCR to check for inactivated tolC gene
(a) PCR to check for inactivated acrB gene
4000 bp 3000 bp
3482 bp
1659 bp
M 1 2 3 4 5 6 7 8 9 10 11 12
BW25113Rif BW25113Rif acrB::aph
BW25113Rif tolC::aph
2000 bp 1500 bp
The various rifampicin-resistant mutants of E. coli BW25113 were verified by PCR for the presence of the inactivated acrB gene. M: Hyperladder I (Bioline); Lane 10: BW25113 acrB::aph genomic DNA (Positive control); Lane 11: BW25113 genomic DNA (Negative control); Lane 12: Water (Contamination control). Primers: acrB fwd/rev; Expected amplicon: 1659 bp (mutant), 3482 bp (wildtype).
2000 bp
bp2500 bp 2131 bp1976 bp
M 1 2 3 4 5 6 7 8 9 10 11 12
BW25113Rif BW25113Rif acrB::aph
BW25113Rif tolC::aph

90
Growth kinetics was done to compare the growth of the rifampicin-susceptible and -resistant E. coli BW25113 and its isogenic efflux mutants. Absorbance values were recorded as mean ± standard deviation of three independent experiments. Generation times were recorded in Table 3.2.
Figure 3.4 Growth kinetics of rifampicin-susceptible/resistant mutants of E. coli BW25113 and its efflux mutants
(a)
(b)
Abs
orba
nce
(600
nm
)

91
Table 3.2 Generation times of rifampicin-susceptible/resistant E. coli BW25113 and its isogenic efflux pump mutants
E. coli Strain Generation Time (min) Student’s t-test
BW25113 35.7 ± 4.4 -
BW25113 acrB::cat 31.9 ± 2.3 0.07
BW25113 tolC::cat 35.3 ± 2.4 0.86
BW25113Rif 34.6 ± 2.0 -
BW25113Rif acrB::cat 39.2 ± 3.3 0.04*
BW25113Rif tolC::cat 40.6 ± 2.9 0.002*
Asterisk (*) denotes statistically significant difference (p<0.05) between the generation time of the mutants relative to the parental strain (BW25113/BW25113Rif). Generation time is shown as a mean ± standard deviation of three independent experiments.

92
the killing effect of carbapenem antibiotics is growth independent (Cozens et al., 1989, Eng et
al., 1991).
Rifampicin-resistant S. Typhimurium ATCC14028s mutants (henceforth call 14028sRif)
were selected at a frequency of 7.3 x 10⁻¹⁰, suggesting a single mutation had occurred during
selection (Miller et al., 2002). The rpoB gene was amplified by PCR, and the 4482 bp
amplicon, which contained the rpoB gene, was purified for DNA sequencing (Figure 3.5a).
The sequence data revealed a single C1565A nucleotide substitution (single Ser522Tyr amino
acid substitution) in the rpoB gene.
In order to ensure that efflux pump component mutants (acrAB::cat and tolC::cat)
were in the same genetic background, the inactivated efflux pump genes from insertion
mutants of EG16564 (tolC::cat) and EG16566 (acrAB::cat) (Nishino et al., 2006) were
transferred into 14028sRif by P22 phage transduction. The S. Typhimurium 14028sRif
acrAB::cat (henceforth call 14028sRif acrAB) and 14028sRif tolC::cat (henceforth call
14028sRif tolC) transductants were then verified by PCR to carry the correct inactivated efflux
pump component genes (Figure 3.5b). PCR was also used to verify the presence of the
chloramphenicol resistance gene (cat) which had been inserted to inactivate the acrAB genes.
Only the mutant with the inactivated genes would yield the amplicons of 500 bp (Primers:
Chlor-Fwd/AcrA-Up) and 415 bp (Primers: AcrB-Down/Chlor-Rev). The inactivated tolC
gene yielded a 1812 bp amplicon. The strains carrying the wildtype tolC gene gave a larger
amplicon of 2489 bp. All strains were correct by PCR. The generation time of 14028sRif
tolC::cat was significantly slower than 14028sRif (p<0.05) (Figure 3.6, Table 3.3). The efflux
mutant series were also checked by API® 20E Gram-negative identification strips to confirm
they were K. pneumoniae, E. coli and S. Typhimurium.
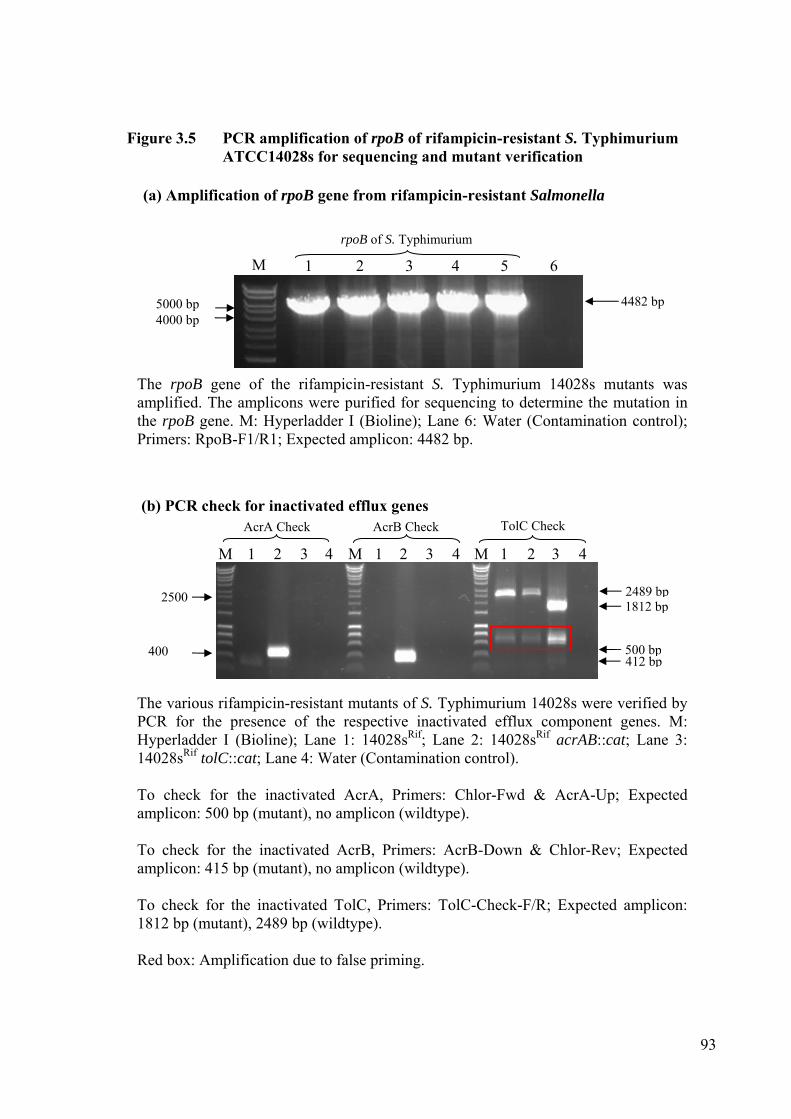
93
The rpoB gene of the rifampicin-resistant S. Typhimurium 14028s mutants was amplified. The amplicons were purified for sequencing to determine the mutation in the rpoB gene. M: Hyperladder I (Bioline); Lane 6: Water (Contamination control); Primers: RpoB-F1/R1; Expected amplicon: 4482 bp.
Figure 3.5 PCR amplification of rpoB of rifampicin-resistant S. Typhimurium ATCC14028s for sequencing and mutant verification
The various rifampicin-resistant mutants of S. Typhimurium 14028s were verified by PCR for the presence of the respective inactivated efflux component genes. M: Hyperladder I (Bioline); Lane 1: 14028sRif; Lane 2: 14028sRif acrAB::cat; Lane 3: 14028sRif tolC::cat; Lane 4: Water (Contamination control). To check for the inactivated AcrA, Primers: Chlor-Fwd & AcrA-Up; Expected amplicon: 500 bp (mutant), no amplicon (wildtype). To check for the inactivated AcrB, Primers: AcrB-Down & Chlor-Rev; Expected amplicon: 415 bp (mutant), no amplicon (wildtype). To check for the inactivated TolC, Primers: TolC-Check-F/R; Expected amplicon: 1812 bp (mutant), 2489 bp (wildtype). Red box: Amplification due to false priming.
(a) Amplification of rpoB gene from rifampicin-resistant Salmonella
M 1 2 3 4
400
M 1 2 3 4 M 1 2 3 4
2500
(b) PCR check for inactivated efflux genes
2489 bp1812 bp
500 bp412 bp
AcrA Check AcrB Check TolC Check
M 1 2 3 4 5 6
5000 bp 4000 bp
4482 bp
rpoB of S. Typhimurium

94
Growth kinetics was done to compare the growth of the rifampicin-susceptible and -resistant S. Typhimurium 14028s and its isogenic efflux mutants. Absorbance values were recorded as mean ± standard deviation of three independent experiments. Generation times were recorded in Table 3.3.
Figure 3.6 Growth kinetics of rifampicin-susceptible/resistant mutants of S. Typhimurium 14028s and its efflux mutants
(a)
(b)

95
Table 3.3 Generation times of rifampicin-susceptible/resistant S. Typhimurium 14028s and its isogenic efflux pump mutants
S. Typhimurium Strain Generation Time (min) Student’s t-test
14028s 30.9 ± 3.1 -
14028s acrB::cat 35.1 ± 4.6 0.05
14028s tolC::cat 42.8 ± 4.6 <0.001*
14028sRif 39.8 ± 4.0 -
14028sRif acrB::cat 40.7 ± 3.6 0.61
14028sRif tolC::cat 53.7 ± 9.2 0.002*
Asterisk (*) denotes statistically significant difference (p<0.05) between the generation time of the mutants relative to the parental strain (14028s/14028sRif). Generation time is shown as a mean ± standard deviation of three independent experiments.
96
In order to assess the contribution of a functional AcrAB-TolC efflux pump in
carbapenem resistance, the blaKPC-encoding plasmid pKpQIL-UK was transferred from E.
coli DH10B into the various parental and isogenic efflux mutant strains by filter conjugation.
The K. pneumoniae Ecl8Rif and Ecl8Rif acrAB mutant with/without pKpQIL-UK were verified
by PCR for the inactivation of the acrAB genes (Figure 3.7a). The transconjugants were also
checked by PCR for the presence of the blaKPC (Figure 3.7b) and pKpQIL-UK plasmid
(Figure 3.7c). All transconjugants were verified by PCR for the presence of the expected
amplicons which represent the blaKPC gene (Primers: KPCg-colpcrF/R), a plasmid backbone
fragment which differentiates pKpQIL-UK from -D2 (Primers: pQIL-F/R), and the respective
inactivated efflux pump component genes (Primers: AcrABdelchkF/R). All transconjugants
contained the expected amplicons i.e. blaKPC gene (785 bp), pKpQIL-UK backbone fragment
(383 bp) and inactivated acrAB genes (3000 bp). The series of E. coli BW25113Rif
transconjugants carrying pKpQIL-UK were also verified by PCR for the presence of the
blaKPC gene (Figure 3.8a) and pKpQIL-UK plasmid (Figure 3.8b).
PCR verifications were also done for the various S. Typhimurium 14028sRif strains
carrying the pKpQIL-UK plasmids: 14028sRif/pKpQIL-UK (Figure 3.9a & b), 14028sRif
acrAB/pKpQIL-UK and 14028sRif tolC/pKpQIL-UK (Figure 3.10a & b). In order to
investigate whether the plasmid variant region had an impact on the carbapenem resistance of
the host bacterium, pKpQIL-D2 was also transferred into the Salmonella strains using the
same method. All transconjugants were confirmed by PCR to carry the blaKPC gene and the
respective plasmids (Figure 3.10a, 3.11 & 3.12). In order to differentiate the highly similar
plasmids pKpQIL-UK and pKpQIL-D2, a primer pair (pMan-F/R) which only amplifies a 600
bp fragment of the pKpQIL-D2 backbone was also included in the PCR tests.

97
The various rifampicin-resistant mutants of K. pneumoniae Ecl8 were verified by PCR for the presence of the inactivated acrB gene and the pKpQIL-UK plasmid. M: Hyperladder I (Bioline); Lane 1: Ecl8Rif; Lane 2: Ecl8Rif acrAB; Lane 3: Ecl8Rif/pKpQIL-UK; Lane 4: Ecl8Rif acrAB/pKpQIL-UK; Lane 5: Water (Contamination control). (a) Check for inactivation of acrAB Primers: AcrABdelchkF/R Expected amplicon: 5543 bp (wildtype), 3000 bp (mutant) (b) Check for blaKPC Primers: KPCg-colpcrF/R Expected amplicon: 785 bp (c) Check for pKpQIL-UK Primers: pQIL-F/R Expected Amplicon: 383 bp
Figure 3.7 PCR verification of K. pneumoniae Ecl8, acrAB, Ecl8Rif/pKpQIL-UK and Ecl8Rif acrAB/pKpQIL-UK
M 1 2 3 4
6000 bp
5
5543 bp
383 bp 400 bp
(a) PCR check for the inactivation of acrAB
M 1 2 3 4 5
(b) PCR check for the presence of blaKPC
4000 bp 3000 bp
M 1 2 3 4 5
785 bp 800 bp
(c) PCR check for the presence of pKpQIL-UK

98
Figure 3.8 PCR verification for the presence of pKpQIL-UK in the E. coli BW25113Rif and isogenic efflux mutants
The various rifampicin-resistant mutants of E. coli BW25113 were verified by PCR for the presence of the pKpQIL-UK plasmid’s backbone gene. M: Hyperladder I (Bioline); Lane 10: pKpQIL-UK plasmid (Positive control); Lane 11: BW25113Rif genomic DNA (Negative control); Lane 12: Water (Contamination control); Primers: pQIL-F/R; Expected Amplicon: 383 bp.
(a) PCR to check for presence of blaKPC
4000 bp 3000 bp
3482 bp
1659 bp
M 1 2 3 4 5 6 7 8 9 10 11 12
BW25113Rif BW25113Rif acrB::aph
BW25113Rif tolC::aph
2000 bp 1500 bp
The various rifampicin-resistant mutants of E. coli BW25113 were verified by PCR for the presence of the pKpQIL-UK plasmid’s blaKPC gene. M: Hyperladder I (Bioline); Lane 10: pKpQIL-UK plasmid (Positive control); Lane 11: BW25113Rif genomic DNA (Negative control); Lane 12: Water (Contamination control); Primers: KPCg-colpcrF/R; Expected amplicon: 785 bp.
400 bp 383 bp
M 1 2 3 4 5 6 7 8 9 10 11 12
BW25113Rif BW25113Rif acrB::aph
BW25113Rif tolC::aph
(b) PCR to check for presence of pKpQIL-UK

99
The various rifampicin-resistant mutants of S. Typhimurium 14028s were verified by PCR for the presence of the pKpQIL-UK plasmid’s (a) blaKPC and (b) backbone genes. M: Hyperladder I (Bioline); Lane 5: Plasmid pKpQIL-UK (Positive control); Lane 6: 14028sRif genomic DNA (Negative control); Lane 7: Water (Contamination control). (a) Check for blaKPC Primers: KPCg-colpcrF/R Expected amplicon: 785 bp (b) Check for pKpQIL-UK Primers: pQIL-F/R Expected Amplicon: 383 bp
Figure 3.9 PCR verification of 14028sRif/pKpQIL-UK transconjugants
M 1 2 3 4
800 bp
5 6 7
785 bp
383 bp 400 bp
14028sRif/pKpQIL-UK
(a) PCR check for the presence of blaKPC
M 1 2 3 4 5 6 7
14028sRif/pKpQIL-UK
(b) PCR check for the presence of pKpQIL-UK

100
Figure 3.10 PCR verification of 14028sRif acrAB/pKpQIL-UK, 14028sRif tolC/pKpQIL-UK and 14028sRif acrAB/pKpQIL-D2
The various rifampicin-resistant efflux component mutants of S. Typhimurium 14028s were verified by PCR for the presence of the pKpQIL-UK plasmid’s backbone gene. M: Hyperladder I (Bioline); Lane 9: Plasmid pKpQIL-UK (Positive control); Lane 10: Plasmid pKpQIL-D2 (Negative control); Lane 11: Water (Contamination control); Primers: pQIL-F/R; Expected amplicon: 383 bp.
The various rifampicin-resistant efflux component mutants of S. Typhimurium 14028s were verified by PCR for the presence of the pKpQIL-UK and -D2 plasmid’s blaKPC genes. M: Hyperladder I (Bioline); Lane 13: Plasmid pKpQIL-UK (Positive control); Lane 14: 14028sRif genomic DNA (Negative control); Lane 15: Water (Contamination control); Primers: KPCg-colpcrF/R; Expected amplicon: 785 bp.
M 1 2 3 4
800 bp
5 6 7 8 9 10 11 12 13 14 15
785 bp
14028sRif acrAB/ pKpQIL-UK
14028sRif tolC/ pKpQIL-UK
14028sRif acrAB/ pKpQIL-D2
(b) PCR check for the presence of pKpQIL-UK
M 1 2 3 4
400 bp
5 6 7 8 9 10 11
383 bp
14028sRif acrAB/ pKpQIL-UK
14028sRif tolC/ pKpQIL-UK
(a) PCR check for the presence of blaKPC

101
Figure 3.11 PCR verification of 14028sRif/pKpQIL-D2 and 14028sRif tolC/pKpQIL-D2
The various rifampicin-resistant efflux component mutants of S. Typhimurium 14028s were verified by PCR for the presence of the pKpQIL-D2 plasmid’s backbone gene. M: Hyperladder I (Bioline); Lane 13: Plasmid pKpQIL-D2 (Positive control); Lane 14: Plasmid pKpQIL-UK (Negative control); Lane 15: Water (Contamination control); Primers: pMan-F/R; Expected amplicon: 600 bp.
The various rifampicin-resistant efflux component mutants of S. Typhimurium 14028s were verified by PCR for the presence of the pKpQIL-D2 plasmid’s blaKPC
gene. M: Hyperladder I (Bioline); Lane 13: Plasmid pKpQIL-D2 (Positive control); Lane 14: 14028sRif genomic DNA (Negative control); Lane 15: Water (Contamination control); Primers: KPCg-colpcrF/R; Expected amplicon: 785 bp.
M 1 2 3 4 5 6 7 8 9 10 11 12 13 14 15
785 bp800 bp
(a) PCR check for the presence of blaKPC
14028sRif/pKpQIL-D2 14028sRif tolC/pKpQIL-D2
(b) PCR check for the presence of pKpQIL-D2
14028sRif/pKpQIL-D2 14028sRif tolC/pKpQIL-D2
600 bp 600 bp
M 1 2 3 4 5 6 7 8 9 10 11 12 13 14 15

102
The various rifampicin-resistant efflux component mutants of S. Typhimurium 14028s were verified by PCR for the presence of the pKpQIL-D2 plasmid’s backbone gene. M: Hyperladder I (Bioline); Lane 5: Plasmid pKpQIL-D2 (Positive control); Lane 6: Plasmid pKpQIL-UK (Negative control); Lane 7: Water (Contamination control); Primers: pMan-F/R; Expected Amplicon: 600 bp.
Figure 3.12 PCR verification of 14028sRif acrAB/pKpQIL-D2 transconjugants
M 1 2 3 4
600 bp
5 6 7
600 bp
14028sRif acrAB/pKpQIL-D2
PCR check for the presence of pKpQIL-D2
103
3.3.2 The MICs of Antibiotics in Strains Lacking a Component of the AcrAB-TolC
Efflux Pump
The susceptibility of K. pneumoniae Ecl8 and isogenic AcrAB mutant carrying the pKpQIL-
UK plasmid was tested (Table 3.4). No difference in β-lactam antibiotic MIC values was
observed between the plasmid-free strains. However, when pKpQIL-UK was present, the
AcrAB mutant strain showed an 8- and 4-fold decrease in susceptibility to ertapenem and
meropenem, respectively. Similarly the E. coli BW25113 acrB::aph carrying the plasmid
showed a 4-fold decrease in susceptibility to ertapenem. However, the E. coli TolC mutant
was significantly more susceptible to meropenem, doripenem, biapenem and ceftazidime.
Other antibiotics such as chloramphenicol, erythromycin, ciprofloxacin and tetracycline were
included as controls to verify the phenotype of the efflux mutants. As expected, antibiotics
which are known substrates to the AcrAB-TolC efflux system had lower MIC values for the
mutant strains.
The susceptibility of the Salmonella efflux mutants in the presence and absence of the
pKpQIL-UK plasmid was also determined. With the exception of ertapenem in the absence of
the plasmid, there was no difference in susceptibility observed between the parental strain
(14028sRif) and the respective efflux pump component mutants (14028sRif acrAB and
14028sRif tolC) for the β-lactam antibiotics tested (Table 3.4). However, compared to
14028sRif, the TolC mutant showed a 4-fold decrease in ertapenem susceptibility (0.008 µg/ml
to 0.03 µg/ml). Although chloramphenicol is a substrate of this efflux pump, the MIC value
for chloramphenicol was higher in the mutants as a chloramphenicol resistance gene (cat) was
inserted in the efflux pump genes to construct the mutants (Nishino et al., 2006).
In the presence of the blaKPC carbapenemase-encoding pKpQIL-UK, compared to the
parental Salmonella strain (14028sRif), the TolC mutant was 4- to 8-fold less susceptible to

Table 3.4 MIC values of various antibiotics for efflux pump component mutants carrying the pKpQIL-UK plasmid
Strains Genotype Plasmid
Introduced
Antibiotics (µg/ml)
ETP IMI MER DOR BIA CAZ CHL CIP EM TET
E. coli NCTC10418 Wildtype - 0.015 0.25 0.03 0.03 0.06 0.25 2 0.008 32 1
K. pneumoniae Ecl8
Ecl8Rif RifR - 0.015 0.12 0.015 0.03 0.25 0.03 2 0.008 64 0.5
Ecl8Rif acrAB::aph - 0.015 0.12 0.03 0.03 0.25 0.06 1 0.004 4 0.5
Ecl8Rif RifR pKpQIL-UK 4 4 1 2 4 16 4 0.008 64 0.5
Ecl8Rif acrAB::aph pKpQIL-UK 32 8 4 4 8 16 1 0.004 4 0.5
E. coli BW25113
BW25113Rif RifR - 0.015 0.25 0.03 0.06 0.06 0.06 8 0.008 32 2
BW25113Rif acrB::aph - 0.015 0.5 0.03 0.06 0.06 0.06 1 0.004 4 0.5
BW25113Rif tolC::aph - 0.008 0.12 0.015 0.015 0.015 0.03 1 0.002 2 0.5
BW25113Rif RifR pKpQIL-UK 0.12 2 0.25 0.5 2 2 8 0.008 32 1
BW25113Rif acrB::aph pKpQIL-UK 0.5 2 0.25 1 4 2 1 0.004 4 0.5
BW25113Rif tolC::aph pKpQIL-UK 0.06 1 0.03 0.12 0.12 0.5 1 0.002 2 0.5
Continued overleaf.
104

Table 3.4 (Continued) MIC values of various antibiotics for efflux pump component mutants carrying the pKpQIL-UK plasmid
Strains Genotype Plasmid
Introduced
Antibiotics (µg/ml)
ETP IMI MER DOR BIA CAZ CHL CIP EM TET
S. Typhimurium ATCC14028s
14028s Wildtype - 0.015 0.25 0.03 0.03 0.06 0.25 4 0.015 64 2
14028sRif RifR - 0.008 0.5 0.03 0.03 0.03 0.25 8 0.015 128 2
14028sRif acrAB::cat - 0.008 0.12 0.015 0.015 0.03 0.12 >16 0.004 4 0.5
14028sRif tolC::cat - 0.03 0.25 0.03 0.03 0.06 0.5 >16 0.004 2 0.5
14028sRif RifR pKpQIL-UK 2 4 1 1 4 8 8 0.015 64 2
14028sRif acrAB::cat pKpQIL-UK 2 4 2 1 4 8 >16 0.004 4 0.5
14028sRif tolC::cat pKpQIL-UK 16 8 8 4 4 32 >16 0.004 2 0.5
ETP: Ertapenem; IMI: Imipenem; MER: Meropenem; DOR: Doripenem; BIA: Biapenem; CAZ: Ceftazidime; CHL: Chloramphenicol; CIP: Ciprofloxacin; EM: Erythromycin; TET: Tetracycline; Bolded fonts denote significant increase/decrease in MIC values; Changes of 4-fold or more in MIC values are considered significant.
105

106
three carbapenem antibiotics (ertapenem, meropenem and doripenem). No significant
difference in MIC value was observed for biapenem between the strains. A similar increase in
the MIC value of ceftazidime was also observed. Compared to the parental strain (14028sRif),
there was no significant difference in MIC values between the 14028sRif AcrAB mutant
carrying the plasmid.
3.4 The Salmonella TolC Mutant is Less Susceptible to β-lactam Antibiotics and This
is Not Specific to Carbapenemase
The AcrAB-TolC efflux system is one of the most well characterised RND efflux pump
which is highly conserved among Gram-negative bacteria (Piddock, 2006a, Nikaido and
Zgurskaya, 2001). It has been reported that the amino acid identity of AcrA and AcrB proteins
among Proteus mirabilis, E. coli, K. pneumoniae and Enterobacter aerogenes is 75%. The
acrB gene shares about 85-88% identity among the latter three bacteria (Visalli et al., 2003).
The S. Typhimurium AcrAB-TolC has also been shown to have high DNA sequence identity
(>70%) and amino acid similarity (>80%) with its E. coli counterpart (Piddock, 2006a). The
AcrAB-TolC protein sequence identities of the various strains used in this PhD study were
compared to K. pneumoniae MGH78578 by BlastP (Table 3.5). It is well established that S.
Typhimurium is a model organism for studying Gram-negative bacteria as there are tractable
infection models (Garai et al., 2012). Therefore, the AcrAB-TolC efflux system in this
bacterium has been used in this PhD study as a model to investigate its contribution towards
carbapenem resistance in other Gram-negative bacteria.
Although it was observed that the carriage of the pKpQIL-UK plasmid in the TolC
mutant conferred higher resistance to β-lactam antibiotics compared to the 14028sRif/pKpQIL-
UK, it was hypothesised that this observation was specific to this plasmid. Hence, in order to
investigate whether the increase in MIC values of the various β-lactam antibiotics tested was a

107
Table 3.5 Protein sequence homology of AcrAB-TolC efflux system
Species Genbank
Accession No.
Percentage Protein Sequence Identity (Coverage)
AcrA AcrB TolC
K. pneumoniae MGH78578 CP000647 - - -
K. pneumoniae Ecl8 HF536482 100 (100) 100 (100) 99 (100)
E. coli K12 MG1655 U00096 85 (100) 92 (100) 84 (99)
E. coli BW25113 CP009273 85 (100) 92 (100) 84 (99)
S. Typhimurium 14028s CP001363 85 (99) 92 (100) 86 (100)
S. Typhimurium SL1344 FQ312003 85 (99) 92 (100) 86 (100)
AcrAB-TolC efflux pump protein sequence identity of the various strains was compared to K. pneumoniae MGH78578

108
result specific to pKpQIL-UK, its variant (pKpQIL-D2) and a blaNDM carbapenemase-
encoding plasmid (pNDM-HK) were tested. The plasmid pNDM-HK was transferred into S.
Typhimurium 14028sRif, 14028sRif acrAB and 14028sRif tolC strains by filter conjugation. All
transconjugants were verified by PCR for the presence of the carbapenemase gene (Figure
3.13a) and a backbone fragment of the plasmid (Primers: pHK-F/R; 1407 bp) (Figure 3.13b).
A similar increase in MIC values of ertapenem, meropenem, doripenem and ceftazidime was
observed for the plasmid pKpQIL-D2 and the unrelated pNDM-HK in the TolC mutant
(Table 3.6). Together, these data suggest that the increase in carbapenem MIC value was not
due to the presence of the blaKPC gene or the plasmids used, but instead due to a different
mechanism of resistance.
To determine whether the reduction in carbapenem susceptibility was also observed
when a non-carbapenemase β-lactamase was present. The MICs of antibiotics for S.
Typhimurium SL1344 and its isogenic efflux mutants (∆acrA, ∆acrB and ∆tolC) carrying a
blaTEM-1 β-lactamase-encoding plasmid (pUC18) were also determined. Except for ertapenem,
no significant difference was observed in the MIC values for the various β-lactam antibiotics
tested. Compared to S. Typhimurium SL1344/pUC18, SL1344 ∆tolC/pUC18 was 4-fold less
susceptible to ertapenem (Table 3.6). These data further suggest that the reduced
susceptibility to β-lactam antibiotics observed in the S. Typhimurium TolC mutant is not
specific to the plasmids or β-lactamase genes it carries.
3.5 Increased Carbapenem Resistance is Not Associated with Passive Release of
Carbapenemase from the Periplasmic Space of the Salmonella Efflux Mutant
Previous study has suggested that the membrane of an E. coli TolC mutant is under stress as
there was an increase in the expression of the Tol-Pal system which is essential for
maintaining membrane integrity (Cascales et al., 2002, Dhamdhere and Zgurskaya, 2010).

109
The various rifampicin-resistant efflux component mutants of S. Typhimurium 14028s were verified by PCR for the presence of the pNDM-HK plasmid’s blaNDM gene. M: Hyperladder I (Bioline); Lane 13: Plasmid pNDM-HK (Positive control); Lane 14: 14028sRif genomic DNA (Negative control); Lane 15: Water (Contamination control); Primers: NDM1-colpcrF/R; Expected amplicon: 578 bp.
Figure 3.13 PCR verification of transconjugants of 14028sRif and its mutants carrying the plasmid pNDM-HK
The various rifampicin-resistant efflux component mutants of S. Typhimurium 14028s were verified by PCR for the presence of the pNDM-HK plasmid’s backbone gene. M: Hyperladder I (Bioline); Lane 13: Plasmid pNDM-HK (Positive control); Lane 14: 14028sRif genomic DNA (Negative control); Lane 15: Water (Contamination control); Primers: pHK-F/R; Expected amplicon: 1407 bp.
(a) PCR check for the presence of blaNDM-1
M 1 2 3 4
600 bp
5 6 7 8 9 10 11 12 13 14 15
578 bp
14028sRif/ pNDM-HK
14028sRif acrAB/ pNDM-HK
14028sRif tolC/ pNDM-HK
(b) PCR check for the presence of pNDM-HK
1500 bp 1407 bp
M 1 2 3 4 5 6 7 8 9 10 11 12 13 14 15
14028sRif/ pNDM-HK
14028sRif acrAB/ pNDM-HK
14028sRif tolC/ pNDM-HK

Table 3.6 MIC values of various antibiotics for efflux pump component mutants carrying various plasmids
Strains Genotype Plasmid
Introduced
Antibiotics (µg/ml)
ETP IMI MER DOR BIA CAZ CHL CIP EM TET
S. Typhimurium ATCC14028s
14028sRif RifR pKpQIL-D2 1 4 1 1 4 8 8 0.016 64 2
14028sRif acrAB::cat pKpQIL-D2 2 4 1 1 4 8 >16 0.004 4 0.5
14028sRif tolC::cat pKpQIL-D2 16 8 4 4 4 32 >16 0.004 2 0.5
14028sRif RifR pNDM-HK 8 8 4 8 2 >512 8 0.016 256 2
14028sRif acrAB::cat pNDM-HK 8 8 4 4 2 >512 >16 0.004 512 0.5
14028sRif tolC::cat pNDM-HK 32 16 16 16 1 >512 >16 0.004 128 0.5
S. Typhimurium SL1344
SL1344 Wildtype - 0.03 0.5 0.06 0.125 0.06 2 8 0.016 64 2
SL1344 ∆acrA pUC18 0.03 0.5 0.06 0.125 0.125 2 1 0.004 2 0.5
SL1344 ∆acrB pUC18 0.03 0.5 0.06 0.125 0.25 2 1 0.004 2 0.5
SL1344 ∆tolC pUC18 0.125 1 0.125 0.25 0.125 2 1 0.002 2 0.5
ETP: Ertapenem; IMI: Imipenem; MER: Meropenem; DOR: Doripenem; BIA: Biapenem; CAZ: Ceftazidime; CHL: Chloramphenicol; CIP: Ciprofloxacin; EM: Erythromycin; TET: Tetracycline; Bolded fonts denote significant increase/decrease in MIC values; Changes of 4-fold or more in MIC values are considered significant.
110
111
E. coli TolC mutant is also known to have an alteration in its lipopolysaccharide which
compromises its membrane integrity and permeability, resulting in passive release of enzymes
including RNase and β-lactamase (Cascales et al., 2002, Li et al., 2012, Stone and Miller,
1995). As the increased carbapenem MIC values were only observed when the carbapenemase
gene was associated with the S. Typhimurium TolC mutant, it was hypothesised that S.
Typhimurium TolC mutant leaked carbapenemase into the external environment, thereby
hydrolysing the carbapenem and preventing it from reaching its target. This results in the
higher carbapenem MIC values in the TolC mutant. To explore this hypothesis, the hydrolytic
activity of the crude cell lysates of the three strains (14028sRif, 14028sRif acrAB and 14028sRif
tolC) carrying the plasmid pKpQIL-UK was tested using nitrocefin. The crude lysates of these
three strains showed comparable hydrolytic activity against nitrocefin (Figure 3.14). As the
amount of total protein in the supernatant was insufficient (15 µg of total protein was required
for hydrolysis of nitrocefin), the carbapenemase activity in the supernatant (i.e. LB broth
which the strains were grown in) could not be determined directly. A release of
carbapenemase enzyme from the cell would cause the hydrolytic activity in the crude cell
lysate to decrease as there would be lesser enzymes within the bacterial cell. If the bacterial
cells with higher membrane permeability (i.e. compromised membrane integrity) were lysed
and used for the β-lactamase assay, the slope of the graph showing the initial hydrolysis of
nitrocefin would be reduced corresponding to the lower hydrolytic activity. However, this was
not observed, suggesting no passive release of carbapenemase into the environment was
detected.

112
All values were mean ± standard deviation of three independent experiments. The carbapenemase activity in the crude lysate was tested with nitrocefin to determine the difference in the total amount of the carbapenemase in the three S. Typhimurium strains. The initial enzyme activity represented by the slope from the 10th to the 50th second was not significantly different (Analysed by GraphPad Prism).
Figure 3.14 β-lactamase activity assay for pKpQIL-UK carrying Salmonella and isogenic efflux pump component mutants

113
3.6 Efflux Inhibitor Alters Susceptibility to Some β-lactam Antibiotics
3.6.1 PAβN Reduces β-lactam Antibiotic Susceptibility in K. pneumoniae, E. coli and
Salmonella
As a complete set efflux mutant was available for S. Typhimurium, the effect of the efflux
inhibitor (PAβN) was tested on this set of carbapenemase-producing strains. PAβN has been
repeatedly shown to decrease the susceptibility of some antibiotics, including β-lactams and
fluoroquinolones (Piddock, 2006a). The TolC mutant had the lowest MIC value for PAβN (50
µg/ml). Hence, the MIC values for the antibiotics were determined in the presence of a sub-
inhibitory concentration, 25 µg/ml PAβN (Table 3.7). In the presence of PAβN, there was a 4-
to 16-fold increase in the MIC of ertapenem for the wildtype and AcrAB mutant carrying the
pKpQIL-UK, pNDM-HK or pUC18 plasmids. The increase in MIC was similar to the trend
observed between the wildtype S. Typhimurium 14028sRif and its isogenic TolC mutant
carrying the plasmids in the absence of PAβN. Apart from S. Typhimurium SL1344/pUC18,
which showed a 4-fold increase in cephalothin susceptibility in the presence of PAβN, no
other strain carrying any of the plasmids showed differences in cephalothin susceptibility in
the presence and absence of PAβN.
To investigate the role of RND efflux pumps in the susceptibility of the strains to
carbapenem antibiotics, CCCP, a proton-motive force uncoupler was used to remove the
energy source required for RND efflux pumps (Richmond et al., 2013). Except for S.
Typhimurium 14028sRif/pNDM-HK, which showed 4-fold decrease in the ertapenem MIC
value (8 µg/ml to 2 µg/ml), generally no difference in the MIC values of ertapenem and
cephalothin were observed in the presence of 25 µM CCCP. Tetracycline was included as a
control to detect reduced efflux function in the presence of 25 µg/ml PAβN and 25 µM CCCP.
The S. Typhimurium and E. coli TolC mutants were tested in the presence of 3 µM CCCP as

Table 3.7 Effects of PAβN and CCCP on MIC of β-lactam antibiotics
Strains Genotype Plasmid
Introduced ETP CEP TET
PAβN CCCP - +PAβN +CCCP - +PAβN +CCCP - +PAβN +CCCP
E. coli NCTC 10418
Wildtype - 0.015 0.015 0.015 8 16 8 1 0.5 0.25 200 50
S. Typhimurium 14028s
14028sRif RifR pKpQIL-UK 2 32 2 1024 2048 512 2 1 1 400 100
14028sRif acrAB::cat pKpQIL-UK 2 16 2 512 512 512 0.5 0.25 0.25 100 100
14028sRif tolC::cat pKpQIL-UK 16 8 32 512 128 1024 0.5 0.12 0.5 50 12.5
14028sRif RifR pNDM-HK 8 64 2 2048 2048 2048 2 1 1 400 100
14028sRif acrAB::cat pNDM-HK 8 32 4 1024 1024 1024 0.5 0.25 0.25 100 100
14028sRif tolC::cat pNDM-HK 32 4 64 512 32 512 0.5 0.12 0.5 50 12.5
S. Typhimurium SL1344
SL1344 Wildtype pUC18 0.03 0.5 0.03 512 2048 512 2 1 1 400 100
SL1344 ∆acrA pUC18 0.03 0.25 0.03 512 512 256 0.5 0.25 0.25 50 200
SL1344 ∆acrB pUC18 0.03 0.25 0.06 512 1024 512 0.5 0.25 0.25 100 100
SL1344 ∆tolC pUC18 0.12 0.25 0.06 512 128 512 0.5 0.25 0.25 50 12.5
All values are in µg/ml. Unit for CCCP is in µM. ETP: Ertapenem; CEP: Cephalothin; TET: Tetracycline; PAβN: Phenylalanine-arginine-β-naphthylamide; CCCP: Carbonyl cyanide m-chlorophenyl hydrazone; Bolded fonts denote significant increase/decrease in MIC (without efflux inhibitors); Bolded and underlined fonts denote significant increase in MIC (with efflux inhibitors); TolC mutants were tested in the presence of 3 µM CCCP. All other strains were tested in the presence of 25 µM CCCP.
114

115
the MIC value for CCCP was 12.5 µM. E. coli DH10B carrying the plasmids also showed a
similar decrease in ertapenem susceptibility in the presence of PAβN (Table 3.8). In the
presence of PAβN, even without the carbapenemase-encoding plasmids, E. coli DH10B was
less susceptible to ertapenem and cephalothin. In the absence of the plasmids, the S.
Typhimurium 14028sRif and its isogenic AcrAB mutant were also less susceptible to
ertapenem and cephalothin in the presence of PAβN.
Another known efflux inhibitor 1-(1-naphtylmethyl)-piperazine (NMP) and a novel
AcrAB specific inhibitor (denoted as Compound A) were used to investigate whether the
decrease in susceptibility towards ertapenem was specific to PAβN. In order to determine
which concentration of the compounds would give a similar inhibitory effect to that of 25
µg/ml PAβN, Hoechst H33342 accumulation assays comparing 25 µg/ml of PAβN with
varying concentrations of NMP and Compound A were carried out using the parental S.
Typhimurium 14028sRif carrying pKpQIL-UK. The AcrAB mutant was included as a control.
It was found that 2.5 µg/ml Compound A (Figure 3.15a) and 100 µg/ml NMP (Figure 3.15b)
gave comparable intracellular accumulation of H33342 to that in the presence of 25 µg/ml
PAβN.
No difference in susceptibility was observed in the presence of various efflux
inhibitors for the K. pneumoniae Ecl8Rif carrying the pKpQIL-UK plasmid. Only in the
presence of PAβN, did the isogenic K. pneumoniae Ecl8Rif AcrAB mutant carrying the
pKpQIL-UK show a difference: a 16-fold increase in susceptibility to ertapenem. In contrast,
and as found for Salmonella, the series of pKpQIL-UK carrying E. coli BW25113Rif (wildtype,
AcrB and TolC mutants) had decreased susceptibility to ertapenem in the presence of PAβN
and NMP. The E. coli TolC mutant was less susceptible to ertapenem in the presence of

Table 3.8 Effects of PAβN and CCCP on MIC of β-lactam antibiotics
Strains Genotype Plasmid
Introduced ETP CEP TET
PAβN CCCP - +PAβN +CCCP - +PAβN +CCCP - +PAβN +CCCP
S. Typhimurium 14028s
14028s Wildtype - 0.008 0.03 0.015 4 16 4 2 1 1 >400 100
14028sRif RifR - 0.008 0.03 0.008 4 16 4 2 1 1 400 100
14028sRif acrAB::cat - 0.008 0.03 0.008 0.5 4 0.5 0.5 0.5 0.5 100 100
14028sRif tolC::cat - 0.03 0.015 0.03 0.5 0.12 1 0.5 0.25 0.5 50 12.5
S. Typhimurium SL1344
SL1344 Wildtype - 0.015 0.015 0.015 4 16 4 2 1 1 >400 100
SL1344Rif RifR - 0.008 0.03 0.008 4 16 4 2 1 1 >400 100
E. coli DH10B
DH10B Wildtype - 0.015 0.06 0.015 4 16 4 2 1 1 200 100
DH10B Wildtype pKpQIL-UK 1 4 2 256 512 256 2 1 1 200 100
DH10B Wildtype pKpQIL-D2 1 4 1 256 512 256 2 1 1 200 100
DH10B Wildtype pNDM-HK 8 32 16 1024 2048 1024 2 1 1 200 100
All values are in µg/ml. Unit for CCCP is in µM. ETP: Ertapenem; CEP: Cephalothin; TET: Tetracycline; PAβN: Phenylalanine-arginine-β-naphthylamide; CCCP: Carbonyl cyanide m-chlorophenyl hydrazone; Bolded fonts denote significant increase/decrease in MIC (without efflux inhibitors); Bolded and underlined fonts denote significant increase in MIC (with efflux inhibitors); TolC mutants were tested in the presence of 3 µM CCCP. All other strains were tested in the presence of 25 µM CCCP.
116
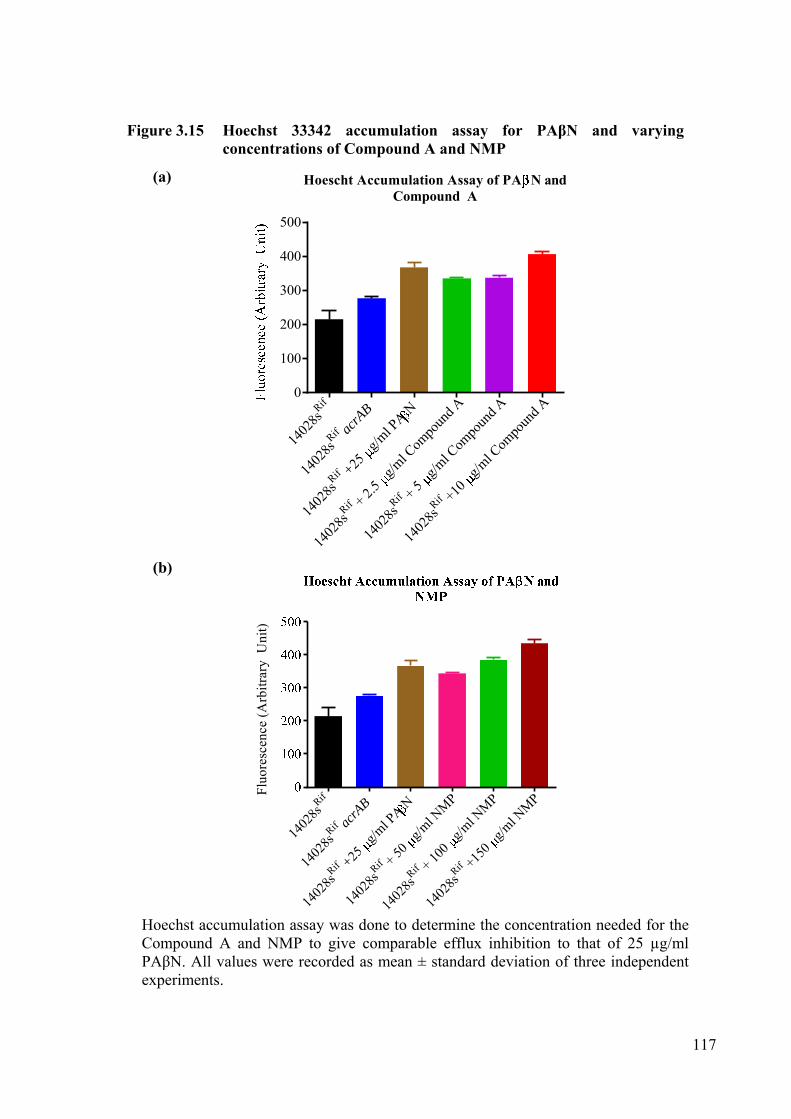
117
Hoechst accumulation assay was done to determine the concentration needed for the Compound A and NMP to give comparable efflux inhibition to that of 25 µg/ml PAβN. All values were recorded as mean ± standard deviation of three independent experiments.
Figure 3.15 Hoechst 33342 accumulation assay for PAβN and varying concentrations of Compound A and NMP
(a)
(b)
Hoescht Accumulation Assay of PA N andCompound A
1402
8sRif
1402
8sRif ac
rAB
1402
8sRif +25
g/m
l PA
N
1402
8sRif +
2.5
g/ml C
ompo
und A
1402
8sRif +
5 g/m
l Com
poun
d A
1402
8sRif +
10
g/ml C
ompo
und A
0
100
200
300
400
500
1402
8sRif
1402
8sRif ac
rAB
1402
8sRif +25
g/m
l PA
N
1402
8sRif +
50
g/ml N
MP
1402
8sRif +
100
g/ml N
MP
1402
8sRif +
150
g/ml N
MP
Flu
ores
cenc
e (A
rbit
rary
Uni
t)

118
CCCP and Compound A. In the presence of NMP, the Salmonella and isogenic efflux mutants
carrying pKpQIL-UK were 4- to 8-fold less susceptible to ertapenem (Table 3.9).
As it was found that S. Typhimurium TolC mutant carrying a blaTEM-1 encoding
plasmid had reduced susceptibility to ertapenem, the susceptibility of S. Typhimurium strains
carrying a blaCTX-M-14 (ESBL)-encoding plasmid (pCT) was also determined in the presence
of the various efflux inhibitors. In the presence of PAβN, both S. Typhimurium 14028sRif/pCT
and 14028sRif acrAB/pCT had a 4-fold reduction in susceptibility to ertapenem. However, the
14028sRif tolC/pCT strain was more susceptible to ertapenem in the presence of PAβN.
Nonetheless it was 4- and 8-fold less susceptible to ertapenem in the presence of Compound
A and NMP, respectively. Inactivation of the blaCTX-M-14 gene on pCT showed that the ESBL
enzyme played a minimal role in the susceptibility of the strains towards ertapenem (Table
3.9).
3.6.2 PAβN Increases Carbapenem Resistance in Clinical Isolates of
Enterobacteriaceae
As data from this study suggested that PAβN conferred increased resistance to some β-lactam
antibiotics, it was hypothesised that the PAβN-associated decrease in β-lactam antibiotic
susceptibility would be observed among clinical isolates of Enterobacteriaceae. Hence, the
effect of PAβN on the susceptibility of clinical isolates of carbapenemase producing
Enterobacteriaceae was investigated. Eighty six non-replicate of clinical isolates from Public
Health England were tested for their ertapenem susceptibility in the absence and presence of
25 µg/ml PAβN. The isolates included various species including Klebsiella oxytoca (n = 4), K.
pneumoniae (n = 25), Enterobacter asburiae (n = 1), E. aerogenes (n = 3), E. cloacae (n = 22),
Enterobacter gergoviae (n = 2) and E. coli (n = 29). Each of these strains carry one of the

119
Table 3.9 Ertapenem MIC in the presence of various efflux inhibitors
Strains Genotype Plasmid
Introduced MIC of Ertapenem (µg/ml)
- +PABN +CCCP + A +NMPE. coli
NCTC10418 Wildtype - 0.015 0.015 0.015 0.015 0.015
K. pneumoniae Ecl8
Ecl8Rif RifR pKpQIL-UK 4 8 4 4 4
Ecl8Rif acrAB::cat pKpQIL-UK 32 2 32 32 32
E. coli BW25113
BW25113Rif RifR pKpQIL-UK 0.12 1 0.12 0.12 0.5
BW25113Rif acrB::aph pKpQIL-UK 0.5 4 1 1 4
BW25113Rif tolC::aph pKpQIL-UK 0.06 0.25 0.5 0.25 0.5
S. Typhimurium ATCC14028s
14028sRif RifR - 0.008 0.03 0.008 0.008 0.015
14028sRif acrAB::cat - 0.008 0.015 0.008 0.008 0.015
14028sRif tolC::cat - 0.015 0.008 0.03 0.03 0.06
14028sRif RifR pKpQIL-UK 2 32 2 2 16
14028sRif acrAB::cat pKpQIL-UK 1 4 2 2 8
14028sRif tolC::cat pKpQIL-UK 16 0.008 32 32 64
S. Typhimurium SL1344
SL1344Rif RifR pKpQIL-UK 1 8 2 2 8
SL1344 ompC::aph pKpQIL-UK 2 32 2 2 8
SL1344 ompF::aph pKpQIL-UK 16 32 16 16 16
SL1344 ∆ompC
ompF::aph pKpQIL-UK 32 64 32 32 32
Continued overleaf.

120
Table 3.9 (Continued) Ertapenem MIC in the presence of various efflux inhibitors
Strains Genotype Plasmid
Introduced MIC of Ertapenem (µg/ml)
- +PABN +CCCP + A +NMPS. Typhimurium ATCC14028s
14028sRif RifR pCT 0.015 0.06 0.015 0.015 0.03
14028sRif acrAB::cat pCT 0.015 0.06 0.015 0.015 0.03
14028sRif tolC::cat pCT 0.03 0.008 0.06 0.12 0.25
14028sRif RifR pCT blaCTX-M-
14::aph 0.008 0.03 0.008 0.004 0.016
14028sRif acrAB::cat pCT blaCTX-M-
14::aph 0.008 0.015 0.008 0.004 0.008
14028sRif tolC::cat pCT blaCTX-M-
14::aph 0.015 0.008 0.03 0.03 0.06
All values are in µg/ml. PAβN: Phenylalanine-arginine-β-naphthylamide; CCCP: Carbonyl cyanide m-chlorophenyl hydrazone; Compound A: Novel AcrAB specific inhibitor; NMP: 1-(1-naphthylmethyl)-piperazine; Bolded fonts denote significant increase/decrease in MIC (when inhibitors are added); TolC mutants were tested in the presence of 3 µM CCCP. All other strains were tested in the presence of 25 µM CCCP.

121
major carbapenemase genes found in the UK i.e. blaOXA-48 (n = 18), blaIMP (n = 12), blaVIM (n
= 16), blaNDM (n = 20) and blaKPC (n = 20).
In the presence of 25 µg/ml PAβN, 42% (n = 36) of the Enterobacteriaceae isolates
became 4-fold or more resistant to ertapenem (Table 3.10a). 26% (n = 22) and 30% (n = 26)
of the isolates showed no change or a 2-fold increase in ertapenem MIC values, respectively.
When compared to the ertapenem MIC values in the absence of the inhibitor, only two
isolates were more susceptible to ertapenem in the presence of PAβN.
To investigate whether a higher concentration of PAβN would result in a larger
number of clinical isolates showing greater resistance to ertapenem, 100 µg/ml PAβN was
used. At this concentration and compared with 25 µg/ml PAβN, the number of isolates for
which the ertapenem MIC increased 4-fold was reduced to seven (8.1%). A total of 26 (30.2%)
and 33 (38.4%) isolates showed 2-fold increase or no changes in ertapenem MIC value,
respectively. Twenty isolates (ca. 23%) showed more than 2-fold increase in ertapenem
susceptibility. The 36 isolates for which 25 µg/ml PAβN conferred a 4-fold or more increase
in the ertapenem MIC were affected differently when 100 µg/ml PAβN was used (Table
3.10b). At the higher PAβN concentration, only seven of the isolates were 4-fold less
susceptible to ertapenem compared to when no PAβN was added. Of the remaining isolates,
23 were 2-fold less susceptible and 6 isolates had no change in ertapenem MIC value. In the
presence of 25 µg/ml PAβN, the MIC50 and MIC90 values of the clinical isolates increased 4-
and 2-fold, respectively. However, no changes in MIC50 and MIC90 values were observed in
the presence of 100 µg/ml PAβN (Table 3.11).

122
Table 3.10 Changes in ertapenem resistance of clinical isolates in the presence of PAβN
(a) Comparison of the changes in ertapenem resistance between two PAβN concentrations
Changes in MIC
25 µg/ml PAβN 100 µg/ml PAβN
Number of isolates
Percentage (%) Number of isolates
Percentage (%)
≥4-fold Reduction - - 6 7.0
2-fold Reduction 2 2.3 14 16.3
No Change 22 25.6 33 38.4
2-fold Increase 26 30.2 26 30.2
≥4-fold Increase 36ϯ 41.9 7 8.1
Total 86 100.0 86 100.0
ϯThe impact of 100 µg/ml PAβN on this 36 isolates were recorded in (b).
(b) The impact of 100 µg/ml PAβN on the isolates which showed 4-fold increase or more in ertapenem MIC in the presence of 25 µg/ml PAβN
Concentration
The number of isolates (%) with altered ertapenem MIC in the presence of PAβN* Total
number of isolates
No Change 2-fold Increase 4-fold Increase
100 µg/ml 6 (16.7) 23 (63.9) 7 (19.4) 36
*Changes in ertapenem MIC is relative to the MIC of ertapenem in the absence of PAβN
The MIC values of ertapenem were determined for a set of 86 non-replicate clinical isolates of various Enterobacteriaceae (Klebsiella spp., E. coli and Enterobacter spp.), each carrying one of the five major carbapenemase genes (blaKPC, blaNDM, blaVIM, blaIMP and blaOXA-48) detected in the UK. (a) The changes in the susceptibility of the isolates in the presence of 25 and 100 µg/ml PAβN. (b) The effect of 100 µg/ml of PAβN on the susceptibility of the 36 isolates (ϯ) which showed ≥4-fold increase in ertapenem MIC value in the presence of 25 µg/ml PAβN. The MIC values were determined on two separate occasions.
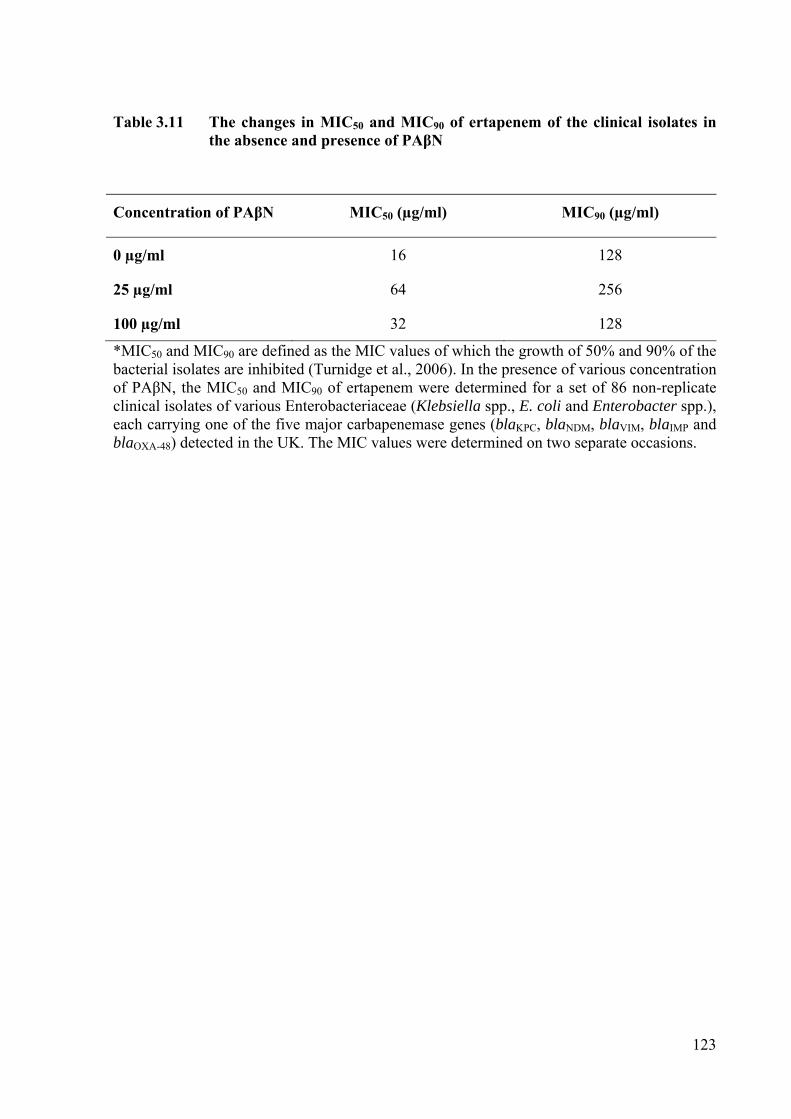
123
Table 3.11 The changes in MIC50 and MIC90 of ertapenem of the clinical isolates in the absence and presence of PAβN
Concentration of PAβN MIC50 (µg/ml) MIC90 (µg/ml)
0 µg/ml 16 128
25 µg/ml 64 256
100 µg/ml 32 128
*MIC50 and MIC90 are defined as the MIC values of which the growth of 50% and 90% of the bacterial isolates are inhibited (Turnidge et al., 2006). In the presence of various concentration of PAβN, the MIC50 and MIC90 of ertapenem were determined for a set of 86 non-replicate clinical isolates of various Enterobacteriaceae (Klebsiella spp., E. coli and Enterobacter spp.), each carrying one of the five major carbapenemase genes (blaKPC, blaNDM, blaVIM, blaIMP and blaOXA-48) detected in the UK. The MIC values were determined on two separate occasions.

124
3.7 PAβN and Lack of TolC Alter the Porin Profile and Confers Decreased
Susceptibility to β-lactam Antibiotics
3.7.1 Outer Membrane Protein Mutants Showed Reduced Susceptibility to Ertapenem
As there was no effect on the MICs in the absence of AcrB, it was hypothesised that the
PAβN effect on the MICs was due to this compound altering expression of the outer
membrane proteins. Furthermore, it was hypothesised that reduction in outer membrane
protein expression, possibly porin proteins, caused the observed reduced susceptibility to
ertapenem. Hence, plasmid pKpQIL-UK was transferred by filter conjugation into S.
Typhimurium SL1344 in which the genes encoding major outer membrane proteins (OmpC
and OmpF) have been inactivated (henceforth called SL1344 ompC, SL1344 ompF and
SL1344 ompCF double mutant). The transconjugants were verified by PCR (Figure 3.16 &
3.17) and the lack of the respective outer membrane proteins were verified by SDS-PAGE
(Figure 3.18) (Please also see Section 3.7.2).
Without the carbapenemase-producing plasmid, compared to the wildtype S.
Typhimurium SL1344 there was a 2-fold increase in the ertapenem MIC value between the
OmpC and OmpF double mutant (SL1344 ompCF) (Table 3.12). However, there was a larger
difference (4-fold increase) in the cephalothin MIC value between these two strains. In the
presence of the plasmid pKpQIL-UK, the increase in ertapenem MIC value was more
apparent for the OmpF mutant (8-fold increase) and OmpC-OmpF double mutants (16-fold
increase). An increase in MIC value was also observed for cephalothin.
There was also a 16-fold increased in the ertapenem MIC value for S. Typhimurium
SL1344Rif/pKpQIL-UK in the presence of 25 µg/ml PAβN. When PAβN was present, this
increase in carbapenem resistance was greater for the S. Typhimurium OmpC mutant (16-
fold), than the OmpF and OmpCF mutants (4-fold) (Table 3.12). The changes in the MIC of

125
The various porin mutants of S. Typhimurium SL1344 were verified by PCR for the presence of the pKpQIL-UK plasmid’s blaKPC gene. M: Hyperladder I (Bioline); Lane 10: Plasmid pKpQIL-UK (Positive control); Lane 11: SL1344 genomic DNA (Negative control); Lane 12: Water (Contamination control); Primers: KPCg-colpcrF/R; Expected amplicon: 785 bp.
Figure 3.16 PCR verification of SL1344 porin mutants carrying pKpQIL-UK
The various porin mutants of S. Typhimurium SL1344 were verified by PCR for the presence of the pKpQIL-UK plasmid’s backbone gene. M: Hyperladder I (Bioline); Lane 10: Plasmid pKpQIL-UK (Positive control); Lane 11: Plasmid pKpQIL-D2 (Negative control); Lane 12: Water (Contamination control); Primers: pQIL-F/R; Expected amplicon: 383 bp.
M 1 2 3 4
800 bp
5 6 7 8 9 10 11 12
(a) PCR check for the presence of blaKPC SL1344 ompC/ pKpQIL-UK
SL1344 ompF/ pKpQIL-UK
SL1344 ompCF/ pKpQIL-UK
785 bp
(b) PCR check for the presence of pKpQIL-UK
400 bp
M 1 2 3 4 5 6 7 8 9 10 11 12
SL1344 ompC/ pKpQIL-UK
SL1344 ompF/ pKpQIL-UK
SL1344 ompCF/ pKpQIL-UK
383 bp
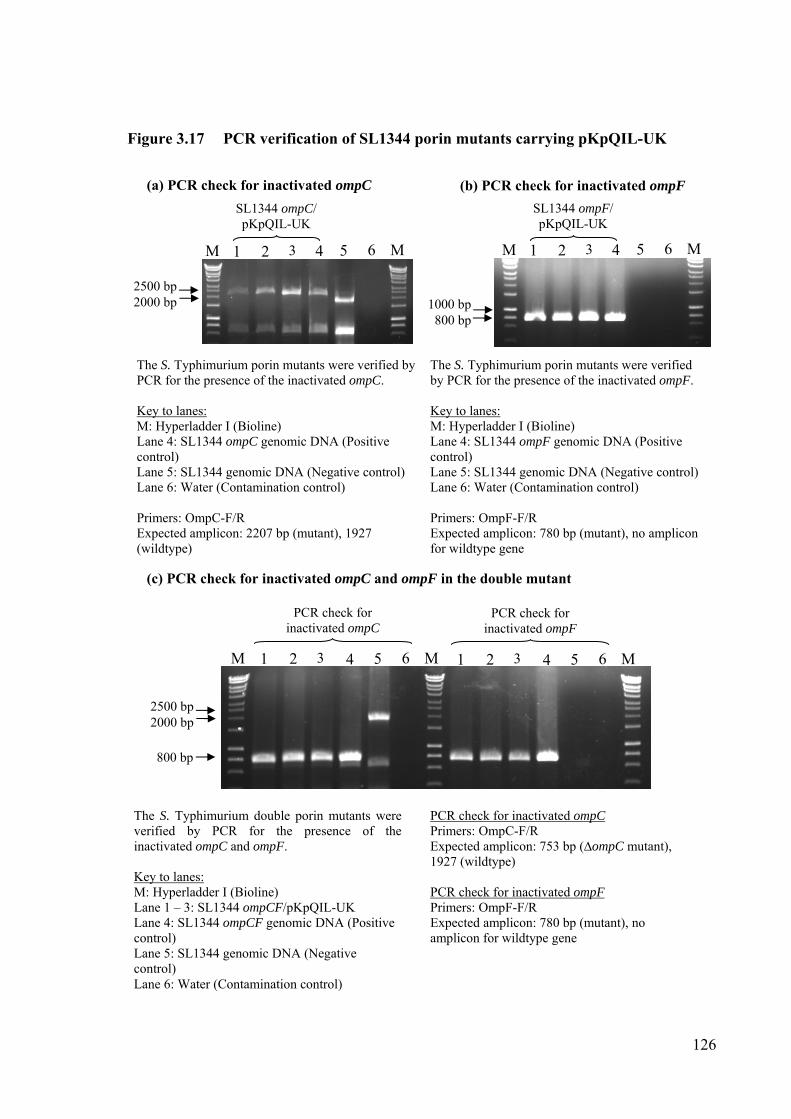
126
Figure 3.17 PCR verification of SL1344 porin mutants carrying pKpQIL-UK
The S. Typhimurium porin mutants were verified by PCR for the presence of the inactivated ompC. Key to lanes: M: Hyperladder I (Bioline) Lane 4: SL1344 ompC genomic DNA (Positive control) Lane 5: SL1344 genomic DNA (Negative control) Lane 6: Water (Contamination control) Primers: OmpC-F/R Expected amplicon: 2207 bp (mutant), 1927 (wildtype)
The S. Typhimurium porin mutants were verified by PCR for the presence of the inactivated ompF. Key to lanes: M: Hyperladder I (Bioline) Lane 4: SL1344 ompF genomic DNA (Positive control) Lane 5: SL1344 genomic DNA (Negative control) Lane 6: Water (Contamination control) Primers: OmpF-F/R Expected amplicon: 780 bp (mutant), no amplicon for wildtype gene
The S. Typhimurium double porin mutants were verified by PCR for the presence of the inactivated ompC and ompF. Key to lanes: M: Hyperladder I (Bioline) Lane 1 – 3: SL1344 ompCF/pKpQIL-UK Lane 4: SL1344 ompCF genomic DNA (Positive control) Lane 5: SL1344 genomic DNA (Negative control) Lane 6: Water (Contamination control)
PCR check for inactivated ompC Primers: OmpC-F/R Expected amplicon: 753 bp (∆ompC mutant), 1927 (wildtype) PCR check for inactivated ompF Primers: OmpF-F/R Expected amplicon: 780 bp (mutant), no amplicon for wildtype gene
2500 bp 2000 bp
(a) PCR check for inactivated ompC
M 1 2 3 4 5 6 M M 1 2 3 4 5 6 M
1000 bp 800 bp
(c) PCR check for inactivated ompC and ompF in the double mutant
(b) PCR check for inactivated ompF
SL1344 ompC/ pKpQIL-UK
SL1344 ompF/ pKpQIL-UK
2500 bp 2000 bp
M 1 2 3 4 5 6 M
800 bp
1 2 3 4 5 6 M
PCR check for inactivated ompC
PCR check for inactivated ompF

127
Figure 3.18 Outer membrane protein profile of Salmonella Typhimurium SL1344 and its isogenic efflux pump mutants
(a) SDS-PAGE comparing the outer membrane porin profile of the various S. Typhimurium strains. (b) 6 µg of the total protein of SL1344 OmpC mutant was loaded to allow the faint band migrating slightly slower than the OmpD protein to be excised for mass spectrometry. Ladder: PageRuler Plus Prestained Protein Ladder (Thermo Scientific) Band C, D, A and F were determined as OmpC, OmpD, OmpA and OmpF, respectively by mass spectrometry. The amount of total protein was determined by Bradford assay and 2 µg of total protein was loaded per lane. The blue box indicates equal loading of each sample.
SL
1344
55 kDa
35 kDa
25 kDa
15 kDa
C D A
F
Lad
der
100
µg/
ml P
AβN
25 µ
g/m
l PAβN
SL
1344
tol C
::ap
h
SL
1344
acr
B::
aph
SL
1344
om
pF::
aph
SL
1344
om
pC::
aph
SL
1344
∆om
pC o
mpF
::ap
h
Lad
der
(a)
6 µ
g S
L13
44 o
mpC
::ap
h
(b)
F

Table 3.12 Effects of PAβN and CCCP on MIC of β-lactam antibiotics
Strains Genotype Plasmid
Introduced ETP CEP TET
PAβN CCCP - +PAβN +CCCP - +PAβN +CCCP - +PAβN +CCCP
S. Typhimurium SL1344
SL1344Rif RifR - 0.015 0.015 0.015 4 16 4 2 1 1 >400 100
SL1344 ompC::aph - 0.015 0.03 0.015 8 32 8 2 1 1 >400 100
SL1344 ompF::aph - 0.015 0.06 0.015 8 32 8 2 1 1 400 100
SL1344 ∆ompC
ompF::aph - 0.03 0.06 0.03 16 32 16 2 1 1 400 100
SL1344Rif RifR pKpQIL-UK 1 8 2 512 2048 1024 2 1 1 400 100
SL1344 ompC::aph pKpQIL-UK 2 32 2 2048 4096 2048 2 1 1 400 100
SL1344 ompF::aph pKpQIL-UK 8 32 8 1024 2048 512 2 1 1 400 100
SL1344 ∆ompC
ompF::aph pKpQIL-UK 16 64 16 2048 4096 2048 2 1 1 400 100
All values are in µg/ml. Unit for CCCP is in µM. ETP: Ertapenem; CEP: Cephalothin; TET: Tetracycline; PAβN: Phenylalanine-arginine-β-naphthylamide; CCCP: Carbonyl cyanide m-chlorophenyl hydrazone; Bolded fonts denote significant increase in MIC (without efflux inhibitors); Bolded and underlined fonts denote significant increase in MIC (with efflux inhibitors); Changes of 4-fold or more in MIC values are considered significant.
128

129
cephalothin were less obvious for the porin mutants carrying the plasmid. Nonetheless, the
susceptibility of S. Typhimurium SL1344-Rif/pKpQIL-UK to cephalothin decreased 4-fold in
the presence of PAβN. However, there were no changes in β-lactam antibiotic susceptibility
in the presence of CCCP. Tetracycline was used as a control and all strains showed reduced
susceptibility to tetracycline in the presence of PAβN and CCCP.
The susceptibility to ertapenem of the porin mutants in the presence of Compound A
and NMP was also determined (Table 3.13). The largest decrease in ertapenem susceptibility
was only observed in the plasmid carrying S. Typhimurium SL1344 OmpC mutant when
PAβN was present. In the presence of NMP, the decrease in susceptibility was also observed
in S. Typhimurium SL1344 and its isogenic OmpC mutant. These data suggest that OmpF
plays a more important role in the changes in susceptibility to ertapenem.
3.7.2 PAβN Reduces Outer Membrane Protein Expression in Salmonella Strains
The loss of outer membrane proteins (OmpC and OmpF) was associated with the reduction in
susceptibility of the S. Typhimurium strains towards β-lactam antibiotics. Hence, it was
hypothesised that the repression of outer membrane proteins (OmpC and OmpF) resulted in
the reduced β-lactam antibiotic susceptibility in the S. Typhimurium TolC mutants. Therefore,
the expression of the outer membrane protein of the Salmonella strains in the absence of the
AcrAB/TolC efflux pump components and when treated with PAβN was investigated. The
outer membrane proteins were prepared from wildtype Salmonella SL1344 and its isogenic
efflux pump mutants (AcrB and TolC). From the SDS-PAGE gel, no apparent difference were
observed for the efflux pump mutants compared to the wildtype S. Typhimurium SL1344
(Figure 3.18a; On page 127). Based on protein mobility, there is contradictory identification
of outer membrane proteins of Salmonella in the literature (Piddock et al., 1993, Santiviago et
al., 2003). As there was no specific outer membrane protein anti-serum available for this

130
Table 3.13 Ertapenem MIC in the presence of various efflux inhibitors
Strains Genotype Plasmid
Introduced MIC of Ertapenem (µg/ml)
- +PABN +CCCP + A +NMPS. Typhimurium SL1344
SL1344Rif RifR pKpQIL-UK 1 8 2 2 8
SL1344 ompC::aph pKpQIL-UK 2 32 2 2 8
SL1344 ompF::aph pKpQIL-UK 8 32 8 16 16
SL1344 ∆ompC
ompF::aph pKpQIL-UK 16 64 16 32 32
All values are in µg/ml. PAβN: Phenylalanine-arginine-β-naphthylamide; CCCP: Carbonyl cyanide m-chlorophenyl hydrazone; Compound A: Novel AcrAB specific inhibitor; NMP: 1-(1-naphthylmethyl)-piperazine; Bolded fonts denote significant increase in MIC (when inhibitors are added).

131
study, the three major protein bands around 35 kDa were excised for N-terminal sequencing
to determine the identity of the proteins. After repeated attempts, N-terminal sequencing was
only able to identify the protein band labelled as ‘A’. Hence, mass spectrometry was used to
identify the protein bands ‘C’, ‘D’ and a very faint protein band ‘F’ which was only observed
in the OmpC mutant (Figure 3.18b). All the bands were identified as OmpC (Band C), OmpF
(Band F), OmpD (Band D) and OmpA (Band A). From the SDS-PAGE gel, there was a
concentration dependent down-regulation of outer membrane proteins when PAβN was added.
In the presence of PAβN, there was a clear difference in the total intensity of protein bands
visible on the gel even when 2 µg of total protein was used in each lane for electrophoresis.
Although this may suggest unequal loading of protein samples, this phenomenon was
repeatedly observed, despite equal loadings being used in all experiments indicated by the
lower molecular mass protein (ca. 15 kDa) highlighted with the blue box.
3.7.3 Outer Membrane Protein Profile of Clinical Isolates of Enterobacteriaceae
Sixty-two Enterobacteriaceae clinical isolates had reduced susceptibility to ertapenem in the
presence of PAβN. It was hypothesised that PAβN altered the outer membrane and/or porin
expression in these isolates, resulting in reduced susceptibility to ertapenem. Hence, selected
isolates of E. coli which were tested for their susceptibility in the presence and absence of
PAβN (Section 3.6.2) were chosen to determine whether 25 µg/ml PAβN changed their outer
membrane protein profile. The selected clinical isolates consisted of isolates which had
increased ertapenem MIC values and one isolate which was not affected by the presence of
PAβN. Based on previous studies of E. coli (Erdei et al., 1994, Ma et al., 2013, Oteo et al.,
2008), protein bands C, F and A were identified as OmpC, OmpF and OmpA, respectively
(Figure 3.19). After SDS-PAGE, it was observed that for isolates which showed an increase
in ertapenem resistance in the presence of PAβN, also showed reduced expression of OmpF.

132
Figure 3.19 Outer membrane protein of E. coli clinical isolates in the presence and absence of 25 µg/ml PAβN
L: PageRuler Plus Prestained Protein Ladder (Thermo Scientific) Strain PAβN (25 µg/ml) Ertapenem MIC (µg/ml) E. coli NCTC10418 − 0.016 + 0.016 Isolate 298 − 8 + 64 Isolate 359 − 2 + 8 Isolate 388 − 8 + 32 Isolate 656 − 128 + 128 Isolate 669 − 8 + 16 −: Not added; +: Added Band C, F and A are assumed as OmpC, OmpF and OmpA by previously published data. Blue and yellow box were determined by mass spectrometry as OmpC and OmpA, respectively. Bolded fonts denote significant increase in MIC values. Where the strains showed a change in the MIC values of ertapenem in the presence of 25 µg/ml PAβN, these strains also showed reduced expression of their porins when treated with the compound. Yellow arrows show the changes in the intensity of the porin bands.
L - + - + - + - + - +
55 kDa
35 kDa
25 kDa
15 kDa
- + L
C F A
298 359 388 656NCTC 669

133
Isolate 656, which showed no difference in ertapenem MIC value when PAβN was added,
also had no detectable changes in OmpC and OmpF production. The outer membrane protein
of higher molecular mass (Blue box) of isolate 298 was determined by mass spectrometry to
be OmpC. The smaller outer membrane protein band (Yellow box) of isolate 656 was
confirmed to be OmpA by mass spectrometry. Other isolates of Enterobacter spp. (n = 4) and
Klebsiella spp. (n = 5) were also selected to assess the effects of PAβN on the outer
membrane protein profiles. In both cases, the addition of PAβN changed the outer membrane
protein profile of the isolates of these two species (Figure 3.20 and Figure 3.21). In
conclusion, in many of the isolates where PAβN was found to have increased the ertapenem
MIC values, the compound was also found to alter porin expression of these isolates.
However, exceptions were observed in some cases (e.g. Figure 3.21 isolate 582 & 664).
3.8 Discussion
Previous studies have shown that in E. coli the AcrAB-TolC efflux system works
synergistically with other mechanisms to confer a higher level of resistance to antibacterial
compounds, such as triclosan and ciprofloxacin (McMurry et al., 1998, Oethinger et al., 2000).
However, the data obtained from my study suggest that a functional AcrAB-TolC is not
required for the full elaboration of carbapenem resistance i.e. not as expected in the
hypothesis (Section 3.2). This is in disagreement with some reports that have often implicated
increased efflux to contribute (at least in part) to carbapenem resistance among
Enterobacteriaceae (Bornet et al., 2003, Lavigne et al., 2012, Woodford et al., 2007). Some
authors have also suggested that the AcrAB efflux pump plays a role in carbapenem
resistance (Bornet et al., 2003, Lavigne et al., 2012, Seecoomar et al., 2013). During the
course of treatment with imipenem, susceptible isolates of E. aerogenes which evolved into
imipenem intermediate and fully resistant strains had elevated AcrA and TolC expression

134
Figure 3.20 Outer membrane protein of Enterobacter spp. clinical isolates in the presence and absence of 25 µg/ml PAβN
L: PageRuler Plus Prestained Protein Ladder (Thermo Scientific) Strain PAβN (25 µg/ml) Ertapenem MIC (µg/ml) E. cloacae − 0.5 NCTC10005 + 0.5 Isolate 200 − 16 (E. cloacae) + 32 Isolate 278 − 4 (E. asburiae) + 4 Isolate 428 − 32 (E. cloacae) + 64 Isolate 559 − 8 (E. cloacae) + 32 −: Not added; +: Added; ND: Not determined; Bolded fonts denote significant increase in MIC values. Where the strains showed a change in the MIC value of ertapenem in the presence of 25 µg/ml PAβN, changes in the porin profile were also observed. Yellow arrows show the changes in the intensity of the porin bands.
55 kDa
35 kDa
25 kDa
15 kDa
L - + - + - + - + - + L
200 278 428 559 NCTC

135
Figure 3.21 Outer membrane proteins of Klebsiella spp. clinical isolates in the presence and absence of 25 µg/ml PAβN
L: PageRuler Plus Prestained Protein Ladder (Thermo Scientific) Strain PAβN (25 µg/ml) Ertapenem MIC (µg/ml) K. pneumoniae − 0.016 NCTC9633 + 0.016 Isolate 423 − 32 K. pneumoniae + 64 Isolate 433 − 8 K. oxytoca + 64 Isolate 472 − 64 K. pneumoniae + 128 Isolate 582 − 2 K. pneumoniae + 8 Isolate 664 − 8 K. pneumoniae + 8 −: Not added; +: Added; ND: Not determined; Bolded fonts denote significant increase in MIC values. Bolded fonts denote significant increase in MIC values. Where the strains showed a change in the MIC value of ertapenem in the presence of 25 µg/ml PAβN, changes in the porin profile were also observed. Yellow arrows show the changes in the intensity of the porin bands.
55 kDa
35 kDa
25 kDa
15 kDa
L - + - + - + - + - + - + L
423 433 472 582 NCTC 664
136
(Lavigne et al., 2012). However, the resistant isolate had no expression of OmpK35 and
OmpK36 which are frequently associated with carbapenem resistance (Adams-Sapper et al.,
2015, Clancy et al., 2013a, Clancy et al., 2013b, Hernandez-Alles et al., 1999, Shields et al.,
2015). In another study, imipenem resistant mutants of E. aerogenes were selected by
sequential sub-culturing of an ATCC13048 type strain in increasing concentration of
imipenem. The mutants also showed increased expression of AcrA efflux protein (Bornet et
al., 2003).
A more recent study cloned and expressed the blaKPC gene on a plasmid in an E. coli
N43 strain which does not produce the AcrA protein (Seecoomar et al., 2013). Compared to
the parental strain, E. coli W4573 which carried the same carbapenemase-producing plasmid,
the authors concluded that the AcrAB efflux pump is important for carbapenem resistance as
there was a 32- and 16-fold increase in meropenem and imipenem MIC values, respectively in
the parental strain (Seecoomar et al., 2013). Although the same blaKPC-2 in Tn4401 isoform ‘a’
and similar K-12 derived E. coli strains were used (Leavitt et al., 2010a, Nakamura, 1968,
Seecoomar et al., 2013, Wanner et al., 1983), the AcrAB associated reduction in carbapenem
susceptibility was not observed in this PhD study.
The N43 strain carries a mutant allele of acrA termed acrA1 due to the insertion of an
insertion element (IS2) close to the 5’ end of the acrA gene (Ma et al., 1993, Ma et al., 1995).
Together with MIC data, it was assumed that N43 does not produce the functional AcrAB
efflux pump as the susceptibility of the N43 strain could be restored to wildtype levels by
introducing a wildtype acrA gene (Ma et al., 1993). It is important to note that this N43 strain
is not an acrA null mutant and may carry other mutations with unknown effects on drug
susceptibility (Ma et al., 1995). It is also not known whether there is any polar effect arising
from the insertion element (Ma et al., 1993, Thanassi et al., 1997). If the AcrB protein is still

137
produced, the presence of other membrane fusion protein such as AcrE can complement the
function of AcrA (Smith and Blair, 2014). Hence, the use of this N43 strain in the study does
not provide a defined background to investigate the relationship of AcrAB efflux system with
carbapenem resistance.
On the contrary, the Salmonella strain used in this PhD study is different: the function
of AcrAB has been completely abolished due to the inactivation method used which replaced
the acrAB genes with a chloramphenicol resistance gene (cat) (Nishino et al., 2006). Similarly,
the acrB efflux pump component has been completely removed from E. coli BW25113 (Baba
et al., 2006). Hence, the data gathered from this PhD suggest that the AcrAB-TolC efflux
system does not play a role in carbapenem resistance. This finding also corroborates a
previous study which found no increase expression of acrB mRNA transcripts among
carbapenem resistant isolates of Klebsiella spp. and Enterobacter spp. (Doumith et al., 2009).
Moreover, to date, there is no study which clearly associates carbapenems (in particular,
ertapenem) as a substrate of the AcrAB-TolC efflux system. Crystallisation and molecular
docking studies have frequently centred on substrates, such as penicillins, cephalosporins,
doxorubicin and minocycline (Collu et al., 2012, Eicher et al., 2012, Lim and Nikaido, 2010,
Murakami et al., 2006, Nagano and Nikaido, 2009).
Interestingly, although the functional AcrAB-TolC efflux system was not found to be
required for the resistance of the carbapenemase-producing Salmonella strains, the loss of
TolC function instead caused an increase in resistance towards a variety of carbapenem
antibiotics (ertapenem, meropenem and doripenem) and a cephalosporin (ceftazidime). To
investigate whether the plasmid (pKpQIL-UK) used was responsible for the reduced
susceptibility observed in the TolC mutant, its variant (pKpQIL-D2), pNDM-HK and pUC18
plasmids were also included in the experiment. The plasmid ca. 89 kb pNDM-HK is an

138
IncL/M plasmid which encodes for a blaNDM-1 carbapenemase (Ho et al., 2011). This plasmid
shares no significant homology (≈4% Blastn alignment coverage) to the ca. 114 kb blaKPC-
encoding pKpQIL-UK and -D2 plasmids which belong to the IncF group of plasmids. Unlike
the natural conjugative plasmids (pKpQIL-UK, -D2 and pNDM-HK), the much smaller (2.7
kb) pUC18 is a laboratory generated plasmid (Norrander et al., 1983). Although as expected
that the blaTEM-1-encoding pUC18 plasmid did not confer a clinically significant level of
resistance to ertapenem in the TolC mutant, the fold increase in the ertapenem MIC value
(when compared to the wildtype) was similar to those shown for strains containing the
carbapenemase-producing plasmids. Taken together, these data suggest that the increase in β-
lactam (especially carbapenem) resistance in the Salmonella TolC mutant was not an effect of
expression of other vector genes in the plasmids or chromosome of the strains used. Neither
was it an effect of the carbapenemase or β-lactamase genes involved. This finding is similar to
those that have been reported where clinical isolates harbouring different carbapenemases
showed heteroresistance towards various carbapenem antibiotics (Jain et al., 2014, Pournaras
et al., 2010, Tijet et al., 2013, Zavascki et al., 2014). The decrease in carbapenem
susceptibility was not observed in the E. coli BW25113 TolC mutant. Instead, the E. coli
TolC mutant carrying the pKpQIL-UK plasmid was more susceptible to various carbapenem
antibiotics.
It has been suggested previously that E. coli lacking TolC protein exhibit membrane
stress (Dhamdhere and Zgurskaya, 2010). Hence, it was hypothesised that membrane damage
from the loss of TolC might allow the diffusion of the carbapenemase into the extracellular
environment allowing better tolerance to the carbapenem antibiotics tested. Possibly due to
low expression of the carbapenemase (blaKPC) and/or low plasmid copy number of pKpQIL-
UK, a high amount of total protein was required to detect the hydrolysis of the nitrocefin dye.

139
This amount was not achievable using the supernatant of the culture medium. Hence, the
passive release of the carbapenemase could only be assessed using the crude lysate of the
bacterial pellet. As no significant difference in the initial hydrolysis of nitrocefin was
observed between the wildtype Salmonella compared to the AcrAB and TolC mutant, it is
unlikely that this hypothesis is correct.
The effect of the well established efflux inhibitor PAβN in carbapenem susceptibility
was also investigated. Of note, the addition of this efflux inhibitor increased the ertapenem
MIC values of the wildtype S. Typhimurium 14028sRif and AcrAB mutant strain. The fold
increase is similar to that observed in the Salmonella TolC mutant carrying the plasmids (in
the absence of PAβN). It has been suggested that a low concentration of PAβN (20 µM ≈ 10.4
µg/ml) will have efflux inhibitory effect, whereas a higher concentration (0.1 mM ≈ 51.9
µg/ml) will enhance the efflux rate of cephalosporins via AcrB (Kinana et al., 2013).
However, this phenomenon does not explain the observations of this PhD study as the
increase in ertapenem resistance was also observed in the AcrAB Salmonella and AcrB E. coli
mutants when treated with PAβN. Other studies have used PAβN to associate the role of
efflux in carbapenem resistance when a decrease in carbapenem MIC value was observed in
the presence of the inhibitor (Baroud et al., 2013, Szabó et al., 2006, Yang et al., 2012). The
concentration of PAβN used in these studies ranged from 25 – 100 µg/ml. Unlike the data
obtained from this PhD study, where 72 out of 86 clinical isolates showed at least 2-fold
increase in ertapenem resistance, the previous studies reported reduction in carbapenem MIC
values when the isolates were tested with PAβN (Baroud et al., 2013, Szabó et al., 2006, Yang
et al., 2012). In one study, one of the E. coli isolate (E44) showed a 8-fold decrease in
ertapenem susceptibility in the presence of 100 µg/ml PAβN (Baroud et al., 2013). However,
the authors did not discuss this isolate further.

140
Previous studies have shown that efflux pump expression and repression of porin are
closely regulated (Barbosa and Levy, 2000, De Majumdar et al., 2013). Microarray studies
have also shown that the disruption of the acrB or tolC gene resulted in decreased expression
of ompF (Webber et al., 2009). Recently RNA-sequencing from the Piddock Group which
studied the impact of PAβN on S. Typhimurium SL1344 also showed decreased ompF mRNA
transcript (Blair, J. & Piddock, L., Unpublished data). The ertapenem MIC values of the porin
mutants carrying the pKpQIL-UK plasmid showed increased resistance to ertapenem, but the
fold-change in MIC value after addition of PAβN decreases in the following order: OmpC,
OmpF and OmpC/F double mutants. Taken together, these data suggested that altered porin
production was associated with the observed reduction in ertapenem susceptibility in the
strains carrying the various plasmids. This was supported by the SDS-PAGE gels which
showed a decreased in Salmonella porin expression with an increasing concentration of PAβN.
Similar changes in outer membrane protein profile were observed with the Enterobacteriaceae
clinical isolates harbouring a variety of carbapenemases. These findings support a previous
study which showed OmpC and OmpF or their orthologues play a role in carbapenem
resistance among Enterobacter spp. and Klebsiella spp. (Doumith et al., 2009).
To investigate whether the decrease in carbapenem susceptibility was specific to
PAβN, MIC values were determined with two other efflux inhibitors (NMP and Compound
A). The S. Typhimurium 14028sRif which carries the pKpQIL-UK plasmid was tested for its
susceptibility towards ertapenem. This carbapenem was chosen as it showed the largest
change in susceptibility. Independent of the presence of the functional AcrAB-TolC efflux
system, PAβN and NMP reduced the susceptibility of the Salmonella and E. coli strains
harbouring the pKpQIL-UK plasmid. Compound A had no impact on the carbapenem
susceptibility of the strains. This may be due to the difference in the mechanism of action of

141
the efflux inhibitors. Since its discovery, PAβN has been known to have membrane
permeabilising effects (Lomovskaya et al., 2001), but that the permeabilising effect was only
apparent when efflux function was compromised. At up to 128 µg/ml PAβN, P. aeruginosa
with a functional MexAB-OprM showed no significant membrane permeabilisation. However,
more recently it has been suggested that the permeabilising effect of PAβN is stronger than
previously reported (Lamers et al., 2013, Matsumoto et al., 2011). The membrane damaging
effects occur also in wildtype Pseudomonas without efflux defects and the effects are stronger
on the E. coli outer membrane compared to the former (Lamers et al., 2013, Matsumoto et al.,
2011). It may be possible that the membrane stress caused by PAβN is similar to that of the
loss of the TolC physical protein and/or its function. The permeabilising effect of PAβN also
explains the observation that most of the clinical isolates which showed a 4-fold increase in
ertapenem MIC values at 25 µg/ml PAβN had only a 2-fold increase when 100 µg/ml PAβN
was used. A previous study comparing the membrane permeabilising effects of PAβN and
NMP also suggested a possible membrane permeabilising effect by NMP albeit less
prominent than PAβN (Pannek et al., 2006). This suggests that NMP may have reduced the
susceptibility of the Salmonella and E. coli strains via the same mechanism as PAβN. The
effect of NMP via down-regulation of OmpF is also supported by the observation that the
ertapenem MIC values were only increased in the SL1344 OmpC mutant but not when OmpF
was absent. The regulation of porin expression is known to be complex and may differ
between species (De La Cruz and Calva, 2010, Martínez-Flores et al., 1999). This may
explain the differences observed between the K. pneumoniae, E. coli and S. Typhimurium
efflux mutants’ susceptibility to the antibiotics tested.
Previous studies have associated ESBL with carbapenem resistance (Doumith et al.,
2009, Woodford et al., 2007). Hence, the blaCTX-M-14 encoding pCT plasmid and its ESBL
142
inactivated plasmids were introduced into the set of Salmonella strains to study the effects of
an ESBL on carbapenem susceptibility in the presence/absence of a functional AcrAB-TolC
efflux system. Unlike the blaTEM-1-encoding pUC18, there was no obvious decrease in
ertapenem susceptibility in the Salmonella TolC mutant. This was possibly due to the lower
copy number of pCT and/or lower expression of blaCTX-M-14. However, in the presence of
PAβN, an increase in ertapenem MIC values was observed for S. Typhimurium
14028sRif/pCT and 14028sRif acrAB/pCT.
Efflux systems has been well established for their contribution to antibiotic resistance
and TolC forms the outer membrane channel of most efflux pumps found in Gram-negative
bacteria. Hence, TolC has been suggested as a potential target for the design of efflux pump
component inhibitors (Pagès and Amaral, 2009). From this work, it is suggested that PAβN
which causes membrane stress and the loss of function of the TolC and/or its physical protein
could increase the resistance of the bacteria against antibiotics which uses outer membrane
porins as entry routes to their targets in the cell. Hence, TolC may not be an ideal drug target
as the loss of TolC function and/or its protein may cause increase resistance via the down-
regulation of outer membrane proteins, especially OmpF.
3.9 Future Work
One main question arising from the data obtained is whether the down-regulation of the
porins resulted from the physical loss of the TolC protein or from the loss of function of the
protein. This could be addressed by expressing a non-functional TolC protein instead of using
a deletion mutant. This could be done by introducing point mutations which affect the
function of the TolC protein without affecting its expression or complex with the AcrAB
components (Krishnamoorthy et al., 2013). Data arising from this experiment will be
important for efflux inhibitor design. If the loss of TolC function was the trigger for the
143
adaptation in porin repression, a drug designed to inhibit the function of TolC may increase
the resistance to certain antibiotics. The main antibiotics tested in this study were carbapenem
antibiotics due to the carbapenemases encoded on the plasmids. However, other antibiotics
which utilise OmpF as the major route of entry into the cells, such as quinolones, should also
be tested (Marshall and Piddock, 1993).
From this study, it was observed that the inactivation of the efflux pump components
had different effects in the different species (K. pneumoniae, E. coli and Salmonella). Hence,
a TolC inactivated K. pneumoniae will be required to investigate whether the susceptibility of
the carbapenemase producing strain would show similar susceptibility level as the E. coli or
Salmonella strains. The inactivation of the TolC could be done as previously described by
homologous recombination of chimeric PCR amplicons of antibiotic resistance gene (e.g. aph
or cat) with flanking regions homologous to the tolC gene (Datsenko and Wanner, 2000).
It is hypothesised that the inactivation of TolC in Salmonella and the addition of
PAβN (Salmonella and E. coli) represses porin production. This could be via at least two
mechanisms: (1) the micF antisense pathway which inhibits OmpF translation and/or
destabilisation of ompF mRNA transcript (Ramani et al., 1994) or (2) EnvZ-OmpR
mechanism where EnvZ phosphorylates OmpR which then represses the transcription of
ompF (Cai and Inouye, 2002). Hence, qRT-PCR could be used to assess the expression of
micF and the porin genes in the TolC mutants and, when the wildtype Salmonella and E. coli
strains are treated with PAβN. Another method to confirm that OmpF played a role in the
carbapenem susceptibility observed in the Salmonella TolC mutant is by expression of OmpF
in trans on a low copy plasmid in the strain. A low copy plasmid such as pUA66 can be used
for the expression of OmpF with an inducible promoter (Zaslaver et al., 2004). If OmpF is
144
repressed in the TolC mutant, the expression of OmpF in trans would restore the carbapenem
MIC values to wildtype levels.
3.10 Key Findings
The AcrAB-TolC efflux system in K. pneumoniae, E. coli and S. Typhimurium is not
essential for carbapenem resistance.
The loss of TolC protein and/or TolC function in S. Typhimurium reduces β-lactam
antibiotic susceptibility.
The efflux inhibitor (PAβN) reduces β-lactam antibiotic susceptibility.
The decrease in carbapenem susceptibility in a Salmonella TolC mutant and, when
Salmonella and E. coli are treated with PAβN, is likely due to OmpF repression.
145
CHAPTER FOUR: COMPARISON OF PLASMIDS pKpQIL-UK WITH pKpQIL-D2
4.1 Background
The blaKPC-encoding plasmid pKpQIL-UK has been found in bacteria isolated in various
countries, including USA, Israel, Italy and Poland. Recently, this plasmid was also discovered
in the UK (Woodford, N. Unpublished data). Interestingly, a variant of the plasmid i.e.
pKpQIL-D2 was also isolated. A ca. 20 kb backbone region on the pKpQIL-UK has been
substituted with a smaller ca. 16 kb in pKpQIL-D2. This variant plasmid was found in
different species of Enterobacteriaceae, including E. cloacae and E. coli. However, it is not
known whether the substituted region confers a general advantage to the dissemination and
persistence of this variant plasmid in other species and so contributed to the hospital outbreak
in the UK.
4.2 Hypothesis and Aims
It was hypothesised that the ca. 16 kb region in the pKpQIL-D2 plasmid confers a fitness
advantage in the plasmid-carrying host. Therefore, the aims of the study were:
i) To determine the conjugation frequencies of the pKpQIL-UK and -D2 from
their original clinical isolates into representative species of Enterobacteriaceae.
ii) To determine the ability of the plasmid-carrying hosts to form biofilm.
iii) To study the differences in growth rate of the plasmid-carrying hosts.
iv) To investigate the impact of the plasmids on host bacterium chromosomal gene
expression.
4.3 Comparison of the Genetic Sequence of pKpQIL-UK with that of pKpQIL-D2
The pKpQIL-UK and pKpQIL-D2 plasmid DNA sequences were identical except for a ca. 20
kb region in pKpQIL-UK which has been substituted with a ca. 16 kb region in pKpQIL-D2.

146
Both of these regions carry genes which are associated with resistance, mobile elements,
replicon, plasmid genes (e.g. partition system) (Figure 1.8; On page 42). The majority of the
open reading frames within the substituted region in pKpQIL-D2 encode for small
hypothetical proteins (100 – 150 amino acids). Protein homology search by Blastp, conserved
motif search by PROSITE (http://prosite.expasy.org/) and protein localisation prediction by
PSORTb (http://www.psort.org/psortb/) were conducted but no significant hit was obtained
for these hypothetical proteins. It is not known whether these were functional proteins. A
blastn search (http://blast.ncbi.nlm.nih.gov/) using this region in pKpQIL-D2 showed 46%
coverage with high sequence identity (98%) with a region in the plasmid pKPN5 found in the
multidrug drug resistant K. pneumoniae MGH78578 (Figure 4.1). Among the isolates
received by Public Health England, it was found that plasmid pKpQIL-D2 occurred more
frequently than pKpQIL-D1. Moreover, pKpQIL-D2 was also found in E. cloacae, E. coli and
non-ST258 K. pneumoniae. Therefore, all the fitness experiments conducted in this PhD study
focused on the pKpQIL-UK and pKpQIL-D2 plasmids.
4.4 Transfer of Plasmid into Different Species of Enterobacteriaceae
Plasmids pKpQIL-UK and -D2 were large and could not be transferred by electroporation into
new bacterial hosts. Hence, rifampicin-resistant mutants were selected from K. pneumoniae
Ecl8, E. coli NCTC10418, S. Typhimurium (SL1344 and ATCC14028s), E. cloacae
NCTC10005 and S. marcescens NCTC10211. A single amino acid substitution was found in
the rpoB gene in representative mutants of all five strains. The amino acid substitution varied
between the species. The frequency of mutation to resistance of each strain was typical of that
of a mutation in a single gene (Table 4.1) (Miller et al., 2002).
Plasmids pKpQIL-UK and -D2 were transferred by electroporation into highly
electrocompetent ElectroMAXTM DH10BTM E. coli cells according to manufacturer’s
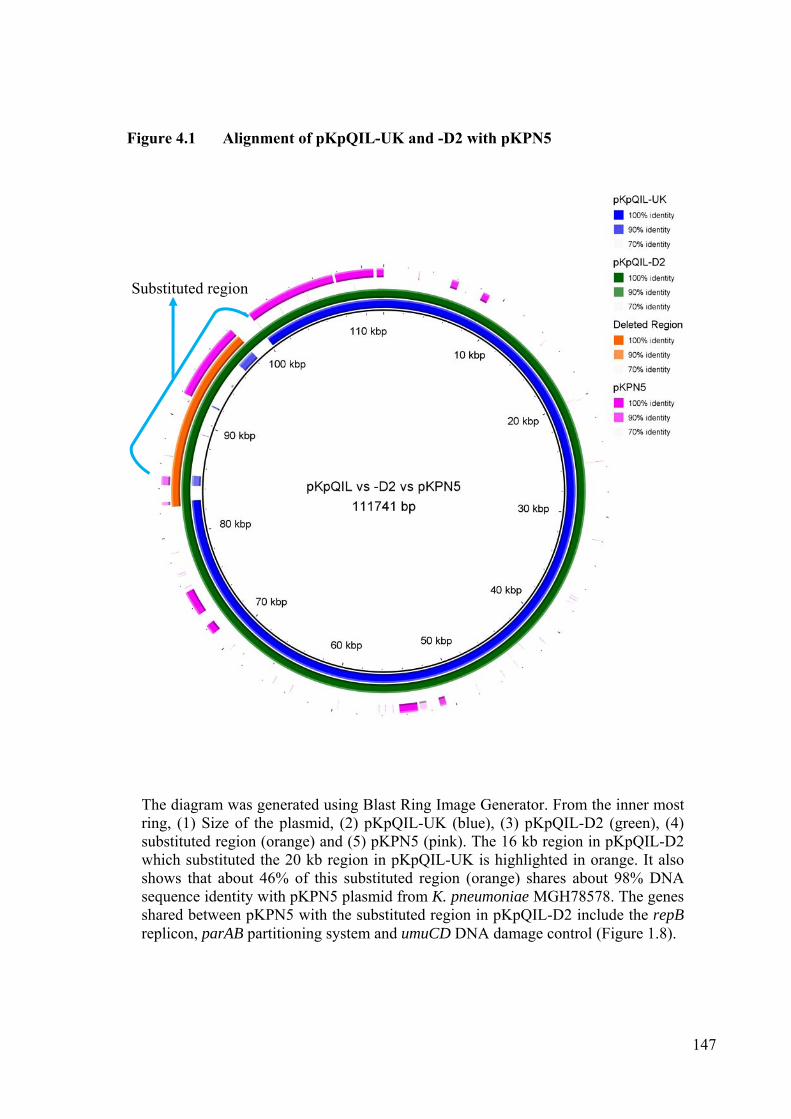
147
Figure 4.1 Alignment of pKpQIL-UK and -D2 with pKPN5
The diagram was generated using Blast Ring Image Generator. From the inner most ring, (1) Size of the plasmid, (2) pKpQIL-UK (blue), (3) pKpQIL-D2 (green), (4) substituted region (orange) and (5) pKPN5 (pink). The 16 kb region in pKpQIL-D2 which substituted the 20 kb region in pKpQIL-UK is highlighted in orange. It also shows that about 46% of this substituted region (orange) shares about 98% DNA sequence identity with pKPN5 plasmid from K. pneumoniae MGH78578. The genes shared between pKPN5 with the substituted region in pKpQIL-D2 include the repB replicon, parAB partitioning system and umuCD DNA damage control (Figure 1.8).
Substituted region
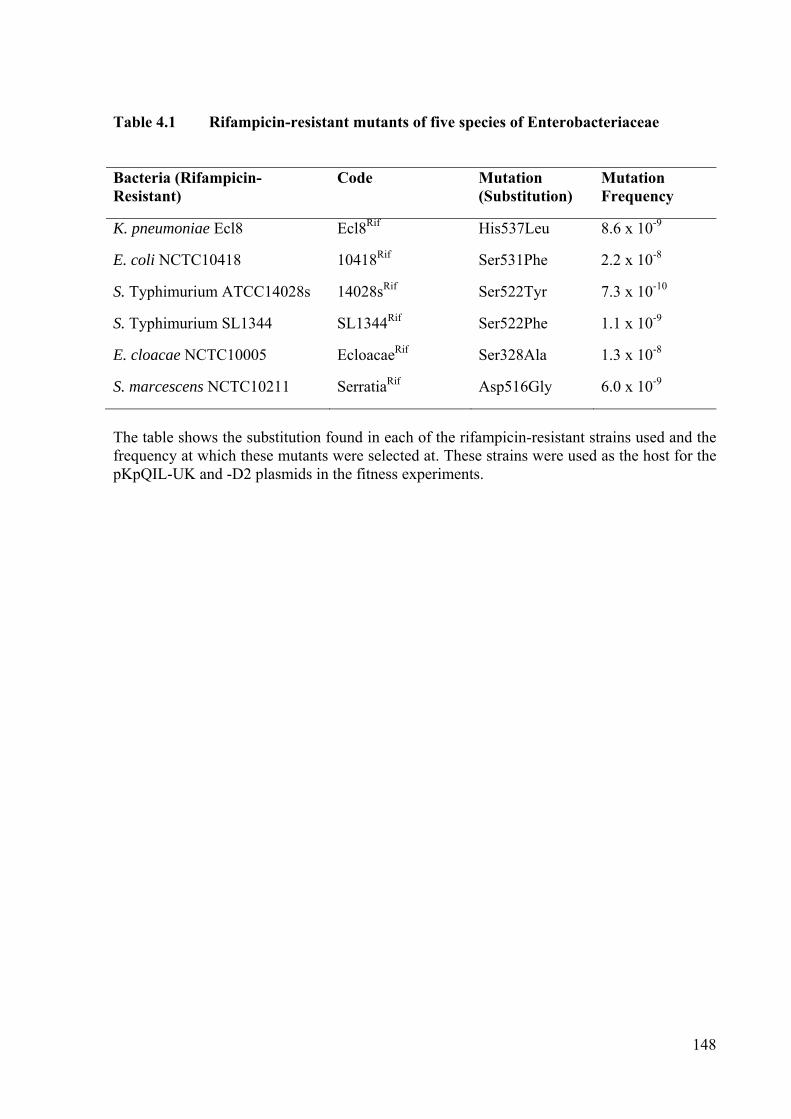
148
Table 4.1 Rifampicin-resistant mutants of five species of Enterobacteriaceae Bacteria (Rifampicin-Resistant)
Code Mutation (Substitution)
Mutation Frequency
K. pneumoniae Ecl8 Ecl8Rif His537Leu 8.6 x 10⁻⁹
E. coli NCTC10418 10418Rif Ser531Phe 2.2 x 10⁻⁸
S. Typhimurium ATCC14028s 14028sRif Ser522Tyr 7.3 x 10⁻¹⁰
S. Typhimurium SL1344 SL1344Rif Ser522Phe 1.1 x 10⁻⁹
E. cloacae NCTC10005 EcloacaeRif Ser328Ala 1.3 x 10⁻⁸
S. marcescens NCTC10211 SerratiaRif Asp516Gly 6.0 x 10⁻⁹
The table shows the substitution found in each of the rifampicin-resistant strains used and the frequency at which these mutants were selected at. These strains were used as the host for the pKpQIL-UK and -D2 plasmids in the fitness experiments.

149
instructions. This E. coli strain was chosen as it is known to be plasmid-free and possesses a
high transformation efficiency with a good ability to maintain large plasmids (Durfee et al.,
2008). To verify that the transformants contained the plasmids, PCR was used to detect the
blaKPC gene. The PCR amplicon was purified and DNA sequenced; this showed that the
DH10B transformants carried the blaKPC-2 variant carbapenemase. The DH10B/pKpQIL-UK
and DH10B/pKpQIL-D2 strains were used to transfer the plasmids into the respective
Enterobacteriaceae species (Figure 4.2).
The DH10B/pKpQIL-UK and DH10B/pKpQIL-D2 strains were used as the donor
strains of the plasmids into the rifampicin-resistant recipient strains of E. coli, Salmonella, E.
cloacae and S. marcescens in filter conjugation experiments. The plasmids were also
transferred into K. pneumoniae ST258 which was naturally kanamycin resistant. All of the
transconjugants obtained were checked for the presence of the blaKPC gene and for the
plasmid backbone fragment which differentiates the two plasmids (Figure 4.3 – 4.7). For the
SerratiaRif/pKpQIL-UK transconjugants, it was shown by PCR to contain the blaKPC gene
(Figure 4.5a, Lane 7-9). However, the PCR to check for the presence of a pKpQIL-UK
backbone region was unsuccessful (Figure 4.5b, Lane 4-6). Hence, the PCR was repeated
(Figure 4.6).
4.5 Growth Rates of Enterobacteriaceae pKpQIL-UK and -D2
Growth kinetics was one of the aspects of fitness which was investigated to determine the
impact of the plasmids on its host. It was hypothesised that bacteria carrying the variant
plasmid, pKpQIL-D2 grew faster than strains containing pKpQIL-UK. It was further
hypothesised that this attribute allowed the pKpQIL-D2 plasmid to spread and persist in the
UK. The difference of growth rates was identified by calculating the generation time of each
strain/plasmid combination during the logarithmic phase of growth. Under the conditions

150
Figure 4.2 PCR verification of the E. coli DH10B transformants for the presence of pKpQIL-UK and -D2
The plasmids pKpQIL-UK and -D2 provided by Woodford, N. was electroporated into E. coli DH10B to be used as donor strains for conjugation experiments. The transformants were verified by PCR for the presence of the blaKPC gene. M: Hyperladder I (Bioline); Lane 4: pKpQIL-UK plasmid (Positive control); Lane 5: DH10B genomic DNA (Negative control); Lane 6: Water (Contamination control); Lane 10: pKpQIL-D2 plasmid (Positive control); Lane 11: DH10B genomic DNA (Negative control); Lane 12: Water (Contamination control); Primers: KpQIL-KPC-F/R; Expected amplicon: 1580 bp.
M 1 2 3 4 5 6
2000 bp 1500 bp 1580 bp
DH10B/pKpQIL-UK Transformants
M 7 8 9 10 11 12
(a) PCR check for the presence of blaKPC
DH10B/pKpQIL-D2 Transformants
M 1 2 3 4 5 6
DH10B/pKpQIL-UK Transformants
M 7 8 9 10 11 12
DH10B/pKpQIL-D2 Transformants
(b) PCR check for the presence of pKpQIL-UK
600 bp 400 bp
600 bp 383 bp
The plasmids pKpQIL-UK and -D2 provided by Woodford, N. was electroporated into E. coli DH10B to be used as donor strains for conjugation experiments. The transformants were verified by PCR for the presence of the respective plasmid backbone gene. Key to lanes: M: Hyperladder I (Bioline) Lane 4: pKpQIL-UK plasmid (Positive control) Lane 5: DH10B genomic DNA (Negative control) Lane 6: Water (Contamination control) Primers: pQIL-F/R Expected amplicon: 383 bp
Lane 10: pKpQIL-D2 plasmid (Positive control) Lane 11: DH10B genomic DNA (Negative control) Lane 12: Water (Contamination control) Primers: pMan-F/R Expected amplicon: 600 bp
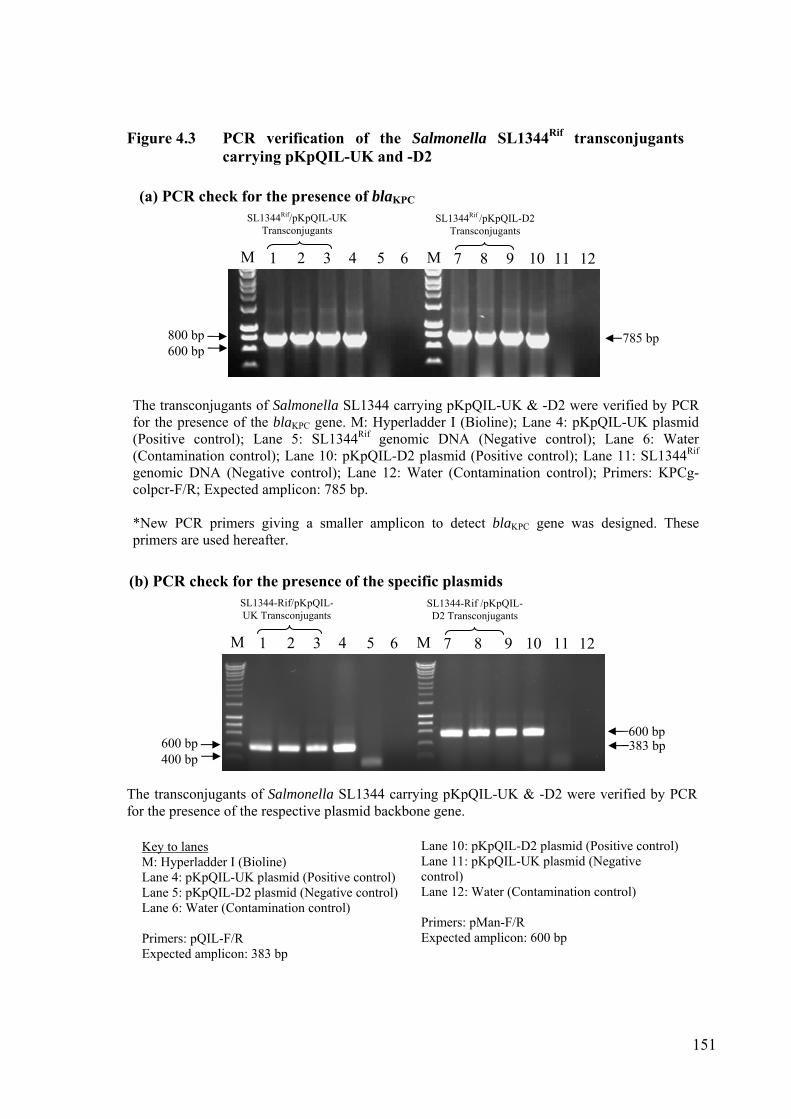
151
Figure 4.3 PCR verification of the Salmonella SL1344Rif transconjugants carrying pKpQIL-UK and -D2
The transconjugants of Salmonella SL1344 carrying pKpQIL-UK & -D2 were verified by PCR for the presence of the blaKPC gene. M: Hyperladder I (Bioline); Lane 4: pKpQIL-UK plasmid (Positive control); Lane 5: SL1344Rif genomic DNA (Negative control); Lane 6: Water (Contamination control); Lane 10: pKpQIL-D2 plasmid (Positive control); Lane 11: SL1344Rif genomic DNA (Negative control); Lane 12: Water (Contamination control); Primers: KPCg-colpcr-F/R; Expected amplicon: 785 bp. *New PCR primers giving a smaller amplicon to detect blaKPC gene was designed. These primers are used hereafter.
M 1 2 3 4 5 6
800 bp 600 bp
785 bp
M 7 8 9 10 11 12
SL1344Rif/pKpQIL-UK Transconjugants
SL1344Rif /pKpQIL-D2 Transconjugants
(a) PCR check for the presence of blaKPC
(b) PCR check for the presence of the specific plasmids
M 1 2 3 4 5 6 M 7 8 9 10 11 12
SL1344-Rif/pKpQIL-UK Transconjugants
SL1344-Rif /pKpQIL-D2 Transconjugants
600 bp 400 bp
600 bp 383 bp
Lane 10: pKpQIL-D2 plasmid (Positive control) Lane 11: pKpQIL-UK plasmid (Negative control) Lane 12: Water (Contamination control) Primers: pMan-F/R Expected amplicon: 600 bp
Key to lanes M: Hyperladder I (Bioline) Lane 4: pKpQIL-UK plasmid (Positive control) Lane 5: pKpQIL-D2 plasmid (Negative control) Lane 6: Water (Contamination control) Primers: pQIL-F/R Expected amplicon: 383 bp
The transconjugants of Salmonella SL1344 carrying pKpQIL-UK & -D2 were verified by PCR for the presence of the respective plasmid backbone gene.

152
Check for the presence of blaKPC Primers: KPCg-colpcr-F/R Postive control: pKpQIL-UK plasmid Expected amplicon: 785 bp Check for the presence of pKpQIL-UK Primers: pQIL-F/R Postive control: pKpQIL-UK plasmid Expected amplicon: 383 bp Check for the presence of pKpQIL-D2 Primers: pMan-F/R Postive control: pKpQIL-D2 plasmid Expected amplicon: 600 bp
Figure 4.4 PCR verification of the E. coli 10418Rif transconjugants carrying pKpQIL-UK and -D2
Key to lanes M: Hyperladder I (Bioline) Lane 1: 10418Rif/pKpQIL-UK transconjugant Lane 2: 10418Rif/pKpQIL-D2 transconjugant Lane 3: Positive control Lane 4: 10418-Rif genomic DNA (Negative control) Lane 5: Water (contamination control)
M 1 2 3 4 5
1000 bp 800 bp 785 bp
Check for KPC gene
400 bp 200 bp
M 1 2 3 4 5 M 1 2 3 4 5
Check for pKpQIL-UK Check for pKpQIL-D2
600 bp 383 bp
The transconjugants of Salmonella SL1344 carrying pKpQIL-UK & -D2 were verified by PCR for the presence of the blaKPC and respective plasmid backbone gene.

153
Lane 15: Water (Contamination control) Primers: KPCg-colpcr-F/R Expected amplicon: 785 bp
Figure 4.5 PCR verification of the Rifampicin-resistant E. cloacae and S. marcescens transconjugants carrying pKpQIL-UK and -D2
Key to lanes M: Hyperladder IV (Bioline) Electrophoresis was done using 2% (w/v) agarose Lane 13: pKpQIL-UK plasmid (Positive control) Lane 14: EcloacaeRif/SerratiaRif genomic DNA (Negative control)
Key to lanes M: Hyperladder IV (Bioline) Electrophoresis was done using 2% (w/v) agarose Lane 7: pKpQIL-UK plasmid (Positive control) Lane 8: pKpQIL-D2 plasmid (Negative control) Lane 9: Water (Contamination control) Primers: pQIL-F/R Expected amplicon: 383 bp
Key to lanes M: Hyperladder IV (Bioline) Electrophoresis was done using 2% (w/v) agarose Lane 7: pKpQIL-D2 plasmid (Positive control) Lane 8: pKpQIL-UK plasmid (Negative control) Lane 9: Water (Contamination control) Primers: pMan-F/R Expected amplicon: 600 bp
M 1 2 3 4 5 6
800 bp 785 bp
EcloacaeRif/ pKpQIL-UK
7 8 9 10 11 12 13 14 15
EcloacaeRif/ pKpQIL-D2
SerratiaRif/ pKpQIL-UK
SerratiaRif/ pKpQIL-D2
(a) PCR check for the presence of blaKPC
M 1 2 3 4 5 6
EcloacaeRif/ pKpQIL-UK
SerratiaRif/ pKpQIL-UK
7 8 9
400 bp
(b) PCR check for the presence of pKpQIL-UK
M 1 2 3 4 5 6
EcloacaeRif/ pKpQIL-D2
SerratiaRif/ pKpQIL-D2
7 8 9
600 bp
(c) PCR check for the presence of pKpQIL-D2
The transconjugants of E. cloacae and S. marcescens carrying pKpQIL-UK & -D2 were verified by PCR for the presence of the blaKPC gene.
The transconjugants of E. cloacae and S. marcescens carrying pKpQIL-UK & -D2 were verified by PCR for the presence of the respective plasmid backbone gene.

154
Figure 4.6 Repeat PCR verification of the Rifampicin-resistant S. marcescens transconjugants carrying pKpQIL-UK
The transconjugants of S. marcescens carrying pKpQIL-UK were verified by PCR for the presence of the plasmid backbone gene. M: Hyperladder I (Bioline); Lane 4: pKpQIL-UK plasmid (Positive control); Lane 5: pKpQIL-D2 plasmid (Negative control); Lane 10 – 12: Water (Contamination control); Primers: pQIL-F/R; Expected amplicon: 383 bp.
M 1 2 3 4 5 6
400 bp 383 bp
SerratiaRif/ pKpQIL-UK

155
Lane 10: pKpQIL-D2 plasmid (Positive control) Lane 11: ST258 genomic DNA (Negative control) Lane 12: Water (Contamination control) Primers: KPCg-colpcr-F/R Expected amplicon: 785 bp
Figure 4.7 PCR verification of the K. pneumoniae ST258 transconjugants carrying pKpQIL-UK and -D2
Key to lanes M: Hyperladder I (Bioline) Lane 4: pKpQIL-UK plasmid (Positive control) Lane 5: ST258 genomic DNA (Negative control) Lane 6: Water (Contamination control)
(b) PCR check for the presence of the specific plasmids
Lane 10: pKpQIL-D2 plasmid (Positive control) Lane 11: pKpQIL-UK plasmid (Negative control) Lane 12: Water (Contamination control) Primers: pMan-F/R Expected amplicon: 600 bp
Key to lanes M: Hyperladder I (Bioline) Lane 4: pKpQIL-UK plasmid (Positive control) Lane 5: pKpQIL-D2 plasmid (Negative control) Lane 6: Water (Contamination control) Primers: pQIL-F/R Expected amplicon: 383 bp
M 1 2 3 4 5 6
800 bp
400 bp 785 bp
M 7 8 9 10 11 12
ST258/pKpQIL-UK Transconjugants
ST258/pKpQIL-D2 Transconjugants
(a) PCR check for the presence of blaKPC
M 1 2 3 4 5 6 M 7 8 9 10 11 12
ST258/pKpQIL-UK Transconjugants
ST258/pKpQIL-D2 Transconjugants
600 bp 400 bp
600 bp 383 bp
The transconjugants of K. pneumoniae ST258 carrying pKpQIL-UK & -D2 were verified by PCR for the presence of the respective plasmid backbone gene.
The transconjugants of K. pneumoniae ST258 carrying pKpQIL-UK & -D2 were verified by PCR for the presence of the blaKPC gene.

156
tested, E. cloacae and S. marcescens carrying pKpQIL-UK grew significantly more slowly
than when carrying pKpQIL-D2. S. Typhimurium 14028s containing pKpQIL-D2 had a
significantly slower generation time (Figure 4.8 & Table 4.2). In all other host strains, no
difference in the generation time was observed in strains carrying pKpQIL-D2.
4.6 Plasmid Persistence
It was hypothesised that the substituted region in the pKpQIL-D2 allowed the plasmid to
persist better than pKpQIL-UK in bacterial host strains, thus allowing it to persist in different
bacterial populations. The stability of plasmid carriage among the Enterobacteriaceae species
was also assessed by consecutive growth of the plasmid (pKpQIL-UK and -D2) carrying
strains over a period of 20 days (ca. 140 generations) without antibiotic selection (Figure 4.9).
For the original clinical isolates carrying the plasmids (K. pneumoniae ST468/pKpQIL-UK
and ST321/pKpQIL-D2) (Figure 4.9a) and the K. pneumoniae ST258 transconjugants (Figure
4.9b), both plasmids were able to persist within their hosts over 20 days without detectable
loss. However, in both strains of Salmonella, it was found that the pKpQIL-D2 plasmid was
rapidly lost from the population (Figure 4.9c & d). On day 5, more than half of the population
of Salmonella has lost pKpQIL-D2 (Figure 4.9c & d). However, pKpQIL-UK was able to
persist within the population of Salmonella over the duration of time tested (ca. 140
generations). Interestingly, both plasmids were gradually lost from the E. coli population
(Figure 4.9e). On the 20th day, most of the E. coli within the population were plasmid-free.
Similar to K. pneumoniae, both plasmids were able to persist within the E. cloacae population
(Figure 4.9f). It was not possible to assess the percentage of the S. marcescens population
which retained or lost the plasmids as carbapenem-resistant, but plasmid-free, Serratia were
selected during the course of the experiment.
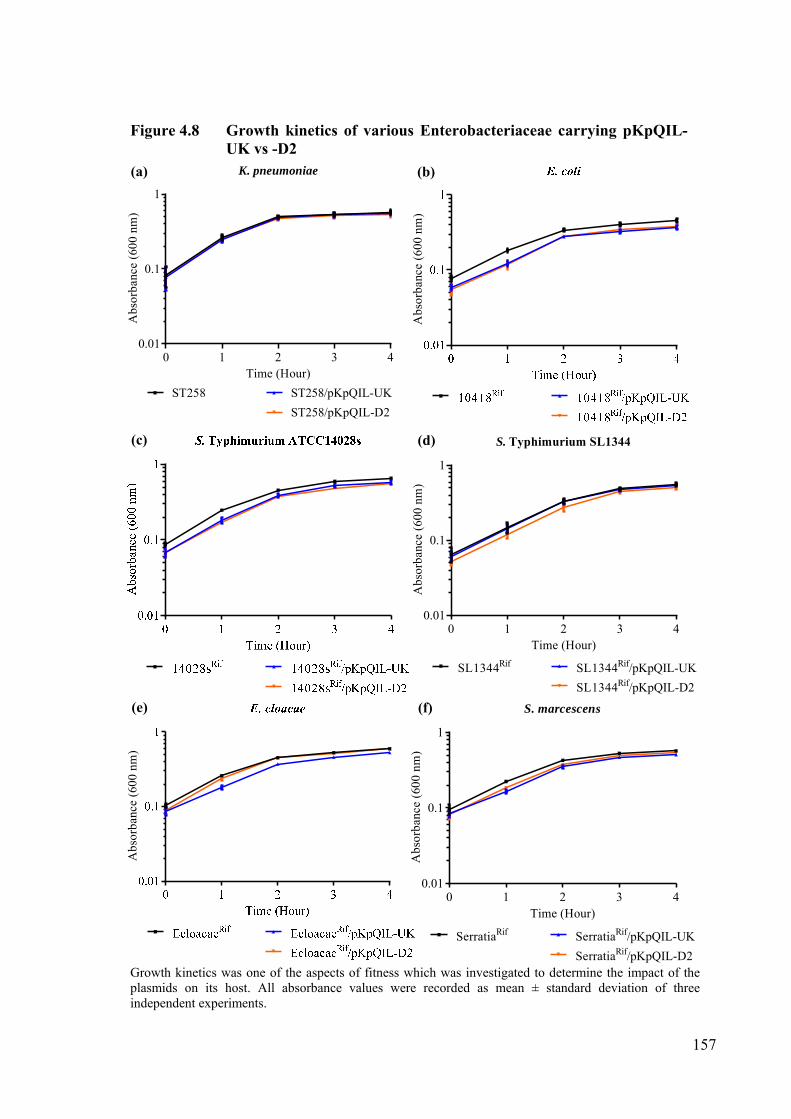
157
Figure 4.8 Growth kinetics of various Enterobacteriaceae carrying pKpQIL-UK vs -D2
(a) (b)
(c) (d)
(e) (f)
Growth kinetics was one of the aspects of fitness which was investigated to determine the impact of the plasmids on its host. All absorbance values were recorded as mean ± standard deviation of three independent experiments.
K. pneumoniae
Time (Hour)
Abs
orba
nce
(600
nm
)
0 1 2 3 40.01
0.1
1
ST258/pKpQIL-UK
ST258/pKpQIL-D2
ST258
Abs
orba
nce
(600
nm
)
S. Typhimurium SL1344
Time (Hour)
Abs
orba
nce
(600
nm
)
0 1 2 3 40.01
0.1
1
SL1344Rif SL1344Rif/pKpQIL-UK
SL1344Rif/pKpQIL-D2
Abs
orba
nce
(600
nm
)
S. marcescens
Time (Hour)
Abs
orba
nce
(600
nm
)
0 1 2 3 40.01
0.1
1
SerratiaRif SerratiaRif/pKpQIL-UK
SerratiaRif/pKpQIL-D2
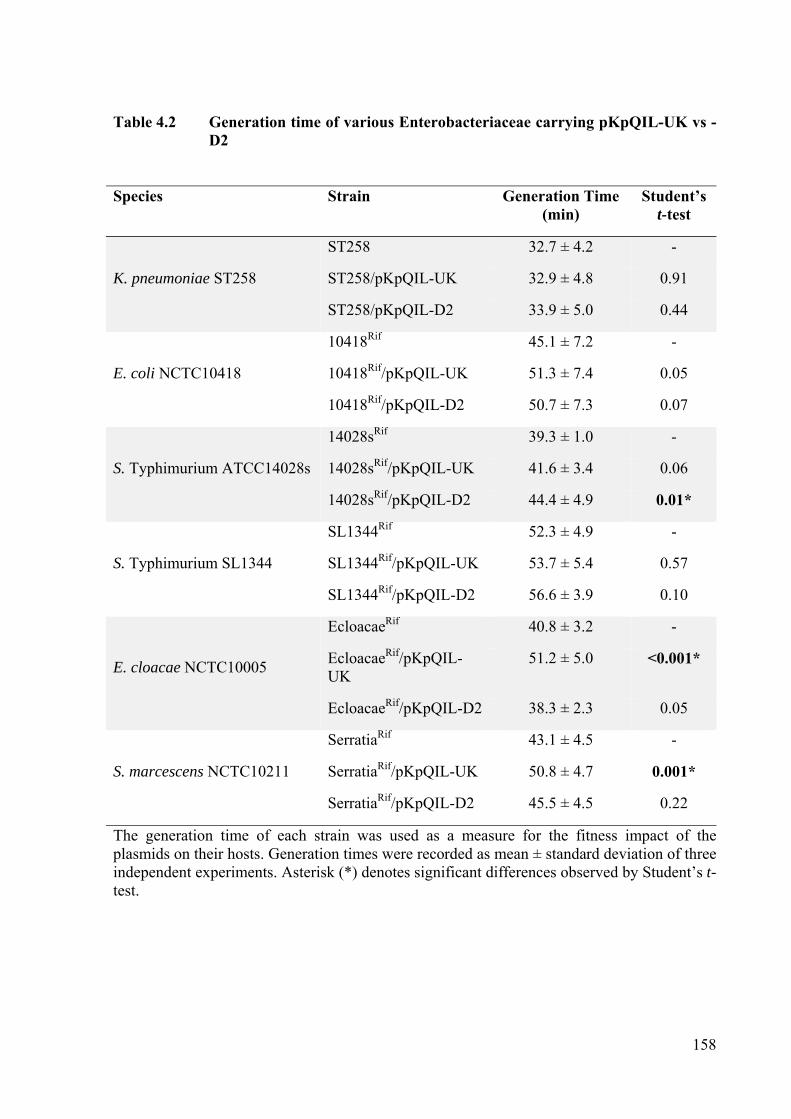
158
Table 4.2 Generation time of various Enterobacteriaceae carrying pKpQIL-UK vs -D2
Species Strain Generation Time
(min) Student’s
t-test
K. pneumoniae ST258
ST258 32.7 ± 4.2 -
ST258/pKpQIL-UK 32.9 ± 4.8 0.91
ST258/pKpQIL-D2 33.9 ± 5.0 0.44
E. coli NCTC10418
10418Rif 45.1 ± 7.2 -
10418Rif/pKpQIL-UK 51.3 ± 7.4 0.05
10418Rif/pKpQIL-D2 50.7 ± 7.3 0.07
S. Typhimurium ATCC14028s
14028sRif 39.3 ± 1.0 -
14028sRif/pKpQIL-UK 41.6 ± 3.4 0.06
14028sRif/pKpQIL-D2 44.4 ± 4.9 0.01*
S. Typhimurium SL1344
SL1344Rif 52.3 ± 4.9 -
SL1344Rif/pKpQIL-UK 53.7 ± 5.4 0.57
SL1344Rif/pKpQIL-D2 56.6 ± 3.9 0.10
E. cloacae NCTC10005
EcloacaeRif 40.8 ± 3.2 -
EcloacaeRif/pKpQIL-UK
51.2 ± 5.0 <0.001*
EcloacaeRif/pKpQIL-D2 38.3 ± 2.3 0.05
S. marcescens NCTC10211
SerratiaRif 43.1 ± 4.5 -
SerratiaRif/pKpQIL-UK 50.8 ± 4.7 0.001*
SerratiaRif/pKpQIL-D2 45.5 ± 4.5 0.22
The generation time of each strain was used as a measure for the fitness impact of the plasmids on their hosts. Generation times were recorded as mean ± standard deviation of three independent experiments. Asterisk (*) denotes significant differences observed by Student’s t-test.

159
Figure 4.9 The percentage of pKpQIL-UK vs -D2 carrying cells in growth over a period of 20 days without antibiotic selection
(a) (b)
(d)
(e) (f)
The persistence of the plasmids in various Enterobacteriaceae species in LB broth without antibiotic selection over a 20-day period was investigated to determine the stability of the plasmids in their respective hosts. The percentages of cells which retain the plasmids were recorded as mean ± standard deviation of three independent experiments.
(c)
Original K. pneumoniae Clinical Isolates
Day
Per
cent
age
of C
ell (
%)
5 10 15 200
25
50
75
100
ST468/pKpQIL-UK ST321/pKpQIL-D2
K. pneumoniae ST258
Day5 10 15 20
0
25
50
75
100
ST258/pKpQIL-UK ST258/pKpQIL-D2
S. Typhimurium ATCC14028s
Day5 10 15 20
0
25
50
75
100
14028sRif/pKpQIL-UK 14028sRif/pKpQIL-D2
S. Typhimurium SL1344
Day
Per
cent
age
of C
ell (
%)
5 10 15 200
25
50
75
100
SL1344Rif/pKpQIL-UK SL1344Rif/pKpQIL-D2
E. coli
Day5 10 15 20
0
25
50
75
100
10418Rif/pKpQIL-UK 10418Rif/pKpQIL-D2
Per
cent
age
of C
ell (
%)

160
4.7 Pairwise Competition of K. pneumoniae Ecl8 carrying pKpQIL-UK and -D2
It was hypothesised that the K. pneumoniae carrying pKpQIL-D2 has a competitive advantage
against pKpQIL-UK in a bacterial population. Hence, a pairwise competition assay was
carried out to study the percentage of bacteria carrying the plasmids within a bacterial
population over a period of 20 days. The pKpQIL-UK plasmid has been typically associated
with K. pneumoniae ST258 (Chen et al., 2014a, Leavitt et al., 2010a). Hence, the competition
assay was carried out with K. pneumoniae. In order to differentiate the two plasmids pKpQIL-
UK and -D2, the blaKPC gene was replaced with the kanamycin resistance gene, aph. The
inactivated blaKPC was verified by PCR (Figure 4.10). Although ST258 is the ideal host to use
for the competition experiment, the ST258 strain obtained from USA was kanamycin resistant.
The strain was also resistant to chloramphenicol which the resistant marker is commonly used
for gene inactivation. Hence, K. pneumoniae Ecl8 was used. The four plasmids (pKpQIL-UK,
pKpQIL-UK blaKPC::aph, pKpQIL-D2 and pKpQIL-D2 blaKPC::aph) were transferred into K.
pneumoniae Ecl8Rif by filter conjugation. The transconjugants were verified by PCR (Figure
4.11).
In order to exclude the possibility of the kanamycin resistance gene (aph) affecting the
outcome of the competition experiment, two experiments were carried out, i.e. pKpQIL-UK
vs -D2 blaKPC::aph and pKpQIL-UK blaKPC::aph vs -D2. It was observed that pKpQIL-D2
out-competed pKpQIL-UK over the 20-day period (Figure 4.12a & b). For the pKpQIL-UK
blaKPC::aph vs -D2 competition, pKpQIL-UK was almost completely loss from the population
at the 20th day of the experiment. However, the trend in the loss of the pKpQIL-UK vs -D2
blaKPC::aph competition was different as the population of K. pneumoniae carrying pKpQIL-
UK dropped to ca. 15% on Day-5 and maintained throughout the duration of the experiment.
Hence, the percentage of the population carrying the plasmids (pKpQIL-UK vs -D2
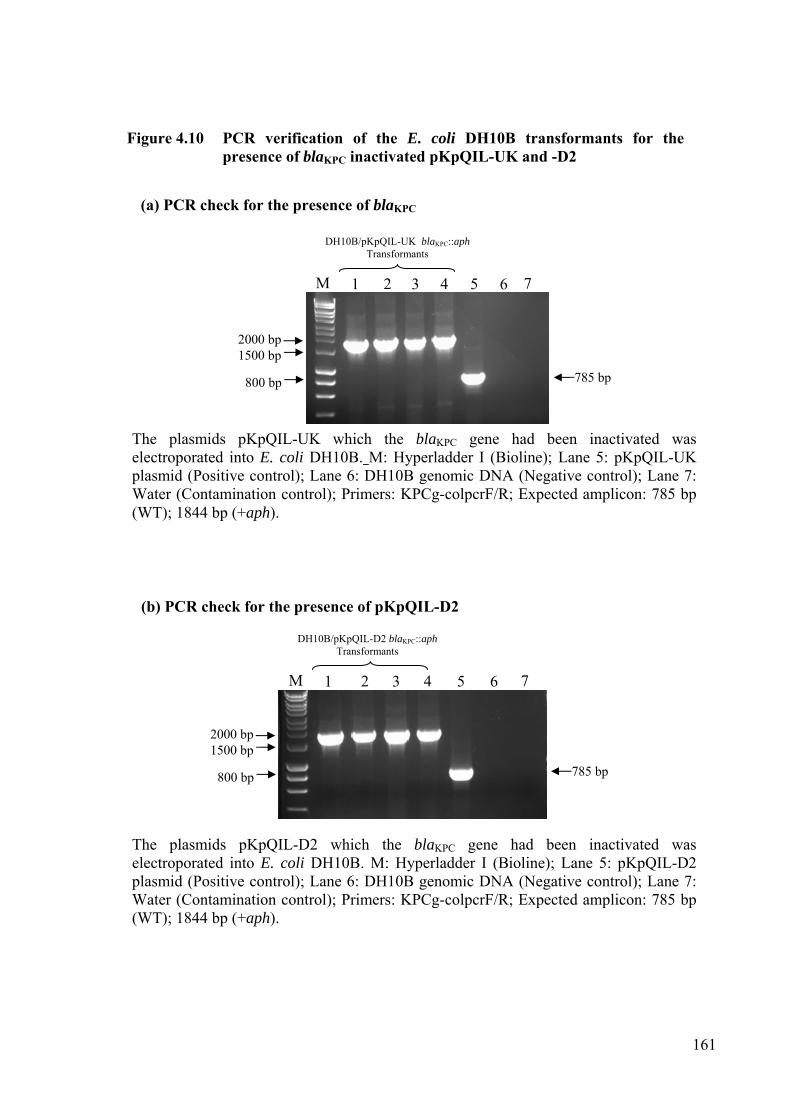
161
Figure 4.10 PCR verification of the E. coli DH10B transformants for the presence of blaKPC inactivated pKpQIL-UK and -D2
The plasmids pKpQIL-UK which the blaKPC gene had been inactivated was electroporated into E. coli DH10B. M: Hyperladder I (Bioline); Lane 5: pKpQIL-UK plasmid (Positive control); Lane 6: DH10B genomic DNA (Negative control); Lane 7: Water (Contamination control); Primers: KPCg-colpcrF/R; Expected amplicon: 785 bp (WT); 1844 bp (+aph).
M 1 2 3 4 5 6
2000 bp 1500 bp
785 bp
DH10B/pKpQIL-UK blaKPC::aph Transformants
7
(a) PCR check for the presence of blaKPC
(b) PCR check for the presence of pKpQIL-D2
The plasmids pKpQIL-D2 which the blaKPC gene had been inactivated was electroporated into E. coli DH10B. M: Hyperladder I (Bioline); Lane 5: pKpQIL-D2 plasmid (Positive control); Lane 6: DH10B genomic DNA (Negative control); Lane 7: Water (Contamination control); Primers: KPCg-colpcrF/R; Expected amplicon: 785 bp (WT); 1844 bp (+aph).
800 bp
2000 bp 1500 bp
800 bp
M 1 2 3 4 5 6
785 bp
DH10B/pKpQIL-D2 blaKPC::aph Transformants
7
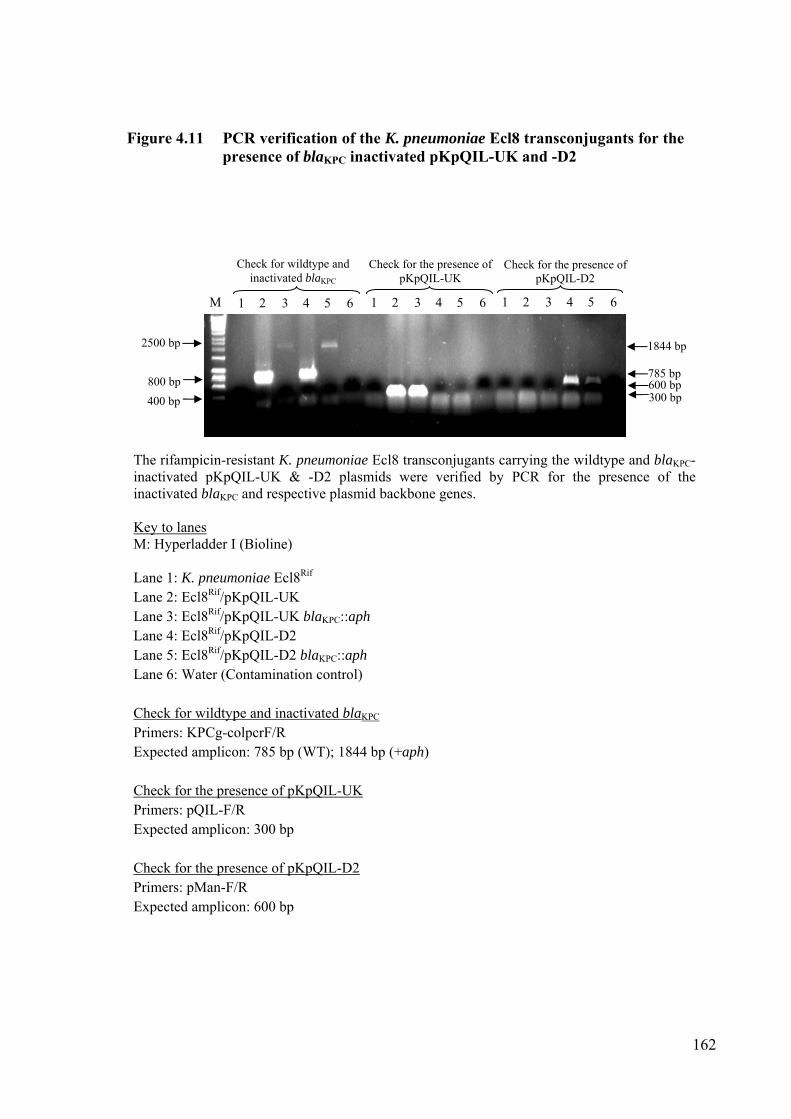
162
Figure 4.11 PCR verification of the K. pneumoniae Ecl8 transconjugants for the presence of blaKPC inactivated pKpQIL-UK and -D2
The rifampicin-resistant K. pneumoniae Ecl8 transconjugants carrying the wildtype and blaKPC-inactivated pKpQIL-UK & -D2 plasmids were verified by PCR for the presence of the inactivated blaKPC and respective plasmid backbone genes. Key to lanes M: Hyperladder I (Bioline) Lane 1: K. pneumoniae Ecl8Rif Lane 2: Ecl8Rif/pKpQIL-UK Lane 3: Ecl8Rif/pKpQIL-UK blaKPC::aph Lane 4: Ecl8Rif/pKpQIL-D2 Lane 5: Ecl8Rif/pKpQIL-D2 blaKPC::aph Lane 6: Water (Contamination control) Check for wildtype and inactivated blaKPC Primers: KPCg-colpcrF/R Expected amplicon: 785 bp (WT); 1844 bp (+aph) Check for the presence of pKpQIL-UK Primers: pQIL-F/R Expected amplicon: 300 bp Check for the presence of pKpQIL-D2 Primers: pMan-F/R Expected amplicon: 600 bp
M 1 2 3 4 5 6
2500 bp
400 bp
785 bp
Check for wildtype and inactivated blaKPC
800 bp 600 bp 300 bp
1844 bp
1 2 3 4 5 6
Check for the presence of pKpQIL-UK
1 2 3 4 5 6
Check for the presence of pKpQIL-D2

163
Figure 4.12 Pairwise competition of pKpQIL-UK vs -D2
Pairwise competition was done to study the competition of rifampicin-resistant K. pneumoniae Ecl8 carrying (a) pKpQIL-UK vs pKpQIL-D2 marked with an aph gene, and (b) pKpQIL-UK marked with an aph gene vs pKpQIL-D2. This was done to assess whether the plasmids conferred a competitive advantage to their hosts relative to the other. Percentage of plasmid carrying bacteria was recorded as mean ± standard deviation of three independent experiments. Competition index at the end of the experiment (a) was 0.62, (b) was 0.96. The positive values of the competition index indicated pKpQIL-D2 was fitter than pKpQIL-UK in the experiment. (c) The graph shows that pKpQIL-UK was rapidly displaced from the population by pKpQIL-D2 marked with an aph gene within the first five days of the competition. (d) Both plasmids were found to be stable within their host in LB broth without antibiotic selection over a period of 20 days.
(a) (b)
(c)
Per
cent
age
in P
opul
atio
n (%
)
Per
cent
age
in P
opul
atio
n (%
)
Per
cent
age
in P
opul
atio
n (%
)
(d) Plasmid Persistence of pKpQIL-UK vs -D2
Day5 10 15 20
0
25
50
75
100
Ecl8Rif/pKpQIL-D2
Ecl8Rif/pKpQIL-UK

164
blaKPC::aph) was determined from the first to the fourth day of the experiment to determine
whether the initial input inoculum was equal. It was observed that for the pKpQIL-UK vs -D2
blaKPC::aph competition, there was a rapid loss of pKpQIL-UK from Day 1 (Figure 4.12c) and
the percentage of pKpQIL-UK in the population maintained at ca. 15% after Day 4. To assess
whether pKpQIL-UK was stable in the K. pneumoniae Ecl8 strain, plasmid persistence assay
without antibiotic selection was carried out for the Ecl8 strains carrying the plasmids. Unlike
E. coli and Salmonella, both plasmids were able to persist without detectable loss in K.
pneumoniae Ecl8 over a period of 20 days without antibiotic selection (Figure 4.12d).
It was hypothesised that the pKpQIL-UK plasmid had a slower generation time than
its variant plasmid. Hence the generation time for the K. pneumoniae Ecl8 carrying the
plasmids were determined (Figure 4.13, Table 4.3). There was no difference in generation
times of K. pneumoniae Ecl8 carrying the various plasmids. The kanamycin resistance gene
(aph) also had no detectable impact upon the growth rate of the plasmids.
4.8 Conjugation Frequencies of the Plasmids into Various Enterobacteriaceae
In addition to K. pneumoniae, the plasmid pKpQIL-D2 was also found in E. cloacae and E.
coli in the UK outbreaks, whereas pKpQIL-UK was generally found in K. pneumoniae
(Woodford, N. Unpublished data). Hence, it was hypothesised that pKpQIL-D2 possessed a
higher transfer rate from its K. pneumoniae ST321 host compared to the K. pneumoniae
ST468 carrying pKpQIL-UK. The transfer potential of the plasmids from their original
clinical isolate host strains into four Enterobacteriaceae species was assessed using filter
conjugation. pKpQIL-UK showed an 18-fold and 30-fold higher conjugation frequency into K.
pneumoniae ST258 and E. coli, respectively (Figure 4.14a & b, Table 4.4). Both plasmids
transferred at similar rates into S. Typhimurium (14028s and SL1344) (Figure 4.14c & d) and

165
Figure 4.13 Growth rates of rifampicin-resistant K. pneumoniae Ecl8 carrying pKpQIL-UK & -D2 in the presence & absence of blaKPC
Growth kinetics for the various plasmid-carrying strains were determined to study the fitness impact of the plasmids and its blaKPC genes on their hosts. Generation times were recorded as mean ± standard deviation of three independent experiments. No difference in growth was observed between the K. pneumoniae Ecl8 carrying the wildtype plasmids and its corresponding blaKPC-inactivated plasmids.
(c)
(a) (b) Ecl8Rif vs Ecl8Rif/pKpQIL-UK & blaKPC::aph
Time (Hour)0 1 2 3 4
0.01
0.1
1
Ecl8Rif
Ecl8Rif/pKpQIL-UK
Ecl8Rif/pKpQIL-UK blaKPC::aph
Ecl8Rif vs Ecl8Rif/pKpQIL-D2 & blaKPC::aph
Time (Hour)
Abs
orba
nce
(600
nm
)
0 1 2 3 40.01
0.1
1
Ecl8Rif
Ecl8Rif/pKpQIL-D2 blaKPC::aph
Ecl8Rif/pKpQIL-D2

166
Table 4.3 Generation times of rifampicin-resistant K. pneumoniae Ecl8 carrying pKpQIL-UK & -D2 in the presence & absence of blaKPC
Strain Generation Time (min) Student’s t-test
K. pneumoniae Ecl8Rif 33.2 ± 3.6 -
Ecl8Rif/pKpQIL-UK 31.8 ± 5.7 0.54
Ecl8Rif/pKpQIL-UK blaKPC::aph 33.2 ± 3.1 0.99
Ecl8Rif/pKpQIL-D2 33.9 ± 5.6 0.76
Ecl8Rif/pKpQIL-D2 blaKPC::aph 33.5 ± 3.2 0.84
The generation time of each strain was used as a measure for the fitness impact of the plasmids in their hosts. Generation times were recorded as mean ± standard deviation of three independent experiments. Compared to the K. pneumoniae Ecl8Rif, no difference was observed in the generation time of the various plasmid carrying strains.

167
(a) (b)
(c) (d)
(e)
Figure 4.14 Conjugation frequencies of pKpQIL-UK and -D2 from their respective clinical isolates into Enterobacteriaceae species
(f)
Con
juga
tion
Fre
quen
cy
Con
juga
tion
Fre
quen
cyS. Typhimurium ATCC14028s
Con
juga
tion
Fre
quen
cy
14028sRif /pKpQIL-UK
14028sRif /pKpQIL-D2
0
1.0 10-5
2.0 10-5
3.0 10-5
4.0 10-5
5.0 10-5
Con
juga
tion
Fre
quen
cy
SL1344Rif /pKpQIL-UK
SL1344Rif /pKpQIL-D2
Con
juga
tion
Fre
quen
cy
Con
juga
tion
Fre
quen
cy
Conjugation frequencies were determined by filter mating to assess the differences in the transfer of the plasmids from their respective clinical isolates into different Enterobacteriaceae species. The values were recorded as mean ± standard deviation of three independent experiments. Significant difference (p<0.05) was determined by Student’s t-test. The values were recorded in Table 4.4.
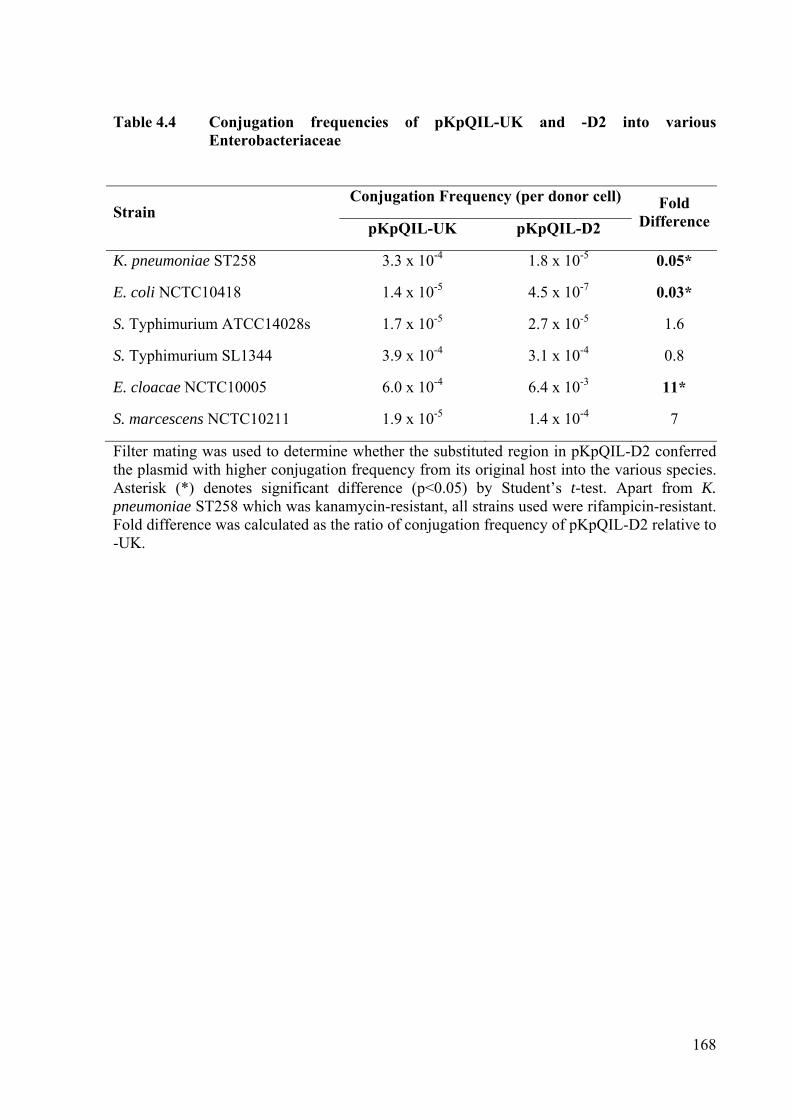
168
Table 4.4 Conjugation frequencies of pKpQIL-UK and -D2 into various Enterobacteriaceae
Strain Conjugation Frequency (per donor cell) Fold
DifferencepKpQIL-UK pKpQIL-D2
K. pneumoniae ST258 3.3 x 10⁻⁴ 1.8 x 10⁻⁵ 0.05*
E. coli NCTC10418 1.4 x 10⁻⁵ 4.5 x 10⁻⁷ 0.03*
S. Typhimurium ATCC14028s 1.7 x 10⁻⁵ 2.7 x 10⁻⁵ 1.6
S. Typhimurium SL1344 3.9 x 10⁻⁴ 3.1 x 10⁻⁴ 0.8
E. cloacae NCTC10005 6.0 x 10⁻⁴ 6.4 x 10⁻³ 11*
S. marcescens NCTC10211 1.9 x 10⁻⁵ 1.4 x 10⁻⁴ 7
Filter mating was used to determine whether the substituted region in pKpQIL-D2 conferred the plasmid with higher conjugation frequency from its original host into the various species. Asterisk (*) denotes significant difference (p<0.05) by Student’s t-test. Apart from K. pneumoniae ST258 which was kanamycin-resistant, all strains used were rifampicin-resistant. Fold difference was calculated as the ratio of conjugation frequency of pKpQIL-D2 relative to -UK.
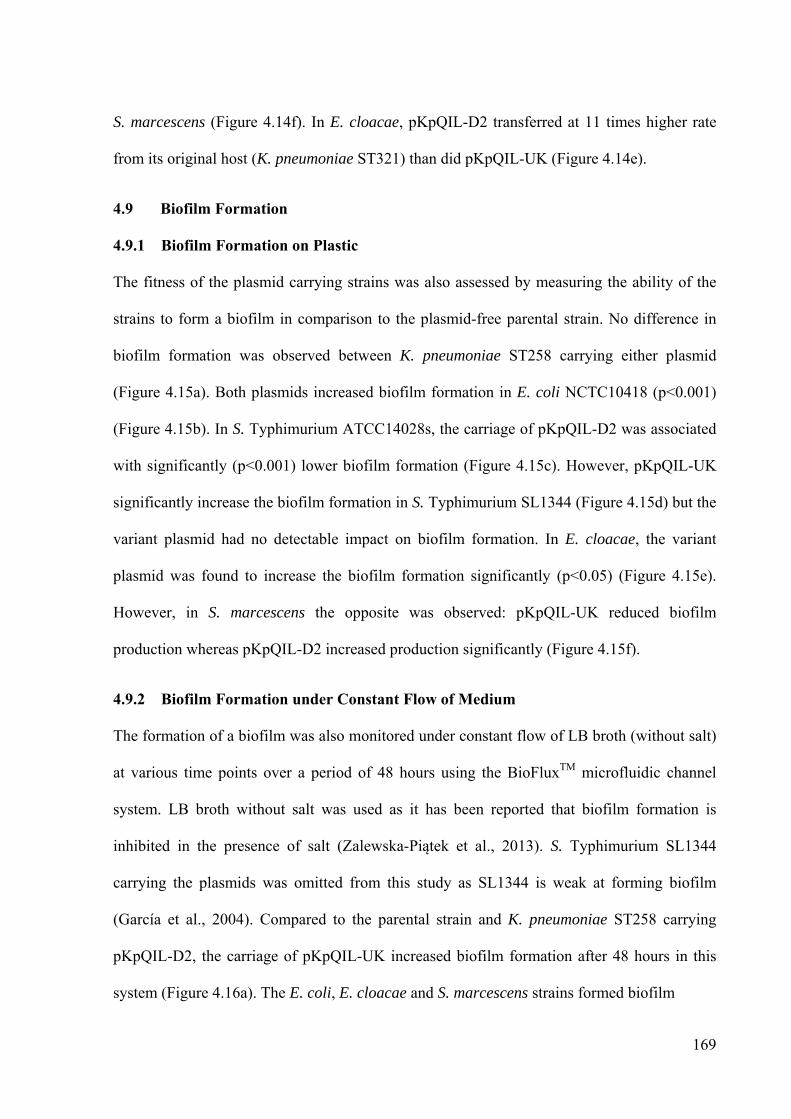
169
S. marcescens (Figure 4.14f). In E. cloacae, pKpQIL-D2 transferred at 11 times higher rate
from its original host (K. pneumoniae ST321) than did pKpQIL-UK (Figure 4.14e).
4.9 Biofilm Formation
4.9.1 Biofilm Formation on Plastic
The fitness of the plasmid carrying strains was also assessed by measuring the ability of the
strains to form a biofilm in comparison to the plasmid-free parental strain. No difference in
biofilm formation was observed between K. pneumoniae ST258 carrying either plasmid
(Figure 4.15a). Both plasmids increased biofilm formation in E. coli NCTC10418 (p<0.001)
(Figure 4.15b). In S. Typhimurium ATCC14028s, the carriage of pKpQIL-D2 was associated
with significantly (p<0.001) lower biofilm formation (Figure 4.15c). However, pKpQIL-UK
significantly increase the biofilm formation in S. Typhimurium SL1344 (Figure 4.15d) but the
variant plasmid had no detectable impact on biofilm formation. In E. cloacae, the variant
plasmid was found to increase the biofilm formation significantly (p<0.05) (Figure 4.15e).
However, in S. marcescens the opposite was observed: pKpQIL-UK reduced biofilm
production whereas pKpQIL-D2 increased production significantly (Figure 4.15f).
4.9.2 Biofilm Formation under Constant Flow of Medium
The formation of a biofilm was also monitored under constant flow of LB broth (without salt)
at various time points over a period of 48 hours using the BioFluxTM microfluidic channel
system. LB broth without salt was used as it has been reported that biofilm formation is
inhibited in the presence of salt (Zalewska-Piątek et al., 2013). S. Typhimurium SL1344
carrying the plasmids was omitted from this study as SL1344 is weak at forming biofilm
(García et al., 2004). Compared to the parental strain and K. pneumoniae ST258 carrying
pKpQIL-D2, the carriage of pKpQIL-UK increased biofilm formation after 48 hours in this
system (Figure 4.16a). The E. coli, E. cloacae and S. marcescens strains formed biofilm

170
(c) (d)
Figure 4.15 Biofilm formation on plastic for the various plasmid carrying Enterobacteriaceae strain
The impact of the plasmids on its hosts’ ability to form biofilm was investigated using the microtitre tray and crystal violet dye method. Percentage fold change was recorded as mean ± standard deviation of three independent experiments. Student’s t-test was used to analyse significant changes and shown with asterisk (*) p<0.05 and (**) p<0.001. Y-axis was not drawn to similar scale due to the large differences in fold change between species.
(e) (f)
(b) (a)
Per
cent
age
Fol
d C
hang
e (%
)
Per
cent
age
Fol
d C
hang
e (%
)
10418Rif
10418Rif /pKpQIL-UK
10418Rif /pKpQIL-D2
S. Typhimurium ATCC14028s
Per
cent
age
Fol
d C
hang
e (%
)
14028sRif
14028sRif /pKpQIL-UK
14028sRif /pKpQIL-D2
0
50
100
150**
S. Typhimurium SL1344
SL1344Rif
SL1344Rif /pKpQIL-UK
SL1344Rif /pKpQIL-D2
0
100
200
300
400
500
*
Per
cent
age
Fol
d C
hang
e (%
)
Per
cent
age
Fol
d C
hang
e (%
)

171
Figure 4.16 Images of biofilm formation in microfluidic channel at various time points
Images were taken at a magnification of 400X.
(a) 240 12 48
Time Point (Hour)
K. pneumoniae ST258
ST258/ pKpQIL-UK
ST258/ pKpQIL-D2
(b) 240 12 48
Time Point (Hour)
Rifampicin resistant E. coli NCTC10418
10418Rif/ pKpQIL-UK
10418Rif/ pKpQIL-D2

172
Figure 4.16 Images of biofilm formation in microfluidic channel at various time points (Continued)
Images were taken at a magnification of 400X.
240 12 48
Time Point (Hour)
Rifampicin resistant S. Typhimurium ATCC 14028s
14028sRif/ pKpQIL-UK
14028sRif / pKpQIL-D2
(c)
(d) 240 12 48
Rifampicin Resistant E. cloacae
EcloacaeRif / pKpQIL-UK
EcloacaeRif / pKpQIL-D2
Time Point (Hour)

173
Figure 4.16 Images of biofilm formation in microfluidic channel at various time points (Continued)
Images were taken at a magnification of 400X. The ability of the plasmid-carrying hosts to form biofilm was determined under constant flow of LB broth (without salt) using the BioFlux microfluidic system. Images of the biofilm formed were captured at both ends and the middle of the channel. Representative images are shown in this figure.
(e) 240 12 48
Time Point (Hour)
Rifampicin resistant S. marcescens NCTC10005
SerratiaRif/ pKpQIL-UK
SerratiaRif/ pKpQIL-D2

174
equally well in the microfluidic channel after 48 hours (Figure 4.16b, d & e). Both E. coli and
E. cloacae (with and without plasmids) started forming microcolonies as early as the 12 hours
after the attachment of the cells in the microfluidic channel (Figure 4.16b and d). Relative to
E. cloacae with and without pKpQIL-D2, carriage of pKpQIL-UK conferred the production
of a denser biofilm, filling the entire flow channel after 48 hours (4.16d). However, S.
marcescens carrying pKpQIL-UK formed biofilm slower than the plasmid-free parental strain
or when carrying pKpQIL-D2 after 24 hours (Figure 4.16e).
The area in the microfluidic channel which was covered by the plasmid carrying
strains relative to the parental strain with no plasmid was also determined (Figure 4.17). The
plasmids had different impact on the biofilm forming ability of the K. pneumoniae ST258 in
the BioFlux system (Figure 4.17a). Plasmid pKpQIL-UK was associated with a higher area of
coverage relative to the plasmid-free strain while K. pneumoniae with pKpQIL-D2 had lower
coverage. Relative to plasmid-free strain, no significant difference was observed for the E.
coli and E. cloacae carrying both pKpQIL-UK and -D2 (Figure 4.17b and d). S. Typhimurium
ATCC14028s carrying the pKpQIL-UK plasmid had significantly lower coverage compared
to the plasmid-free strain and the pKpQIL-D2 counterpart (Figure 4.17c). In S. marcescens,
both plasmid carrying strains showed significantly higher coverage compared to the plasmid-
free strain (Figure 4.17e).
4.10 Infection of Galleria mellonella by Plasmid Carrying K. pneumoniae ST258
Another aspect of fitness that was investigated in this PhD was the virulence of the plasmid-
carrying hosts in an infection model. It was hypothesised that the substituted region in
pKpQIL-D2 conferred a difference in virulence of the plasmid carrying K. pneumoniae
compared to the pKpQIL-UK carrying strain in the G. mellonella model. K. pneumoniae
ST258 was used as the host of the plasmids in the virulence experiment as the plasmids were

175
The coverage of biofilm formed on the surface of the microfluidic channel was estimated using ImageJ software. The percentage coverage relative to the parental strain was recorded as mean ± standard deviation of three independent experiments. Student’s t-test was used to analyse significant changes which are shown with asterisk (*) p<0.05 and (**) p<0.001.
(a) (b)
(c) (d)
(e)
Figure 4.17 Percentage area of coverage by biofilm in microfluidic channel after 48 hours under constant flow of LB broth (without salt)
Per
cent
age
Cov
erag
e (%
)
Per
cent
age
Cov
erag
e (%
)
10418Rif
10418Rif /pKpQIL-UK
10418Rif /pKpQIL-D2
S. Typhimurium ATCC14028s
Per
cent
age
Cov
erag
e (%
)
14028sRif
14028sRif /pKpQIL-UK
14028sRif /pKpQIL-D2
0
50
100
150
*
Per
cent
age
Cov
erag
e (%
)
S. marcescens
SerratiaRif
SerratiaRif /pKpQIL-UK
SerratiaRif /pKpQIL-D2
0
50
100
150
**
*

176
originally found in this species. No difference was observed between the two populations of
G. mellonella infected by either of the plasmid carrying K. pneumoniae ST258 (Figure 4.18).
4.11 Minimum Inhibitory Concentration of Antibiotics for Various Plasmid-bearing
Hosts
It was hypothesised that the pKpQIL-D2 conferred higher antibiotic resistance in its hosts
than pKpQIL-UK and this allow it to persist in other Enterobacteriaceae and frequently occur
in the hospital outbreaks in the UK. Hence, susceptibility of the strains to various β-lactam
antibiotics, ciprofloxacin and tigecycline was determined. Generally, there was no difference
in the MIC values of the different species of Enterobacteriaceae carrying the plasmids (Table
4.5). However, S. marcescens carrying pKpQIL-UK was more resistant to carbapenem
antibiotics than pKpQIL-D2. Interestingly, there was no difference in the susceptibility of
these two strains for the cephalosporins tested. The reverse was observed for K. pneumoniae
Ecl8 carrying pKpQIL-UK, which was more resistant to cephalosporins than pKpQIL-D2 but
not to carbapenem antibiotics.
Based upon this susceptibility data, it was hypothesised that the differences observed
in S. marcescens and K. pneumoniae Ecl8 were due to differences in porin expression.
However, no difference was observed in the porin profile of the parental strain and the
plasmid-bearing strains (Figure 4.19, Table 4.6).
It was hypothesised that the K. pneumoniae ST258 carrying pKpQIL-D2 would grow
better than pKpQIL-UK in the presence of a carbapenem. To test this, the strains were grown
in LB medium supplemented with 16 µg/ml doripenem (Figure 4.20a). The strains were also
challenged with 16 µg/ml doripenem after they have reached OD600~0.6 (Figure 4.20b). In
both cases, there was no difference in the growth between the two plasmid carrying strains.

177
Percentage of G. mellonella which survived after infection was recorded as mean ± standard deviation of three independent experiments at a 24-hour interval for five days. Each experiment consisted of a group of 10 Galleria larvae. Log-rank (Mantel-Cox) test was used to analyse the differences in survival of the two populations infected with plasmid carrying K. pneumoniae ST258 compared to the wildtype host. No difference was observed (p = 0.79) among the populations.
Figure 4.18 Virulence assay of Galleria mellonella infected by pKpQIL-UK and -D2 carrying K. pneumoniae ST258
Survival of Galleria mellonella infectedby K. pneumoniae
Time (Hours)0 24 48 72 96 120
0
25
50
75
100
ST258 ST258/pKpQIL-UK
ST258/pKpQIL-D2

Table 4.5 Minimum inhibitory concentration of pKpQIL-UK and -D2 carrying hosts Strains ETP IMI MER DOR BIA FAR CAZ CTX CFX PIP CIP ATM TIG
K. pneumoniae ST258
ST258 0.12 0.12 0.03 0.03 0.12 2 256 16 64 512 >16 512 0.5
ST258/UK 32 16 16 8 16 256 512 32 1024 1024 >16 1024 1
ST258/D2 32 8 8 4 8 256 256 32 1024 1024 >16 1024 0.5
K. pneumoniae Ecl8
Ecl8 0.015 0.12 0.015 0.03 0.03 0.12 0.03 0.008 0.12 0.5 0.008 0.008 0.12
Ecl8Rif 0.008 0.12 0.015 0.03 0.03 0.12 0.03 0.008 0.12 1 0.008 0.008 0.12
Ecl8Rif/UK 4 2 2 2 4 64 16 4 256 256 0.03 64 0.12
Ecl8Rif/D2 2 4 1 2 4 32 0.25 0.5 64 256 0.008 0.5 0.12
E.coli NCTC10418
10418 0.015 0.12 0.015 0.03 0.03 1 0.12 0.03 2 2 0.008 0.03 0.12
10418Rif 0.015 0.25 0.03 0.06 0.06 1 0.12 0.03 2 2 0.015 0.03 0.12
10418Rif/UK 0.5 4 0.5 1 2 64 1 1 128 128 0.015 8 0.12
10418Rif/D2 0.5 4 0.5 1 2 64 1 1 64 128 0.015 8 0.12
E. coli DH10B
DH10B 0.008 0.12 0.015 0.03 0.03 1 0.25 0.03 4 2 0.002 0.06 0.12
DH10B/UK 0.25 1 0.12 0.5 0.5 64 4 1 128 64 0.002 16 0.12
DH10B/D2 0.25 1 0.12 0.5 0.5 64 4 1 128 64 0.002 16 0.12
Continued overleaf. 178

Table 4.5 (Continued) Minimum inhibitory concentration of pKpQIL-UK and -D2 carrying hosts Strains ETP IMI MER DOR BIA FAR CAZ CTX CFX PIP CIP ATM TIG
S. Typhimurium SL1344
SL1344 0.015 0.12 0.015 0.03 0.06 0.5 0.25 0.12 8 4 0.015 0.06 0.25
SL1344Rif 0.008 0.12 0.015 0.03 0.03 0.25 0.25 0.25 16 4 0.03 0.03 0.25
SL1344Rif/UK 1 2 0.5 1 4 64 16 16 512 256 0.03 16 0.25
SL1344Rif/D2 0.5 2 0.25 0.5 2 32 16 16 512 256 0.03 16 0.25
S. Typhimurium ATCC14028s
14028s 0.015 0.12 0.015 0.03 0.06 0.5 0.25 0.12 4 2 0.015 0.06 0.25
14028sRif 0.008 0.12 0.015 0.03 0.03 0.25 0.25 0.12 8 2 0.015 0.03 0.25
14028sRif/UK 2 2 0.5 1 2 64 8 8 512 256 0.015 16 0.25
14028sRif/D2 1 2 0.5 1 2 64 8 8 512 256 0.015 16 0.25
E. cloacae NCTC10211
Ecloacae 0.5 0.5 0.06 0.12 0.12 4 1 2 256 2 0.008 1 0.12
EcloacaeRif 0.5 0.25 0.06 0.06 0.06 4 1 1 128 2 0.008 0.12 0.12
EcloacaeRif/UK 16 2 2 2 2 256 16 8 512 256 0.008 32 0.12
EcloacaeRif/D2 16 4 4 4 4 256 16 16 1024 512 0.008 64 0.06
S. marcescens NCTC10005
Serratia 0.03 0.5 0.03 0.12 0.25 8 0.12 0.25 64 2 0.06 0.12 1
SerratiaRif 0.015 0.5 0.06 0.12 0.5 8 0.25 0.12 32 2 0.06 0.06 1
SerratiaRif/UK 32 16 32 64 64 512 16 32 1024 256 0.06 64 1
SerratiaRif/D2 8 4 4 4 8 512 16 32 1024 128 0.06 64 1
‘UK’ denotes pKpQIL-UK while ‘D2’ denotes variant plasmid pKpQIL-D2. Bolded fonts denote significant increase in MIC values. ETP: Ertapenem; IMI: Imipenem; MER: Meropenem; DOR: Doripenem; BIA: Biapenem; FAR: Faropenem; CAZ: Ceftazidime; CTX: Cefotaxime; CFX: Cefuroxime; PIP: Piperacillin; CIP: Ciprofloxacin; ATM: Aztreonam; TIG: Tigecycline.
179

180
Figure 4.19 Outer membrane profile of S. marcescens and K. pneumoniae Ecl8 carrying pKpQIL-UK and -D2
In order to determine whether the down-regulation of porins altered the MIC values of the antibiotics of the pKpQIL-UK carrying strains compared to the -D2 carrying strain. The outer membrane proteins were prepared and separated on a 10% SDS-PAGE gel. The relative abundance of the five outer membrane protein highlighted with the yellow boxes was analysed by densitometry (Table 4.6). L: PageRuler Plus Prestained Protein Ladder (Thermo Scientific) Lane 1: S. marcescens NCTC10005 Lane 2: SerratiaRif/pKpQIL-UK Lane 3: SerratiaRif/pKpQIL-D2 Lane 4: K. pneumoniae Ecl8Rif Lane 5: Ecl8Rif/pKpQIL-UK Lane 6: Ecl8Rif/pKpQIL-D2
55 kDa
35 kDa
25 kDa
15 kDa
L 1 2 3 L 4 5 6 L
S. marcescens K. pneumoniae
Ecl8
1
2
3
4
5
1 23
4
5

181
Table 4.6 Relative abundance of the major outer membrane proteins in the plasmid-carrying strains of S. marcescens and K. pneumoniae
Bands (from top to bottom)
Lane 1 Lane 2 Lane 3 Lane 4 Lane 5 Lane 6
SerratiaRif SerratiaRif/UK SerratiaRif/D2 Ecl8Rif Ecl8Rif/UK Ecl8Rif/D2
1 0.11 0.08 0.10 0.61 0.57 0.58
2 0.54 0.60 0.50 0.15 0.19 0.19
3 0.05 0.06 0.06 0.15 0.17 0.16
4 0.14 0.14 0.20 0.02 0.02 0.02
5 0.16 0.12 0.14 0.06 0.05 0.05
Total 1.00 1.00 1.00 1.00 1.00 1.00
‘UK’ denotes pKpQIL-UK, ‘D2’ denotes pKpQIL-D2 Relative abundance of the major protein bands highlighted in the yellow box was determined by densitometry.

182
Figure 4.20 Growth kinetics of K. pneumoniae ST258/pKpQIL-UK vs -D2 in the presence of doripenem
In order to determine whether the presence of pKpQIL-UK or -D2 affected the growth of its host in the presence of antibiotic, the growth kinetics of the strains were determined when the (a) LB broth was supplemented with 16 µg/ml doripenem and (b) 16 µg/ml doripenem was injected into the LB broth after the strains had achieved mid-logarithmic phase. Absorbance readings were recorded as mean ± standard deviation of three independent experiments.
(a)
(b)

183
4.12 Summary of Phenotypes Conferred by Carriage of pKpQIL-UK vs -D2
The spread and persistence of pKpQIL-D2 in different species of Enterobacteriaceae in the
UK was hypothesised to be associated to the fitness advantage conferred by the plasmid.
However, compared to the pKpQIL-UK, no obvious fitness advantage was observed in the
pKpQIL-D2 carrying bacterial hosts in the various experiments (Table 4.7). In general,
depending on the fitness assay used, both plasmids affected their hosts in different ways.
4.13 Gene Expression Profiling of Plasmid Carrying K. pneumoniae ST258 with RNA
Sequencing
4.13.1 Determination of Growth Phase for RNA Extraction
Compared to the K. pneumoniae host carrying pKpQIL-UK, it was hypothesised that genes
expressed in the pKpQIL-D2 substituted region conferred biological difference in its host as
summarised in Table 4.7. In order to identify the genetic determinants conferring the
differences, RNA sequencing was used to investigate the gene expression of the K.
pneumoniae ST258 host in the presence of the pKpQIL-UK and -D2 plasmids. In order to
ensure that the results from the study were reproducible, the K. pneumoniae ST258 and its
isogenic strains carrying the plasmids (pKpQIL-UK and -D2) were grown in defined MOPS
minimal medium for RNA preparation. The growth kinetics of the strains showed that the
early, mid and late logarithmic phase were at an OD600 of 0.2, 0.4 and 0.6, respectively
(Figure 4.21a, Table 4.8). Using ST258/pKpQIL-UK as a representative, the total RNA was
prepared from the three growth phases to assess the expression level of the blaKPC gene by
qRT-PCR. Across the logarithmic phase, it was found that the carbapenemase gene was
highly expressed at the early phase (OD600 = 0.2) compared to the other phases (Figure 4.21b).
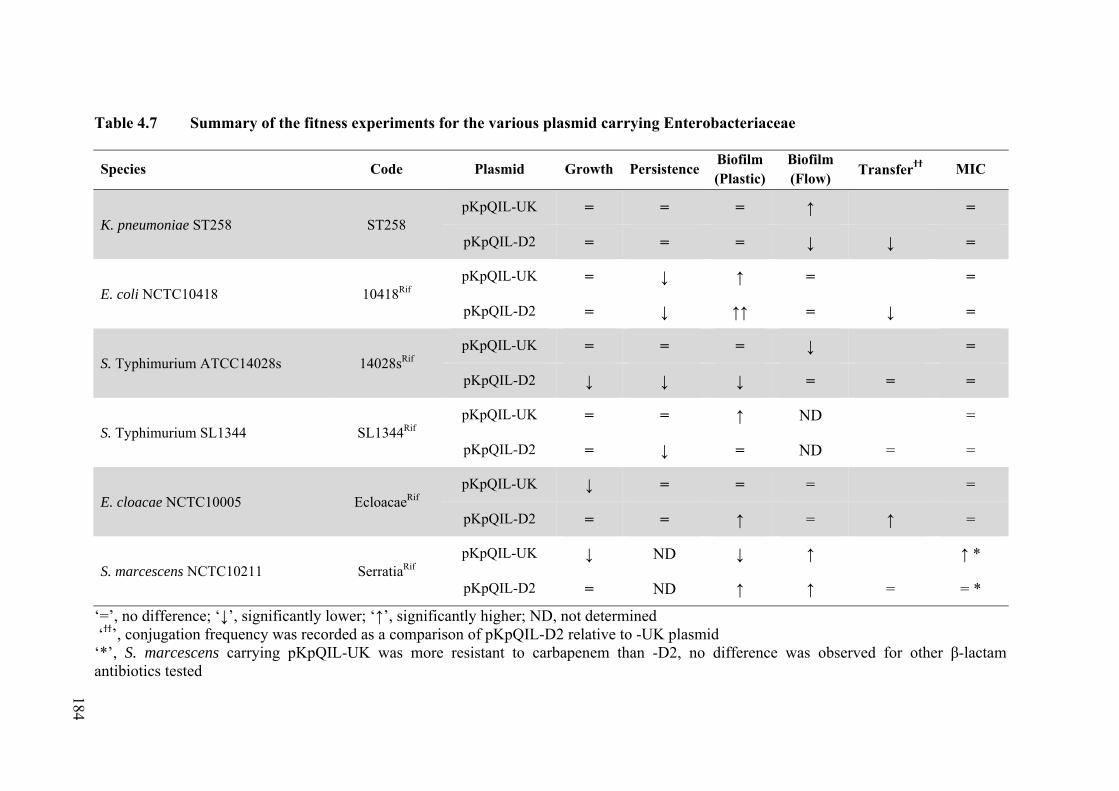
Table 4.7 Summary of the fitness experiments for the various plasmid carrying Enterobacteriaceae
Species Code Plasmid Growth Persistence Biofilm (Plastic)
Biofilm (Flow)
Transferϯϯ MIC
K. pneumoniae ST258 ST258 pKpQIL-UK = = = ↑ =
pKpQIL-D2 = = = ↓ ↓ =
E. coli NCTC10418 10418Rif pKpQIL-UK = ↓ ↑ = =
pKpQIL-D2 = ↓ ↑↑ = ↓ =
S. Typhimurium ATCC14028s 14028sRif pKpQIL-UK = = = ↓ =
pKpQIL-D2 ↓ ↓ ↓ = = =
S. Typhimurium SL1344 SL1344Rif pKpQIL-UK = = ↑ ND =
pKpQIL-D2 = ↓ = ND = =
E. cloacae NCTC10005 EcloacaeRif pKpQIL-UK ↓ = = = =
pKpQIL-D2 = = ↑ = ↑ =
S. marcescens NCTC10211 SerratiaRif pKpQIL-UK ↓ ND ↓ ↑ ↑ *
pKpQIL-D2 = ND ↑ ↑ = = *
‘=’, no difference; ‘↓’, significantly lower; ‘↑’, significantly higher; ND, not determined ‘ϯϯ’, conjugation frequency was recorded as a comparison of pKpQIL-D2 relative to -UK plasmid ‘*’, S. marcescens carrying pKpQIL-UK was more resistant to carbapenem than -D2, no difference was observed for other β-lactam antibiotics tested
184

185
Figure 4.21 Growth kinetics of K. pneumoniae ST258 and plasmid carrying isogenic strains in MOPS minimal medium, and blaKPC expression
(a) Growth kinetics of K. pneumoniae ST258 and plasmid carrying ST258
(a) The growth kinetics of the plasmid-carrying strains of K. pneumoniae ST258 were determined to estimate the approximate early-, mid- and late-logarithmic phase of the strains in MOPS minimal medium. Compared to the ST258, no difference in generation time was observed for the plasmid carrying strains. (b) The blaKPC expression was determined for the various growth phases in MOPS minimal medium and results were recorded as fold change relative to the early growth phase (OD600 = 0.2). All values were recorded as mean ± standard deviation of three independent experiments. Student’s t-test was used to analyse the data for significant changes which is shown with an asterisk (*) p<0.05.
(b)
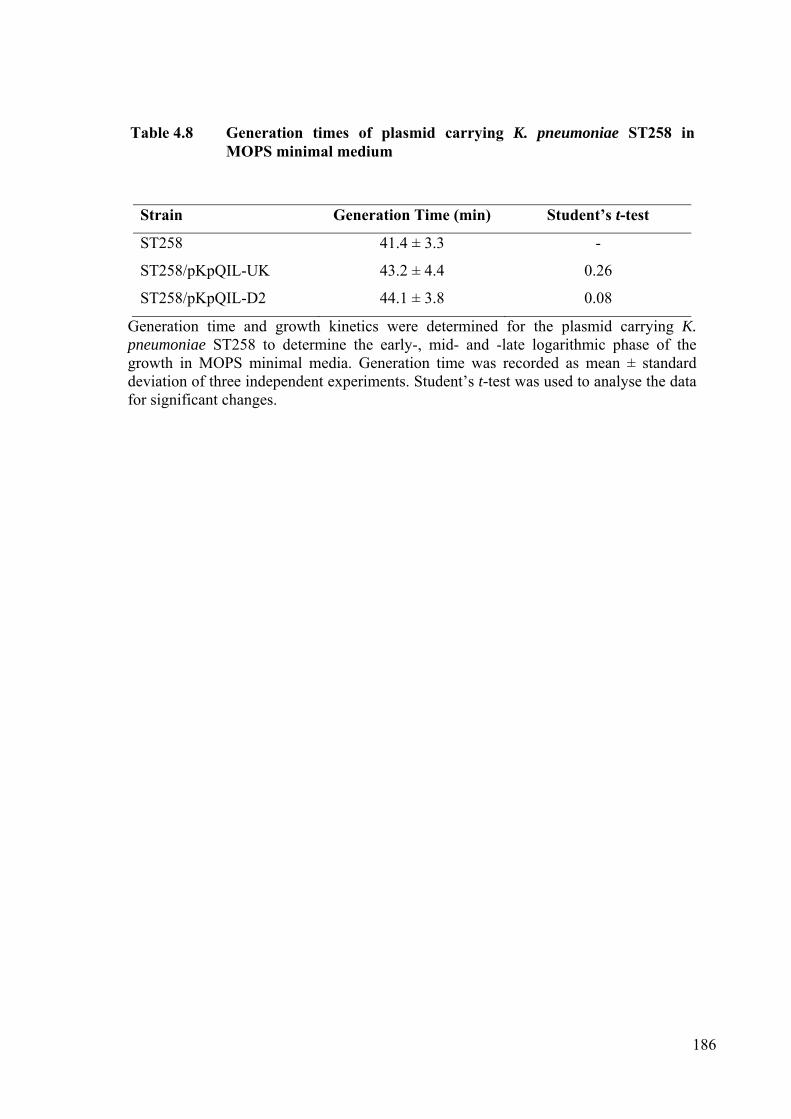
186
Table 4.8 Generation times of plasmid carrying K. pneumoniae ST258 in MOPS minimal medium
Strain Generation Time (min) Student’s t-test
ST258 41.4 ± 3.3 -
ST258/pKpQIL-UK 43.2 ± 4.4 0.26
ST258/pKpQIL-D2 44.1 ± 3.8 0.08
Generation time and growth kinetics were determined for the plasmid carrying K. pneumoniae ST258 to determine the early-, mid- and -late logarithmic phase of the growth in MOPS minimal media. Generation time was recorded as mean ± standard deviation of three independent experiments. Student’s t-test was used to analyse the data for significant changes.

187
4.13.2 Optimisation of Total RNA Extraction
From the qRT-PCR data, it was found that the carbapenemase gene was highly expressed in
the early stage of the logarithmic phase. Hence, the RNA from the early logarithmic phase
was used to study the difference in the transcriptome of the K. pneumoniae ST258,
ST258/pKpQIL-UK and ST258/pKpQIL-D2. Initially, the RNA preparation was carried using
the SV Total RNA Isolation System (Promega, Wisconsin, USA, Catalogue No.: Z3105).
This kit was used as it is frequently used to prepare RNA from S. Typhimurium in the
Piddock Group. However, white precipitate (possibly debris from the Klebsiella capsule) was
observed repeatedly at the final step where the RNA was eluted from the spin column. This
white precipitate was also observed in the total RNA extracted for assessing the blaKPC
expression in the different growth stages. As RNA sequencing involves many preparation
steps and the sequencing reaction is sensitive to contaminants, the RNA preparation
conditions were optimised before proceeding to the sequencing stage. The RNA extraction kit
used was changed to TRIzol® Plus RNA Purification Kit (Life Technologies, California, USA,
Catalogue No.: 12183-555). Using the ‘Total RNA Isolation’ protocol in the manufacturer’s
manual, this kit yielded no detectable RNA when quantified by Qubit® RNA HS Assay Kit.
Hence, the ‘Total Trancriptome Isolation’ method (designed to include small RNA during
RNA extraction) in the manufacturer’s manual was used and yielded about 5 – 7 µg RNA.
The eluted RNA was not contaminated with the previously observed white precipitate.
When separated by electrophoresis, the 16S and 23S rRNA could be observed (Figure
4.22a). Although the total amount of RNA extracted was high (5 – 7 µg), but the ribosomal
RNA (16S and 23S) bands were relatively faint and possibly suggested a low amount of
messenger RNA (mRNA) was present. The RNA samples were analysed using Agilent 2100
Bioanalyzer. However, the RNA samples consisted of mostly of small RNA species (Figure

188
Figure 4.22 Purification of RNA from K. pneumoniae ST258 in the presence and absence of pKpQIL-UK and -D2
(a) The total RNA samples extracted from the various plasmid-carrying K. pneumoniae ST258 strains using different commercial kits were compared in a 1% agarose gel by observing the intensity of the 16 and 23S rRNA bands. A representative image of Agilent 2100 Bioanalyzer (b) electropherogram trace and (c) gel photo, for the RNA samples extracted using TRIzol® Plus Kit and Quick-RNATM Kit. The RNA samples consisted of mostly small RNA species as the 16 and 23S RNA peaks were very small on the electropherogram.
M: Hyperladder I (Bioline) Lane 1 – 2: ST258 Lane 3 – 4: ST258/pKpQIL-UK Lane 5 – 6: ST258/pKpQIL-D2 Lane 7 – 8: ST258 (Quick-RNATM, Zymo Research Kit)
M 1 2 3 4 5 6
1500 bp
1000 bp
23S rRNA
TRIzol® Plus
7 8
Zymo Research
16S rRNA
Small RNA
(a) Purified total RNA separated on agarose gel
(b) Lower Marker
Small RNA
Ribosomal RNA
(c)
Lower Marker
Small RNA

189
4.22b & c). A different kit (Quick-RNATM, Zymo Research, California, USA) was also used
to prepare total RNA from ST258. A similar pattern of total RNA composition was observed
in the electrophoresis gel (Lane 7 – 8, Figure 4.22a). The composition of RNA obtained from
the two different kits suggested that it was not an artefact of the RNA extraction kit but the
amount of mRNA at the early logarithmic phase was very low. Hence, a greater volume of
culture was use for RNA extraction with the previous ‘Total RNA Isolation’ protocol in the
manufacturer’s guide. This protocol was chosen instead of the ‘Total Transcriptome Isolation’
because the latter omits one of the washing buffers which was needed for on-column DNAse-
treatment. The removal of the on-column DNAse-treatment step would result in highly DNA
contaminated RNA samples.
Using an increasing volume of culture (30, 90, 120 and 150 ml) for RNA extraction, it
was observed that there was an increase in the intensity of the ribosomal RNA and the smear
of mRNA along the electrophoresis lanes (Figure 4.23a). Although the higher volume of
culture used for RNA extraction indicated the possibility of increased mRNA transcripts in
the samples, the Bioanalyzer analysis showed that the RNA samples still comprised of mostly
small RNA species (Figure 4.23b and c). Moreover, the white precipitate was again observed
using the larger culture volume. Hence, extraction of RNA using another method (i.e. glass
beads) was attempted with the RiboPureTM RNA Purification Kit. The extraction was also
carried out using a culture from the late logarithmic phase (OD600 = 0.6) to overcome the
lower mRNA transcript production at the early growth phase. This kit produced a sufficient
amount of total RNA (including mRNA) (ca. 15 – 20 µg) for sequencing. From the
Bioanalyzer analyses, the 16S and 23S rRNA peaks were discreet suggesting a good quality
of total RNA without obvious degradation (Figure 4.24a and b). The smear on the background
190
Figure 4.23 Purification of RNA from increasing volume of K. pneumoniae ST258 culture
M: Hyperladder I (Bioline) Lane 1: ST258 (Total Transcriptome Isolation as positive control) Lane 2: ST258 (30 ml) Lane 3: ST258 (90 ml) Lane 4: ST258 (120 ml) Lane 5: ST258 (150 ml)
M 1 2 3 4 5
1500 bp
1000 bp
23S rRNA
Total RNA Isolation
16S rRNA
Small RNA
(a) Purified total RNA separated on agarose gel Total Transcriptome
Isolation
Total RNA Isolation
(a) The total RNA samples extracted from the various plasmid-carrying K. pneumoniae ST258 strains using different culture volumes were compared in a 1% agarose gel by observing the intensity of the 16 and 23S rRNA bands. A representative image of Agilent 2100 Bioanalyzer (b) electropherogram trace and (c) gel photo, for the RNA samples extracted from 150 ml of culture using TRIzol® Plus Kit (Total RNA Isolation Protocol). The RNA samples consisted of mostly small RNA species as the 16 and 23S RNA peaks were very small on the electropherogram.
(b) Lower Marker
Small RNA
Ribosomal RNA
(c)
Lower Marker
Small RNA
Ribosomal RNA

191
(Figure 4.24a) and the elevated signal (Figure 4.24b) around the ribosomal RNA peaks
showed that mRNA was present in the samples.
4.13.3 Ribosomal RNA Depletion and Library Preparation
The total RNA in a bacterial cell comprises of mostly ribosomal RNAs with messenger RNA
only contributing to about 1 – 5% of the pool of RNA (Giannoukos et al., 2012, He et al.,
2010). To increase the sensitivity of detecting an mRNA transcript during sequencing, the
depletion of ribosomal RNA was carried out before the sequencing stage. All RNA samples
were DNAse-treated to remove DNA contamination as DNA will reduce the ribosomal RNA
depletion efficiency. The DNAse-treated RNA samples were then verified by PCR for the
gyrB gene to be free of DNA contamination (Figure 4.25). The DNA-free RNA samples were
then subjected to ribosomal RNA depletion. All samples (Figure 4.26a & b) were successfully
depleted of ribosomal RNA as shown by the reduction in the two major ribosomal RNA peaks
(16S and 23S) in the Bioanalyzer electropherogram trace (Figure 4.26c & d). The rRNA-
depleted RNA samples were used for preparation of the cDNA library for sequencing. Before
the library was sequenced, all library preparations were analysed by the Agilent 2200
TapeStation (Figure 4.27a). All the cDNA libraries had an average fragment size of about 260
bp, the recommended fragment size for RNA sequencing (Figure 4.27b).
4.13.4 RNA Sequencing
The sequencing obtained approximately 1.3 to 2.0 million reads per sample. The probability
of a base being incorrectly assigned during sequencing was low for most of the length of the
reads (Figure 4.28). The sequencing reads were initially mapped on to the published K.
pneumoniae ST258 chromosome as the reference sequence (Accession No.: CP006923).
However, in the subsequent analysis where the gene annotation file for the chromosome
sequence was required, the software in GalaxyProject was unable to recognise the gene

192
Figure 4.24 Purification of RNA using RiboPureTM RNA Purification Kit
(b) Representative of Agilent 2100 Bioanalyzer electropherogram trace
Lower Marker
Ribosomal RNA
Messenger RNA
(a) Agilent 2100 BioAnalyzer electrophoresis gel
M: Molecular marker (Agilent)
M 1 2 3 4 5
23S rRNA
16S rRNA
6 7 8 9 10 11 12
Lower Marker
ST258 ST258/
pKpQIL-UKST258/
pKpQIL-D2
A representative image of Agilent 2100 Bioanalyzer (a) electropherogram trace and (b) gel photo, showing the total RNA samples extracted from the various K. pneumoniae ST258 strains using RiboPure RNA Purification Kit. All the samples contained mRNA and the discreet 16 and 23S rRNA peaks suggest good RNA integrity with minimal degradation.

193
Figure 4.25 Validation of DNA contamination in DNAse-treated RNA samples
The DNAse-treated RNA samples were checked by PCR (40 cycles) for the presence of the gyrB gene. The presence of DNA contamination would allow the gene to be amplified and the amplicons would be visible in the agarose gel. M: HyperLadder IV (Bioline); Lane 16: K. pneumoniae ST258 genomic DNA; Lane 17: Water; Primer: gyrB-F/R; Expected amplicon: 373 bp.
M 1 2 3 4 5
373 bp
6 7 8 9 10 11 12
300 bp
13 14 15 16 17
ST258 ST258/
pKpQIL-UK ST258/
pKpQIL-D2
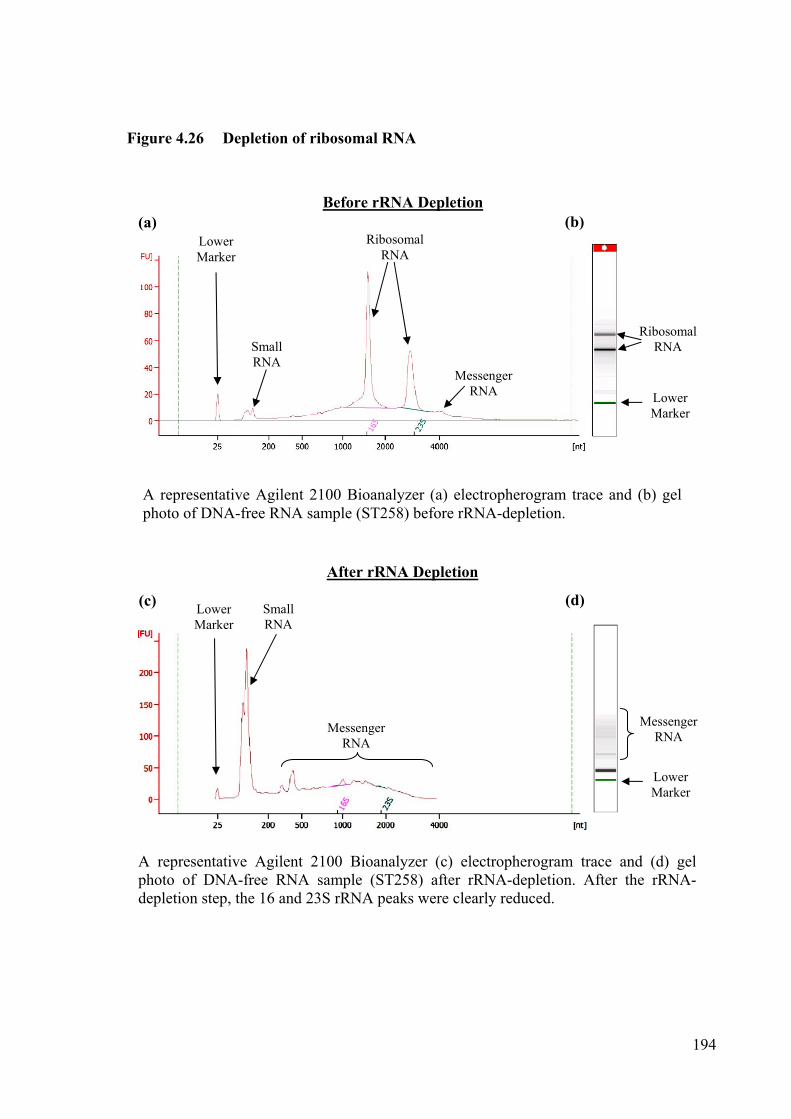
194
Figure 4.26 Depletion of ribosomal RNA
(a)
A representative Agilent 2100 Bioanalyzer (a) electropherogram trace and (b) gel photo of DNA-free RNA sample (ST258) before rRNA-depletion.
Lower Marker
Ribosomal RNA
Small RNA
Messenger RNA Lower
Marker
Ribosomal RNA
(b)
A representative Agilent 2100 Bioanalyzer (c) electropherogram trace and (d) gel photo of DNA-free RNA sample (ST258) after rRNA-depletion. After the rRNA-depletion step, the 16 and 23S rRNA peaks were clearly reduced.
Before rRNA Depletion
(c) (d) Lower Marker
Small RNA
Messenger RNA
Lower Marker
Messenger RNA
After rRNA Depletion

195
Figure 4.27 Validation of cDNA libraries
M: Molecular ladder (Agilent)
cDNA Library
The DNase-treated and rRNA-depleted RNA samples were converted into cDNA. The average length of the fragments in these cDNA libraries were determined by the Agilent 2200 TapeStation. (a) The gel photo shows the average length of the cDNA libraries of all samples. (b) A representative electropherogram shows a majority of the cDNA fragment are at the recommended size of about 260 bp for sequencing.
Lower Marker
cDNA Library
(a) Agilent 2200 TapeStation gel photo of all library preparation for sequencing
Lower Marker
bp M 1 2 3 4 5 6 7 8 9 10 11 12
ST258 ST258/
pKpQIL-UKST258/
pKpQIL-D2
(b) A representative Agilent 2200 TapeStation electropherogram for a cDNA library sample
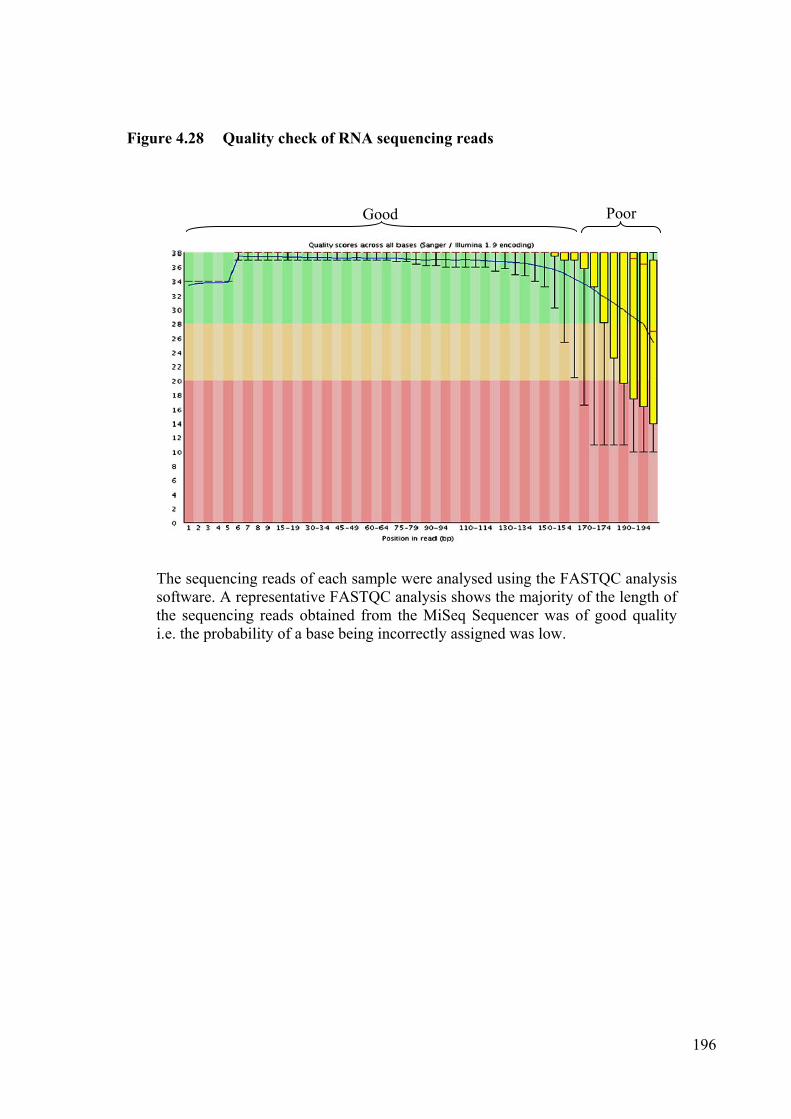
196
Figure 4.28 Quality check of RNA sequencing reads
The sequencing reads of each sample were analysed using the FASTQC analysis software. A representative FASTQC analysis shows the majority of the length of the sequencing reads obtained from the MiSeq Sequencer was of good quality i.e. the probability of a base being incorrectly assigned was low.
Good Poor

197
annotation. This was probably due to incorrect annotation in the original ST258 file. Hence,
the chromosome sequence of K. pneumoniae MGH78578 (ST38) (Accession No.: CP000647)
was used as the reference sequence for the analysis. The MGH78578 shares 91-92% coverage
with 99% identity with the other published ST258 chromosome sequence (CP006923 &
CP006918) (Figure 4.29).
The difference in K. pneumoniae ST258 chromosomal gene expression was studied in
the presence of pKpQIL-UK and -D2 (Table 4.9). The genes were categorised according to
cluster of orthologous groups (COG). Generally, both plasmids did not significantly alter the
gene expression in the K. pneumoniae ST258 host. Interestingly, with the exception of four
genes, pKpQIL-UK and -D2 affected the expression of two different sets of chromosomal
genes. The four genes which were affected by both plasmids were carbon starvation gene
(yjiY), transcriptional regulator (ycgE), short chain dehydrogenase and a gene encoding for a
hypothetical protein. Twenty four genes were differentially expressed due to the presence of
the plasmid. These were broadly categorised into genes related to cellular processes and
signalling (n = 2, Table 4.9a), information storage and processing (n = 4, Table 4.9b),
metabolism (n = 9. Table 4.9c) and genes of poorly characterised functions (n = 9, Table 4.9d).
Most of the genes which were affected by the plasmids were related to transporters involved
in metabolic functions (n = 5, Table 4.9c).
Expression of the pKpQIL-UK and -D2 plasmidic genes were also compared.
However, only the genes located in the substituted regions were found to be expressed
differently (Table 4.10). By mapping the sequencing reads of K. pneumoniae ST258 carrying
the plasmids on to the substituted region of the individual plasmids, it was found that
pKpQIL-UK’s substituted region was transcriptionally more active than the -D2 plasmid
(Figure 4.30 – 4.33). Although both parA and parM genes were found on the substituted
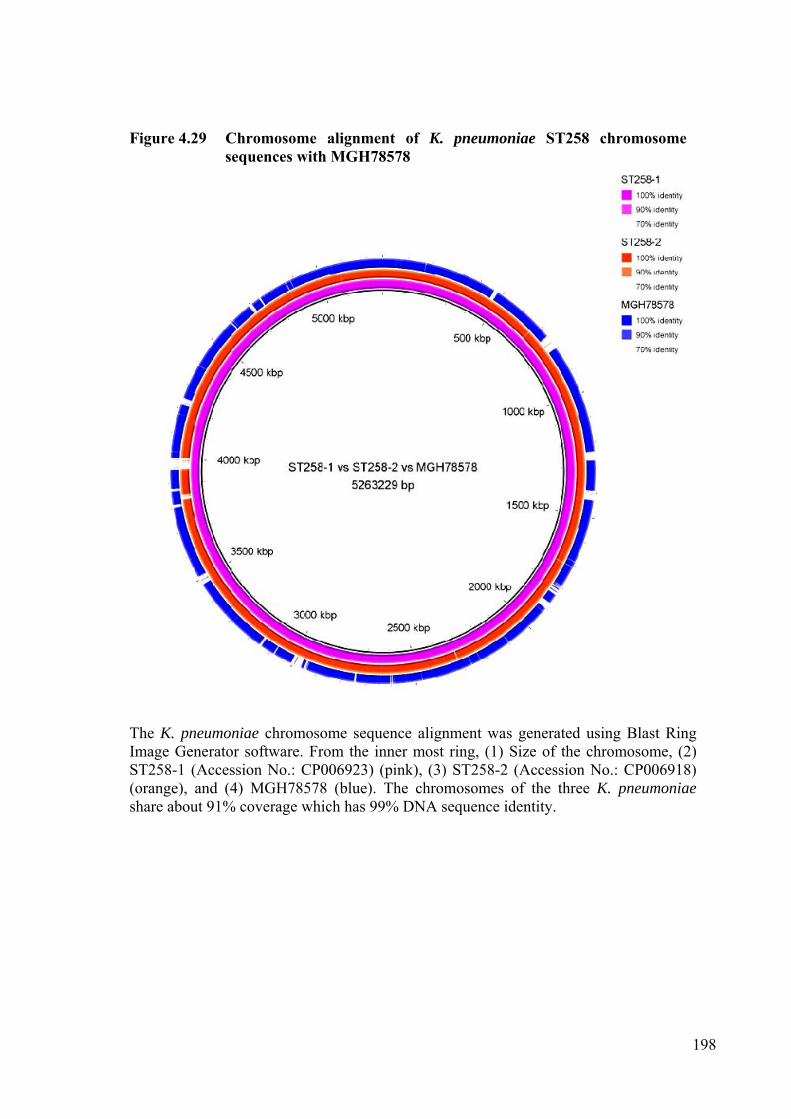
198
Figure 4.29 Chromosome alignment of K. pneumoniae ST258 chromosome sequences with MGH78578
The K. pneumoniae chromosome sequence alignment was generated using Blast Ring Image Generator software. From the inner most ring, (1) Size of the chromosome, (2) ST258-1 (Accession No.: CP006923) (pink), (3) ST258-2 (Accession No.: CP006918) (orange), and (4) MGH78578 (blue). The chromosomes of the three K. pneumoniae share about 91% coverage which has 99% DNA sequence identity.
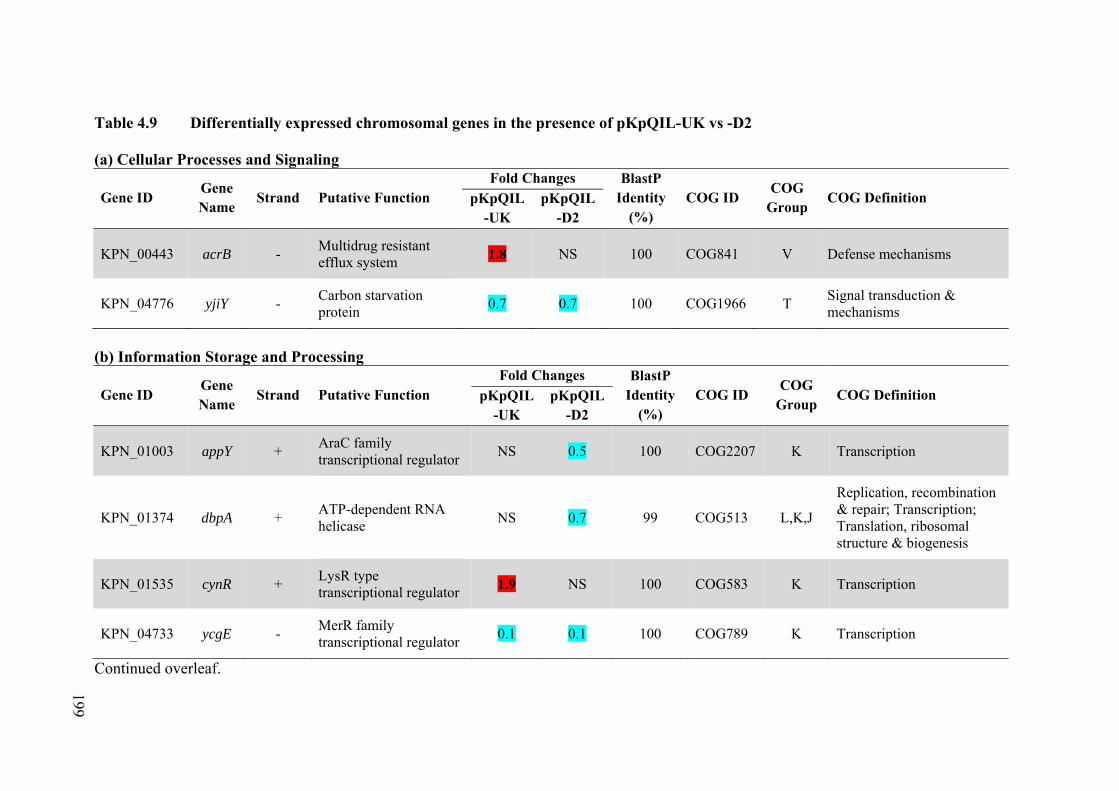
Table 4.9 Differentially expressed chromosomal genes in the presence of pKpQIL-UK vs -D2 (a) Cellular Processes and Signaling
Gene ID Gene Name
Strand Putative Function Fold Changes BlastP
Identity (%)
COG ID COG
Group COG Definition pKpQIL
-UK pKpQIL
-D2
KPN_00443 acrB - Multidrug resistant efflux system
1.8 NS 100 COG841 V Defense mechanisms
KPN_04776 yjiY - Carbon starvation protein
0.7 0.7 100 COG1966 T Signal transduction & mechanisms
(b) Information Storage and Processing
Gene ID Gene Name
Strand Putative Function Fold Changes BlastP
Identity (%)
COG ID COG
Group COG Definition pKpQIL
-UK pKpQIL
-D2
KPN_01003 appY + AraC family transcriptional regulator
NS 0.5 100 COG2207 K Transcription
KPN_01374 dbpA + ATP-dependent RNA helicase
NS 0.7 99 COG513 L,K,J
Replication, recombination & repair; Transcription; Translation, ribosomal structure & biogenesis
KPN_01535 cynR + LysR type transcriptional regulator
1.9 NS 100 COG583 K Transcription
KPN_04733 ycgE - MerR family transcriptional regulator
0.1 0.1 100 COG789 K Transcription
Continued overleaf. 199

(c) Metabolism
Gene ID Gene Name
Strand Putative Function Fold Changes BlastP
Identity (%)
COG ID COG
Group COG Definition pKpQIL
-UK pKpQIL
-D2
KPN_00640 xylG - ABC sugar transporter 1.8 NS 99 COG1129 G Carbohydrate transport & metabolism
KPN_00801 bioF + Biotin metabolism (8-amino-7-oxononanoate synthase)
NS 1.7 100 COG156 H Coenzyme transport & metabolism
KPN_01007 oppA + Oligopeptide transport system
NS 0.5 99 COG4166 E Amino acid transport & metabolism
KPN_02229 chaA + Calcium/sodium:proton antiporter
0.5 NS 100 COG387 P Inorganic ion transport & metabolism
KPN_02235 hemA - Glutamyl-tRNA reductase
0.5 NS 100 COG373 H Coenzyme transport & metabolism
KPN_02333 manX + PTS mannose transporter subunit IIAB
0.7 NS 99 COG3444 G Carbohydrate transport & metabolism
KPN_03184 cobQ - Cobyric acid synthase NS 0.8 100 COG1492 H Coenzyme transport & metabolism
KPN_03259 yesO + Oligogalacturonate-binding protein OgtD
NS D2 100 COG1653 G Carbohydrate transport & metabolism
KPN_03375 metK + S-adenosylmethionine synthetase
NS 1.4 100 COG192 H Coenzyme transport & metabolism
200
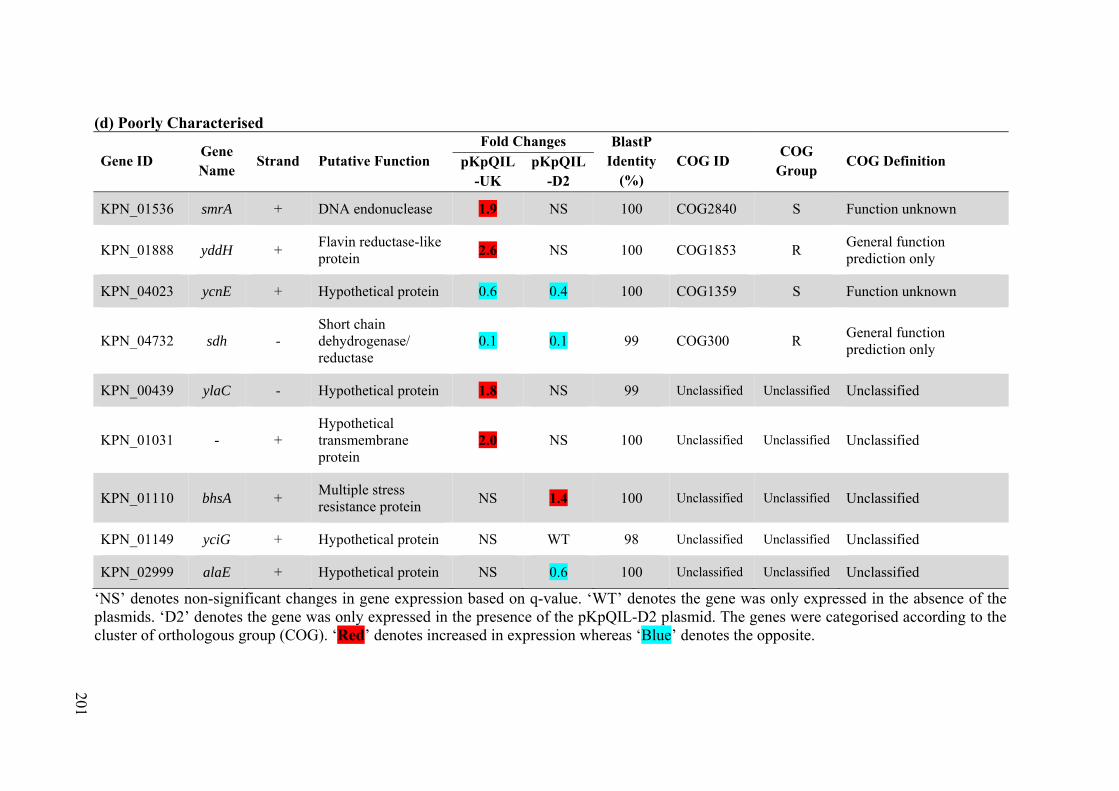
(d) Poorly Characterised
Gene ID Gene Name
Strand Putative Function Fold Changes BlastP
Identity (%)
COG ID COG
Group COG Definition pKpQIL
-UK pKpQIL
-D2
KPN_01536 smrA + DNA endonuclease 1.9 NS 100 COG2840 S Function unknown
KPN_01888 yddH + Flavin reductase-like protein
2.6 NS 100 COG1853 R General function prediction only
KPN_04023 ycnE + Hypothetical protein 0.6 0.4 100 COG1359 S Function unknown
KPN_04732 sdh - Short chain dehydrogenase/ reductase
0.1 0.1 99 COG300 R General function prediction only
KPN_00439 ylaC - Hypothetical protein 1.8 NS 99 Unclassified Unclassified Unclassified
KPN_01031 - + Hypothetical transmembrane protein
2.0 NS 100 Unclassified Unclassified Unclassified
KPN_01110 bhsA + Multiple stress resistance protein
NS 1.4 100 Unclassified Unclassified Unclassified
KPN_01149 yciG + Hypothetical protein NS WT 98 Unclassified Unclassified Unclassified
KPN_02999 alaE + Hypothetical protein NS 0.6 100 Unclassified Unclassified Unclassified
‘NS’ denotes non-significant changes in gene expression based on q-value. ‘WT’ denotes the gene was only expressed in the absence of the plasmids. ‘D2’ denotes the gene was only expressed in the presence of the pKpQIL-D2 plasmid. The genes were categorised according to the cluster of orthologous group (COG). ‘Red’ denotes increased in expression whereas ‘Blue’ denotes the opposite. 201
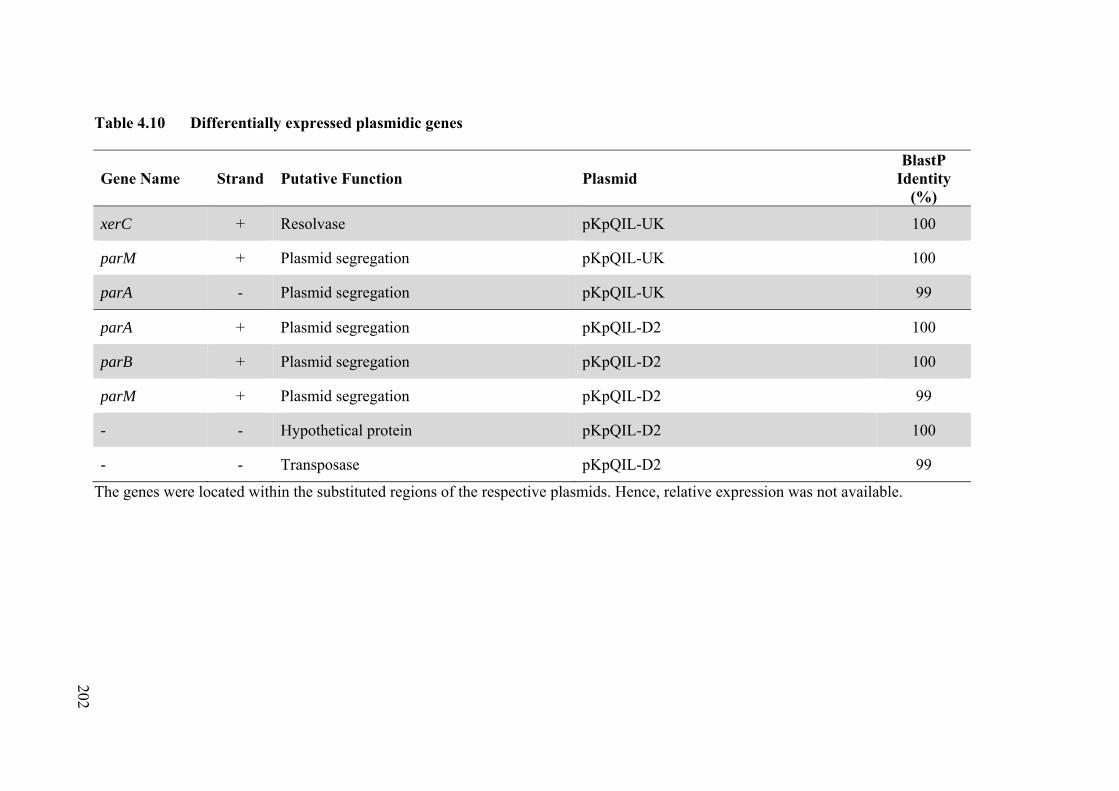
Table 4.10 Differentially expressed plasmidic genes
Gene Name Strand Putative Function Plasmid BlastP
Identity (%)
xerC + Resolvase pKpQIL-UK 100
parM + Plasmid segregation pKpQIL-UK 100
parA - Plasmid segregation pKpQIL-UK 99
parA + Plasmid segregation pKpQIL-D2 100
parB + Plasmid segregation pKpQIL-D2 100
parM + Plasmid segregation pKpQIL-D2 99
- - Hypothetical protein pKpQIL-D2 100
- - Transposase pKpQIL-D2 99
The genes were located within the substituted regions of the respective plasmids. Hence, relative expression was not available.
202
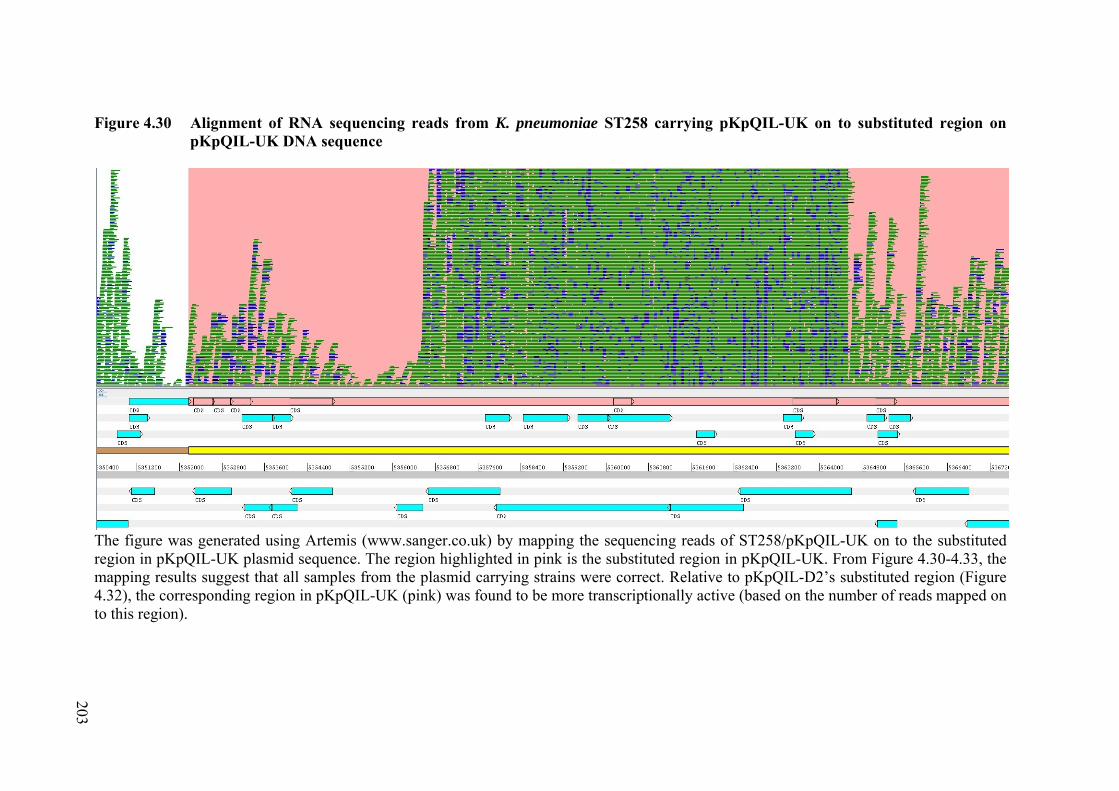
Figure 4.30 Alignment of RNA sequencing reads from K. pneumoniae ST258 carrying pKpQIL-UK on to substituted region on pKpQIL-UK DNA sequence
The figure was generated using Artemis (www.sanger.co.uk) by mapping the sequencing reads of ST258/pKpQIL-UK on to the substituted region in pKpQIL-UK plasmid sequence. The region highlighted in pink is the substituted region in pKpQIL-UK. From Figure 4.30-4.33, the mapping results suggest that all samples from the plasmid carrying strains were correct. Relative to pKpQIL-D2’s substituted region (Figure 4.32), the corresponding region in pKpQIL-UK (pink) was found to be more transcriptionally active (based on the number of reads mapped on to this region). 203
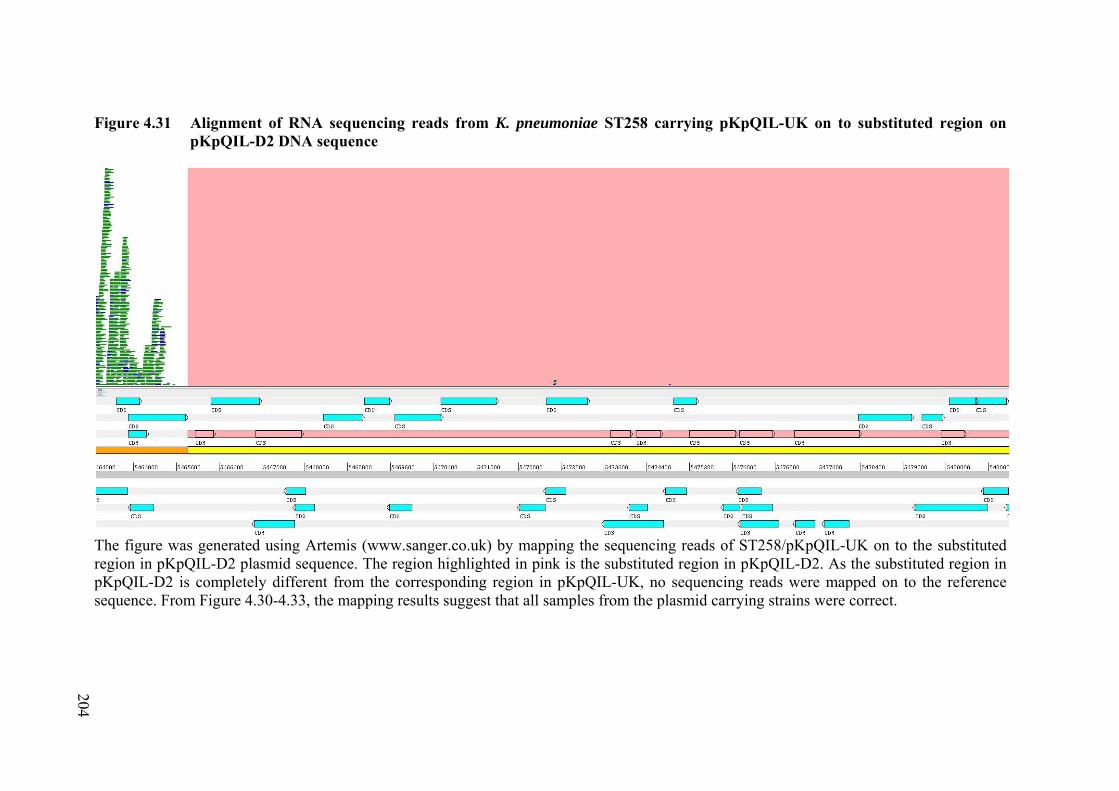
Figure 4.31 Alignment of RNA sequencing reads from K. pneumoniae ST258 carrying pKpQIL-UK on to substituted region on pKpQIL-D2 DNA sequence
The figure was generated using Artemis (www.sanger.co.uk) by mapping the sequencing reads of ST258/pKpQIL-UK on to the substituted region in pKpQIL-D2 plasmid sequence. The region highlighted in pink is the substituted region in pKpQIL-D2. As the substituted region in pKpQIL-D2 is completely different from the corresponding region in pKpQIL-UK, no sequencing reads were mapped on to the reference sequence. From Figure 4.30-4.33, the mapping results suggest that all samples from the plasmid carrying strains were correct. 204

Figure 4.32 Alignment of RNA sequencing reads from K. pneumoniae ST258 carrying pKpQIL-D2 on to substituted region on pKpQIL-D2 DNA sequence
The figure was generated using Artemis (www.sanger.co.uk) by mapping the sequencing reads of ST258/pKpQIL-D2 on to the substituted region in pKpQIL-D2 plasmid sequence. The region highlighted in pink is the substituted region in pKpQIL-D2. From Figure 4.30-4.33, the mapping results suggest that all samples from the plasmid carrying strains were correct. Relative to pKpQIL-UK’s substituted region (Figure 4.30), the corresponding region in pKpQIL-UK (pink) was found to be more transcriptionally active (based on the number of reads mapped on to this region). 205
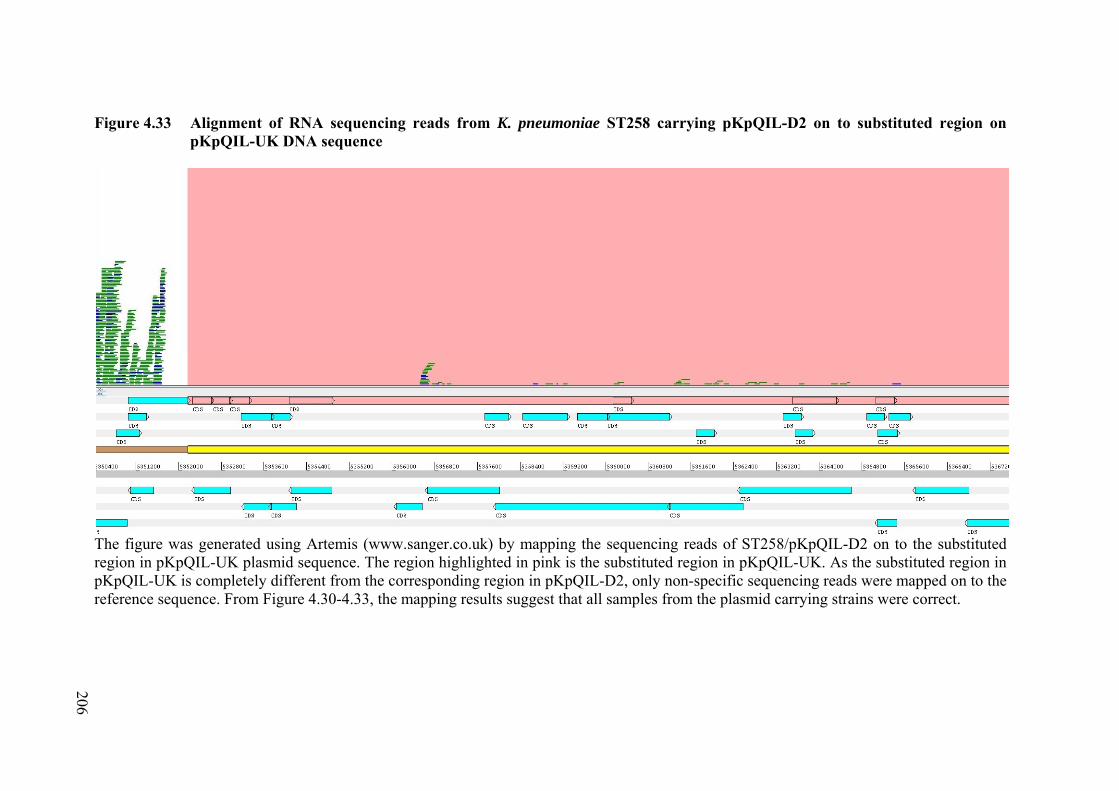
Figure 4.33 Alignment of RNA sequencing reads from K. pneumoniae ST258 carrying pKpQIL-D2 on to substituted region on pKpQIL-UK DNA sequence
The figure was generated using Artemis (www.sanger.co.uk) by mapping the sequencing reads of ST258/pKpQIL-D2 on to the substituted region in pKpQIL-UK plasmid sequence. The region highlighted in pink is the substituted region in pKpQIL-UK. As the substituted region in pKpQIL-UK is completely different from the corresponding region in pKpQIL-D2, only non-specific sequencing reads were mapped on to the reference sequence. From Figure 4.30-4.33, the mapping results suggest that all samples from the plasmid carrying strains were correct.
206

207
region of pKpQIL-UK and -D2, and were highly expressed, these genes shared low amino
acid sequence identity to each other (Figure 4.34 & 4.35).
4.14 Discussion
Bacterial fitness is a complex phenomenon which can be broadly defined as the ability of
bacteria to alter their metabolism to adapt to the environmental conditions, in order for its
genetic trait to compete, survive and reproduce within itself or to transfer across different
hosts (Binet and Maurelli, 2005, Pope et al., 2010). For this study, the fitness of the plasmid-
bearing strains was investigated in various ways, such as growth rates, biofilm formation,
conjugation frequency, antibiotic susceptibility and pairwise competition.
Plasmid carriage has been previously reported to incur a fitness cost, most often
translated into slower growth rates (Bouma and Lenski, 1988, Dahlberg and Chao, 2003,
Lenski and Bouma, 1987, Ow et al., 2006). In this PhD study, the growth rates of pKpQIL-
UK and -D2 were indistinguishable from their parental strains (K. pneumoniae ST258, S.
Typhimurium SL1344 and E. coli NCTC10418). Although SL1344 and ATCC14028s are
generally regarded as closely related pathogenesis models for Salmonella (Brown et al., 2011),
pKpQIL-D2 carriage in S. Typhimurium ATCC14028s conferred a significantly slower
growth rate. These data suggest that minor differences in the host played a role in the
differences in fitness impact of the plasmids. pKpQIL-UK, but not -D2, negatively affected
the growth rate of S. marcescens and E. cloacae. Although both plasmids are very similar
with 85% coverage at 99% sequence identity, the differences in the substituted region could
have contributed to the differences in observed growth rates. Although a large plasmid size
has been implicated with slower growth rates (Smith and Bidochka, 1998, Zünd and Lebek,
1980), such a correlation was not observed in this study (pKpQIL-UK=113 kb; -D2=111 kb).
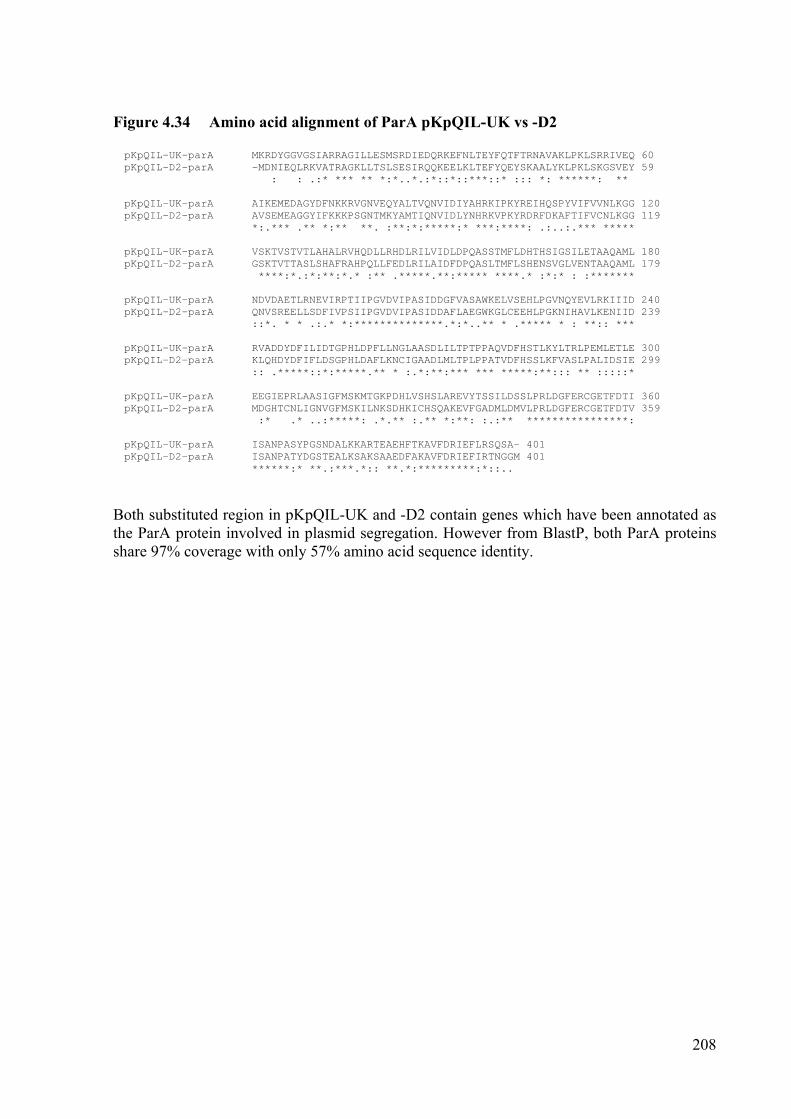
208
Figure 4.34 Amino acid alignment of ParA pKpQIL-UK vs -D2 pKpQIL-UK-parA MKRDYGGVGSIARRAGILLESMSRDIEDQRKEFNLTEYFQTFTRNAVAKLPKLSRRIVEQ 60 pKpQIL-D2-parA -MDNIEQLRKVATRAGKLLTSLSESIRQQKEELKLTEFYQEYSKAALYKLPKLSKGSVEY 59 : : .:* *** ** *:*..*.:*::*::***::* ::: *: ******: ** pKpQIL-UK-parA AIKEMEDAGYDFNKKRVGNVEQYALTVQNVIDIYAHRKIPKYREIHQSPYVIFVVNLKGG 120 pKpQIL-D2-parA AVSEMEAGGYIFKKKPSGNTMKYAMTIQNVIDLYNHRKVPKYRDRFDKAFTIFVCNLKGG 119 *:.*** .** *:** **. :**:*:*****:* ***:****: .:..:.*** ***** pKpQIL-UK-parA VSKTVSTVTLAHALRVHQDLLRHDLRILVIDLDPQASSTMFLDHTHSIGSILETAAQAML 180 pKpQIL-D2-parA GSKTVTTASLSHAFRAHPQLLFEDLRILAIDFDPQASLTMFLSHENSVGLVENTAAQAML 179 ****:*.:*:**:*.* :** .*****.**:***** ****.* :*:* : :******* pKpQIL-UK-parA NDVDAETLRNEVIRPTIIPGVDVIPASIDDGFVASAWKELVSEHLPGVNQYEVLRKIIID 240 pKpQIL-D2-parA QNVSREELLSDFIVPSIIPGVDVIPASIDDAFLAEGWKGLCEEHLPGKNIHAVLKENIID 239 ::*. * * .:.* *:**************.*:*..** * .***** * : **:: *** pKpQIL-UK-parA RVADDYDFILIDTGPHLDPFLLNGLAASDLILTPTPPAQVDFHSTLKYLTRLPEMLETLE 300 pKpQIL-D2-parA KLQHDYDFIFLDSGPHLDAFLKNCIGAADLMLTPLPPATVDFHSSLKFVASLPALIDSIE 299 :: .*****::*:*****.** * :.*:**:*** *** *****:**::: ** :::::* pKpQIL-UK-parA EEGIEPRLAASIGFMSKMTGKPDHLVSHSLAREVYTSSILDSSLPRLDGFERCGETFDTI 360 pKpQIL-D2-parA MDGHTCNLIGNVGFMSKILNKSDHKICHSQAKEVFGADMLDMVLPRLDGFERCGETFDTV 359 :* .* ..:*****: .*.** :.** *:**: :.:** ****************: pKpQIL-UK-parA ISANPASYPGSNDALKKARTEAEHFTKAVFDRIEFLRSQSA- 401 pKpQIL-D2-parA ISANPATYDGSTEALKSAKSAAEDFAKAVFDRIEFIRTNGGM 401 ******:* **.:***.*:: **.*:*********:*::..
Both substituted region in pKpQIL-UK and -D2 contain genes which have been annotated as the ParA protein involved in plasmid segregation. However from BlastP, both ParA proteins share 97% coverage with only 57% amino acid sequence identity.

209
Figure 4.35 Amino acid alignment of ParM pKpQIL-UK vs -D2 pKpQIL-UK-parM ------MATISTISQPLRGEFIRTAATAGAVVY-QVDARLPALIPVFFAGQLSAVRLCAV 53 pKpQIL-D2-parM MNIYCDDGSTNVKLAWFEGDELQTRVSANSFRHGWKVAEFSAATFNYQVGTLKYTWDSVS 60 .: .. :.*: ::* .:*.:. : *.:.* : .* *. . .. pKpQIL-UK-parM MALVSGT-----WSSL-----------TGLPDEPENGGAALPVSP---------ETEYQR 88 pKpQIL-D2-parM RDAIPTTNVEYQYGDLNLLAVHHALLNSGLEPQPVSLTVTLPLSEYYDGDCQRNEENIRR 120 :. * :..* :** :* . .:**:* * : :* pKpQIL-UK-parM RR----YTLTLQNGRSG---------ERVESVLTEASSRLRGDLLRNLIITG----LALH 131 pKpQIL-D2-parM KRENLMRELVLNKGRAFTVTDVKVMPESLPAAFSRLAELKPGPAETTLIIDLGGTTLDAG 180 :* *.*::**: * : :.::. :. * .*** * pKpQIL-UK-parM TTAPELPRLLASMPVPPTSVSELQALVQQMAGTAD------------------------- 166 pKpQIL-D2-parM VIVGQFDDISAVHGNPSVGVSQVTRAAAGALRAADSETSALIADTIIRNRNDRQYLQRVI 240 . . :: : * *...**:: . :** pKpQIL-UK-parM -----VNRAAAAVPDTPTASAAPVS---------------GSDTREIKKNMRRAFGD--- 203 pKpQIL-D2-parM NDAGKIDEVRNKITEAITSLGARVTSELTAFRNVNRVFLVGGGASLIEEAIRQAWPLAPD 300 ::.. :.:: *: .* *: *..: *:: :*:*: pKpQIL-UK-parM ----------------------- pKpQIL-D2-parM RIEVIGDPQMALAREIALYNKED 323
Both substituted region in pKpQIL-UK and -D2 contain genes which have been annotated as the ParM protein involved in plasmid segregation. However, both ParM proteins share only 26% coverage and 45% identity.

210
Bacterial growth rates have also been implicated to impact upon drug susceptibility
(Costerton et al., 1999, Gilbert et al., 1990, Lewis, 2001). However, this was not observed in
this study. All strains carrying the two plasmids were inhibited by similar MIC values for the
antibiotics tested.
S. marcescens carrying pKpQIL-UK which was found in this PhD study to be more
resistant than S. marcescens carrying pKpQIL-D2 towards carbapenem antibiotics. A
previous study implicated the loss of OmpF and/or OmpC with the overproduction of AmpC
β-lactamase as a cause for β-lactam resistance in S. marcescens (Weindorf et al., 1998).
However, no difference in porin expression was observed in my study. Derepression of
AmpC β-lactamase in the presence of antibiotic inducers has been previously reported. Some
β-lactam antibiotics such as imipenem, cefoxitin and cefotetan are known to be strong AmpC
β-lactamase inducers whilst third generation cephalosporins such as cefotaxime and
ceftazidime have poor inducing properties (Sanders et al., 1997, Stapleton et al., 1995).
Therefore in S. marcescens NCTC10211 carrying the pKpQIL-D2 plasmid, the phenotype
maybe caused by incomplete derepression of the chromosomal AmpC β-lactamase.
The high rate of loss of both plasmids from the E. coli population was probably due to
high fitness cost incurred by the presence of the plasmids. The general fitness cost of plasmid
carriage may be attributed to a variety of factors including cytotoxic effect resulting from
misfolded proteins, additional usage of cellular resources for physiological processes and
alteration of metabolic flux due to introduction of homologues (Baltrus, 2013). The loss of
pKpQIL-D2 but not pKpQIL-UK from the S. Typhimurium SL1344 and ATCC14028s
populations suggests that the fitness cost most probably originated from the substituted region
in pKpQIL-D2. The stability of large low copy plasmids within a bacterial population is
generally facilitated by post-segregational killing and active partitioning mechanisms encoded
211
by the plasmids (Sengupta and Austin, 2011). The pKpQIL-UK plasmid is known to encode
genes involve in plasmid maintenance, such as the parA/parB and stbA/stbB (Leavitt et al.,
2010a). The variant plasmid, pKpQIL-D2 also carries the same stbA/stbB genes but a variant
of parA/parB genes. It is possible that these genes were not able to function efficiently in
maintaining the plasmids in some of the genetic backgrounds tested. Although it has been
reported that genetic adaptation, which ameliorates the fitness cost of plasmid carriage can
reduce the rate of loss of the plasmid (San Millan et al., 2014), this was not observed under
the conditions tested. The plasmids exhibited a complete, rather than a delayed loss in the
persistence assay. Both plasmids had similar conjugation frequencies into the two Salmonella
strains, but pKpQIL-D2 was unable to persist. This may suggests that lateral gene transfer
play little role in the maintenance of these two plasmids. Previous studies have shown strong
correlation between antibiotic usage and the emergence of resistance (Van De Sande-
Bruinsma et al., 2008). The reduction in antibiotic consumption has also led to the decrease in
resistance (Anonymous, 2008, Seppälä et al., 1997). However, where the genes encoding for
antibiotic resistance are found on successful plasmid such as pKpQIL-UK or its variant, the
reduction in resistance is unlikely.
Interestingly, it was observed that the percentage of K. pneumoniae ST258 and Ecl8
carrying the pKpQIL-UK plasmid dropped at the early stages of the persistence experiment
(Figure 4.9b and Figure 4.12d). However, the plasmid carrying population recovered after day
5 (ca. 35 generations). A similar observation was noted with the original clinical isolate (K.
pneumoniae ST321) carrying the pKpQIL-D2. This may indicate a slight fitness cost of the
plasmids in their respective hosts which was rapidly abrogated. A study has shown that
chromosomal adaptation could alleviate the fitness cost of the plasmids after 100 generations

212
of co-existence of the plasmid and its host (San Millan et al., 2014). However, it is unclear
whether a similar adaptation had occurred with the persistence experiments in this PhD.
Relative to the host bacterial strain with no plasmid (i.e. before introduction of
pKpQIL-UK and -D2), both plasmids affected the ability of various Enterobacteriaceae hosts
to form a biofilm on plastic in different ways. Biofilm formation is an important phenomenon
as most bacteria (99%) in the natural environment exist in biofilms (Potera, 1996). The
establishment of a biofilm by a single or a mixture of bacterial species plays an important role
in various infections and resistance to antimicrobial agents (antibiotics and biocides)
(Costerton et al., 1999). Conflicting data associating conjugation to biofilm formation have
been previously reported (Ghigo, 2001, Reisner et al., 2006, Røder et al., 2013). The carriage
of F-plasmids has been previously shown to confer the ability to form biofilm in the E. coli
host (Ghigo, 2001). When plasmid carrying strains which do not form thick biofilm on their
own were co-cultured with the plasmid-free E. coli MG1655, the author observed a significant
increase in biofilm formation. Moreover, when the traA gene involved in pilus formation on
the plasmid was inactivated, the ability to form a biofilm was abolished (Ghigo, 2001). This
also suggested that the cell-to-cell and/or cell-to-surface contact promoted by the conjugation
pilus can influence biofilm formation (Ghigo, 2001). A similar observation was made in
another study investigating the effects of co-culturing clinical isolates with plasmid-free E.
coli on biofilm formation (Reisner et al., 2006). However, a recent study on IncP-1 plasmid
carriage in different species showed a reduction in biofilm formation (Røder et al., 2013). In
contrast, the inactivation of traF gene involved in the conjugation machinery increased the
biofilm formation of the host bacterium (Røder et al., 2013). However, as the conjugation
machinery involves a large number of genes, it is likely that there is a complex interaction
between this machinery with that of biofilm formation. From my study, it was observed that

213
the bacterial species also contributed to the difference in ability to form a biofilm in the
presence of the plasmids.
The pairwise competition assay between the pKpQIL-UK and -D2 in K. pneumoniae
Ecl8 showed that pKpQIL-D2 conferred a competitive advantage over pKpQIL-UK in this
host. Over the 20-day period, the majority of pKpQIL-UK carrying Ecl8 strain was displaced
from the population. All the strains used in this competition had comparable growth rates
discounting growth rate as the factor for the plasmid loss from the population. Unlike in S.
Typhimurium, both pKpQIL-UK and -D2 were able to persist within the population of K.
pneumoniae over a period of 20 days (ca. 140 generation). This suggested that the pKpQIL-
D2 plasmid had a competitive advantage over pKpQIL-UK when both plasmid carrying K.
pneumoniae Ecl8 hosts were grown in the same population. In the competition of pKpQIL-
UK vs -D2 blaKPC::aph, it was observed that pKpQIL-UK was not completely cleared from
the population. It is possible that the kanamycin resistance gene (aph) had a fitness impact on
the pKpQIL-D2 plasmid reducing its ability to displace the pKpQIL-UK plasmid. However,
the aph gene was used extensively in our previous work and no apparent fitness cost was
observed (Cottell et al., 2014, Cottell et al., 2012). The plasmids pKpQIL-UK, -D2 and their
blaKPC-inactivated plasmids were conjugative as the tra locus was still present. As both
plasmids were of the same incompatibility group, the transfer of pKpQIL-D2 into pKpQIL-
UK-carrying Ecl8Rif was unlikely as both plasmids could not coexist in the same host. The
possibility of the transfer of pKpQIL-D2 into plasmid-free Ecl8Rif (from the loss of pKpQIL-
UK) and displacing the pKpQIL-UK-carrying host from the population was minimal as both
plasmids persisted equally well in K. pneumoniae Ecl8Rif without any significant loss and all
the plasmid carrying strains used in the competition had equal generation times (Figure 4.12d
& Figure 4.13 & Table 4.3). Moreover, pKpQIL-UK was found to have a higher conjugation

214
frequency than pKpQIL-D2. As pKpQIL-UK was out-competed by pKpQIL-D2, it was
unlikely that conjugation played a significant role in this experiment.
Another method to assess fitness of the plasmid carrying hosts is by studying the
bacteria using infection models. A simple model involving Galleria mellonella has been
established to study infection by K. pneumoniae (Insua et al., 2013, Wand et al., 2013). In this
model, there was no detectable difference in virulence between the two plasmid carrying K.
pneumoniae ST258 under the conditions tested. It is possible that this infection model is not
sufficiently sensitive to detect the subtle differences contributed by the plasmids. Hence,
additional virulence assays such as murine infection model, serum resistance and
macrophage-mediated killing assays are needed to assess the virulence of the pKpQIL-UK
and -D2 carrying K. pneumoniae ST258 (Diago-Navarro et al., 2014).
The RNA sequencing data revealed a minimal influence of both plasmids on the host
chromosomal gene expression. Those chromosomal genes with altered transcription were
related to metabolic functions. However, there was no clear association of these pathways
with the fitness or virulence of the host. Interestingly, pKpQIL-UK was found to up-regulate
the multidrug efflux pump component gene, acrB. The up-regulation of this gene did not
translate into obvious changes in antibiotic susceptibility of the host for the antibiotics tested.
However, acrB is also known to affect virulence of the host and biofilm formation (Piddock,
2006b). However, there were no detectable changes in biofilm formation or Galleria infection
for K. pneumoniae ST258 carrying pKpQIL-UK vs -D2. However, the lack of observed
difference may also be caused by the poor biofilm forming ability of the ST258 strain used.
The lack of many changes in gene expression of the host in the presence of the plasmids may
imply that the plasmids are well adapted to K. pneumoniae. Hence, they do not significantly
change the gene expression of their host resulting in excessive (if any) fitness cost. The

215
pKpQIL-UK plasmids have been generally found in K. pneumoniae since its discovery (Chen
et al., 2014a, Leavitt et al., 2010b, Villa et al., 2013). Moreover, the pKpQIL-UK is
essentially comprised of pKPN4 with the Tn4401 harbouring the blaKPC-2 gene (Leavitt et al.,
2010a). The pKPN4 plasmid was found in the multidrug-resistant K. pneumoniae MGH78578
(ATCC700721) isolated from the sputum of a 66-year-old ICU patient with Klebsiella caused
pneumonia in 1994. The pKpQIL-UK plasmid is relatively stable with less than 10 nucleotide
substitution detected in sequenced plasmids (Chen et al., 2014a, Leavitt et al., 2010b).
Although deletion or variations of the plasmid have been reported, the significance of these
variants is unclear (Chen et al., 2014a, Villa et al., 2013). In the RNA sequencing analysis, it
was found that the plasmid segregation genes parA and parM were highly expressed in both
plasmids. However, the genes found on both plasmids share low amino acid sequence identity.
It is unclear whether these proteins function differently in the individual plasmids.
The RNA sequencing data suggested no significant difference in the transcriptome
profile of the plasmid carrying K. pneumoniae ST258. Similarly, the presence of both
plasmids in K. pneumoniae did not show a significant difference in phenotype under the
conditions tested. Taken together, these may suggest that the plasmids are well adapted to the
K. pneumoniae host. Hence, both plasmids do not confer significant fitness cost on their host,
allowing them to thrive in K. pneumoniae. However, this is different to the observations with
an IncH plasmid commonly found in S. Typhimurium (Paytubi et al., 2013). The study found
that the IncHI1 plasmid affected different categories of genes to assist its Salmonella host to
adapt to environmental stresses. A recent study also found that the introduction of a ca. 5 kb
plasmid (pNUK73) had tremendous impact on the transcriptional profile of its P. aeruginosa
PAO1 host (San Millan et al., 2015). This shuttle vector was rapidly loss from its host due to
its high fitness cost (San Millan et al., 2014). The fitness cost was a result of the expression of

216
the Rep plasmid replication protein (San Millan et al., 2015). After 300 generations of co-
existence with its host, chromosomal mutations in the helicase or kinase gene successfully
reverted the transcriptome profile of the plasmid-carrying strains to that of the plasmid-free P.
aeruginosa PAO1, reducing the cost of plasmid carriage and stabilising the plasmid in the
bacterial population (San Millan et al., 2014, San Millan et al., 2015). These studies suggest
that different plasmid incompatibility groups may affect their host differently.
Due to its isolation in many Enterobacteriaceae species in the outbreaks in UK, it was
hypothesised that pKpQIL-D2 was more successful than pKpQIL-UK. The data obtained
from the competition experiment suggest that the variant plasmid is able to displace pKpQIL-
UK from the population under the conditions tested. However, outbreaks in the UK were
found to involve both plasmids, suggesting that both plasmids are able to persist equally in the
clinical environment.
4.15 Future Work
It has been shown that plasmid copy number can affect the metabolic flux of the plasmid
carrying host possibly due to increase gene expression (Adler et al., 2014, Wang et al., 2006).
Determination of the plasmid copy number of pKpQIL-UK and -D2 in the various
Enterobacteriaceae bacteria could provide more insights to some of the observations made in
this study. For example, the loss of pKpQIL-D2 from the Salmonella host strains during the
20-day plasmid persistence assay may be due to low plasmid copy number. The information
on the plasmid copy number after the inactivation of the blaKPC gene with the kanamycin
resistance gene (aph) will also exclude the plasmid copy number factor in the interpretation of
the competitive advantage observed in pKpQIL-D2. Also, it can be hypothesised that the
difference in the plasmid segregation proteins (ParA and ParM) in conjunction with low
217
plasmid copy number have contributed to the advantage observed in pKpQIL-D2 during the
competition experiment or its inability to persist in a S. Typhimurium host.
Real time PCR could also be used to determine the expression of the plasmid
maintenance genes (parAB and stbAB) in the Salmonella and E. coli hosts where the loss of
plasmids from the population was significant. The plasmid persistence assay involved daily
sub-culturing of the plasmid-carrying bacteria. Hence, bacteria constantly undergo the lag, log
and stationary phases of growth. It is hypothesised that both plasmid-carrying bacteria
perform differently in the different growth phases leading to the subsequent displacement
from the population. Using a chemostat, the growth rate can be kept constant to reduce the
variability in the experiment. The same could be done with the pairwise competition assay to
determine the competitiveness of the plasmid-carrying strains.
Although pKpQIL-UK has been reported to have crossed the sequence type barrier
and is found in other ST strains of K. pneumoniae (Chen et al., 2014a), a pairwise competition
assay should ideally be done using a carbapenem susceptible ST258 which is the predominant
K. pneumoniae clone and host of the plasmid. In order to use the current antibiotic resistance
gene for inactivation/tagging of the blaKPC gene on the plasmid, a kanamycin or
chloramphenicol susceptible ST258 strain will be needed. Otherwise, an alternative resistance
marker (e.g. tellurite resistance gene) could be used instead to differentiate the plasmids
during competition. However, the alternative marker will need to be tested to confirm that it
does not confer any significant cost to the plasmid-carrying host.
The RNA sequencing showed that the presence of either plasmid had little influence
on chromosomal gene expression. Nonetheless, the difference in the gene expression in the
presence of both plasmids needs to be confirmed by using qRT-PCR. Another study also
showed that different culture conditions and growth phases can affect the influence of the

218
plasmids on their host (Paytubi et al., 2013). It is hypothesised that pKpQIL-UK and -D2 may
regulate host gene expression under stress to allow their persistence within the bacterial
population. Hence, the RNA sequencing could be repeated using total RNA extracted from
stationary phase to investigate the effects of the plasmids on their host under stress (e.g.
limited nutrients).
4.16 Key Findings
Contrary to the hypothesis, pKpQIL-D2 does not confer an obvious fitness advantage to
its host over pKpQIL-UK.
Both pKpQIL-UK and pKpQIL-D2 plasmids influenced their host differently in the
various fitness experiments done.
The pKpQIL-D2 plasmid was found to out-compete pKpQIL-UK in a pairwise
competition assay.
RNA-sequencing suggests that both plasmids have a minimal effect on host chromosomal
gene expression.

219
CHAPTER FIVE: OVERALL DISCUSSION
The continuous spread and persistence of carbapenemase-producing Enterobacteriaceae and
deleterious impact on the treatment of infections have attracted increasing attention in the
recent years (Otter, 2014). The spread of these carbapenemases and other major β-lactamases
is promoted by plasmids (Harris et al., 2015). In addition to antibiotic resistance, plasmid
carriage also promotes evolution of the bacterial host via acquisition of new beneficial traits
associated with virulence, resistance to heavy metals and additional metabolic functions
(Bennett, 2008). It is a widely viewed that the acquisition of plasmids incurs a significant
fitness cost upon the bacterial host, which results in plasmid-bearing bacteria to be out-
competed by the plasmid-free strains (Bouma and Lenski, 1988, Lenski, 1998, Lenski and
Nguyen, 1988).
In this PhD study, the impact of a globally disseminated blaKPC carbapenemase
encoding plasmid (pKpQIL-UK) and its variant (pKpQIL-D2) on various Enterobacteriaceae
host strains was investigated. The pKpQIL-D2 variant has not been described in the published
blaKPC-encoding plasmids to date (31st March 2015). The majority of the pKpQIL-like
plasmids (i.e. pKpQIL-UK) investigated (Chen et al., 2014a) do not carry the substituted
region observed in the pKpQIL-D2 isolated in the UK. Since the discovery of the pKpQIL
plasmid in Israel, the plasmid has since been isolated in various continents including North
America, Europe and Asia (Chen et al., 2013, Leavitt et al., 2010a, Richter et al., 2012, Tang
et al., 2014, Hrabák et al., 2013, Lee et al., 2014). Variants of the plasmid have also been
isolated (Chen et al., 2014a, Villa et al., 2013). The variations in the plasmids obtained can be
very drastic. Although the original pKpQIL plasmid was approximately 114 kb, deletion,
insertion and fusion events have been observed which resulted in the generation of variant
plasmids ranging from 49 kb to 115 kb (Chen et al., 2014a, Villa et al., 2013). The presence

220
of multiple insertion elements (e.g. IS26) on the plasmid is believed to have contributed to the
plasticity of this plasmid (Partridge, 2014, Villa et al., 2013).
The historical events leading to the emergence of the pKpQIL-D2 variant plasmid are
unclear. The pKpQIL-UK (or referred to as pKpQIL in the literature) plasmid is essentially of
pKPN4 plasmid of K. pneumoniae MGH 78578 (Accession No.: GCA_000016305) carrying
the blaKPC containing Tn4401 transposon (Leavitt et al., 2010a). As the host K. pneumoniae
strain MGH 78578 carries five plasmids (pKPN3, 4, 5, 6 and 7), it is possible that the D2
substituted region was a result of recombination of the pKPN4 and pKPN5 plasmids (Figure
1.8 & 4.1). The region between the repB and umuD (Figure 1.8) in the pKpQIL-D2 16 kb
substituted region shares 98% DNA sequence identity with the corresponding region in
pKPN5. However, it is unclear whether the blaKPC containing transposon was inserted in
pKpQIL-D2 before or after the additional fragment of the substituted region was introduced.
The source of the additional fragment is also unclear as Blastn search of the fragment did not
provide any significant homology hits apart from pKPN5.
Previous reports have studied the association of blaCTX-M ESBL with specific
genotypes of E. coli (Branger et al., 2005, Deschamps et al., 2009). Although no conclusive
correlation was observed between the type of blaCTX-M-encoding plasmids with the genotype
of the E. coli host, it was suggested that adaptation between the ESBL gene and the host
genotype resulted in increased fitness of the resistant strains which aided in the dissemination
of the ESBL gene within the host bacterial genotype (Deschamps et al., 2009). This has been
found to be true for blaCTX-M-15 which has been reported to be highly associated with the E.
coli ST131 causing frequent outbreaks around the world (Coque et al., 2008, Mathers et al.,
2015, Peirano and Pitout, 2010). Although the blaKPC carbapenemase was initially discovered
in a K. pneumoniae, it has crossed species boundaries and can be found in various

221
Enterobacteriaceae including E. coli, S. marcescens, E. cloacae, A. baumannii and P.
aeruginosa (Cai et al., 2008, Chen et al., 2012). In K. pneumoniae, this carbapenemase is
predominantly associated with K. pneumoniae ST258 (Chen et al., 2014b, Chen et al., 2012).
However, blaKPC can also be found with sequence type unrelated to ST258 (Giakkoupi et al.,
2011, Lavigne et al., 2013). Comparative genomics of published K. pneumoniae genome
sequence of various sequence types have found high conservation among chromosomal
sequences with differences mostly associated to mobile elements (Chen et al., 2014b). Due to
the differences in the capsule polysaccharide gene clusters K. pneumoniae ST258 is
categorised into two clades (DeLeo et al., 2014). The blaKPC-2 and blaKPC-3 carrying plasmids
are associated with clade 1 and 2, respectively (DeLeo et al., 2014). The authors also
suggested possible association of plasmid incompatibility groups with the clades (DeLeo et al.,
2014). The reason contributing to these associations is unknown. It is possible that factors
encoded in the host and/or the plasmids have resulted in this close host-plasmid relationship.
Antibiotic resistance has frequently been associated with a fitness cost incurred on the
host bacterium (Andersson and Hughes, 2010). One study compared the fitness impact of a
carbapenemase, blaSME-1 and a penicillinase, blaTEM-1 cloned into a pTrc99A- and pUC18-
based plasmids on a E. coli host (Marciano et al., 2007). Compared to the blaTEM-1 carrying E.
coli, the authors found that the E. coli carrying the blaSME-1 gene had a significant slower
growth rate, lower cell viability after 24 hours of culture and were unable to persist in the
absence of antibiotic selection (Marciano et al., 2007). The lower cell viability was also
observed when the blaSME-1 was cloned into the E. coli chromosome. Hence, the authors
concluded that the fitness impact arose from the carriage of the carbapenemase gene
(Marciano et al., 2007). Another study, on blaVIM-2 carbapenemase in S. Typhimurium, also
found that the carbapenemase resulted in colony morphology deformity, slower growth,

222
decreased motility and reduction in invasion of Caco-2 cells (Cordeiro et al., 2014). However,
a blaOXA-66 carbapenemase had no deleterious effects on the growth and morphology in the
same experiment (Cordeiro et al., 2014). Recently, various blaKPC-2 containing plasmids of
different incompatibility groups (IncN, IncL/M and IncFII) were transferred into a common K.
pneumoniae ATCC10031 and the fitness impact of these plasmid carrying hosts were
assessed using the Caenorhabditis elegans infection model (Lavigne et al., 2013). The authors
found that the K. pneumoniae carrying plasmids isolated from clonal group 258 were more
virulent than plasmids from non-ST258 related strains. The K. pneumoniae carrying a blaKPC-2
cloned into a pBK-CMV expression plasmid was found to be unable to kill the C. elegans as
efficiently as the plasmid-free host, suggesting the carbapenemase gene was the source of the
fitness cost (Lavigne et al., 2013). This also suggested that the observed increase in virulence
in the infection model was probably a result of the plasmid backbone.
In this PhD study, the carriage of the pKpQIL-UK or -D2 plasmid showed no
detectable adverse impact on the virulence of the K. pneumoniae ST258 in the Galleria
infection model. This correlated to the other fitness experiments done with the K. pneumoniae
ST258 as both plasmids did not have a significant impact in the generation time, ability to
form biofilm and persistence of the plasmids in this strain. Further supporting these, the total
transcriptome of both K. pneumoniae ST258 carrying pKpQIL-UK and -D2 also showed the
plasmids had minimal impact in the host chromosomal gene expression. The carriage of
blaKPC-2 inactivated pKpQIL-UK and -D2 plasmids in K. pneumoniae Ecl8 also showed no
changes in generation times of the bacterial host strains. This suggested that the
carbapenemase gene does not incur any fitness cost on the growth rate of the host. It was
hypothesised that the pKpQIL-D2 plasmid with the new substituted region has a fitness
advantage over the original pKpQIL-UK plasmid. However, there was no obvious advantage

223
across the panel of fitness experiments used to compare the two plasmids in the various
Enterobacteriaceae. Of note, the pKpQIL-D2 plasmid was only found to confer a fitness
advantage over the pKpQIL-UK plasmid in a pairwise competition experiment in K.
pneumoniae Ecl8, where the variant plasmid carrying bacterial host strain displaced most of
the pKpQIL-UK carrying K. pneumoniae Ecl8 after 20 days (ca. 140 generation). No
correlation was observed between conjugation frequencies of the plasmids from their original
clinical isolates into the various Enterobacteriaceae strains with the persistence of the
plasmids in their new bacterial hosts. Virulence experiment using a representative K.
pneumoniae ST258 isolate and a septicaemia mice model suggested that this sequence type is
avirulent (Tzouvelekis et al., 2013). The strain was also prone to human serum killing and
phagocytosis. Hence, the authors suggested that the K. pneumoniae ST258 generally acts as
an opportunistic pathogen and the associated mortality rate with this epidemic strain is mostly
by overwhelming of the host immune system with high bacterial load (Tzouvelekis et al.,
2013). Antibiotic resistance which leads to therapy failure may also allow the bacteria to
achieve the numbers required for infection to occur (Tzouvelekis et al., 2013).
The spread of carbapenemase producing Enterobacteriaceae has threatened one of the
most efficacious antibiotics available, i.e. carbapenem for treatment of serious bacterial
infections. Correct management of infections should depend on the antibiotic susceptibility of
bacteria from patient specimens and epidemiological data. However, as reported,
carbapenemase producing Enterobacteriaceae can appear susceptible to carbapenem
antibiotics leading to false reports (Nordmann et al., 2012b). Where treatment options is
guided by such information, it may lead to counter-productive outcome among patients with
bacterial infections (Cortés et al., 2010, Kang et al., 2005, Lueangarun and Leelarasamee,
2012, MacGowan, 2008, Zilberberg et al., 2014). The level of carbapenem resistance is

224
dependent on various factors including level of gene expression and number of
carbapenemase genes, up-regulation of efflux pump and down-regulation of porins (Kitchel et
al., 2010). Hence, inappropriate initial antibiotic therapy may select for high level resistant
isolates during the course of treatment leading to serious consequences (Adams-Sapper et al.,
2015).
Carbapenemase producing Enterobacteriaceae often carry other resistance determinant
rendering other antibiotics such as fluoroquinolone and aminoglycosides ineffective (DeLeo
et al., 2014, Ho et al., 2011). Hence, the combination therapy of efflux inhibitor and
antibiotics may present an alternative option for the treatment of multidrug resistant bacteria
(Lomovskaya and Bostian, 2006). The presence of the efflux inhibitor may sensitise the
bacteria to a variety of antibiotics which are substrates to the efflux systems. However, data
from this PhD study suggest that careful design and judicious use of efflux inhibitors are
required to ensure that indirect effects of the inhibitor do not result in reduced susceptibility of
bacteria carrying β-lactamase genes. Where the efflux inhibitor exerts an effect (such as
down-regulation of porins), the inhibitor should only be used in combination with antibiotics
that do not require porins as the main entry route into the bacterial cell.
The recent Review on Antimicrobial Resistance has acknowledged the increasing
concerns of mortality and morbidity associated with antibiotic resistant E. coli and K.
pneumoniae (O'Neill, 2014). The widespread prevalence of blaKPC carrying K. pneumoniae
ST258-related clones poses a serious threat to medical treatment. At present, pKpQIL and its
variant have played a significant role in the dissemination of this carbapenemase across
various sequence type and species (Chen et al., 2014a). Although the reason for the successful
spread and stability of this plasmid within a bacterial population still remains unclear, the
findings of this PhD study has provided more evidence that these factors are found on the

225
plasmid. This work allows us to better understand the interaction of plasmid factor(s) with
bacterial host background in determining the success of the plasmid.

226
REFERENCES
Abraham, E. P. & Chain, E. 1940. An enzyme from bacteria able to destroy penicillin. Nature,
146, 837-837.
Actis, L. A., Tolmasky, M. E. & Crosa, J. H. 1999. Bacterial plasmids: replication of
extrachromosomal genetic elements encoding resistance to antimicrobial compounds.
Frontiers in Bioscience, 4, D43-62.
Adams-Sapper, S., Nolen, S., Donzelli, G. F., Lal, M., Chen, K., Justo Da Silva, L. H.,
Moreira, B. M. & Riley, L. W. 2015. Rapid induction of high-level carbapenem
resistance in heteroresistant KPC-producing Klebsiella pneumoniae. Antimicrobial
Agents and Chemotherapy, 59, 3281-3289.
Adler, M., Anjum, M., Berg, O. G., Andersson, D. I. & Sandegren, L. 2014. High fitness costs
and instability of gene duplications reduce rates of evolution of new genes by
duplication-divergence mechanisms. Molecular Biology and Evolution, 31, 1526-1535.
Albertí, S., Rodríquez-Quiñones, F., Schirmer, T., Rummel, G., Tomás, J. M., Rosenbusch, J.
P. & Benedí, V. J. 1995. A porin from Klebsiella pneumoniae: sequence homology,
three-dimensional model, and complement binding. Infection and Immunity, 63, 903-
10.
Allen, K. P., Randolph, M. M. & Fleckenstein, J. M. 2006. Importance of heat-labile
enterotoxin in colonization of the adult mouse small intestine by human
enterotoxigenic Escherichia coli strains. Infection and Immunity, 74, 869-875.
Alvarez-Martinez, C. E. & Christie, P. J. 2009. Biological diversity of prokaryotic type IV
secretion systems. Microbiology and Molecular Biology Reviews, 73, 775-808.
Ambler, R. P. 1980. The structure of β-lactamases Philosophical Transactions of the Royal
Society of London Series B-Biological Sciences, 289, 321-331.
Anderson, E. S. 1965. Origin of transferable drug-resistance factors in the Enterobacteriaceae.
The British Medical Journal, 2, 1289-1291.
Andersson, D. I. & Hughes, D. 2010. Antibiotic resistance and its cost: Is it possible to
reverse resistance? Nature Reviews Microbiology, 8, 260-271.
Andrews, J. M. 2001. Determination of minimum inhibitory concentrations. Journal of
Antimicrobial Chemotherapy, 48, 5-16.
Anonymous 2008. Recent trends in antimicrobial resistance among Streptococcus
pneumoniae and Staphylococcus aureus isolates: the French experience. Euro

227
surveillance : bulletin européen sur les maladies transmissibles = European
communicable disease bulletin, 13, pii=19035.
Antignac, A., Kriz, P., Tzanakaki, G., Alonso, J. M. & Taha, M. K. 2001. Polymorphism of
Neisseria meningitidis penA gene associated with reduced susceptibility to penicillin.
Journal of Antimicrobial Chemotherapy, 47, 285-296.
Aoki, H., Sakai, H., Kohsaka, M., Konomi, T. & Hosoda, J. 1976. Nocardicin A, a new
monocyclic β-lactam antibiotic. I. Discovery, isolation and characterization. The
Journal of Antibiotics (Tokyo), 29, 492-500.
Arias, C. A. & Murray, B. E. 2009. Antibiotic-resistant bugs in the 21st century — A clinical
super-challenge. New England Journal of Medicine, 360, 439-443.
Arnold, R. S., Thom, K. A., Sharma, S., Phillips, M., Kristie Johnson, J. & Morgan, D. J.
2011. Emergence of Klebsiella pneumoniae carbapenemase-producing bacteria.
Southern Medical Journal, 104, 40-45.
Baba, T., Ara, T., Hasegawa, M., Takai, Y., Okumura, Y., Baba, M., Datsenko, K. A., Tomita,
M., Wanner, B. L. & Mori, H. 2006. Construction of Escherichia coli K-12 in-frame,
single-gene knockout mutants: The Keio collection. Molecular Systems Biology, 2.
Baltrus, D. A. 2013. Exploring the costs of horizontal gene transfer. Trends in Ecology &
Evolution, 28, 489-495.
Baraniak, A., Grabowska, A., Izdebski, R., Fiett, J., Herda, M., Bojarska, K., Żabicka, D.,
Kania-Pudło, M., Młynarczyk, G., Żak-Puławska, Z., Hryniewicz, W., Gniadkowski,
M. & Group, T. K.-P. S. 2011. Molecular characteristics of KPC-producing
Enterobacteriaceae at the early stage of their dissemination in Poland, 2008–2009.
Antimicrobial Agents and Chemotherapy, 55, 5493-5499.
Barbosa, T. M. & Levy, S. B. 2000. Differential expression of over 60 chromosomal genes in
Escherichia coli by constitutive expression of MarA. Journal of Bacteriology, 182,
3467-3474.
Barlow, M. 2009. What antimicrobial resistance has taught us about horizontal gene transfer.
Methods in Molecular Biology, 532, 397-411.
Baroud, M., Dandache, I., Araj, G. F., Wakim, R., Kanj, S., Kanafani, Z., Khairallah, M.,
Sabra, A., Shehab, M., Dbaibo, G. & Matar, G. M. 2013. Underlying mechanisms of
carbapenem resistance in extended-spectrum β-lactamase-producing Klebsiella
pneumoniae and Escherichia coli isolates at a tertiary care centre in Lebanon: Role of

228
OXA-48 and NDM-1 carbapenemases. International Journal of Antimicrobial Agents,
41, 75-79.
Baucheron, S., Tyler, S., Boyd, D., Mulvey, M. R., Chaslus-Dancla, E. & Cloeckaert, A. 2004.
AcrAB-TolC directs efflux-mediated multidrug resistance in Salmonella enterica
serovar typhimurium DT104. Antimicrobial Agents and Chemotherapy, 48, 3729-3735.
Baugh, S., Ekanayaka, A. S., Piddock, L. J. V. & Webber, M. A. 2012. Loss of or inhibition
of all multidrug resistance efflux pumps of Salmonella enterica serovar Typhimurium
results in impaired ability to form a biofilm. Journal of Antimicrobial Chemotherapy,
67, 2409-2417.
Baugh, S., Phillips, C. R., Ekanayaka, A. S., Piddock, L. J. V. & Webber, M. A. 2014.
Inhibition of multidrug efflux as a strategy to prevent biofilm formation. Journal of
Antimicrobial Chemotherapy, 69, 673-681.
Bennett, J. W., Herrera, M. L., Lewis, J. S., Ii, Wickes, B. W. & Jorgensen, J. H. 2009. KPC-
2-producing Enterobacter cloacae and Pseudomonas putida coinfection in a liver
transplant recipient. Antimicrobial Agents and Chemotherapy, 53, 292-294.
Bennett, P. M. 2008. Plasmid encoded antibiotic resistance: acquisition and transfer of
antibiotic resistance genes in bacteria. British Journal of Pharmacology, 153, S347-
S357.
Bernet, M. F., Brassart, D., Neeser, J. R. & Servin, A. L. 1994. Lactobacillus acidophilus LA
1 binds to cultured human intestinal cell lines and inhibits cell attachment and cell
invasion by enterovirulent bacteria. Gut, 35, 483-489.
Bhardwaj, A. K. & Mohanty, P. 2012. Bacterial efflux pumps involved in multidrug
resistance and their inhibitors: Rejuvinating the antimicrobial chemotherapy. Recent
Patents on Anti-Infective Drug Discovery, 7, 73-89.
Binet, R. & Maurelli, A. T. 2005. Fitness cost due to mutations in the 16S rRNA associated
with spectinomycin resistance in Chlamydia psittaci 6BC. Antimicrobial Agents and
Chemotherapy, 49, 4455-4464.
Blahová, J., Králiková, K., Krčméry Sr, V. & Bartoníková, N. 1999. High-frequency
transduction of antibiotic resistance in Pseudomonas aeruginosa by a wild-type
bacteriophage with restricted specificity for recipient strains. European Journal of
Clinical Microbiology & Infectious Diseases, 18, 152-154.

229
Blumberg, P. M. & Strominger, J. L. 1974. Interaction of penicillin with the bacterial cell:
penicillin-binding proteins and penicillin-sensitive enzymes. Bacteriological Reviews,
38, 291-335.
Blumer, J. L. 1997. Meropenem: Evaluation of a new generation carbapenem. International
Journal of Antimicrobial Agents, 8, 73-92.
Bogaerts, P., Bouchahrouf, W., De Castro, R. R., Deplano, A., Berhin, C., Piérard, D., Denis,
O. & Glupczynski, Y. 2011. Emergence of NDM-1-producing Enterobacteriaceae in
Belgium. Antimicrobial Agents and Chemotherapy, 55, 3036-3038.
Bornet, C., Chollet, R., Malléa, M., Chevalier, J., Davin-Regli, A., Pagès, J. M. & Bollet, C.
2003. Imipenem and expression of multidrug efflux pump in Enterobacter aerogenes.
Biochemical and Biophysical Research Communications, 301, 985-990.
Boucher, H. W., Talbot, G. H., Bradley, J. S., Edwards Jr, J. E., Gilbert, D., Rice, L. B.,
Scheld, M., Spellberg, B. & Bartlett, J. 2009. Bad bugs, no drugs: No ESKAPE! An
update from the Infectious Diseases Society of America. Clinical Infectious Diseases,
48, 1-12.
Bouma, J. E. & Lenski, R. E. 1988. Evolution of a bacteria/plasmid association. Nature, 335,
351-352.
Bradford, P. A., Bratu, S., Urban, C., Visalli, M., Mariano, N., Landman, D., Rahal, J. J.,
Brooks, S., Cebular, S. & Quale, J. 2004. Emergence of carbapenem-resistant
Klebsiella species possessing the class A carbapenem-hydrolyzing KPC-2 and
inhibitor-resistant TEM-30 β-lactamases in New York City. Clinical Infectious
Diseases, 39, 55-60.
Branger, C., Zamfir, O., Geoffroy, S., Laurans, G., Arlet, G., Vu Thien, H., Gouriou, S.,
Picard, B. & Denamur, E. 2005. Genetic background of Escherichia coli and
extended-spectrum β-lactamase type. Emerging Infectious Diseases, 11, 54-61.
Bratu, S., Mooty, M., Nichani, S., Landman, D., Gullans, C., Pettinato, B., Karumudi, U.,
Tolaney, P. & Quale, J. 2005. Emergence of KPC-possessing Klebsiella pneumoniae
in Brooklyn, New York: Epidemiology and recommendations for detection.
Antimicrobial Agents and Chemotherapy, 49, 3018-3020.
Brown, A. G., Butterworth, D., Cole, M., Hanscomb, G., Hood, J. D. & Reading, C. 1976.
Naturally-occurring β-lactamase inhibitors with antibacterial activity. Journal of
Antibiotics, 29, 668-669.

230
Brown, M. H., Paulsen, I. T. & Skurray, R. A. 1999. The multidrug efflux protein NorM is a
prototype of a new family of transporters. Molecular Microbiology, 31, 394-395.
Brown, N. F., Coombes, B. K., Bishop, J. L., Wickham, M. E., Lowden, M. J., Gal-Mor, O.,
Goode, D. L., Boyle, E. C., Sanderson, K. L. & Finlay, B. B. 2011. Salmonella phage
ST64B encodes a member of the SseK/NleB effector family. PLoS ONE, 6, e17824.
Brown, S. P., Cornforth, D. M. & Mideo, N. 2012. Evolution of virulence in opportunistic
pathogens: generalism, plasticity, and control. Trends in Microbiology, 20, 336-342.
Bryant, K. A., Van Schooneveld, T. C., Thapa, I., Bastola, D., Williams, L. O., Safranek, T. J.,
Hinrichs, S. H., Rupp, M. E. & Fey, P. D. 2013. KPC-4 is encoded within a truncated
Tn4401 in an IncL/M plasmid, pNE1280, isolated from Enterobacter cloacae and
Serratia marcescens. Antimicrobial Agents and Chemotherapy, 57, 37-41.
Burton, H. S. & Abraham, E. P. 1951. Isolation of antibiotics from a species of
Cephalosporium. Cephalosporins P1, P2, P3, P4 and P5. Biochemical Journal, 50,
168-174.
Bush, K., Courvalin, P., Dantas, G., Davies, J., Eisenstein, B., Huovinen, P., Jacoby, G. A.,
Kishony, R., Kreiswirth, B. N., Kutter, E., Lerner, S. A., Levy, S., Lewis, K.,
Lomovskaya, O., Miller, J. H., Mobashery, S., Piddock, L. J. V., Projan, S., Thomas,
C. M., Tomasz, A., Tulkens, P. M., Walsh, T. R., Watson, J. D., Witkowski, J., Witte,
W., Wright, G., Yeh, P. & Zgurskaya, H. I. 2011. Tackling antibiotic resistance.
Nature Reviews Microbiology, 9, 894-896.
Bush, K., Jacoby, G. A. & Medeiros, A. A. 1995. A functional classification scheme for β-
lactamases and its correlation with molecular structure. Antimicrobial Agents and
Chemotherapy, 39, 1211-1233.
Cabeen, M. T. & Jacobs-Wagner, C. 2005. Bacterial cell shape. Nature Reviews Microbiology,
3, 601-610.
Cai, J. C., Zhou, H. W., Zhang, R. & Chen, G. X. 2008. Emergence of Serratia marcescens,
Klebsiella pneumoniae, and Escherichia coli isolates possessing the plasmid-mediated
carbapenem-hydrolyzing β-lactamase KPC-2 in intensive care units of a Chinese
hospital. Antimicrobial Agents and Chemotherapy, 52, 2014-2018.
Cai, S. J. & Inouye, M. 2002. EnvZ-OmpR interaction and osmoregulation in Escherichia coli.
Journal of Biological Chemistry, 277, 24155-24161.

231
Cascales, E., Bernadac, A., Gavioli, M., Lazzaroni, J. C. & Lloubes, R. 2002. Pal lipoprotein
of Escherichia coli plays a major role in outer membrane integrity. Journal of
Bacteriology, 184, 754-759.
CDC 2001. Outbreaks of multidrug-resistant Salmonella Typhimurium associated with
veterinary facilities--Idaho, Minnesota, and Washington, 1999. MMWR. Morbidity
and mortality weekly report, 50, 701-4.
CDC 2010. Detection of Enterobacteriaceae isolates carrying metallo-β-lactamase - United
States, 2010. MMWR. Morbidity and mortality weekly report, 59, 750.
Chamier, B., Lorenz, M. G. & Wackernagel, W. 1993. Natural transformation of
Acinetobacter calcoaceticus by plasmid DNA adsorbed on sand and groundwater
aquifer material. Applied and Environmental Microbiology, 59, 1662-1667.
Chantot, J. F., Klich, M., Teutsch, G., Bryskier, A., Collette, P., Markus, A. & Seibert, G.
1992. Antibacterial activity of RU44790, a new N-tetrazolyl monocyclic β-lactam.
Antimicrobial Agents and Chemotherapy, 36, 1756-1763.
Chen, L., Chavda, K. D., Melano, R. G., Jacobs, M. R., Koll, B., Hong, T., Rojtman, A. D.,
Levi, M. H., Bonomo, R. A. & Kreiswirtha, B. N. 2014a. Comparative genomic
analysis of KPC-encoding pKpQIL-like plasmids and their distribution in New Jersey
and New York hospitals. Antimicrobial Agents and Chemotherapy, 58, 2871-2877.
Chen, L., Chavda, K. D., Melano, R. G., Jacobs, M. R., Levi, M. H., Bonomo, R. A. &
Kreiswirth, B. N. 2013. Complete sequence of a blaKPC-2-harboring IncFIIK1 plasmid
from a Klebsiella pneumoniae sequence type 258 strain. Antimicrobial Agents and
Chemotherapy, 57, 1542-1545.
Chen, L., Mathema, B., Chavda, K. D., Deleo, F. R., Bonomo, R. A. & Kreiswirth, B. N.
2014b. Carbapenemase-producing Klebsiella pneumoniae: molecular and genetic
decoding. Trends in Microbiology, 22, 686-696.
Chen, L. F., Anderson, D. J. & Paterson, D. L. 2012. Overview of the epidemiology and the
threat of Klebsiella pneumoniae carbapenemases (KPC) resistance. Infection and Drug
Resistance, 5, 133-141.
Chen, S., Cui, S., Mcdermott, P. F., Zhao, S., White, D. G., Paulsen, I. & Meng, J. 2007.
Contribution of target gene mutations and efflux to decreased susceptibility of
Salmonella enterica serovar typhimurium to fluoroquinolones and other antimicrobials.
Antimicrobial Agents and Chemotherapy, 51, 535-542.

232
Chen, Y., Zhou, Z., Jiang, Y. & Yu, Y. 2011. Emergence of NDM-1-producing Acinetobacter
baumannii in China. Journal of Antimicrobial Chemotherapy, 66, 1255-1259.
Chuanchuen, R., Beinlich, K., Hoang, T. T., Becher, A., Karkhoff-Schweizer, R. R. &
Schweizer, H. P. 2001. Cross-resistance between triclosan and antibiotics in
Pseudomonas aeruginosa is mediated by multidrug efflux pumps: Exposure of a
susceptible mutant strain to triclosan selects nfxB mutants overexpressing MexCD-
OprJ. Antimicrobial Agents and Chemotherapy, 45, 428-432.
Chuang, Y. C., Chen, Y. C., Chang, S. C., Sun, C. C., Chang, Y. Y., Chen, M. L., Hsu, L. Y.
& Wang, J. T. 2010. Secular trends of healthcare-associated infections at a teaching
hospital in Taiwan, 1981–2007. Journal of Hospital Infection, 76, 143-149.
Clancy, C. J., Chen, L., Hong, J. H., Cheng, S., Hao, B., Shields, R. K., Farrell, A. N., Doi, Y.,
Zhao, Y., Perlin, D. S., Kreiswirth, B. N. & Nguyen, M. H. 2013a. Mutations of the
ompK36 porin gene and promoter impact responses of sequence Type 258, KPC-2-
producing Klebsiella pneumoniae strains to doripenem and doripenem-colistin.
Antimicrobial Agents and Chemotherapy, 57, 5258-5265.
Clancy, C. J., Chen, L., Shields, R. K., Zhao, Y., Cheng, S., Chavda, K. D., Hao, B., Hong, J.
H., Doi, Y., Kwak, E. J., Silveira, F. P., Abdel-Massih, R., Bogdanovich, T., Humar,
A., Perlin, D. S., Kreiswirth, B. N. & Hong Nguyen, M. 2013b. Epidemiology and
molecular characterization of bacteremia due to carbapenem-resistant Klebsiella
pneumoniae in transplant recipients. American Journal of Transplantation, 13, 2619-
2633.
Clewell, D. B., Flannagan, S. E. & Jaworski, D. D. 1995. Unconstrained bacterial promiscuity:
the Tn916–Tn1545 family of conjugative transposons. Trends in Microbiology, 3,
229-236.
Colardyn, F. 2005. Appropriate and timely empirical antimicrobial treatment of ICU
infections - A role for carbapenems. Acta Clinica Belgica, 60, 51-62.
Collu, F., Vargiu, A. V., Dreier, J., Cascella, M. & Ruggerone, P. 2012. Recognition of
imipenem and meropenem by the RND-transporter MexB studied by computer
simulations. Journal of the American Chemical Society, 134, 19146-19158.
Colomer-Lluch, M., Jofre, J. & Muniesa, M. 2011. Antibiotic resistance genes in the
bacteriophage DNA fraction of environmental samples. PLoS ONE, 6, e17549.
Coque, T. M., Novais, Â., Carattoli, A., Poirel, L., Pitout, J., Peixe, L., Baquero, F., Cantón, R.
& Nordmann, P. 2008. Dissemination of clonally related Escherichia coli strains
233
expressing extended-spectrum β-lactamase CTX-M-15. Emerging Infectious Diseases,
14, 195-200.
Cordeiro, N. F., Chabalgoity, J. A., Yim, L. & Vignoli, R. 2014. Synthesis of metallo-β-
Lactamase VIM-2 is associated with a fitness reduction in Salmonella enterica serovar
Typhimurium. Antimicrobial Agents and Chemotherapy, 58, 6528-6535.
Cortés, J. A., Garzón, D. C., Navarrete, J. A. & Contreras, K. M. 2010. Impact of
inappropriate antimicrobial therapy on patients with bacteremia in intensive care units
and resistance patterns in Latin America. Revista Argentina de Microbiologia, 42,
230-234.
Costerton, J. W., Stewart, P. S. & Greenberg, E. P. 1999. Bacterial biofilms: A common cause
of persistent infections. Science, 284, 1318-1322.
Cottell, J. L., Saw, H. T. H., Webber, M. A. & Piddock, L. J. V. 2014. Functional genomics to
identify the factors contributing to successful persistence and global spread of an
antibiotic resistance plasmid. BMC Microbiology, 14, 168.
Cottell, J. L., Webber, M. A., Coldham, N. G., Taylor, D. L., Cerdeño-Tárraga, A. M., Hauser,
H., Thomson, N. R., Woodward, M. J. & Piddock, L. J. V. 2011. Complete sequence
and molecular epidemiology of IncK epidemic plasmid encoding blaCTX-M-14.
Emerging Infectious Diseases, 17, 645-652.
Cottell, J. L., Webber, M. A. & Piddock, L. J. V. 2012. Persistence of transferable extended-
spectrum-β-lactamase resistance in the absence of antibiotic pressure. Antimicrobial
Agents and Chemotherapy, 56, 4703-4706.
Cozens, R. M., Markiewicz, Z. & Tuomanen, E. 1989. Role of autolysins in the activities of
imipenem and CGP 31608, a novel penem, against slowly growing bacteria.
Antimicrobial Agents and Chemotherapy, 33, 1819-1821.
D'costa, V. M., King, C. E., Kalan, L., Morar, M., Sung, W. W., Schwarz, C., Froese, D.,
Zazula, G., Calmels, F., Debruyne, R., Golding, G. B., Poinar, H. N. & Wright, G. D.
2011. Antibiotic resistance is ancient. Nature, 477, 457-61.
Dahlberg, C. & Chao, L. 2003. Amelioration of the cost of conjugative plasmid carriage in
Eschericha coli K12. Genetics, 165, 1641-1649.
Datsenko, K. A. & Wanner, B. L. 2000. One-step inactivation of chromosomal genes in
Escherichia coli K-12 using PCR products. Proceedings of the National Academy of
Sciences of the United States of America, 97, 6640-6645.

234
Datta, N. & Hughes, V. M. 1983. Plasmids of the same Inc groups in Enterobacteria before
and after the medical use of antibiotics. Nature, 306, 616-7.
Davison, J. 1999. Genetic exchange between bacteria in the environment. Plasmid, 42, 73-91.
De Cristóbal, R. E., Vincent, P. A. & Salomón, R. A. 2006. Multidrug resistance pump
AcrAB-TolC is required for high-level, Tet(A)-mediated tetracycline resistance in
Escherichia coli. Journal of Antimicrobial Chemotherapy, 58, 31-36.
De Kraker, M. E. A., Davey, P. G., Grundmann, H. & On Behalf of The, B. S. G. 2011.
Mortality and hospital stay associated with resistant Staphylococcus aureus and
Escherichia coli bacteremia: Estimating the burden of antibiotic resistance in Europe.
PLoS Medicine, 8, e1001104.
De La Cruz, M. A. & Calva, E. 2010. The complexities of porin genetic regulation. Journal of
Molecular Microbiology and Biotechnology, 18, 24-36.
De Majumdar, S., Veleba, M., Finn, S., Fanning, S. & Schneiders, T. 2013. Elucidating the
regulon of multidrug resistance regulator rarA in Klebsiella pneumoniae.
Antimicrobial Agents and Chemotherapy, 57, 1603-1609.
Deleo, F. R., Chen, L., Porcella, S. F., Martens, C. A., Kobayashi, S. D., Porter, A. R.,
Chavda, K. D., Jacobs, M. R., Mathema, B., Olsen, R. J., Bonomo, R. A., Musser, J.
M. & Kreiswirth, B. N. 2014. Molecular dissection of the evolution of carbapenem-
resistant multilocus sequence type 258 Klebsiella pneumoniae. Proceedings of the
National Academy of Sciences of the United States of America, 111, 4988-4993.
Demain, A. L. & Elander, R. P. 1999. The β-lactam antibiotics: past, present, and future.
Antonie van Leeuwenhoek, 75, 5-19.
Denap, J. C. B., Thomas, J. R., Musk, D. J. & Hergenrother, P. J. 2004. Combating drug-
resistant bacteria: Small molecule mimics of plasmid incompatibility as antiplasmid
compounds. Journal of the American Chemical Society, 126, 15402-15404.
Deschamps, C., Clermont, O., Hipeaux, M. C., Arlet, G., Denamur, E. & Branger, C. 2009.
Multiple acquisitions of CTX-M plasmids in the rare D2 genotype of Escherichia coli
provide evidence for convergent evolution. Microbiology, 155, 1656-1668.
Dhamdhere, G. & Zgurskaya, H. I. 2010. Metabolic shutdown in Escherichia coli cells
lacking the outer membrane channel TolC. Molecular Microbiology, 77, 743-754.
Dhanji, H., Khan, P., Cottell, J. L., Piddock, L. J., Zhang, J., Livermore, D. M. & Woodford,
N. 2012. Dissemination of pCT-like IncK plasmids harboring CTX-M-14 extended-
235
spectrum β-lactamase among clinical Escherichia coli isolates in the United Kingdom.
Antimicrobial Agents and Chemotherapy, 56, 3376-7.
Diago-Navarro, E., Chen, L., Passet, V., Burack, S., Ulacia-Hernando, A., Kodiyanplakkal, R.
P., Levi, M. H., Brisse, S., Kreiswirth, B. N. & Fries, B. C. 2014. Carbapenem-
resistant Klebsiella pneumoniae exhibit variability in capsular polysaccharide and
capsule associated virulence traits. Journal of Infectious Diseases, 210, 803-813.
Doern, C. D., Michael Dunne Jr, W. & Burnham, C. a. D. 2011. Detection of Klebsiella
pneumoniae Carbapenemase (KPC) production in non-Klebsiella pneumoniae
Enterobacteriaceae isolates by use of the Phoenix, Vitek 2, and disk diffusion
methods. Journal of Clinical Microbiology, 49, 1143-1147.
Domenech-Sanchez, A., Martinez-Martinez, L., Hernandez-Alles, S., Canejo, M. D., Pascual,
A., Tomas, J. M., Alberti, S. & Benedi, V. J. 2003. Role of Klebsiella pneumoniae
OmpK35 porin in antimicrobial resistance. Antimicrobial Agents and Chemotherapy,
47, 3332-3335.
Donetz, A. P., Harvey, R. A. & Greco, R. S. 1984. Stability of antibiotics bound to
polytetrafluoroethylene with cationic surfactants. Journal of Clinical Microbiology, 19,
1-3.
Doumith, M., Ellington, M. J., Livermore, D. M. & Woodford, N. 2009. Molecular
mechanisms disrupting porin expression in ertapenem-resistant Klebsiella and
Enterobacter spp. clinical isolates from the UK. Journal of Antimicrobial
Chemotherapy, 63, 659-667.
Drancourt, M., Bollet, C., Carta, A. & Rousselier, P. 2001. Phylogenetic analyses of
Klebsiella species delineate Klebsiella and Raoultella gen. nov., with description of
Raoultella ornithinolytica comb. nov., Raoultella terrigena comb. nov. and Raoultella
planticola comb. nov. International Journal of Systematic and Evolutionary
Microbiology, 51, 925-932.
Drusano, G. 1997. Meropenem: laboratory and clinical data. Clinical Microbiology and
Infection, 3, Supplement 4, 4S51-4S59.
Durfee, T., Nelson, R., Baldwin, S., Plunkett Iii, G., Burland, V., Mau, B., Petrosino, J. F.,
Qin, X., Muzny, D. M., Ayele, M., Gibbs, R. A., Csörgo, B., Pósfai, G., Weinstock, G.
M. & Blattner, F. R. 2008. The complete genome sequence of Escherichia coli DH10B:
Insights into the biology of a laboratory workhorse. Journal of Bacteriology, 190,
2597-2606.

236
ECDC. 2013a. Annual Epidemiological Report 2013 [Online]. Stockholm. Available:
http://ecdc.europa.eu/en/publications/Publications/annual-epidemiological-report-
2013.pdf [Accessed 14th June 2015].
ECDC. 2013b. Point prevalence survey of healthcare-associated infections and antimicrobial
use in European acute care hospitals 2011-2012 [Online]. Stockholm. Available:
http://ecdc.europa.eu/en/publications/Publications/healthcare-associated-infections-
antimicrobial-use-PPS.pdf [Accessed 14th June 2015].
ECDC. 2015. Surveillance of seven priority food- and waterborne diseases in the EU/EEA
[Online]. Stockholm. Available:
http://ecdc.europa.eu/en/publications/Publications/food-and-waterborne-diseases-
surveillance-report-2015.pdf [Accessed 14th June 2015].
ECDC & EMEA. 2009. Technical Report: The bacterial challenge - time to react [Online].
Stockholm: European Centre for Disease Prevention and Control. Available:
http://ecdc.europa.eu/en/publications/Publications/0909_TER_The_Bacterial_Challen
ge_Time_to_React.pdf [Accessed 14th June 2015].
Eicher, T., Cha, H. J., Seeger, M. A., Brandstätter, L., El-Delik, J., Bohnert, J. A., Kern, W.
V., Verrey, F., Grütter, M. G., Diederichs, K. & Pos, K. M. 2012. Transport of drugs
by the multidrug transporter AcrB involves an access and a deep binding pocket that
are separated by a switch-loop. Proceedings of the National Academy of Sciences of
the United States of America, 109, 5687-5692.
El Amin, N., Giske, C. G., Jalal, S., Keijser, B., Kronvall, G. & Wretlind, B. 2005.
Carbapenem resistance mechanisms in Pseudomonas aeruginosa: alterations of porin
OprD and efflux proteins do not fully explain resistance patterns observed in clinical
isolates. APMIS : Acta Pathologica, Microbiologica, et Immunologica Scandinavica,
113, 187-196.
Eng, R. H. K., Padberg, F. T., Smith, S. M., Tan, E. N. & Cherubin, C. E. 1991. Bactericidal
effects of antibiotics on slowly growing and nongrowing bacteria. Antimicrobial
Agents and Chemotherapy, 35, 1824-1828.
Engelberg-Kulka, H. & Glaser, G. 1999. Addiction modules and programmed cell death and
antideath in bacterial cultures. Annual Review of Microbiology, 53, 43-70.
Erdei, J., Forsgren, A. & Naidu, A. S. 1994. Lactoferrin binds to porins OmpF and OmpC in
Escherichia coli. Infection and Immunity, 62, 1236-1240.

237
Esterly, J. S., Wagner, J., Mclaughlin, M. M., Postelnick, M. J., Qi, C. & Scheetz, M. H. 2012.
Evaluation of clinical outcomes in patients with bloodstream infections due to Gram-
negative bacteria according to carbapenem MIC stratification. Antimicrobial Agents
and Chemotherapy, 56, 4885-4890.
Fàbrega, A. & Vila, J. 2013. Salmonella enterica serovar Typhimurium skills to succeed in
the host: Virulence and regulation. Clinical Microbiology Reviews, 26, 308-341.
Falagas, M. E., Tansarli, G. S., Karageorgopoulos, D. E. & Vardakas, K. Z. 2014. Deaths
attributable to carbapenem-resistant Enterobacteriaceae infections. Emerging
Infectious Diseases, 20, 1170-1175.
Fernebro, J. 2011. Fighting bacterial infections - Future treatment options. Drug Resistance
Updates, 14, 125-139.
Fey, P. D., Safranek, T. J., Rupp, M. E., Dunne, E. F., Ribot, E., Iwen, P. C., Bradford, P. A.,
Angulo, F. J. & Hinrichs, S. H. 2000. Ceftriaxone-resistant salmonella infection
acquired by a child from cattle. New England Journal of Medicine, 342, 1242-1249.
Fisher, J. F., Meroueh, S. O. & Mobashery, S. 2005. Bacterial resistance to β-lactam
antibiotics: Compelling opportunism, compelling opportunity. Chemical Reviews, 105,
395-424.
Fleming, A. 1929. On the antibacterial action of cultures of a Penicillium, with special
reference to their use in the isolation of B. influenzae. British Journal of Experimental
Pathology, 10, 226-236.
Fong, J. J., Rosé, L. & Radigan, E. A. 2012. Clinical outcomes with ertapenem as a first-line
treatment option of infections caused by extended-spectrum β-lactamase producing
Gram-negative bacteria. Annals of Pharmacotherapy, 46, 347-352.
Foster, T. J. 1983. Plasmid-determined resistance to antimicrobial drugs and toxic metal ions
in bacteria. Microbiological Reviews, 47, 361-409.
Franceschini, N., Segatore, B., Perilli, M., Vessillier, S., Franchino, L. & Amicosante, G.
2002. Meropenem stability to β-lactamase hydrolysis and comparative in vitro activity
against several β-lactamase-producing Gram-negative strains. Journal of
Antimicrobial Chemotherapy, 49, 395-398.
Frost, L. S. & Koraimann, G. 2010. Regulation of bacterial conjugation: balancing
opportunity with adversity. Future Microbiology, 5, 1057-1071.
Gagliotti, C., Balode, A., Baquero, F., Degener, J., Grundmann, H., Gur, D., Jarlier, V.,
Kahlmeter, G., Monen, J., Monnet, D. L., Rossolini, G. M., Suetens, C., Weist, K. &

238
Heuer, O. 2011. Escherichia coli and Staphylococcus aureus: bad news and good
news from the European Antimicrobial Resistance Surveillance Network (EARS-Net,
formerly EARSS), 2002 to 2009. Euro surveillance, 16.
Garai, P., Gnanadhas, D. P. & Chakravortty, D. 2012. Salmonella enterica serovars
Typhimurium and Typhi as model organisms: Revealing paradigm of host-pathogen
interactions. Virulence, 3, 377-388.
García-Fernández, A., Villa, L., Carta, C., Venditti, C., Giordano, A., Venditti, M., Mancini,
C. & Carattoli, A. 2012. Klebsiella pneumoniae ST258 producing KPC-3 identified in
Italy carries novel plasmids and OmpK36/OmpK35 porin variants. Antimicrobial
Agents and Chemotherapy, 56, 2143-2145.
García, B., Latasa, C., Solano, C., García-Del Portillo, F., Gamazo, C. & Lasa, I. 2004. Role
of the GGDEF protein family in Salmonella cellulose biosynthesis and biofilm
formation. Molecular Microbiology, 54, 264-277.
Garzon, A., Cano, D. A. & Casadesus, J. 1995. Role of Erf recombinase in P22-mediated
plasmid transduction. Genetics, 140, 427-434.
Gaynes, R., Edwards, J. R. & Natl Nosocomial, I. 2005. Overview of nosocomial infections
caused by Gram-negative bacilli. Clinical Infectious Diseases, 41, 848-854.
Georgopapadakou, N. H. 1993. Penicillin-binding proteins and bacterial resistance to β-
lactams. Antimicrobial Agents and Chemotherapy, 37, 2045-2053.
Ghigo, J. M. 2001. Natural conjugative plasmids induce bacterial biofilm development.
Nature, 412, 442-445.
Ghosh, S. K., Hajra, S., Paek, A. & Jayaram, M. 2006. Mechanisms for chromosome and
plasmid segregation. Annual Review of Biochemistry, 75, 211-241.
Ghuysen, J. M. 1997. Penicillin-binding proteins. Wall peptidoglycan assembly and resistance
to penicillin: Facts, doubts and hopes. International Journal of Antimicrobial Agents,
8, 45-60.
Giakkoupi, P., Papagiannitsis, C. C., Miriagou, V., Pappa, O., Polemis, M., Tryfinopoulou, K.,
Tzouvelekis, L. S. & Vatopoulos, A. C. 2011. An update of the evolving epidemic of
blaKPC-2-carrying Klebsiella pneumoniae in Greece (2009-10). Journal of
Antimicrobial Chemotherapy, 66, 1510-1513.
Giannoukos, G., Ciulla, D. M., Huang, K., Haas, B. J., Izard, J., Levin, J. Z., Livny, J., Earl, A.
M., Gevers, D., Ward, D. V., Nusbaum, C., Birren, B. W. & Gnirke, A. 2012.

239
Efficient and robust RNA-seq process for cultured bacteria and complex community
transcriptomes. Genome Biology, 13, R23.
Gilbert, P., Collier, P. J. & Brown, M. R. W. 1990. Influence of growth rate on susceptibility
to antimicrobial agents: Biofilms, cell cycle, dormancy, and strigent response.
Antimicrobial Agents and Chemotherapy, 34, 1865-1868.
Gillis, R. J., White, K. G., Choi, K. H., Wagner, V. E., Schweizer, H. P. & Iglewski, B. H.
2005. Molecular basis of azithromycin-resistant Pseudomonas aeruginosa biofilms.
Antimicrobial Agents and Chemotherapy, 49, 3858-3867.
Giraud, E., Cloeckaert, A., Kerboeuf, D. & Chaslus-Dancla, E. 2000. Evidence for active
efflux as the primary mechanism of resistance to ciproffoxacin in Salmonella enterica
serovar typhimurium. Antimicrobial Agents and Chemotherapy, 44, 1223-1228.
Goffin, C., Fraipont, C., Ayala, J., Terrak, M., Nguyendisteche, M. & Ghuysen, J. M. 1996.
The non-penicillin-binding module of the tripartite penicillin-binding protein 3 of
Escherichia coli is required for folding and/or stability of the penicillin-binding
module and the membrane-anchoring module confers cell septation activity on the
folded structure. Journal of Bacteriology, 178, 5402-5409.
Gootz, T. D., Lescoe, M. K., Dib-Hajj, F., Dougherty, B. A., He, W., Della-Latta, P. & Huard,
R. C. 2009. Genetic organization of transposase regions surrounding blaKPC
carbapenemase genes on plasmids from Klebsiella strains isolated in a New York city
hospital. Antimicrobial Agents and Chemotherapy, 53, 1998-2004.
Gordon, J. I., Hooper, L. V., Mcnevin, M. S., Wong, M. & Bry, L. 1997. Epithelial cell
growth and differentiation. III. Promoting diversity in the intestine: conversations
between the microflora, epithelium, and diffuse GALT. American Journal of
Physiology - Gastrointestinal and Liver Physiology, 273, G565-G570.
Gould, I. M. 2008. The epidemiology of antibiotic resistance. International Journal of
Antimicrobial Agents, 32, S2-S9.
Graham, J. P., Boland, J. J. & Silbergeld, E. 2007. Growth promoting antibiotics in food
animal production: An economic analysis. Public Health Reports, 122, 79-87.
Greenfield, T. J., Ehli, E., Kirshenmann, T., Franch, T., Gerdes, K. & Weaver, K. E. 2000.
The antisense RNA of the par locus of pAD1 regulates the expression of a 33-amino-
acid toxic peptide by an unusual mechanism. Molecular Microbiology, 37, 652-660.

240
Gupta, N., Limbago, B. M., Patel, J. B. & Kallen, A. J. 2011. Carbapenem-resistant
Enterobacteriaceae: Epidemiology and prevention. Clinical Infectious Diseases, 53,
60-67.
Hall, M. A., Cole, C. B., Smith, S. L., Fuller, R. & Rolles, C. J. 1990. Factors influencing the
presence of fecal lactobacilli in early infancy. Archives of Disease in Childhood, 65,
185-188.
Hamad, B. 2010. The antibiotics market. Nature Reviews Drug Discovery, 9, 675-675.
Hammond, M. L. 2004. Ertapenem: A group 1 carbapenem with distinct antibacterial and
pharmacological properties. Journal of Antimicrobial Chemotherapy, 53, ii7-ii9.
Hanahan, D. 1983. Studies on transformation of Escherichia coli with plasmids. Journal of
Molecular Biology, 166, 557-580.
Harris, P., Paterson, D. & Rogers, B. 2015. Facing the challenge of multidrug-resistant Gram-
negative bacilli in Australia. Medical Journal of Australia, 202, 243-246.
Hawkey, P. M. 2015. Multidrug-resistant Gram-negative bacteria: A product of globalization.
Journal of Hospital Infection, 89, 241-247.
Hawkey, P. M. & Livermore, D. M. 2012. Carbapenem antibiotics for serious infections. BMJ
(Clinical research ed.), 344, e3236.
He, S., Wurtzel, O., Singh, K., Froula, J. L., Yilmaz, S., Tringe, S. G., Wang, Z., Chen, F.,
Lindquist, E. A., Sorek, R. & Hugenholtz, P. 2010. Validation of two ribosomal RNA
removal methods for microbial metatranscriptomics. Nature Methods, 7, 807-812.
Hedegaard, J., De a Steffensen, S. A., Nørskov-Lauritsen, N., Mortensen, K. K. & Sperling-
Petersen, H. U. 1999. Identification of Enterobacteriaceae by partial sequencing of the
gene encoding translation initiation factor 2. International Journal of Systematic
Bacteriology, 49, 1531-1538.
Helling, R. B., Kinney, T. & Adams, J. 1981. The maintenance of plasmid-containing
organisms in populations of Escherichia coli. Journal of General Microbiology, 123,
129-141.
Hernandez-Alles, S., Alberti, S., Alvarez, D., Domenech-Sanchez, A., Martinez-Martinez, L.,
Gil, J., Tomas, J. M. & Benedi, V. J. 1999. Porin expression in clinical isolates of
Klebsiella pneumoniae. Microbiology, 145, 673-679.
Hernandez-Alles, S., Alberti, S., Rubires, X., Merino, S., Tomas, J. M. & Benedi, V. J. 1995.
Isolation of FC3–11, a bacteriophage-specific for the Klebsiella pneumoniae porin

241
OmpK36, and its use for the isolation of porin-deficient mutants. Canadian Journal of
Microbiology, 41, 399-406.
Hidron, Alicia i., Edwards, Jonathan r., Patel, J., Horan, Teresa c., Sievert, Dawn m., Pollock,
Daniel a. & Fridkin, Scott k. 2008. NHSN annual update: Antimicrobial-resistant
pathogens associated with healthcare-associated infections: Annual summary of data
reported to the National Healthcare Safety Network at the Centers for Disease Control
and Prevention, 2006–2007. Infection Control and Hospital Epidemiology, 29, 996-
1011.
Hilas, O., Ezzo, D. C. & Jodlowski, T. Z. 2008. Doripenem (doribax), a new carbapenem
antibacterial agent. P & T, 33, 134-80.
Hill, M. J. 1997. Intestinal flora and endogenous vitamin synthesis. European Journal of
Cancer Prevention, 6, S43-S45.
Ho, P. L., Lo, W. U., Yeung, M. K., Lin, C. H., Chow, K. H., Ang, I., Tong, A. H. Y.,
Baojessie, J. Y. J., Lok, S. & Lo, J. Y. C. 2011. Complete sequencing of pNDM-HK
encoding NDM-1 carbapenemase from a multidrug-resistant Escherichia coli strain
isolated in Hong Kong. PLoS ONE, 6, e17989.
Holden, C. 2002. Cell biology: Alliance launched to model E. coli. Science, 297, 1459-1460.
Holtje, J. V. 1998. Growth of the stress-bearing and shape-maintaining murein sacculus of
Escherichia coli. Microbiology and Molecular Biology Reviews, 62, 181-203.
Hooper, L. V., Midtvedt, T. & Gordon, J. I. 2002. How host-microbial interactions shape the
nutrient environment of the mammalian intestine. Annual Review of Nutrition, 22,
283-307.
Hopwood, D., Levy, S., Wenzel, R. P., Georgo-Papadakou, N., Baltz, R. H., Bhavnani, S. &
Cox, E. 2007. News Feature: A call to arms. Nature Reviews Drug Discovery, 6, 8-12.
Hornish, R. E. & Kotarski, S. F. 2002. Cephalosporins in veterinary medicine - ceftiofur use
in food animals. Current Topics in Medicinal Chemistry, 2, 717-31.
HPA 2011. Health Protection Report - Carbapenemase-producing Enterobacteriaceae in the
UK, 2003-2007.
Hrabák, J., Papagiannitsis, C. C., Študentová, V., Jakubu, V., Fridrichová, M., Zemlickova, H.,
Adamkova, V., Bartonikova, N., Bartova, M., Bendova, E., Bergerova, T., Bohunova,
Z., Capova, E., Chmelarova, E., Dovalova, M., Glasnak, M., Hanslianova, M.,
Haskova, V., Heinigeova, B., Hornikova, M., Horova, B., Janeckova, J., Jezek, P.,
Jindrak, V., Kolar, M., Kolarova, L., Kůrková, V., Linhart, P., Nedvedova, H.,

242
Niemczykova, J., Nyc, O., Petkov, V., Pokorna, Z., Pomykal, J., Puchalkova, B.,
Rumlerova, M., Ryskova, L., Scharfen, J., Sekacova, A., Skacaniova, H., Simeckova,
E., Sosikova, M., Stastna, E., Steinerova, A., Stolbova, M., Tejkalova, R., Trojan, L.,
Typovska, H., Uhlirova, E., Vesela, E., Zalabska, E., Zamazalova, D. & Zaruba, R.
2013. Carbapenemase-producing Klebsiella pneumoniae in the Czech Republic in
2011. Eurosurveillance, 18.
Hughes, V. M. & Datta, N. 1983. Conjugative plasmids in bacteria of the 'pre-antibiotic' era.
Nature, 302, 725-726.
Hurrell, E., Kucerova, E., Loughlin, M., Caubilla-Barron, J., Hilton, A., Armstrong, R., Smith,
C., Grant, J., Shoo, S. & Forsythe, S. 2009. Neonatal enteral feeding tubes as loci for
colonisation by members of the Enterobacteriaceae. BMC Infectious Diseases, 9, 146.
Iaconis, J. P., Pitkin, D. H., Sheikh, W. & Nadler, H. L. 1997. Comparison of antibacterial
activities of meropenem and six other antimicrobials against Pseudomonas aeruginosa
isolates from North American studies and clinical trials. Clinical Infectious Diseases,
24, S191-S196.
IDSA 2011. Combating antimicrobial resistance: Policy recommendations to save lives.
Clinical Infectious Diseases, 52, S397-S428.
Insua, J. L., Llobet, E., Moranta, D., Pérez-Gutiérrez, C., Tomás, E., Garmendia, E. &
Bengoechea, J. A. 2013. Modeling Klebsiella pneumoniae pathogenesis by infection
of the wax moth Galleria mellonella. Infection and Immunity, 81, 3552-3565.
Ishino, F., Mitsui, K., Tamaki, S. & Matsuhashi, M. 1980. Dual enzyme-activities of cell wall
peptidoglycan synthesis, peptidoglycan transglycosylase and penicillin-sensitive
transpeptidase, in purified preparations of Escherichia coli penicillin-binding protein-
1a. Biochemical and Biophysical Research Communications, 97, 287-293.
Jacoby, G. A., Mills, D. M. & Chow, N. 2004. Role of β-lactamases and porins in resistance
to ertapenem and other β-lactams in Klebsiella pneumoniae. Antimicrobial Agents and
Chemotherapy, 48, 3203-3206.
Jain, A., Hopkins, K. L., Turton, J., Doumith, M., Hill, R., Loy, R., Meunier, D., Pike, R.,
Livermore, D. M. & Woodford, N. 2014. NDM carbapenemases in the United
Kingdom: An analysis of the first 250 cases. Journal of Antimicrobial Chemotherapy,
69, 1777-1784.

243
Jain, S. & Chen, J. 2007. Attachment and biofilm formation by various serotypes of
Salmonella as influenced by cellulose production and thin aggregative fimbriae
biosynthesis. Journal of Food Protection, 70, 2473-2479.
Jakobsen, Ø. M., Benichou, A., Flickinger, M. C., Valla, S., Ellingsen, T. E. & Brautaset, T.
2006. Upregulated transcription of plasmid and chromosomal ribulose monophosphate
pathway genes is critical for methanol assimilation rate and methanol tolerance in the
methylotrophic bacterium Bacillus methanolicus. Journal of Bacteriology, 188, 3063-
3072.
Jean, S. S., Lee, W. S., Lam, C., Hsu, C. W., Chen, R. J. & Hsueh, P. R. 2015.
Carbapenemase-producing Gram-negative bacteria: Current epidemics, antimicrobial
susceptibility and treatment options. Future Microbiology, 10, 407-425.
Jovetic, S., Zhu, Y., Marcone, G. L., Marinelli, F. & Tramper, J. 2010. β-lactam and
glycopeptide antibiotics: first and last line of defense? Trends in Biotechnology, 28,
596-604.
Kaczmarek, F. S., Gootz, T. D., Dib-Hajj, F., Shang, W. C., Hallowell, S. & Cronan, M. 2004.
Genetic and molecular characterization of β-lactamase-negative ampicillin-resistant
Haemophilus influenzae with unusually high resistance to ampicillin. Antimicrobial
Agents and Chemotherapy, 48, 1630-1639.
Kahan, J. S., Kahan, F. M., Goegelman, R., Currie, S. A., Jackson, M., Stapley, E. O., Miller,
T. W., Miller, A. K., Hendlin, D., Mochales, S., Hernandez, S., Woodruff, H. B. &
Birnbaum, J. 1979. Thienamycin, a new β-lactam antibiotic.1. Discovery, taxonomy,
isolation and physical properties. Journal of Antibiotics, 32, 1-12.
Kallen, A. J., Beekmann, S. E., Limbago, B., Lentnek, A. L., Polgreen, P. M., Patel, J. &
Srinivasan, A. 2011. Prevalence of β-lactam nonsusceptible Gram-negative bacilli and
use and interpretation of current susceptibility breakpoints: a survey of infectious
disease physicians. Diagnostic Microbiology and Infectious Disease, 71, 316-319.
Kalpoe, J. S., Sonnenberg, E., Factor, S. H., Del Rio Martin, J., Schiano, T., Patel, G. &
Huprikar, S. 2012. Mortality associated with carbapenem-resistant Klebsiella
pneumoniae infections in liver transplant recipients. Liver Transplantation, 18, 468-
474.
Kang, C. I., Kim, S. H., Wan, B. P., Lee, K. D., Kim, H. B., Kim, E. C., Oh, M. D. & Choe, K.
W. 2005. Bloodstream infections caused by antibiotic-resistant Gram-negative bacilli:
244
Risk factors for mortality and impact of inappropriate initial antimicrobial therapy on
outcome. Antimicrobial Agents and Chemotherapy, 49, 760-766.
Katayama, Y., Zhang, H. Z. & Chambers, H. F. 2004. PBP 2a mutations producing very-high-
level resistance to β-lactams. Antimicrobial Agents and Chemotherapy, 48, 453-459.
Kenyon, T. A., Valway, S. E., Ihle, W. W., Onorato, I. M. & Castro, K. G. 1996.
Transmission of multidrug-resistant Mycobacterium tuberculosis during a long
airplane flight. New England Journal of Medicine, 334, 933-938.
Keseler, I. M., Collado-Vides, J., Gama-Castro, S., Ingraham, J., Paley, S., Paulsen, I. T.,
Peralta-Gil, M. & Karp, P. D. 2005. EcoCyc: A comprehensive database resource for
Escherichia coli. Nucleic Acids Research, 33, D334-D337.
Kinana, A. D., Vargiu, A. V. & Nikaido, H. 2013. Some ligands enhance the efflux of other
ligands by the Escherichia coli multidrug pump AcrB. Biochemistry, 52, 8342-8351.
Kitchel, B., Rasheed, J. K., Endimiani, A., Hujer, A. M., Anderson, K. F., Bonomo, R. A. &
Patel, J. B. 2010. Genetic factors associated with elevated carbapenem resistance in
KPC-producing Klebsiella pneumoniae. Antimicrobial Agents and Chemotherapy, 54,
4201-4207.
Kitchel, B., Rasheed, J. K., Patel, J. B., Srinivasan, A., Navon-Venezia, S., Carmeli, Y.,
Brolund, A. & Giske, C. G. 2009. Molecular epidemiology of KPC-producing
Klebsiella pneumoniae isolates in the United States: Clonal expansion of multilocus
sequence Type 258. Antimicrobial Agents and Chemotherapy, 53, 3365-3370.
Klevens, R. M., Edwards, J. R., Richards, C. L., Jr., Horan, T. C., Gaynes, R. P., Pollock, D.
A. & Cardo, D. M. 2007. Estimating health care-associated infections and deaths in
U.S. hospitals, 2002. Public Health Reports 122, 160-166.
Kresse, H., Belsey, M. J. & Rovini, H. 2007. The antibacterial drugs market. Nature Reviews
Drug Discovery, 6, 19-20.
Krishnamoorthy, G., Tikhonova, E. B., Dhamdhere, G. & Zgurskaya, H. I. 2013. On the role
of TolC in multidrug efflux: The function and assembly of AcrAB-TolC tolerate
significant depletion of intracellular TolC protein. Molecular Microbiology, 87, 982-
997.
Kumar, A. & Schweizer, H. P. 2005. Bacterial resistance to antibiotics: Active efflux and
reduced uptake. Advanced Drug Delivery Reviews, 57, 1486-1513.

245
Kwon, D. H., Dore, M. P., Kim, J. J., Kato, M., Lee, M., Wu, J. Y. & Graham, D. Y. 2003.
High-level β-lactam resistance associated with acquired multidrug resistance in
Helicobacter pylori. Antimicrobial Agents and Chemotherapy, 47, 2169-2178.
Lambert, P. A. 2005. Bacterial resistance to antibiotics: Modified target sites. Advanced Drug
Delivery Reviews, 57, 1471-1485.
Lamers, R. P., Cavallari, J. F. & Burrows, L. L. 2013. The efflux inhibitor phenylalanine-
arginine β-naphthylamide (PAβN) permeabilizes the outer membrane of Gram-
negative bacteria. PLoS ONE, 8, e60666.
Landman, D., Bratu, S. & Quale, J. 2009. Contribution of OmpK36 to carbapenem
susceptibility in KPC-producing Klebsiella pneumoniae. Journal of Medical
Microbiology, 58, 1303-1308.
Landman, D., Salamera, J., Singh, M. & Quale, J. 2011. Accuracy of carbapenem
nonsusceptibility for identification of KPC-possessing Enterobacteriaceae by use of
the revised CLSI breakpoints. Journal of Clinical Microbiology, 49, 3931-3933.
Landman, D., Urban, C., Bäcker, M., Kelly, P., Shah, N., Babu, E., Bratu, S. & Quale, J. 2010.
Susceptibility profiles, molecular epidemiology, and detection of KPC-producing
Escherichia coli isolates from the New York City vicinity. Journal of Clinical
Microbiology, 48, 4604-4607.
Lavigne, J. P., Cuzon, G., Combescure, C., Bourg, G., Sotto, A. & Nordmann, P. 2013.
Virulence of Klebsiella pneumoniae isolates harboring blaKPC-2 carbapenemase gene in
a Caenorhabditis elegans model. PLoS ONE, 8, e67847.
Lavigne, J. P., Sotto, A., Nicolas-Chanoine, M. H., Bouziges, N., Bourg, G., Davin-Regli, A.
& Pagès, J. M. 2012. Membrane permeability, a pivotal function involved in antibiotic
resistance and virulence in Enterobacter aerogenes clinical isolates. Clinical
Microbiology and Infection, 18, 539-545.
Leavitt, A., Chmelnitsky, I., Carmeli, Y. & Navon-Venezia, S. 2010a. Complete nucleotide
sequence of KPC-3-encoding plasmid pKpQIL in the epidemic Klebsiella pneumoniae
sequence type 258. Antimicrobial Agents and Chemotherapy, 54, 4493-4496.
Leavitt, A., Chmelnitsky, I., Ofek, I., Carmeli, Y. & Navon-Venezia, S. 2010b. Plasmid
pKpQIL encoding KPC-3 and TEM-1 confers carbapenem resistance in an extremely
drug-resistant epidemic Klebsiella pneumoniae strain. Journal of Antimicrobial
Chemotherapy, 65, 243-248.
246
Leavitt, A., Navon-Venezia, S., Chmelnitsky, I., Schwaber, M. J. & Carmeli, Y. 2007.
Emergence of KPC-2 and KPC-3 in carbapenem-resistant Klebsiella pneumoniae
strains in an Israeli hospital. Antimicrobial Agents and Chemotherapy, 51, 3026-3029.
Lee, Y., Kim, B. S., Chun, J., Yong, J. H., Lee, Y. S., Yoo, J. S., Yong, D., Hong, S. G.,
D'souza, R., Thomson, K. S., Lee, K. & Chong, Y. 2014. Clonality and resistome
analysis of KPC-producing Klebsiella pneumoniae strain isolated in Korea using
whole genome sequencing. BioMed Research International, 2014, 1-6.
Lenski, R. E. 1998. Bacterial evolution and the cost of antibiotic resistance. International
Microbiology, 1, 265-270.
Lenski, R. E. & Bouma, J. E. 1987. Effects of segregation and selection on instability of
plasmid pACYC184 in Escherichia coli B. Journal of Bacteriology, 169, 5314-5316.
Lenski, R. E. & Nguyen, T. T. 1988. Stability of recombinant DNA and its effects on fitness.
Trends in Biotechnology, 6, S18-S20.
Lenski, R. E., Simpson, S. C. & Nguyen, T. T. 1994. Genetic analysis of a plasmid-encoded,
host genotype-specific enhancement of bacterial fitness. Journal of Bacteriology, 176,
3140-3147.
Lewis, K. 2001. Riddle of biofilm resistance. Antimicrobial Agents and Chemotherapy, 45,
999-1007.
Li, Y., Powell, D. A., Shaffer, S. A., Rasko, D. A., Pelletier, M. R., Leszyk, J. D., Scott, A. J.,
Masoudi, A., Goodlett, D. R., Wang, X., Raetze, C. R. H. & Ernst, R. K. 2012. LPS
remodeling is an evolved survival strategy for bacteria. Proceedings of the National
Academy of Sciences of the United States of America, 109, 8716-8721.
Liebana, E., Batchelor, M., Hopkins, K. L., Clifton-Hadley, F. A., Teale, C. J., Foster, A.,
Barker, L., Threlfall, E. J. & Davies, R. H. 2006. Longitudinal farm study of extended-
spectrum β-lactamase-mediated resistance. Journal of Clinical Microbiology, 44,
1630-1634.
Liew, Y.-X., Krishnan, P., Yeo, C. L., Tan, T. Y., Lee, S. Y., Lim, W. P., Lee, W., Hsu, L. Y.
& Network for Antimicrobial Resistance, S. 2011. Surveillance of broad-spectrum
antibiotic prescription in Singaporean hospitals: A 5-Year longitudinal study. PLoS
ONE, 6, e28751.
Lim, S. P. & Nikaido, H. 2010. Kinetic parameters of efflux of penicillins by the multidrug
efflux transporter AcrAB-TolC of Escherichia coli. Antimicrobial Agents and
Chemotherapy, 54, 1800-1806.
247
Lioy, V. S., Rey, O., Balsa, D., Pellicer, T. & Alonso, J. C. 2010. A toxin-antitoxin module as
a target for antimicrobial development. Plasmid, 63, 31-39.
Lleo, M. D., Canepari, P., Cornaglia, G., Fontana, R. & Satta, G. 1987. Bacteriostatic and
bactericidal activities of β-lactams against Streptococcus (enterococcus)-faecium are
associated with saturation of different penicillin-binding proteins. Antimicrobial
Agents and Chemotherapy, 31, 1618-1626.
Loftie-Eaton, W. & Rawlings, D. E. 2010. Evolutionary competitiveness of two natural
variants of the IncQ-like plasmids, pRAS3.1 and pRAS3.2. Journal of Bacteriology,
192, 6182-6190.
Lomovskaya, O. & Bostian, K. A. 2006. Practical applications and feasibility of efflux pump
inhibitors in the clinic—A vision for applied use. Biochemical Pharmacology, 71,
910-918.
Lomovskaya, O., Lee, A., Hoshino, K., Ishida, H., Mistry, A., Warren, M. S., Boyer, E.,
Chamberland, S. & Lee, V. J. 1999. Use of a genetic approach to evaluate the
consequences of inhibition of efflux pumps in Pseudomonas aeruginosa.
Antimicrobial Agents and Chemotherapy, 43, 1340-1346.
Lomovskaya, O., Warren, M. S., Lee, A., Galazzo, J., Fronko, R., Lee, M., Blais, J., Cho, D.,
Chamberland, S., Renau, T., Leger, R., Hecker, S., Watkins, W., Hoshino, K., Ishida,
H. & Lee, V. J. 2001. Identification and characterization of inhibitors of multidrug
resistance efflux pumps in Pseudomonas aeruginosa: Novel agents for combination
therapy. Antimicrobial Agents and Chemotherapy, 45, 105-116.
Lorenz, M. G., Gerjets, D. & Wackernagel, W. 1991. Release of transforming plasmid and
chromosomal DNA from two cultured soil bacteria. Archives of Microbiology, 156,
319-326.
Lorenz, M. G. & Wackernagel, W. 1994. Bacterial gene transfer by natural genetic
transformation in the environment. Microbiological Reviews, 58, 563-602.
Lueangarun, S. & Leelarasamee, A. 2012. Impact of inappropriate empiric antimicrobial
therapy on mortality of septic patients with bacteremia: A retrospective study.
Interdisciplinary Perspectives on Infectious Diseases, 2012, 1-13.
Lugtenberg, B. & Van Alphen, L. 1983. Molecular architecture and functioning of the outer
membrane of Escherichia coli and other Gram-negative bacteria. Biochimica et
Biophysica Acta (BBA) - Reviews on Biomembranes, 737, 51-115.

248
Lujan, S. A., Guogas, L. M., Ragonese, H., Matson, S. W. & Redinbo, M. R. 2007. Disrupting
antibiotic resistance propagation by inhibiting the conjugative DNA relaxase.
Proceedings of the National Academy of Sciences of the United States of America, 104,
12282-12287.
Luo, N., Pereira, S., Sahin, O., Lin, J., Huanq, S., Michel, L. & Zhanq, Q. 2005. Enhanced in
vivo fitness of fluoroquinolone-resistant Campylobacter jejuni in the absence of
antibiotic selection pressure. Proceedings of the National Academy of Sciences of the
United States of America, 102, 541-546.
Ma, D., Cook, D. N., Alberti, M., Pon, N. G., Nikaido, H. & Hearst, J. E. 1993. Molecular
cloning and characterization of acrA and acrE genes of Escherichia coli. Journal of
Bacteriology, 175, 6299-6313.
Ma, D., Cook, D. N., Alberti, M., Pon, N. G., Nikaido, H. & Hearst, J. E. 1995. Genes acrA
and acrB encode a stress-induced efflux system of Escherichia coli. Molecular
Microbiology, 16, 45-55.
Ma, L., Siu, L. K., Lin, J. C., Wu, T. L., Fung, C. P., Wang, J. T., Lu, P. L. & Chuang, Y. C.
2013. Updated molecular epidemiology of carbapenem-non-susceptible Escherichia
coli in Taiwan: First identification of KPC-2 or NDM-1-producing E. coli in Taiwan.
BMC Infectious Diseases, 13, 599.
Macgowan, A. P. 2008. Clinical implications of antimicrobial resistance for therapy. Journal
of Antimicrobial Chemotherapy, 62, ii105-ii114.
Maclean, R. C., Hall, A. R., Perron, G. G. & Buckling, A. 2010. The evolution of antibiotic
resistance: insight into the roles of molecular mechanisms of resistance and treatment
context. Discovery Medicine, 10, 112-8.
Marciano, D. C., Karkouti, O. Y. & Palzkill, T. 2007. A fitness cost associated with the
antibiotic resistance enzyme SME-1 β-lactamase. Genetics, 176, 2381-2392.
Marger, M. D. & Saier Jr, M. H. 1993. A major superfamily of transmembrane facilitators
that catalyse uniport, symport and antiport. Trends in Biochemical Sciences, 18, 13-20.
Marshall, A. J. H. & Piddock, L. J. V. 1993. Effect of cations and EDTA upon the activity of
18 quinolones, gentamicin, ceftazidime and polymixin against Gram-negative and
Gram-positive bacteria. Drugs, 46, 150-151.
Martínez-Flores, I., Cano, R., Bustamante, V. H., Calva, E. & Puente, J. L. 1999. The ompB
operon partially determines differential expression of OmpC in Salmonella typhi and
Escherichia coli. Journal of Bacteriology, 181, 556-562.

249
Martínez-Martínez, L., Pascual, A., Conejo, M. D. C., García, I., Joyanes, P., Doménech-
Sánchez, A. & Benedí, V. J. 2002. Energy-dependent accumulation of norfloxacin and
porin expression in clinical isolates of Klebsiella pneumoniae and relationship to
extended-spectrum β-lactamase production. Antimicrobial Agents and Chemotherapy,
46, 3926-3932.
Mathers, A. J., Peirano, G. & Pitout, J. D. D. 2015. The role of epidemic resistance plasmids
and international high- risk clones in the spread of multidrug-resistant
Enterobacteriaceae. Clinical Microbiology Reviews, 28, 565-591.
Matic, V., Bozdogan, B., Jacobs, M. R., Ubukata, K. & Appelbaum, P. C. 2003. Contribution
of β-lactamase and PBP amino acid substitutions to amoxicillin/clavulanate resistance
in β-lactamase-positive, amoxicillin/clavulanate-resistant Haemophilus influenzae.
Journal of Antimicrobial Chemotherapy, 52, 1018-1021.
Matsumoto, Y., Hayama, K., Sakakihara, S., Nishino, K., Noji, H., Iino, R. & Yamaguchi, A.
2011. Evaluation of multidrug efflux pump inhibitors by a new method using
microfluidic channels. PLoS ONE, 6, e18547.
Mcclelland, M., Sanderson, K. E., Spieth, J., Clifton, S. W., Latreille, P., Courtney, L.,
Porwollik, S., Ali, J., Dante, M., Du, F., Hou, S., Layman, D., Leonard, S., Nguyen, C.,
Scott, K., Holmes, A., Grewal, N., Mulvaney, E., Ryan, E., Sun, H., Florea, L., Miller,
W., Stoneking, T., Nhan, M., Waterston, R. & Wilson, R. K. 2001. Complete genome
sequence of Salmonella enterica serovar Typhimurium LT2. Nature, 413, 852-856.
Mcmurry, L. M., Oethinger, M. & Levy, S. B. 1998. Overexpression of marA, soxS, or acrAB
produces resistance to triclosan in laboratory and clinical strains of Escherichia coli.
FEMS Microbiology Letters, 166, 305-309.
Miller, K., O'neill, A. J. & Chopra, I. 2002. Response of Escherichia coli hypermutators to
selection pressure with antimicrobial agents from different classes. Journal of
Antimicrobial Chemotherapy, 49, 925-934.
Miriagou, V., Tzouvelekis, L. S., Rossiter, S., Tzelepi, E., Angulo, F. J. & Whichard, J. A.
2003. Imipenem resistance in a Salmonella clinical strain due to plasmid-mediated
class a carbapenemase KPC-2. Antimicrobial Agents and Chemotherapy, 47, 1297-
1300.
Mitsuhashi, S., Hashimoto, H., Egawa, R., Tanaka, T. & Nagai, Y. 1967. Drug resistance of
enteric bacteria. IX. Distribution of R factors in gram-negative bacteria from clinical
sources. Journal of Bacteriology, 93, 1242-1245.

250
Moellering, R. C., Eliopoulos, G. M. & Sentochnik, D. E. 1989. The carbapenems: New
broad spectrum β-lactam antibiotics. Journal of Antimicrobial Chemotherapy, 24, 1-7.
Mohr, J. F. 2008. Update on the efficacy and tolerability of meropenem in the treatment of
serious bacterial infections. Clinical Infectious Diseases, 47, S41-S51.
Moland, E. S., Hanson, N. D., Herrera, V. L., Black, J. A., Lockhart, T. J., Hossain, A.,
Johnson, J. A., Goering, R. V. & Thomson, K. S. 2003. Plasmid-mediated,
carbapenem-hydrolysing β-lactamase, KPC-2, in Klebsiella pneumoniae isolates.
Journal of Antimicrobial Chemotherapy, 51, 711-714.
Moran, N. A., Russell, J. A., Koga, R. & Fukatsu, T. 2005. Evolutionary relationships of three
new species of Enterobacteriaceae living as symbionts of aphids and other insects.
Applied and Environmental Microbiology, 71, 3302-3310.
Morris, D., Boyle, F., Ludden, C., Condon, I., Hale, J., O'connell, N., Power, L., Boo, T. W.,
Dhanji, H., Lavallee, C., Woodford, N. & Cormican, M. 2011. Production of KPC-2
carbapenemase by an Escherichia coli clinical isolate belonging to the international
ST131 clone. Antimicrobial Agents and Chemotherapy, 55, 4935-4936.
Moyes, R. B., Reynolds, J. & Breakwell, D. P. 2009. Differential staining of bacteria: Gram
stain. Current Protocols in Microbiology, Appendix 3, Appendix 3C.
Muniesa, M., Garcia, A., Miro, E., Mirelis, B., Prats, G., Jofre, J. & Navarro, F. 2004.
Bacteriophages and diffusion of β-lactamase genes. Emerging Infectious Diseases, 10,
1134-1137.
Murakami, S., Nakashima, R., Yamashita, E., Matsumoto, T. & Yamaguchi, A. 2006. Crystal
structures of a multidrug transporter reveal a functionally rotating mechanism. Nature,
443, 173-179.
Musson, D. G., Majumdar, A., Birk, K., Holland, S., Wickersham, P., Li, S. X., Mistry, G.,
Fisher, A., Waldman, S., Greenberg, H., Deutsch, P. & Rogers, J. D. 2003.
Pharmacokinetics of intramuscularly administered ertapenem. Antimicrobial Agents
and Chemotherapy, 47, 1732-1735.
Naas, T., Cuzon, G., Villegas, M. V., Lartigue, M. F., Quinn, J. P. & Nordmann, P. 2008.
Genetic structures at the origin of acquisition of the β-lactamase blaKPC gene.
Antimicrobial Agents and Chemotherapy, 52, 1257-1263.
Naas, T., Nordmann, P., Vedel, G. & Poyart, C. 2005. Plasmid-mediated carbapenem-
hydrolyzing β-lactamase KPC in a Klebsiella pneumoniae isolate from France.
Antimicrobial Agents and Chemotherapy, 49, 4423-4424.
251
Nagano, K. & Nikaido, H. 2009. Kinetic behavior of the major multidrug efflux pump AcrB
of Escherichia coli. Proceedings of the National Academy of Sciences of the United
States of America, 106, 5854-5858.
Nahid, F., Khan, A. A., Rehman, S. & Zahra, R. 2013. Prevalence of metallo-β-lactamase
NDM-1-producing multi-drug resistant bacteria at two Pakistani hospitals and
implications for public health. Journal of Infection and Public Health, 6, 487-493.
Nakagawa, J., Tamaki, S. & Matsuhashi, M. 1979. Purified penicillin binding proteins 1bs
from Escherichia coli membrane showing activities of both peptidoglycan polymerase
and peptidoglycan crosslinking enzyme. Agricultural and Biological Chemistry, 43,
1379-1380.
Nakamura, H. 1968. Genetic determination of resistance to acriflavine, phenethyl alcohol, and
sodium dodecyl sulfate in Escherichia coli. Journal of Bacteriology, 96, 987-996.
NAO. 2009. Reducing healthcare associated infections in hospitals in England [Online].
Norwich: The Stationery Office. Available: http://www.nao.org.uk/wp-
content/uploads/2009/06/0809560es.pdf [Accessed 14th June 2015].
Navon-Venezia, S., Leavitt, A., Schwaber, M. J., Rasheed, J. K., Srinivasan, A., Patel, J. B.,
Carmeli, Y. & Israeli, K. P. C. K. S. G. 2009. First report on a hyperepidemic clone of
KPC-3-producing Klebsiella pneumoniae in Israel genetically related to a strain
causing outbreaks in the United States. Antimicrobial Agents and Chemotherapy, 53,
818-820.
Nayler, J. H. C. 1971. Structure-activity relationships in semi-synthetic penicillins.
Proceedings of the Royal Society of London. Series B, Biological Sciences, 179, 357-
367.
Nelson, D. E. & Young, K. D. 2000. Penicillin binding protein 5 affects cell diameter, contour,
and morphology of Escherichia coli. Journal of Bacteriology, 182, 1714-1721.
Nicas, T. I. & Hancock, R. E. 1983. Pseudomonas aeruginosa outer membrane permeability:
isolation of a porin protein F-deficient mutant. Journal of Bacteriology, 153, 281-285.
Nicolau, D. P. 2008. Carbapenems: a potent class of antibiotics. Expert Opinion on
Pharmacotherapy, 9, 23-37.
Nijssen, S., Florijn, A., Bonten, M. J. M., Schmitz, F. J., Verhoef, J. & Fluit, A. C. 2004. β-
lactam susceptibilities and prevalence of ESBL-producing isolates among more than
5000 European Enterobacteriaceae isolates. International Journal of Antimicrobial
Agents, 24, 585-591.

252
Nikaido, H. 1998. Antibiotic resistance caused by Gram-negative multidrug efflux pumps.
Clinical Infectious Diseases, 27, S32-S41.
Nikaido, H. 2001. Preventing drug access to targets: cell surface permeability barriers and
active efflux in bacteria. Seminars in Cell & Developmental Biology, 12, 215-223.
Nikaido, H. 2003. Molecular basis of bacterial outer membrane permeability revisited.
Microbiology and Molecular Biology Reviews, 67, 593-656.
Nikaido, H., Basina, M., Nguyen, V. & Rosenberg, E. Y. 1998. Multidrug efflux pump
AcrAB of Salmonella Typhimurium excretes only those β-lactam antibiotics
containing lipophilic side chains. Journal of Bacteriology, 180, 4686-4692.
Nikaido, H. & Rosenberg, E. Y. 1983. Porin channels in Escherichia coli: Studies with
liposomes reconstituted from purified proteins. Journal of Bacteriology, 153, 241-252.
Nikaido, H. & Zgurskaya, H. I. 2001. AcrAB and related multidrug efflux pumps of
Escherichia coli. Journal of Molecular Microbiology and Biotechnology, 3, 215-218.
Nishino, K., Latifi, T. & Groisman, E. A. 2006. Virulence and drug resistance roles of
multidrug efflux systems of Salmonella enterica serovar Typhimurium. Molecular
Microbiology, 59, 126-141.
Nordmann, P. 2014. Carbapenemase-producing Enterobacteriaceae: Overview of a major
public health challenge. Medecine et Maladies Infectieuses, 44, 51-56.
Nordmann, P., Dortet, L. & Poirel, L. 2012a. Carbapenem resistance in Enterobacteriaceae:
Here is the storm! Trends in Molecular Medicine, 18, 263-272.
Nordmann, P., Gniadkowski, M., Giske, C. G., Poirel, L., Woodford, N., Miriagou, V., Akova,
M., Naas, T., Seifert, H., Livermore, D., Bogaerts, P., Glupczynski, Y., Canton, R.,
Rossolini, G. M., Giske, C., Adler, A., Carmeli, Y., Navon-Venezia, S., Samuelsen, O.
& Cornaglia, G. 2012b. Identification and screening of carbapenemase-producing
Enterobacteriaceae. Clinical Microbiology and Infection, 18, 432-438.
Norrander, J., Kempe, T. & Messing, J. 1983. Construction of improved M13 vectors using
oligodeoxynucleotide-directed mutagenesis. Gene, 26, 101-106.
Novick, R. P. 1987. Plasmid incompatibility. Microbiological Reviews, 51, 381-395.
O'Neill, J. 2014. Antimicrobial Resistance: Tackling a crisis for the health and wealth of
nations [Online]. United Kingdom. Available: http://amr-
review.org/sites/default/files/AMR%20Review%20Paper%20-
%20Tackling%20a%20crisis%20for%20the%20health%20and%20wealth%20of%20n
ations_1.pdf [Accessed 14th June 2015].

253
Oethinger, M., Kern, W. V., Jellen-Ritter, A. S., Mcmurry, L. M. & Levy, S. B. 2000.
Ineffectiveness of topoisomerase mutations in mediating clinically significant
fluoroquinolone resistance in Escherichia coli in the absence of the AcrAB efflux
pump. Antimicrobial Agents and Chemotherapy, 44, 10-13.
Ohnishi, M., Watanabe, Y., Ono, E., Takahashi, C., Oya, H., Kuroki, T., Shimuta, K.,
Okazaki, N., Nakayama, S. I. & Watanabe, H. 2010. Spread of a chromosomal
cefixime-resistant penA gene among different Neisseria gonorrhoeae lineages.
Antimicrobial Agents and Chemotherapy, 54, 1060-1067.
Ohse, M., Takahashi, K., Kadowaki, Y. & Kusaoke, H. 1995. Effects of plasmid DNA sizes
and several other factors on transformation of Bacillus subtilis ISW1214 with plasmid
DNA by electroporation. Bioscience, Biotechnology and Biochemistry, 59, 1433-1437.
Opperman, T. J., Kwasny, S. M., Kim, H. S., Nguyen, S. T., Houseweart, C., D'souza, S.,
Walker, G. C., Peet, N. P., Nikaido, H. & Bowlin, T. L. 2014. Characterization of a
novel pyranopyridine inhibitor of the AcrAB efflux pump of Escherichia coli.
Antimicrobial Agents and Chemotherapy, 58, 722-733.
Oteo, J., Delgado-Iribarren, A., Vega, D., Bautista, V., Rodríguez, M. C., Velasco, M.,
Saavedra, J. M., Pérez-Vázquez, M., García-Cobos, S., Martínez-Martínez, L. &
Campos, J. 2008. Emergence of imipenem resistance in clinical Escherichia coli
during therapy. International Journal of Antimicrobial Agents, 32, 534-537.
Otter, J. A. 2014. What's trending in the infection prevention and control literature? From HIS
2012 to HIS 2014, and beyond. Journal of Hospital Infection, 89, 229-236.
Ow, D. S. W., Nissom, P. M., Philp, R., Oh, S. K. W. & Yap, M. G. S. 2006. Global
transcriptional analysis of metabolic burden due to plasmid maintenance in
Escherichia coli DH5α during batch fermentation. Enzyme and Microbial Technology,
39, 391-398.
Pagès, J.-M. & Amaral, L. 2009. Mechanisms of drug efflux and strategies to combat them:
Challenging the efflux pump of Gram-negative bacteria. Biochimica et Biophysica
Acta (BBA) - Proteins and Proteomics, 1794, 826-833.
Pages, J.-M. & Davin, A. V. 2015. Enterobacter aerogenes and Enterobacter cloacae;
versatile bacterial pathogens confronting antibiotic treatment. Frontiers in
Microbiology, 6.

254
Pages, J.-M., James, C. E. & Winterhalter, M. 2008. The porin and the permeating antibiotic:
a selective diffusion barrier in Gram-negative bacteria. Nature Reviews Microbiology,
6, 893-903.
Pages, J.-M., Lavigne, J.-P., Leflon-Guibout, V., Marcon, E., Bert, F., Noussair, L. &
Nicolas-Chanoine, M.-H. 2009. Efflux pump, the masked side of ß-lactam resistance
in Klebsiella pneumoniae clinical isolates. PLoS ONE, 4, e4817.
Pai, H., Kim, J. W., Kim, J., Lee, J. H., Choe, K. W. & Gotoh, N. 2001. Carbapenem
resistance mechanisms in Pseudomonas aeruginosa clinical isolates. Antimicrobial
Agents and Chemotherapy, 45, 480-484.
Pannek, S., Higgins, P. G., Steinke, P., Jonas, D., Akova, M., Bohnert, J. A., Seifert, H. &
Kern, W. V. 2006. Multidrug efflux inhibition in Acinetobacter baumannii:
Comparison between 1-(1-naphthylmethyl)-piperazine and phenyl-arginine-β-
naphthylamide. Journal of Antimicrobial Chemotherapy, 57, 970-974.
Paphitou, N. I. 2013. Antimicrobial resistance: Action to combat the rising microbial
challenges. International Journal of Antimicrobial Agents, 42, S25-S28.
Papp-Wallace, K. M., Endimiani, A., Taracila, M. A. & Bonomo, R. A. 2011. Carbapenems:
Past, present, and future. Antimicrobial Agents and Chemotherapy, 55, 4943-4960.
Partridge, S. R. 2014. Tn4401 Carrying blaKPC is inserted within another insertion in pKpQIL
and related plasmids. Journal of Clinical Microbiology, 52, 4448-4449.
Paterson, D. L. & Bonomo, R. A. 2005. Extended-spectrum β-lactamases: a clinical update.
Clinical Microbiology Reviews, 18, 657-686.
Paulsen, I. T., Skurray, R. A., Tam, R., Saler, M. H., Turner, R. J., Weiner, J. H., Goldberg, E.
B. & Grinius, L. L. 1996. The SMR family: A novel family of multidrug efflux
proteins involved with the efflux of lipophilic drugs. Molecular Microbiology, 19,
1167-1175.
Paytubi, S., Aznar, S., Madrid, C., Balsalobre, C., Dillon, S. C., Dorman, C. J. & Juárez, A.
2013. A novel role for antibiotic resistance plasmids in facilitating Salmonella
adaptation to non-host environments. Environmental Microbiology, 16, 950-962.
Peirano, G. & Pitout, J. D. D. 2010. Molecular epidemiology of Escherichia coli producing
CTX-M β-lactamases: the worldwide emergence of clone ST131 O25:H4.
International Journal of Antimicrobial Agents, 35, 316-321.
Pérez-Cruz, C., Delgado, L., López-Iglesias, C. & Mercade, E. 2015. Outer-inner membrane
vesicles naturally secreted by Gram-negative pathogenic bacteria. PLoS ONE, 10.

255
Phillips, I., Casewell, M., Cox, T., De Groot, B., Friis, C., Jones, R., Nightingale, C., Preston,
R. & Waddell, J. 2004. Does the use of antibiotics in food animals pose a risk to
human health? A critical review of published data. Journal of Antimicrobial
Chemotherapy, 53, 28-52.
Piddock, L. J. V. 2006a. Clinically relevant chromosomally encoded multidrug resistance
efflux pumps in bacteria. Clinical Microbiology Reviews, 19, 382-402.
Piddock, L. J. V. 2006b. Multidrug-resistance efflux pumps - Not just for resistance. Nature
Reviews Microbiology, 4, 629-636.
Piddock, L. J. V. 2012. The crisis of no new antibiotics—what is the way forward? The
Lancet Infectious Diseases, 12, 249-253.
Piddock, L. J. V., Griggs, D. J., Hall, M. C. & Jin, Y. F. 1993. Ciprofloxacin resistance in
clinical isolates of Salmonella Typhimurium obtained from two patients.
Antimicrobial Agents and Chemotherapy, 37, 662-666.
Piddock, L. J. V., Traynor, E. A. & Wise, R. 1990. A comparison of the mechanisms of
decreased susceptibility of aztreonam-resistant and ceftazidime-resistant
Enterobacteriaceae. Journal of Antimicrobial Chemotherapy, 26, 749-762.
Pittet, D., Mourouga, P., Perneger, T. V. & Infection Control, P. 1999. Compliance with
handwashing in a teaching hospital. Annals of Internal Medicine, 130, 126-130.
Plüss-Suard, C., Pannatier, A., Kronenberg, A., Mühlemann, K. & Zanetti, G. 2011. Hospital
antibiotic consumption in Switzerland: comparison of a multicultural country with
Europe. Journal of Hospital Infection, 79, 166-171.
Poirel, L., Lagrutta, E., Taylor, P., Pham, J. & Nordmann, P. 2010. Emergence of metallo-β-
lactamase NDM-1-producing multidrug-resistant Escherichia coli in Australia.
Antimicrobial Agents and Chemotherapy, 54, 4914-4916.
Poirel, L., Revathi, G., Bernabeu, S. & Nordmann, P. 2011. Detection of NDM-1-producing
Klebsiella pneumoniae in Kenya. Antimicrobial Agents and Chemotherapy, 55, 934-
936.
Polilli, E., Parruti, G., Fazii, P., D'antonio, D., Palmieri, D., D'incecco, C., Mangifesta, A.,
Garofalo, G., Del Duca, L., D'amario, C., Scimia, M., Cortesi, V. & Fortunato, V.
2011. Rapidly controlled outbreak of Serratia marcescens infection/colonisations in a
neonatal intensive care unit, Pescara general hospital, Pescara, Italy, April 2011.
Eurosurveillance, 16.

256
Poole, K. 2000. Efflux-mediated resistance to fluoroquinolones in gram-negative bacteria.
Antimicrobial Agents and Chemotherapy, 44, 2233-2241.
Poole, K. 2004. Efflux-mediated multiresistance in Gram-negative bacteria. Clinical
Microbiology and Infection, 10, 12-26.
Poole, K. 2005. Efflux-mediated antimicrobial resistance. Journal of Antimicrobial
Chemotherapy, 56, 20-51.
Poole, K. & Lomovskaya, O. 2006. Can efflux inhibitors really counter resistance? Drug
Discovery Today: Therapeutic Strategies, 3, 145-152.
Pope, C. F., Gillespie, S. H., Moore, J. E. & Mchugh, T. D. 2010. Approaches to measure the
fitness of Burkholderia cepacia complex isolates. Journal of Medical Microbiology,
59, 679-686.
Potera, C. 1996. Biofilms invade microbiology. Science, 273, 1795-1797.
Poulou, A., Voulgari, E., Vrioni, G., Koumaki, V., Xidopoulos, G., Chatzipantazi, V., Markou,
F. & Tsakris, A. 2013. Outbreak caused by an ertapenem-resistant, CTX-M-15-
producing Klebsiella pneumoniae sequence type 101 clone carrying an OmpK36 porin
variant. Journal of Clinical Microbiology, 51, 3176-3182.
Pournaras, S., Kristo, I., Vrioni, G., Ikonomidis, A., Poulou, A., Petropoulou, D. & Tsakris, A.
2010. Characteristics of meropenem heteroresistance in Klebsiella pneumoniae
carbapenemase (KPC)-producing clinical isolates of K. pneumoniae. Journal of
Clinical Microbiology, 48, 2601-2604.
Pratt, L. A., Hsing, W., Gibson, K. E. & Silhavy, T. J. 1996. From acids to osmZ: multiple
factors influence synthesis of the OmpF and OmpC porins in Escherichia coli.
Molecular Microbiology, 20, 911-917.
Psichogiou, M., Tassios, P. T., Avlamis, A., Stefanou, I., Kosmidis, C., Platsouka, E., Paniara,
O., Xanthaki, A., Toutouza, M., Daikos, G. I. & Tzouvelekis, L. S. 2008. Ongoing
epidemic of blaVIM-1-positive Klebsiella pneumoniae in Athens, Greece: A prospective
survey. Journal of Antimicrobial Chemotherapy, 61, 59-63.
Queenan, A. M. & Bush, K. 2007. Carbapenemases: the versatile β-lactamases. Clinical
Microbiology Reviews, 20, 440-458.
Raimondi, A., Sisto, F. & Nikaido, H. 2001. Mutation in Serratia marcescens AmpC β-
lactamase producing high-level resistance to ceftazidime and cefpirome. Antimicrobial
Agents and Chemotherapy, 45, 2331-2339.

257
Ramani, N., Hedeshian, M. & Freundlich, M. 1994. micF antisense RNA has a major role in
osmoregulation of OmpF in Escherichia coli. Journal of Bacteriology, 176, 5005-
5010.
Reinert, R. R., Low, D. E., Rossi, F., Zhang, X., Wattal, C. & Dowzicky, M. J. 2007.
Antimicrobial susceptibility among organisms from the Asia/Pacific Rim, Europe and
Latin and North America collected as part of TEST and the in vitro activity of
tigecycline. Journal of Antimicrobial Chemotherapy, 60, 1018-1029.
Reisner, A., Höller, B. M., Molin, S. & Zechner, E. L. 2006. Synergistic effects in mixed
Escherichia coli biofilms: Conjugative plasmid transfer drives biofilm expansion.
Journal of Bacteriology, 188, 3582-3588.
Renau, T. E., Léger, R., Flamme, E. M., Sangalang, J., She, M. W., Yen, R., Gannon, C. L.,
Griffith, D., Chamberland, S., Lomovskaya, O., Hecker, S. J., Lee, V. J., Ohta, T. &
Nakayama, K. 1999. Inhibitors of efflux pumps in Pseudomonas aeruginosa
potentiate the activity of the fluoroquinolone antibacterial levofloxacin. Journal of
Medicinal Chemistry, 42, 4928-4931.
Renau, T. E., Léger, R., Yen, R., She, M. W., Flamme, E. M., Sangalang, J., Gannon, C. L.,
Chamberland, S., Lomovskaya, O. & Lee, V. J. 2002. Peptidomimetics of efflux pump
inhibitors potentiate the activity of levofloxacin in Pseudomonas aeruginosa.
Bioorganic and Medicinal Chemistry Letters, 12, 763-766.
Ricci, V., Tzakas, P., Buckley, A., Coldham, N. C. & Piddock, L. J. V. 2006. Ciprofloxacin-
resistant Salmonella enterica serovar Typhimurium strains are difficult to select in the
absence of AcrB and TolC. Antimicrobial Agents and Chemotherapy, 50, 38-42.
Richmond, G. E., Chua, K. L. & Piddock, L. J. V. 2013. Efflux in Acinetobacter baumannii
can be determined by measuring accumulation of H33342 (bis-benzamide). Journal of
Antimicrobial Chemotherapy, 68, 1594-1600.
Richter, S. N., Frasson, I., Franchin, E., Bergo, C., Lavezzo, E., Barzon, L., Cavallaro, A. &
Pal, G. 2012. KPC-mediated resistance in Klebsiella pneumoniae in two hospitals in
Padua, Italy, June 2009-December 2011: Massive spreading of a KPC-3-encoding
plasmid and involvement of non-intensive care units. Gut Pathogens, 4, 7.
Roberts, R. R., Hota, B., Ahmad, I., Scott, R. D., Foster, S. D., Abbasi, F., Schabowski, S.,
Kampe, L. M., Ciavarella, G. G., Supino, M., Naples, J., Cordell, R., Levy, S. B. &
Weinstein, R. A. 2009. Hospital and societal costs of antimicrobial-resistant infections

258
in a Chicago teaching hospital: Implications for antibiotic stewardship. Clinical
Infectious Diseases, 49, 1175-1184.
Røder, H. L., Hansen, L. H., Sørensen, S. J. & Burmølle, M. 2013. The impact of the
conjugative IncP-1 plasmid pKJK5 on multispecies biofilm formation is dependent on
the plasmid host. FEMS Microbiology Letters, 344, 186-192.
Rodríguez, E., Bautista, A. & Barrero, L. 2014. First report of a Salmonella enterica serovar
typhimurium isolate with carbapenemase (KPC-2) in Colombia. Antimicrobial Agents
and Chemotherapy, 58, 1263-1264.
Roggenkamp, A. 2007. Phylogenetic analysis of enteric species of the family
Enterobacteriaceae using the oriC-locus. Systematic and Applied Microbiology, 30,
180-188.
Romanowski, G., Lorenz, M. G. & Wackernagel, W. 1993. Plasmid DNA in a groundwater
aquifer microcosm -adsorption, DNAase resistance and natural genetic transformation
of Bacillus subtilis. Molecular Ecology, 2, 171-181.
Ropp, P. A., Hu, M., Olesky, M. & Nicholas, R. A. 2002. Mutations in ponA, the gene
encoding penicillin-binding protein 1, and a novel locus penC are requiree for hig-
level chromosomally mediated penicillin resistance in Neisseria gonorrhoeae.
Antimicrobial Agents and Chemotherapy, 46, 769-777.
Rosa Gomez-Gil, M., Ramon Pano-Pardo, J., Pilar Romero-Gomez, M., Gasior, M., Lorenzo,
M., Quiles, I. & Mingorance, J. 2010. Detection of KPC-2-producing Citrobacter
freundii isolates in Spain. Journal of Antimicrobial Chemotherapy, 65, 2695-2697.
Ruiz, E., Ocampo-Sosa, A. A., Rezusta, A., Revillo, M. J., Román, E., Torres, C. & Martínez-
Martínez, L. 2012. Acquisition of carbapenem resistance in multiresistant Klebsiella
pneumoniae strains harbouring blaCTX-M-15, qnrS1 and aac(6')-Ib-cr genes. Journal of
Medical Microbiology, 61, 672-677.
Rupp, M. E. & Fey, P. D. 2003. Extended spectrum β-lactamase (ESBL)-producing
Enterobacteriaceae - Considerations for diagnosis, prevention and drug treatment.
Drugs, 63, 353-365.
Sacha, P., Wieczorek, P., Hauschild, T., Zorawski, M., Olszanska, D. & Tryniszewska, E.
2008. Metallo-β-lactamases of Pseudomonas aeruginosa - a novel mechanism
resistance to β-lactam antibiotics. Folia Histochemica et Cytobiologica, 46, 137-142.

259
Saier, M. H., Tam, R., Reizer, A. & Reizer, J. 1994. Two novel families of bacterial
membrane proteins concerned with nodulation, cell division and transport Molecular
Microbiology, 11, 841-847.
Salgado, H., Gama-Castro, S., Martínez-Antonio, A., Díaz-Peredo, E., Sánchez-Solano, F.,
Peralta-Gil, M., Garcia-Alonso, D., Jiménez-Jacinto, V., Santos-Zavaleta, A.,
Bonavides-Martínez, C. & Collado-Vides, J. 2004. RegulonDB (version 4.0):
Transcriptional regulation, operon organization and growth conditions in Escherichia
coli K-12. Nucleic Acids Research, 32, D303-D306.
Salje, J. 2010. Plasmid segregation: How to survive as an extra piece of DNA. Critical
Reviews in Biochemistry and Molecular Biology, 45, 296-317.
Samra, Z., Ofir, O., Lishtzinsky, Y., Madar-Shapiro, L. & Bishara, J. 2007. Outbreak of
carbapenem-resistant Klebsiella pneumoniae producing KPC-3 in a tertiary medical
centre in Israel. International Journal of Antimicrobial Agents, 30, 525-529.
Samuelsen, Ø., Thilesen, C. M., Heggelund, L., Vada, A. N., Kümmel, A. & Sundsfjord, A.
2011. Identification of NDM-1-producing Enterobacteriaceae in Norway. Journal of
Antimicrobial Chemotherapy, 66, 670-672.
San Millan, A., Peña-Miller, R., Toll-Riera, M., Halbert, Z. V., Mclean, A. R., Cooper, B. S.
& Maclean, R. C. 2014. Positive selection and compensatory adaptation interact to
stabilize non-transmissible plasmids. Nature Communications, 5, 5208.
San Millan, A., Toll-Riera, M., Qi, Q. & Maclean, R. C. 2015. Interactions between
horizontally acquired genes create a fitness cost in Pseudomonas aeruginosa. Nature
Communications, 6.
Sanders, C. C., Bradford, P. A., Ehrhardt, A. F., Bush, K., Young, K. D., Henderson, T. A. &
Sanders Jr, W. E. 1997. Penicillin-binding proteins and induction of AmpC β-
lactamase. Antimicrobial Agents and Chemotherapy, 41, 2013-2015.
Santiviago, C. A., Toro, C. S., Hidalgo, A. A., Youderian, P. & Mora, G. C. 2003. Global
regulation of the Salmonella enterica serovar Typhimurium major porin, OmpD.
Journal of Bacteriology, 185, 5901-5905.
Savkovic, S. D., Villanueva, J., Turner, J. R., Matkowskyj, K. A. & Hecht, G. 2005. Mouse
model of enteropathogenic Escherichia coli infection. Infection and Immunity, 73,
1161-1170.
Scheffers, D. J. & Pinho, M. G. 2005. Bacterial cell wall synthesis: New insights from
localization studies. Microbiology and Molecular Biology Reviews, 69, 585-607.

260
Schmieger, H. & Schicklmaier, P. 1999. Transduction of multiple drug resistance of
Salmonella enterica serovar Typhimurium DT104. FEMS Microbiology Letters, 170,
251-256.
Schneider, E. & Hunke, S. 1998. ATP-binding-cassette (ABC) transport systems: Functional
and structural aspects of the ATP-hydrolyzing subunits/domains. FEMS Microbiology
Reviews, 22, 1-20.
Schopf, J. W. 1993. Microfossils of the early Archean Apex Chert: New evidence of the
antiquity of life. Science, 260, 640-646.
Schwaber, M. J., Navon-Venezia, S., Schwartz, D. & Carmeli, Y. 2005. High levels of
antimicrobial coresistance among extended-spectrum-β-lactamase-producing
Enterobacteriaceae. Antimicrobial Agents and Chemotherapy, 49, 2137-2139.
Scoulica, E. V., Neonakis, I. K., Gikas, A. I. & Tselentis, Y. J. 2004. Spread of blaVIM-1-
producing E. coli in a university hospital in Greece. Genetic analysis of the integron
carrying the blaVIM-1 metallo-β-lactamase gene. Diagnostic Microbiology and
Infectious Disease, 48, 167-172.
Seecoomar, G. D., Marmol, B. C. & Kwon, D. H. 2013. Promoter deletions of Klebsiella
pneumoniae carbapenemase (KPC)-encoding genes (blaKPC-2) and efflux pump
(AcrAB) on β-lactam susceptibility in KPC-producing Enterobacteriaceae. FEMS
Microbiology Letters, 348, 120-6.
Sengupta, M. & Austin, S. 2011. Prevalence and significance of plasmid maintenance
functions in the virulence plasmids of pathogenic bacteria. Infection and Immunity, 79,
2502-2509.
Seppälä, H., Klaukka, T., Vuopio-Varkila, J., Muotiala, A., Helenius, H., Lager, K. &
Huovinen, P. 1997. The effect of changes in the consumption of macrolide antibiotics
on erythromycin resistance in group a streptococci in Finland. New England Journal
of Medicine, 337, 441-446.
Shaheen, B. W., Nayak, R., Foley, S. L., Kweon, O., Deck, J., Park, M., Rafii, F. & Boothe, D.
M. 2011. Molecular characterization of resistance to extended-spectrum
cephalosporins in clinical Escherichia coli Isolates from companion animals in the
United States. Antimicrobial Agents and Chemotherapy, 55, 5666-5675.
Sharan, S. K., Thomason, L. C., Kuznetsov, S. G. & Court, D. L. 2009. Recombineering: a
homologous recombination-based method of genetic engineering. Nature Protocols, 4,
206-223.

261
Shields, R. K., Nguyen, M. H., Potoski, B. A., Press, E. G., Chen, L., Kreiswirth, B. N.,
Clarke, L. G., Eschenauer, G. A. & Clancy, C. J. 2015. Doripenem MICs and ompK36
porin genotypes of sequence type 258, KPC-producing Klebsiella pneumoniae may
predict responses to carbapenem-colistin combination therapy among patients with
bacteremia. Antimicrobial Agents and Chemotherapy, 59, 1797-1801.
Sinha, R. P. & Iyer, V. N. 1971. Competence for genetic transformation and the release of
DNA from Bacillus subtilis. Biochimica et Biophysica Acta (BBA) - Nucleic Acids and
Protein Synthesis, 232, 61-71.
Smith, H. E. & Blair, J. M. A. 2014. Redundancy in the periplasmic adaptor proteins AcrA
and AcrE provides resilience and an ability to export substrates of multidrug efflux.
Journal of Antimicrobial Chemotherapy, 69, 982-987.
Smith, M. A. & Bidochka, M. J. 1998. Bacterial fitness and plasmid-loss: The importance of
culture conditions and plasmid size. Canadian Journal of Microbiology, 44, 351-355.
Spellberg, B., Powers, J. H., Brass, E. P., Miller, L. G. & Edwards Jr, J. E. 2004. Trends in
antimicrobial drug development: Implications for the future. Clinical Infectious
Diseases, 38, 1279-1286.
Spratt, B. G. 1975. Distinct penicillin binding proteins involved in the division, elongation,
and shape of Escherichia coli K12. Proceedings of the National Academy of Sciences
of the United States of America, 72, 2999-3003.
Sreevatsan, S., Pan, X., Stockbauer, K. E., Williams, D. L., Kreiswirth, B. N. & Musser, J. M.
1996. Characterization of rpsL and rrs mutations in streptomycin-resistant
Mycobacterium tuberculosis isolates from diverse geographic localities. Antimicrobial
Agents and Chemotherapy, 40, 1024-1026.
Stapleton, P., Shannon, K. & Phillips, I. 1995. The ability of β-lactam antibioties to select
mutants with derepressed β-lactamase synthesis from Citrobacter freundii. Journal of
Antimicrobial Chemotherapy, 36, 483-496.
Stone, B. J. & Miller, V. L. 1995. Salmonella enteritidis has a homologue of tolC that is
required for virulence in BALB/c mice. Molecular microbiology, 17, 701-12.
Stover, C. K., Pham, X. Q., Erwin, A. L., Mizoguchi, S. D., Warrener, P., Hickey, M. J.,
Brinkman, F. S. L., Hufnagle, W. O., Kowalik, D. J., Lagrou, M., Garber, R. L.,
Goltry, L., Tolentino, E., Westbrock-Wadman, S., Yuan, Y., Brody, L. L., Coulter, S.
N., Folger, K. R., Kas, A., Larbig, K., Lim, R., Smith, K., Spencer, D., Wong, G. K. S.,
Wu, Z., Paulsen, I. T., Reizer, J., Saier, M. H., Hancock, R. E. W., Lory, S. & Olson,

262
M. V. 2000. Complete genome sequence of Pseudomonas aeruginosa PAO1, an
opportunistic pathogen. Nature, 406, 959-964.
Symmons, M. F., Bokma, E., Koronakis, E., Hughes, C. & Koronakis, V. 2009. The
assembled structure of a complete tripartite bacterial multidrug efflux pump.
Proceedings of the National Academy of Sciences, 106, 7173-7178.
Szabó, D., Silveira, F., Hujer, A. M., Bonomo, R. A., Hujer, K. M., Marsh, J. W., Bethel, C.
R., Doi, Y., Deeley, K. & Paterson, D. L. 2006. Outer membrane protein changes and
efflux pump expression together may confer resistance to ertapenem in Enterobacter
cloacae. Antimicrobial Agents and Chemotherapy, 50, 2833-2835.
Tang, H. J., Chen, Y. T., Chiang, T., Fung, C. P., Chuang, Y. C. & Kristopher Siu, L. 2014.
Identification of the first imported KPC-3 Klebsiella pneumoniae from the USA to
Taiwan. International Journal of Antimicrobial Agents, 44, 431-435.
Thanassi, D. G., Cheng, L. W. & Nikaido, H. 1997. Active efflux of bile salts by Escherichia
coli. Journal of Bacteriology, 179, 2512-2518.
Thomas, J. R., Denap, J. C. B., Wong, M. L. & Hergenrother, P. J. 2005. The relationship
between aminoglycosides' RNA binding proclivity and their antiplasmid effect on an
IncB plasmid. Biochemistry, 44, 6800-6808.
Thomson, K. S. 2010. Extended-spectrum-β-lactamase, AmpC, and carbapenemase issues.
Journal of Clinical Microbiology, 48, 1019-1025.
Tijet, N., Macmullin, G., Lastovetska, O., Vermeiren, C., Wenzel, P., Stacey-Works, T., Low,
D. E., Patel, S. N. & Melano, R. G. 2013. Verona integron-encoded metallo-β-
lactamase 1 in Enterobacteria, Ontario, Canada. Emerging Infectious Diseases, 19,
1156-1158.
Timmerman, T., Dewulf, J., Catry, B., Feyen, B., Opsomer, G., Kruif, A. D. & Maes, D. 2006.
Quantification and evaluation of antimicrobial drug use in group treatments for
fattening pigs in Belgium. Preventive Veterinary Medicine, 74, 251-263.
Tipper, D. J. & Stroming, J. L. 1965. Mechanism of action of penicillins - a proposal based on
their structural similarity to acyl-D-alanyl-D-alanine. Proceedings of the National
Academy of Sciences of the United States of America, 54, 1133-1141.
Tsai, Y. K., Fung, C. P., Lin, J. C., Chen, J. H., Chang, F. Y., Chen, T. L. & Siu, L. K. 2011.
Klebsiella pneumoniae outer membrane porins OmpK35 and OmpK36 play roles in
both antimicrobial resistance and virulence. Antimicrobial Agents and Chemotherapy,
55, 1485-1493.

263
Tuomanen, E., Gilbert, K. & Tomasz, A. 1986. Modulation of bacteriolysis by cooperative
effects of penicillin-binding protein-1a and -3 in Escherichia coli. Antimicrobial
Agents and Chemotherapy, 30, 659-663.
Turnidge, J., Kahlmeter, G. & Kronvall, G. 2006. Statistical characterisation of bacterial wild-
type MIC value distributions and the determination of epidemiological cut-off values.
Clinical Microbiology and Infection, 12, 418-425.
Tzouvelekis, L. S., Miriagou, V., Kotsakis, S. D., Spyridopoulou, K., Athanasiou, E.,
Karagouni, E., Tzelepi, E. & Daikos, G. L. 2013. KPC-producing, multidrug-resistant
Klebsiella pneumoniae sequence type 258 as a typical opportunistic pathogen.
Antimicrobial Agents and Chemotherapy, 57, 5144-5146.
Umesaki, Y., Setoyama, H., Matsumoto, S. & Okada, Y. 1993. Expansion of alpha-beta T-cell
receptor-bearing intestinal intraepithelial lymphocytes after microbial colonization in
germ-free mice and its independence from thymus. Immunology, 79, 32-37.
Van Bambeke, F., Pagès, J. M. & Lee, V. J. 2006. Inhibitors of bacterial efflux pumps as
adjuvants in antibiotic treatments and diagnostic tools for detection of resistance by
efflux. Recent patents on anti-infective drug discovery, 1, 157-175.
Van De Sande-Bruinsma, N., Grundmann, H., Verloo, D., Tiemersma, E., Monen, J.,
Goossens, H., Ferech, M., Mittermayer, H., Metz, S., Koller, W., Hendrickx, E.,
Markova, B., Tambic-Andrasevic, A., Francetic, I., Kalenic, S., Bagatzouni, D.,
Dvorak, P., Urbaskova, P., Monnet, D., Anker Nielsen, A., Naaber, P., Huovinen, P.,
Paakkari, P., Lyytikainen, O., Nissinen, A., Maugendre, P., Guillemot, D., Coignard,
B., Jarlier, V., Kern, W., Schroeder, H., Witte, W., Heckenbach, K., Giamarellou, H.,
Antoniadou, A., Tsakris, A., Vatopoulos, A., Ternak, G., Fuzi, M., Kristinsson, K.,
Smyth, E., Cunney, R., Igoe, D., Murphy, O., Raz, R., Cornaglia, G., Pantosti, A.,
D'ancona, P., Berzina, S., Balode, A., Valenteliene, R., Miciulevicience, J., Hemmer,
R., Bruch, M., Borg, M., Zarb, P., Janknegt, R., Filius, M., De Neeling, H., Tiemermsa,
E., Degener, J., Salvesen Blix, H., Hoiby, A., Simonsen, G., Hryniewicz, W.,
Grzesiowski, P., Caldeira, L., Canica, M., Codita, I., Foltan, V., Tesar, T., Langsadl,
L., Cizman, M., Mueller-Premru, M., Kolman, J., Campos, J., Baquero, F., Cars, O.,
Skoog, G., Liljequist, B., Kahlmeter, G., Unal, S., Gür, D., Davey, P., Johnson, A.,
Hill, R., Hughes, H. & Coyne, M. 2008. Antimicrobial drug use and resistance in
Europe. Emerging Infectious Diseases, 14, 1722-1730.

264
Villa, L., Capone, A., Fortini, D., Dolejska, M., Rodri'guez, I., Taglietti, F., De Paolis, P.,
Petrosillo, N. & Carattoli, A. 2013. Reversion to susceptibility of a carbapenem-
resistant clinical isolate of Klebsiella pneumoniae producing KPC-3. Journal of
Antimicrobial Chemotherapy, 68, 2482-2486.
Visalli, M. A., Murphy, E., Projan, S. J. & Bradford, P. A. 2003. AcrAB multidrug efflux
pump is associated with reduced levels of susceptibility to tigecycline (GAR-936) in
Proteus mirabilis. Antimicrobial Agents and Chemotherapy, 47, 665-669.
Voulgari, E., Zarkotou, O., Ranellou, K., Karageorgopoulos, D. E., Vrioni, G., Mamali, V.,
Themeli-Digalaki, K. & Tsakris, A. 2013. Outbreak of OXA-48 carbapenemase-
producing Klebsiella pneumoniae in Greece involving an ST11 clone. Journal of
Antimicrobial Chemotherapy, 68, 84-88.
Waksman, S. A. 1973. History of the word ‘Antibiotic’. Journal of the History of Medicine
and Allied Sciences, XXVIII, 284-286.
Wand, M. E., Mccowen, J. W. I., Nugent, P. G. & Sutton, J. M. 2013. Complex interactions
of Klebsiella pneumoniae with the host immune system in a Galleria mellonella
infection model. Journal of Medical Microbiology, 62, 1790-1798.
Wang, Z., Xiang, L., Shao, J., Wegrzyn, A. & Wegrzyn, G. 2006. Effects of the presence of
ColE1 plasmid DNA in Escherichia coli on the host cell metabolism. Microbial Cell
Factories, 5, 34.
Wanner, B. L., Gottesman, M. & Gottesman, M. 1983. Overlapping and separate controls on
the phosphate regulon in Escherichia coli K12. Journal of Molecular Biology, 166,
283-308.
Warming, S., Costantino, N., Court, D. L., Jenkins, N. A. & Copeland, N. G. 2005. Simple
and highly efficient BAC recombineering using galK selection. Nucleic Acids
Research, 33, 1-12.
Webber, M. & Coldham, N. 2010. Measuring the activity of active efflux in Gram-negative
bacteria. In: GILLESPIE, S. H. & MCHUGH, T. D. (eds.) Antibiotic Resistance
Protocols. Humana Press.
Webber, M. A., Bailey, A. M., Blair, J. M. A., Morgan, E., Stevens, M. P., Hinton, J. C. D.,
Ivens, A., Wain, J. & Piddock, L. J. V. 2009. The global consequence of disruption of
the AcrAB-TolC efflux pump in Salmonella enterica includes reduced expression of
SPI-1 and other attributes required to infect the host. Journal of Bacteriology, 191,
4276-4285.

265
Wei, Y., Havasy, T., Mcpherson, D. C. & Popham, D. L. 2003. Rod shape determination by
the Bacillus subtilis Class B penicillin-binding proteins encoded by pbpA and pbpH.
Journal of Bacteriology, 185, 4717-4726.
Weindorf, H., Schmidt, H. & Martin, H. H. 1998. Contribution of overproduced chromosomal
β-lactamase and defective outer membrane porins to resistance to extended-spectrum
β-lactam antibiotics in Serratia marcescens. Journal of Antimicrobial Chemotherapy,
41, 189-195.
WHO. 2011. World Health Statistics [Online]. Geneva: World Health Organization. Available:
http://www.who.int/whosis/whostat/EN_WHS2011_Full.pdf [Accessed 14th June
2015].
WHO. 2014. Antimicrobial Resistance - Global Report on Surveillance [Online]. France:
World health Organization. Available:
http://apps.who.int/iris/bitstream/10665/112642/1/9789241564748_eng.pdf [Accessed
14th June 2015].
Williams, J. J. & Hergenrother, P. J. 2008. Exposing plasmids as the Achilles' heel of drug-
resistant bacteria. Current Opinion in Chemical Biology, 12, 389-399.
Willmott, C. J. R. & Maxwell, A. 1993. A single point mutation in the DNA gyrase A protein
greatly reduces binding of fluoroquinolones to the gyrase-DNA complex.
Antimicrobial Agents and Chemotherapy, 37, 126-127.
Wolter, D. J., Hanson, N. D. & Lister, P. D. 2004. Insertional inactivation of oprD in clinical
isolates of Pseudomonas aeruginosa leading to carbapenem resistance. FEMS
Microbiology Letters, 236, 137-143.
Woo, P. C. Y., To, A. P. C., Lau, S. K. P. & Yuen, K. Y. 2003. Facilitation of horizontal
transfer of antimicrobial resistance by transformation of antibiotic-induced cell-wall-
deficient bacteria. Medical Hypotheses, 61, 503-508.
Woodford, N., Dallow, J. W. T., Hill, R. L. R., Palepou, M. F. I., Pike, R., Ward, M. E.,
Warner, M. & Livermore, D. M. 2007. Ertapenem resistance among Klebsiella and
Enterobacter submitted in the UK to a reference laboratory. International Journal of
Antimicrobial Agents, 29, 456-459.
Woodford, N., Tierno, P. M., Young, K., Tysall, L., Palepou, M.-F. I., Ward, E., Painter, R. E.,
Suber, D. F., Shungu, D., Silver, L. L., Inglima, K., Kornblum, J. & Livermore, D. M.
2004. Outbreak of Klebsiella pneumoniae producing a new carbapenem-hydrolyzing

266
class A β-lactamase, KPC-3, in a New York Medical Center. Antimicrobial Agents
and Chemotherapy, 48, 4793-4799.
Yamaguchi, Y. & Inouye, M. 2011. Regulation of growth and death in Escherichia coli by
toxin–antitoxin systems. Nature Reviews Microbiology, 9, 779-790.
Yamamoto, T., Takano, T., Iwao, Y. & Hishinuma, A. 2011. Emergence of NDM-1-positive
capsulated Escherichia coli with high resistance to serum killing in Japan. Journal of
Infection and Chemotherapy, 17, 435-439.
Yang, F. C., Yan, J. J., Hung, K. H. & Wu, J. J. 2012. Characterization of ertapenem-resistant
Enterobacter cloacae in a Taiwanese University Hospital. Journal of Clinical
Microbiology, 50, 223-226.
Yang, Y. J., Bhachech, N. & Bush, K. 1995. Biochemical comparison of imipenem,
meropenem and biapenem: permeability, binding to penicillin-binding proteins, and
stability to hydrolysis by β-lactamases. Journal of Antimicrobial Chemotherapy, 35,
75-84.
Yaron, S., Kolling, G. L., Simon, L. & Matthews, K. R. 2000. Vesicle-mediated transfer of
virulence genes from Escherichia coli O157:H7 to other enteric bacteria. Applied and
Environmental Microbiology, 66, 4414-4420.
Yigit, H., Queenan, A. M., Anderson, G. J., Domenech-Sanchez, A., Biddle, J. W., Steward,
C. D., Alberti, S., Bush, K. & Tenover, F. C. 2001. Novel carbapenem-hydrolyzing β-
lactamase, KPC-1, from a carbapenem-resistant strain of Klebsiella pneumoniae.
Antimicrobial Agents and Chemotherapy, 45, 1151-1161.
Yigit, H., Queenan, A. M., Anderson, G. J., Domenech-Sanchez, A., Biddle, J. W., Steward,
C. D., Alberti, S., Bush, K. & Tenover, F. C. 2008. Novel carbapenem-hydrolyzing β-
lactamase, KPC-1, from a carbapenem-resistant strain of Klebsiella pneumoniae.
Antimicrobial Agents and Chemotherapy, 52, 809.
Yoneyama, H. & Katsumata, R. 2006. Antibiotic resistance in bacteria and its future for novel
antibiotic development. Bioscience Biotechnology and Biochemistry, 70, 1060-1075.
Yoneyama, H. & Nakae, T. 1993. Mechanism of efficient elimination of protein D2 in outer
membrane of imipenem-resistant Pseudomonas aeruginosa. Antimicrobial Agents and
Chemotherapy, 37, 2385-2390.
Yong, D., Toleman, M. A., Giske, C. G., Cho, H. S., Sundman, K., Lee, K. & Walsh, T. R.
2009. Characterization of a new metallo-β-lactamase gene, blaNDM-1, and a novel
erythromycin esterase gene carried on a unique genetic structure in Klebsiella

267
pneumoniae sequence type 14 from India. Antimicrobial Agents and Chemotherapy,
53, 5046-5054.
Yoshida, T. 1980. Structural requirements for antibacterial activity and β-lactamase stability
of 7β-arylmalonylamino-7α-methoxy-1 -oxacephems. Philosophical Transactions of
the Royal Society of London. Series B, Biological Sciences, 289, 231-237.
Yoshimura, F. & Nikaido, H. 1985. Diffusion of β-lactam antibiotics through the porin
channels of Escherichia coli K-12. Antimicrobial Agents and Chemotherapy, 27, 84-
92.
Younes, H., Coudray, C., Bellanger, J., Demigne, C., Rayssiguier, Y. & Remesy, C. 2001.
Effects of two fermentable carbohydrates (inulin and resistant starch) and their
combination on calcium and magnesium balance in rats. British Journal of Nutrition,
86, 479-485.
Zalewska-Piątek, B., Wilkanowicz, S., Bruździak, P., Piątek, R. & Kur, J. 2013. Biochemical
characteristic of biofilm of uropathogenic Escherichia coli Dr+ strains.
Microbiological Research, 168, 367-378.
Zaslaver, A., Mayo, A. E., Rosenberg, R., Bashkin, P., Sberro, H., Tsalyuk, M., Surette, M. G.
& Alon, U. 2004. Just-in-time transcription program in metabolic pathways. Nature
Genetics, 36, 486-491.
Zavascki, A. P., Falci, D. R., Da Silva, R. C. F., Dalarosa, M. G., Ribeiro, V. B., Rozales, F.
P., Luz, D. I., Magagnin, C. M., Vieira, F. J., Sampaio, J. M. & Barth, A. L. 2014.
Heteroresistance to carbapenems in New Delhi metallo-β-lactamase-1-producing
isolates: A challenge for detection? Infection Control and Hospital Epidemiology, 35,
751-752.
Zavascki, A. P., Machado, A. B. M. P., De Oliveira, K. R. P., Superti, S. V., Pilger, D. A.,
Cantarelli, V. V., Pereira, P. R., Lieberkmecht, A. C. & Barth, A. L. 2009. KPC-2-
producing Enterobacter cloacae in two cities from Southern Brazil. International
Journal of Antimicrobial Agents, 34, 286-288.
Zhang, W., Robertson, D. C., Zhang, C., Bai, W., Zhao, M. & Francis, D. H. 2008.
Escherichia coli constructs expressing human or porcine enterotoxins induce identical
diarrheal diseases in a piglet infection model. Applied and Environmental
Microbiology, 74, 5832-5837.

268
Zilberberg, M., Shorr, A., Micek, S., Vazquez-Guillamet, C. & Kollef, M. 2014. Multi-drug
resistance, inappropriate initial antibiotic therapy and mortality in Gram-negative
severe sepsis and septic shock: a retrospective cohort study. Critical Care, 18, 596.
Zünd, P. & Lebek, G. 1980. Generation time-prolonging R plasmids: Correlation between
increases in the generation time of Escherichia coli caused by R plasmids and their
molecular size. Plasmid, 3, 65-69.