the blood vessels and blood pressurejkeener/hlth2040-1-su2012/pwreadings/pdf/4-5.pdf · Δpis...
TRANSCRIPT

Chapter 10
The Blood Vessels and
Blood Pressure

Fig. 10-1, p. 262
20%
100% Lungs
Left side of heartRight side of heart
Digestive system
(Hepatic portal system)
Liver
Kidneys
Skin
Brain
Heart muscle
Skeletal muscle
Bone
Other8%
5%
15%
3%
10%
13%
20%
6%
Regulate a constant mean arterial pressure to distribute the blood flow by alterations in resistance to flow in each branch of the systemic circulation.
Distribute flow given to a circuit by altering resistance in smaller metarterioles that distribute to specific capillary beds
Tissues receive blood in proportion to their oxygen requirement as opposed to their weight

Flow is directly proportional to pressure difference and inversely proportional to resistance. Resistance is proportional to difference in radius4. If radius double from 1 to 2, resistance changes 24. If radius
triples from 1 to 3, resistance changes 34
Blood Flow
• Flow rate through a vessel:
– Directly proportional to the pressure gradient
– Inversely proportional to vascular resistance
F = ΔPR
F = flow rate of blood through a vessel
ΔP = pressure gradient
R = resistance of blood vessels

F = ΔPR
F = flow rate of blood through a vessel Cardiac Output (Qc)
ΔP = pressure gradient Mean Arterial Pressure (MAP)
R = resistance of blood vessels Total Systemic Peripheral Resistance (TsPR)
MAP = CO x TsPR
MAP = HR x SV x TsPR
MAP = HR x (EDV‐ESV) x TsPR
EDV is dependent upon adequate VENOUS RETURN
ESV is dependent upon level of catecholamines arriving from sympathetic neurons and adrenal medulla
CO = VR because heart cannot pump out blood that is not there
Flow of fluids through tubes is fluid dynamics. Flow of blood through arterial vessels is hemodynamics. Same equations and principles govern each
ΔΔPPRR
F =F =
ΔP is Pressure gradient is pressure difference between beginning and end of a vessel
Blood flows from area of higher pressure to area of lower pressure

50 mm Hgpressure
90 mm Hgpressure
(a) Comparison of flow rate in vessels with a different ∆P
10 mm Hgpressure
10 mm Hgpressure
∆P = 40 mm HgVessel A
∆P = 80 mm HgVessel B
∆P in vessel B = 2 times that of vessel A
Flow in vessel B = 2 times that of vessel A
Flow ∆P
Fig. 10-2a, p. 263
90 mm Hgpressure
180 mm Hgpressure
(b) Comparison of flow rate in vessels withthe same ∆P
10 mm Hgpressure
100 mm Hgpressure
∆P = 80 mm HgVessel B
∆P = 80 mm HgVessel C
∆P in vessel C = the same as that of vessel B, despite the larger absolute values
Flow in vessel C = the same as that of vessel B
Flow ∆P
Fig. 10-2b, p. 263

Flow of fluids through tubes is fluid dynamics. Flow of blood through arterial vessels is hemodynamics. Same equations and principles govern each
•• Resistance Resistance is measure of opposition of blood flow through a vessel
– Depends on 3 things:
• Blood viscosity
• Vessel length
• Vessel radium– Major determinant of resistance to flow is vessel’s radiusradius
– Slight change in radius produces significant change in blood flow
• R is proportional to 1r4
ΔΔPPRR
F =F =
Fig. 10-3b, p. 263
•Resistance ∝ 1/r 4 so at any P Flow ∝ r 4
Vessel A
Vessel B
Samepressuregradient
Radius in vessel B = 2 times that ofvessel 1
•Resistance in vessel B = 1/24 = 1/16 that of vessel A
•Flow in vessel B = 16 times that of vessel A at same P
(b) Influence of vessel radius on resistance and flow
Radius may quadruple
Increase 4x
= 44 =1/256 resistance or 256x more flow
AT SAME P

Fig. 10-1, p. 262
20%
100% Lungs
Left side of heartRight side of heart
Digestive system
(Hepatic portal system)
Liver
Kidneys
Skin
Brain
Heart muscle
Skeletal muscle
Bone
Other8%
5%
15%
3%
10%
13%
20%
6%
Flow = P/R
= MAP/resistance of system’s arterioles ………= 100mmHg/Resistance in “systemic circuit”
RR
What is resting cardiac output ? ______
What % of resting cardiac output goes to kidneys? __
What is actual liters of blood flow to kidney, per minute ? _____ x _______ = ______ liters per min
Kidney Flow 1 liter/minute = P/ Kidney Resistance
Kidney Flow 1 liter/minute = 100mmHg/ ___ Kidney Resistance Units
Kidney Resistance = ______ Resistance Units
55
20%20%
20%20%55 11
100100
100100
Fig. 10-1, p. 262
21%
100% Lungs
Left side of heartRight side of heart
Digestive system
(Hepatic portal system)
Liver
Kidneys
Skin
Brain
Heart muscle
Skeletal muscle
Bone
Other8%
5%
15%
3%
9%
13%
20%
6%
Flow = P/R
= MAP/resistance of system’s arterioles
MAP = 100mmHg, what is resistance in Bone’s arterioles ?
5% of CO = 5% of 5 liters = 0.25 liter
0.25liters = 100mmHg/resistance
Resistance in renal arterioles = 400 resistance units
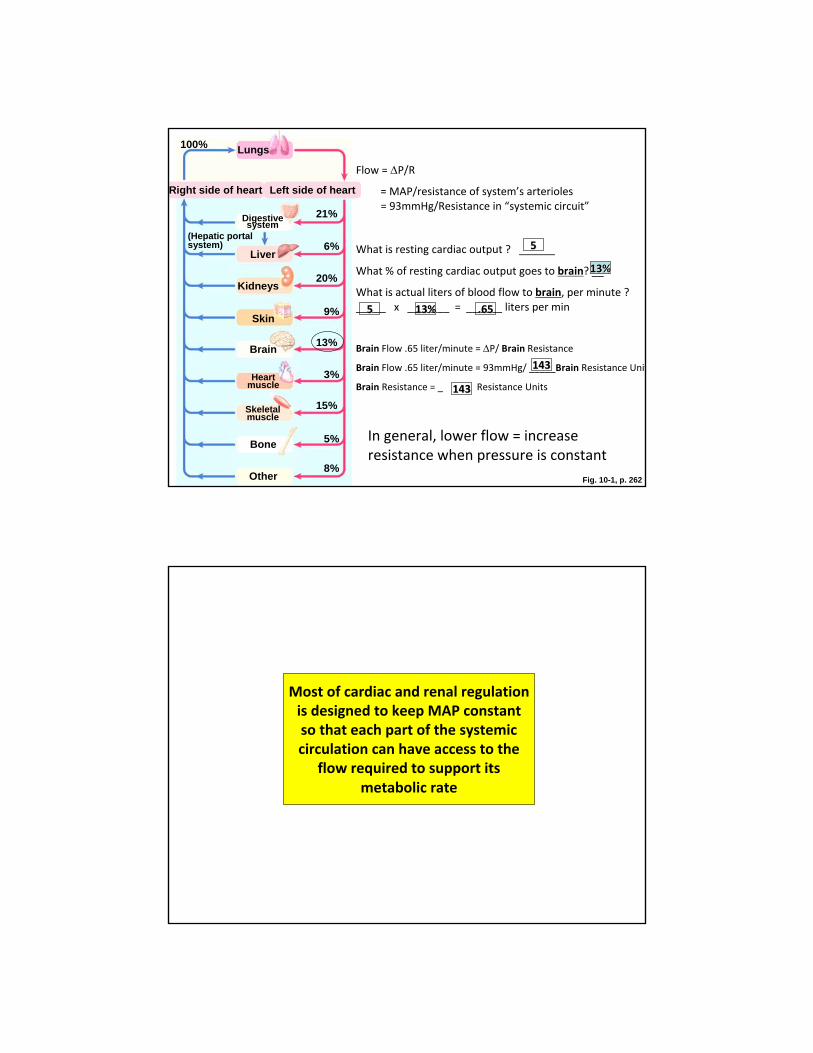
Fig. 10-1, p. 262
21%
100% Lungs
Left side of heartRight side of heart
Digestive system
(Hepatic portal system)
Liver
Kidneys
Skin
Brain
Heart muscle
Skeletal muscle
Bone
Other8%
5%
15%
3%
9%
13%
20%
6%
Flow = P/R
= MAP/resistance of system’s arterioles ………………= 93mmHg/Resistance in “systemic circuit”
What is resting cardiac output ? ______
What % of resting cardiac output goes to brain? __
What is actual liters of blood flow to brain, per minute ? _____ x _______ = ______ liters per min
Brain Flow .65 liter/minute = P/ Brain Resistance
Brain Flow .65 liter/minute = 93mmHg/ _____Brain Resistance Unit
Brain Resistance = _ Resistance Units
55
13%13%
13%13%55 .65.65
143143
143143
In general, lower flow = increase resistance when pressure is constant
Most of cardiac and renal regulation is designed to keep MAP constant so that each part of the systemic circulation can have access to the
flow required to support its metabolic rate

Vascular Tree
• Closed system of vessels• Consists of
– Arteries• Carry blood away from heart to tissues
– Arterioles• Smaller branches of arteries that serve as RESISTANCE VESSELS
– Capillaries• Smaller branches of arterioles• Smallest of vessels across which all exchanges are made with
surrounding cells– Venules
• Formed when capillaries rejoin• Return blood to heart
– Veins• Formed when venules merge• Serve as CAPACITANCE VESSELS• Return blood to heart
Fig. 10-4, p. 264
Smaller arteries branching off to supply various tissues
Lungs
Airway
Air sac
Tissues
PULMONARYCIRCULATION
Pulmonarycapillaries
Pulmonaryartery
Systemicveins
Arterioles
Venules
Venules
Arterioles
Pulmonaryveins
Aorta(majorsystemicartery)
SYSTEMICCIRCULATION
Systemiccapillaries
For simplicity, onlytwo capillary beds withintwo organs are illustrated.

Arteries
• Specialized to
– Serve as rapid‐transit passageways for blood from heart to organs
• Due to large radius, arteries offer little resistance to blood flow
– Act as pressure reservoir to provide driving force for blood when heart is relaxing
• Arterial connective tissue contains
– Collagen fibers
» Provide tensile strength
– Elastin fibers
» Provide elasticity to arterial walls
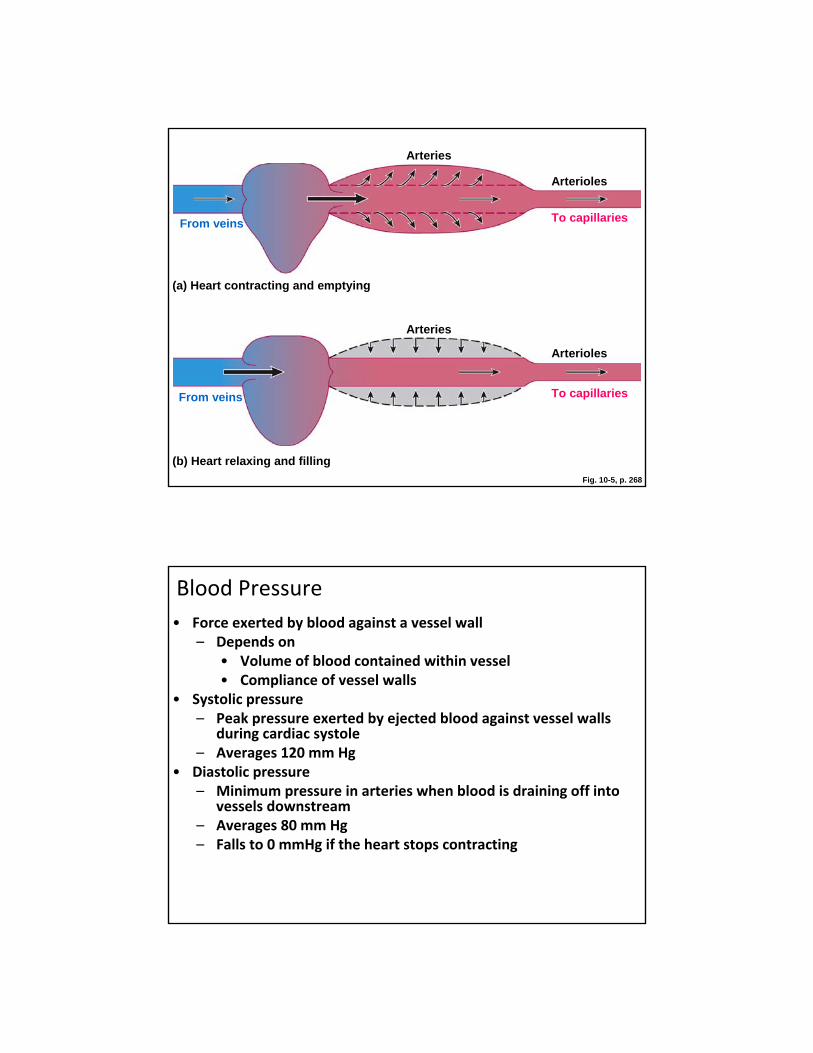
Arteries
Arterioles
To capillaries
To capillaries
Arterioles
(a) Heart contracting and emptying
(b) Heart relaxing and filling
From veins
From veins
Arteries
Fig. 10-5, p. 268
Blood Pressure
• Force exerted by blood against a vessel wall– Depends on
• Volume of blood contained within vessel• Compliance of vessel walls
• Systolic pressure – Peak pressure exerted by ejected blood against vessel walls
during cardiac systole– Averages 120 mm Hg
• Diastolic pressure– Minimum pressure in arteries when blood is draining off into
vessels downstream– Averages 80 mm Hg– Falls to 0 mmHg if the heart stops contracting

Blood Pressure
• Can be measured indirectly using sphygmomanometer
• Korotkoff sounds
– Sounds heard when determining blood pressure
– Sounds are distinct from heart sounds associated with valve closure
Fig. 10-6, p. 267
Art
eria
l pre
ss
ure
(m
m H
g)
120
80
93
Pulsepressure
Meanpressure
Systolic pressure
Time (msec)
Diastolic pressure
Notch inpressurecurve causedby closureof aortic valve
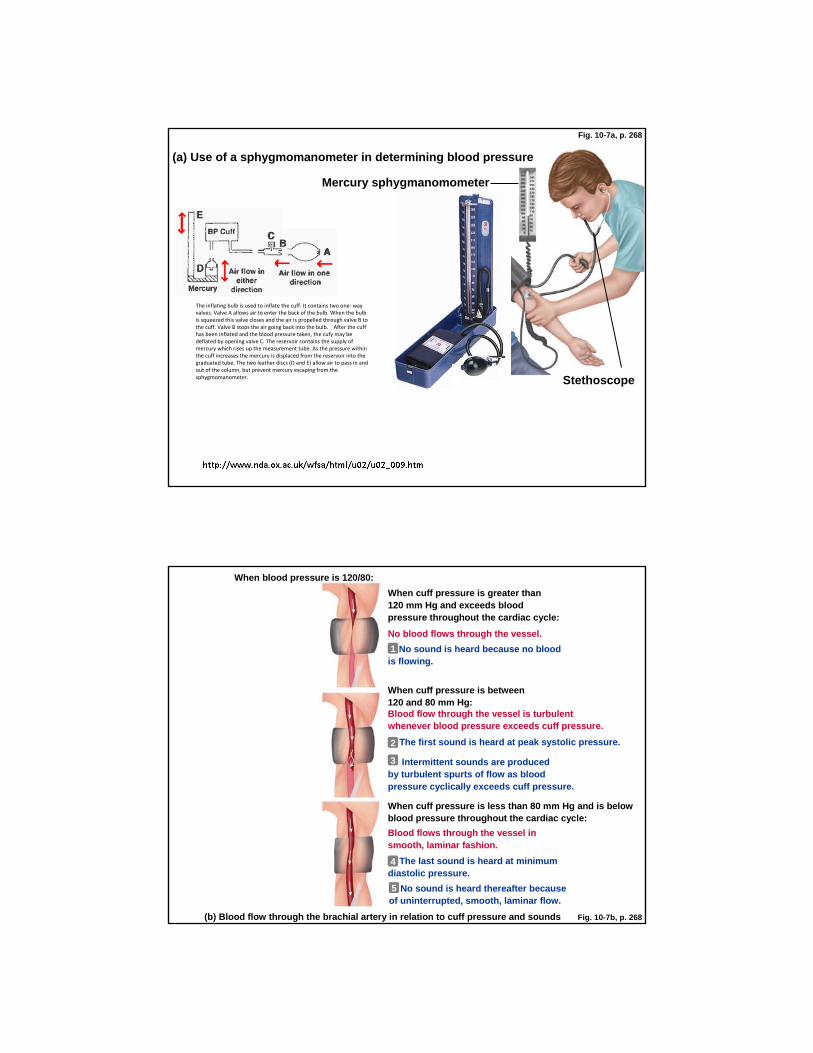
Stethoscope
(a) Use of a sphygmomanometer in determining blood pressure
Inflatablecuff
Mercury sphygmanomometer
Fig. 10-7a, p. 268
The inflating bulb is used to inflate the cuff. It contains two one‐ way valves. Valve A allows air to enter the back of the bulb. When the bulb is squeezed this valve closes and the air is propelled through valve B to the cuff. Valve B stops the air going back into the bulb. After the cuff has been inflated and the blood pressure taken, the cufy may be deflated by opening valve C. The reservoir contains the supply of mercury which rises up the measurement tube. As the pressure within the cuff increases the mercury is displaced from the reservoir into the graduated tube. The two leather discs (D and E) allow air to pass in and out of the column, but prevent mercury escaping from the sphygmomanometer.
(b) Blood flow through the brachial artery in relation to cuff pressure and sounds
When blood pressure is 120/80:
When cuff pressure is greater than120 mm Hg and exceeds bloodpressure throughout the cardiac cycle:
No blood flows through the vessel.
No sound is heard because no bloodis flowing.
When cuff pressure is between120 and 80 mm Hg:Blood flow through the vessel is turbulent whenever blood pressure exceeds cuff pressure.
2 The first sound is heard at peak systolic pressure.
3 Intermittent sounds are producedby turbulent spurts of flow as bloodpressure cyclically exceeds cuff pressure.
When cuff pressure is less than 80 mm Hg and is below blood pressure throughout the cardiac cycle:
Blood flows through the vessel insmooth, laminar fashion.
4 The last sound is heard at minimumdiastolic pressure.
5 No sound is heard thereafter becauseof uninterrupted, smooth, laminar flow.
Fig. 10-7b, p. 268
1
2
3
4
5

Cuff pressure Blood pressure
Fig. 10-7c, p. 268
Time
Pre
ssu
re (
mm
Hg
)
140
120
100
80
12
4 5
3
Pulse Pressure
• Pressure difference between systolic and diastolic pressure
• Example
– If blood pressure is 120/80, pulse pressure is 40 mm Hg (120mm Hg –80mm Hg)
• Pulse that can be felt in artery lying close to surface of skin is due to pulse pressure
• Pulse pressure reflects the amount of blood entering aorta and the rapidity that it runs off into the vessels of the peripheral circulation
– Increase systolic
1. Bigger stroke volume into a set of large distribution arteries = : (
2. Same stroke volume into a smaller, less elastic, calcified distribution arteries = : {
– Increased diastolic
1. Harder run off due to smaller or constricted arterial field
– Isometric skeletal muscle contraction = normal
– Calcified, non elastic arteries vessels = not normal

Mean Arterial Pressure
• Average pressure driving blood forward into tissues throughout cardiac cycle
• Formula for approximating mean arterial pressure:
Mean arterial pressure =
diastolic pressure + ⅓ pulse pressure
At 120/80, mean arterial pressure =
80 mm Hg + ⅓ (40 mm Hg) = 93 mm Hg
During Rest, heart spends 2/3 time in disatole
1/3 time in systole, with pressure decreasing towards diastolic pressure
Fig. 10-1, p. 262
21%
100% Lungs
Left side of heartRight side of heart
Digestive system
(Hepatic portal system)
Liver
Kidneys
Skin
Brain
Heart muscle
Skeletal muscle
Bone
Other8%
5%
15%
3%
9%
13%
20%
6%
Flow = DP/R
= MAP/resistance of system’s arterioles ………………= 9393 mmHg/Resistance in “systemic circuit”
What is resting cardiac output ? 5 liters
What % of resting cardiac output goes to regional circuit? __
What is actual liters of blood flow to any regional circuit, perminute ? __%__ x 5 liters/min CO = ______ liters per min
Flow liter/minute = P/ Resistance
Flow liter/minute = 93mmHg/ Resistance Units
Resistance Units = Liters/min/93mmHg
In general, lower flow = increase resistance when pressure is constant