the boston fed study of consumer behavior and …...no. 07‐1 the boston fed study of consumer...
TRANSCRIPT

No. 07‐1 The Boston Fed Study of Consumer Behavior and Payment Choice:
A Survey of Federal Reserve System Employees Marques Benton, Krista Blair, Marianne Crowe, and Scott Schuh
Abstract: The way people pay for goods and services is changing dramatically, but little data and research on consumer behavior and payment choice are publicly available. This paper describes the results of a survey of payment behavior and attitudes taken by Federal Reserve employees in 2004. Major contributions of the survey are that it asks: 1) why payment choices are made; 2) why individual payment behavior has changed; and 3) why individual‐specific payment characteristics matter for payment choice. Although the survey is not statistically representative of U.S. consumers, and thus may not provide accurate estimates of aggregate U.S. payment trends, many results are consistent with data from more representative payment surveys. For example, the data show a trend away from check‐writing and toward electronic and emerging payment methods, but the choice of payment method depends on the type of payment, amount of payment, and other complex factors. Also, cost, convenience, and control over timing are the most important characteristics determining respondents’ adoption and use of payment methods. We find that payment characteristics vary widely across respondents, partly because of inherent heterogeneity but perhaps also because of measurement error, misperception, or inadequate information (lack of consumer education). Cross‐sectional evidence shows that respondents tend to use payment methods in a manner broadly consistent with their reported assessments of the payment characteristics.
JEL Classifications: D12, D14, E41, C81 Marques Benton and Krista Blair are Assistant Vice Presidents, Marianne Crowe is a Vice President, and Scott Schuh is a Senior Economist and Policy Advisor, all at the Federal Reserve Bank of Boston. Their e‐mail addresses are [email protected], [email protected], [email protected], and [email protected], respectively.
This project sprang from a leadership development program at the Federal Reserve Bank of Boston. The authors thank our colleague, Geoff Tootell, whose suggestions, together with the research of our colleague Joanna Stavins (2001), helped spark the idea of the consumer payment survey and who was instrumental in helping us develop the idea. We thank Jeff Fuhrer and Sally Green for sponsoring the survey project. We also thank Pattie Allouise, David Brown, David DeRemer, Nicola Lostumbo, Caroline Theoharides, Marcella Wiegand, Lisa Wright, and Jennifer Young for providing excellent research, administrative, and legal assistance. We thank Jim Cunha, Jeff Fuhrer, Geoff Gerdes, Jane Little, and Geoff Tootell for helpful comments and suggestions, and Brad Hirschbein, Suzanne Lorant, and Tyler Williams for valuable editorial assistance. See Appendix B for complete acknowledgments. Any errors remain the responsibility of the authors.
The views expressed in this paper are those of the authors and not necessarily the views of the Federal Reserve Bank of Boston or the Federal Reserve System.
This paper, which may be revised, is available on the web site of the Federal Reserve Bank of Boston at http://www.bos.frb.org/economic/ppdp/index.htm.
This version: February 14, 2007
1

1. Introduction
The way people pay for goods and services is changing dramatically. Evidence—
including new results from a Boston Fed survey reported in this paper—is accumulating that
consumers are making substantially different choices among payment methods to settle their
transactions than in the past. Apparently, consumers are shifting away from paper checks and
currency and turning instead to “electronics,” an expanding array of methods that leverage
advances in information technology and financial markets to offer low‐cost transactions and
improved convenience.1 Even the British version of the classic Monopoly® board game has
switched from cash to a debit card.2
Perhaps the most tangible change in payment behavior is occurring in the use of paper
checks, a change that directly affects a central business concern of the Federal Reserve System.
Figure 1 depicts the available data on check volumes. The upper panel shows the latest official
Fed estimates of the total U.S. volume of check payments, which are available only at four
selected points in time.3 The estimates reveal a decline in check volume from 50 billion in 1995
to 42 billion in 2000 and to 37 billion in 2003 (26 percent overall). The first evidence of decline
was announced when the estimates for 1995 and 2000 were published in 2002 by Gerdes and
Walton (2002, p. 360): “The exact year in which check use peaked is unknown, but it appears the
number paid began to decline sometime in the mid‐1990s.” The relative scarcity of reliable,
publicly available data on check volumes prior to 2000 made it difficult to know and
understand completely the aggregate trend, much less the underlying consumer payment
1 Note that the use of the term “paper check” to distinguish traditional check‐writing from “electronic” forms of checking—such as electronic images of paper checks, paper checks initiated electronically through online bill payment, or conversion of paper checks to electronic debit via the Automated Clearing House (ACH) system—illustrates our point nicely. 2 See Henry (2006) at http://www.boston.com/news/local/massachusetts/articles/2006/07/25/new_monopoly_version_drops_paper_money_adds_debit_card/ . 3 Actual survey data estimates are from Federal Reserve Bank of Atlanta (1981), the Federal Reserve System (2002, 2004), Gerdes and Walton (2002), and Gerdes, Liu, Parke, and Walton (2005); Projections are from Federal Reserve Bank of Atlanta (1983).
2
behavior driving the trend. The recognition of a significant change in the aggregate trend is a
key reason why the Fed has been estimating check volumes more frequently since 2000.
The bottom panel of Figure 1 shows data on check processing done by the Federal
Reserve only—roughly 40 percent of the U.S. total processing. The total number of checks
processed by the Fed declined from about 19 billion per year in 1994 to about 12 billion in 2005
(37 percent). Much of the fluctuation in total volume during the mid‐1990s was associated with
legal, regulatory, and operational changes that significantly affected the volume of a relatively
small proportion of checks handled by the Fed.4 However, the core number of unsorted checks
processed by the Fed trended upward until the early 2000s, as indicated by the dashed line.
Prior to the Gerdes and Walton (2002) announcement in August 2002, an observer using this
core measure of check processing as an estimate of aggregate check use might have surmised
that volume was increasing. But since 2002, the volume of unsorted checks processed by the Fed
has declined significantly too.
The decline in volume of Fed‐processed checks has impacted System operations
significantly. It has contributed to a reduction in Fed employment from 23,448 in 2001, to 19,935
in 2005 (15 percent) and a reduction in the number of check‐processing operations sites from 45
to 22 (51 percent) by the end of 2006.5 Not surprisingly, these developments have fully captured
the attention of Fed and private payments industry managers, who need to know how fast and
how far check‐writing will decline, what payment methods will replace checks, and what roles
the Fed should play in the new payments environment.
The paper‐to‐electronics transformation clearly has important implications for
participants in the payments industry, including the Federal Reserve System, but it has broader
economic and public policy implications that merit examination as well. What is not understood
well is why the transformation is occurring. For example, why is it happening now and not
earlier (or later)? Why are some consumers participating in it, but not others? A full
understanding of the broader implications of the payments transformation hinges critically on
4 These were checks influenced by the same day settlement process, which affected the way checks were presented and settled among banks. 5 This includes the closing of two check‐processing branches in the First (Boston) District: Lewiston, ME, in 1997, and Boston in 2006.
3

understanding why it is happening. Unfortunately, answers to these questions are not easily
forthcoming, largely because demand for payment methods by consumers—perhaps the most
important end‐users of payment methods—is not well understood.
Although some information is available about what payment choices consumers are
making, little is known about why consumers make those choices. For example, why do some
consumers still write checks and put them in the U.S. mail when they could “write” an
electronic check via online bill payment faster and more cheaply? Among consumers who have
stopped using checks for retail payments, why do some switch to a debit card, especially if the
payment involves a fee, when they could use a credit card and get what is, in effect, an interest‐
free loan and perhaps frequent flyer miles to boot? Unanswered questions like these, and many
others, are perplexing payments system providers, researchers, and policymakers.
A key gap in the understanding of consumer behavior and payment choice is a shortage
of fundamental research on the topic. Perhaps the clearest evidence of the lack of research
appears in a very useful bibliography compiled by the Federal Reserve Bank of Philadelphia.6
Although the title of the document is “Consumer Payments Bibliography,” only about 5 percent
of the more than 700 entries are even indirectly connected with consumer behavior and payment
choice per se, and far fewer directly address the theory of consumer payment choice. Schreft
(2006) provides an overview of this small literature and advocates more research on the topic.7
The shortage of research on consumer payment behavior both stems from and is
exacerbated by a lack of data on actual consumer payment choices. Kennickell and Kwast (1997)
were among the first to cite the lack of data as an important part of the reason for the neglect of
research on consumer demand for payments. They turned to the Federal Reserve’s triennial
Survey of Consumer Finances (SCF), which contains some information about what payment
choices consumers make, although payments are not the main focus.8 Aside from the SCF, there
are few publicly available alternative data sources on this subject; private‐sector data sources
6 See http://www.phil.frb.org/pcc/bibliography.pdf for a PDF file of the bibliography or http://www.philadelphiafed.org/pcc/bibliography.cfm for a searchable online version. 7 Schreft’s paper was commissioned by the Emerging Payments Research Group at the Boston Fed and presented at the Bank’s first “Consumer Behavior and Payment Choice” conference in 2005 (see Federal Reserve Bank of Boston 2005). 8 For information about the SCF, see Board of Governors (2006a).
4

are generally not available to policymakers and researchers.9 Another corroborating assessment
appears in a survey of research on financial innovation by Frame and White (2004): “A striking
feature of this literature, however, is the relative dearth of empirical studies that specifically test
hypotheses or otherwise provide a quantitative analysis of financial data.” [Emphasis added.]
The lack of empirical studies on the adoption of payment methods by consumers is one specific
example of the problem cited.
Noting the transformation in payments and its vital importance to the Fed, we set out to
make a modest contribution toward filling the data gap and improving the understanding of
consumer behavior and payment choice. Beginning in 2002, we developed a survey of
consumer behavior and payment choice designed to go beyond asking what choices consumers
were making by beginning to ask why they make those choices.10 Because of our connection to
the Federal Reserve, we focused the survey on check‐writing behavior. But because the decision
about whether to write a check is made jointly with the decision about whether to use any other
payment method, the survey includes questions about most common alternatives. The three
primary contributions of our survey design are: 1) the survey asks why consumers make the
payment choices they do; 2) it asks individual consumers about changes in their specific
payment behavior over time (although it is not a true longitudinal panel); and 3) it asks
consumers how they rate the relative values of some fundamental characteristics of payment
methods, in addition to asking about actual payment behavior.
Working on a limited budget, we chose a convenience sample of the most readily
available, highly motivated, and inexpensive potential respondents: Federal Reserve employees.
We first conducted the survey in 2003, with more than 500 Boston Fed employees, and then in
2004, with more than 5,000 Federal Reserve employees from across the System.11 These samples
have five serious limitations: 1) Fed employees are not demographically representative of U.S.
consumers (on average, Fed employees are older, better educated, and have higher incomes); 2)
9 See Appendix A for a brief discussion of data sources and their availability. 10 For an example of research along these lines, see Schuh and Stavins (2005). 11 The survey results are posted on the Boston Fed’s public web site. For the survey instrument with all numerical results in tabular form, see http://www.bos.frb.org/economic/eprg/FRBBsurvey04num.pdf. For a graphical summary of most results, see http://www.bos.frb.org/economic/eprg/FRBBsurvey04.pdf
5

Fed employees are far more knowledgeable about the payments system than U.S. consumers (a
bias problem); 3) Because of professional duty, reward incentives, and a general sense that
providing the information could help the Fed during a time of institutional change, Fed
employees were more likely than other U.S. consumers to respond to this voluntary survey (a
sample selection problem); 4) Because Fed employees work in an organization that supplies
payment services, they may answer certain survey questions—knowingly or unknowingly—
from the perspective of a firm rather than from the perspective of a consumer; and 5) Because
almost every Fed employee has a checking account, Fed employees’ behavior is not
representative of the behavior of all U.S. consumers, particularly those without checking
accounts.
Because the survey results are not representative of all U.S. consumers, the aggregate
statistics from our survey should not be used to draw conclusions about U.S. consumers in
general. However, cross‐sectional (individual consumer‐level) studies using the survey data can
provide valid and useful information about individual consumer behavior.12 Furthermore, in
2006, we collaborated with the AARP (formerly the American Association of Retired Persons) to
implement a modified version of the Boston Fed survey with a nationally representative sample
drawn randomly from the entire U.S. population. 13
This paper provides an overview of the Boston Fed survey.14 Section 2 defines
terminology, and Section 3 describes the survey. Section 4 compares our results on what
payment choices consumers are making with results from similar surveys that are more
representative of U.S. consumers. Section 5 presents selected results on why consumers are
making the payment choices they make and how those choices are changing. Section 6 discusses
some survey results that bear directly on Federal Reserve payment operations. Section 7
presents a brief assessment of the issues raised by the transformation in payments and the
challenges facing policymakers. Section 8 concludes with a high‐level assessment of the
12 For an example of research along these lines, see Schuh and Stavins (2005). 13 Documentation of this survey is forthcoming in another Boston Fed Public Policy Discussion Paper. 14 Krieger and Braun (2005) describe the results of an analogous survey of large corporations’ preferences with regard to payments, conducted by the New York Fed.
6

contributions of the survey and suggestions for future research to advance the understanding of
consumer payment choice.
Although the survey design is imperfect, we were encouraged to discover general
consistency with findings of other, more representative surveys (Survey of Consumer Finances
(2001, 2004), Michigan Survey of Consumers (2003), and American Bankers Association (ABA)
and Dove (2003, 2005), for aspects of the survey that were also addressed by others.
Our results include several findings that seem important and suggest the need for
further study and consideration:
• Fed respondents overall rate checks worse than other payment methods across most
fundamental characteristics, and ACH payments appear to strictly dominate checks
in all characteristics. This finding may help to explain why consumers are shifting
from paper to electronics, especially for recurring bill payments.
• Yet, even in 2004, checks were still the most common single payment method used
by respondents. The survey results suggest that improvements in user control of
payment timing, overdraft protection, and consumer knowledge of ACH might
increase use of ACH payments considerably.
• Nearly one‐third of respondents indicate that their payment behavior, especially
check‐writing, is sensitive to float.15 However, even fewer respondents would or did
alter their payment, banking, or shopping behavior in response to changes in the
check‐processing environment—particularly the introduction of electronic check
images and conversion of paper checks to electronic ACH transactions that affect
float.
• Cost, convenience, and timing are the three most important fundamental
characteristics that determine respondents’ adoption and use of all payment
methods. Safety and privacy also are important for methods more susceptible to
consequences like identity theft that are costly to consumers.
15 Float is the interval between the physical writing of the check (payment) and the time when the funds are deducted the consumer’s checking account (settlement) by the bank.
7

• Respondents are heterogeneous in their views about and use of payment methods.
The most important barrier to the adoption of a payment method differs by method,
and most respondents use a variety of payment methods each month. When
respondents switch from checks to other payment methods, the method they choose
depends on the location and amount of the payment, among other things.
• Respondents choose payment methods in a manner that is broadly consistent with
their reported ratings of the relative characteristics of those payment methods.
Reported characteristics could vary across respondents, even within narrow
demographic groups, for many valid reasons. More research and data are needed to
determine whether the reported characteristics accurately reflect the actual payment
characteristics consumers face, and the extent to which the assessments may be
subjective or biased.
• When the payments system changes, some respondents report that they would or
did alter their payment behavior. The extent to which behavior changes, and the
circumstances under which it changes, depends on the type and magnitude of the
payments system change. Understanding whether the change is beneficial for society
as a whole requires a much deeper understanding of consumers’ tastes and
preferences regarding payments than we currently have. Put simply, for a complete
understanding of the overall payments industry, the views of consumers matter.
We view these key survey results as an illustrative step toward gaining a better understanding
of consumer payment behavior. We hope that they will stimulate further research, data
collection, and public policy discussion.
As consumer behavior is understood more fully, it will be natural for policymakers like
the Federal Reserve to begin to ask, what is best for consumers with regard to the payments
system? A major hurdle to answering this question is the surprisingly widespread and
persistent heterogeneity of consumers’ payment preferences. Also, some U.S. households have
no bank account and thus cannot participate in some electronic payment innovations. Other
developments—identity theft, credit and debit card interchange fees, technology barriers,
8

financial market complexity, rapidly expanding choices, and the like—have potentially
important impacts on the welfare of consumers as well.
2. Definitions and Terminology
As with any rapid change in society, the payment transformation is engendering new
language and terminology that is sometimes redundant and unclear. So, before diving into the
details of consumer payment behavior, it will be helpful to define the terms used in this paper
and their relationship to alternative terms used elsewhere.
The term “consumer” refers to a household member who makes payment decisions
when buying goods and services for personal or household use. Thus, we are all consumers
who demand payment services. However, our survey queried Federal Reserve employees, who,
as we have noted, are quite different on average from the average U.S. consumer. For these
reasons, we try to distinguish carefully between consumer and respondent, and the reader
should always bear in mind the potentially important differences between them.
The payment survey includes seven main payment methods: cash, paper check, credit
card, debit card, Automatic Clearing House (ACH), stored‐value card (SVC), and online bill
payment. To some extent, these payment method terms are self‐evident and have become part
of today’s vernacular, but no consensus on all terminology has emerged yet. Thus, to be clear
and precise, we list and define the terms we use, plus alternative terms, in Table 1.
Three general issues concerning payment methods cause unusual confusion and merit
additional brief discussion. First, there is great variety in the payment methods that are
available to consumers; these are summarized in Table 1. Consumer preferences and choices in
the face of this variety are discussed further in Section 6. Second, ACH, which plays a pivotal
role in several other payment methods (debit cards, check conversions, and online bill
payments), is not a payment method per se but rather an electronic medium for settling
payments that can be initiated by various payment methods. However, in developing our
survey we relied on “ACH payments” as a short‐hand for one form of payment—automatic bill
payments initiated by consumers (mortgage payments, insurance payments, and the like)—so
the reader should think of these when reading references to ACH.
9

Similarly, a third issue is that payments made over the Internet can occur in at least
three ways, any of which might be viewed as a form of online bill payment. One way is via
online banking, a process that allows a consumer with a checking account to pay bills
electronically rather than with a paper check. Typically, the bill is paid by the bank through
ACH, but, ironically, this method sometimes involves the bank’s writing a check for the
consumer. A second form of online bill payment occurs when a consumer accesses a company’s
web site and initiates a payment to the company for the bill. This form of payment can be made
by credit or debit card or by ACH, either period‐by‐period or recurring automatically, the latter
requiring only a single online transaction to sign up. A third form of online bill payment can be
mediated through a third party, such as a payment provider like PayPal. This form of online
payment is similar to a payment made directly to a company (or individual), but the payment
provider acts as an intermediary and may offer additional payment options.
We did not distinguish among these different forms of online bill payment, leaving the
survey respondents some leeway in defining the term. Thus, as with ACH, we treated online
bill payment as a payment method even though it is actually not a payment method per se;
rather, the Internet is an electronic medium used to facilitate various payment methods. In
future surveys, it might be better to distinguish more clearly among the various forms of
payment methods that can be initiated online.
Finally, we need to clarify the terminology used in this paper to describe various aspects
of payments themselves. We use the term “payment method” to describe the various means
that consumers (including respondents) can use to effect a payment; we use the term “form” in
a general sense, as in the discussion immediately above; and we use the term “payment type” or
“type of payment” to describe the kind of obligation that is being discharged, for example, a
mortgage payment, a utility bill, a retail sales purchase, etc.)
3. The Boston Fed Consumer Payment Survey
This section describes the design, implementation, and sample properties of the Boston
Fed consumer payment survey conducted in 2004.
10

3.1 Survey Design
To begin, we conducted focus group interviews for three months in early 2003 with
employees of the Boston Fed to gain a better understanding of the importance of changes in
check processing for Federal Reserve payment operations and of the gaps in knowledge about
consumers’ use of checks. These interviews, formal and informal, included the Bank’s most
senior officers with expertise in payments and economic research. Two key findings emerged
clearly from the interviews:
• Although most observers were keenly aware of the decline in check volume by early
2003, the timing and magnitude of the check decline were not fully anticipated or
explained, suggesting the need for greater understanding of the underpinnings of
consumer demand for checks and other payment methods. This gap in knowledge
mirrored the lack of fundamental research on consumer payment demand noted in
the introduction. It also stemmed in part from the fact that the Fed’s primary
customers are depository financial institutions (banks, for short), rather than
individual consumers, and neither the Fed nor banks had developed a sufficient
understanding of why consumers make their payment choices.16 Together, the
decline in check volume and the gap in knowledge about consumer payment
demand are cultivating the need to develop greater insight into consumer payment
demand and its impact on all Federal Reserve payment operations.17
• It is impossible to design a proper survey of consumer behavior about a single
payment method. When consumers make choices about buying goods and services,
they form relative comparisons among these goods and services, based on prices and
other characteristics of the products. Consumers’ decisions about payments work the
16 This point also was made by Rich Oliver, head of the Federal Reserve’s Retail Payments Office, in his keynote address at the Boston Fed’s 2005 Consumer Behavior and Payment Choice conference. Oliver identified four stumbling blocks to eliminating the gap of understanding between banks and consumers, one of which was the need to ask consumers what they want in their payments. In fact, Oliver noted that the conference’s survey of participants’ payment preferences represented the first time in 40 years that he had been asked about payments as a consumer. For more details, see Crowe, Schuh, and Stavins (2006). 17 The series of Retail Payment Studies in the early 2000s described in Gerdes and Walton (2002) and Gerdes et al. (2005) represent one improvement in strategic thinking on this topic.
11

same way. The decision to write a check is a choice among options, and as such is
integrally related to the choice to pay by alternative methods.
These two findings influenced the survey design in two ways:
• The survey aimed to elicit information primarily about check‐writing behavior to
understand how and why consumer payment behavior matters for the Fed.
• Although focused primarily on check‐writing, the survey also includes questions
about other common payment methods; specifically, it asked for pair‐wise
comparisons of checks versus other payment methods.
The result of these findings and design considerations is a payment survey that emphasizes
checks and Federal Reserve operations to a greater extent than would a survey designed to
understand U.S. consumer payment behavior in general.18
The Boston Fed consumer payment survey contains 55 questions of various types in the
following categories:19
• General check‐writing behavior and attitudes [questions 1–8];
• Adoption and use of six non‐cash payment methods (checks, credit cards, debit
cards, ACH, online bill payment, and SVC) [9–17]; 20
• Three‐year retrospective changes in payment method usage [18];
• Reasons for substituting other payment methods for checks [19–22];
• Types of payments made using debit, ACH, and SVC [24–26];
• Pair‐wise comparisons of non‐check payment methods, relative to paper checks,
along seven payment characteristics [27–31];
• Experience with check conversion to ACH in retail stores, also known as point of
sale (POS), and check conversion to ACH for recurring bills mailed to a lockbox, also
known as Accounts Receivable Conversion (ARC) [32–42];
• Miscellaneous payment experiences [43–48];
18 Indeed, the version of our survey implemented by the AARP excludes some of the questions most relevant for the Federal Reserve and most detailed about check‐writing. 19 See Table 1 for complete definitions of all payment methods as well as all new terms (for example, Accounts Receivable Conversion). 20 The omission of cash from this group was inadvertent.
12

• Reasons for not having a checking account [49];
• Demographics [50–54];
• Open‐ended essay about check‐writing decisions [55].
Although the survey seeks primarily to measure consumers’ behavior and attitudes at a point in
time, it asks some retrospective questions to gain perspective on changes in attitudes and
behavior over time. Most respondents reported that they took about one‐half hour to complete
the survey.
3.2 Survey Implementation
We distributed the main version of the survey to all employees of the Federal Reserve
System during approximately six weeks in June and July of 2004. It was advertised as voluntary
and respondents were promised complete confidentiality.
The primary form of the survey was posted by the Boston Fed on the internal Federal
Reserve intranet, which is accessible by employees of the Board of Governors, all 12 regional
Banks, and all Bank branches. Each Federal Reserve District (plus the Board of Governors)
appointed a representative to work with the Boston Fed survey team. However, each location
was individually responsible for promoting the survey and encouraging participation among its
own employees. Not surprisingly, participation and enthusiasm varied across Fed locations for
this voluntary project. Paper copies of the survey were also made available to an extent that
varied across Banks, but only 4 percent of all surveys were completed in writing.21
Although participation in the survey was voluntary, it was encouraged in at least two
ways. First, we made an unabashed appeal to employees’ loyalty to the Fed, citing the changes
in Federal Reserve employment and the need to understand the payments transformation. Most
employees who provided feedback indicated that loyalty, duty, and a desire to help the
System—especially a desire to help employees in check‐processing operations—were highly
motivating factors. Second, the Bank also sponsored a modest raffle drawing as incentive; the
21 The availability of paper surveys was an important issue because computer access is not uniform across all jobs within the Federal Reserve. Employees in jobs with less computer access tend to be among the most underrepresented demographic groups of the Fed universe (younger, with lower incomes and less education than others). Thus, broader availability of paper surveys may increase sample representation. However, distribution and collection of paper surveys is also much more costly (especially in time and labor) than is the case with electronic surveys.
13

top prizes were valued at about $25, and participants had a 4.7 percent ex post chance of
winning a prize.22
3.3 Sample Properties
Nearly one in four Federal Reserve System employees participated in the consumer
payment survey. A total of 5,344 Fed employees responded to the survey, 5,110 electronically
(96 percent) and 234 by paper, a response rate of 24 percent.23 This rate is considerably higher
than the rate obtained by some private‐sector firms that conduct voluntary consumer payment
surveys designed to be representative of the U.S. population.24
Survey participation was uneven across the regions of the country. The top panel of
Figure 2 compares the Fed survey responses with the regional distribution of the U.S.
population.25 The distribution of survey responses generally reflects the U.S. population
distribution in all but four Districts: Minneapolis and Kansas City are over‐represented, and San
Francisco and Atlanta are under‐represented.26 If variation in respondents’ payment behavior
across Districts differs from variation in U.S. consumers’ payment behavior across Districts, the
Fed survey results will be subject to bias.
Even if the geographical variation of respondents accurately reflects the geographical
variation of consumers in these respects, the unequal representation of Districts may be a source
of additional geographical bias. Gerdes and Walton (2002) and Gerdes et al. (2005) find 22 In May and June of 2003, we also conducted a very similar, but slightly shorter, version of the survey with Boston Fed employees as well as several test versions prior to that with small groups. The main differences between the two surveys were: 1) most of the Boston Fed 2003 survey was conducted via paper copies (64 percent) rather than electronically; and 2) the top prize in the Boston Fed 2003 survey raffle was a free vacation day, considerably more valuable than $25. 23 Unfortunately, 1040 electronic responses were lost due to technical difficulties in Boston, but 329 of these lost responses (32 percent) were replaced by employees’ taking the survey a second time. These employees were offered an additional raffle with a 19.6 percent ex post chance of winning. Results from the employees who retook the survey clearly may be biased for several reasons, but we can identify these responses and control for their potential biases. 24 For example, the ABA/Dove (2005) survey response rate was about 6 percent for paper surveys (the rate for e‐mail surveys is not known). 25 To create population by Federal Reserve District, we made two simplifying assumptions: 1) The Board of Governors (Washington, DC) was included in the Richmond District; and 2) population in states served by two Reserve Banks was divided evenly between the two Districts. 26 The top panel of Figure 2 uses the total usable number of surveys to calculate the Fed Survey numbers (that is, it does not include the lost surveys described in footnote 22). Most of the lost surveys were in the San Francisco District; this explains much of that District’s relatively low (usable) response rate.
14

statistically significant regional differences in check‐writing; for example, the Midwest region
writes more checks per capita than the other three regions that these authors studied. However,
this evidence is for total checks (including those of businesses), not just for consumer
(individual) checks, and thus it is not comparable to the Fed survey estimates we report in
Section 4. Although we find regional variation in payment behavior, Federal Reserve Banks do
not provide representative sampling of the regions in which they are located and thus are
unsatisfactory indicators for regional analysis.27
Participation was also uneven across the Federal Reserve System, in a slightly different
manner. The bottom panel of Figure 2 plots the per‐employee response rates and the usable
response rates (excluding lost surveys) by Federal Reserve District, as well as the total System
response rate. Participation was greatest in Minneapolis (51 percent rate) and Kansas City (46
percent rate), and generally above average in most Midwest districts. Participation was poorest,
in total and rate, at the Board of Governors in Washington, DC.
In addition to geographic region, four other demographic characteristics from the survey
are available to gauge the representativeness of the Fed sample relative to the U.S. population:
age, education, income, and home ownership, which proxies for wealth. Figure 3 plots the
distributions of each of these characteristics for Fed respondents and for the U.S. population.
• AGE: Fed respondents are older than the U.S. population. Most Fed respondents are
middle‐aged (35–55) employees from a heavily white‐collar industry; as a result, the
relatively young and relatively old are underrepresented, especially the youngest
(18–25).
• EDUCATION: About two‐thirds of Fed respondents have a college degree or some
higher education, compared with only about one‐fourth of the U.S. population; as a
result, consumers with a high‐school diploma or less education are vastly
underrepresented in the survey.
• INCOME: In part because of these age and educational advantages, Fed
respondents tend to have much higher household incomes than U.S. consumers 27 Moreover, we find considerable heterogeneity within the broader regions. Five Reserve Bank Districts are included in the Midwest region defined by Gerdes and co‐authors, and our estimates of checks per capita per month range from 9.3 to 13.2 across those Districts (the System average is 10.5).
15

generally.28 About half of Fed respondents have annual household incomes of
$75,000 or more, about twice the share of the total population with such high
incomes.
• HOME OWNERSHIP (WEALTH): Fed respondents are more likely than the general
population to own a home (82 percent vs. 67 percent).
Like the regional imbalances, these demographic differences will contribute to bias in the
aggregate survey results if consumer payment behavior is systematically related to
demographics.
3.4 Survey Question Types
Many of the survey questions are straightforward, single‐response questions, but some
of our other questions are designed to gain an understanding of why consumers make their
payment choices; these latter questions readily admit multiple responses. For example, we
asked respondents who do not use certain payment methods to explain why they do not, and
one can easily imagine multiple answers to this type of question. Survey designers have two
basic choices with regard to multiple‐answer questions: 1) provide a large number of reasons
and allow respondents to choose multiple reasons; or 2) ask open‐ended, essay‐type questions.
Open‐ended questions generally are preferable for a number of reasons; for example, they do
not lead respondents to answers and they allow for responses that the survey designers may
not have considered. However, open‐ended questions are more difficult and time‐consuming to
handle in data analysis, and they require the survey analysts to interpret respondents’ answers,
leaving open the possibility of subjective interpretation and the introduction of errors and
biases. For this reason, we opted primarily for multiple‐response questions with predetermined
answers.
Having chosen multiple‐response questions, we then had to decide whether or not to
design the response format to elicit the relative importance (or weight) of each respondent’s
multiple responses. One option is ordinal ranking, which would require respondents to list the
order of importance of each response (from 1 to the total number of responses, for example). 28 The income data are in nominal terms (2004) and not adjusted for cost‐of‐living differences across regions. Most Federal Reserve employees work in large metropolitan areas that tend to have populations with much higher incomes on average than the rest of the country, especially on the East and West coasts.
16

However, if one response was far more important than all the others, this format would not
provide that information. Another option was to ask respondents to rate each response on an
absolute scale of importance (from 1 to 10, for example). After considering the additional
complexity and burden of eliciting relative importance, we opted to use un‐weighted, multiple‐
response questions.
In analyzing the results of these un‐weighted, multiple‐response questions, we
examined the data from two different perspectives. For some questions, we were most
interested in knowing the distribution of choices among respondents; for example, we might
want to know what percentage of respondents cited concerns about safety as a barrier to the use
of an electronic payment method. For other questions, we were most interested in the intensity
of response to each choice. For this latter set of questions, we looked at the distribution of
responses among the possible choices, for example, what percentage of responses identified
convenience as a factor in influencing respondents’ choice of payment method. The percentage
of responses provides a crude measure of the relative importance of a response, although it is
clearly inferior to the direct weighting alternatives discussed in the preceding paragraph.
4. What Consumers Use When They Pay
This section reports basic results on Fed respondents’ typical payment behavior, as of
June 2004. The survey asked respondents what payment methods they had adopted and how
they used the payment methods—in general, and in specific payment situations. Because much
of this “what” behavior has been measured in other, more representative surveys, we compared
our results with these benchmark surveys to highlight potential biases in the Fed sample. The
main benchmarks for the general payments questions are the Survey of Consumer Finances
(2001, 2004) and the Michigan Survey of Consumers (2003). For more detailed payments
questions, the surveys by the ABA and Dove (2003, 2005) are the benchmark.29 We also provide
demographically corrected Fed results to check for biases.
29 See Anguelov, Hilgert, and Hogarth (2004) for more details.
17

4.1 Payment Method Adoption
The survey begins with several questions (2–8) about checking accounts.30 Fed
respondents are considerably more likely than the U.S. population to have a checking account.
Nearly all have one (99 percent), as shown in Table 2, compared with fewer than 90 percent of
the general population. There are two reasons for this disparity. First, Fed employees are
employed, and the unemployed and non‐participants in the labor force are less likely to have
(or need) a checking account. Second, the Fed has been particularly aggressive among
employers in requiring their employees to sign up for direct deposit of their pay; thus Fed
employees must have checking accounts.31 For these reasons, demographic adjustments to the
Fed checking account adoption rate do not alter the response much. Interestingly, however,
only 49 percent of Fed employees with a checking account earn interest on their checking
account balances (question 3).
Among those who do not have a checking account, the Fed respondents are much more
likely to eschew them because they do not need one, rather than for other reasons. Table 3
shows that 53 percent (20 of the 38) Fed respondents without a checking account reported no
need for one, much higher than the 5‐percent benchmark results. Because respondents were
allowed to respond more than once in the Fed Survey (and only once in the other surveys), this
comparison may not necessarily suggest that having no need for a checking account is Fed
respondents’ most important reason for not having a checking account. Fed respondents may
actually weight the reasons for eschewing checks differently than the overall U.S. population.
For example, these Fed respondents are likely to be more comfortable than the U.S. population
at large in dealing with banks (presumably because they work for one).
Unfortunately, we inadvertently designed the survey to exclude respondents who lack a
checking account from answering the remaining questions in the survey. Consequently, all of
the remaining statistics in this paper are based on respondents who do have a checking account. 30 The survey did not distinguish between traditional demand deposit checking accounts at commercial banks and money market accounts through investment brokers. Anecdotal evidence suggests that some Fed employees may have only the latter type of checking account; the other surveys were clearer in asking about traditional checking accounts. 31 A small percentage of Fed workers—temporary, itinerant, contractors, and the like—may be exempt from direct deposit, making the total adoption rate slightly less than 100 percent.
18

Fortunately, as noted above, 99 percent of respondents do have a checking account (however,
application of this survey to a representative sample would be even more problematic in this
regard).
Among those who do have a checking account, Fed respondents are more likely than the
overall U.S. population to adopt all of the other non‐cash payment methods except stored‐value
cards, as shown in the remaining rows of Table 2.32 Respondents are somewhat more likely to
adopt credit and debit cards and online bill payment. Demographic adjustments actually
increase the debit card adoption estimates slightly, making them even more upwardly biased.
Income and education adjustments, however, help to explain some of Fed respondents’
relatively high adoption of credit cards and online bill payment. Respondents to the Fed survey
are more likely than respondents to the other surveys to use (pre‐authorized) ACH payments
for some bills by a wide margin (71 percent versus 44‐47 percent). Even though income and
education adjustments reduce the bias a bit, Fed respondents clearly are unusually frequent
ACH users. This result likely reflects their much greater familiarity with, and trust in, ACH
payments than is the case for the U.S. population overall.
The most striking difference between Fed employees with checking accounts and the
U.S. population is in the adoption of stored‐value cards, where Fed respondents are less than
half as likely (35 percent versus 73 percent) to adopt the technology even after demographic
adjustments. In fact, only 5 percent of Fed respondents even use the stored‐value cards
available to them internally at their own Fed location (question 26). Three qualifications apply
to this result. First, with only one benchmark estimate of population adoption of stored‐value
cards (2003 Michigan Survey), this result should be viewed with caution. It is possible that the
responses to the two surveys differ because of the way terms were defined or questions were
32 In the following discussion of demographically adjusted statistics, it is important to understand that for demographic weighting to have an effect, two conditions must hold: 1) the group must be under‐sampled by a large amount; and 2) the group must have very different behavior from the rest of the population. Thus, we find that weighting by education or income has a much larger effect then weighting by home ownership or age. See Mester (2006) for data from the SCF on payment method adoption rates from 1995–2004.
19

asked.33 Second, as we explain further in Section 6, the overall Fed adoption rates for stored‐
value cards may be considerably lower than adoption rates at individual Fed locations if some
locations do not have the cards. Finally, as with other payment methods, there could be regional
differences more generally in stored‐value card adoption.
4.2 Payment Method Use
Paper checks still represented the single largest payment method in terms of
transactions volume for Fed respondents in 2004, but the volume of all electronic payments far
exceeded checks written. Checks represented 30 percent of all monthly non‐cash transactions, as
shown in Figure 4, whereas electronic payments accounted for 70 percent. Because these data
on payment use were collected from memory rather than from observed or recorded
transactions, a concern arises about the accuracy of these responses. Fed respondents who write
checks (that is, 99 percent of all respondents) stated that they write an average of 10.5 checks
each month. This estimate is less than the estimate of 12.1 (not shown) inferred from ABA/Dove
(2005) survey, which also relies on respondents’ memories and was obtained a year later.34
When considering all respondents (maroon bars, Figure 4)—that is, both users and non‐
users of payment methods together—the non‐check payment methods were used less
frequently than checks, but use of debit and credit cards was nearly as common. Debit card use
for all respondents averaged 9.4 transactions per month, and credit card use averaged 8.5
transactions per month. Respondents used newer “emerging” payment methods much less
frequently. Online bill payment and ACH were the more common of these, averaging about
three transactions per month each, while stored‐value cards were used on average about once
33 The Michigan survey said: “Prepaid cards are cards that contain a stored value, or a value that has been paid up‐front, allowing you to use the card much like cash. As you use the card, the prepaid value is drawn down. Examples of prepaid cards include phone cards, gift cards, and student cards. Have you ever had or used a prepaid card or bought one as a gift?” The Boston Fed survey said: “Stored‐Value Card—A plastic card that stores electronic data on dollar values. One example is a pre‐paid phone card. Other examples include gift cards from stores like Macy’s, Home Depot, or Starbucks.” If the Michigan definition were clearer or easier for respondents to understand, it might have increased Michigan respondents’ likelihood of acknowledging use of stored‐value cards. 34 The ABA/Dove estimate was obtained from the data on the percentages of checks written for payments in‐store (retail), online, and bills. Although this estimate may undercount checks written if consumers write them for many other types of payments, the results may still give a general idea of the comparison between the two survey populations.
20

per month. Thus, checks, debit cards, and credit cards accounted for the vast bulk of
respondents’ payments—about 28 per month compared with about seven per month for
emerging payment methods. Note that these self‐reported monthly payments imply that the
typical respondent is making slightly more than one payment per day (roughly 35 per month);
unfortunately, we do not have independent information to verify the accuracy of this number.
Looking by payment method only at respondents who have adopted each method
(yellow bars, Figure 4), we find, not surprisingly, that the incidence of use is somewhat more
evenly divided across the spectrum of payment methods. Most notably, respondents who
adopted a debit card tend to use it much more frequently than any other payment method is
used by its adopters (14.7 transactions per month on average). In addition, respondents who
adopted online bill payment tend to use it about seven times per month on average, a rate of
use approaching that of the other most common methods by their adopters. Respondents who
adopted ACH or a stored‐value card tend to use them substantially less (about four transactions
per month on average). Thus, even among users of “emerging” payment methods, we find the
use of these methods is still relatively infrequent. The reason for the low intensity of use among
users of these “emerging” payment methods is unclear. Probably, it is explained partly by low
demand by respondents and partly by limited supply, since for many types of transactions,
these methods are simply not available options at the present time.
4.3 Payment Choices by Venue
One of the most striking findings, and one that makes it clear that a great deal more
study will be needed to gain a full understanding of consumer payment choice, is that
consumers’ payment choices are quite heterogeneous, varying by venue (retail store or
whatever venue is used for recurring bill payment), and within a given venue, by bill payment
type and (for retail store payments) by payment amount.
4.3.1 Payment Choices at Retail Stores
Although checks are the most common payment method overall, at retail stores Fed
respondents most often choose a debit (36 percent) or credit (31 percent) card to make
payments, as shown in Figure 5. In fact, only 12 percent of Fed respondents make most retail
21

payments by writing checks. Comparing our results with the more representative ABA/Dove
survey results, we see that Fed employees tend to favor checks more than does the U.S.
population (12 percent versus 7 percent), and to use cash less (21 percent versus 26 percent). But
overall, the results are similar.
Interestingly, Fed respondents’ use of payment methods at retail stores is far from
uniform across payment amounts, as shown in the remaining bars of Figure 5.35 For payment
amounts below $20 (also called micro payments), cash is still king (51 percent). For medium‐
sized payments ($20–50), debit cards are most common (46 percent), and for large payments
(amounts above $50), credit cards are most common (48 percent). One shortcoming of the study
is that the survey did not obtain enough information to distinguish between use of credit cards
for credit (borrowing with repayment over time) and use of credit cards for deferred payment
(interest‐free loan or negative float) or incentives. In any case, payment size appears to be a
factor in respondents’ payment choices.
4.3.2 Payment Choices for Recurring Bills
Checks are still the dominant payment method for recurring bills, as shown in the upper
panel of Figure 6, but respondents to both surveys also use other methods. Eighty‐three percent
of respondents to the Fed survey and 72 percent of respondents to the ABA/Dove survey write
checks to pay some bills. ACH payments are the next most common among Fed respondents,
followed by online bill payment and credit cards. Compared with the ABA/Dove results, Fed
respondents appear to be roughly representative of U.S. consumers in their check‐writing.36
Heterogeneity of payment choice is evident from the data on payment choice (of Fed
respondents) by type of bill payment, as shown in the bottom panel of Figure 6. About half of
all respondents pay their housing, telephone, cable, and insurance bills by check, but only one
third of respondents pay their Internet service providers by check. The use of ACH payments is
relatively widespread for housing, insurance, and loan payments, but relatively unpopular for
telephone and cable bills. Roughly one‐third of respondents use credit cards to pay their
Internet service providers, but no more than about one‐tenth of respondents (and in some cases
35 We do not have results from a representative survey against which to compare these results. 36 Credit cards were excluded from the ABA/Dove survey.
22

hardly any) use this method to pay other bills. Understanding the root causes of this
heterogeneity in consumer payments across recurring bill types is a challenge.
5. Why Consumers Pay the Way They Do
Because our primary goal is to develop a better understanding of why consumers make
the payment choices they do, a significant portion of the Boston Fed consumer payment survey
contains two types of questions designed to elicit this information. One type of question
explores changes in the way consumers make payments, asking them what changes they made
and why. A second type of question explores the fundamental characteristics of payment
methods that likely influence consumers’ decisions to adopt and use the methods, and seeks to
understand whether these characteristics are consistent with actual payment behavior. The
remainder of this section examines these two important dimensions of consumer payment
behavior.
5.1 Changes in Consumer Payment Behavior
Ideally, changes in consumer payment behavior would be measured using longitudinal
surveys in which the payment behavior of the same consumers was followed consistently over
time. However, because the Boston Fed payment survey was originally intended to be a one‐
time survey, we designed some retrospective questions to try to obtain information about
changes in individual consumer payment behavior over time. The most direct question of this
kind asked respondents whether they use fewer, more, or the same volume of each payment
method compared with three years earlier in June, 2001 (question 18). Follow‐up questions
asked respondents who said they were writing fewer checks than in the past what payment
methods they had substituted for checks, and why they had chosen these methods—both in
general and for retail or recurring bill payments (questions 19–23, 44–46, and 48). Additional
queries asked about payment method substitution, specifically for retail and recurring bill
payments.
5.1.1 Changes in Payment Methods: From Paper to Electronics
Most respondents’ use of checks (for all types of payments) had declined over the
preceding three years, and their use of electronic payments had increased commensurately.
23

Figure 7 shows that 64 percent of respondents who write checks reported having decreased
their use of checks in the past three years, and only 8 percent reported having increased their
use, with the rest reporting about the same use.37
The largest increases in the use of electronic payments occurred in online bill payment
and the use of debit cards. Eighty‐four percent of Fed respondents who use online bill payment
increased their use of that method, 77 percent of users of debit cards increased their use of debit
cards, and fewer than 5 percent of users of each of these two payment methods decreased their
use of the method in question. Just over half of Fed respondents who use ACH reported having
increased their use of ACH, with only one percent reporting reduction in their use of ACH.
Forty‐three percent of users of stored‐value cards reported increased use of those cards,
although half reported that their use had not changed.
On the other hand, users of credit cards, a more traditional and previously more widely
used type of electronic payment, reported that they had not increased their use of credit cards in
the past three years. Thirty‐five percent of respondents who used credit cards reported
increased credit card usage, with 42 percent indicating no change, and 24 percent reporting a
decline.
5.1.2 Replacement of Checks by Electronic Methods, by Bill Payment Type and Value
Electronic payments are replacing checks in retail payments and in a wide variety of
recurring bill payments, as shown in Figure 8. Mortgage and rent payments are the most
common recurring bills for which Fed respondents eliminated check‐writing completely for
each given payment type and switched to electronic payments for that payment type (39
percent). Among respondents who switched from writing checks, about 30 percent switched to
electronics to pay their credit cards, utilities, and insurance, and 22 percent did so for telephone
bills. However, of those who switched from writing checks to electronic payment methods, only
14 percent switched for their retail purchases. In each of these cases, the survey data do not
indicate directly whether a low percentage indicates that consumers are substituting electronic
payments for checks because the electronic payment options have become more desirable and 37 The results are quite similar for retail purchases only. Sixty‐five percent of respondents reported writing fewer checks for retail payments than they did three years earlier, with 31 percent writing the same amount and only 4 percent writing more (question 45).
24

feasible, or whether consumers were already writing fewer checks for these payments than they
had three years earlier. The former seems more likely for many types of bill payments (only 6
percent of respondents wrote more checks for bills, according to question 48); the latter seems
more likely for retail purchases (65 percent of respondents write fewer checks at retail stores
than formerly, according to question 45).
Changes in retail payments from checks to electronic payments were not uniform:
Respondents who wrote fewer checks for retail payments compared with three years earlier
chose different electronic payment methods depending on the value of the retail transaction.38
Figure 9 shows what other payment methods respondents used as their check‐writing
decreased. Results for these changes in payment behavior between 2001 and 2004 are quite
similar to the results depicted in Figure 5 for respondents’ payment behavior in 2004. Most
respondents who reduced their use of checks primarily replaced checks with cash for small
purchases under $20 (43 percent), followed closely by debit cards (41 percent). For medium‐
sized purchases of $20 to $50, nearly two‐thirds (62 percent) of those who reduced their use of
checks primarily substituted debit cards, with 31 percent using credit cards. But for large
purchases over $50, only about half of all respondents who reduced their paper check‐writing
opted for debit cards instead, while almost as many (48 percent) chose credit cards. Those who
reduced their use of checks most definitely did not choose stored‐value cards to replace checks
for any size purchase, and they chose cash for small purchases only.
It is difficult to understand why consumers change their payment methods in general,
and even more complex to understand why the shift in payment choice depends on the type of
bill and the value of a payment. Still, we offer some possible explanations. With respect to
payments in general, it may be that the convenience of setting up automatic payments for
recurring bills is seen as a stronger advantage than the convenience of paying electronically at
retail stores. With respect to payments at retail stores, it may be that consumers do not increase
their use of cash as they reduce their use of checks for larger (>$20) purchases because they
want to avoid carrying a great deal of cash as a result of security concerns or other reasons. The 38 Here, “Respondents who wrote fewer checks,” refers to any respondent who simply reduced check usage for retail purchases, whereas the discussion in the previous paragraph deals with respondents who eliminated check‐writing entirely for a given payment type.
25

shift from checks to credit cards for larger (>$20) purchases in general may be explained partly
by loyalty (reward) programs. However, the fact that this checks‐to‐credit cards shift is greatest
for the largest purchases (>$50) is more difficult to understand fully without separately
identifying respondents’ use of credit cards to borrow money to pay for these very large
purchases. Moreover, for medium‐sized retail purchases, a very high percentage of those who
reduced their use of checks chose debit cards instead (62 percent). This raises the question of
why these respondents do not take advantage of the interest‐free loan and incentive features of
credit cards for these purchases, too. Perhaps they are guarding against overdrafts or building
up debt. The variety and complexity of possible explanations for consumer behavior payments
behavior highlights the need for further research.
5.1.3 Why Did Respondents Substitute Electronic Payments for Checks?
What explains the general shift from paper checks to electronic payment methods for
retail purchases and recurring bills? Respondents reported that convenience and various
elements of cost were the primary influences on their decisions to substitute electronic
payments for checks, as shown in Table 4. Note, however, that the term “convenience” is
somewhat vague, both inherently and because it was left for respondents to define subjectively.
As only one response was allowed and because the definition of convenience may vary across
respondents and may overlap with other similar terms, interpreting the responses is somewhat
difficult. In future research, a more granular definition of the characteristics of payment
methods may shed additional light on why consumers as a whole, and by demographic or other
characteristics, shift from checks to specific alternative payment methods.
For online bill payment, which showed the largest increase in use, several diverse factors
prompted Fed respondents who switched from writing checks to electronic methods to change
their payment method. Respondents switched from checks to online bill payments because they
found that it is faster (22 percent of responses) and generally more convenient (21 percent of
responses) to pay bills online. In addition, the greater ability to control the timing of their
payment (20 percent of responses), save on postage (19 percent of responses), and enjoy the
recordkeeping benefits of online bill payments (13 percent of responses) were all influential in
the decisions of respondents who made the switch from checks to online bill payment.
26

The reasons for switching from checks to ACH were similar to the reasons provided for
switching to online bill payment. Convenience, lack of mail hassles, and not having to
remember to pay the bill each month were reasons cited in 19 percent of responses of
respondents who switched, while cost savings—saving money on postage and the absence of
fees—were slightly less important in this case (16 percent of responses).
Thirty‐seven percent of the responses indicated that convenience was a factor for
respondents who switched from checks to debit cards, while 18 percent of responses showed
cost (saving money on checks) as an influencing factor on respondents’ decisions. Thirteen
percent of responses indicated that better recordkeeping was a factor in respondents’ switching
from checks to debit cards. Almost one‐third of responses indicated that use of debit cards
increased simply because more stores now accept them than previously (a supply‐side reason).
Convenience was also cited most often by respondents who switched from checks to
credit cards, but several aspects of credit‐card cost were cited relatively frequently as well. The
ability to buy now and pay later (17 percent) makes the credit‐card payment an implicit interest‐
free loan. Incentives (rewards), such as mileage, points, or cash‐back, promoted by credit card
use (15 percent) also reduce the net cost of credit card payments. These examples of cost savings
are reductions in the full economic cost of the payment method, not out‐of‐pocket cash costs.
However, saving money on postage (11 percent), an out‐of‐pocket cash cost, also was important
to some respondents.
5.2 Determinants of Payment Choice
A consumer’s decision to adopt and use a particular payment method is likely to be
based heavily on the fundamental characteristics embodied by that payment method. In this
regard, the consumer’s payment choice is essentially no different from other choices consumers
make to use (buy, or consume) any other type of good or service. However, unlike the case of
consumption of goods and services, very little attention has been paid thus far to the study of
payment characteristics and the role that they play in consumers’ choices of payment methods.
This subsection offers three types of evidence on the fundamental characteristics of
payment methods that influence consumers’ decisions to adopt and use various methods. First,
for respondents who do not adopt a payment method, we describe the main barriers they
27

reported to the adoption of payment methods. These barriers suggest important characteristics
that discourage certain consumers from adopting payment methods. Second, we describe how
respondents rate each payment method, relative to checks, with respect to seven fundamental
characteristics. Relative characteristics of payment methods can vary widely across
respondents, even within demographic categories, because of actual heterogeneity in the
payment characteristics at the individual level. However, as we explain in more detail later, the
assessments of relative characteristics reported by respondents may differ from the actual
relative characteristics of the payment methods—for a variety of reasons. Third, we present a
relatively simple comparison of respondents’ actual payment behavior with their reported
assessments of relative payment characteristics.
5.2.1 Barriers to Adoption of Payment Methods
Many respondents are now using electronic payment methods instead of checks for
some transactions, and they gave us numerous reasons to explain why they switched. But why
aren’t more people making greater use of electronic payment methods? For each method, we
asked respondents to cite the reasons, or barriers, for not adopting the particular method. (This
was a multiple‐response question where we allowed respondents to select more than one
choice.)
Barriers to adoption vary considerably across payment types for two reasons, as
illustrated in Table 5.39 First, the range of possible barriers is not the same for each payment
type because some barriers are not applicable to certain payment methods (reflected by missing
values in a row). Second, the relative importance of the barriers is not the same for each
payment type or for each consumer. The color‐coding of the barriers indicates their degree of
importance, as measured by the percentage of responses citing the barrier. Red barriers are the
most important (more than 15 percent of responses), and white barriers, the least (5 percent or
fewer), with orange and yellow in between. In assessing the importance of barriers to payment
method adoption, the reader should bear in mind the adoption rate of each method from Table
39 Table 5 is derived from questions 10–17. The numbers in the table are the percentages of responses that cite the barrier as a factor (row) for respondents who do not use the payment method (column). Respondents were allowed to choose more than one barrier. For results on the barriers in terms of the percentages of total respondents, see the survey results files.
28

2, which (excluding checks) varies from 86 percent for credit cards to 35 percent for stored‐value
cards. Thus, the most important barrier to the adoption of stored‐value cards likely has a greater
effect on overall consumer payment choice than does the most important barrier to the adoption
of credit cards.
Scanning the columns of Table 5, one can see that the most important barriers to
adoption vary across payment methods. Although some methods share similar barriers, no two
payment methods have the same most important barrier, and each payment method has a most
important barrier that the others do not. The most important barriers to credit card use are the
amount of debt in the household (38 percent of responses) and interest and fee expenses (32
percent of responses) or out‐of‐pocket cost. For debit cards, the barriers are much more varied,
with five rated as most important or second most important (at least 11 percent of responses).
Interestingly, two elements of the cost of credit cards have opposite effects on the adoption of
debit cards. Incentives, which make credit cards cheaper relative to debit cards, are the most
important barrier to the use of debit cards (19 percent of responses), but interest and fee
expenses, which make credit cards dearer relative to debit cards, are tied for third place with
theft and misuse, among barriers to the use of debit cards (13 percent of responses). Concern
about tracking payments (14 percent of responses) is the second most important barrier to debit
card use. The most important barrier to the use of ACH payments cited by non‐users of ACH is
concern about overdrafts (20 percent of responses), with concern about the lack of flexibility in
timing of payments coming in second (16 percent of responses). Not surprisingly, the major
concerns related to online bill payments were privacy and security (22 percent of responses) and
theft (19 percent of responses).
These results on adoption of payment methods suggest that the barriers are so different
among the electronic payment methods that it is unlikely that any single improvement to the
payments system will encourage consumers to increase their use of electronic payments in
general. However, respondents generally would be willing to use electronic payments more if
the specific barriers that inhibited them for using each type of payment were removed (see the
odd‐numbered questions from 10–17). These results suggest ways that payment providers may
have an opportunity to increase the use of their payment methods. For example, offering
29

consumers protection against overdrawing accounts and more flexibility on payment timing
might significantly increase use of ACH payments.
5.2.2 Relative Payment Characteristics
To understand better how consumers think about their payment choices, we attempted
to determine the relative importance (or value) of some fundamental characteristics of the
payment methods. Our strategy was to ask respondents to self‐report the qualitative values of
the characteristics of each payment method relative to the values of the same characteristics of a
benchmark payment method (paper checks). As is the case for the entire survey, self‐reporting
by respondents is susceptible to a variety of errors, which might be lessened if the data on
relative payment characteristics were collected from other sources. Furthermore, the potential
weakness of consumer self‐reporting is exacerbated for payment characteristics because they
are hard to define—a subject we discuss in more detail in the next sub‐subsection. Nevertheless,
for this sub‐subsection, we proceed under the assumption that the reported and actual relative
payment characteristics are the same.
To keep the comparison manageable, we asked respondents to compare each type of
electronic payment, one at a time, with paper checks with respect to seven characteristics: cost,
convenience, safety, privacy, ability to resolve errors, ability to control the timing of payments,
and ease of recordkeeping. Specifically, we asked for a simple, qualitative comparison of the
value of each characteristic by asking the following question: Is the electronic payment method
better, the same as, or worse than a check?40 For each respondent, these value results were
converted to a discrete numeric format (better is 1.0, worse is –1.0, and same is 0.0). Table 6
summarizes the results of our qualitative comparison of payment characteristics by averaging
the quantitative values assigned to the qualitative assessments across respondents. Like Table 5,
the entries in Table 6 are color‐coded to indicate the relative value reflected by the averages.
Red shading indicates that the electronic payment method is rated worse than checks, green
shading better, and white shading the same. Each color has two shades, with the darker shade
40 A more continuous and quantitative evaluation would be preferable, but we decided that it would have been too difficult to obtain accurate answers of this type in the survey. Data from this kind of qualitative assessment question have some notoriety in economic analysis; for example, see the surveys of business activity by the Institute for Supply Management (ISM), which can be found at http://www.ism.ws/ .
30

indicating greater intensity. Thus, green indicates “better,” darker green indicates “much
better,” red indicates “worse,” and darker red indicates “much worse.”
Our assessment of relative payment characteristics is adversely affected by a serious
error in our survey design. We asked only the respondents who use a particular payment
method to answer the group of questions that compare payment methods by characteristic. But
to gain a full, accurate understanding of the relationship between characteristics and payment
choice, one needs the payment characteristic comparisons of both users and non‐users.41
Fortunately, because some respondents did not follow directions, we actually did obtain
responses for the payment characteristic comparisons for a relatively small—and probably even
more unrepresentative—number of non‐users of each payment method. Thus, we can report
characteristic ratings separately for respondents who used the particular payment method
(Table 6, top panel) and for those who did not (Table 6, bottom panel).42
The clear and pervasive message of Table 6 is that respondents who use each of the
electronic payment methods (top panel) generally view them as markedly superior to paper
checks. Of the 35 possible comparisons, in only three cases is the electronic payment method
rated worse than checks (negative numbers in the top panel of Table 6), while in 27 cases the
electronic payment method was rated by its users as better or much better than checks (light
green or dark green in the top panel). Respondents who use electronic payments view them as
strictly better than checks (value is positive) in four characteristics: cost, convenience, timing,
and errors. Respondents think electronic payment methods are overwhelmingly more
convenient than checks—all five payment methods were rated as much better for convenience
than checks. Respondents also think that electronic payment methods are significantly better in
terms of cost and timing.
41 Unless consumers are completely illogical or constrained in their behavior, the users of any particular payment method almost surely rate that particular method better than other methods, as evidenced by their decision to use it. Thus, data gathered only from payment users will give a biased (more favorable) assessment of relative payment characteristics than such assessments made by all consumers. 42 Of course, it is conceivable that respondents who do not follow directions have their own set of biases and thus induce sample selection problems. We have no way to test or verify this possibility, so the reader should keep this potential flaw in mind.
31

Of all the electronic payment methods, respondents who used the method rated only
one—ACH payments—as uniformly dominant over checks. In all seven categories, ACH
payments were rated better or much better than checks. Overall, it seems likely that a better
understanding of the availability of ACH payments would lead to further reductions in check‐
writing. However, with respect to this finding, it is important to recall once again that Federal
Reserve employees are probably not typical users of ACH payments.
In contrast, respondents who do not use a particular electronic payment method (bottom
panel) tend to rate the electronic methods about the same, on average, as checks. Even non‐
users of a particular payment method view the electronic payment method as better in
convenience across the board, and they tend to view ACH as essentially equivalent to checks in
all characteristics. However, non‐users see several areas in which credit cards, debit cards, and
online bill payment are significantly worse than checks. Cost, safety, and privacy are key
concerns for the respondents who do not use these electronic methods and who rated them
worse than checks. Among these non‐users, recordkeeping (for debit cards) and payment
timing (for SVCs) are also viewed as worse than checks. Interestingly, respondents who do not
use SVCs nevertheless rate them better than checks on convenience and privacy; apparently,
some other unobserved factors discouraged these respondents from using stored‐value cards.
The important result to keep in mind with respect to the characteristics of payment
methods is that Fed respondents overall rate checks worse than other payment methods across
most fundamental characteristics. Only among the small group of respondents who are non‐
users of electronic payment methods did we find some characteristics for which checks were
viewed as superior.
5.2.3 Relative Payment Characteristics and Consumer Payment Behavior
A natural question arising from the evidence on relative payment characteristics is
whether they play an important role in determining actual consumer payment behavior. In this
sub‐subsection, we perform a simple comparison to try to answer this question, at least at a
32

cursory level.43 However, first we must examine the concept of relative payment characteristics
in a bit more detail.
Economists generally assume that consumers act in their own best interest to maximize
their utility, which depends positively on their consumption of goods and services and
negatively on their supply of labor for work. Implicitly, economists typically assume as a
benchmark that consumers accurately and completely observe the fundamental characteristics
of the goods and services—price, color, quality, speed, and the like—that they consume, thereby
enabling them to make fully informed decisions and behave in their own best interest. If this
benchmark assumption is correct for relative payment characteristics, then we can compare
them with the observed payment behavior of the respondent who reported the characteristics to
see whether the behavior is consistent with the characteristics. For example, respondents who
rate paper checks as costlier than another payment method should (all else being equal) use that
other payment method more frequently than checks.44
However, numerous aspects of the relative payment characteristics and corresponding
consumer payment behavior may complicate this simplistic analytical conclusion. Before
proceeding to our comparison of payment characteristics and behavior, we provide an itemized
discussion of these key issues:
• External heterogeneity – Relative payment characteristics most likely vary across
individual consumers, for a variety of reasons. One can imagine that the cost of a
payment method may be different for two consumers, even if they have similar
demographic characteristics. For example, checking accounts have different fee 43 See Schuh and Stavins (2005) for a more rigorous and thorough investigation of this issues. They find evidence that relative payment characteristics are much more important than demographics in econometric models that try to explain consumer payment behavior. 44 Even if consumers have accurately and completely observed their economic environment, they may not make choices that are in their own best interest, or “rational.” A relatively new branch of the profession, called behavioral economics, challenges the basic premise that consumers consistently make choices in their best interest and offers evidence that consumers sometimes deviate from the rational behavior traditionally assumed by economists (see the overviews by Mullainathan and Thaler (2000) or Camerer and Loewenstein (2004)). Consumer payment choice is an area where many of the ideas advanced in behavioral economics may be evident in the real world, but a formal evaluation of whether consumer payment behavior is consistent with relative payment characteristics requires an economic model and statistical tests, which are beyond the scope of this survey overview. For examples of this kind of work, see Zinman (2005) or Meier and Sprenger (2006).
33

structures, interest rates, cost of paper checks, and other pecuniary features;
likewise, payment service providers (such as banks) may differ in their abilities
to resolve errors or payment disputes with their customers. This kind of
characteristic heterogeneity is external to consumers, thus taken as given.
• Endogeneity – One reason payment characteristics may be heterogeneous across
consumers is that consumers can choose many of the characteristics of their
payment methods simultaneously with the choice of the method itself. In the
preceding example of the checking account, a consumer who chose to write
checks intensively would likely search for (and choose) a relatively inexpensive
checking account (low fees, high interest) and buy discount checks—actions that
work to lower the relative cost of checks for that consumer. Likewise, among
credit card users, the cost is heavily determined by a respondent’s decision
whether to carry balances across months (thereby incurring or avoiding interest
charges) and by the decision whether to pay in a timely manner (thereby
avoiding or incurring late fees and perhaps an increase in the interest rate
charged on future balances). For these reasons, we cannot view the relative
payment characteristics as something consumers take as given when they choose
their payment methods.
• Measurement error – Some payment characteristics are very difficult for
consumers (and perhaps even others) to measure properly. For example,
although identity theft is being discussed and publicized much more frequently
than before, the actual unconditional probabilities of various forms of identity
theft are not well known. Moreover, it is likely that the conditional (on individual
consumer behavior and characteristics) probabilities are even more difficult for
individual consumers to estimate. Thus, reported relative characteristics
probably contain some measurement error.
• Experience – Some payment methods may exhibit the characteristics of an
experience good, which is one whose price and features are not fully known by
the consumer until the consumer actually consumes (experiences) it. For
34

example, consumers may not grasp accurately the convenience (ease of use) of
online bill payment until they actually set up their online banking facilities and
begin to pay bills this way.45
• Subjectivity, internal heterogeneity, and perceptions – Some payment characteristics
may be subjective from the perspective of the consumer. For example,
convenience (ease of use) and recordkeeping (ease of financial management) are
characteristics that may be determined largely by the tastes and preferences of
individual consumers. If so, the relative payment characteristics would reflect
heterogeneity in consumer utility functions, which is internal to the consumer,
rather than a fundamental feature of the economic environment that influences
consumer decisions. But subjectivity may run even deeper. Some consumers
may form perceptions about payment characteristics that have no systematic
relationship to measurable, objective characteristics of the economic
environment. For example, consumers who read a great deal about identity theft
in the newspaper may perceive that safety is much lower for online bill payment
than is actually the case (even if they are shown evidence to the contrary), or than
do consumers who rarely read the newspaper or who already use online bill
payment.
Each of these factors may influence respondents’ reported relative payment characteristics and
may drive a wedge between the reported characteristics and the actual characteristics that
prevail in the marketplace.46 Nevertheless, actual payment behavior is most likely to be
determined primarily by reported payment characteristics. Much more data and research are
needed to distinguish more clearly between reported and actual payment characteristics, and to
45 See Goettler and Clay (2006) for an example pertaining to the use of online grocery services that has similarities to the payment choice. Experience goods are also susceptible to price discrimination. 46 For several payment characteristics, such as privacy, security, and payment timing, one might wonder whether the difference in reported characteristics across respondents and the divergence (if one exists) of reported and actual characteristics are matters of misinformation that could perhaps be remedied by education. For example, a paper check, which has one’s name, address, and account number on it, and which passes through many individuals’ hands as it makes its way through the clearing process, is probably not more secure than a debit card, especially if the latter is guarded by a PIN, but individual consumers may not be aware of this fact.
35

understand the extent to which deviations from actual characteristics actually influence
consumer payment behavior.
Proceeding under the assumption that respondents’ reported payment characteristics
are accurate assessments of actual payment characteristics, we seek to determine, in a rough
way, whether there might be some obvious, first‐order deviation of respondents’ payment
behavior from the relative characteristics they reported for the various payment methods. To do
so, we devised a simple way to evaluate whether respondents’ assessments of relative
characteristics were consistent with their payment method usage. From the results on usage
(question 9), we identified three types of respondents:
• Check payers: Respondents who wrote checks for more than 75 percent of their
monthly payments.
• Eclectic payers: Respondents who wrote checks for between 20 and 75 percent of their
monthly transactions.
• Electronic payers: Respondents who wrote checks for fewer than 20 percent of their
monthly transactions.
These three types of respondents are represented by the different colored bars in Figure 10.
Fed respondents appear to behave in a manner broadly consistent with their reported
assessments of relative payment characteristics, a point illustrated by Figure 10 in two ways.
Both the intensity of use of electronic payment methods and the adoption of electronic payment
methods are consistent with the reported relative superiority of electronic payment methods.
Electronic payers (third, deepest row of bars) rated electronic payment methods
consistently better than checks. In each of 14 possible categories—users (top graph) and non‐
users (bottom) across seven payment characteristics—more electronic payers than eclectic
payers rated electronic methods as superior to checks, and more eclectic payers than check
payers rated electronic methods as superior to checks. For four characteristics—cost,
convenience (ease), timing, and recordkeeping—more than 50 percent of electronic payers rated
the electronic payment methods that they use better than checks. In contrast, check payers
conceded the superiority of electronic payment methods in only one characteristic—
convenience (ease of use); fewer than half of check payers (nearest row of bars) rated electronic
36

payments (whether they use them or not) better than checks in all other characteristics. Eclectic
payers rated electronic payments better than checks at a rate that lies between the ratings of the
other two groups of payers, as one might expect. Thus, the intensity of electronic payment usage
is consistent with the reported superiority of electronic methods.47
A second way that reported behavior appears to be consistent with ratings of relative
characteristics is that respondents generally rate more of the electronic methods they use as
superior to checks than the electronic payment methods they do not use. For each type of payer
(check, eclectic, and electronic), respondents generally rate electronic methods that they use
(bars in the top graph) higher than electronic methods that they do not use (bars in bottom
graph), with only a few exceptions: Among electronic payers (deepest bars), privacy and
payment timing (fourth and sixth characteristics) are rated about the same for electronic
methods, whether these respondents use them or not. More than 50 percent of electronic payers
rate electronic payment methods that they do not use as better than checks only for convenience
(ease) and payment timing. Thus, it appears that adoption of electronic payment methods by
respondents is also generally consistent with their assessments of superiority of electronic
payment methods.
Although these results do not constitute sufficient proof that consumers’ payments
decisions are consistent with their reported relative payment characteristics, they do suggest
that there is no obvious behavioral inconsistency among the Fed respondents. When it comes to
understanding the diversity of payment behavior among consumers, it is difficult for
researchers to distinguish accurately among the following possible sources: measurement error,
heterogeneity of consumer circumstances, heterogeneity of consumer preferences (utility
functions), irrationality (as explained by behavioral economics), or other important
determinants of consumer payment behavior. Nevertheless, our findings show that respondents
choose payment methods that are broadly consistent with their ratings of the relative
characteristics of those methods. More research should help us determine whether assessments
47 One caveat is that self‐reporting, especially in the context of a survey that also asks about relative characteristics, may induce a bias toward false consistency.
37

of relative characteristics accurately reflect the actual payment system and economic choices
faced by consumers.
6 Application to Federal Reserve Operations
A considerable portion of Federal Reserve Bank operations is devoted to running a
business: the provision of payments services.48 Like any business in the marketplace, the Fed
needs to understand its customers. So, naturally, the Federal Reserve payments staff are well
acquainted with the needs of their direct customers, banks. Consumers, however, are not direct
customers of the Fed, but rather customers of banks.
In our focus group interviews with Boston Fed payments staff, we discovered a lack of
detailed familiarity with the needs and values of end‐users of payments, particularly
consumers. The prevailing view was characterized by an overriding concern about the cost‐
efficiency and frontier technology of the supply of payment methods. In contrast, consumers’
tastes and preferences were judged to be much less important factors in decisions about the
supply of payment methods. In fact, the staff assumed, at least implicitly, that consumers would
adopt the payment methods supplied to them precisely because those methods were the most
cost‐efficient and high tech. For example, although Boston was among the System leaders in
developing and implementing check image technology (originally for Treasury checks), the staff
were not well informed about consumer attitudes toward imaging before implementing the
technology. Although the Fed’s customers (banks) may have a somewhat greater understanding
of consumer payment behavior than the Boston Fed payments staff, we learned that the Boston
Fed staff are not privy to much of this proprietary bank information.
The sudden, swift, and large decline in total U.S. check‐writing, which has not yet been
fully explained, is helping to elevate the importance of understanding consumer payment
48 In fact, for certain designated priced services to depository institutions, Section 11A of the Monetary Control Act of 1980 (MCA) requires the Federal Reserve to set fees to recover, over the long run, all direct and indirect costs and imputed costs, including financing costs, taxes, and certain other expenses, as well as return on equity (profit) that would have been earned if a private business firm provided the services. In setting the fees, the MCA requires that due regard be given to competitive factors and the provision of an adequate level of such services nationwide. For an example of this principle applied to a cost of equity capital analysis of Reserve Bank rates of return, see Barnes and Lopez (2005).
38

behavior within the Federal Reserve. Now, the Fed, as well as other stakeholders (the banking
industry, payments providers, and the like), sees clearly that it has an increased need to
understand payment trends and to assess implications of changes in consumer payment
behavior. What impact will further declines in check volume have on operating costs, staffing,
and revenue—not only in check services, but in other complementary and competing payment
services? The Fed, along with commercial banks, must consider how rapidly to downsize or
consolidate in order to contain costs, and in which products and services to continue to invest or
divest.
Having better information to improve one’s ability to understand and predict the future
of products and the marketplace is critical to making good decisions in any business. For the
Fed and the rest of the payments industry, this information includes recognizing and
understanding the role that consumers play in the demand for payment services. To contribute
to the accumulation of this information, we included questions in the payment survey that bear
directly on four issues related to changes in the check‐processing environment that are of
specific interest to the Federal Reserve and commercial banks: 1) reduction in check float; 2)
increase in electronic imaging of checks; 3) conversion of checks to ACH payments; and 4)
provision of alternative payment services, especially stored‐value cards.
6.1 Sensitivity to Changes in Check Processing
We begin with an assessment of the overall responsiveness to changes in the check‐
processing environment. The questions aim to determine whether these particular changes are
likely to affect respondents’ check‐writing behavior and, if so, how and why. Table 7 presents
the central results from questions about four changes (some posed as hypothetical questions,
some asking about actual behavior) to summarize respondents’ stated reactions to these
changes.
In general, a substantial majority of Fed respondents would not or did not alter their
check‐writing behavior in response to hypothetical or actual changes in the check‐processing
environment. Table 7 shows that 69 percent of respondents stated that they would not alter
their behavior if check float were eliminated; 86 percent would not alter their behavior if they
were no longer able to receive cancelled checks; and 73 percent and 90 percent, respectively,
39

have already accepted POS check conversion and ARC conversion without changing their
behavior. Among those who would or did change their check‐writing behavior, the primary
reasons and the primary responses given were different in each instance. These results further
underscore the difficulties facing payments providers and policymakers who are trying to
understand changes in consumer payment behavior.
Two caveats are in order. First, the proportion of respondents who would or did change
their check‐writing behavior is not trivial in any of the cases. More than one in four respondents
either said that they would alter behavior (27 percent, if confronted with POS check conversion)
or did alter behavior (31 percent, in response to the elimination of check float). Because this
represents a sizable fraction of respondents, it is important to understand the motivation for the
change. For policymakers, it may be important to know whether the changes improve the
welfare of society as a whole; this, in turn, requires an understanding of the tastes and
preferences of all consumers. Second, the response to changes in the check‐processing
environment—particularly to changes in unfamiliar high technology—is probably influenced
by the fact that respondents are Fed employees. Because of their greater familiarity with
payments technology, Fed employees may be more accepting of changes than the general public
would be.
6.2 Check Float
Float is the interval between the physical writing of the check (payment) and the time
when the funds are deducted from the consumer’s checking account (settlement) by the bank.
The payee, U.S. mail, payee’s bank, and even the payer’s bank may all contribute to the delay
between payment and settlement. Consumers take advantage of float for a variety of reasons.
The simplest one is that they benefit from interest paid, either directly on the checking account
funds or indirectly on other interest‐bearing assets, until those assets are transferred to the
checking account. Float also can function as an interest‐free loan for a consumer who has
insufficient funds in a checking account at the time of payment. The consumer values this loan
at his or her rate of time preference, which can vary across consumers and is very large for
impatient consumers, but the prevailing market interest rate also influences the consumer’s
decision whether to exploit the float.
40

We asked Fed respondents whether they would change their check‐writing behavior if
their float were reduced to less than one day (question 4). This question was hypothetical and
general, without reference to a particular manner in which the float would be eliminated, and it
was worded to indicate that the money would be withdrawn from the checking account the
same day the check was written. Thus, float might be reduced by varying amounts for different
types of check payments, but there was no implication that float would be eliminated entirely.
More than two‐thirds (69 percent) of respondents said that they would not change their
check‐writing behavior if their float were reduced, as shown in Table 7. The simplest potential
implication is that float, which is relatively short in modern times, may not be an economically
significant consideration for most respondents. Because of their relatively high incomes and
wealth, it may be unlikely that many Fed employees were using float as an interest‐free loan to
finance consumption. Thus, they might not need to switch to another payment method to
provide them that loan. Moreover, with interest rates relatively low—especially on bank
checking accounts—and with checking account balances a relatively small portion of consumer
wealth, the interest earned from float is very modest (recall that only about half of Fed
respondents with checking accounts earn interest on their balances).49
For the nearly one‐third (31 percent) of respondents who have a checking account and
who would alter their behavior, the reason to change might partly be the loss of interest. Fed
employees who are more sophisticated than others in managing their assets and rates of return,
and thus more sensitive to changes in float, may be among those whose behavior would
change. Furthermore, these financial sophisticates may be more aware of the implications of
changes in float for the relative costs and benefits of all payment types, and therefore more
likely to act on them.
49 However, the incomes and wealth of most individuals (including Fed employees) are not generally on a scale (like those of some corporations) associated with the writing of checks of such high amounts that even a day or two’s worth of interest can amount to a substantial sum. Consider the following example. Suppose a consumer had an average daily checking account balance of $10,000 and earned 5 percent annual interest—both amounts are probably unusually high for the average U.S. consumer. Then a change in float that reduced the average daily balance to $8,000 by clearing checks much faster would cost the consumer only about $100 per year in interest.
41

Some electronic payment methods reduce float, as explained in detail below, but we do
not know how clearly the respondents observed the changes in float. Conversion of paper
checks to ACH payments accelerates settlement and reduces float. Some aspects of electronic
imaging of paper checks, most of which are not well observed by consumers, also accelerate
settlement and reduce float (imaging connected with canceled checks and bank statements, as
described below, is one case where it does not). If changes in float were the only implication of
these payment methods, then 31 percent would be an upper bound on the share of respondents
who might change their check‐writing behavior in response to these changes. However, these
payment methods involve other potentially beneficial features, so reduced float (a disadvantage
for consumers) may have some impact that we cannot identify separately in these other
payment methods.
6.3 Electronic Processing
By 2004, most U.S. consumers with a checking account had encountered, or at least
heard about, new electronic technologies introduced to the processing of checks. Two types of
change are most apparent. First, banks are beginning to create electronic check images from
paper checks, a development that consumers may notice most in the way banks do or do not
return checks. However, check imaging can also affect the clearing of checks between banks,
including the Fed; this effect occurs behind the scenes and may be difficult for consumers to
observe. Check imaging is being used by banks to expedite the clearing process (thereby
reducing float) and to reduce the costs of handling paper checks. Public acceptance of check‐
image exchange has been greatly facilitated by passage of The Check Clearing Act for the 21st
Century (or Check 21).50 Second, many companies that are paid by check are converting the
checks upon receipt to an ACH debit (ARC), thereby accelerating clearing, reducing float, and
eliminating return of the check to the consumer.
6.3.1 Check Imaging
Because the Fed has been a leader in promoting check image products since the mid‐
1990s, it has a keen business interest in understanding the impact of check imaging on 50 One of the main accomplishments of Check 21 is to give a substitute check (a paper reproduction of an original check from an electronic image) the same legal status as the original paper check, provided it meets the specified legal requirements. For more details on Check 21, see Board of Governors (2006b).
42

consumer check‐writing behavior. Based on our focus group interviews, we realized the
importance to the Fed of understanding consumers’ attitudes toward check images. With this in
mind, we asked respondents about their willingness to receive images of canceled checks from
their banks (questions 5–8) in place of the paper checks themselves (the image is an electronic
picture of the canceled paper check, usually front side only).51
Almost everyone knows someone who insists on receiving canceled paper checks from
their bank, cataloguing them meticulously, often in old shoe boxes. Apparently, however,
canceled checks are not very important to most Fed respondents. Table 7 reveals that only 14
percent of Fed respondents with checking accounts would change their check‐writing behavior
if their financial institution stopped returning canceled checks. Nevertheless, those who would
change would make rather drastic changes. About half of those changing behavior (7 percent
overall) would react by changing their financial institution, presumably to one that did return
canceled checks, and about half would reduce or eliminate check‐writing altogether.
Most likely, the 86 percent of respondents who would not change their check‐writing
behavior do not place high value on receiving their canceled checks. Figure 11 indicates that 75
percent of respondents do not receive canceled checks, and only 11 percent of those who do,
said it was very important to receive canceled checks. The mix of responses may be a reaction to
existing bank practices rather than a strong preference: Check image may not be offered at one
bank; at another bank check image may be the only option. Although 21 percent of respondents
indicated that it was somewhat important to receive their canceled checks, only two‐thirds of
them (14 percent overall) would change their behavior.
The vast majority of Fed respondents with a checking account (91 percent) were willing
to accept a check image (either electronically or on a paper copy) instead of a canceled check, as
shown in Figure 11. The reasons given by the 9 percent who were unwilling to receive check
images were highly varied; no single reason accounted for even one‐tenth of the negative
responses (question 8A). The second most common reason given was that respondents want
copies of the front and back of the check (with the bank cancellation stamp) rather than just the 51 Although we did not ask about the specific impact of imaging on float, an effect that occurs when check images are used by banks in the process of clearing checks, it would be interesting to know the extent to which consumers observe and respond to this effect.
43

front.52 Other reasons given were the notion that the images generated too much extra paper,
concern about theft or errors, or simply wanting the original checks back.
If demand for the return of canceled checks appears not to be widespread, then why are
check‐image acceptance rates so low in the banking industry? Perhaps banks have not been
trying hard enough to market the feature or to get at the root causes of resistance. The results
suggest that banks may have an opportunity to increase the use of check image and to cross‐sell
other electronic services, such as online banking and bill payment. The Fed and other financial
institutions need good data to develop forecasts of check use in coming years in order to decide
which of these payment businesses and products to invest in further. If Fed employees are
representative of U.S. consumers with regard to attitudes toward and acceptance of check
image services, our results may suggest that the supply of check image services to consumers
will grow relatively rapidly in the near future. However, the intensity of resistance to check
imaging among a small proportion of respondents and the multiplicity of reasons given for the
resistance suggest that it may be difficult to completely eliminate check‐writing any time soon.
More understanding of the economic and psychological underpinnings of these attitudes is
needed.
6.3.2 Converting Checks to ACH
Because the Fed has also been a leader in providing electronic payments settlement
through its Automated Clearing House (ACH) network, it has a keen business interest in
understanding the impact on consumer demand for checks of conversion of paper checks to
ACH.53 Direct ACH use by respondents (pre‐authorized debits), although growing rapidly, still
lags far behind check‐writing (8 percent versus 30 percent of respondents’ monthly transactions,
Figure 4). However, our survey results suggest that the triggering of indirect consumer ACH
payments by business applications is an important determinant of the increase in ACH volume
52 The most common reason given for unwillingness to accept a check image was that respondents do not need the image. This response probably is not a sign of unwillingness to accept a check image as a substitute for a paper check but rather a reflection of lack of need for a paper record of either type. Indeed, of the 399 respondents who were “unwilling” to receive a check image, 254 (64 percent) reported not receiving canceled checks from their financial institution (Question 5) anyway. 53 In 2003, ACH transactions totaled 10 billion and were expected to double in the subsequent five years as ACH expands to more consumer applications. For more details, see NACHA (2004).
44

and that this conversion contributes indirectly to the decline in check‐processing volume over
and above the decline in check‐writing per se. Therefore, we asked respondents questions about
their experience with, and attitudes toward, indirect ACH payments (questions 32–42).
Consumer‐initiated indirect ACH payments occur in at least two instances—at the
point‐of‐sale (POS) and at the lockbox (ARC).54 Increasingly, consumers are beginning to
encounter situations where payees are engaging in these kinds of check conversion, so
consumers are faced with a decision whether to participate in the conversion. Because
conversion changes the way consumers’ checks are processed, it alters the fundamental
characteristics of check payments facing consumers. Consumers’ reactions to conversion
provide data that may shed light on their payment preferences and help the Fed improve its
efficiency in providing payments. Check conversion accelerates the clearing process and
reduces float because the demand deposit account is debited the same day or the next. Thus,
respondents who would alter their check‐writing behavior in response to lost float might react
in a similar manner to conversion, although other characteristics of these payment methods
may matter to respondents as well.
Table 7 indicates that most Fed respondents who were confronted with check
conversion did not change their payment behavior: Only 10 percent did so for Lockbox/ARC
and 27 percent for POS. Both percentages are lower than the 31 percent of respondents who
would alter their payment behavior if they lost their float. So, either the respondents were
unaware that check conversion reduces float or other factors restrained their actions (or both).
Because the loss of float is greater for POS conversion than for ARC (float still occurs with ARC
during the U.S. mail delivery period), one might expect a greater response to POS conversion.55
54 In POS conversion, the consumer writes a check, the cashier scans it to create an ACH debit, and the cashier returns the “processed” check to the consumer. In lockbox conversion, the consumer mails a paper check for a recurring bill to a third‐party processor, which converts it to an electronic ACH debit; this is called Accounts Receivable Conversion (ARC). On the consumer’s bank statement, a transaction message “ARC e‐check (check #)” appears in place of the check detail. The paper check is destroyed, never entering the check processing system or being returned to the consumer. POS and ARC transactions are no longer governed by check law, but are considered to be ACH transactions that are governed by ACH rules and regulations (Regulation E, NACHA; see NACHA 2005). 55 In fact, the data from NACHA on payment volume attributable to POS conversion (falling) and ARC (rising) seem to bear out this hypothesis. See NACHA (2006) for more details.
45

However, familiarity with check conversion probably influenced the results, too. At the
time of the survey (June 2004), respondents’ experience with conversion was relatively limited,
as can be seen in Table 8. Only 52 percent of respondents had experienced POS conversion, and
a mere 16 percent had experienced the newer ARC, which can easily be overlooked in a
standard Bank statement if consumers do not conduct a thorough reconciliation of their
checking accounts.56 Thus, relatively less familiarity with ARC may be one reason why
relatively fewer respondents said they would change their payment behavior to avoid
experiencing ARC. Among consumers who had experienced check conversion, most knew that
their paper check had been converted (91 percent for POS, and 67 percent for ARC, Table 8).
At the time of the survey, a rule change in ARC procedures occurred that increased
consumers’ knowledge about ARC transactions and we wished to learn what effect, if any, this
new information would have on consumers’ payment behavior. As of June 11, 2004, pursuant to
NACHA rules, companies were “strongly encouraged” to notify U.S. consumers of their right to
“opt out” of conversion of their checks to ARC and to provide information about how to do
so.57 We asked survey participants whether they would exercise this right under the
circumstances, and about half said no, as shown in Table 8. Another 38 percent indicated that
they were uncertain, perhaps because they did not understand the service, and 13 percent said
they would opt out of ARC. The most common reasons respondents cited for opting out were
check return, float benefits, and concerns about errors. However, it should be noted that opting
out requires an active and time‐consuming response from consumers, who must notify the
originator of the ARC, and this may have inhibited some consumers from opting out. 56 However, 14 percent were unsure whether they had experienced ARC, so the actual percentage having experienced it may be a bit higher. About one‐third of respondents indicated that the question was not applicable, from which we assume that they do not pay their recurring bills via check. These respondents probably pay their recurring bills electronically via automatic ACH debits to their bank accounts or credit cards, or use online bill payment. 57 Prior to June 11, 2004, the official staff commentary to Federal Reserve Regulation E stated: ʺA consumer authorizes a one‐time EFT (in providing a check to a merchant or other payee for the MICR encoding), where the consumer receives notice that the transaction will be processed as an EFT and completes the transaction.ʺ In other words, Regulation E required consumers to be notified in advance that their check would be converted, thus giving consumers the choice to not participate in ARC by choosing not to mail their check to the company. To enhance customer service for consumers who may be opposed to check conversion, NACHA implemented the rule change for ARC that suggested notification of the opt‐out possibility to help clarify further consumers’ rights and options.
46

When respondents were confronted with paper check conversion and did change their
payment behavior, the payment venue clearly was an important determinant of the payment
method substituted. According to Table 7, POS conversion (which concerns retail payments)
primarily prompted substitution to debit cards, whereas ARC (which concerns recurring
payments) primarily prompted the substitution of online bill payment. This result further
underscores the heterogeneity of consumer payment behavior by venue.
Two additional manifestations of heterogeneity are evident from the results on payment
methods to which Fed respondents switched because of check conversion, as shown in Figure
12. First, they switched to many payment alternatives within each type of conversion. When
faced with POS conversion, most responses indicated a switch to debit card (43 percent of
responses from respondents who switched), while a substantial share of responses indicated a
switch to credit card (29 percent of responses) or cash (23 percent of responses). Responses from
the small number of respondents who switched in reaction to ARC mostly indicated a switch to
online bill payment (38 percent of responses), but credit cards and other methods (23 percent of
responses each) were also popular choices, as was ACH (17 percent of responses).
In a second form of heterogeneity, responses indicated a switch to various payment
alternatives across conversion types. A similar share of responses indicated a switch to credit
cards (29 percent of responses for POS, versus 23 percent for ARC), but the share of responses
indicating switching to other methods was quite different for each conversion type.
The most extreme aversion to check conversion—that is, reduction or discontinuation of
patronage—is rare. Table 8 shows that only 10 percent of the subset of respondents who knew
that their checks were converted using POS altered their retail shopping behavior. Only 6
percent who knew that their checks were converted with ARC altered the companies to whom
they made recurring bill payments. Most who changed retailers reported that they did so
because they “didn’t like” the check conversion. This kind of deep preference is something
many economists would argue is fundamental to consumer character and cannot be changed.
Some respondents who changed the companies they paid by check did so because the
companies had not asked their permission to convert the check. This reason suggests that
fairness or business ethics can be a determinant of consumer payment behavior.
47

Open‐ended questions in the survey (questions 34, 36, 39, and 41) shed some light on the
reasons respondents reacted the way they did. The vast majority of respondents who were
prompted by check conversion to switch to debit cards (the most popular choice in this
circumstance among those who switched) did so because they believed that debit cards do the
same thing as checks. Many who switched to any of these methods did so simply because they
do not like the check conversion process for some reason. Some switched because they wanted
the paper check or check image back, and some simply wanted to control the timing of the
payment.
The heterogeneity of responses to check conversion highlights the complexity of
consumer payment behavior. Two basic conclusions stand out. First, at least some consumers
who do not like changes in their payments environment will respond by changing their
shopping or payments behavior, a fact that payments providers need to consider. Second,
consumers’ reactions to changes in the payments environment depend on many factors.
6.4 Stored‐Value Cards
Amid the ongoing transformation of the payment system, many new payment methods
are emerging, challenging traditional Fed payment services and raising questions about the
Fed’s role. According to its 1990 policy statement, “…the role of the Federal Reserve in
providing payment services is to promote the integrity and efficiency of the payments
mechanism and to ensure the provision of payment services to all depository institutions on an
equitable basis, and to do so in an atmosphere of competitive fairness.”58 In addition to this
general statement, the Fed’s 1981 guidelines for providing financial services specifically allow
Reserve Banks “…to modify existing services or to offer new services, as appropriate, to meet
the specialized and changing needs of financial institutions and the public.” However, more
recent statements from Fed officials express a clear preference for private‐sector solutions. For
example, from Stern (2003): “…the Federal Reserve and other government entities must clearly
demonstrate that a new product or service will improve social welfare before offering it,” and
“…without market failure, there is no reason to believe that government intervention in
payments markets ... will lead to a superior allocation of resources.”
58 See Board of Governors (1990).
48

In evaluating a potential role for the Fed in emerging payments, perhaps the most
obvious instrument to consider is the stored‐value card (SVC). Because an SVC is essentially a
form of electronic cash, it competes directly with traditional cash (paper currency, or Federal
Reserve Notes, and coinage). If the Federal Reserve or the U.S. Treasury ever considers issuing
cash in an electronic format, that format is likely to be some type of technological and financial
descendent of the SVC. In fact, the Boston Fed has been working with the Treasury for many
years to develop SVC applications for U.S. military personnel.59 Likewise, the Financial
Management Service of the U.S. Treasury, which disburses nearly 1 billion Federal payments to
100 million recipients each year, also has a great need to understand alternative payment
instruments like SVCs.
In focus group interviews, we discovered an interest among Fed payment experts
working with cash and smart cards to understand better consumers’ attitudes toward SVCs. For
this reason, we included SVCs as one of the main payment methods in the survey, even though
their use is limited to a relatively narrow set of applications. We have already discussed results
pertaining to SVCs in general. Although nearly half the respondents reported increased use of
SVCs during the previous three years (43 percent, Figure 7), SVCs are still not very popular
compared with other payment methods (only 3 percent of monthly transactions, Figure 4). More
specifically, they are not used much in retail payments (less than 1 percent of transactions,
Figure 5), and they are not viewed as good substitutes for paper checks for retail payments (also
less than 1 percent, Figure 9), despite being rated as better than, or the same as, checks on all
characteristics but one for all venues (Table 6).
We also asked about specific SVC use (question 26), including cards issued for internal
use at Federal Reserve locations (presumably for the cafeteria, coffee and gift shops, and the
like, although the survey did not ask about the specific kind of SVC used). Figure 13 shows the
shares of SVC‐user respondents who use each kind of stored‐value card. Eighty percent of the
SVC‐user respondents indicate use of a gift card, and almost half indicate use of a phone card,
but very few other kinds of stored‐value cards are used. In particular, only 7 percent of Fed
59 Because these cards include a computer chip that may incorporate the latest high‐technology and security features, they are sometimes called “smart” cards.
49

employees use internal Federal Reserve SVCs. However, this result is likely influenced by the
absence of SVCs at some Fed locations. As Figure 13 shows, responses suggest that use of
internal SVCs at the Boston Fed is much higher than the rate of use across the System as a
whole, at 50 percent, and the responses indicating such use in Boston actually increased from
2003 to 2004.60 Although these cursory results on SVC use are interesting, much more data and
research are needed to gain a better understanding of the low rate of use of SVCs among
respondents
7. Potential Public Policy Implications
We have argued that it is important to understand consumers’ preferences and the
payment behavior they induce, to be able to form a coherent interpretation and forecast of the
payments transformation. We believe that the Boston Fed consumer payment survey begins to
suggest some important factors in the determination of consumers’ preferences and behavior.
However, to understand the economic importance of consumer behavior and payment choice
more fully, it is necessary to examine the welfare of society as a whole. As described in a speech
by Minneapolis Fed President Gary Stern (2003), the payments transformation must be
evaluated in the context of social welfare, and public policies that are consistent with
maximizing that welfare must be developed. 61
60 In the Boston Fed pilot survey, we also found that about one in three respondents who used a stored‐value card used only a Fed stored‐value card. These employees, who presumably were attracted to the stored‐value card at the Fed because of synergies with the workplace, also tended to be respondents who wrote far fewer checks than did consumers who did not hold a stored‐value card at the Fed. 61 To quote Stern, “A policymaker’s overriding concern is improving the welfare of society as a whole. And I am specifically thinking of social welfare in the sense that economists use the term; that is, allocating resources to maximize the benefits that society receives from them. This perspective is not one that leaders of a private‐sector banking organization or other participants in payments usually take, nor should it be. But for the Federal Reserve, an institution created to further the public interest, net societal benefits are critical. A focus on social welfare and resource allocation may sound of only theoretical value, but it has some pertinent implications for how I view both developments in the payment system and the manner in which the Federal Reserve ought to respond to those developments. For example, because of the focus on resource allocation, I, unlike the head of a private firm, view social welfare from the vantage point of households. This means that I support developments that in the aggregate improve the welfare of households, even if in some sense they make some Federal Reserve financial services, and related private firm services, worse off.”
50

Thus far, consumers’ welfare with regard to payments has been a relatively neglected
aspect of the evaluation of social welfare. Although the Boston Fed consumer payment survey is
a step in the direction needed to evaluate social welfare, it is a modest and imperfect step.
Clearly, a great deal of additional data and research on consumer behavior and payment choice
are needed before public policymakers can design and implement the policies necessary to
optimize this aspect of social welfare.
To help motivate this research agenda, we draw attention briefly to some current real‐
world payment issues that are particularly relevant to at least some consumers, and therefore
potentially important in the evaluation of social welfare and public policy. However, given the
incomplete state of knowledge about consumer preferences and payment behavior, we cannot
draw any firm conclusions about these issues yet. Instead, we simply provide a list of
prominent issues, along with some key questions:
• The unbanked and offline – According to Jacob et al. (2005), up to 20 million U.S.
households in 2000 were unbanked (without a checking or saving account);
according to the U.S Census Bureau (2005), about 45 percent of U.S. households in
2003 were offline (without access to the Internet at home).62 Clearly, the use of
electronic payment methods by these unbanked and offline consumers is limited.
Why are some consumers unbanked or offline? What policies are in the best interest
of consumers who: a) want to become banked or online but cannot; or b) do not want
to become banked or online but may have no reasonable alternative?
• Interchange fees – Credit card associations charge merchants a fee as large as about 2
percent of the transaction value when consumers pay by credit card or debit card.
Many merchants are involved in a major legal battle over these fees with Visa,
Mastercard, and some major commercial banks, currently pending in U.S. District
62 For more on the challenges regarding the unbanked, see the proceedings of a conference sponsored by the Federal Reserve Bank of Philadelphia (Federal Reserve Bank of Philadelphia 2005). Regarding the offline, researchers from Kennickell and Kwast (1997) to Kim, Widdows, and Yilmazer (2005) so far have been able to discover the characteristics of consumers who use the Internet for payments, but not the reasons why consumers are (or are not) using it.
51

Court in New York.63 Thus far, attention to this issue has generally focused on the
viewpoint of retailers rather than the viewpoint and welfare of consumers.64 Are
interchange fees a consequence of uncompetitive market power? Are interchange
fees passed on to consumers in higher retail prices? If so, are consumers aware of
this price increase, and do they make informed payment decisions based on it?
• Identity theft – Identity theft has gained prominence in the media, and is alleged to be
growing fast and threatening to undermine the benefits of high technology and
electronic payment methods.65 Easier access to credit, proliferation of personal
information via the Internet, and advances in computer technology and hacking are
making consumers more susceptible to the work of identity thieves—in part because
publicly available court documents contain personal financial information. This
problem is particularly extreme in Phoenix, Arizona, which reportedly has the
highest rate of identity theft in the nation.66 Is the threat of identity theft a significant
deterrent to the adoption of electronic payment methods? Are consumers aware of
the threat and the large costs of credit repair? Are consumers sufficiently protected
from identity theft?
• Stored‐value card costs – Disclosure of credit card fees and lending terms have long
been a concern for consumers. Now, similar issues are arising with stored‐value
cards, which can have very high fees that often are hard to discover. In some cases,
63 The “Payment Card Interchange Fee and Merchant Discount Antitrust Litigation” case is a multi‐district litigation (MDL) in the Eastern District of New York that combines 49 related lawsuits. 64 For example, see the proceedings of a Federal Reserve Bank of Kansas City conference on interchange fees in 2005 (Federal Reserve Bank of Kansas City 2005). 65 The Boston Fed’s brochure Identity Theft (http://www.bos.frb.org/consumer/identity/idtheft.htm) says the FBI calls it one of the fastest growing crimes in America. However, comprehensive and statistically reliable data on the growth of identity theft are relatively scarce. 66 For more details, see Leland and Zeller (2006).
52

this problem is hitting the lower‐income segment of society hardest.67 Are consumers
adequately informed about the costs associated with stored‐value cards? Do issuers
of these cards earn uncompetitive profits? How effective are these stored‐value cards
for consumers without bank accounts, particularly for government transfer
payments?
Together, these real‐world payments issues highlight the importance of gaining a better
understanding of consumer preferences and social welfare.
8. Conclusions and Future Directions
When we first considered the consumer payment survey, our expectations of
discovering convincing and enlightening information about why consumers make their
payment choices were low. The survey was primarily a leadership development project, our
resources were limited, the prospective sample was not representative, and we had very little
guidance from existing data and research on consumer payment behavior. Nevertheless, the
results from the initial survey of Boston Fed employees in 2003 were sufficiently intriguing to
warrant a survey of all Federal Reserve System employees in 2004, and those results, described
in this paper, seem intriguing enough to pursue additional research and data collection.
Although the survey has its limitations, we have identified the following specific
elements of success:
• High response rates – The response rate of 24 percent for the System (and 40 percent in
Boston) far exceeded our expectations for a voluntary survey run by a team of
67 “Caught in the consumer backlash against the fees and expiration dates attached to gift cards, mall operator Simon Property Group is fighting back. The Indianapolis company filed suit in federal court against the Massachusetts attorney general’s office, claiming that Simon Visa gift card is not subject to state law and is therefore exempt from any civil enforcement action taken by the state office. The suit was filed in response to a letter from the attorney general, notifying Simon of its intent to bring a civil enforcement action. Because the gift card is issued by Bank of America and banks are federally regulated, Simon argues that its card is not subject to state law.” (Aoki 2004). Specifically, Massachusetts deems this gift card illegal because of its one‐year expiration date, its $1.50 initial‐handling fee, and its $2.50 monthly dormancy fee that goes into effect after six months. Simon, which operates 14 malls in Massachusetts, including South Shore Plaza and Copley Plaza, has stated that it sold $10 million worth of the cards in December 2004 alone (Aoki 2004).
53

Boston Fed employees without high‐level authority, and far exceeded the response
rates of many private surveys.
• Enthusiastic participation – We received widespread anecdotal reports that survey
participants actually enjoyed completing the survey and thinking about the issues it
raised.
• Changed behavior – We also received widespread anecdotal reports that survey
participants’ payment behavior changed as a consequence of taking the survey.
Apparently, the survey forced participants to think about why they were making the
payment choices they made, and the introspection led to change. This result bodes
well for consumer education.
• Importance of reported payment characteristics – Although we do not explore and show
this result in full detail in this paper, observed payment characteristics (as reported
by respondents) are remarkably important in explaining respondents’ payment
choice—far more important than key demographic variables, including income (see
Schuh and Stavins 2005).
• Importance of heterogeneity – The results reveal widespread heterogeneity in consumer
payment behavior, increasing the difficulty in understanding the best design of the
payments system. This finding suggests that we need to develop a much deeper
understanding of why individual consumers choose their payment methods than is
developed by looking at simple, easily observable consumer characteristics like
demographics.
Of course, the survey project had a number of serious limitations, which we have noted
already. Given the motivation to develop a deeper understanding of consumer payment
behavior, we conclude with a list of some important issues for future data collection and
research:
• Survey design flaws – The Boston Fed survey contains some design flaws, which are
listed in detail in Table 9. These flaws should be corrected before the survey is used
in another application.
54

• Use a representative sample – Future surveys and data collection should be undertaken
using nationally representative samples. As we noted in the beginning, we are
collaborating with the AARP in 2006 to conduct a representative version of the
Boston Fed consumer payment survey. More generally, effort should be given to
developing the most accurate estimates possible of aggregate U.S. payments
volume.68
• Don’t forget cash! – By focusing on paper checks and electronic methods, the Boston
Fed survey overlooked the importance of studying the use of cash. The surprising
resilience of demand for cash, even in today’s technologically advanced marketplace,
suggests the need for a more extensive study of cash payments.69
• Avoid conditional survey questions (unless they are obviously appropriate) – We
inadvertently designed the Boston Fed survey in such a way that many questions
that we intended (and needed) to ask of all respondents were asked only of those
who responded a certain way on (a) prior question(s).
• Avoid overtaxing respondents with multiple, similar questions – Likewise, the extent to
which respondents can continue to answer similar questions without losing patience
or focus was probably taxed.
• Avoid overlapping or ambiguous choices – Be precise in defining choices intended to be
mutually exclusive. For example, the following were among the response choices
offered for Question 22 (“If you use Internet bill payment for bills you previously
paid by check, what made you switch?”): “Faster to pay bills online,” “More
convenient than a check,” and “Easier/better record keeping.” Both “Faster to pay
bills online” and “Easier/better record keeping” can be interpreted as aspects of
68 In a panel discussion of the need for payments data at the Boston Fed’s 2006 Consumer Behavior and Payment Choice conference, Jeff Marquardt of the Federal Reserve Board cited this objective as one of the most important priorities in the development of payments data. 69 The Federal Reserve Banksʹ Cash Product Office (CPO) intends to conduct a large‐scale survey of U.S. businesses to understand trends in payments and business cash management practices. A smaller‐scale pilot study is scheduled to be completed by April, 2007, and published later in the year. For more information, see http://www.frbservices.org/Cash/paymentssurvey.html .
55

“More convenient than a check.” In this example, it might have been better to omit
“More convenient than a check” or to define more precisely what was meant.
• Question order – Investigate the importance of asking general attitude questions
toward electronic payments after having asked specific questions about use, and vice
versa, as question order may affect the responses to the attitude questions. Use
appropriate survey design techniques to control for the potential effect on responses
of the order in which questions are asked.
• Take into account the fact that payment choice is a joint decision – The consumer
perspective on payment choice has been somewhat neglected, so it is important to
study consumer behavior. However, the payment choice is made jointly between the
two parties involved in the payment. The survey results show that payment choice
varies across transactions and parties (and even payment value). Therefore, surveys
of consumer payment behavior are likely to be more effective if they include
information about both parties (business and consumer) involved in the payment.
• Aim to understand payment characteristics and how they are understood by consumers –
Given the remarkable importance of relative payment characteristics in determining
payment choice, it is clearly important to develop a deeper and more precise
understanding of these characteristics. As discussed in Section 5, it would be helpful
to know things like how these characteristics are determined and measured; how
well consumers observe, perceive, and understand them; and what roles might
consumer education or public policy play in improving the supply of and demand
for different types of payment services to consumers. For example, what aspects of a
given attribute—such as cost or convenience—are most important in the eyes of
consumers, and why? More definition and exploration of this key idea and
information are vital.
56

References
American Bankers Association and Dove Consulting (2005). 2005/2006 Study of Consumer Payment Preferences: Summary of Findings. Washington: ABA and Boston: Dove Consulting.
Anguelov, Christoslav E., Marianne A. Hilgert, and Jeanne M. Hogarth (2004). “U.S. Consumers
and Electronic Banking, 1995–2003.” Federal Reserve Bulletin, Winter, 1–18. Aoki, Naomi (2004). “Simon Property Sues.” Boston Globe, November 13, 2004. Benton, Marques, Krista Blair, Marianne Crowe, and Scott Schuh (2004). “Consumer Payment
Survey: Federal Reserve System.” Unpublished report. http://www.bos.frb.org/economic/eprg/FRBBsurvey04.pdf Accessed September 11, 2006. Board of Governors of the Federal Reserve System (1990). “The Federal Reserve in the Payments
System.” http://www.federalreserve.gov/paymentsystems/pricing/frpaysys.htm. Accessed September 11, 2006. Board of Governors of the Federal Reserve System (2004). Report to the Congress on the Disclosure
of Point‐of‐Sale Debit Fees. Submitted to the U.S. Senate Committee on Banking, Housing, and Urban Affairs, November. Washington, DC: Federal Reserve Board.
Board of Governors of the Federal Reserve System (2006). FRB: OSS‐2 FRB Index. http://www.federalreserve.gov/pubs/oss/oss2/scfindex.html. Accessed September 11,
2006. Board of Governors of the Federal Reserve System (2006). FRB: Check Clearing for the 21st
Century Act. http://federalreserve.gov/paymentsystems/truncation/default.htm. Accessed September 11, 2006.
Barnes, Michelle L. and Jose A. Lopez (2005). “Alternative Measures of the Federal Reserve
Banks’ Cost of Equity Capital.” Federal Reserve Bank of Boston Public Policy Discussion Paper 05‐2.
Camerer, Colin F. and George Loewenstein (2004). “Behavioral Economics: Past, Present, and
Future,” in Colin F. Camerer, George Loewenstein, and Matthew Rabin, eds., Advances in Behavioral Economics, Chapter 1, 3‐51. Princeton and Oxford: Princeton University Press.
57

Dunn, Lucia F., Tufan Ekici, Paul J. Lavrakas, and Jeffrey A. Stec (2004). “An Index to Track Credit Card Debt and Predict Consumption.” Ohio State University Economics Working Paper WP04‐04.
Federal Reserve Bank of Atlanta (1981). A Quantitative Description of the Check Collection System:
A Report of Research Findings on the Check Collection System. Volumes 1 and 2. http://www.frbatlanta.org/fi_services/1979_ckstudy/check_study.htm. Accessed February 14, 2007.
Federal Reserve Bank of Atlanta (1983). Special Issue: Displacing the Check. Federal Reserve Bank
of Atlanta Economic Review, August. Federal Reserve Bank of Boston (2005). Consumer Behavior and Payment Choice: How and Why Do
Consumers Choose Their Payment Methods? http://www.bos.frb.org/news/conf/payments2005. Accessed September 11, 2006. Federal Reserve Bank of Kansas City (2005). Interchange Fees in Credit and Debit Card Industries:
What Role for Public Authorities? http://www.kc.frb.org/PUBLICAT/PSR/Proceedings/2005/05prg.htm. Accessed September 11, 2006. Federal Reserve Bank of Philadelphia (2005). Payment Cards and the Unbanked: Prospects and
Challenges. http://www.phil.frb.org/pcc/PCCJuly132005conf.pdf. Accessed September 11, 2006.
Federal Reserve System (2002). Retail Payments Research Project: A Snapshot of the U.S. Payments
Landscape. http://f122w01/rpo/rpodocs/rpo/research/2001‐RetailPaymentsResearchProject.pdf
Accessed February 14, 2006. Federal Reserve System (2004). The 2004 Federal Reserve Payments Study: Analysis of Noncash
Payments Trends in the United States: 2000–2003. http://www.frbservices.org/Retail/pdf/2004PaymentResearchReport.pdf Accessed February 14, 2006. Frame, Scott W. and Lawrence J. White (2004). “Empirical Studies of Financial Innovation: Lots
of Talk, Little Action? Journal of Economic Literature, 42(1), March, 116–144. Gerdes, Geoffrey R. and Jack K. Walton II (2002). “The Use of Checks and Other Noncash
Payment Instruments in the United States.” Federal Reserve Bulletin, August, 360–374. Gerdes, Geoffrey R., May X. Liu, Darrel W. Parke, and Jack K. Walton (2005). “Trends in the Use
of Payment Instruments in the United States.” Federal Reserve Bulletin, Spring, 180–201.
58

Goettler, Ronald L. and Karen Clay (2006). “Price Discrimination with Experience Goods:
Sorting Induced Biases and Illusive Surplus.” Unpublished paper. Henry, Ray (2006). “New Monopoly version drops paper money, adds debit card.” Boston.com
News, July 25. Humphrey, David B. (2004). “Replacement of Cash By Cards in U.S. Consumer Payments.”
Journal of Economics and Business, 56(3), May‐June, 211–225. Javelin Strategy & Research (2006). “Why Consumers Don’t Buy.” Online Consumer Payment
Poll, 2006 Annual Survey. Jacob, Katy, Sabrina Su, Sherri L.W. Rhine, and Jennifer Tescher (2005). “Stored Value Cards:
Challenges and Opportunities for Reaching Emerging Markets.” Unpublished working paper.
Jonker, Nicole (2005). “Payment Instruments as Perceived by Consumers—A Public Survey.”
De Nederlandsche (The Netherlands) Bank Working Paper No. 53, September. Kennickell, Arthur B. and Myron L. Kwast (1997). “Who Uses Electronic Banking? Results from
the 1995 Survey of Consumer Finances.” Board of Governors of the Federal Reserve System, Finance and Economics Discussion Series, 1997‐35.
Kim, Byoung‐Min, Richard Widdows, and Tansel Yilmazer (2005). “The Determinants of
Consumers’ Adoption of Internet Banking.” Unpublished paper. Kim, Taehyung, Lucia F. Dunn, and Gene E. Mumy (2005). “Bank Competition and Consumer
Search Over Credit Card Interest Rates.” Economic Inquiry, 43(2), April, 344–353. Krieger, Sandy and Michele Braun (2005). “Improving Business Payments by Asking What
Corporations Really Want.” Current Issues in Economics and Finance, Federal Reserve Bank of New York, 11(5), May, 1–7.
Leland, John and Tom Zeller Jr. (2006). “Technology and Easy Credit Give Identity Thieves an
Edge.” New York Times, May 30, 2006. Loix, Ellen, Roland Pepermans, and Leo Van Hove (2005). “Who’s Afraid of the Cashless
Society? Belgian Survey Evidence.” Unpublished paper. Mester, Loretta J. (2006). “Changes in the Use of Electronic Means of Payment: 1995‐2004.”
Business Review, Federal Reserve Bank of Philadelphia, Q2, 26–30.
59

Meier, Stephan and Charles Sprenger (2006). “Impatience and Credit Behavior: Evidence from a Field Experiment.” Unpublished paper.
Mullainathan, Sendhil and Richard H. Thaler (2000). “Behavioral Economics.” NBER Working
Paper 7948, October. NACHA: The Electronic Payments Association (2004). “Ten Billion ACH Payments in 2003,
NACHA Announces.” http://www.nacha.org/news/news/pressreleases/2004/Pr032204/pr032204.htm.
Accessed September 11, 2006. NACHA: The Electronic Payments Association (2005). “Consumers Have More Protection with
Check Conversion, NACHA Reports to Congress.” http://www.nacha.org/News/news/pressreleases/2005/Pr042005/pr042005.htm.
Accessed September 11, 2006. NACHA: The Electronic Payments Association (2006). Facts and Statistics. http://www.nacha.org/news/Stats/stats.html. Accessed September 11, 2006. Schreft, Stacey L. (2006). “How and Why Do Consumers Choose Their Payment Methods.”
Federal Reserve Bank of Kansas City Working Paper RWP 06‐04, April. Schuh, Scott and Joanna Stavins (2005). “To Check or Not to Check: Why Are (Some)
Consumers (Finally) Writing Fewer Checks?” Unpublished paper. Stavins, Joanna (2001). “The Effect of Consumer Characteristics on the Use of Payment
Instruments.” New England Economic Review, Federal Reserve Bank of Boston, 3, 19–31. Stern, Gary H. (2003). “Federal Reserve Banks’ Initiatives in the Payments System.” The
Payments System in Transition, Washington D.C., October 30. U.S. Census Bureau (2005). “Computer and Internet Use in the United States: 2003.” October. Visa (2006). Visa Payment Panel Study: 2006 Payment Trends Summary. Visa, U.S.A., Inc. Williamson, Stephen D. (2003). “Payment Systems and Monetary Policy.” Journal of Monetary
Economics, 50(2), 475–495. Zinman, Jonathan (2005). “Debit or Credit?” Unpublished paper.
60

Appendix A: Alternative Consumer Payments Data
One of the main reasons for the dearth of adequate research on consumer payment
behavior has been a lack of sufficient data on the actual payment practices of U.S. consumers.70
Of course, some data on consumer payments behavior do exist. In this appendix, we describe
the main alternative sources of consumer payment data.
Probably the most prominent data source is the triennial Survey of Consumer Finance
(SCF) conducted by the Federal Reserve, which contains data on a limited number of consumer
payments variables from a nationally representative survey of about 4,500 U.S. households.71
However, with payment practices changing at breakneck speed, a three‐year lag in data on
payments behavior is a serious disadvantage. Recognizing this, researchers at the Ohio State
University are proposing to expand to the national level, a monthly SCF‐like survey of Ohio
consumers, perhaps including more payments‐related questions.72 From time to time, policy‐
makers also commission the collection of data. The U.S. Senate Committee on Banking,
Housing, and Urban Affairs recently became concerned about debit card fees and directed the
Board of Governors of the Federal Reserve System to study debit card use. The Board did so by
collecting data from two new, nationally representative surveys (including the University of
Michigan’s Survey of Consumers), but this data collection was a one‐time effort.73
Private firms in the payments industry also collect and analyze data on consumer
payment behavior. Studies, such as the joint collaboration between the ABA and Dove
Consulting (2005), have been conducted by private consulting firms for private clients. In some
cases, results from these studies can be obtained from the consultants, though usually for a
price. However, since most private firms collect data on consumer payment behavior for their
own purposes, the data are generally proprietary and unavailable to the public or public
policymakers. One example of a particularly rich and potentially useful data source is the 14‐
70 A similar problem exists in Europe, and efforts are underway to develop consumer payments data there too. For examples from Belgium and the Netherlands, see Loix, Pepermans, and Van Hove (2005) and Jonker (2006). 71 For more information about the SCF, see http://www.federalreserve.gov/pubs/oss/oss2/scfindex.html. 72 See Dunn, Ekici, Lavrakas, and Stec (2004) and Kim, Dunn, and Mumy (2005) for details of the Ohio data. Thus far, proposals to expand the data have been informal and undocumented. 73 See Board of Governors (2004) for details.
61

year panel of consumer payment behavior created by Visa (2006). Because the data and survey
methodologies of these private sector studies are kept confidential, it is very difficult to evaluate
their reliability.
62

Appendix B: Acknowledgments
Many people played a vital role in developing and implementing the 2003–2004 Boston
Fed consumer payment surveys. Table B.1 provides our best effort at a comprehensive list of
everyone who contributed to the survey or this paper in any way. Because we did not keep
detailed records of all meetings, we may have missed some individuals; to those we apologize.
In addition to this general recognition, we want to identify and acknowledge several
individuals who made extraordinary contributions to the survey project. Without them, it
would not have been possible to complete the study.
• Administration – Boston Fed employees Marci Vencil‐Wiegand (Boston Fed 2003
survey) and David Brown (Federal Reserve System 2004 survey) provided a
tremendous amount of administrative assistance that was essential to conducting the
surveys. Furthermore, after the surveys were completed, they devoted many hours
to compiling and presenting the detailed results in tabular and graphical format.
• Information technology services – Peter Tai (Boston Fed technical services division)
designed and programmed the web version of the survey and managed it
throughout the survey periods. Peter contributed his survey assistance above and
beyond his regular job responsibilities and contributed many hours of his own free
time. In addition, Peter was responsible for managing the Fed System survey during
a time when the Boston Fed was changing its network platform—no easy task.
• System leadership – Convincing all Federal Reserve locations to permit and encourage
their employees to participate in a voluntary, lengthy survey required a considerable
amount of time and diplomacy. Cathy Minehan, Paul Connolly, Sally Green, Lynn
Browne, and Tom Lavelle were instrumental in obtaining 100 percent cooperation
and participation from the entire Federal Reserve System (Board of Governors and
the 12 Regional Banks).
• Onsite representatives – Each Federal Reserve location provided at least one person to
serve as our onsite representative responsible for facilitating the implementation of
the survey at their respective Fed locations. Without these onsite representatives, we
could not possibly have accomplished the survey. Among these outstanding
63

assistants, we particularly want to acknowledge Abby Mayer of Kansas City, whose
extraordinary enthusiasm and assistance spilled over to the rest of the System.
Table B.1 Federal Reserve Employees Helping with 2003–2004 Consumer Payment Survey Fed District Employees Atlanta Charles Davidson Board Tim Markey Boston David Brown, Lynn Browne, Grace Cerrone, Cynthia Conley, Paul
Connolly, Jim Cunha, David DeRemer, Jeff Fuhrer, Dexter Holt, Sally Green, Linda Kopec, Tom Lavelle, Paul Malloy, Leah Maurer, Cathy Minehan, Trish Rivard, Research Department research assistants, Amy Ross, Harriet Santiago, Delia Sawhney, Joanna Stavins, Peter Tai, Geoff Tootell, Marci Vencil‐Wiegand, Jennifer Young
Chicago Dan Wassman, Geraldine Vaughn Cleveland Steve Collette, Melanie Loper, Kinley Stalker Dallas Magda Salazar Kansas City Lori Hand, Abigail (Abby) Mayer, Timothy Todd Minneapolis Debbie Drake, Michael Garrett, Paul Wallace (WEDGE) New York Hildon James, Evelyn Kender, Christine Opferkuch Philadelphia Sally Burke Richmond Bridgette Craney, Trisha Meade San Francisco Beth Hager, Chantel Mandel, Andrea Todd St. Louis Heather Black, Dan Brennan, Laura Hopper NOTE: Employees listed are by their location at the time of the survey in June 2004.
64

Table 1Payment Method Terminology and Definitions
Terminology
Primary Other
Cash Coin and currency
Check or Paper check
Any paper check written against demand deposit accounts at a depository institution, plus any other paper checks written against other check-writing accounts (e.g., money market funds).
Credit card Any general purpose or branded/merchant card offering revolving credit.
Debit card Check card/ATM debit card
Initiates an electronic debit against a checkable account that is settled the same day via ACH.
Automated Clearing House payment (ACH)
Automatic payment, preauthorized debit
"ACH clears and settles electronic payments and receipts among financial institutions. If your pay is directly deposited to your checking account, you are being paid through ACH. You also use ACH when you make automatic payments (e.g., mortgages, insurance, etc.)." The critical distinction is between automatic payments and occasional or self-initiated payments through a company’s web site. The latter also initiates an ACH transaction.
Online (Internet) bill payment services
Online banking, Internet banking,Electronic banking
"If you use the Internet through your bank or other service provider to access your bank account to make payments from your checking account, this is online bill payment. This does not include credit card purchases from Internet shopping sites." “Other service provider” could include a private (non-bank) firm that processes payments through ACH.
Stored-value card Prepaid card, gift card, smart card
"A plastic card that stores electronic data on dollar values. One example is a prepaid phone card. Other examples include gift cards from stores like Macy’s, Home Depot, or Starbucks,” or general-purpose, bank-issued cards (e.g., Visa, Mastercard).
Point-of-sale (POS) check conversion
Point-of-purchase (POP) check conversion, check-to-ACH
A paper check converted to an ACH debit transaction at the point of sale or purchase, such as a retail store. The cashier processes it through a special electronic reader, voids it, and returns it to the customer. The special reader captures the bank number, account number, and transaction amount and transmits the information for electronic settlement via ACH.
Accounts receivable conversion (ARC)
Check conversion at a lockbox processor, Lockbox
"ARC is an electronic payment that is created when you pay a bill by mail with a check and that check is converted into an ACH payment. When this ARC conversion occurs, a line item like “ARC E check #1234” appears on your bank checking account statement, and your paper check or electronic image is not returned to you."
Electronic check image
Check truncation, Check 21 payment
A paper check deposited to a bank (or its processor), which uses check image technology to convert the check to an electronic image to send through the check clearing process for payment and settlement. The paper check is truncated, usually at the bank of first deposit (BOFD), and is not returned to the depositor. An image of the check may be included on the customer’s bank statement received at the end of the billing cycle. A check image is processed under check law (Regulation CC, Operating Circular 3).
Definitions(Definitions included in the payment survey are in italic)

Table 2
Comparison of Payment Method Adoption Rates(Percent of respondents)
2004 Boston Fed Survey
Unweighted Education-Weighted
Income-Weighted
Age-Weighted
Own/Rent-Weighted
2001 Survey of Consumer Finances
2003 Michigan Survey of
Consumers
2004 Survey of Consumer Finances
Check 87 --- 89 99 99 98 99 99
Debit Card 50 54 59 67 69 70 69 68
Credit Card 80 --- 75 86 79 80 86 85
ACH – All 44 46 47 71 64 66 70 70
Utility 13 --- 18 28 22 25 27 27
Mortgage/Rent 14 --- 16 30 25 23 28 26
Online Bill Payment 21 32 40 49 42 47 51 50
Stored-Value Card --- 73 --- 35 31 33 36 35Note: The 2001 SCF and 2003 Michigan statistics were taken from Anguelov et al. (2004). The sample for both surveys includes only those households with a bank, thrift, or credit union account. The sample for the Fed Survey includes all respondents for check adoption, and only individuals with checking accounts for all other adoptions. Demographic weights are derived from the 2003 American Community Survey.
The reported results from the Fed Survey are tabulated from a subsample consisting solely of check users. Blank responses are considered to indicate that the respondent does not use the payment type.
Table based on Fed Survey Questions #9 and #25.
66

Table 3Reasons for Not Having a Checking Account
(Percent of respondents)
2001 Survey of Consumer Finances
2004 Survey of Consumer Finances
2004 Boston
Fed Survey
Don’t write enough checks 28.6 27.9 34.2
Minimum balance too high 6.5 5.6 8.0
Service charges too high 10.2 11.6 15.8
Don’t like to deal with banks 22.6 22.6 10.6
Can't manage a checking account 6.6 6.8 13.2
Don’t want/need an account 5.3 5.1 52.7
Other 20.2 20.4 15.8
Note: In both Surveys of Consumer Finances, respondents are instructed to choose the single most important reason why they don’t have a checking account, while in the Boston Fed Survey, respondents are allowed to choose multiple reasons. The columns should be compared with this in mind. Also, this explains why the Fed Survey column sums to more than 100 percent.Table based on Fed Survey Question #49.
67

Table 4Reasons for Switching from Checks
to Electronic Payments(Percent of responses)
Credit Card
Debit Card ACH
Online Banking
Convenience 19 37 19 21
Better recordkeeping 10 13 8 13
Save money on postage 11 16 19
Easier to resolve disputes 10
Internet purchases require credit cards 16
Incentives (rewards) 15
Can buy now, pay later 17
Save money on checks 18
More stores accept debit cards 29
No fees 16
No mail delays or hassles 19
Don’t have to remember to pay the bill 19
More control over payment timing 20
Faster to pay bills online 22
Other 2 4 3 6
Table based on Fed Survey Questions #19-22.
68

Table based on Fed Survey Questions #10, 12, 14, and 16.
Table 5Barriers to the Adoption of
Electronic Payment Methods
BarrierCredit Card
Debit Card ACH
Online Bill
Payment
Privacy/Security 9 10 12 22
19
6
8
8
8
7
8
9
Theft/Misuse 10 13 11
Tracking payments 5 14 11
Expense (interest and fees) 32 13 6
Debt 38
More benefits w/CC (incentives) 19
Same-day debits 11
Overdrawing account 9 20
Not accepted everywhere 6
Bank doesn't offer 1
Can't control timing 16
Difficult set up/use 13
Lack of access
Inconvenient
percent of responses out of all nonuser responses on barriers to use
1–5% 6–10 % 11–15 % > 15 %
69

Table 6Relative Perceptions of Payment Characteristics
Users of Payment Instrument
Characteristic Credit Card Debit Card ACH Stored-Value Card
Online Bill Payment
Cost 0.18 0.57 0.67 0.39 0.71
Convenience 0.85 0.91 0.87 0.72 0.89
Safety 0.08 0.10 0.63 -0.12 0.26
Privacy -0.02 0.17 0.45 0.59 0.13
Errors 0.21 0.28 0.41 0.35 0.41
Timing 0.61 0.46 0.61 0.46 0.84
Record keeping 0.37 0.21 0.37 -0.05 0.59
# Respondents [min, max]
[3385, 3678]
[2621, 2882]
[2623, 2844]
[1224, 1385]
[1809, 1946]
Nonusers of Payment Instrument
Characteristic Credit Card Debit Card ACH Stored-Value Card
Online Bill Payment
Cost -0.55 -0.12 -0.05 0.08 0.07
Convenience 0.52 0.31 0.08 0.33 0.23
Safety -0.25 -0.40 0.02 -0.16 -0.35
Privacy -0.26 -0.29 -0.03 0.32 -0.40
Errors -.08 -0.12 -0.09 0.12 -0.02
Timing 0.20 -0.19 -0.06 0.26 0.24
Record keeping 0.11 -0.28 -0.14 -0.10 0.08
# Respondents [min, max] [222, 236] [204, 211] [144, 150] [309, 341] [314, 332]
Response
Much Worse Worse Same Better Much
Better
Table based on Fed Survey Questions #27-31. Characteristics are rated relative to checks. Numerical values of 1, 0, and -1 were assigned to the responses Better, Same, and Worse, respectively. The results presented here are the average value of the responses. Much Worse refers to an average less than -0.6; Worse is between -0.6 and -0.2; Same is from -0.2 to 0.2; Better is from .0.2 to 0.6; and Much Better is greater than 0.6.

Table 7Responses to Changes in Paper Check Processing Environment
Responses about Hypothetical Changes from all Respondents
Would You Change Your Payment Behavior? (%)
Change Yes No
Eliminate Check Float 31 69 N/A
Stop Returning Canceled Checks 14 86 Change institution (7%)
Reduce check usage (6%)
Top Two Payment Responses
Responses from Respondents Who Experienced the Actual Change
Use online banking (38%)Use credit cards (23%)
9010Accounts Receivable Conversion (ARC)
Use debit cards (43%)Use credit cards (29%)7327POS Check
Conversion
NoYesTop Two Payment Responses
Did You Change Your Payment Behavior? (%)
Change
Table based on Fed Survey Questions #4, 7, 32–35, 37–40.
71
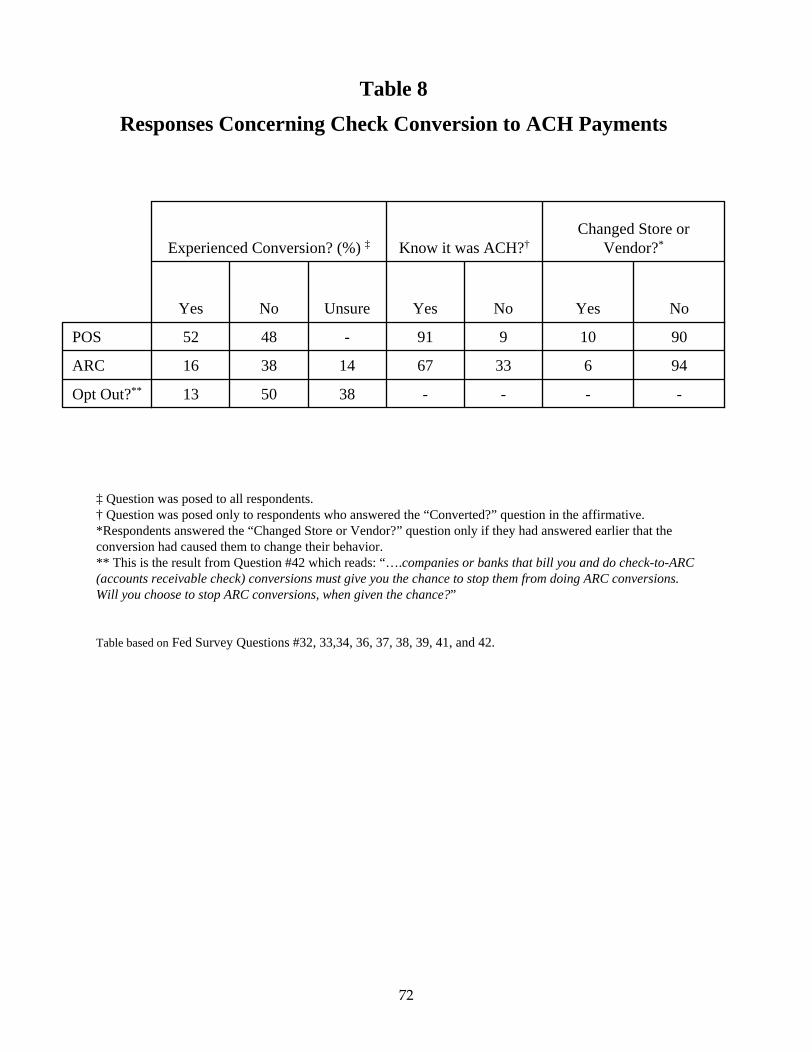
Table 8
Responses Concerning Check Conversion to ACH Payments
Experienced Conversion? (%) ‡ Know it was ACH?†Changed Store or
Vendor?*
Yes No Unsure Yes No Yes No
POS 52 48 - 91 9 10 90
ARC 16 38 14 67 33 6 94
Opt Out?** 13 50 38 - - - -
‡ Question was posed to all respondents.† Question was posed only to respondents who answered the “Converted?” question in the affirmative.*Respondents answered the “Changed Store or Vendor?” question only if they had answered earlier that the conversion had caused them to change their behavior. ** This is the result from Question #42 which reads: “….companies or banks that bill you and do check-to-ARC (accounts receivable check) conversions must give you the chance to stop them from doing ARC conversions. Will you choose to stop ARC conversions, when given the chance?”
Table based on Fed Survey Questions #32, 33,34, 36, 37, 38, 39, 41, and 42.
72

Question Flaw Problem Recommended Correction
#2 Non‐users of checks were asked not to answer the majority of the survey.
Data on the behavior of non‐users of checks provide equally valuable insight on non‐check payments.
Remove exclusion of non‐users of checks.
#10‐26, 35, 40, 47, 49
Multiple responses were allowed. Allowing multiple responses does not reveal the relative importance of each answer.
Limit respondent to one choice or allow ordering of answers.
#23 Retail payments were included in the same section as bill payments.
Retail payments are not bill payments, and this adds some potential ambiguity to the survey.
Define bill payments, and separate retail payments from bill payments.
#24‐26 Failed to ask about types of purchases made with a credit card.
Information on purchase types is included for all other payment methods in the survey.
Include credit card purchases as another question.
#27‐31 Only respondents who use a payment were asked about the payment characteristics.
The assessment of payment characteristics by non‐users is equally valuable and important.
Ask all respondents to assess the payment characteristics.
#9, 18, 27‐31
Cash was excluded. Cash is an important payment method that needs to be understood more thoroughly.
Include analogous questions or choicesfor cash as a payment method.
#27‐31 Several response choices were vague (convenience, privacy, etc).
This ambiguity in payment characteristics may lead the answers to be subjective and not comparable.
Define the payment characteristics more clearly and specifically.
#32, 37 Respondents who did not answer “yes” were asked to skip the next question about awareness.
Information on the awareness of all respondents is valuable, especially for understanding the connection between experience and awareness.
Ask all respondents to answer these questions.
#43, 46 Credit card purchases were not separated into payments (bill paid off in full each month) and revolving debt (carrying a balance over time).
While the payment instrument is the same, these two ways to use credit cards indicate different saving behavior that should be distinguished.
Ask credit card users to distinguish between pure purchases and the use of credit.
#50‐54 Omitted key demographic questions (e.g., gender) and failed to ask for sufficient detail in existing questions.
Unexploited opportunity exists to obtain additional valuable information on demographic characteristics of respondents.
Include other key demographic questions; break up answers into more detailed categories.
#54 Geographic areas were broken up only into Federal Reserve Districts.
State, city, and other small‐region trends, as well as urban/rural trends, are not observable.
Ask geographic location more specifically (state, city).
General ACH and online banking are not payment methods per se, but were treated as such.
The definitions of these payment methods potentially add ambiguity to the survey responses.
Define ACH and online banking payments more specifically.
Table 9
Survey Instrument Flaws and Recommended Corrections

Federal Reserve Estimates of Total U.S. Check Payments
0
10
20
30
40
50
60
70
1969 1971 1973 1975 1977 1979 1981 1983 1985 1987 1989 1991 1993 1995 1997 1999 2001 2003 2005 2007
Bill
ions
0
10
20
30
40
50
60
70
Actual Survey Data ProjectionsPublished in 2002
Published in 1981
Published in 2005
2006
Esti
mat
es in
Pro
gres
s
Sources: Actual Survey Data:
Federal Reserve Bank of Atlanta (1981); Federal Reserve System (2002, 2004); Gerdes and Walton (2002); and Gerdes, Liu, Parke, and Walton (2005).
Projections:Federal Reserve Bank of Atlanta (1983).
Source: Federal Reserve System.
Figure 1Check Volume
Federal Reserve Check Processing Volume
10
12
14
16
18
20
1979 1981 1983 1985 1987 1989 1991 1993 1995 1997 1999 2001 2003 2005 2007
Bill
ions
10
12
14
16
18
20
Core Unsorted Checks Processed
Total
Trend through 2002 Q2
Note: Check volume is calculated as a four quarter moving average.
74

0
5
10
15
20
BOS NY PHIL CLEV RICH ATL CHI STL MINN KC DAL SF
Perc
ent
0
5
10
15
20
Percent
Percent of US 18+ Population in District
Percent of Boston Fed Survey Respondents in District
Figure 2
Comparison of Population and Respondent Distributions Across Federal Reserve Districts
Population Distributions
Boston Fed Survey Response Rates
0
10
20
30
40
50
60
BOS NY PHIL CLEV RICH* ATL CHI STL MINN KC DAL SF BOARD
Total Responses as Percent of Employment (left)
Usable Responses as Percent of Employment (right)
Total System Response Rate = 24.2 %
*Survey respondents from the Richmond district include both the Richmond Fed and the Board.
Note: District population shares (top panel) come from the Census’s 2004 ACS.
Figure based on Fed Survey Question #54. 75

Age
0
10
20
30
40
50
60
18-24 25-34 35-44 45-54 55+
Perc
ent
Share of U.S . 18–65 Population
Share of Survey Respondents
Education
0
10
20
30
40
50
60
High schoolor less
1-3 yearscollege
Bachelor'sdegree
Post graduate
Perc
ent
Share of U.S . 25+ Population
Share of Survey Respondents
Household Income
0
10
20
30
40
50
60
Less than$50,000
$50,000 to$74,999
$75,000 to$99,999
Greater than$100,000
Perc
ent
Share of U.S . Households
Share of Survey Respondents
Home Ownership
0
20
40
60
80
100
Own Rent
Perc
ent
Share of U.S. Households
Share of Survey Respondents
Figure 3
Boston Fed Payment Survey and U.S. Demographic Characteristics
Figure based on Fed Survey Questions #50–5376

Figure 4 Reported Payment Method Use per Month
10.5(30%)
8.5(24%)
9.4(27%)
3.0(9%)
2.7(8%)
1.2(3%)
3.8(9%)
3.9(10%)
6.9(17%)
14.7(39%)
10.1(27%)
10.5(30%)
0
2
4
6
8
10
12
14
Check Credit Card Debit Card Online BillPayment
ACH Stored-Value Card
Ave
rage
Num
ber o
f Mon
thly
Tra
nsac
tion
All Respondents Users of Payment Method
Figure based on Fed Survey Question #9. Percentages are of total average monthly transactions.
77

Figure 5Payment Choices at Retail Stores
(From all respondents)
2
9
51
2126
1414
612
7
48
30
14
3127
3935
46
2936
000 0 00
10
20
30
40
50
60
Less than $20 $20‐$50 More than $50 Fed Total DOVE Survey
Percent
Cash Check Credit Card Debit Card Stored‐Value Card
Dove Survey results are based on the 2005 American Bankers Association/Dove Survey of Consumer Payment Preferences, Question # 4, parts A, C, D, and E, which ask for respondents’ most used payment method for purchases at Grocery, Department, Discount, and Drug Stores, respectively.
Figure based on Fed Survey Question #43.
78

0
15
30
45
60
Rent/Mortg
age
Home phone
Cell ph
one Cable
Internet
Insurance
Loan paym
ents
Utilities
Other
Perc
ent
Check ACH Online Credit
Boston Fed Payment Survey, by Type of Bill Payment
Figure 6Payment Choices for Recurring Bills
(Percent of respondents)
All Bills*
*The Dove column is based on Question #55, part A, from the 2005 ABA/Dove Survey of Consumer Payment Preferences. The ABA/Dove survey did not have credit as a payment option, but did have autopay (credit or ACH), money orders and cash.
Figures based on Fed Survey Question #47.
Payment Choice Fed Dove
Check 83 72
ACH or Credit 75 27
Credit only 33 -
ACH only 64 -
Online 36 14
Other Payment Types - 72
79

28
1411
4 3 2 1 1 1 1
39
31
1422
27
05
1015202530354045
Mortgage/Rent
Credit Cards
Utilities
Insurance
TelephonesRetail
Cable/Internet
Auto Loans
Other Loans
Club Memberships
Investments
Tuition
Subscriptions
CharitiesTaxes
Percent of Respondents
Figure based on Fed Survey Question #23.
(From respondents who switched from check)
Figure 8Types of Bills and Purchases Formerly Made by Check
Figure 7Reported Changes in Payment Use during Past Three Years
(2001–2004)
Figure based on Fed Survey Question #18.
(From respondents who use the payment method)
8
35
77
55
84
43
28
42
19
44
15
51
64
24
4 1 16
0102030405060708090
Check Credit Card Debit Card ACH Online BillPayment
Stored-ValueCard
Perc
ent
Increased Same Decreased
80

Figure 9Payment Methods Substituted for Checks for Retail Payments
(by value of purchase)
43
72
16
31
4841
62
50
0 0 00
1020
3040
5060
70
Less than $20 $20‐$50 More than $50
Percent of Respondents
Cash Credit Card Debit Card Stored‐Value Card
Figure based on Fed Survey Question #46.
81

0
20
40
60
80
100
Cost
Ease
Safety
Privacy
Errors
Timing
Recordkeeping
Primarily Write Check Mixed Primarily Use Electronic Methods
Percent
0
20
40
60
80
100
Cost
Ease
Safety
Privacy
Errors
Timing
Recordkeeping
Percent
Primarily use electronic methods
MixedPrimarily write check
Primarily use electronic methods
MixedPrimarily write check
(Respondents’ Rating of Payment Methods They Use)
(Respondents’ Rating of Payment Methods They Do Not Use)
Figure 10Percent of Respondents Rating Electronic Payments Better than Checks
Figure Based on Fed Survey Questions #27–31.
82

How important is it for you to receive your canceled checks back?
Notimportant
68%
Somewhat21%
Very11%
Important
Importance of Paper?
How willing would you be to receive an image copy (either paper or electronic) of the front of your check instead of receiving canceled checks?
Somewhat20%
Notwilling
9%
Very 71%
Willing
Willing to Receive Image?
For your primary checking account, does your financial institution return your canceled checks to you?
No75%
Yes25%
Receive Paper?
Figure 11
Consumer Responses Concerning Canceled Checks
Figure based on Fed Survey Questions #5, 6, and 8.
83

2329
0 05
0
23
0
17
38
23
43
0
10
20
30
40
50
Cash Credit Card Debit Card ACH Online BillPayment
Other
Percent
Retail Payments Recurring Bill Payments
40
50
6 80
41 43
6 5 47 9 5
46
80
9
79
59
0
10
20
30
40
50
60
70
80
90
Gift card Phone card Internal FedSVC
Visa/MCcash
School card Other
Percent
Federal Reserve 2004 Boston 2004 Boston 2003
Figure 13Stored-Value Card Use
(Percent of respondents who use Stored-Value Cards)
Figure based on Fed Survey Question #26.
Figure 12Payment Choice When Checks are Converted to
ACH Payments(Percent of responses from respondents who switched because of check-to-
ACH/ARC conversion)
Figure based on Fed Survey Questions #35 and 40.
84