the brazilian experience in public investment management
TRANSCRIPT
The Brazilian Experience in Public Investment Management
VIII Seminario de la Red de Sistemas Nacionales de Inversión Pública
Panama, April 17th, 2018
CRISTINA GONÇALVES RODRIGUES General Coordinator of Public Investment Projects National Treasury Secretariat - Ministry of Finance

2
Recent Developments in Brazilian Economy
Fiscal Space for Public Investment
Major Public Programs
Subnational Governments
Perspectives and Challenges
1
2
3
4
5

3
1. Brazil´s Economic Recovery 1
Source: IBGE, prepared by the Ministry of Finance (MF). 2018 forecast: MF.
Forecast
0,5
-3,5 -3,5
1,0
3,0
2014 2015 2016 2017 2018
GDP Annual Real Rate, %

4
1. Brazil´s Economic Recovery 1
Source: IBGE
2,95
0
2
4
6
8
10
12
jan
/14
m
ar/1
4
mai
/14
ju
l/1
4
set/
14
n
ov/
14
ja
n/1
5
mar
/15
m
ai/1
5
jul/
15
se
t/1
5
no
v/1
5
jan
/16
m
ar/1
6
mai
/16
ju
l/1
6
set/
16
n
ov/
16
ja
n/1
7
mar
/17
m
ai/1
7
jul/
17
se
t/1
7
no
v/1
7
Var
iaçã
o%
12
me
ses
Consumer Inflation Index (IPCA)
5
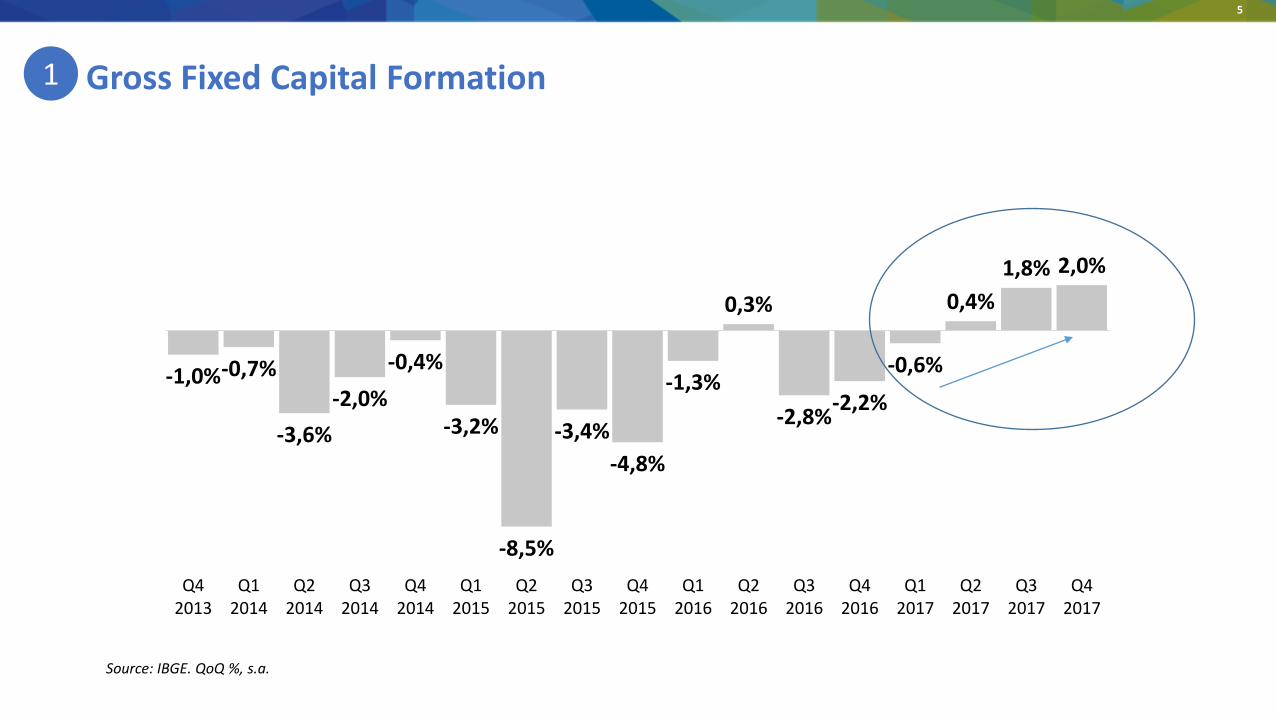
1. Gross Fixed Capital Formation 1
Source: IBGE. QoQ %, s.a.
-1,0% -0,7%
-3,6%
-2,0%
-0,4%
-3,2%
-8,5%
-3,4%
-4,8%
-1,3%
0,3%
-2,8% -2,2%
-0,6%
0,4%
1,8% 2,0%
Q4 2013
Q1 2014
Q2 2014
Q3 2014
Q4 2014
Q1 2015
Q2 2015
Q3 2015
Q4 2015
Q1 2016
Q2 2016
Q3 2016
Q4 2016
Q1 2017
Q2 2017
Q3 2017
Q4 2017

6
The economy reflects fiscal adjustment
1
Spending cap New expenditure rule Limits the growth of public spending to inflation for, at least, the next 20 years Forces prioritization of public policies
Primary Result Targets
Spending cuts
Ongoing Social Security reform and other structural measures
7
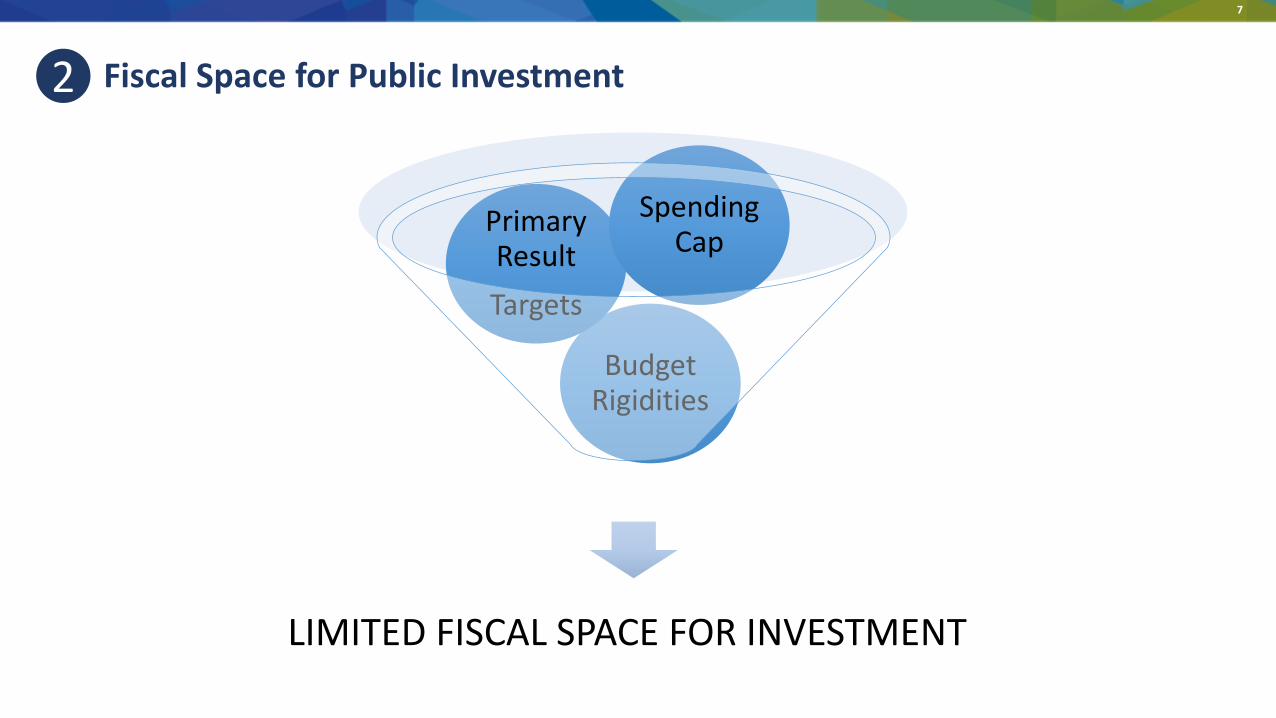
Fiscal Space for Public Investment 2
LIMITED FISCAL SPACE FOR INVESTMENT
Budget Rigidities
Primary Result
Targets
Spending Cap

8
Municipalities Central Government States
2010
2017
Payroll 52,0%
Retiree Payroll 7,8%
Investment 4,0%
Other Expenses
36,2%
Payroll 44,4%
Retiree Payroll 5,4%
Investment 11,2%
Other Expenses
39,0%
Source: National Treasury, Ministry of Finance (MF)
Payroll 36,8%
Retiree Payroll 16,0%
Investment 8,9%
Other Expenses
38,3%
Payroll 41,0%
Retiree Payroll 21,4%
Investment 3,8%
Other Expenses
33,9%
2 Fiscal Space for Public Investment
Payroll 13,9%
Retiree Payroll 9,9%
Investment 6,3%
Other Expenses
33,8%
Social Security (RGPS) 36,0%
Payroll 12,9%
Retiree Payroll 9,3%
Investment 3,6%
Other Expenses
30,7%
Social Security (RGPS) 43,6%

9
Source: IMF
0.0
2.0
4.0
6.0
8.0
10.0
12.0
1990
1991
1992
1993
1994
1995
1996
1997
1998
1999
2000
2001
2002
2003
2004
2005
2006
2007
2008
2009
2010
2011
2012
2013
2014
2015
Brazil BRICS
Emerging Market Economies Latin America and the Caribbean
Public Sector Investment (% GDP)
Public Sector Investment below the LAC and EME averages 2

10
High levels of current spending versus low levels of capital expenditure
Source: IMF
Public Sector Current Expenditure vs. Capital Expenditure (% GDP)
BRAATG
ARG
BHS
BRB
BLZ
BOL
CHL
COL
CRI
DMA
DOM
ECU
SLV
GRD
GTM
HTI
HND
MEX
NICPAN
PRYPER
KNALCAVCT
SUR
TTO
URY
VEN
0
2
4
6
8
10
12
14
16
18
0 5 10 15 20 25 30 35 40 45 50
Capi
tal S
pend
ing (
Aver
age
of 20
11 -
2015
)(N
omin
al, %
of G
DP)
Current Spending (Nominal, % of GDP)
Median
Brazil and Latin America and the Caribbean
2

11
Improving the efficiency of public investment is essential
Source: IMF
2
The Efficiency Frontier

12
Brazil has expanded public expenditure despite lower revenues
14,2%
15,6%
16,4% 16,5%
17,3%
18,0%
17,4%
18,1%
18,8% 18,8% 19,0% 18,9%
18,6%
20,2%
18,9% 18,5%
18,7%
17,7% 17,4% 17,4%
17,6%
14,0%
14,8% 14,6%
14,8%
15,6% 15,9%
15,1%
15,6%
16,4% 16,8% 16,9%
16,2%
17,4%
18,2%
16,7% 16,9% 17,3%
18,0%
19,3%
20,0%
19,5%
12,0%
13,0%
14,0%
15,0%
16,0%
17,0%
18,0%
19,0%
20,0%
21,0%
1997 1998 1999 2000 2001 2002 2003 2004 2005 2006 2007 2008 2009 2010 2011 2012 2013 2014 2015 2016 2017
Central Government Revenues and Expenditure (GDP %)
Total Revenues (GDP %) Total Expenditure (GDP %)
Source: National Treasury, Ministry of Finance (MF)
2
13
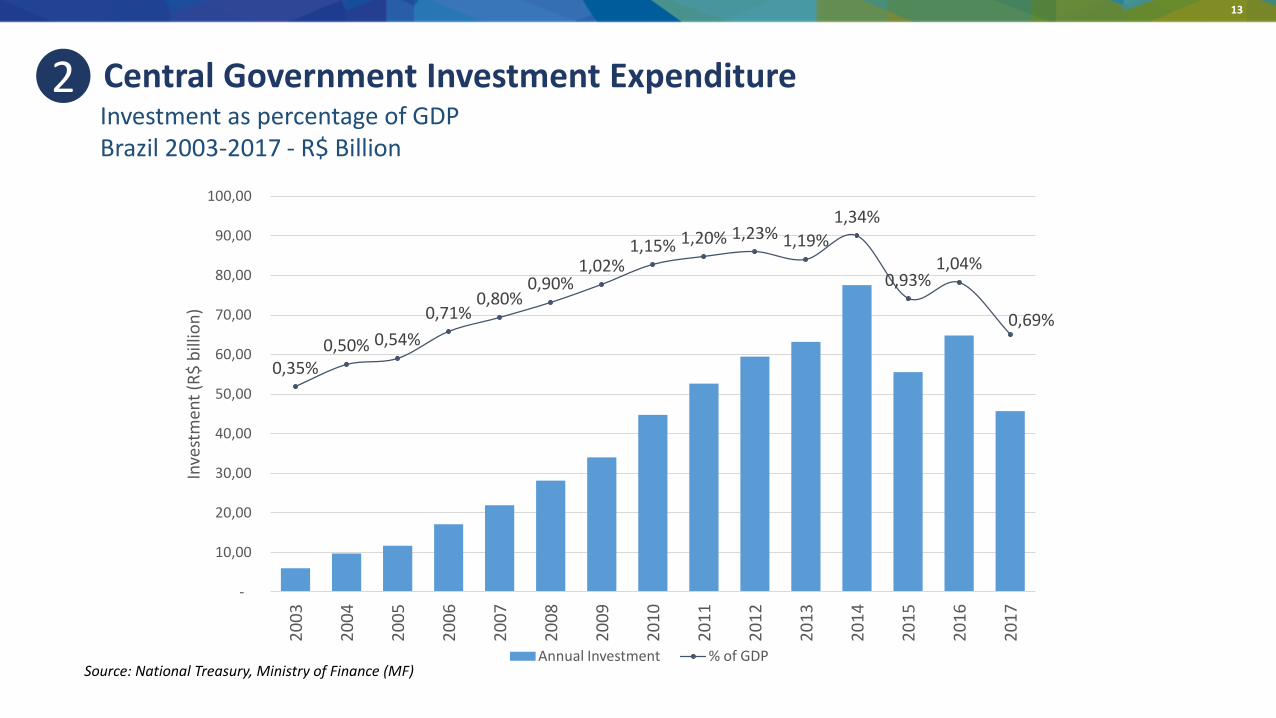
Central Government Investment Expenditure 2 Investment as percentage of GDP Brazil 2003-2017 - R$ Billion
Source: National Treasury, Ministry of Finance (MF)
0,35% 0,50% 0,54%
0,71% 0,80%
0,90% 1,02%
1,15% 1,20% 1,23% 1,19%
1,34%
0,93% 1,04%
0,69%
-
10,00
20,00
30,00
40,00
50,00
60,00
70,00
80,00
90,00
100,00
20
03
20
04
20
05
20
06
20
07
20
08
20
09
20
10
20
11
20
12
20
13
20
14
20
15
20
16
20
17
Inve
stm
ent
(R$
bill
ion
)
Annual Investment % of GDP

14
Central Government Investment by sector
2008-2017
Transport 24%
Housing 17%
Defense 14%
Education 12%
Other Economic Affairs
9%
Health 6%
Environment 5%
Public Order and Safety
5% General Public Services
4%
Social Protection 2%
Culture 2%
Source: National Treasury.
2
15
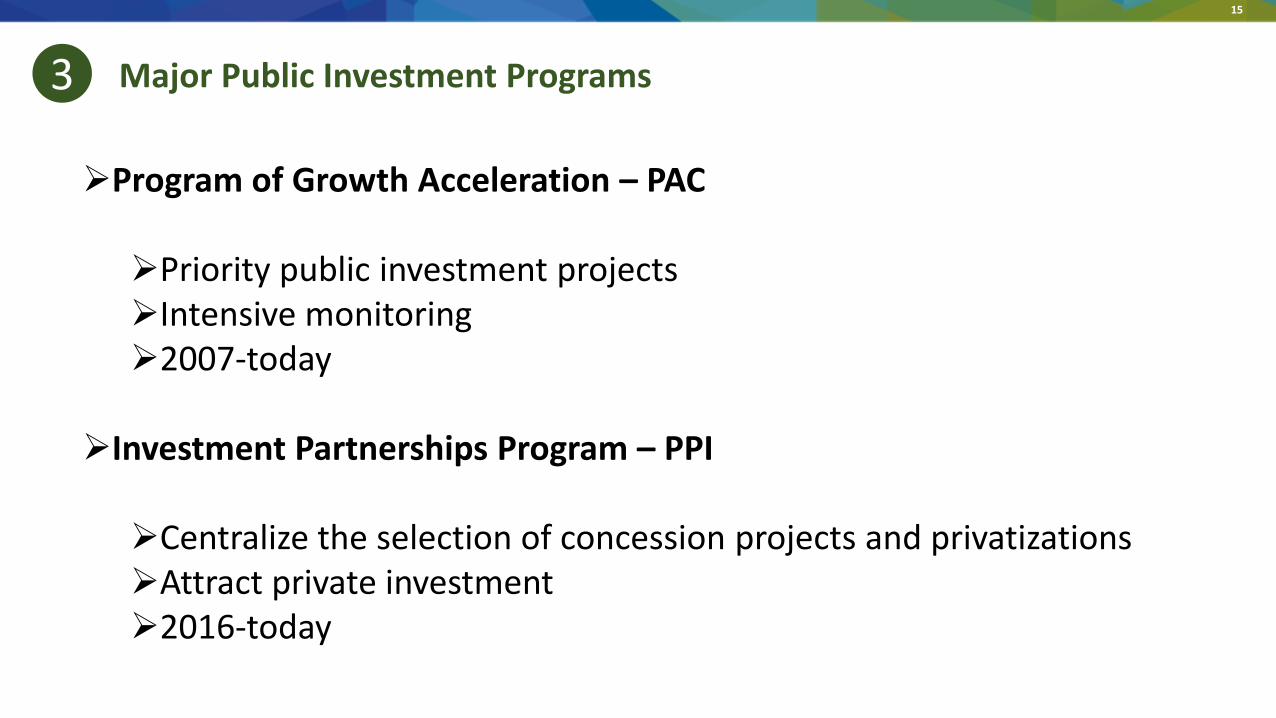
Major Public Investment Programs
Program of Growth Acceleration – PAC Priority public investment projects Intensive monitoring 2007-today
Investment Partnerships Program – PPI Centralize the selection of concession projects and privatizations Attract private investment 2016-today
3
16
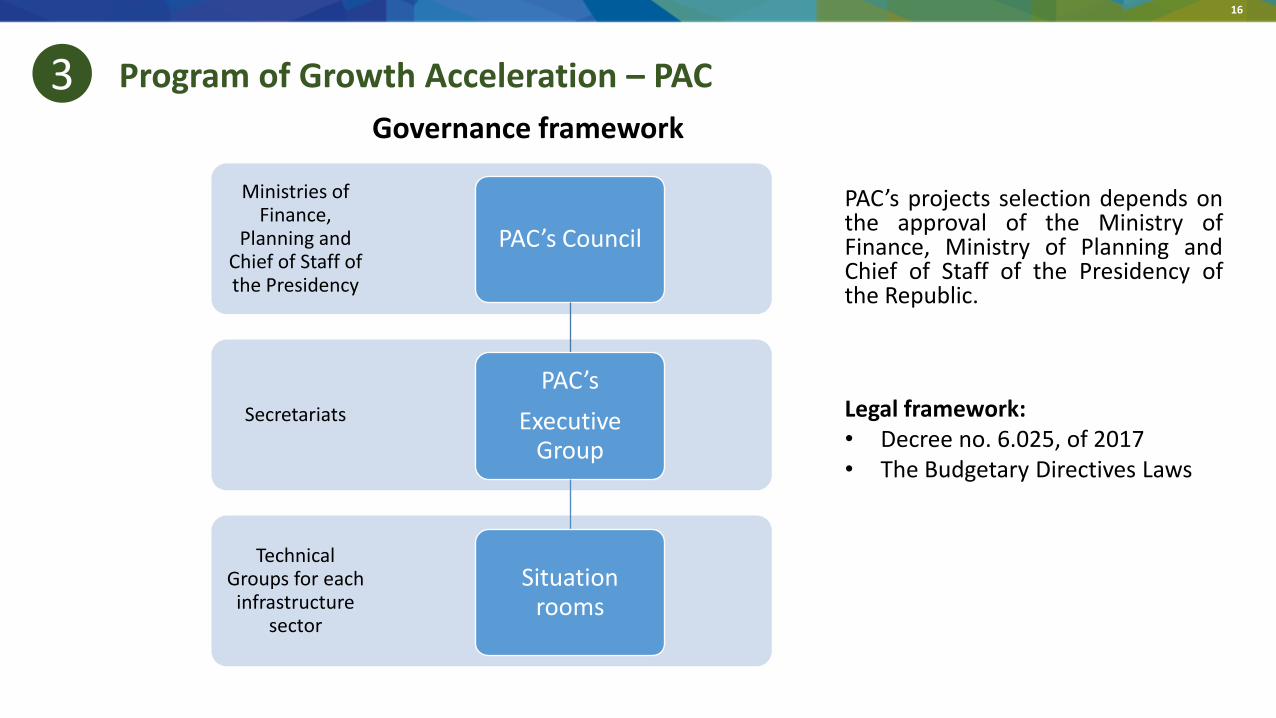
Program of Growth Acceleration – PAC
PAC’s projects selection depends on the approval of the Ministry of Finance, Ministry of Planning and Chief of Staff of the Presidency of the Republic.
Technical Groups for each infrastructure
sector
Secretariats
Ministries of Finance,
Planning and Chief of Staff of the Presidency
PAC’s Council
PAC’s
Executive Group
Situation rooms
Legal framework: • Decree no. 6.025, of 2017 • The Budgetary Directives Laws
3 Governance framework

17
Program of Growth Acceleration PAC Portfolio by major areas
Source: National Treasury.
Portfolio 2015-2018 R$ Billion
Defense and Safety 22,02
Logistic Infrastructure
47,35
Social Infrastructure
14,95
Urban Infrastructure
58,81
Other Economic Affairs 7,28
3

18
PPI Structure
PRESIDENCY
PRESIDENCY’S
GENERAL SECRETARIAT
PPI’S COUNCIL
PPI’S SPECIAL
DEPARTMENT
• PPI’s projects selection depends on the approval of the President of the Republic.
• Projects selected to integrate the PPI’s portfolio must be treated as national priorities and follow PPI guidelines
• A new legal framework on infrastructure:
• Legal Act no.13.334, of 2016, Legal Act no.13.448, of 2017
• PPI Council no.1 Resolution
• The PPI “guidelines”
3

19
Source: PPI Secretariat (Executive Department of Investment Partnerships Program)
Carried Out
Electric Power
Port Terminals
Oil and Gas
Airports
52 14 5 4
Planned investments - R$143.6 billion
75 Projects
PPI Concessions and Privatizations 3
20
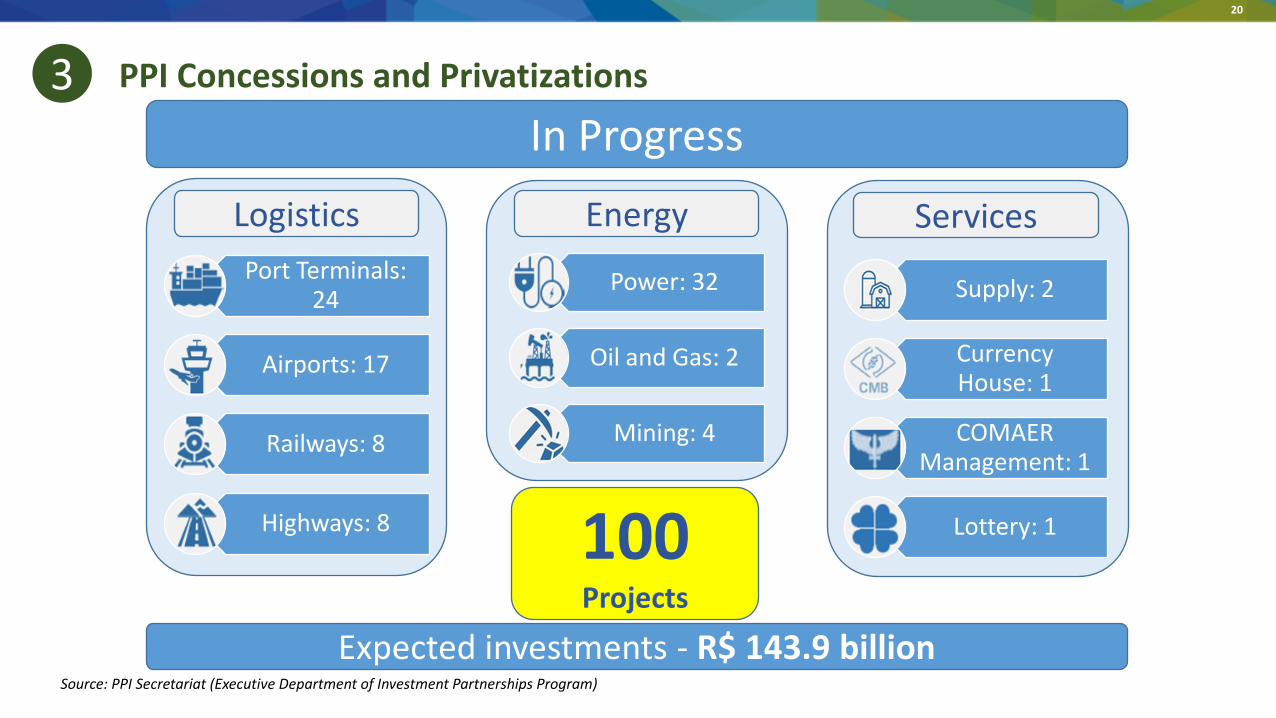
Source: PPI Secretariat (Executive Department of Investment Partnerships Program)
In Progress
Expected investments - R$ 143.9 billion
Logistics Energy Services
100 Projects
Port Terminals: 24
Airports: 17
Railways: 8
Highways: 8
Supply: 2
Currency House: 1
COMAER Management: 1
Lottery: 1
Power: 32
Oil and Gas: 2
Mining: 4
PPI Concessions and Privatizations 3

21
Transfers to subnational
governments 28%
Others 2%
Direct Investments
70%
Central Government Investment 2008-2017
Source: National Treasury.
Subnational Governments 4

22
Source: IBGE
Brazil: 26 States + Federal District
Over 5500 Municipalities
5th largest country by area
5th largest population (208 MILLION)
Subnational Governments 4

23
1. Subnational Governments
Funding Sources
States and municipalities’ own resources
Borrowing operations
Capital transfers from federal government
4

24
Subnational Governments 4
Federal
Government
Highways
Railways
Ports
Airports
Defense
Housing*
States and municipalities
Sanitation
Health
Education
Urban transportation
Level of government x sectors
* Programa Minha Casa Minha Vida

25
Central Government Investment Execution by level of government 4
2017 R$ Billions
Source: National Treasury.
0,31
0,58
1,05
1,12
3,51
5,36
12,24
9,72
4,43
0,92
2,45
3,51
Logistic Infrastructure
Defense and Safety
General Public Services
Other Economic Affairs
Urban Infrastructure
Social Infrastructure
Direct Investments Capital transfers to subnational governments

26
Source: Ministty of Planning
Number of PAC projects executed by Capital Transfers from Federal Government
10.140
3.305
2.953
1.819
762
398
352
303
237
171
Public Health Units - UBS
Sanitation
School Sports Courts
Hydric Resources
Nurseries and Kindergartens
Urbanization
Emergency Care Units - UPA
Prevention in Risk Areas
Sports and Arts Centers
Other
Subnational Governments 4

27
1. Subnational Governments
Capital transfers from federal government - Grant agreements
4
Spending Ministries
• Funding
• Guidelines
• Selection
• Monitoring
Public Bank
• Transfers
• Special accounts
• Monitoring
States and Municipalities
• Prepare studies and projects
• Bidding
• Execution
• Maintenance and administration costs
Grant agreements on a project-by-project basis

28
Housing Public Policy
$$ $$
CONSTRUCTION COMPANIES
FEDERAL GOVERNMENT
FAMILIES MUNICIPALITIES
HOUSING FUND
CAPITAL INJECTION
CONTRACTS BUILDING
HOUSES
SUBSIDIES INSTALLMENTS
SELECTION Legal framework: • Law no. 11.977, of 2009 • Decree no. 7.499, of 2011
‘Minha Casa Minha Vida’ Program
4
29
Challenges
Estratégia Fiscal
Improve Central-Local Coordination
Capacity building at the local level
Fragmentation of transfers
Federal grants uses a variety of design, management and monitoring arrangements
Strengthen procedures for project selection and prioritization
Protect fiscal space for public investment
5

30
Priority Agenda
Estratégia Fiscal New public finance law Bank of Projects
Concessions and Privatizations
Structural reforms to reduce mandatory expenditure
5
Thank You
CRISTINA GONÇALVES RODRIGUES General Coordinator of Public Investment Projects National Treasury Secretariat - Ministry of Finance
VIII Seminario de la Red de Sistemas Nacionales de Inversión Pública