the building of 2030 · • cost segregation • provides a means of accelerating the depreciable...
TRANSCRIPT
“Green retrofits are the single most important measure that corporations and real
estate owners can take to reduce their operating costs, raise commercial property values and
achieve important environmental benefits like reduced carbon dioxide emissions.” - Deloitte
The Building of 2030 AEE So Cal Conference

What Factors Will Drive the Market
• Risk of Functional Obsolescence
• Investor, Government Pressure
• Data Transparency & Availability
• Reporting, Measurement Standards
• Innovations in Property Valuation
• Tenant Demand
• Innovations in Project Finance
• Increased Investor Confidence

Risk of Obsolescence
0%
5%
10%
15%
20%
25%
1990-1995 1980-1989 1970-1979 1960-1969 1946-1959 1920-1945 Earlier
Year Built
Age of US Building Stock
*Source: Lawrence Berkeley National Laboratory
~90% > 30 years old

Risk of Obsolescence
Hard Value Soft Value
8.5% Reduction in operating costs Market differentiation
6.8% Increase in building values Growing tenant demand
9.2% Increase in ROI Reduced risk of obsolescence
6.4% Increased occupancy Lower energy cost risk
6.2% Increases in rent Stay ahead of regulations
8.5% Reduction in operating costs Reputation, public image
*Source: McGraw Hill, Green Outlook 2011: Green Trends Driving Growth

Investor Pressure

Government Pressure

Increasing Transparency

Increasing Transparency

Data Availability
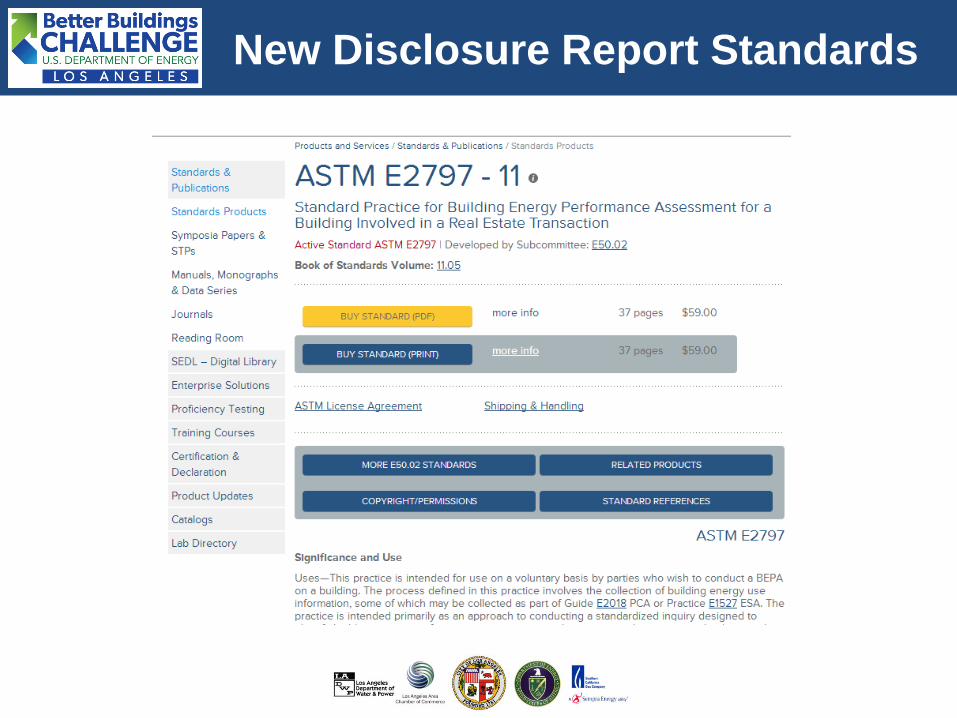
New Disclosure Report Standards

http://www.eere.energy.gov/pdfs/doe_taf_mou_signed_6-10.pdf
New Appraisal Guidelines

Tenants Care about Green
• Fewer Sick Days
• Average of 2.9 fewer sick days
• Net impact of ~$5/sf
occupied
• Higher Productivity
• 55% report productivity
improvement (~$20/sf)
• Recruitment and retention
• Young people want green
• But what is the main
reason tenants care?
Source: CBRE 2009 Green Building Study
LOWER TOTAL COST OF OCCUPANCY

The Tenant’s Perspective:
An Example
*Source: Kilroy Realty Corporation

The Tenant’s Perspective
Building Age 2000 1983 2001
Sq Ft 490,000 415,000 300,000
Operating Expenses ($ psf)
Utilities 1.32 1.80 2.33
Janitorial 1.15 1.56 1.97
Administration 0.96 1.60 2.09
Repairs & Maintenance 1.34 1.73 1.05
Management Fees 0.91 0.77 1.67
Insurance 0.59 0.65 0.52
Security 0.54 0.59 0.50
Landscaping 0.07 0.05 0.30
Non-Reimbursable 0.01 0.15 0.10
Expenses ex Tax 6.89 8.90 10.53
RE Tax Estimate 4.00 4.00 4.00
Other 1.71 - -
Total Expenses 12.60 12.90 14.53
Rental Rate (NNN) ? ? 25.97
Total Cost to Tenant ? ? 40.50
*Source: Kilroy Realty Corporation

The Tenant’s Perspective
*Source: Kilroy Realty Corporation
Operating Expenses ($ psf)
Utilities 1.32 1.80 2.33
Janitorial 1.15 1.56 1.97
Administration 0.96 1.60 2.09
Repairs & Maintenance 1.34 1.73 1.05
Management Fees 0.91 0.77 1.67
Insurance 0.59 0.65 0.52
Security 0.54 0.59 0.50
Landscaping 0.07 0.05 0.30
Non-Reimbursable 0.01 0.15 0.10
Expenses ex Tax 6.89 8.90 10.53
RE Tax Estimate 4.00 4.00 4.00
Other 1.71 - -
Total Expenses 12.60 12.90 14.53
Rental Rate (NNN) 27.90 27.60 25.97
Total Cost to Tenant 40.50 40.50 40.50

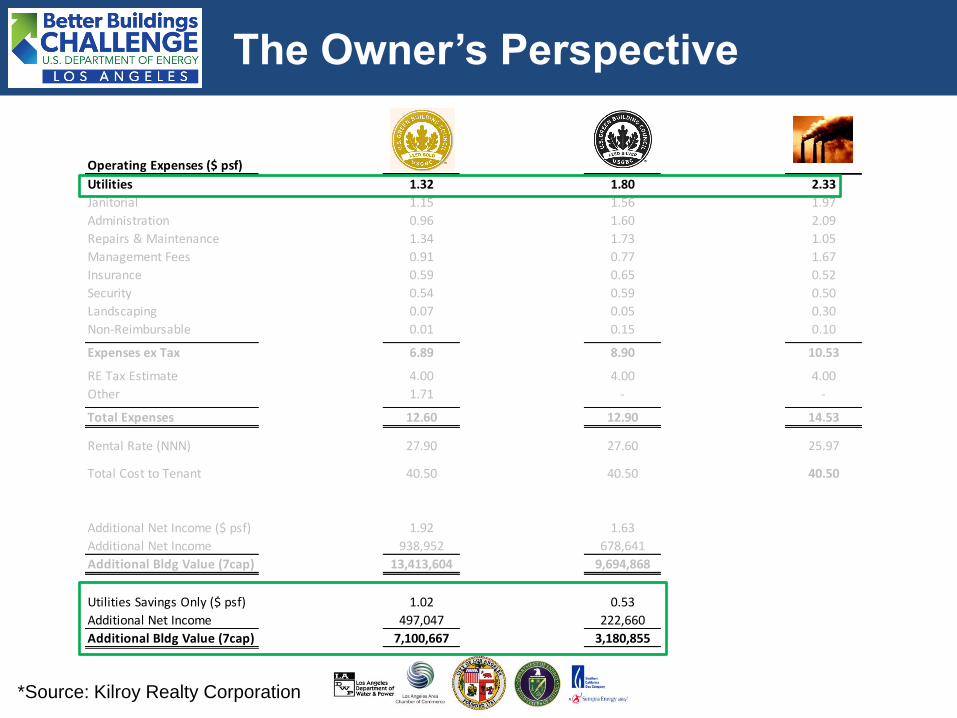
The Owner’s Perspective
*Source: Kilroy Realty Corporation
Operating Expenses ($ psf)
Utilities 1.32 1.80 2.33
Janitorial 1.15 1.56 1.97
Administration 0.96 1.60 2.09
Repairs & Maintenance 1.34 1.73 1.05
Management Fees 0.91 0.77 1.67
Insurance 0.59 0.65 0.52
Security 0.54 0.59 0.50
Landscaping 0.07 0.05 0.30
Non-Reimbursable 0.01 0.15 0.10
Expenses ex Tax 6.89 8.90 10.53
RE Tax Estimate 4.00 4.00 4.00
Other 1.71 - -
Total Expenses 12.60 12.90 14.53
Rental Rate (NNN) 27.90 27.60 25.97
Total Cost to Tenant 40.50 40.50 40.50
Additional Net Income ($ psf) 1.92 1.63
Additional Net Income 938,952 678,641
Additional Bldg Value (7cap) 13,413,604 9,694,868
Utilities Savings Only ($ psf) 1.02 0.53
Additional Net Income 497,047 222,660
Additional Bldg Value (7cap) 7,100,667 3,180,855

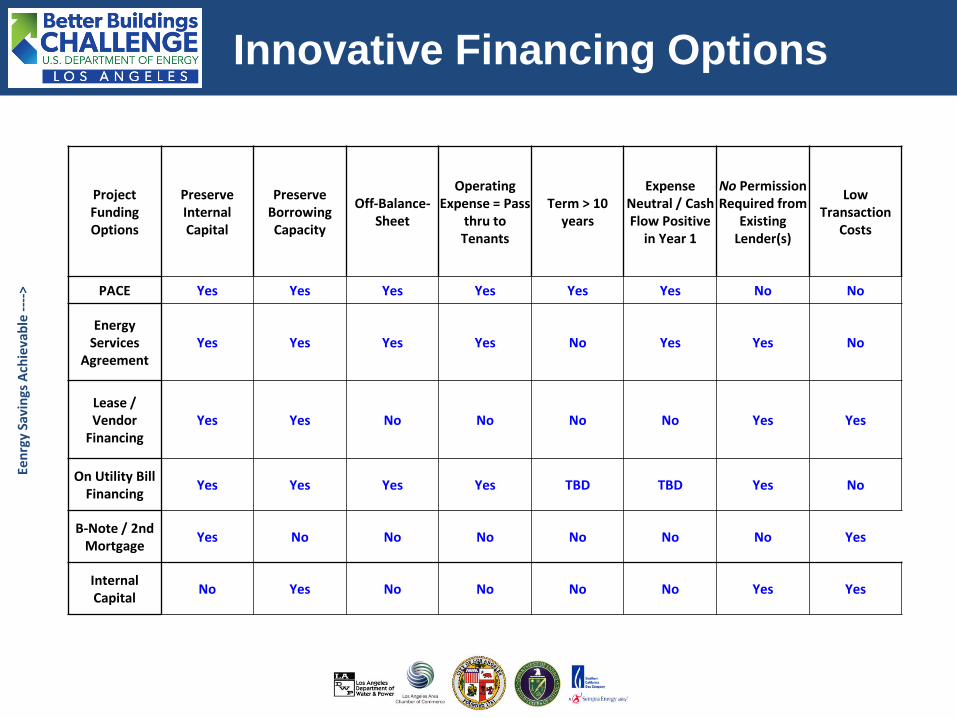
Innovative Financing Options
Inability to secure repayment drives up rates, shortens terms
Assets held by single-purpose LLC with no credit
Owner desires to preserve borrowing capacity
Competition for capital
“Split-incentives” between landlords and tenants
Short hold period
Short payback requirements
Repayment secured through property taxes or utility bills
Repayment secured by contract or by property, not owner credit
Off-balance Sheet Treatment preserves borrowing capacity
100% external financing Repayment structured as an
operating expense, like utility bills Repayment transfers with property Longer term financing = cash flow +
Historical Barriers New Solutions
Een
rgy
Savi
ngs
Ach
ieva
ble
---
->
Project Funding Options
Preserve Internal Capital
Preserve Borrowing Capacity
Off-Balance-Sheet
Operating Expense = Pass
thru to Tenants
Term > 10 years
Expense Neutral / Cash Flow Positive
in Year 1
No Permission Required from
Existing Lender(s)
Low Transaction
Costs
PACE Yes Yes Yes Yes Yes Yes No No
Energy Services
Agreement Yes Yes Yes Yes No Yes Yes No
Lease / Vendor
Financing Yes Yes No No No No Yes Yes
On Utility Bill Financing
Yes Yes Yes Yes TBD TBD Yes No
B-Note / 2nd Mortgage
Yes No No No No No No Yes
Internal Capital
No Yes No No No No Yes Yes
Innovative Financing Options

Cash Flow Positivity
-5000000
-4000000
-3000000
-2000000
-1000000
0
1000000
2000000
3000000
1 2 3 4 5 6 7 8 9 10 11 12 13 14 15 16 17 18 19 20
Cumulative Unlevered Cash Flow
Cumulative Levered Cash Flow (Net)
No upfront cost for necessary equipment replacement
Tax Incentives for EE Retrofits
But if you’re going green…
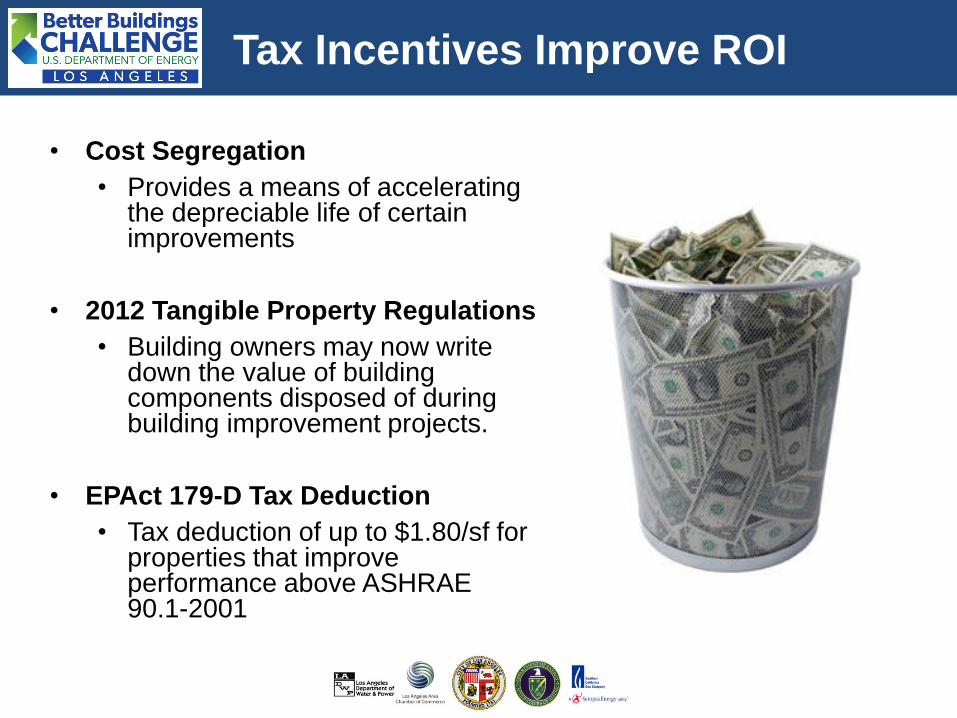
• Cost Segregation
• Provides a means of accelerating the depreciable life of certain improvements
• 2012 Tangible Property Regulations
• Building owners may now write down the value of building components disposed of during building improvement projects.
• EPAct 179-D Tax Deduction
• Tax deduction of up to $1.80/sf for properties that improve performance above ASHRAE 90.1-2001
Tax Incentives Improve ROI

• Onsite Generation
• Efficient HVAC
• High Performance Lighting
• Sophisticated BAS & Controls
• Demand Response
• Energy Storage
• Tenant level EE
• Real-Time Data
• EV Chargers
Working Buildings in 2030…
Source: McKinstry
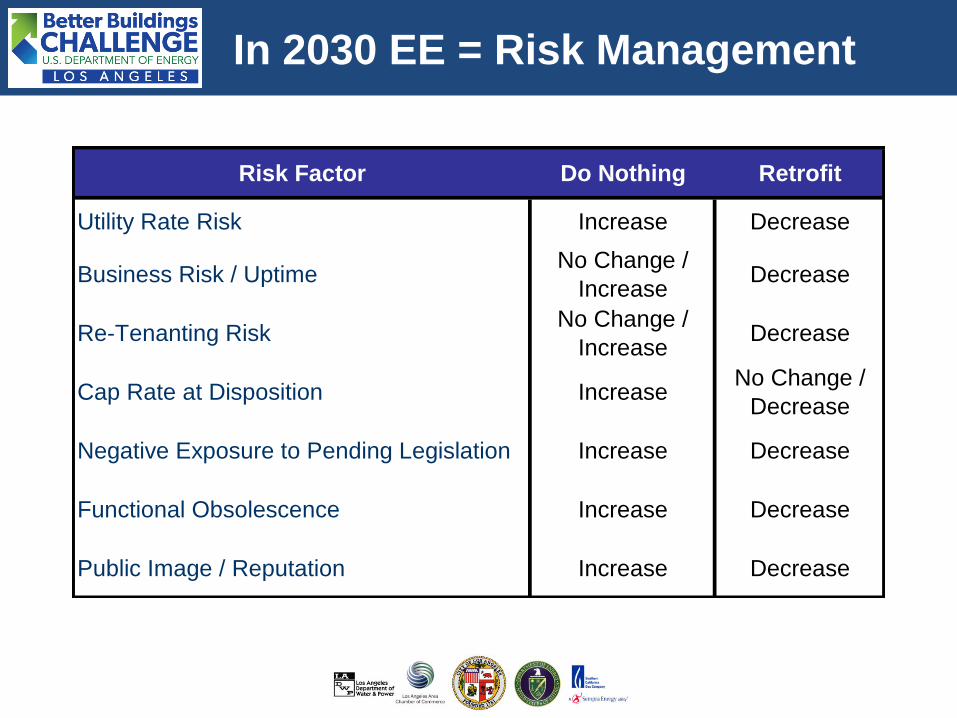
In 2030 EE = Risk Management
Risk Factor Do Nothing Retrofit
Utility Rate Risk Increase Decrease
Business Risk / UptimeNo Change /
IncreaseDecrease
Re-Tenanting RiskNo Change /
IncreaseDecrease
Cap Rate at Disposition IncreaseNo Change /
Decrease
Negative Exposure to Pending Legislation Increase Decrease
Functional Obsolescence Increase Decrease
Public Image / Reputation Increase Decrease

Demand will drive investment…
How will we get there?
But only if we…
• Develop a common
language in the EE
community
• Learn to speak
“financial”
• Align around standards
And drive investor confidence in EE investments.

David Hodgins Executive Director
LA Better Buildings Challenge
Thank you!
Operating
costs
drop 8.5%
Building
value
rises 6.8%
ROI
improves
2.5%
Occupancy
rises 1%
Rents
rise 19.2%
Source: McGraw Hill Construction (2010). Green Outlook 2011: Green Trends Driving Growth.
www.LA-BBC.com