the business improvement district: - lorlene hoyt
TRANSCRIPT

THE BUSINESS IMPROVEMENT DISTRICT:AN INTERNATIONALLY DIFFUSED APPROACH
TO REVITALIZATION
Lorlene M. Hoyt, Ph.D.Edward H. and Joyce Linde Career Development Assistant Professor of PlanningDepartment of Urban Studies and Planning, Massachusetts Institute of Technology77 Massachusetts Avenue, Room 9-528Cambridge, MA 02139-4307 - USAPhone: 617.452.2073 Email:[email protected]:http://www.urbanrevitalization.net
Is it possible that someone went to City Hall asking permission to do something and offer to pay for it on their own? Our businessmen did and the cost of all these improvements is added to their business tax bill every year through a special arrangement made with the city. The area now has a bright new name to complement its image, ‘the Bloor West Village.’ It belongs to the residents of Ward One who should enjoy it and patronize the businesses that made it possible. After all, there are other parts of the city that want one like it.
-Alderman Boytchuk describing the world’s first BID, in 1971

2 3
TABLE OF CONTENTS
INTRODUCTION ………………………………………… 3
THEORETICAL FRAMEWORK ……………………………… 4 Network Actors 4 Canada, New Zealand, and South Africa 4-7
METHODOLOGY ………………………………………… 8 - 11
STUDY FINDINGS ……………………………………… 12-20
CONCLUDING REMARKS ………………………………… 21
APPENDIX Quantitative Survey Results 22-44 Qualitative Survey Results 45-52 Survey Instrument 53-58
ACKNOWLEDGEMENTS ………………………………… 59
REFERENCES ………………………………………… 60-63

2 3
For more than a year, researchers at the Department of Urban Studies and Planning at the Massachusetts Institute of Technology (MIT) have studied the role of business improvement districts (BIDs) and BID-like1 organizations in supporting community revitalization efforts. Specifically, this project examines where and why these organizations form, how they vary with respect to structure, scope, and purpose, and how they have changed over time. While BID organizations were originally considered a North American phenomenon, enabling legislation and operational organizations2 currently exist in Canada, New Zealand, the United States, and South Africa, as shown in Table 1.
More recently, the concept has spread to other regions of the globe including Australia, Austria, Belgium, Denmark, France, Germany, Japan, Netherlands, Norway, Portugal, Spain, Sweden, and the United Kingdom, as shown in Table 2. This project, the first international survey of BIDs and BID-like organizations outside the United States, builds on previous research (Mitchell, 1999) and assembles the requisite data to answer the aforementioned questions.
The BID model represents a flexible form of governance that allows participants to craft solutions in a way that is sensitive to the local context and where state and local funding is limited. The model provides an opportunity for multiple stakeholders to organize, operate with autonomy, and manage programs to improve the physical, economic, and social conditions within their geographical jurisdiction. The BID model also allows commercial interests to aggressively promote downtown areas by managing sophisticated marketing campaigns and outdoor events that attract visitors.
The BID has emerged as an internationally diffused model for urban revitalization as evidenced by the proliferation of organizations in a wide range of contexts. Prior to the start of this project, little was known about the number or distribution of BID and BID-like organizations around the world. For example, a report that resulted from the World Bank Urban Forum held on April 3, 2002 in Washington, DC, claims that there were 60,000 such organizations worldwide. Project findings demonstrate the enormous and often overlooked contributions of business and property owners in improving the quality of life for those who live or simply like to spend their leisure time downtown.
1A distinction between BID and BID-like organizations is offered on page 9.2According to Steven Rosenburg, Chief of Party for the Serbia Local Government Reform Program, BIDs exist in Serbia (in Krusevac, Nis, Valjevo, and Zrenjanin) and Albania (in Durres). This effort, financed by the United States Agency for International Development (USAID), is intended to improve many aspects of local government performance, including financial management and citizen participation in cities throughout Central and Eastern Europe. The model will soon be introduced in the Czech Republic, Poland, and Romania.
INTRODUCTION
West Bloor Village BIA, Toronto, Canada
University City District BID, Philadelphia, USA
Green Point BID, Cape Town, South Africa

4 5
THEORETICAL FRAMEWORKWhile it is beyond the scope of this paper to fully explore the policy diffusion literature, the policy network concept provides a useful framework for describing the BID movement. A policy network is a “a set of relatively stable relationships which are of nonhierarchical and interdependent nature, linking a variety of actors who share common interests with regard to a policy and who exchange resources to pursue these shared interests acknowledging that cooperation is the best way to achieve common goals” (Borzel, 1998).
Policy transfer attends to the way that policies and practices in one context are used to develop policies and practices in other settings (Dolowitz and Marsh, 2000; 5). For example, British officials implemented the Urban Development Grant (UDG) shortly after the United Kingdom’s Department of the Environment examined “potentially adoptable” policies for inner-city revitalization, like the United States’ Urban Development Action Grant (UDAG) (Wolman, 1992). Policy transfer, therefore, is a type of policy learning, because it includes the acquisition and utilization of knowledge about policies elsewhere (Dolowitz, 1997). Other terms describing the voluntary transfer of policy knowledge include lesson-drawing (Rose, 1993) and policy band-wagoning (Ikenberry, 1990).
Network ActorsTheorists agree that policy transfer occurs within networks and is influenced by the distribution and disposition of individual actors across the network (Marsh and Rhodes, 1992; Borzel, 1998; Mintrom and Vergari, 1998). Independently, these actors represent public, private or public-private organizations and function as experts or ‘policy transfer entrepreneurs’ (Dolowitz and Marsh, 1996) to advocate the spread of certain policies and information. Collectively, they constitute a transnational system for sharing information and promoting policy transfer. Following a detailed analysis of the BID movement and with a particular focus on network actors, the author suggests that the BID emerged as an international model for urban revitalization because network actors, operating within policy networks, deliberately transferred BID policy and practices from one context to the next over time.
Examples From Canada, New Zealand, and South AfricaThe author’s findings support the claim that BID policy network actors, such as property owners, NGOs, public agencies, private consultancy firms and elected officials are instrumental to the process of policy transfer and essential in the explanation of the BID movement. The following section of this study identifies the actors responsible for initiating the world’s first BID in 1971. Next, it describes the actors and events leading to successful passage of BID policy in New Zealand and South Africa.
Melbourne, Australia
Tokyo, Japan

4 5
Canada
Neil McLellan, a jewelry store owner and Chairman of the Bloor-Jane-Runnymede Business Men’s Association’s Parking Committee, conjured up the notion of a BID in the mid-1960s. A new committee eventually formed, including representatives of the Business Men’s Association, City of Toronto Planning Board, City Council, Department of Public Works, Parking Authority, City Surveyors Department, City Real Estate Dept, City Legal Department, Department of Streets, Metro Roads and Traffic Department, Department of Parks and Recreation, Development Department, Toronto Transit Commission, Toronto Hydro Electric Commission and Ontario Hydro, to explore the feasibility of business district with a self imposed tax on local property owners as a means for collective improvements to protect their individual investments (Grys, 1972).
After considerable research into the subject, the Committee discovered that the formation of such a district required enabling legislation. With cooperation from the Department of the City Solicitor, the Committee crafted the necessary legislation, which passed in the Legislature on December 17, 1969 (Grys, 1972; Ling, 2002). After years of planning, the world’s first BID, Bloor West Village (BWV), became a legal reality in 1971 when the City of Toronto passed By-law No.170-70.
West Bloor Village BIA, Toronto, Canada
Old Port Dalhousie BIA, St. Catharines, Canada

6 7
New Zealand
Mall development in New Zealand began in the 1960s, and by the 1980s New Zealand’s town and city centers were negatively impacted by suburbanization and decreasing retail sales. As a result, Council planners imported the main street model from the United States to coordinate economic development efforts. Town centers, with assistance from their local council, are able to implement a separate rate, or SR, (a self-funding mechanism which activates a surcharge on the general business tax) for making capital improvements in well-defined areas. Few centers have successfully completed the separate rating process, but those that have are considered BIDs for the purpose of this study.
While we were able to identify 30 town centers that currently utilize this self-funding mechanism (Table 1), most town centers are funded by Council grants, and are considered BID-like (Table 2). For example, for several decades, the Takapuna Beach Business Association (TBBA) in Auckland was structured as a typical town center organization. In the late 1990s, key retailer members worked for five years to raise interest in and gain support for a separate rating. In 2000, after several years of discussion and attempts, the TBBA gained funding from the North Shore City Council to undertake the process (Houston, 1997). In the first year of the SR (July 2001 to June 2002), the TBBA worked primarily on marketing and promotion.
Downtown Burlington BIA, Burlington, Canada
Cantebury, New Zealand

6 7
South Africa
The BID movement, however, is entirely new to South Africa; the first BID enabling statute was enacted in 1999. As shown in Table 1, there are 21 BID organizations operating in communities throughout the Republic of South Africa today, namely Johannesburg, Midrand, Pretoria, and Cape Town. Since there are 21 additional organizations currently under consideration (Table 2), we can expect that the total of BID organizations will likely double in the near future.
The BID concept diffused to Cape Town in the late 1990s as property owners and city management raised concerns regarding urban decay in the central business district. At this time, stakeholders researched a variety of international urban renewal models, including the Downtown Denver Partnership, the Downtown Denver Business Improvement District, the Downtown Seattle Association, the Seattle Metropolitan Improvement District, the Times Square BID, as well as similar organizations in Washington, D.C. and Coventry. As a result, the Cape Town Partnership (CTP) formed and simultaneously, the Cape Town City Council enacted a municipal by-law authorizing the creation of BIDs. Tygerberg and South Peninsula municipal administrations soon replicated this by-law, save minor modifications (Veley, 2003).
The CTP manages BIDs throughout the Cape Town Metropolitan Area, mostly those on the periphery of the central city. Those beyond the periphery are predominantly self-managed. Three BIDs, the Cape Town Central City Improvement District, the Claremont Improvement District and Wynberg Improvement District began operations in 2000. With an
annual budget of approximately $1.5 million, the Central City Improvement District’s primary focus is crime prevention. The security program includes 160 dedicated security personnel in the CBD, including 60 Community Patrol Officers and 100 private security officers that patrol on foot, horseback, and motorized vehicles.
Community Patrol Officers are South African Police Reservists; unlike the private security officers, they have the power to arrest criminal suspects. The ground patrols are complemented by 75 surveillance cameras paid for by the Council. Furthermore, parking marshals employed by the Cape Town Partnership provide additional security.
City of Tshwane, South Africa
Cape Town Central CID, Cape Town, South Africa

8 9
METHODOLOGYWith support from MIT’s Humanities and Social Science Fund and with cooperation from the International Downtown Association (IDA), the author launched the International BID Project (IBP) in August 2002. Designed to trace the origins and progression of the BID movement and document the role of business and property owners in revitalizing urban areas throughout the globe, this study represents a systematic examination of an elusive subject.
Promotional newsletters and pamphlets describing the activities of individual BID organizations are bountiful; however, an understanding of how the BID model diffuses and responds to different national contexts requires more than a collection of readily available materials. Such a study requires an in-depth and systematic investigation. This case study analysis, therefore, employed a range of data collection techniques. Primary data collection involved an international survey of BID organizations as well as on-site, semi-structured personal interviews with BID managers, public and private service providers, and government officials. Secondary sources included BID enabling legislation, public hearing transcripts, scholarly papers and newspaper articles.
Prior to the identification of organizations, it was necessary to craft a flexible yet functional definition of what qualifies as a BID. This effort began with a comprehensive review of the literature. While individual states and provinces offer concise operational definitions within enabling statutes, there is no standard definition and some scholars and practitioners are at odds. The primary disagreement centers on whether the “financing mechanism” is mandatory or voluntary. For example, Mitchell’s definition requires BIDs to impose an added tax on all the properties and (or businesses) in the area, while Houstoun (Houstoun, Jr., 1997) allows entities that rely solely on voluntary donations to qualify as full-fledged BIDs. To further complicate matters, there is no standard naming convention. Variations within the United States include, “special improvement districts” (SIDs), “public improvement districts” (PIDs), “neighborhood improvement districts” (NIDs) and “municipal improvement districts” (MIDs). In Canada and South Africa, they are known as “business improvement areas” (BIAs) and “city improvement districts” (CIDs), respectively.
Although the BID appears to be a new economic development concept, it is more accurate to describe it as a hybrid that combines elements from a variety of models including the special purpose district, the special assessment district, and the special zoning district (Briffault, 1999; Hoyt, 2001). For the purposes of this study, a BID is publicly sanctioned - yet privately directed - organization that supplements public services to improve shared, geographically defined, outdoor public spaces. Moreover, such organizations subscribe to a self-help doctrine, whereby a compulsory self-taxing mechanism generates multi-year revenue. Using this strict definition, BID organizations exist in four countries. They are: Canada, New Zealand, South Africa, and the United States. Early on, we discovered that there were many organizations that functioned like BIDs, but that did not rely on a self-taxing funding mechanism. For the purposes of this study, organizations that function like BIDs, but do not rely on a self-taxing mechanism are classified as “BID-like.” This category includes organizations like main street programs and centralized management organizations.

8 9
Today, the absence of enabling statutes in the United Kingdom and Japan prohibits the legal establishment of BID organizations; however, the passage of such legislation is imminent on both fronts. Therefore, the research team also identified and surveyed town centre management (TCMs) organizations3 in the United Kingdom and town management organizations4 (TMOs) in Japan that are likely to become BIDs once legislation is passed. As shown in Table 2, they identified 38 TCMs and 261 TMOs. The response rate was 34 percent and 26 percent, respectively.
To increase the likelihood of participation, the team modified language in the survey instrument for each country. The changes ranged from referring to BIDs as “Business Improvement Areas” for Canada and “City Improvement Districts” for South Africa, to translating the entire instrument into Japanese for surveying TMOs in Japan. Project staff mailed envelopes, each containing a cover letter, survey, and postage-paid reply envelope, to the manager of each BID and BID-like organization identified. Managers who did not return a completed survey received reminders in the form of letters, phone calls, and electronic mail messages.
3England’s central government began a deliberate investigation into the adoption of the BID model in 1992. After extensive research and considerable debate, several public sector bodies and national businesses recently provided the funding and support for a pilot BID project. Of the more than 300 TCMs in existence today, nearly 100 applied to participate. Ultimately, the Association of Town Centre Management (ATCM), the entity entrusted with administering the pilot project, selected 23 sites located in cities such as Birmingham and Bristol, Coventry and Manchester, Liverpool, Lincoln and London. If the Local Government Bill currently before Parliament is passed, the pilot organizations will become full-fledged BIDs.4In 1999, the Japanese government passed legislation allowing the creation of Town Management Organizations (TMOs) to assist with the revitalization of downtown improvement districts (DID) --- the Japanese equivalent of a central business district (CBD). TMOs are BID-like in that they represent a joint effort between local government and business owners. Local governments formulate the Basic Plan, which describes proposed development projects and may also specify the need for a TMO. Often the city appoints the Chamber of Commerce as the TMO, but may select other types of organizations. Currently, the Tokyo metropolitan government is investigating the feasibility of a BID in Shiodome-chiku Machizukuri Kyogikai.
Table 1– Survey Response Rate, BID Organizations
To begin, the research team obtained and compiled mailing lists from professional membership organizations like the International Downtown Association (IDA) as well as national, state, and local governments. From September 2002 to December 2002, we mailed 347 surveys to BID organizations in Canada, 21 to BID organizations in South Africa, and 30 to BID organizations in New Zealand. As shown in Table 1, the response rate was 27 percent, 81 percent, and 53 percent, respectively.
COUNTRY NUMBER OF
ORGANIZATIONS CONTACTED
RESPONSES RESPONSE RATE
Canada 347 92 27%United States (Mitchell, 1999) 404 264 65%New Zealand 30 16 53%South Africa 21 17 81%
TOTAL 802 389 49%

10 11
Table 2 – Survey Response Rate, BID-like Organizations
The five page survey instrument contains questions that allow open-ended responses as well as questions in a multiple-choice format. It has five distinct sections. They are: Formation, Structure and Scope, Purpose, Performance Evaluation, and Evolution (See Appendix – Survey Instrument). For the sake of comparison, some portions of the survey instrument are identical to the one Mitchell used to survey American BIDs (Mitchell, 1999). For example, eight multiple-choice questions invite the manager to select the phrase that best describes the organization’s level of involvement with providing supplemental public services. The phrases are: “very involved,” “somewhat involved,” and “not at all involved.” Below is a list of those services.
• Capital Improvements - Funding and supervising the installation of street lighting, sidewalks, curbing, bus shelters, street trees, trash receptacles, bicycle racks and signage.
• Consumer Marketing - Hosting special events and devising formal marketing campaigns to attract customers (visitors, residents and investors). • Economic Development - Offering incentives such as tax abatements or loans to new and expanding businesses.
• Maintenance - Providing or coordinating garbage, snow, and grafti removal as well as sidewalk sweeping and landscape maintenance activities.
• Policy Advocacy - Lobbying government bodies and advocating policies intended to benet commercial interests.
• Security - Paying for security guard patrols, installing electronic security systems, working in tandem with local police departments, and helping business owners prevent crime.
• Social Services - Supporting job training, homeless outreach, and youth services.
• Transportation - Financing and operating parking garages, parking lots and shuttle buses to relieve parking pressures.
COUNTRY NUMBER OF
ORGANIZATIONS CONTACTED
RESPONSES RESPONSE RATE
Australia 185 30 16%Belgium 31 5 16%European, Other* 60 0 0%Germany 59 4 7%Japan 261 67 26%United Kingdom 38 13 34%Netherlands 5 4 80%New Zealand** 110 6 16%Norway 32 3 9%South Africa*** 21 1 1%
TOTAL 802 133 16%
* ”European, Other” includes Austria, Denmark, France, Portugal, Spain, and Sweden **These are organizations that do not employ the separate rating mechanism ***These are organizations that currently rely on voluntary contributions

10 11
To augment the survey, the author conducted 72 personal interviews in Canada, the United States, South Africa and The United Kingdom. This process began by contacting BID managers, public and private service providers, and government officials, and requesting permission to conduct on-site interviews. Interviews in the United States took place from 1999 to 2000 as part of earlier research, while site-visits to Canada, South Africa, and The United Kingdom occurred between August 2002 and March 2003. Beyond the standard interview, most BID managers led a narrative walking tour of the district and its surrounds, and furnished copies of internal reports and studies. As a result, interviews varied in style and length. For example, some were less than an hour in duration and took place in the BID manager’s office. However, interviews with others, like Neil Fraser, the Executive Director of the Central Johannesburg Partnership, spanned several days and included a tour of BIDs throughout the metropolitan area. Unlike the survey, the interviews allowed the author to deviate from the preformatted list of questions and direct face-to-face contact facilitated a working relationship with BID managers and other experts.

12 13
100%
80%
60%
40%
20%
0%AUSTRALIA CANADA SOUTHCONTINENTAL JAPAN NEW UNITED
AFRICAEUROPE ZEALAND KINGDOM
STUDY FINDINGSWhere do BID organizations form?
Through this study, we identied 1,200 BIDs and BID-like organizations on four different continents: North America, Europe, Africa and Australia/Oceania. As shown in Tables 1 and 2, we surveyed organizations in 16 countries, including Australia, Austria, Belgium, Canada, Denmark, France, Germany, Japan, the Netherlands, New Zealand, Norway, Portugal, Republic of South Africa, Spain, Sweden, and the United Kingdom. According to the denition set forth earlier in this report, there are BID organizations in three countries (outside the United States): Canada, New Zealand, and South Africa. The overall response rate for all of the organizations surveyed was 31% for BIDs5 and 16% for BID-like organizations. Countries with the highest percentage of respondents included the Netherlands (80%), United Kingdom (34%), Canada (27%) and Japan (26%). Moreover, results show that the cities with the greatest number of BID organizations are Toronto, Canada (43); Vancouver, Canada (21); and Cape Town, South Africa (18).
Of the hundreds of governments throughout Canada that have allowed the authorization of BID organizations, nearly three quarters were authorized before 1990, as shown in Table 3. Further, the BID model remains a popular approach in Canada as evidenced by the recent endorsement of the Downtown Yonge Street BID in Toronto and the Downtown Montreal Commercial Development Association in Montreal. In fact, the median year that Canadian organizations began operations was 1984. This stands in stark contrast with the data collected from organizations in other countries (Australia 1993; New Zealand, 1993; Japan, 2000; South Africa, 2000; United Kingdom, 2000).
According to Mitchell’s study, the BID movement reached the United States in the 1970s and only about one-third of the nation’s organizations were authorized before 1990 (Mitchell, 1999). One explanation for why the model diffused in Canada more rapidly than in the United States is that Canadian governments encouraged the establishment of BIDs. For example, in the 1970s, the Province of Ontario made infrastructure grants available, but only BID organizations were eligible for funding.
5This does not include Mitchell’s survey of organizations within the United States.
BID-like Organizations
Table 3 – Percentage of Organizations in Operation Before 1990

12 13
How do BID and BID-like organizations vary among nations?First, an analysis of survey responses shows that while residents, government agencies, and elected ofcials contribute to the establishment of BID organizations, most efforts are led by business and property owners. As shown in Table 4, nearly 90% of the BID organizations in both Canada and New Zealand reported that business owners were responsible for forming the organization, compared to only 65% of the respondents from South African organizations. Conversely, 100% of the respondents representing South African BID organizations indicated that property owners were responsible for forming the organization, compared to less than 50% of the respondents from Canada and New Zealand. An analysis of the groups responsible for forming BID-like organizations is available in the Appendix.
Table 4 - Groups Responsible for Forming the Organization
0%
20%
40%
60%
80%
100%
CANADA 97% 45% 28% 12% 2% 1% 0% 8%
NEW ZEALAND 65% 100% 18% 6% 29% 0% 0% 0%
SOUTH AFRICA 65% 100% 18% 6% 29% 0% 0% 0%
BusinessOwners
PropertyOwners
ElectedOfficials
GovernmentAgencies
ResidentsMedical
InstitutionsEducationalInstitutions
Other
When asked whether the groups responsible for forming the organization experienced opposition, BID and BID-like entities responded differently. For example, BID-like organizations in Continental Europe (14%) and Japan (11%) reported less opposition than BID organizations located in Canada (36%), New Zealand (38%), and South Africa (59%), as shown in Table 5.
Despite the fact that many business and property owners are responsible for BID formation, others express opposition. For example, a higher percentage of South African (65%) organizations indicated that they had experienced opposition from property owners; opposition from property owners was less prevalent in Canada (20%) and New Zealand (19%), as shown in Table 6.
BID Organizations

14 15
Table 5 – Percentage of Organizations that Experience Opposition
0%
20%
40%
60%
80%
YES 40% 36% 14% 11% 38% 59% 31%
AUSTRALIA CANADACONTINENTAL
EUROPEJAPAN
NEWZEALAND
SOUTHAFRICA
UNITEDKINGDOM
BID-like Organizations
0%
20%
40%
60%
80%
100%
CANADA 30% 20% 7% 2% 0% 2% 0% 2%
NEW ZEALAND 18% 18% 5% 9% 9% 0% 0% 0%
SOUTH AFRICA 17% 67% 0% 0% 11% 0% 0% 0%
BusinessOwners
PropertyOwners
ElectedOfficials
GovernmentAgencies
ResidentsMedical
InstitutionsEducationalInstitutions
Other
BID Organizations
In terms of structure, BID managers were twice as likely to characterize the structure of their organization as a not-for-profit than BID-like organizations in Continental Europe, Japan, and the United Kingdom, as shown in Table 7.
Table 6 – Opposition from Specific Groups

14 15
Table 7 - Percentage of Respondents Characterizing Organization as Not-for-profit
0%
20%
40%
60%
80%
100%
Non Profit 83% 59% 33% 17% 100% 71% 33%
AUSTRALIA CANADACONTINENTAL
EUROPEJAPAN
NEWZEALAND
SOUTHAFRICA
UNITEDKINGDOM
BID-like Organizations
With respect to scope, the majority of BID and BID-like organizations are relatively small as measured by the number of full-time employees and the number of members on the governing boards. For example, the majority of managers in every context – Australia (100%), Canada (91%), Continental Europe (66%), Japan (60%), New Zealand (100%), South Africa (54%), and the United Kingdom (54%) – reported having a staff of three or fewer full-time employees. Also, the majority of managers in every context – Australia (79%), Canada (58%), Continental Europe (59%), Japan (79%), New Zealand (93%), South Africa (54%) – except the United Kingdom (23%) – claimed that they had ten or fewer members on their governing board.
As for spending, the current median annual budget6 reported by BIDs in South Africa ($167,000) is twice as high as those in Canada ($84,000) and eight times the size of BIDs in New Zealand ($27,000). For more information on the annual operating budgets for BID and BID-like organizations, see Appendix. Additionally, BIDs are innovative fund raisers: they not only collect mandatory assessments, but they also depend on other sources of revenue to sustain their operations. About half of the managers in New Zealand (52%) who responded to the survey reported that they received voluntary donations or in-kind contributions. Additionally, approximately one-half of the BID managers in New Zealand (48%) and well over one-third in Canada (40%) indicated that they received financial support in the form of subsidies and government grants. In contrast, of the South African BID managers who responded to the survey, none indicated additional revenue from any of the sources listed.
The provision of services by BID organizations also varies among countries. While 66% of respondents in Canada reported that they are “very involved” in capital improvements, only 20% and 18% of the respondents in New Zealand and South Africa, respectively, responded that they are “very involved” in capital improvement, as shown in Table 8. Moreover, 83% and 63% of respondents in Canada and New Zealand, correspondingly, reported that they are “very involved” in consumer marketing, only 12% of the respondents in South Africa are “very involved.” In contrast, all of the respondents in South Africa (100%) reported that they are “very involved” in maintenance and security; however, less than 10% of the respondents from New Zealand and approximately 30% of the respondents from Canada reported that they are “very involved” in maintenance and security.
6Responses to this question were received in each country’s native currency. For the purpose of this analysis, the values have been converted to United States Dollars based on average exchange rates from 2003 and according to the St. Louis Federal Reserve Bank. These statistics are not adjusted to account for cross-country differences in buying power, cost of labor, and etcetera.

16 17
Table 8 – Percentage of BIDs “Very Involved” in Service Provision, by Service Type
0%
20%
40%
60%
80%
100%
CANADA 66% 83% 34% 27%
NEW ZEALAND 20% 63% 7% 7%
SOUTH AFRICA 18% 12% 100% 100%
CapitalImprovement
ConsumerMarketing
Maintenance Security
BID Organizations
As mentioned earlier, BID and BID-like organizations provide policy advocacy services when they lobby government bodies and support policies that benefit commercial interests. Interestingly, all of the organizations in New Zealand (100%), South Africa (100%), and the United Kingdom (100%) that responded to the survey reported some level of involvement, while the majority of BID and BID-like organizations in Continental Europe (92%), Canada (91%), Australia (74%), and Japan (67%) reported some level of involvement with policy advocacy, as shown in Table 9.
To evaluate their performance, BIDs and BID-like organizations rely on a wide array of indicators including crime rates, retail sales, number of jobs created, pedestrian counts, occupancy rates, customer surveys, and number of new businesses established. As shown in Table 10, most BIDs in South Africa (88%) and BID-like organizations in the United Kingdom (87%) have established performance measures. However, according to the organizations surveyed, this activity is less popular in Continental Europe (46%), Canada (38%), Australia (33%), New Zealand (23%) and Japan (11%).

16 17
Table 10 – Percentage of Organizations that Evaluate Performance
Table 9 – BID and BID-like Organizations Involved in Policy Advocacy Services
Policy Advocacy
0%
10%
20%
30%
40%
50%
60%
70%
80%
90%
100%
UnitedContinentalAustralia South AfricaCanada Japan New Zealand
Europe
37% 53% 39%Very Involved 50% 33% 43% 38%
37% 38% 61%Somewhat 42% 34% 57% 62%
27% 9% 0%Not at All 8% 33% 0% 0%
Kingdom
100%
80%
60%
40%
20%
0%AUSTRALIA CANADA SOUTHCONTINENTAL JAPAN NEW UNITED
AFRICAEUROPE ZEALAND KINGDOM
BID-like Organizations

18 19
Table 11 – Percentage of Organizations Using Performance Indicators
To deter criminal activity, the majority of South African BID managers said they used such methods as paid security patrols (94%), police patrols (89%), notication of property and business owners (72%), and closed circuit television surveillance (61%).
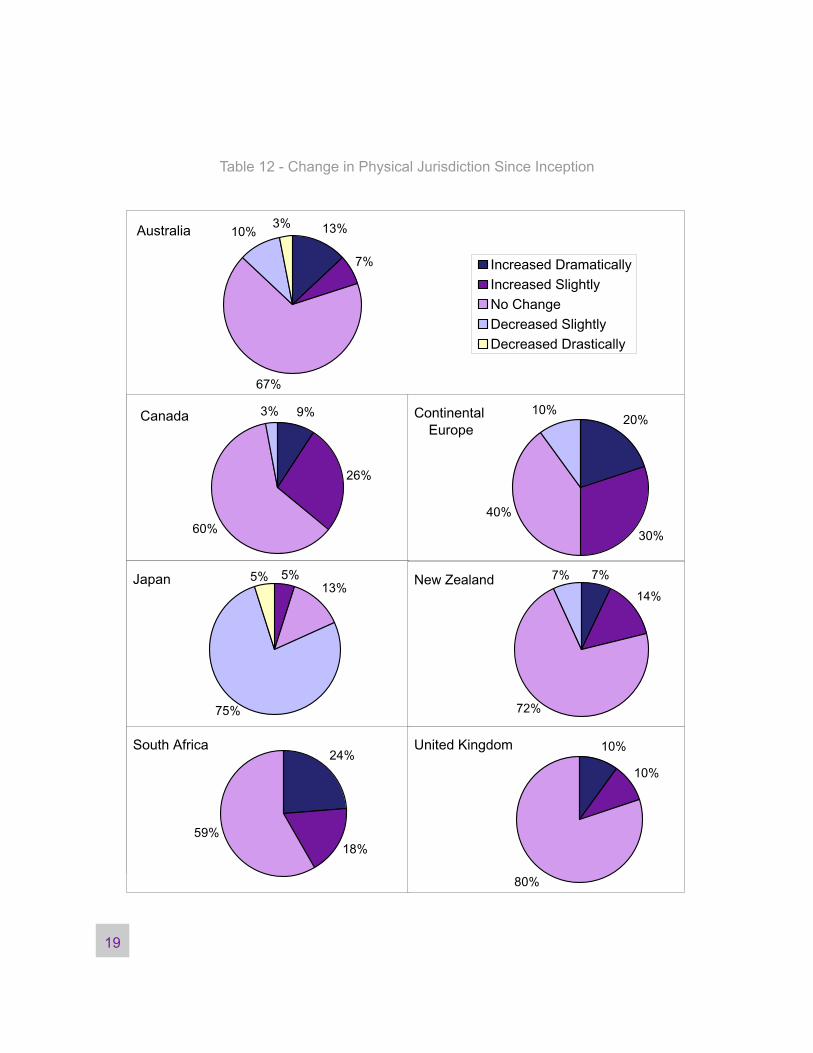
How have BID and BID-like Organizations Changed Over Time?When the managers of BID and BID-like organizations were asked to describe how their organization had changed its physical jurisdiction (boundaries) since implementation, the respondents in South Africa (24%) and Continental Europe (20%) reported that their physical jurisdiction increased dramatically since implementation; more than one-quarter of the organizations in Continental Europe (30%) and Canada (27%) indicated a slight increase in their jurisdiction, as shown in Table 12. Only BID-like organizations in Australia (3%) reported a dramatic decrease in physical jurisdiction.
When asked about change, as measured by the number of full-time employees, 17% of the respondents in the United Kingdom reported that the number of full-time employees increased dramatically since implementation. Moreover, a substantial proportion of the organizations in the United Kingdom (67%), South Africa (41%), Continental Europe (30%), Japan (22%), and Canada (21%) indicated a slight increase in the number of full-time employees, as shown in Table 13. Finally, it is worth noting that 80% of the managers in New Zealand reported a slight decrease in the number of full-time employees since implementation.
Because BIDs are a form of local governance, introduce an additional funding stream, manage the provision of supplemental public services, and concentrate their attention within discrete geographical boundaries, they affect urban management and development patterns. The final section of this report calls into question the role of individual BIDs, the collective impact of BID organizations that proliferate in a single municipality or region, as well as the implications of transnational policy transfer.
100%
80%
60%
40%
20%
0%CUSTOMER
NUMBER OF CRIME RATES
PEDESTRIAN
CANADA 24% 22% 7% 18% 27% 23%
SURVEYSNUMBER OF
OCCUPANCYRETAIL SALES JOBSCOUNTS
CREATED
24%
0% 15% 8% 15%NEW ZEALAND 0% 8% 15%
100% 41% 35% 65%SOUTH AFRICA 53% 12% 71%
BUSINESSES
BID Organizations
For BID organizations, except for pedestrian counts and compared to New Zealand and Canada, a higher percentage of South African BIDs reported using each of the aforementioned measures. As shown in Table 11, the most popular measures for South African BID managers were crime rates (100%), occupancy (71%), number of businesses (65%), and number of jobs created (53%).
18 19
Table 12 - Change in Physical Jurisdiction Since Inception
Australia 13%
7%
67%
10%3%
Increased DramaticallyIncreased SlightlyNo ChangeDecreased SlightlyDecreased Drastically
Canada 9%
26%
60%
3% Continental Europe
20%
30%
40%
10%
Japan13%
75%
5%5% New Zealand14%
72%
7% 7%
South Africa24%
18%59%
United Kingdom 10%
10%
80%

20 21
Table 13 - Change in the Number of Full-time Employees since Inception
Australia16%
8%
72%
4%
Increased DramaticallyIncreased SlightlyNo ChangeDecreased SlightlyDecreased Drastically
Canada11%
21%
51%
8%7%
Continental Europe 10%
30%
60%
Japan 7%
22%
66%
5%
New Zealand 8%8%
67%
17%
South Africa 6%
41%53%
United Kingdom 17%17%
67%

20 21
CONCLUDING REMARKS
This study shows where and why BID and BID-like organizations form, how they vary with respect to structure, scope, and purpose, and how they have changed over time. It also demonstrates that the BID model is an opportunity for business and property owners to respond positively to the inadequate provision of public services and competition from suburban markets. While private sector interests should be commended for their willingness to pay for improvements that benefit the public, their contributions have consequences that deserve serious consideration.
BIDs represent a more focused and flexible form of urban governance (Levy, 2001). Although rarely framed as such, BIDs are new governments, and operate with considerable autonomy. On one hand, these privately funded organizations foster a changing attitude in the approach to revitalization, by aggressively promoting downtown as an exciting place to live and to visit by managing sophisticated marketing campaigns and outdoor events. For example, the Downtown Kingston BID in Canada hosts 76 concerts and other outdoor events each year to attract visitors. On the other hand, these entities favor commercial interests.
Proponents argue that BID programs that include capital improvement services create a sense of place by visually and physically unifying public spaces that would otherwise remain disconnected and in a state of disrepair. In contrast, critics contend that BID-led capital improvement campaigns encourage generic design schemes and diminish the perceivable distinctions between different parts of the city or between cities.
Additionally, critics contend that BID ambassadors discriminate against people who live on the street by aggressively directing them to adjacent neighborhoods or to homeless shelter programs and that BID retail strategies discriminate against merchants that target low income customers. However, advocates note that many BIDs deliberately create job training and employment opportunities for low skilled workers and are largely preoccupied with supporting activities that attract people from all walks of life into public urban spaces.
Inarguably, it is important to recognize that some BID and BID-like organizations possess considerable wherewithal and are able to inuence decision and policy making activities. Furthermore, these organizations, motivated by self-interest, work to improve the physical, economic, and social conditions within their geographical jurisdiction. Said another way, BIDs endow private interests with the power to manage street-level activities and alter the physical nature of the urban environment. In cities where there are dozens of BIDs – like Toronto, New York, and Cape Town – it is reasonable to suspect that BIDs inadvertently create space-based inequalities in service delivery. In short, municipalities that loosely monitor BID activities inertly condone the production of interstitial areas that lack special funding and attention.
For better or worse, the BID has emerged as an international model for urban revitalization because network actors, operating within policy networks, deliberately transferred BID policy and practices from one context to the next over time. This investigation of the BID movement described the role of actors in promoting policy, revealing that networks facilitate the dissemination of ideas across continents. One salient advantage of network membership is the opportunity to benefit from the exchange of information. Information exchange is a form of learning that networks facilitate because they provide a forum for parties with similar interests, which allows participants to reduce transaction costs and form alliances. Together, actors build an infrastructure for sharing information, ideas, and resources beyond their domestic context. Further, actors rely on the network to underpin and advance policy innovations.
It is also important to note that the BID movement is penetrating other arenas, as evidenced by the adoption of such policy in non-commercial contexts. In 1998, then Pennsylvania Governor, Tom Ridge, signed legislation that allows the authorization of like organizations in residential, industrial and mixed-use areas. In closing, the BID is an important planning mechanism. Despite its worldwide appeal, further research is needed to explore not only the potential shortcomings of this approach to revitalizing urban areas, but to identify the exemplary organizations, analyze their practices, and further infuse the network with the innovation.

22 23
APPENDIXQuantitative Survey ResultsABOUT THE ANALYSIS
• To report quantitative survey results, the author calculated summary statistics and created tables, charts, and graphs to depict trends. There were three open-ended questions in the survey – the rst survey question (section one), a question in section three, and a question in section ve. These data are qualitative and appear in the next part of appendix.
• Data presented in tables, charts, and graphs are grouped into seven categories. They are: Australia, Canada, Continental Europe, Japan, New Zealand, South Africa, and the United Kingdom. Continental Europe includes Belgium, Germany, the Netherlands, and Norway (since none or the organizations in Austria, Denmark, France, Portugal, Spain, or Sweden responded to the survey).
• When a table, chart, or graph is grouped into seven categories, data for BID and BID-like organizations are combined . Where data presented in tables, charts, and graphs are grouped by the type of organization – BID or BID-like – responses are grouped accordingly. As shown in Table 1, 16 of the organizations in New Zealand that responded to the survey rely on compulsory payments and are, therefore, considered BID organizations. As shown in Table 2, 6 have not instituted a separate rating and are considered BID-like. The same holds true for South Africa where we received completed surveys from 17 BIDs and 1 BID-like organization.

22 23
SECTION I
2. In what year did the planning phase begin?
NUMBER OF ORGANIZATIONS (RESPONSE RATE)
YEAR AUSTRALIA CANADA CONT’LEUROPE JAPAN
NEWZEALAND
SOUTHAFRICA
UNITEDKINGDOM
1960s 2
(8.0%)1
(1.2%)0
(0.0%)5
(8.8%)1
(5.3%)0
0.0%0
0.0%
1970s 1
(4.0%)27
(32.5%0
(0.0%)0
(0.0%)0
(0.0%)0
0.0%0
0.0%
1980s 2
(8.0%)32
(38.6%)1
(7.7%)0
(0.0%)0
(0.0%)0
0.0%1
8.3%
1990s 18
(69.0%)21
(25.3%)8
(61.5%)48
(84.2%)13
(68.4%)11
61.1%6
50.0%
2000s 3
(12.0%)2
(2.4%)4
(30.8%)4
(7.0%)5
(26.3%)7
38.9%5
41.7%
100.0% 100.0% 100.0% 100.0% 100.0% 100.0% 100.0%
RESPONSESTO THIS QUESTION 26 83 13 57 19 18 12
TOTAL SURVEYSRECEIVED
30(87.0%)
92(90.2%)
13(100.0%)
62(91.9%)
22(86.0%)
18100.0%
13(92.0%)
EARLIEST 1950 1968 1980 1878 1920 1993 1988 MOSTRECENT 2002 2001 2003 2001 2001 2001 2003
MEAN 1991 1984 1997 1992 1992 1998 1998
MEDIAN 1994 1983 1998 1998 1998 1999 1998

24 25
3. In what year was your organization legally established?
NUMBER OF ORGANIZATIONS (RESPONSE RATE)
YEAR AUSTRALIA CANADA CONT’LEUROPE JAPAN
NEWZEALAND
SOUTHAFRICA
UNITEDKINGDOM
1960s 1
(5.0%)0
(0.0%)0
(0.0%)7
(11.3%)2
(11.8%)0
(0.0%)0
(0.0%)
1970s 1
(5.0%)28
(31.5%)0
(0.0%)1
(1.6%)0
(0.0%)0
(0.0%)0
(0.0%)
1980s 4
(18.0%)36
(40.4%)0
(0.0%)0
(0.0%)1
(5.9%)0
(0.0%)1
(10.0%)
1990s 13
(59.0%)17
(19.1%)6
(50.0%)17
(27.4%)8
(47.1%)5
(27.8%)3
(30.0%)
2000s 3
(17.0%)8
(9.0%)6
(50.0%)37
(59.7%)6
(35.3%)13
(72.2%)6
(60.0%)
100.0% 100.0% 100.0% 100.0% 100.0% 100.0% 100.0%
RESPONSESTO THIS QUESTION 22 89 12.00 62 17 18 10.00
TOTAL SURVEYSRECEIVED
30(73.0%)
92(96.7%)
13.00(92.0%)
62(100.0%)
23(73.9%)
18(100.0%)
13.00(77.0%)
EARLIEST 1960 1970 1992 1879 1920 1992 1989 MOSTRECENT 2003 2001 2003 2002 2003 2002 2002 MEAN 1992 1985 1999 1991 1989 1998 1999
MEDIAN 1994 1984 1999 2000 1995 2000 2001

24 25
4. In what year did your organization begin operations?
NUMBER OF ORGANIZATIONS (RESPONSE RATE)
YEAR AAAUUUSSSTTTRRRAAALLLIIIAAA CCCAAANNNAAADDDAAACCCOOONNNTTT’’’LLLEEEUUURRROOOPPPEEE JJJAAAPPPAAANNN
NNNEEEWWWZZZEEEAAALLLAAANNNDDD
SSSOOOUUUTTTHHHAAAFFFRRRIIICCCAAA
UUUNNNIIITTTEEEDDDKKKIIINNNGGGDDDOOOMMM
1960s 2
(8.0%)0
(0.0%)0
(0.0%)6
(9.8%)2
(10.0%)0
(0.0%)0
(0.0%)
1970s 0
(0.0%)27
(30.3%)0
(0.0%)2
(3.3%)1
(5.0%)0
(0.0%)0
(0.0%)
1980s 5
(20.0%)36
(40.4%)1
(7.7%)0
(0.0%)0
(0.0%)0
(0.0%)1
(9.1%)
1990s 16
(64.0%)18
(20.2%)5
(38.5%)15
(24.6%)12
(60.0%)5
(27.8%)4
(36.4%)
2000s 2
(8.0%)8
(9.0%)7
(53.8%)38
(62.3%)5
(25.0%)13
(72.2%)6
(54.5%)
100.0% 100.0% 100.0% 100.0% 100.0% 100.0% 100.0%
RESPONSESTO THIS QUESTION 25 89 13 61 20 18 11
TOTAL SURVEYSRECEIVED
30(83.3%)
92(96.7%)
13(100.0%)
62(98.4%)
22(90.9%)
18(100.0%)
13(84.6%)
EARLIEST 1930 1970 1980 1879 1920 1991 1989 MOSTRECENT 2002 2001 2004 2003 2002 2002 2002
MEAN 1988 1985 1999 1992 1988 1999 1999
MEDIAN 1993 1984 2000 2000 1994 2000 2000

26 27
5. Which best describes the group(s) responsible for forming the organization?
0%
20%
40%
60%
80%
100%
CANADA 97% 45% 28% 12% 2% 1% 0% 8%
NEW ZEALAND 65% 100% 18% 6% 29% 0% 0% 0%
SOUTH AFRICA 65% 100% 18% 6% 29% 0% 0% 0%
BusinessOwners
PropertyOwners
ElectedOfficials
GovernmentAgencies
ResidentsMedical
InstitutionsEducationalInstitutions
Other
*Other responses include economic development agency (NZ), chamber of commerce and heritage group (CA)**New Zealand and South Africa statistics include only operational BIDs
0%
20%
40%
60%
80%
100%
AUSTRALIA 87% 27% 7% 20% 0% 3% 0%
CONTINENTAL EUROPE 64% 29% 50% 43% 0% 0% 0%
JAPAN 82% 2% 13% 53% 8% 0% 0%
UNITED KINGDOM 77% 62% 38% 54% 8% 0% 23%
BusinessOwners
PropertyOwners
ElectedOfficials
GovernmentAgencies
ResidentsMedical
InstitutionsEducationalInstitutions
*Other responses include chamber of commerce (UK & Japan), media (UK), tourist board (Cont. Europe), retailers (Cont.Europe)
BID Organizations
BID-Like Organizations

26 27
6. Did you experience opposition?
7. From which groups?
0%
20%
40%
60%
80%
100%
CANADA 30% 20% 7% 2% 0% 2% 0% 2%
NEW ZEALAND 18% 18% 5% 9% 9% 0% 0% 0%
SOUTH AFRICA 17% 67% 0% 0% 11% 0% 0% 0%
BusinessOwners
PropertyOwners
ElectedOfficials
GovernmentAgencies
ResidentsMedical
InstitutionsEducationalInstitutions
Other
BID Organizations
0%
20%
40%
60%
80%
YES 40% 36% 14% 11% 38% 59% 31%
AUSTRALIA CANADACONTINENTAL
EUROPEJAPAN
NEW ZEALAND
SOUTH AFRICA
UNITED KINGDOM

28 29
0%
20%
40%
60%
80%
100%
AUSTRALIA 33% 7% 7% 7% 3% 0% 0%
CONTINENTAL EUROPE 14% 0% 7% 0% 0% 0% 0%
JAPAN 11% 0% 5% 2% 0% 0% 0%
UNITED KINGDOM 0% 0% 23% 8% 8% 0% 0%
BusinessOwners
PropertyOwners
ElectedOfficials
GovernmentAgencies
ResidentsMedical
InstitutionsEducationalInstitutions
BID-Like Organizations

28 29
SECTION II
1. Which of the following best describes your organization?
ORGANIZATION DESCRIPTION
AUSTRALIA CANADA CONTINENTAL EUROPE JAPAN NEW
ZEALAND SOUTHAFRICA
UNITEDKINGDOM
GOVERNMENTORGANIZATION 0% 3% 25% 2% 0% 0% 8%
NONPROFITORGANIZATION 83% 59% 33% 17% 100% 72% 33%
COMBINATION OFGOVERNMENTAND NONPROFIT
3% 27% 8% 12% 0% 6% 0%
PRIVATE AGENCY 10% 3% 17% 29% 0% 0% 8%
PUBLIC AND PRIVATE AGENCY
3% 8% 17% 41% 0% 22% 50%
OTHER 0% 0% 0% 0% 0% 0% 0%
2. Currently, your organization has how many full-time employees?
FULL TIME EMPLOYEES AUSTRALIA CANADA CONTINENTAL
EUROPE JAPAN NEWZEALAND
SOUTHAFRICA
UNITEDKINGDOM
0 86% 43% 8% 19% 68% 6% 8%1 14% 27% 50% 15% 26% 24% 8%
2-3 0% 21% 8% 26% 5% 24% 38%4-5 0% 7% 8% 6% 0% 29% 31%
6-10 0% 1% 8% 15% 0% 6% 8%11-20 0% 1% 8% 6% 0% 6% 8%21-30 0% 0% 0% 6% 0% 0% 0%31-40 0% 0% 8% 5% 0% 0% 0%41+ 0% 0% 0% 0% 0% 6% 0%
3. Currently, your organization has how many part-time employees?
PART TIME EMPLOYEES AUSTRALIA CANADA CONTINENTAL
EUROPE JAPAN NEWZEALAND
SOUTHAFRICA
UNITEDKINGDOM
0 45% 39% 50% 61% 62% 56% 27%1 34% 44% 20% 10% 24% 25% 18%
2-3 17% 11% 10% 10% 5% 13% 36%4-5 0% 2% 10% 5% 5% 6% 18%
6-10 3% 1% 10% 8% 5% 0% 0%11-20 0% 2% 0% 2% 0% 0% 0%21-30 0% 0% 0% 2% 0% 0% 0%31-40 0% 0% 0% 0% 0% 0% 0%41+ 0% 0% 0% 2% 0% 0% 0%

30 31
4. How many members are in the governing board?
NUMBER OF MEMBERS ON GOVERNING
BOARD
AUSTRALIA CANADA CONTINENTAL EUROPE JAPAN NEW
ZEALAND SOUTHAFRICA
UNITEDKINGDOM
0 10% 0% 0% 29% 0% 0% 8%1 0% 0% 0% 7% 0% 0% 0%
2-3 10% 3% 17% 16% 14% 0% 0%4-5 45% 4% 25% 10% 19% 20% 0%
6-10 14% 51% 17% 17% 48% 73% 15%11-20 21% 42% 17% 16% 19% 7% 62%21-30 0% 0% 17% 3% 0% 0% 15%31-40 0% 0% 8% 0% 0% 0% 0%41+ 0% 0% 0% 2% 0% 0% 0%
5. How many properties are located in the BID?
AUSTRALIA CANADA CONTINENTAL EUROPE JAPAN NEW
ZEALAND SOUTHAFRICA
UNITEDKINGDOM
Lowest - 8 60 - 20 6 9RANGE Highest 1400 7,300 1,000 - 5,000 1,200 1,750
MEAN 210 357 506 - 506 215 820MEDIAN 210 158 415 - 109 108 700

30 31
6. Describe the composition of land use and buildings in your BID with respect to their size and type of use.
7. How many city blocks does your organization cover?
8. Current annual budget in US dollars7
7Responses to this question were received in each country’s native currency. For the purpose of this analysis, the values have been converted to United States Dollars based on average exchange rates from 2003 and according to the St. Louis Federal Reserve Bank.
LAND USE CATEGORY AUSTRALIA CANADA CONTINENTAL
EUROPE JAPAN NEWZEALAND
SOUTHAFRICA
UNITEDKINGDOM
RETAIL 49% 48% 45% 23% 52% 43% 46% OFFICE 12% 20% 12% 12% 8% 27% 25% HOTEL/LODGING 2% 2% 1% 2% 2% 7% 4% EDUCATIONAL 2% 1% 3% 2% 3% 1% 3% TRANSIT/PARKING 8% 5% 4% 8% 6% 1% 5% MEDICAL 2% 5% 2% 2% 2% 1% 0% RECREATIONAL/ OPEN SPACE 4% 2% 11% 4% 4% 1% 4%
RESIDENTIAL 7% 6% 12% 28% 15% 13% 4% CULTURAL 0% 2% 5% 2% 1% 1% 2% GOVERNMENT 1% 3% 3% 4% 2% 2% 2% RELIGIOUS 1% 2% 2% 3% 1% 1% 1% OTHER 1% 3% 0% 9% 4% 7% 9%
*Other includes farming (NZ), services (NZ) and industrial (SA) ** Land uses reflect the average of the actual responses and may not equal 100%.
SIZE OF DISTRICT IN
CITY BLOCKS AUSTRALIA CANADA CONTINENTAL
EUROPEJAPAN (in m2)
NEWZEALAND
SOUTHAFRICA
UNITEDKINGDOM
LOWESTRESPONSE 0 2 0 10,000 1 4 3 HIGHESTRESPONSE 20 125 40 328,700,000 11 80 40
MEAN 4 19 10 49,744,973 4 22 12 MEDIAN 3 12 8 2,700,000 3 16 6
*Japanese responses are in square meters
AUSTRALIA CANADA CONTINENTAL EUROPE JAPAN NEW
ZEALAND SOUTHAFRICA
UNITEDKINGDOM
LOWESTRESPONSE $1,585 $3,340 $46,440 $2,517 $910 $17,618 $191,454 HIGHESTRESPONSE $7,551,286 $1,736,865 $1,393,210 $7,551,286 $454,763 $1,835,160 $2,393,175
MEAN $583,316 $192,534 $548,925 $783,759 $97,319 $310,118 $840,802 MEDIAN $65,495 $83,503 $552,640 $83,903 $27,266 $167,367 $670,089

32 33
9. Which of the following are sources of funding for your organization?
SOURCES OF FUNDING AUSTRALIA CANADA CONTINENTAL
EUROPE JAPAN NEWZEALAND
SOUTHAFRICA
UNITEDKINGDOM
SPECIAL TAX ASSESSMENT 37% 93% 21% 8% 29% 78% 0%
VOLUNTARY DONATIONS OR IN-KINDCONTRIBUTIONS
47% 21% 21% 3% 52% 0% 85%
SUBSIDIES OR GRANTS (GOVERNMENT)
30% 40% 71% 77% 48% 0% 77%
SUBSIDIES OR GRANTS FROM FOUNDATIONS
3% 1% 0% 16% 29% 0% 15%
BONDS (PUBLIC OR PRIVATE) 0% 0% 14% 0% 0% 0% 0%
CITY GENERAL TAX REVENUES 0% 4% 29% 0% 5% 6% 8%
SALES OF GOODS AND/OR SERVICES
7% 13% 7% 40% 14% 0% 15%
USER FEES 20% 10% 0% 16% 19% 0% 8%
*Other responses include membership fees (NZ), foundations (Cont. Europe), management fees (UK), festivals (CA)

32 33
SECTION III
2. To what extent is your organization involved in providing each of the following services?
Percentage of Organizations "Very Involved" in Specific Services
0%
20%
40%
60%
80%
100%
CANADA 66% 83% 34% 27%
NEW ZEALAND 20% 63% 7% 7%
SOUTH AFRICA 18% 12% 100% 100%
CapitalImprovement
ConsumerMarketing
Maintenance Security
Percentage of Organizations "Very Involved" in Specific Services
0%
20%
40%
60%
80%
100%
AUSTRALIA 30% 50% 14% 3%
CONTINENTAL EUROPE 50% 67% 50% 17%
JAPAN 15% 51% 8% 3%
UNITED KINGDOM 62% 46% 54% 69%
CapitalImprovement
ConsumerMarketing
Maintenance Security

34 35
Economic Development
0%10%
20%
30%
40%50%
60%
70%
80%90%
100%
Very Involved 3% 4% 27% 15% 0% 6% 18%
Somewhat 7% 22% 27% 26% 5% 22% 45%
Not at All 90% 73% 45% 59% 95% 72% 36%
Australia CanadaContinental
EuropeJapan New Zealand South Africa
UnitedKingdom
Maintenance
0%10%
20%30%
40%50%
60%70%
80%90%
100%
Very Involved 14% 34% 50% 8% 1% 100% 54%
Somewhat 31% 41% 33% 33% 7% 0% 31%
Not at All 55% 24% 17% 59% 14% 0% 15%
Australia CanadaContinental
EuropeJapan New Zealand South Africa
UnitedKingdom

34 35
Parking and Transportation
0%10%
20%30%
40%50%60%
70%80%
90%100%
Very Involved 3% 6% 67% 8% 0% 11% 8%
Somewhat 31% 39% 33% 26% 15% 33% 38%
Not at All 66% 55% 0% 66% 85% 56% 54%
Australia CanadaContinental
EuropeJapan New Zealand South Africa
UnitedKingdom
Policy Advocacy
0%10%
20%30%
40%50%60%
70%80%
90%100%
Very Involved 37% 53% 50% 33% 43% 39% 38%
Somewhat 37% 38% 42% 34% 57% 61% 62%
Not at All 27% 9% 8% 33% 0% 0% 0%
Australia CanadaContinental
EuropeJapan New Zealand South Africa
UnitedKingdom

36 37
Public Space Regulation
0%10%
20%30%
40%50%60%
70%80%
90%100%
Very Involved 7% 26% 33% 3% 0% 50% 15%
Somewhat 40% 49% 50% 16% 30% 44% 62%
Not at All 53% 25% 17% 80% 70% 6% 23%
Australia CanadaContinental
EuropeJapan New Zealand South Africa
UnitedKingdom
Security
0%10%
20%30%
40%50%60%
70%80%
90%100%
Very Involved 3% 27% 17% 3% 5% 100% 69%
Somewhat 30% 42% 33% 28% 20% 0% 31%
Not at All 67% 31% 50% 69% 75% 0% 0%
Australia CanadaContinental
EuropeJapan New Zealand South Africa
UnitedKingdom

36 37
Social Services
0%10%
20%30%
40%50%60%
70%80%
90%100%
Very Involved 0% 7% 100% 5% 0% 33% 0%
Somewhat 17% 26% 0% 25% 7% 50% 23%
Not at All 83% 67% 0% 70% 93% 17% 77%
Australia CanadaContinental
EuropeJapan New Zealand South Africa
UnitedKingdom

38 39
0%
20%
40%
60%
80%
100%
CANADA 24% 22% 7% 18% 27% 23% 24% 12%
NEW ZEALAND 0% 22% 0% 11% 22% 11% 11% 11%
SOUTH AFRICA 100% 44% 56% 11% 72% 33% 67% 17%
CRIME RATES RETAIL SALESNUMBER OF
JOBS CREATED
PEDESTRIAN COUNTS
OCCUPANCYCUSTOMER
SURVEYSNUMBER OF BUSINESSES
OTHER
SECTION IV
1. Has your organization established standards of performance?
AUSTRALIA CANADA CONTINENTAL EUROPE JAPAN NEW
ZEALAND SOUTH AFRICA
UNITED KINGDOM
33% 38% 46% 11% 22% 89% 77%
2. Is an agency or organization other than your own responsible for performance evaluation?
AUSTRALIA CANADA CONTINENTAL EUROPE JAPAN NEW
ZEALAND SOUTH AFRICA
UNITED KINGDOM
33% 15% 31% 13% 33% 61% 54%
3. If yes to 1 or 2, which of the following has been used as measure of organizational performance during the past year?
BID Organizations
*Other responses include new investment (NZ), ATM crime (NZ), number of events (CA), façade improvements (CA)

38 39
0%
20%
40%
60%
80%
100%
AUSTRALIA 0% 23% 3% 20% 20% 27% 10% 3%
CONTINENTAL EUROPE 31% 38% 23% 31% 15% 31% 23% 23%
JAPAN 0% 10% 2% 15% 8% 5% 10% 5%
UNITED KINGDOM 69% 46% 69% 46% 46% 46% 54% 15%
CRIMERATES
RETAILSALES
NUMBER OFJOBS
CREATED
PEDESTRIAN COUNTS
OCCUPANCYCUSTOMERSURVEYS
NUMBER OFBUSINESSES
OTHER
BID-Like Organizations
3.1. Which type of crime has been a problem during the past year?
TYPE OF CRIME AUSTRALIA CANADA CONTINENTAL EUROPE JAPAN NEW
ZEALAND SOUTHAFRICA
UNITEDKINGDOM
HOMICIDE 0% 1% 0% 0% 0% 6% 0%
RAPE 0% 1% 0% 0% 0% 0% 0%
ROBBERY 7% 8% 0% 0% 0% 89% 46%
ASSAULT 0% 9% 0% 0% 0% 56% 46%
THEFT 20% 13% 23% 0% 6% 94% 38% VANDALISM/
GRAFFITI 27% 33% 23% 0% 0% 78% 62%
PROSTITUTION 0% 11% 0% 0% 0% 28% 8% PANHANDLING/
LOITERING 13% 21% 8% 0% 0% 83% 38%
OTHER 7% 5% 8% 0% 0% 28% 8%

40 41
3.2 Which of the following has been used as a method to deter or decrease criminal activity?
3.3. How would you describe your organization’s involvement in expanding retail activities?
0%
20%
40%
60%
80%
100%
Very Involved 60% 50% 50% 60% 67% 25% 22%
Somewhat 40% 47% 50% 40% 33% 75% 56%
Not at All 0% 3% 0% 0% 0% 0% 22%
Australia CanadaContinental
EuropeJapan
NewZealand
SouthAfrica
UnitedKingdom
METHOD TO DETERCRIME
AUSTRALIA CANADA CONTINENTAL EUROPE JAPAN NEW
ZEALAND SOUTHAFRICA
UNITEDKINGDOM
PAID SECURITY PATROLS 3% 7% 23% 0% 0% 94% 54%
VOLUNTEERSECURITYPATROLS
0% 5% 0% 0% 6% 6% 8%
POLICE PATROLS 23% 26% 38% 0% 0% 89% 62% CLOSED CIRCUIT TELEVISION/SURVEILLANCE CAMERAS
0% 2% 15% 0% 0% 61% 62%
COMPUTERIZEDCRIME MAPPING 0% 5% 15% 0% 0% 44% 23%
NOTIFICATION OF PROPERTY/BUSINESSOWNERS
17% 19% 8% 0% 11% 72% 54%
INCREASE NUMBER OF VISITORS/OUTDOOREVENTS
3% 13% 8% 0% 6% 11% 31%
SEALING VACANT BUILDINGS,GRAFFITI REMOVAL, ETC.
17% 19% 31% 0% 6% 28% 46%

40 41
3.4. Which of the following actions does your organization take to support retail?
3.5. Which retail markets does your organization actively target?
ACTIONS AUSTRALIA CANADA CONTINENTAL EUROPE JAPAN NEW
ZEALAND SOUTHAFRICA
UNITEDKINGDOM
ADVERTISEMENTS 33% 36% 38% 5% 33% 39% 33% LOBBYINGGOVERNMENT 40% 22% 23% 5% 22% 28% 22%
BUSINESSINCENTIVES 3% 10% 15% 6% 6% 0% 6%
SALES AND PROMOTIONS 27% 29% 38% 6% 28% 6% 28%
SPECIAL EVENTS 30% 35% 46% 10% 39% 17% 39%
*Other responses include websites (CA, UK, SA), festivals (SA), maintaining the environment (SA)
TARGET MARKET AUSTRALIA CANADA CONTINENTAL
EUROPE JAPAN NEWZEALAND
SOUTHAFRICA
UNITEDKINGDOM
TOURISTSAND VISITORS 17% 38% 46% 5% 33% 44% 54%
DOWNTOWNRESIDENTS 7% 29% 23% 10% 11% 44% 31%
SUBURBAN RESIDENTS 30% 31% 38% 8% 22% 28% 46%
DOWNTOWNOFFICEWORKERS
3% 25% 23% 6% 17% 50% 38%
STUDENTS 0% 15% 23% 3% 11% 33% 31%

42 43
SECTION V
1. Which of the following describe how your organization has changed its physical jurisdictional (boundaries) since implementation?
Australia 13%
7%
67%
10%3%
Increased DramaticallyIncreased SlightlyNo ChangeDecreased SlightlyDecreased Drastically
Canada 9%
26%
60%
3% Continental Europe
20%
30%
40%
10%
Japan13%
75%
5%5% New Zealand14%
72%
7% 7%
South Africa24%
18%59%
United Kingdom 10%
10%
80%

42 43
2. Which of the following describe how the number of full-time employees has changed since implementation?
Australia16%
8%
72%
4%
Increased DramaticallyIncreased SlightlyNo ChangeDecreased SlightlyDecreased Drastically
Canada11%
21%
51%
8%7%
Continental Europe 10%
30%
60%
Japan 7%
22%
66%
5%
New Zealand 8%8%
67%
17%
South Africa 6%
41%53%
United Kingdom 17%17%
67%

44 45
3. What was your organization’s first annual budget (in US Dollars)? 8
AUSTRALIA CANADA CONTINENTAL EUROPE JAPAN NEW
ZEALAND SOUTHAFRICA
UNITEDKINGDOM
MEAN RATE OF CHANGE -80% 14% 30% 556% 10% -2% 61%
MEDIAN RATE OF CHANGE
26% 13% 7% 35% -34% 26% 36%
8Responses to this question were received in each country’s native currency. Budgets were converted to United States Dollars based on historical conversion rates (St. Louis Federal Reserve Bank) and adjusted the values according to the CPI index.9The budget change rate (increase/decrease) was calculated by using the following formula: (BudgetY1-BudgetY0)/BudgetY0*100; Where BudgetY1 = present budget and BudgetY0 = initial budget.
3.1 Rate of increase/decrease in the BID budget (in US dollars) from start of operations to present.9
BUDGET AUSTRALIA CANADA CONTINENTAL EUROPE JAPAN NEW
ZEALAND SOUTHAFRICA
UNITEDKINGDOM
LOWESTRESPONSE $1,120 $1,500 $50,000 $300,000 $500 $144,000 $25,000
HIGHESTRESPONSE $233,486 $2,000,000 $800,000 $100,000,000 $250,000 $13,000,000 $700,000
MEAN $60,003 $152,865 $448,875 $12,411,306 $34,538 $2,297,709 $280,000
MEDIAN $30,891 $49,000 $500,000 $7,000,000 $15,000 $1,100,000 $225,000

44 45
Qualitative Survey ResultsABOUT THE ANALYSIS
• To report qualitative survey results, the author presents a variety of responses from each country.
• Results are presented in groups. Part one provides a list of responses to the rst survey question (section one, question one), which reads, “In your own words, briey describe the impetus or need for planning the organization.”
• Part two combines responses from two survey questions (question one, from section three, and question four from section ve). Respectively, those questions were, “Briey describe the organization’s central mission” and “In your own words, briey describe how the organization’s central mission has changed since implementation.”
• Responses from organizations located in Continental Europe are not included in this analysis.

46 47
PART I
“In your own words, briefly describe the impetus or need for planning the organization.”
Australia
• “Forming the organization was imperative – without proper planning not much can be achieved. It was the first thing organization did.”
• “Closely located similar shopping strips are actively targeting our regular customers. We need to improve awareness of services available in our strip, or we will lose our clientele to other areas who plan and promote better than we do.”
• “The organization arose out of a need for a coordinated approach to marketing and dealing with local government.”
• “Attempt to coordinate marketing for the shopping strip. A realization that ‘pulling’ the traders resources together through the financial contributions would provide a large fund for common marketing.”
• “A united voice to lobby council on issues such as parking, beautification. A desire to promote the CBD through retail promotions, etc.”
Canada
We were surprised to discover that how many BIDs were created in Canada in the 1970s. To better understand why these BIDs formed, we analyzed responses to the first question listed in the survey instrument, which reads, “In your own words, briefly describe the impetus or need for planning the organization.” The responses (of Canadian BID organizations that began operations by 1980) included:
• “[The BID] provides a tool to work effectively with municipalities in dealing with issues and eliminates the duplication of tasks.”
• “In the mid 1970’s there was a proliferation of strip malls and enclosed malls in the area and once solid retailers were failing. A couple of anchor tenants in our area moved or closed and the remaining business owners organized to promote and beautify our business district.”
• “To maintain a strong downtown business core relative to shopping malls outside the business area.”
• “[The BID’s] purpose was to compete against regional malls.”

46 47
• “Prior to 1980 a small group of merchants met on a regular basis to discuss ways to promote the retail sector. They planned events such as sidewalk sales. Funding to advertise was on a volunteer basis. Some would participate then not support their involvement financially. Also, no funds were available to ‘beautify’ —such as flowers, trees, Christmas decorations.”
Responses from Canadian BIDs that formed during the 1990s contained similar themes. They reported:
• “The need [to form a BID] stems from the belief of collective marketing of an area will help achieve economic vitality and stability in the area. Independent marketing can be fragmented and doesn’t help to create synergy in the marketplace.”
• “The area was busy, but run down. Several people felt more pressure could be brought to bear on city council if [businesses] were united.”
• “[Businesses identified] the need to improve the area’s safety and cleanliness. The previous association had limited success in its ability to raise funds and replace projects. The community agreed that the [BID] would be a good tool to allow the area to realize its aspirations.”
Japan
• “To cope with the problem of deterioration in the DID, the city formed the Basic Plan. The chamber of commerce was chosen to serve as a TMO, and implements the projects specified in the Basic Plan.”
• “The TMO involves residents, retail store owners, the public sector, and others. The goal is to encourage revitalization activities within the DID.”
• "This organization was established as TMO. The local government takes the initiative in terms of the hard projects, and the local retail storekeepers are in charge of the soft projects. The TMO was designed to plan and to coordinate these activities to ensure the urban redevelopment project runs smoothly."
• “Our organization was established as a bridging organization among all the members and the public sector to create and maintain the desirable urban environment through a local initiative.”
• “With the opening of [several] construction projects, we realized that we needed to promote the town as a tourist destination.”

48 49
• “The TMO formed in response to increasing suburban shopping centers, and deterioration of the DID. For example, vacancy rates had risen over 8%.”
• “We needed a TMO; the DID had become less attractive because of the big, suburban retail stores.”
• “To revitalize the DID, which deteriorated as a result of the large retail stores in the suburban areas.”
• “Many retail stores in the DID went out of business when the larger stores were built along the new bypass.”
New Zealand
• “The development of a large indoor retail complex on southern edge of the original city centre and bulk retail Mega Centre at northern end resulted in decreased city centre occupancy rates.”
• “The threat of malls was also increasing. A fairly large mall within a reasonable driving distance was planning to upgrade and began to target [this area] with their marketing campaigns.”
• “The CBD, in the center, is failing. It is characterized by empty shops, high retail shop turnover. On both sides of the CBD there are three new retail areas. Shoppers perceive that the areas outside the CBD are safer.”
• “To organize the timing of events and promotions.”
South Africa
• “To combat crime and grime.”
• “To coordinated revitalization efforts.”
• “The rapid decline of services to the area required the private sector to partner with the public sector to provide security and cleansing services.”
• “[The BID formed in response to] increasing criminal activity, homelessness, problems with informal traders, and a dramatic decline in cleanliness in the area.”

48 49
United Kingdom
• “We have concerns about the sustainability of town centre management model.”
• “We have witnessed deterioration in the level of services provided by the City authorities – specifically cleaning and safety.”
• “The city center was poorly perceived by users and investors, and threatened by an out of town retail mall.”
• “There is a lack of coordination and leadership in encouraging investment and maintenance in the public realm.”
• “The response was to crime and concern over competition with rival cities.”

50 51
PART I I
“Briefly describe the organization’s central mission” and “In your own words, briefly describe how the organization’s central mission has changed since implementation.”
Australia
• “Though the initial mission was to ‘enhance the Collins Street image,’ now we are more a ‘traders’ organization concerned with promoting retail sales.”
• “To serve the community with their health and medical needs.”
• “We endeavor to bring together harmony to the community through a sustained program of involvement and commitment.”
• “To provide the best and most harmonious friendly and vibrant village centre by providing the ‘best service’ and value in a friendly manner to our customers.”
• “To present to regulatory bodies the needs and processes to enable operating a business both profitable and rewarding from an achievement aspect.”
• “Success in achieving full tenancy and streetscape improvements has increased business property values. Developers have come into [the] precinct and wish to establish retail, office, and residential developments in our precinct. [The] Association now has [a] business plan, streetscape plan, parking and traffic strategy, urban design plan and awaiting structure plan – all with council support.”
• “It has changed little but we are constantly monitoring the retail area to see what needs to be done and what can be done. We work closely with police and local/state/federal governments regarding issues impacting on retailing.”
Canada
• “Initially, [the BID formed] to beautify promote and maintain the property and businesses that make up the downtown core.”
• “[The BID] is now involved more in producing events and bringing more people into downtown as opposed to beautification and street fixtures.”
• “Originally, we subscribed to a beautification (streetscaping) approach to revitalization. Now, and for the past 8 years, our primary thrust is pursuing main street revitalization through economic based incentives to developers in order to create high residential densities which in turn support the retail component of the street.”

50 51
• “Since 1980, the organization has been more involved in economic development initiatives and attracting tourism to the area. Though we are still active in operating key beautification projects.”
• “The first two years we provided more “marketing expertise” to businesses, impressing on business the fundamentals of collective marketing. The next several years, we concentrated on improving our infrastructure. We worked with property owners to improve their facades, physical space and helped them market their properties. We then ventured into street improvements and property development. We still do all of the above, but focus more on business recruitment and retention.”
• “The property owners felt they could organize and promote the downtown more effectively through a [BID].”
Japan
• "In 2002, we collected funds to establish the company, operated parking lots, planning events, and so on. In 2003, we will also supervise several urban redevelopment projects."
• “Renovation projects are decreasing, while event planning and coordination is gradually increasing.”
• “We are trying to shift from being engaged in publicity activity, the promotion of events, and issuing newsletters to the development of young human resources and organizing young people.”
• “We focused on promoting the hard projects specified in the Basic Plan and the TMO plan. After that, we undertook a variety of activities which were subsidized both by the national government and the prefecture government, which involved the filling vacant retail spaces.”
New Zealand
• “Initially, the organization’s sole aim was to create retail based promotions and/or events. With time, this role has broadened to include advocacy for the retail/business sector; partnerships with educational institutions; initiation of beautification projects; petty crime control; education of the retail sector, etc.”
• “The current executive realizes that our role is a social one - people go where life is good, not nasty places. By supporting the local community the retail sector will naturally prosper.”
• “[We] are currently seeking a separate rate to provide additional funding. This is the only fair and equitable way to fund the group. Everyone within the area of direct benefit will contribute to the organization if we are successful in our bid to have the separate rate put in place.”

52 53
South Africa• “Initially, our focus was crime and grime. Now, we are refocusing on business retention and attraction.”
• “The first two years were mainly concerned with tackling the issues of crime and grime as well as reducing the number of homeless people in the area. The focus is now shifting towards increasing retail activities and more aggressive marketing of the area.”
• “Crime and grime, then beautification.”
• “From crime and grime to green and development.”
• “Operational services such as security and cleaning are in full force. The focus now is to implement the other services such as landscaping and informal trade management.”
United Kingdom
• “To make the BID area a clean safe and pleasant place to live, work, visit and carry out business.”
• “[We] aim to improve the quality of the environment, further develop the potential draw of the area, increase the sense of security, and ensure that better and sustainable maintenance and management arrangements are put in place.”
• “We aim to attract increased footfall and improve customer satisfaction.”

52 53
APPENDIX: Survey Instrument
International Business Improvement District Survey
Department of Urban Studies & Planning Massachusetts Institute of Technology
2003

54 55
International BID Survey
We thank you in advance for taking choosing to participate. There are 5 sections to this survey. For your convenience, most of the questions are presented in a multiple choice format. Please read each question carefully, answer it to the best of your ability, and return the completed survey to us within ten (10) days. Individual survey responses will remain confidential. We look forward to sharing the final report to with you.
I. FORMATION
For the sake of this survey, the BID formation process has three phases. They are the planning phase, legislative phase, and implementation phase. The planning phase typically begins with informal discussions focused on the advantages and disadvantages of BID formation and ends with a feasibility study or report that summarizes how such an organization will function. The legislative process includes obtaining and filing the documents necessary to formalize the organization’s existence and approve its plans. While the provision of services to a distinct geographical area marks the start of the implementation phase, it may also include such tasks as hiring staff and securing office space. Your responses will provide valuable insights to these three phases of the bid formation process.
1. In your own words, briefly describe the impetus or need for planning the organization. ___________________________________________________________________________________________________________________________________________________________________________________________________________________________________________________________________________________________________________________________________________________________________________________________________________________________________________________________________________________________________________________________________________________________________________________________________________________
2. In what year did the planning phase begin? ____________
3. In what year was your organization legally established? ____________
4. In what year did your organization begin operations? _____________
5. Which best describes the group(s) responsible for forming the organization? (Circle all that apply) (a) Business owners (c) Elected officials (e) Residents (g) Educational institutions (b) Property owners (d) Government (f) Medical institutions (h) Other__________
6. Did they experience opposition? (Circle one) (a) Yes (b) No (c) Not sure
7. If so, from which group? (Circle all that apply) (a) Business owners (c) Elected officials (e) Residents (g) Educational institutions (b) Property owners (d) Government (f) Medical institutions (h) Other__________

54 55
II. STRUCTURE & SCOPE
Every BID organization is unique. To better understand how they vary within and between continents, we ask that you respond to these questions regarding the structure and scope of your organization.
1. Which of the following best characterizes your organization? (Circle one) (a) Government agency (b) Nonprofit organization (c) Combination of government and nonprofit (d) Private agency (e) Public and private agency
2. Currently, your organization has how many full-time employees? (Circle one) (a) 0 (c) 2-3 (e) 6-10 (g) 21-30 (i) 41+ (b) 1 (d) 4-5 (f) 11-20 (h) 31-40
3. Currently, your organization has how many part-time employees? (Circle one) (a) 0 (c) 2-3 (e) 6-10 (g) 21-30 (i) 41+ (b) 1 (d) 4-5 (f) 11-20 (h) 31-40
4. How many members are on your governing board? (Circle one) (a) 0 (c) 2-3 (e) 6-10 (g) 21-30 (i) 41+ (b) 1 (d) 4-5 (f) 11-20 (h) 31-40
5. How many properties are located in the BID? _____
6. Describe the composition of land use and buildings in your BID with respect to their size and type of use. (Assign a numeric value to each category such that they total 100)
_____% Retail _____% Transit/Parking _____% Cultural _____% Office _____% Medical _____% Government _____% Hotel/Lodging _____% Recreational/Open Space _____% Religious _____% Educational _____% Residential _____% Other __________ 7. Approximately, how many city blocks does your organization cover? _____
8. Approximately, what is the current annual budget (in Canadian dollars10)? _____
9. Which of the following are sources of funding for your organization? (Circle all that apply) (a) Special tax assessment on property and/or business (b) Voluntary donations or in-kind contributions (c) Subsidies or grants from federal/state/central/local government (d) Subsides or grants from foundations (e) Bonds (public or private) (f) City general tax revenues (g) Sale of goods and/or services (h) User fees (i) Other (please specify) _________________________________________________
10This question varied by national context.

56 57
III. PURPOSE
BID organizations are formed for a variety of purposes. To better understand why BIDs are formed, we ask that you respond to these questions regarding your mission and service delivery.
1. Briefly describe the organization’s central mission. ______________________________________________________________________________________________________________________________________________________________________________________________________________________________________________________________________________________________________________________________________________________________________________________________________________________________________________________________________________________________________________________________
2. To what extent is your organization involved in providing each of the following services? (Circle a number)
Very Somewhat Not at all involved involved involved
(a) Capital Improvements (i.e. installing pedestrian-scale lighting and street furniture; planting trees and shrubbery) 1 2 3
(b) Consumer Marketing (i.e. producing festivals and events; coordinating sales promotions; producing 1 2 3 maps and newsletters)
(c) Economic Development (i.e. offering incentives such as tax abatements or loans to new and expanding businesses) 1 2 3
(d) Maintenance (i.e. collecting rubbish; removing litter and graffiti; washing sidewalks; shoveling snow; trimming trees) 1 2 3
(e) Parking and Transportation (i.e. managing a public parking system; maintaining transit shelters) 1 2 3
(f) Policy Advocacy (i.e. promoting public policies to the community; lobbying government on behalf of business 1 2 3 interests)
(g) Public Space Regulation (i.e. managing sidewalk vending; discouraging panhandling; controlling 1 2 3 vehicle loading)
(h) Security (i.e. providing supplementary security guards; buying and installing electronic security systems; working 1 2 3 with city police force)
(i) Social Services (i.e. aiding the homeless; providing job training; supplying youth services) 1 2 3
(j) Others (please specify)___________________ 1 2 3

56 57
IV. PERFORMANCE EVALUATION
To learn more about the types of goals that BIDs seek to achieve, we ask that you respond to these questions regarding performance standards and monitoring.
1. Has your organization established standards of performance (“benchmarks”) from which to evaluate its outcomes? (Circle one) (a) Yes (b) No (c) Not sure
2. Is an agency or organization other than your own responsible for performance evaluation? (Circle one) (a) Yes (b) No (c) Not sure
3. If you answered “yes” (to question IV.1 or IV.2), which of the following has been used as a measure of organizational performance during the past year? (Circle all that apply) (a) Crime rates (c) Number of jobs created (e) Occupancy rates (g) Number of businesses (b) Retail sales (d) Pedestrian counts (f) Customer surveys (h) Other____________
If you circled (a) “Crime rates,” (3.1). Which type of crime has been a problem during the past year? (Circle all that apply)
(a) Homicide (d) Assault (g) Prostitution (b) Rape (e) Theft (h) Panhandling/loitering (c) Robbery (f) Vandalism/graffiti (i) Other____________
(3.2). Which of the following has been used as a method to deter or decrease criminal activity? (Circle all that apply)
(a) Paid security patrols (b) Volunteer security patrols (c) Police patrols (d) Closed circuit television/surveillance cameras (e) Computerized crime mapping (f) Notification of property/business owners (g) Increase number of visitors/outdoor events (h) Sealing vacant buildings, rapid graffiti removal, etc.
If you circled (b) “Retail sales,” (3.3). How would you describe your organization’s involvement in expanding retail activities?
(Circle one) (a) Very involved (b) Somewhat involved (c) Not at all involved
(3.4). Which of the following actions does your organization take to support retail activity? (Circle all that apply)
(a) Advertisements (d) Sales and promotions (b) Lobbying government on behalf of retail interests (e) Special events (c) Business incentives (f) Other____________
(3.5). Which retail markets does your organization actively target? (Circle all that apply) (a) Tourists and visitors (c) Suburban residents (e) Students (b) Downtown residents (d) Downtown office workers (f) Other____________

58 59
V. EVOLUTION
BID organizations change over time. To better understand how they evolve, we ask that you respond to these questions regarding some fundamental aspects of your organization.
1. Which of the following describe how your organization has changed its physical jurisdiction (boundaries) since implementation? (Circle one) (a) Increased drastically (c) No change (e) Decreased drastically (b) Increased slightly (d) Decreased slightly (f) Other_______________
2. Which of the following describe how the number of full-time employees has changed since implementation? (Circle one) (a) Increased drastically (c) No change (e) Decreased drastically (b) Increased slightly (d) Decreased slightly (f) Other_______________
3. Approximately, what was your organization’s first annual budget (in Canadian dollars11)? _____
4. In your own words, briefly describe how the organization’s central mission has changed since implementation. ___________________________________________________________________________________________________________________________________________________________________________________________________________________________________________________________________________________________________________________________________________________________________________________________________________________________________________________________________________________________________________________________________________________________________________________________________________________
11This question varied by national context.

58 59
ACKNOWLEDGEMENTS I offer special thanks to the many BID managers, BID experts, public- and private- service providers, and government ofcials who participated in this study. Specically, I would like to acknowledge Jerry Mitchell, Professor of Public Administration at the City University of New York, for inspiring a broader study on BIDs by publishing Business Improvement Districts and Innovative Service Delivery (1999). Also, I am grateful for the support that I received from MIT’s Humanities, Arts, and Social Sciences Fund as well as the help of several talented research assistants.

60 61
REFERENCES
Alterman, R. 1995. A comparative view of neighborhood regeneration programs in nine countries: Are the lessons transferable? Urban Affairs Review, 30(5): 749-765.
Birch, E. L. 2002. Having a longer view on downtown living. Journal of the American Planning Association 68: 1-27.
Borzel, T. 1998. Organizing babylon: On the different conceptions of policy networks.Public Administration 76 (Summer): 253-73.
Boytchuk, W. 1971. Looking ahead. Bloor West Villager 5 (4): 1-2.
Bremner, L. 2000. Reinventing the Johannesburg inner city. Cities 17 (3): 187-302.
Briffault, Richard. 1999. A government for our time? Business improvement districts and urban governance. Columbia Law Review 99 (2): 365-477.
Dolowitz, D., and D. Marsh. 2000. Learning from abroad: The role of policy transfer in contemporary policy making. Governance 13 (1): 5-24.
Dolowitz, D. 1997. British employment policy in the 1980s: Learning from the American experience. Governance 10: 23-42.
_____. 1996. Who learns from whom: A review of the policy transfer literature. Political Studies 44 (2): 343-57.
Evans, M.G. and J.S. Davies. 1999. Understanding policy transfer: A multi-level, multi-disciplinary perspective. Public Administration 77 (2): 361-85.
Foster, K. 1997. The Political Economy of Special-Purpose Government. Washington, D.C.: Georgetown University Press.
Fraser, Neil. 2003. Executive director of the Central Johannesburg Partnership. Interview by author. Tape recording. City of Johannesburg, January.
Garodnick, D. 2000. What’s the BID deal? Can the Grand Central Business Improvement District serve a special limited purpose? University of Pennsylvania Law Review 148: 1767-1770.
Grys, B. 1972. Anniversary. Bloor West Villager 5 (4): 7.
Houstoun, L. O. 2000. BIDs’ growing. Urban Land (February): 64-70.
_____. 1997. Business Improvement Districts. Washington, D.C.: Urban Land Institute.

60 61
Hoyt, L. 2004. Collecting private funds for safer public spaces: an empirical examination of the business improvement district concept. Environment & Planning B 31 (3): 367-380.
_____. 2001. Business improvement districts: Untold stories and substantiated impacts. Ph.D. diss., University of Pennsylvania. Abstract in Dissertation Abstracts International 62 (11): 3961-4221.
Hughes, W. 2000. Community service representative supervisor. Interview by author. Notes. Center City District, Philadelphia, Pennsylvania. 15 May.
Ikenberry, G. J. 1990. The international spread of privatization policies: inducements, learning and policy band wagoning. In The Political Economy of Public Sector Reformand Privatization. Edited by E. Suleiman and J. Waterbury. Boulder: Westview Press.
James, O. and M. Lodge. 2003. The limitations of policy transfer and lesson drawing for public policy research. Political Studies Review 1: 179-193.
Levy, P. R. 2001. Paying for the Public Life. Economic Development Quarterly 15: 124-131.
_____. 2001. Making downtowns competitive. Journal of the American Planning Association 4: 16-19.
_____. 2000. Executive Director of the Center City District. Interview by author. Tape recording. Center City District, Philadelphia. 24 July.
Ling, A. 2002. West Bloor Village BIA manager. Interview by author. Toronto, Canada. 30 August.
Marsh, D. and R. Rhodes. 1992. Policy networks in British government. Oxford, UK: Oxford University Press.
Martin, I. 2001. Dawn of the living wage: The diffusion of a redistributive municipal policy. Urban Affairs Review 36 (4): 470-496.
Mintrom, M. and S. Vergari. 1998. Policy networks and innovative diffusion: The case of state education reforms. The Journal of Politics 60 (1): 26-48.
Mintrom, M. 1997. Policy entrepreneurs and the diffusion of innovation. American Journal of Political Science 41: 738-770.
Mitchell, J. 2001. Business improvement districts and the ‘new’ revitalization of downtown. Economic Development Quarterly 15: 115-123.

62 63
_____. 1999. Business Improvement Districts and Innovative Service Delivery. New York: The PricewaterhouseCoopers Endowment for the Business of Government.
Mossberger, K. and H. Wolman. 2003. Policy transfer as a form of prospective policy evaluation: Challenges and recommendations. Public Administration Review 63 (4): 428-440.
Nasr, J. and M. Volait. 2003. Urbanism - Imported or Exported? Native Aspirations and Foreign Plans. Hoboken: Wiley Academy Press.
Oc, T. and S. Tiesdell. 1998. City centre management and safer city centres: Approaches in Coventry and Nottingham. Cities 15: 85-103. Philadelphia, Pennsylvania. 1990. Public transcripts of the Special Services District. Vol.1, Privy Center City District (CCD) records. 1 August: 5.
Rogowsky, E. and J. S. Gross. 1999. Managing development in New York City: The case of business improvement districts. In Managing Capital Resources for Central City Revitalization. Edited by F.W. Wagner, T.E. Joder and A.J. Mumphrey, Jr. New York: Garland Publishing.
Rose, R. 1993. Lesson drawing in public policy: A guide to learning across time and Space. Chatham. NJ: Chatham House.
Tomlinson, R. 1999. From exclusion to inclusion: rethinking Johannesburg’s central city. Environment and Planning A 31: 1665-1678.
Veley, T. 2003. Advocacy and Marketing consultant to the Cape Town Partnership. Interview by author. Notes. City of Cape Town. January.
Wolman, H. and E. Page. 2002. Policy Transfer Among Local Governments an Information Theory Approach. Governance 15 (4): 477-501.
Wolman, H. 1992. Understanding cross-national policy transfers: The case of Britain and the US. Governance 5: 27-45.