the calcium-independent transient outward potassium
TRANSCRIPT
The Calcium-independent Transient Outward Potassium Current in Isolated
Ferret Right Ventricular Myocytes
I. Basic Characterization and Kinetic Analysis
DONALD L. CAMPBELL, RANDALL L. RASMUSSON, YUSHENG Qu, and HAROLD C. STRAUSS
From the Departments of Pharmacology, Biomedical Engineering, and Medicine, Duke University Medical Center, Durham, North Carolina 27710
ABSTRACT Enzymatically isolated myocytes from ferret right ventricles (12-16 wk, male) were studied using the whole cell patch clamp technique. The macro- scopic propert ies of a transient outward K + current /to were quantified. /to is selective for K +, with a PNa/P~ of 0.082. Activation of / to is a vol tage-dependent process, with both activation and inactivation being independent of Na + or Ca ~+ influx. Steady-state inactivation is well described by a single Boltzmann relationship (V1/z = - 1 3 . 5 mV; k = 5.6 mV). Substantial inactivation can occur during a sub- threshold depolarization without any measurable macroscopic current. Both devel- opment of and recovery from inactivation are well described by single exponential processes. Ensemble averages of single /to channel currents recorded in cell- at tached patches reproduce macroscopic/ to and indicate that inactivation is com- plete at depolarized potentials. The overall inactivation/recovery time constant curve has a bell-shaped potential dependence that peaks between - 1 0 and - 2 0 mV, with time constants (22°C) ranging from 23 ms ( - 9 0 mV) to 304 ms ( -1O mV). Steady-state activation displays a sigmoidal dependence on membrane potential, with a net aggregate half-activation potential of +22.5 mV. Activation kinetics (0 to +70 mV, 22°C) are rapid, with Ito peaking in ~ 5 - 1 5 ms at +50 inV. Experiments conducted at reduced temperatures (12°C) demonstrate that activation occurs with a time delay. A nonlinear least-squares analysis indicates that three closed kinetic states are necessary and sufficient to model activation. Derived time constants of activation (22°C) ranged from 10 ms (+10 mV) to 2 ms (+70 mV). Within the framework of Hodgkin-Huxley formalism,/to gating can be described using an a 3i formulation.
Address reprint requests to Dr. Donald L. Campbell, Department of Pharmacology, Duke University Medical Center, Box 3845, Durham, NC 27710.
J. GEN. PHYSIOL © The Rockefeller University Press • 0022-1295/93/04/0571/31 $2.00 Volume 101 April 1993 571-601
571
5 7 2 T H E JOURNAL OF GENERAL PHYSIOLOGY • VOLUME 101 • 1 9 9 3
I N T R O D U C T I O N
Potassium (K +) currents are fundamentally important in initiating and modulating repolarization of the cardiac action potential (for reviews see Hondeghem and Snyders, 1990; Hume, Uehara, Hadley, and Harvey, 1990; Pennefather and Cohen, 1990; Gintant, Cohen, Datyner, and Kline, 1991). An inactivating K + current that has been described in many cardiac tissues is the so-called "transient outward K + current" or / to (e.g., Binah, 1990; Gintant et al., 1991). Despite important quantita- tive kinetic differences, Ito in cardiac muscle appears to be qualitatively similar to the inactivating K + current IA present in many neuronal cell types (e.g., Connor and Stevens, 1971; Neher, 1971; Adams, Smith, and Thompson, 1980; Rudy, 1988).
/to has been postulated to modulate phase 1 repolarization and frequency- dependent changes in action potential configuration, and to contribute to differences in action potential configuration between different regions of the heart (atrium, Purkinje fiber, ventricle), endocardium versus epicardium, and young versus adult human atrial fibers (reviewed in Binah, 1990). Although/to plays a key role in cardiac repolarization, its basic properties have not been fully characterized. For example, there are contradictory reports about its gating, pharmacological, and neuromodula- tory characteristics, and the number and magnitude of current components compris- ing total/to in any given cardiac myocyte type are uncertain (i.e., a voltage-activated, Ca2+-indepe ndent Ito,1 and a Ca2+-activated Ito,2; see, for example, Callewaert, Vereecke, and Carmeliet, 1986; Escande, Coulombe, Faivre, Deroubaix, and Cora- boeuf, 1987; Bendorf, 1988; Giles and Imaizumi, 1988; Hiraoka and Kawano, 1989; Tseng and Hoffman, 1989; for review see Binah, 1990; Gintant et al., 1991). To date, no complete quantitative kinetic model of cardiac/to has been developed, particularly in regard to activation kinetics. In this article we analyze the macroscopic Ca 2+- independent/ to (/to.i) in single myocytes that have been enzymatically isolated from ferret right ventricles, and we describe and quantify its selectivity characteristics and potential-dependent macroscopic gating kinetics (activation and inactivation/recov- ery). In the accompanying article (Campbell, Qu, Rasmusson, and Strauss, 1993), we describe a kinetic model of state-dependent block of Ca2+-independent /to by 4-aminopyridine (4-AP) which is based in part on the kinetic analysis presented here.
Preliminary accounts of this work have appeared in abstract form (Campbell, Qu, Rasmusson, and Strauss, 1991a, b).
M E T H O D S
Myocyte Isolation
10-16-wk-old male ferrets (Marshall Farms, North Rose, NY) were anesthetized by intraperito- neai injection of sodium pentobarbital. Hearts were excised and perfused via the aorta on a Langendorff perfusion apparatus at 37°C. Perfusion solutions were bubbled with 100% 09, and perfusion pressure was maintained at ~ 70 cm HeO. Initial perfusion (5-10 min)with solution I, composed of (raM) 144 NaCI, 0.4 NaH~PO4, 5.4 KCI, 1 MgCI~, 2.5 CaCI~, 5.6 glucose, and 10 HEPES, pH 7.25, was followed by a 5-min perfusion with solution II (solution I with no added Ca 2+ and 100 IzM EGTA, 3.5 mM MgC12, 20 mM taurine, and 10 mM creatine), followed by a final 12-15-min perfusion with solution III (solution II with EGTA removed and 100 p,M CaCle added) containing 1 mg/ml collagenase (either type I or type II; Worthington Biochemical
CAMPBELL ET AL. Ito in Ferret Right Ventricle 573
Corp., Freehold, NJ), 0.1-0.2 mg/ml protease (type XIV; Sigma Chemical Co., St. Louis, MO), and 0.05 mg/ml elastase (type II-A; Sigma Chemical Co.). The right ventricle was dissected free, placed in fresh enzyme solution II containing an additional 10 mg/ml bovine serum albumin (essentially fatty acid free; Sigma Chemical Co.), and spun gently at 37°C. Aliquots of solution II were collected at 10-rain intervals, filtered through course nylon mesh, and centrifuged (~ 1,000 g for 1 rain). Myocyte pellets were then directly resuspended in tissue culture media (Medium 199; Sigma Chemical Co.; [CaCI2] = 1.8 mM) supplemented with 10% fetal calf serum and 1% antibiotics and stored at room temperature until used. All experiments were conducted within 8-12 h after initial myocyte isolation.
Electrophysiological Techniques
Myocytes were studied (Axopatch 1-C amplifier; Axon Instruments, Inc., Foster City, CA) using the single microelectrode gigaseal patch clamp technique in the whole cell recording configu- ration (Hamill, Marty, Neher, Sakmann, and Sigworth, 1981; Marty and Neher, 1983). Electrodes were fabricated from borosilicate glass tubing (TW150F-4, 1.5 mm o.d.; World Precision Instruments, Inc., Sarasota, FL) using a two-stage pipette puller (L/M-3P-A; Adams & List Associates, Ltd., Westbury, NY) and heat polished to a tip diameter of ~ 1 p.m. When filled with recording solution (described below), resistances were 2-4 MI~. Cells were pipetted into a small (~ 0.5 ml) recording chamber mounted on a modified stage (Adams & List Associates, Ltd.) of an inverted microscope (Nikon Diaphot) and were perfused at 1-4 ml/min. Tip potentials were typically - 5 mV or less; no corrections for offset potentials were applied. After gigaseal formation (> 30-50 Gfl), the whole cell recording configuration was achieved by applying a brief (0.1-10 ms) 1.5-V zap pulse to rupture the patch. 10-15 min elapsed before experimental recordings to allow stabilization (e.g., Marty and Neher, 1983). All experiments were conducted at room temperature (21-23°C) or lower (11-13°C).
For whole cell recording of/to, patch pipettes contained the following intracellular solution (mM): 140 KC1, 1 MgCI2, 5 EGTA, 5 ATP (Mg salt), 5 Na2-creatinephosphate, 0.2 GTP, and 10 HEPES, pH 7.40. Myocytes were initially perfused with a normal Na+-containing extracellular solution (mM): 144 NaC1, 5.4 KCI, 1 MgCI~, 2.5 CaCI2, 5.6 glucose, and 10 HEPES, pH 7.40. Seals were formed and action potentials were recorded in this solution. Unless otherwise specified, measurements were conducted during perfusion of a completely Na+-free/to solution (144 mM N-methyl-D-glucamine-C1 [NMDG-C1], 5.4 mM KC1, 1 mM MgCI2, 2.5 mM CaC12, 12-20 × 10 -6 M tetrodotoxin [TI'X], 500 x 10 -6 M CdC12, and 10 mM HEPES, pH 7.40) to eliminate INa, /ca, the Na+/Ca 2+ exchanger current (e.g., Campbell, Giles, Robinson, and Shibata, 1988), and any possible Na+-activated K + currents (e.g., Sanguinetti, 1990; Dukes and Morad, 1991). Because we have observed (Qu, Y., and D. L. Campbell, unpublished observa- tions) that concentrations of nitrendipine required to completely block Ic~ (1-10 wM) also block Ito (see also Gotoh, Imaizumi, Watanabe, Shibata, Clark, and Giles, 1991; Lefevre, Coulombe, and Coraboeuf, 1991), we used 500 v.M Cd 2+ to block lca.
To determine the ionic selectivity characteristics of/to, the apparent reversal potential, Er~, of deactivating/to tail currents was measured in solutions containing both Na + and K +. In these experiments, the concentration of TI 'X was increased to 50-60 ~M, and [KCI]o was varied from 1 to 100 mM, keeping the total [NaCI]o + [KCI]o constant at 149.4 mM. Only Er~ measurements from myocytes in which 50-60 o.M T-I"X adequately suppressed INa were used for analysis.
Two additional K + currents were observed upon initial establishment of the whole cell configuration: (a) a background, inwardly rectifying current, IKi, and (b) a very slowly activating, delayed rectifier-type current, IKDR. As described for other cardiac myocyte types (e.g., Harvey and Ten Eick, 1988; Gintant et al., 1991), Isl was instantaneous and displayed a typical, highly nonlinear current-voltage (I-V) relationship (see Fig. 1 B), which made application of conven-
574 THE JOURNAL OF GENERAL PHYSIOLOGY • VOLUME 101 • 1 9 9 3
tional linear leakage subtraction protocols impossible. However, IK~ does not contribute appreciable current in the range of potentials where/to activates in ferret ventricular myocytes. Activation of IKDR in these myocytes is extremely slow compared with the kinetics of Ito at 22°C, with half-activation times typically longer than ~ 2-4 s. l ~ g is also typically less than ~ 15% of peak Ito immediately after establishment of the whole cell configuration, and cooling the myocytes to 10-12°C markedly delayed the onset and further reduced the magnitude of IKDg. Furthermore, during the initial 10-15 rain stabilization time, lvd)g progressively declined and, in most myocytes, was nearly or completely eliminated, presumably due to exchange of the pipette solution with the cytosol (cf. Duchatelle-Gourdon, Hartzell, and Lagrutta, 1988; Wasserstrom and Ten Eick, 1991). Only recordings in which IKDR had completely run down were used. In all cases, the initial 10-15-rain perfusion did not affect the magnitude or time course of Ito. Therefore, all of our recordings were obtained from myocytes that had been perfused with control intracellular solution and thus were not necessarily subject to the full complement of cellular regulatory mechanisms.
For single-channel measurements, patch pipettes were manufactured from Corning 7052 glass (1.5 mM o.d., 0.86 mM i.d.; A-M Systems, Inc., Everett, WA), heat polished, and coated with Sylgard (Dow Coming Corp., Midland, MI). Tip resistances were 8-12 MII. Patch pipettes were filled with either normal NMDG-CI, 5.4 KCi solution, or 144 NaCI, 5.4 KC1 Erev solution (described above). Channel activity was recorded in the cell-attached configuration at 22°C; myocytes were bathed in either physiological 144 NaCI, 5.4 KCI Erev solution or an isotonic KCI solution (144 mM KC1, 5.4 NaCI, 1 MgCI2, 1 EGTA, and 10 HEPES, pH 7.40) to zero the membrane potential. Averages of blank records at each potential were used to subtract capacitive transients and the background seal resistance leak current.
Data Analysis and Fitting Procedures
Current traces and clamp pulses were recorded on video tape using a four-channel A/D VCR adaptor (PCM 4; Medical Systems Corp., Greenvale, NY). Whole cell currents were filtered (8-pole Bessel) at 2-5 kHz, while single-channel recordings were filtered at 1 kHz. Data were digitized off-line using a 125 kHz A/D board (Labmaster TL-1 DMA; Scientific Solutions Inc., Solon, OH) in a 386 personal computer running pClamp software (Axon Instruments Inc.). Data analysis utilized both commercially available software (pClamp, Lotus, FigP) and custom- ized programs. Simulations were carried out using a fourth-order, variable step size, Runge- Kutta algorithm written in double precision FORTRAN.
In experiments designed to quantitate activation, bath temperature was reduced to ~ 12°C to separate more reliably activation kinetics from the capacitive current transients (/cap)- To minimize further contamination from /cap, the membrane potential was first stepped to a potential at which macroscopic lto did not activate (typically - 2 0 mV; see Fig. 1 B). The resulting /cap was then linearly scaled and subtracted from current records elicited at more depolarized potentials.
During the capacitive transient (/cap = Cm * dV/dl) the membrane potential is not clamped but is approaching its final value with a characteristic time constant ("r = Rs~es * Cm). There- fore, for each subtracted record/cap was analyzed separately to determine the time required for it to decline 90% from its initial peak value. This 90% rise time for membrane potential was then taken as time zero for all subsequent analyses and fits of activation kinetics. In other words, the/cap-subtracted records were not analyzed back to the immediate on of the voltage clamp pulse, but were fit only once the membrane potential was within 10% of its final value. No attempt was made to fit current time courses before this time.
The subtracted current traces at 12°C were fit using an equation of the form:
A * ( I - e x p [ B * t ] ) " * e x p ( C * t ) + R (1)
CAMPBELL El" AL. Ito in Ferret Right Ventricle 575
where A is an amplitude scalar, B and C are the aggregate rate constants (1/[a + 13]) of activation and inactivation, respectively, n is the activation power, t is time, and R is steady-state current (Hodgkin and Huxley, 1952). Initial fits were obtained using a Marquardt nonlinear least-squares method where A, B, C, n, and R were all allowed to vary freely to determine the mean value of n. Subtracted data obtained at both 12 and 22°C were then fit to the same equation, but the value of n was fixed to the mean value previously determined at 12°C. The extracted time constants were then combined with measured steady-state data to derive first-order rate constants for activation. Apparent Ql0 values for the fully activated I-V relationship and for activation and inactivation rate constants were then calculated from mean values obtained from fits using the mean fixed n value.
Possible limitations of the fitting procedures used in our analysis of/to activation kinetics are described in Appendix II.
R E S U L T S
Basic Observations
Action potentials recorded from ferret right ventricular myocytes in physiological 144
mM Na ÷ saline (Fig. 1 A) typically show a 4-AP-sensitive early phase of repolarizat ion
(i.e., phase 1) immediately before the plateau, suggesting the presence of a rapidly
activating outward current . Fig. 1 B shows current recordings from a myocyte ba thed
in Na+-free NMDG solution elicited by voltage clamp pulses appl ied from a holding
A
B
-80
pA/pF
~ . . ~ . ~ ,
- 5 0
10
. . . . 5 - O ' ' m V
- 5
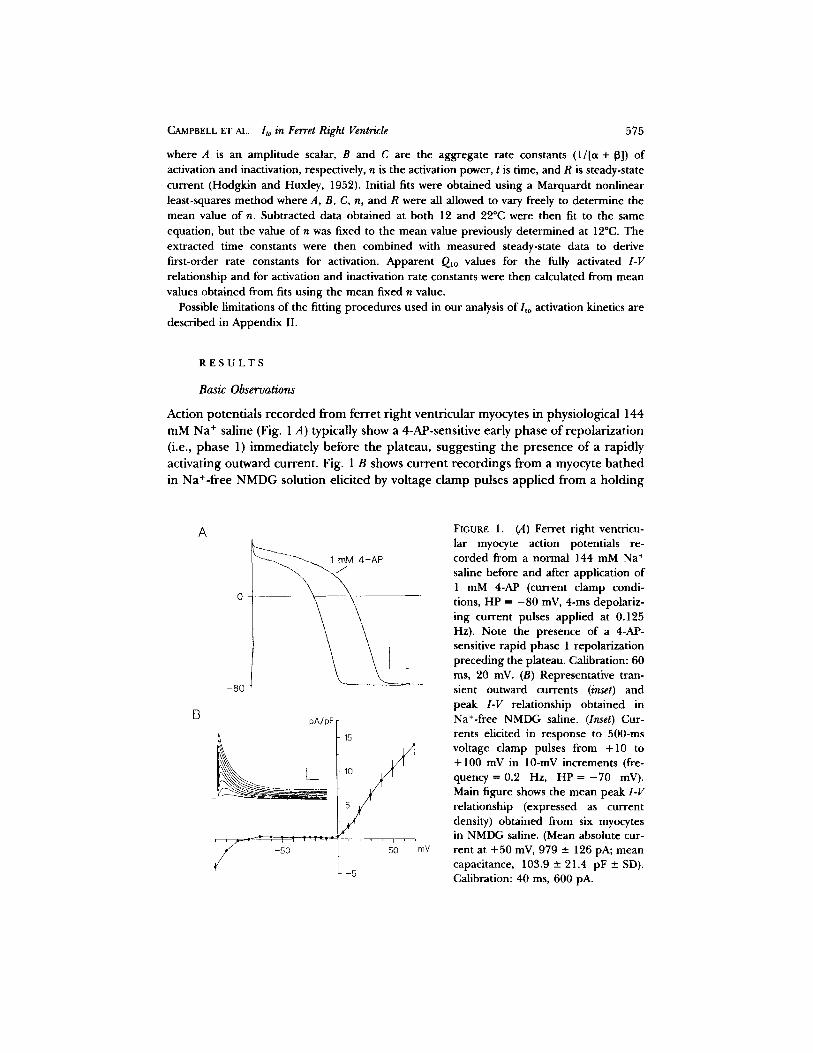
FIGURE 1. (A) Ferret right ventricu- lar myocyte action potentials re- corded from a normal 144 mM Na + saline before and after application of 1 mM 4-AP (current clamp condi- tions, HP = - 80 mV, 4-ms depolariz- ing current pulses applied at 0.125 Hz). Note the presence of a 4-AP- sensitive rapid phase 1 repolarizadon preceding the plateau. Calibration: 60 ms, 20 mV. (B) Representative tran- sient outward currents (inset) and peak 1-V relationship obtained in Na+-free NMDG saline. (Inset) Cur- rents elicited in response to 500-ms voltage clamp pulses from +10 to +100 mV in 10-mV increments (fre- quency = 0.2 Hz, H P = - 7 0 mV). Main figure shows the mean peak I-V relationship (expressed as current density) obtained from six myocytes in NMDG saline. (Mean absolute cur- rent at +50 mV, 979 -+ 126 pA; mean capacitance, 103.9 - 21.4 pF +- SD). Calibration: 40 ms, 600 pA.
5 7 6 T H E JOURNAL OF GENERAL PHYSIOLOGY • VOLUME 101 • 1993
potential (HP) o f - 7 0 mV to test potentials from +10 to +100 inV. The outward current elicited u p o n depolarization displays rapid activation and inactivation. Our experimental conditions indicate that activation o f this current is not dependen t on the influx of either Na + or Ca 2+. The main panel o f Fig. 1 shows the peak I-V
relationship obtained from six myocytes in NMDG solution over the range - 1 1 0 to +70 mV. The peak I-V is approximately linear f rom 0 to +70 mV.
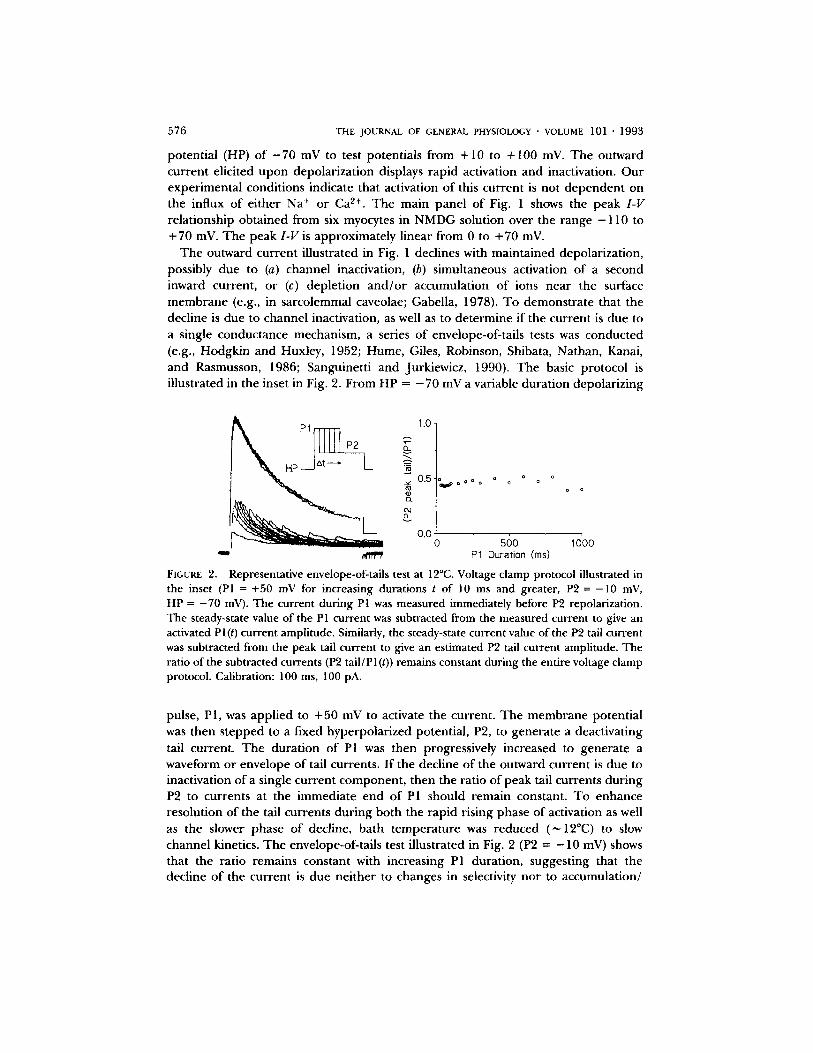
The outward current illustrated in Fig. 1 declines with maintained depolarization, possibly due to (a) channel inactivation, (b) simultaneous activation o f a second inward current, or (c) depletion a n d / o r accumulation of ions near the surface membrane (e.g., in sarcolemmal caveolae; Gabella, 1978). To demonstra te that the decline is due to channel inactivation, as well as to determine if the current is due to a single conductance mechanism, a series of envelope-of-tails tests was conducted (e.g., Hodgkin and Huxley, 1952; Hume, Giles, Robinson, Shibata, Nathan, Kanai, and Rasmusson, 1986; Sanguinetti and Jurkiewicz, 1990). The basic protocol is illustrated in the inset in Fig. 2. From HP = - 7 0 mV a variable duration depolarizing
P2
1.0 ¸
0.5 ¸
0,0
o o o ~ w l ~ o o ° o o e
o
0 500 1000 P1 Duration (ms)
FIGURE 2. Representative envelope-of-tails test at 12°C. Voltage clamp protocol illustrated in the inset (PI = +50 mV for increasing durations t of 10 ms and greater, P2 = -10 mV, HP = -70 mV). The current during PI was measured immediately before P2 repolarization. The steady-state value of the P1 current was subtracted from the measured current to give an activated Pl(t) current amplitude. Similarly, the steady-state current value of the P2 tail current was subtracted from the peak tail current to give an estimated P2 tail current amplitude. The ratio of the subtracted currents (P2 tail/P 1 (t)) remains constant during the entire voltage clamp protocol. Calibration: 100 ms, 100 pA.
pulse, P1, was applied to + 50 mV to activate the current. The membrane potential was then s tepped to a fixed hyperpolarized potential, P2, to generate a deactivating tail current. The durat ion o f PI was then progressively increased to generate a waveform or envelope of tail currents. I f the decline of the outward current is due to inactivation o f a single current component , then the ratio of peak tail currents dur ing P2 to currents at the immediate end of P1 should remain constant. To enhance resolution of the tail currents dur ing both the rapid rising phase of activation as well as the slower phase of decline, bath temperature was reduced (~ 12°C) to slow channel kinetics. The envelope-of-tails test illustrated in Fig. 2 (P2 = - 10 mV) shows that the ratio remains constant with increasing P1 duration, suggesting that the decline o f the current is due neither to changes in selectivity nor to accumulation/
CAMPBELL ET AL. Ito in Ferret Right Ventricle 577
depletion o f ions, but ra ther to changes in membrane conductance. Similar results (12°C) were obtained from three additional myocytes.
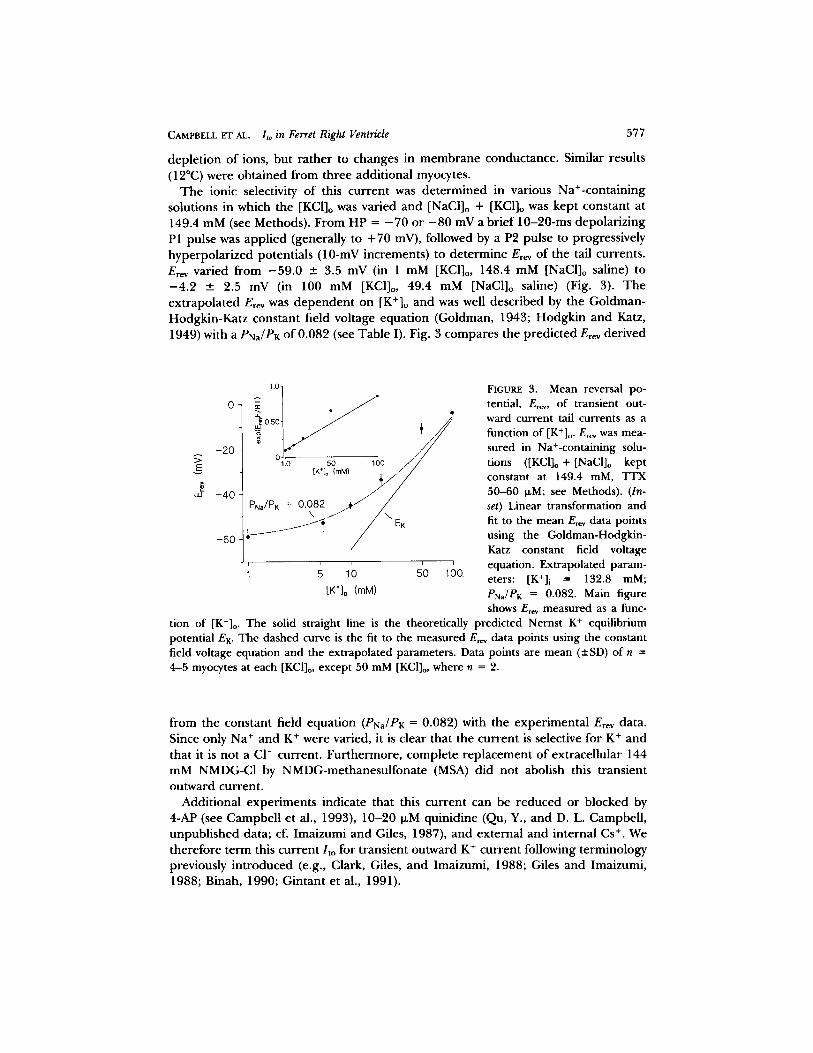
The ionic selectivity o f this current was de termined in various Na+-containing solutions in which the [KCI]o was varied and [NaCl]o + [KCI]o was kept constant at 149.4 mM (see Methods). From HP -- - 7 0 or - 8 0 mV a brief 10-20-ms depolarizing P1 pulse was applied (generally to +70 mV), followed by a P2 pulse to progressively hyperpolar ized potentials (10-mV increments) to determine E,~, of the tail currents. Erev varied from - 5 9 . 0 +- 3.5 mV (in 1 mM [KCI]o, 148.4 mM [NaCl]o saline) to - 4 . 2 -+ 2.5 mV (in 100 mM [KCI]o, 49.4 mM [NaC1]o saline) (Fig. 3). The extrapolated E,~v was dependen t on [K+]o and was well described by the Goldman- Hodgkin-Katz constant field voltage equation (Goldman, 1943; Hodgkin and Katz, 1949) with a PNa/PK of 0.082 (see Table I). Fig. 3 compares the predicted E,ev derived
UJ
-20
-40
-60
/ ~u~x~ 0'50
° o ] . ~ , 1.o ~b 16o / tK'~ (mM) j r / / /
PNa/P K = 0.082 . . ~ v " / / /
f .........
i i i
10 50 100. [K+]o (mM)
FIGURE 3. Mean reversal po- tential, Er~, of transient out- ward current tail currents as a function of [K+]o . E,~ was mea- sured in Na+-containing solu- tions ([KCI]o + [NaCl]o kept constant at 149.4 mM, TFX 50-60 IJ.M; see Methods). (In- set) Linear transformation and fit to the mean E,~v data points using the Goldman-Hodgkin- Katz constant field voltage equation. Extrapolated param- eters: [K+]i = 132.8 mM; PNa/PK = 0.082. Main figure shows Er~v measured as a func-
tion of [K+]o . The solid straight line is the theoretically predicted Nernst K + equilibrium potential EK. The dashed curve is the fit to the measured Er~ data points using the constant field voltage equation and the extrapolated parameters. Data points are mean (-+SD) of n = 4-5 myocytes at each [KCI]o, except 50 mM [KC1]o, where n = 2.
f rom the constant field equation (PNa/PK = 0.082) with the experimental Erev data. Since only Na ÷ and K + were varied, it is clear that the current is selective for K + and that it is not a CI- current. Furthermore, complete replacement of extracellular 144 mM NMDG-CI by NMDG-methanesulfonate (MSA) did not abolish this transient outward current.
Additional experiments indicate that this current can be reduced or blocked by 4-AP (see Campbell et al., 1993), 10-20 I~M quinidine (Qu, Y., and D. L. Campbell, unpubl ished data; cf. Imaizumi and Giles, 1987), and external and internal Cs +. We therefore term this current / to for transient outward K + current following terminology previously introduced (e.g., Clark, Giles, and Imaizumi, 1988; Giles and Imaizumi, 1988; Binah, 1990; Gintant et al., 1991).
578 THE JO U RN A L OF GENERAL PHYSIOLOGY - VOLUME 1 0 1 . 1993
Quantitative Kinetic Analysis of Ito
I N A C T I V A T I O N C H A R A C T E R I S T I C S
The envelope-of-tails data (Fig. 2) in combination with the E r e v data (Fig. 3) confirm that /to is due to a time-dependent change in membrane K + conductance, which subsequently inactivates to a final level. However, at 500-800 ms an outwardly rectifying component of steady-state current was observed. It is important to recall that the currents illustrated have not been leakage corrected. When the scaled capacitive current was subtracted (see Methods), the instantaneous (time zero) current changes after a depolarizing pulse were identical to the steady-state currents measured at the end of the pulse. The average value of the residual current at the end of depolarizing pulses relative to the instantaneous time zero current was - 2.1 + 1.7% (+_ SE; n = 6 myocytes), expressed as a percentage of peak. Therefore, the maximum value for the residual, noninactivated component is 0.34%, using a P = 0.01 criterion for rejection. Thus, the outwardly rectifying current component appears to be a time-independent, background current. This indicates that /to completely inactivates at depolarized potentials and that the residual current at the end of the test pulse is composed of a time-independent or instantaneous back- ground leak current.
Additional experiments demonstrated that this instantaneous background leak current is sensitive to extracellular CI- concentration. For example, complete replacement of 144 mM NMDG-CI by NMDG-MSA significantly reduced the magni- tude of the current at the end of 500-ms depolarizing clamp pulses (e.g., 59 -+ 6% [SD] reduction at + 50 mV; n = 3 myocytes). However, extracellular CI- replacement with NMDG-MSA did not alter the time-to-peak, kinetics of inactivation, or magni- tude of the transient/to (i.e.,/to, p e a k - - •500 ms) over the depolarized range of potentials (+20 to + 100 mV). These results indicate that this CI- conductance is indeed acting as a time-independent, background leak conductance, with properties very similar to the background CI- conductance recently described in canine atrial myocytes by Sorota (1992). In our macroscopic kinetic analysis of/ to we have therefore included appropriate corrections for this background current.
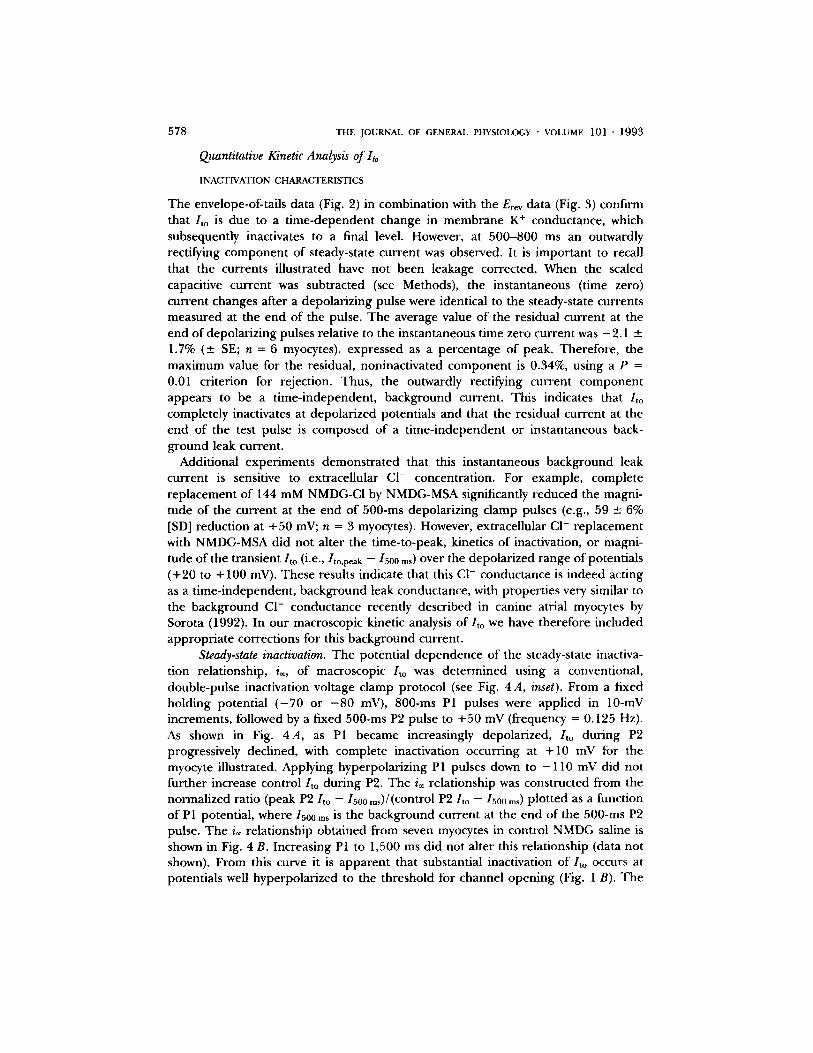
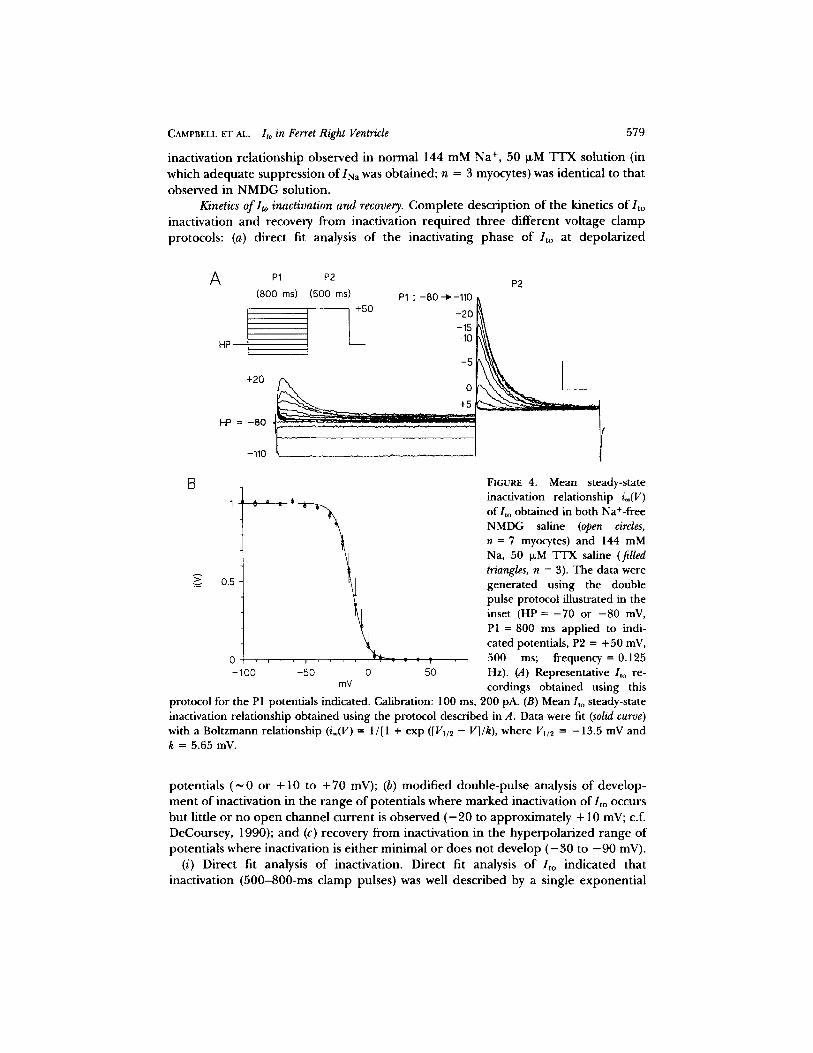
Steady-state inactivation. The potential dependence of the steady-state inactiva- tion relationship, i®, of macroscopic Ito was determined using a conventional, double-pulse inactivation voltage clamp protocol (see Fig. 4 A, inset). From a fixed holding potential ( - 7 0 or - 8 0 mV), 800-ms P1 pulses were applied in 10-mV increments, followed by a fixed 500-ms P2 pulse to +50 mV (frequency = 0.125 Hz). As shown in Fig. 4A, as P1 became increasingly depolarized, /to during P2 progressively declined, with complete inactivation occurring at +10 mV for the myocyte illustrated. Applying hyperpolarizing P1 pulses down to - 1 1 0 mV did not further increase control Ito during P2. The i= relationship was constructed from the normalized ratio (peak P2/to - - 1500 m~)/(control P2/to - - 1500 ms) plotted as a function of P1 potential, where 1500 ms is the background current at the end of the 500-ms P2 pulse. The i= relationship obtained from seven myocytes in control NMDG saline is shown in Fig. 4 B. Increasing PI to 1,500 ms did not alter this relationship (data not shown). From this curve it is apparent that substantial inactivation of / to o c c u r s at potentials well hyperpolarized to the threshold for channel opening (Fig. 1 B). The
CAMPBELL ET AL. Ito in Ferret Right Ventricle 579
inact ivat ion re la t ionship observed in normal 144 mM Na +, 50 I~M T I ' X solut ion (in which adequa te suppress ion OflNa was obta ined; n = 3 myocytes) was identical to that
observed in NMDG solution. Kinetics of Ito inactivation and recovery. Comple t e descr ip t ion of the kinetics o f / to
inact ivat ion and recovery from inact ivat ion requ i red three different vol tage c lamp protocols: (a) direct fit analysis o f the inact ivat ing phase of Ito at depo la r i zed
A P1 P2 P2 (800 ms) (500 ms) P1 : -80-~-110 i ] +50 -20
L -15 -10
HP
-5
+20 ~ _ 0
HP = -80 ~[- - ~ ' ' - r ' " ~ " ~ '
--110
B
A
> 0.5
o -10o
FIGURE 4. Mean steady-state o . ~ , inactivation relationship i®(V)
" e
of/to obtained in both Na+-free NMDG saline (open circles, n = 7 myocytes) and 144 mM Na, 50 o,M TTX saline (filled triangles, n = 3). The data were generated using the double pulse protocol illustrated in the inset (HP = - 7 0 or - 8 0 mV, P1 = 800 ms applied to indi- cated potentials, P2 = +50 mV,
, ~ , ~ 500 ms; frequency = 0.125 -50 0 50 Hz). (A) Representative /to re-
mV cordings obtained using this protocol for the P1 potentials indicated. Calibration: 100 ms, 200 pA. (B) Mean lto steady-state inactivation relationship obtained using the protocol described in A. Data were fit (solid curve) with a Boltzmann relationship (i®(V) -- 1/[1 + exp ([Vu~ - V]/k), where Vii2 = -13.5 mV and k = 5.65 mV.
potent ia ls ( ~ 0 or +10 to + 7 0 mV); (b) modi f ied double -pu l se analysis of develop- men t o f inact ivat ion in the r ange of potent ia ls where m a r k e d inact ivat ion of / to occurs but little or no open channel cur ren t is observed ( - 2 0 to app rox ima te ly + 10 mV; c.f. DeCoursey, 1990); and (c) recovery f rom inact ivat ion in the hype rpo la r i zed range of potent ia ls where inact ivat ion is e i ther min imal or does not develop ( - 3 0 to - 9 0 mV).
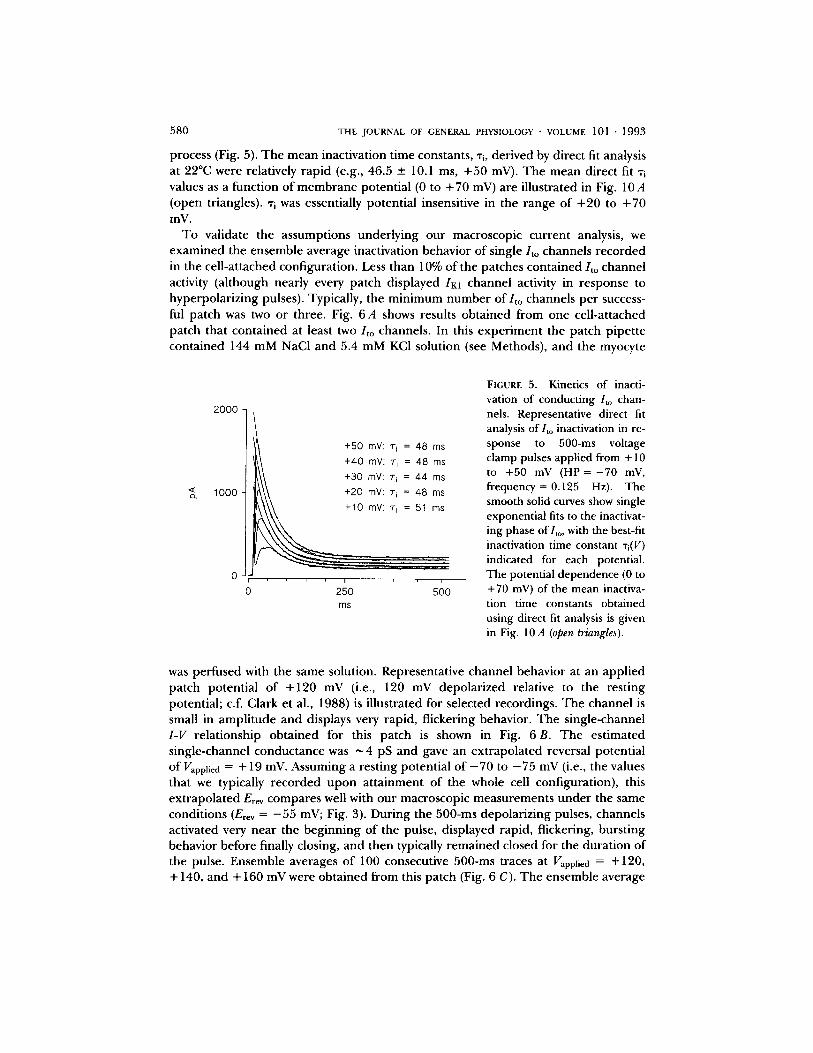
(i) Direct fit analysis o f inactivation. Direct fit analysis o f /to indica ted that inact ivat ion (500-800-ms c lamp pulses) was well descr ibed by a single exponen t i a l
5 8 0 T H E J O U R N A L OF G E N E R A L P H Y S I O L O G Y • V O L U M E 101 • 1 9 9 3
process (Fig. 5). T he mean inactivation time constants, % derived by direct fit analysis at 22°C were relatively rapid (e.g., 46.5 _+ 10.1 ms, +50 mV). The mean direct fit "ri values as a function of membrane potential (0 to + 70 mV) are illustrated in Fig. 10 A (open triangles). "ri was essentially potential insensitive in the range of +20 to +70 mV.
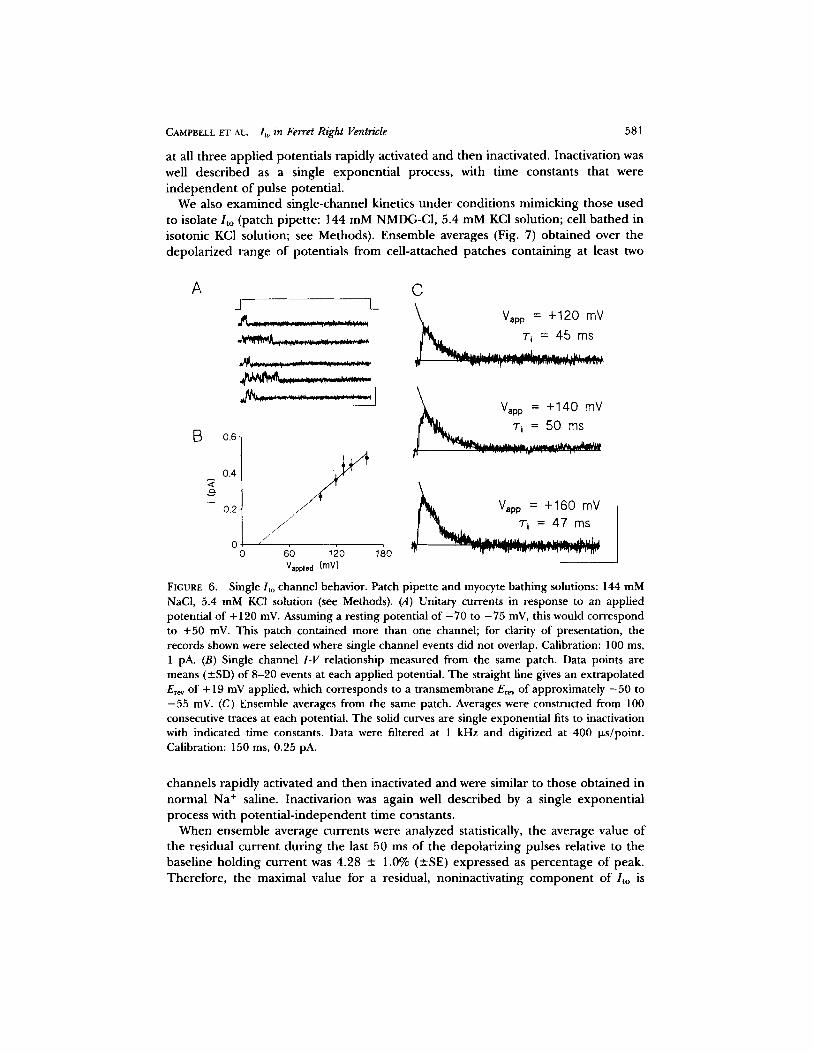
To validate the assumptions underlying our macroscopic current analysis, we examined the ensemble average inactivation behavior o f single/to channels recorded in the cell-attached configuration. Less than 10% of the patches contained/ to channel activity (al though nearly every patch displayed Ial channel activity in response to hyperpolarizing pulses). Typically, the min imum number of/ to channels per success- ful patch was two or three. Fig. 6 A shows results obtained from one cell-attached patch that contained at least two/ to channels. In this exper iment the patch pipette contained 144 mM NaCI and 5.4 mM KCI solution (see Methods), and the myocyte
2000
1000
FIGURE 5. Kinetics of inacti- vation of conducting /to chan- nels. Representative direct fit analysis of/to inactivation in re-
+50 mY: "Q = 48 ms sponse to 500-ms voltage ~/ +40 mY: 7 i = 48 ms clamp pulses applied from +10 ~\\ +30 mY: 7 i = 44 ms to +50 mV (HP = -70 mV, ~ \ \ +20 mY: ri = 48 ms frequency = 0.125 Hz). The
~ ~10 mY: r i = 51 ms smooth solid curves show single exponential fits to the inactivat- ing phase of/to, with the best-fit inactivation time constant "ri(V)
_. -_~._.7".-: ~.~'~ indicated for each potential. The potential dependence (0 to
i i 250 500 +70 mV) of the mean inactiva- ms tion time constants obtained
using direct fit analysis is given in Fig. 10A (open tT~angles).
was perfused with the same solution. Representative channel behavior at an applied patch potential o f +120 mV (i.e., 120 mV depolarized relative to the resting potential; c.f. Clark et al., 1988) is illustrated for selected recordings. The channel is small in ampli tude and displays very rapid, flickering behavior. The single-channel I - V relationship obtained for this patch is shown in Fig. 6 B. The estimated single-channel conductance was ~ 4 pS and gave an extrapolated reversal potential of Vapplie d = "4" 19 mV. Assuming a resting potential of - 7 0 to - 7 5 mV (i.e., the values that we typically recorded upon at tainment of the whole cell configuration), this extrapolated Er~v compares well with our macroscopic measurements under the same conditions (Erev = - 5 5 mV; Fig. 3). During the 500-ms depolarizing pulses, channels activated very near the beginning of the pulse, displayed rapid, flickering, bursting behavior before finally closing, and then typically remained closed for the durat ion of the pulse. Ensemble averages o f 100 consecutive 500-ms traces a t Vapplie d = +120, + 140, and + 160 mV were obtained from this patch (Fig. 6 C). The ensemble average
CAMPBELL ET AL. Ito in Ferret Right Ventricle 581
at all three app l i ed potent ia l s rap id ly act ivated and then inactivated. Inact ivat ion was well descr ibed as a single exponen t i a l process, with t ime constants that were i n d e p e n d e n t o f pulse potent ia l .
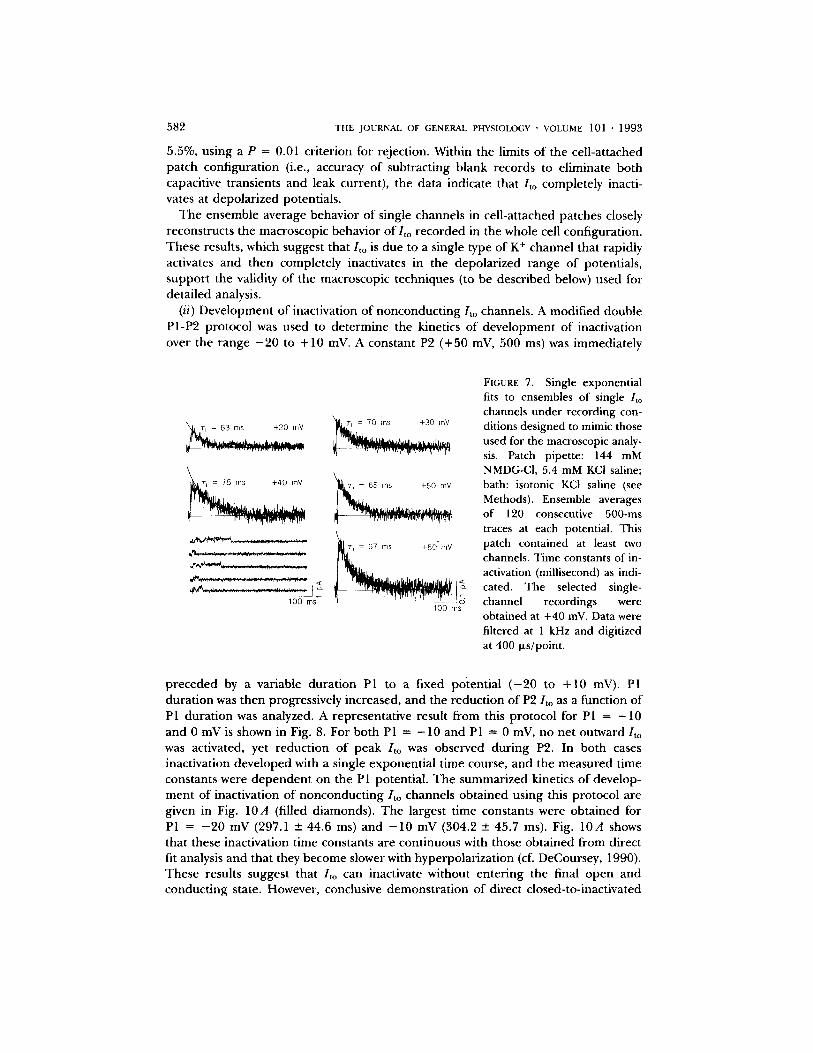
We also e x a m i n e d s ingle-channel kinetics u n d e r condi t ions mimick ing those used to i so la te / to (patch p ipe t te : 144 mM NMDG-CI, 5.4 mM KCI solution; cell ba thed in isotonic KC1 solution; see Methods) . Ensemble averages (Fig. 7) ob ta ined over the depo la r i zed range of potent ia l s f rom cel l -a t tached pa tches conta in ing at least two
A
B
J L_ ~ _ - ~ ;~z.~ .~':_ 727. ":.'+"'7~-';L:~'d'-t':
0.6
0 .4 -
0.2
D "/"+
o
/+/+/
7": ....-
6o ~2o Vapp,ed (mY)
C
~ . , . . ~ , = +120 mV Vapp T+ = 45 ms
Vap p = +140 mV % = 50 ms
~ = a Vapp = +160 mV T i = 47 ms
~ l l . i I I l , . L i i I J u [ d +J.,llJ ~ t a - , ~ + ~ILU Iiii I +- IT"r+ "-"?p"mlr e -lwfl'=,'l r"1 .,,~w,'Ip'
FIGURE 6. Single/to channel behavior. Patch pipette and myocyte bathing solutions: 144 mM NaC1, 5.4 mM KCI solution (see Methods). (A) Unitary currents in response to an applied potential of + 120 mV. Assuming a resting potential of - 7 0 to - 7 5 mV, this would correspond to +50 mV. This patch contained more than one channel; for clarity of presentation, the records shown were selected where single channel events did not overlap. Calibration: 100 ms, 1 pA. (B) Single channel I-V relationship measured from the same patch. Data points are means (_SD) of 8-20 events at each applied potential. The straight line gives an extrapolated E~v of + 19 mV applied, which corresponds to a transmembrane Erev of approximately - 5 0 to - 5 5 mV. (C) Ensemble averages from the same patch. Averages were constructed from 100 consecutive traces at each potential. The solid curves are single exponential fits to inactivation with indicated time constants. Data were filtered at 1 kHz and digitized at 400 i+s/point. Calibration: 150 ms, 0.25 pA.
channels rap id ly act ivated and then inact ivated and were similar to those ob ta ined in no rma l Na + saline. Inact ivat ion was again well descr ibed by a single exponen t i a l process with p o t e n t i a l - i n d e p e n d e n t t ime constants .
When ensemble average currents were analyzed statistically, the average value of the res idual cur ren t du r ing the last 50 ms o f the depo la r i z ing pulses relative to the basel ine ho ld ing cur ren t was 4.28 +- 1.0% (+SE) expressed as pe rcen tage o f peak. Therefore , the max imal value for a residual , noninac t iva t ing c o m p o n e n t o f / t o is
582 T H E J O U R N A L O F G E N E R A L P H Y S I O L O G Y • V O L U M E 10l • 1 9 9 3
5.5%, using a P = 0.01 criterion for rejection. Within the limits of the cell-attached patch configuration (i.e., accuracy of subtracting blank records to eliminate both capacitive transients and leak current), the data indicate that/ to completely inacti- vates at depolarized potentials.
The ensemble average behavior of single channels in cell-attached patches closely reconstructs the macroscopic behavior of/to recorded in the whole cell configuration. These results, which suggest that/to is due to a single type of K + channel that rapidly activates and then completely inactivates in the depolarized range of potentials, support the validity of the macroscopic techniques (to be described below) used for detailed analysis.
(ii) Development of inactivation of nonconducting/to channels. A modified double P1-P2 protocol was used to determine the kinetics of development of inactivation over the range - 2 0 to +10 mV. A constant P2 (+50 mV, 500 ms) was immediately
+40 ray
100 ms
+30 mV
i =
1 0 0 ms
FIGURE 7. Single exponential fits to ensembles of single / t o
channels under recording con- ditions designed to mimic those used for the macroscopic analy- sis. Patch pipette: 144 mM NMDG-CI, 5.4 mM KCI saline; bath: isotonic KCI saline (see Methods). Ensemble averages of 120 consecutive 500-ms traces at each potential. This patch contained at least two channels. Time constants of in- activation (millisecond) as indi- cated. The selected single- channel recordings were obtained at +40 InV. Data were filtered at 1 kHz and digitized at 400 i~s/point.
preceded by a variable duration P1 to a fixed potential ( - 2 0 to +10 mV). P1 duration was then progressively increased, and the reduction of P2/to as a function of PI duration was analyzed. A representative result from this protocol for PI = - 1 0 and 0 mV is shown in Fig. 8. For both P1 = - 10 and P1 = 0 mV, no net outward/to was activated, yet reduction of peak /to was observed during P2. In both cases inactivation developed with a single exponential time course, and the measured time constants were dependent on the P1 potential. The summarized kinetics of develop- ment of inactivation of nonconducting/to channels obtained using this protocol are given in Fig. 10A (filled diamonds). The largest time constants were obtained for PI = - 2 0 mV (297.1 -- 44.6 ms) and - 1 0 mV (304.2 -+ 45.7 ms). Fig. 10A shows that these inactivation time constants are continuous with those obtained from direct fit analysis and that they become slower with hyperpolarization (cf. DeCoursey, 1990). These results suggest that /to can inactivate without entering the final open and conducting state. However, conclusive demonstration of direct closed-to-inactivated
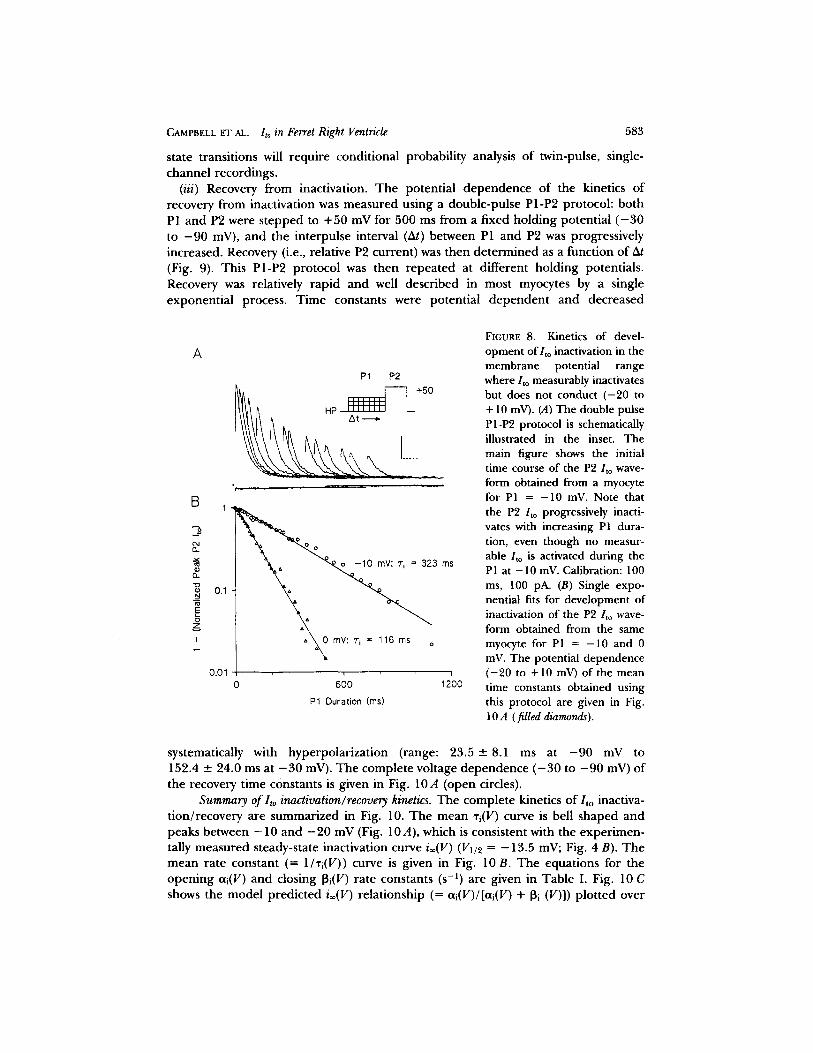
CAMPBELL ET A L Ito in Ferret Right Ventricle 583
state transitions will require conditional probability analysis o f twin-pulse, single- channel recordings.
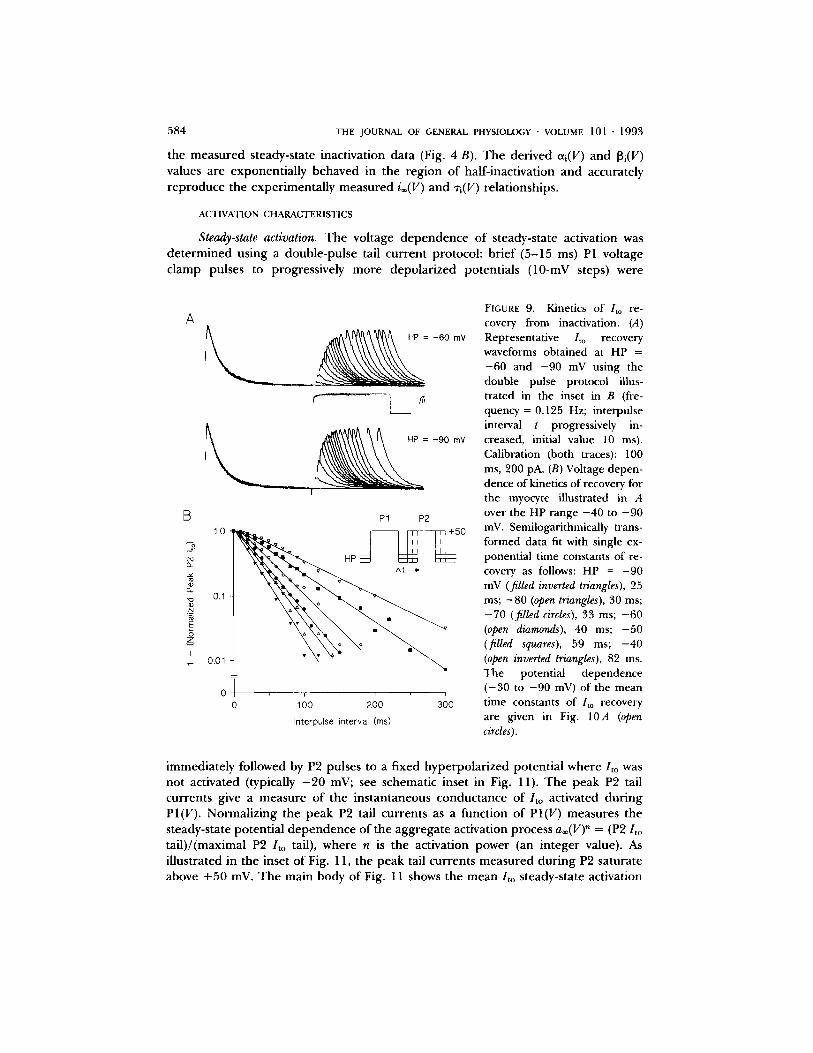
(iii) Recovery from inactivation. The potential dependence o f the kinetics of recovery from inactivation was measured using a double-pulse P1-P2 protocol: both P1 and P2 were s tepped to + 5 0 mV for 500 ms from a fixed holding potential ( - 3 0 to - 9 0 mV), and the interpulse interval (At) between P1 and P2 was progressively increased. Recovery (i.e., relative P2 current) was then de termined as a function o f At (Fig. 9). This P1-P2 protocol was then repeated at different holding potentials. Recovery was relatively rapid and well described in most myocytes by a single exponential process. T ime constants were potential dependen t and decreased
A
_-_o
t~
I
0.1
0.01
p l P2
L_
3 ms
A'~,X0 mV'. -r i = 116 ms o
t i
0 6oo 1200
P1 Duration (ms)
FIGURE 8. Kinetics of devel- opment of/to inactivation in the membrane potential range where/to measurably inactivates but does not conduct ( -20 to + 10 mV). (A) The double pulse PI-P2 protocol is schematically illustrated in the inset. The main figure shows the initial time course of the P2/to wave- form obtained from a myocyte for PI -- - 10 InV. Note that the P2 /to progressively inacti- vates with increasing PI dura- tion, even though no measur- able /to is activated during the P1 at - 10 mV. Calibration: 100 ms, 100 pA. (B) Single expo- nential fits for development of inactivation of the P2 Ito wave- form obtained from the same myocyte for P1 = -10 and 0 mV. The potential dependence ( -20 to + 10 mV) of the mean time constants obtained using this protocol are given in Fig. 10 A (filled diamonds).
systematically with hyperpolarizat ion (range: 2 3 . 5 - 8.1 ms at - 9 0 mV to 152.4 - 24.0 ms at - 3 0 mV). The complete voltage dependence ( - 3 0 to - 9 0 mV) of the recovery time constants is given in Fig. 10 A (open circles).
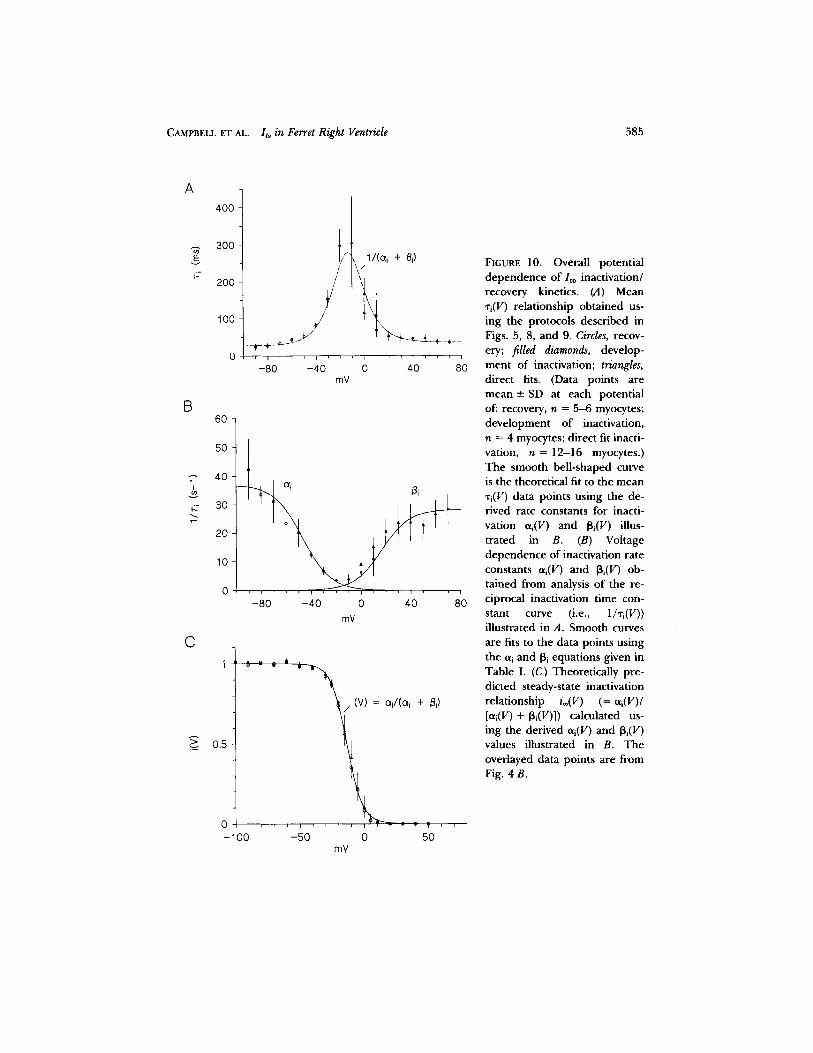
Summary oflto inactivation~recovery kinetics. The complete kinetics of / to inactiva- t ion/recovery are summarized in Fig. 10. The mean "ri(V) curve is bell shaped and peaks between - 1 0 and - 2 0 mV (Fig. 10 A), which is consistent with the exper imen- tally measured steady-state inactivation curve i®(V) (V1/2 = - 1 3 . 5 mV; Fig. 4 B). The mean rate constant (-- 1/xi(V)) curve is given in Fig. 10 B. The equations for the open ing eti(V) and closing [3i(V) rate constants (s - l ) are given in Table I. Fig. 10 C shows the model predicted i®(V) relationship (= eti(V)/[oti(V) + [3i (V)]) plotted over
584 THE JO U RN A L OF GENERAL PHYSIOLOGY • VOLUME 101 • 1 9 9 3
the measured steady-state inactivation data (Fig. 4 B). The derived ai(V) and [3i(V) values are exponentially behaved in the region of half-inactivation and accurately reproduce the experimentally measured i®(V) and ri(V) relationships.
A C T I V A T I O N C H A R A C T E R I S T I C S
Steady-state activation. The voltage dependence of steady-state activation was determined using a double-pulse tail current protocol: brief (5-15 ms) P1 voltage clamp pulses to progressively more depolarized potentials (10-mV steps) were
A l l ~ ~ . , ~ H P = -60 mV
c " I _ _ ~
B 1.0 .4
-%
2
g- o.1
0.01
P1 P2
HP At --~
0 i i E
0 100 200 300 Interpulse interval (ms)
FIGURE 9. Kinetics of /to r e -
c o v e r y from inactivation. (A) Representative /to recovery waveforms obtained at HP = -60 and -90 mV using the double pulse protocol illus- trated in the inset in B (fre- quency-- 0.125 Hz; interpulse interval t progressively in- creased, initial value 10 ms). Calibration (both traces): 100 ms, 200 pA. (B) Voltage depen- dence of kinetics of recovery for the myocyte illustrated in A over the HP range -40 to - 90 inV. Semilogarithmically trans- formed data fit with single ex- ponential time constants of re- covery as follows: HP = -90 mV (filled inverted triangles), 25 ms; - 80 (open triangles), 30 ms; - 7 0 (filled circles), 33 ms; - 60 (open diamonds), 40 ms; - 50 (filled squares), 59 ms; - 40 (open inverted triangles), 82 ms. The potential dependence ( -30 to - 90 mV) of the mean time constants of Ito recovery are given in Fig. 10A (open circles).
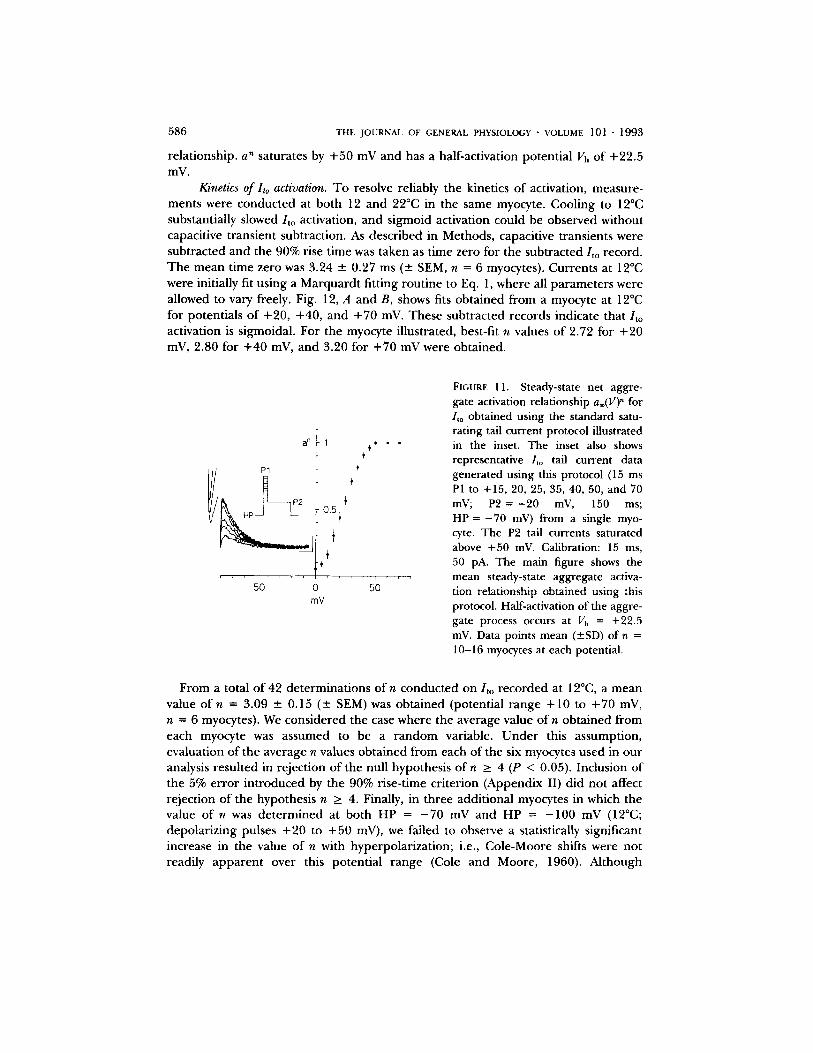
immediately followed by P2 pulses to a fixed hyperpolarized potential where / to was not activated (typically - 2 0 mV; see schematic inset in Fig. 11). The peak P2 tail currents give a measure o f the instantaneous conductance o f / t o activated dur ing PI(V). Normalizing the peak P2 tail currents as a function of PI(V) measures the steady-state potential dependence of the aggregate activation process a®(V)" = (P2/to tail)/(maximal P2 /to tail), where n is the activation power (an integer value). As illustrated in the inset of Fig. 11, the peak tail currents measured dur ing P2 saturate above + 50 inV. T he main body of Fig. 11 shows the mean / to steady-state activation
C A M P B E L L E T A L . Ito in Ferret Right Ventricle 585
A
¢-
B
¥
C
400
300
200
lOO
60
50
40
30
20
10
0
0 - 1 0 0
0.5
I / @ \ / l / ( a i + Bi)
/ i ",1 / " t - i
r + * +./+" --'-'r--+.-L,.....+ ..... , i , , i , , i , ] , , i
- 8 0 - 4 0 0 40 80 mV
I , , i , , i , , l , , , i
- 8 0 - 4 0 0 40 80 rnV
m ; 6
/ i (V ) = al/(ai + .~i)
- 5 0 0 50 mV
FIGURE 10. Overall potential dependence of/to inactivation/ recovery kinetics. (A) Mean *i(V) relationship obtained us- ing the protocols described in Figs. 5, 8, and 9. Circles, recov- ery; filled diamonds, develop- ment of inactivation; triangles, direct fits. (Data points are mean __ SD at each potential of: recovery, n = 5-6 myocytes; development of inactivation, n = 4 myocytes; direct fit inacti- vation, n = 12-16 myocytes.) The smooth bell-shaped curve is the theoretical fit to the mean ~i(V) data points using the de- rived rate constants for inacti- vation oq(V) and fli(V) illus- trated in B. (B) Voltage dependence of inactivation rate constants oq(V) and 13i(V) ob- tained from analysis of the re- ciprocal inactivation time con- stant curve (i.e., 1/Ti(V)) illustrated in A. Smooth curves are fits to the data points using the eti and [3i equations given in Table I. (C) Theoretically pre- dicted steady-state inactivation relationship i®(V) (= eq(V)/ [eti(V) + 13i(V)]) calculated us- ing the derived oq(V) and 13i(V) values illustrated in B. The overlayed data points are from Fig. 4B.
5 8 6 T H E J O U R N A L O F G E N E R A L P H Y S I O L O G Y • V O L U M E 101 • 1 9 9 3
re la t ionship, a" saturates by + 5 0 mV and has a half-activation potent ia l Vh of +22.5 mV.
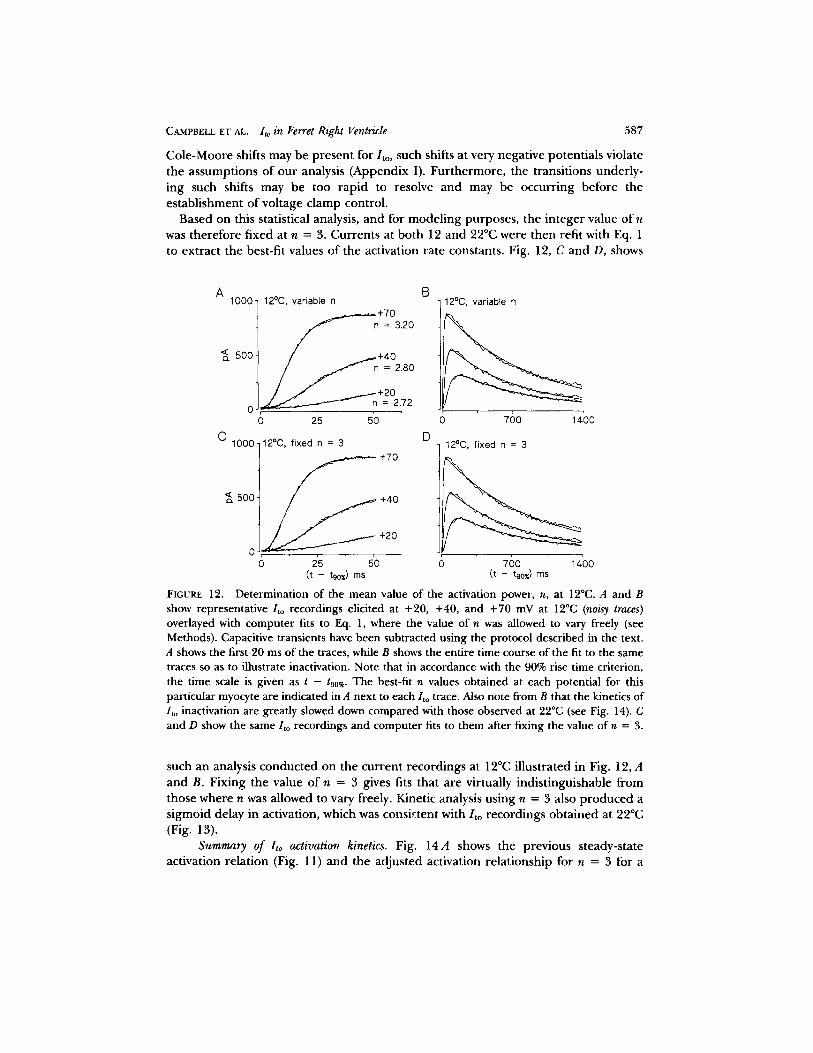
Kinetics of lto activation. To resolve reliably the kinetics of activation, measure- ments were conduc ted at both 12 and 22°C in the same myocyte. Cool ing to 12°C substantial ly s lowed/ to activation, and s igmoid activation could be observed without capacit ive t rans ient subtract ion. As descr ibed in Methods, capacit ive t ransients were subt rac ted and the 90% rise t ime was taken as t ime zero for the sub t rac ted / to record. The m e a n t ime zero was 3.24 -+ 0.27 ms (_+ SEM, n = 6 myocytes). Currents at 12°C were initially fit us ing a Marqua rd t f i t t ing rout ine to Eq. 1, where all pa rame te r s were allowed to vary freely. Fig. 12, A and B, shows fits ob ta ined from a myocyte at 12°C for potent ia ls of +20, +40, and +70 mV. These subt rac ted records indicate t ha t / t o activation is s igmoidal . For the myocyte i l lustrated, best-fit n values o f 2.72 for +20 mV, 2.80 for + 4 0 mV, and 3.20 for + 7 0 mV were obta ined.
a n
P 2
1 • • • ÷
÷
¢
+ o.~+
÷
' ' ' i . . . . . . . . i , , ,
-50 0 50 mV
FIGURE 11. Steady-state net aggre- gate activation relationship a®(V)" for /to obtained using the standard satu- rating tail current protocol illustrated in the inset. The inset also shows representative /to tail current data generated using this protocol (15 ms P1 to +15, 20, 25, 35, 40, 50, and 70 mV; P2 = - 2 0 mV, 150 ms; HP = - 7 0 mV) from a single myo- cyte. The P2 tail currents saturated above +50 mV. Calibration: 15 ms, 50 pA. The main figure shows the mean steady-state aggregate activa- tion relationship obtained using this protocol. Half-activation of the aggre- gate process occurs at Vh = +22.5 inV. Data points mean (---SD) of n = 10-16 myocytes at each potential.
F rom a total o f 42 de te rmina t ions of n conduc ted o n / t o r eco rded at 12°C, a mean value o f n = 3.09 - 0.15 (-+ S E M )w a s ob ta ined (potent ia l r ange + 10 to +70 mV, n = 6 myocytes). We cons idered the case where the average value o f n ob ta ined from each myocyte was assumed to be a r a n d o m variable. U n d e r this assumpt ion, evaluat ion o f the average n values ob ta ined from each of the six myocytes used in our analysis resul ted in re ject ion of the null hypothesis of n _> 4 (P < 0.05). Inclusion of the 5% er ror in t roduced by the 90% rise-t ime cr i ter ion (Append ix II) d id not affect re ject ion of the hypothesis n >_ 4. Finally, in three addi t ional myocytes in which the value o f n was de t e rmined at both HP = - 7 0 mV and HP = - 1 0 0 mV (12°C; depo la r i z ing pulses + 2 0 to + 5 0 mV), we failed to observe a statistically significant increase in the value of n with hyperpola r iza t ion ; i.e., Cole-Moore shifts were not readily a p p a r e n t over this potent ia l r ange (Cole and Moore, 1960). Al though
CAMPBELL ET AL. lto in Ferret Right Ventricle 587
Cole -Moore shifts may be p resen t for/ to, such shifts at very negat ive potent ia ls violate the assumpt ions of our analysis (Append ix I). Fu r the rmore , the t ransi t ions under ly- ing such shifts may be too r ap id to resolve and may be occurr ing before the es tab l i shment of vol tage c lamp control .
Based on this statistical analysis, and for mode l ing purposes , the in teger value of n was therefore f ixed at n = 3. Currents at bo th 12 and 22°C were then refit with Eq. 1 to ext rac t the best-fit values of the activation ra te constants. Fig. 12, C and D, shows
A B 1000 12°C, variable n
. . . . +70 " n = 3.20
- + 4 0 ~ n = 2.80
0 o is s'0
C D 1000- 12°c, f ixed n = 3 - . "- 470
<~ 500 / / +40
0 ~ +20
0 2'5 5'0 (t - tgox) ms
<~ soo
12°C, variable n
o ~6o 14'oo
0 700 1400 (t - t9o x) ms
FIGURE 12. Determination of the mean value of the activation power, n, at 12°C. A and B show representative /to recordings elicited at +20, +40, and +70 mV at 12°C (noisy traces) overlayed with computer fits to Eq. 1, where the value of n was allowed to vary freely (see Methods). Capacitive transients have been subtracted using the protocol described in the text. A shows the first 20 ms of the traces, while B shows the entire time course of the fit to the same traces so as to illustrate inactivation. Note that in accordance with the 90% rise time criterion, the time scale is given as t - t90%. The best-fit n values obtained at each potential for this particular myocyte are indicated in A next to each/to trace. Also note from B that the kinetics of /to inactivation are greatly slowed down compared with those observed at 22°C (see Fig. 14). C and D show the same/to recordings and computer fits to them after fixing the value of n = 3.
such an analysis conduc ted on the cur ren t record ings at 12°C i l lustrated in Fig. 12, A and B. Fixing the value of n -- 3 gives fits that are virtually indis t inguishable f rom those where n was allowed to vary freely. Kinetic analysis using n = 3 also p r o d u c e d a s igmoid delay in activation, which was consis tent wi th / to record ings ob ta ined at 22°C (Fig. 13).
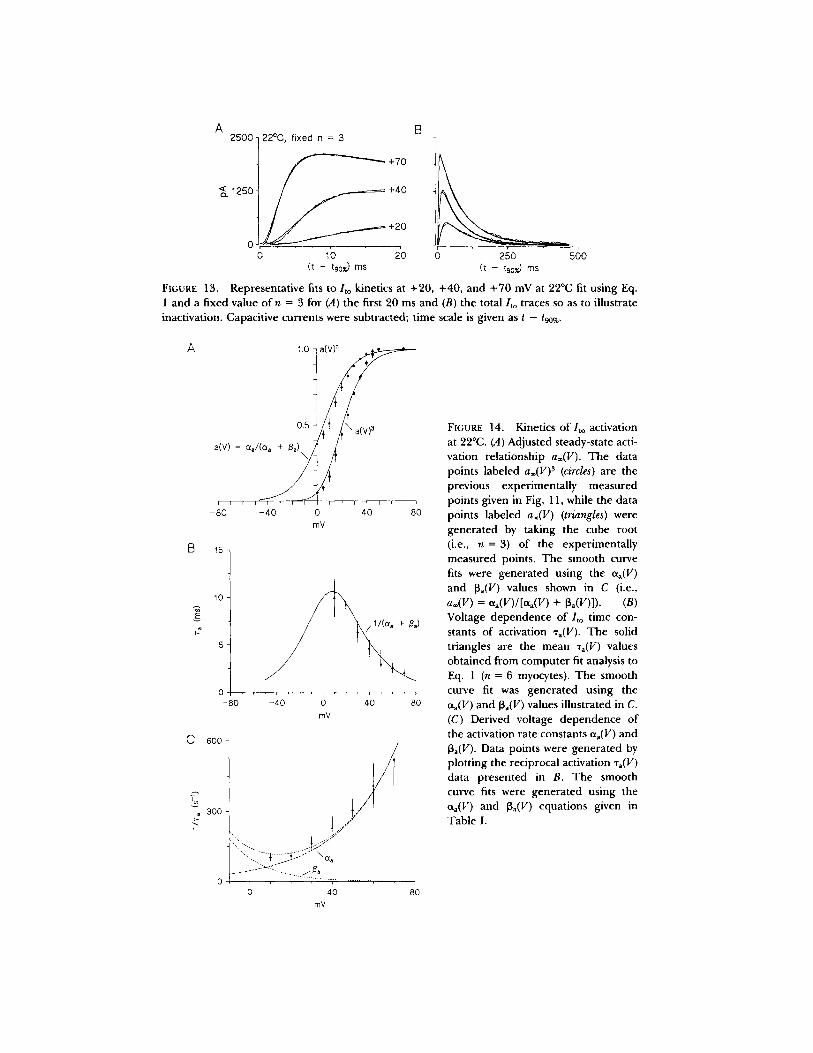
Summary of Ito activation kinetics. Fig. 14A shows the previous steady-state activation re la t ion (Fig. 11) and the ad jus ted activation re la t ionship for n = 3 for a
A 2500
~25o
FIGURE 13.
22°C, fixed n = 3
~ +70
+40
+20
0 10 20 (t - tg0x) ms
B
o z~o 560 (t - tgox) ms
Representative fits to/to kinetics at +20, +40, and +70 mV at 22°C fit using Eq. 1 and a fixed value o f n = 3 for (A) the first 20 ms and (B) the total/to traces so as to illustrate inactivation. Capacitive currents were subtracted; time scale is given as t - t90~.
A
B
C
1.0 I a(
= a . / 4 / { ( a ~ + ~,)0'5 /T ~ / { 1 i'v' 22 . . . .
-80 -40 0 40 80 mV
15~
10 ¸
5
600
® 300
0 -80 -40 0 40 80
mV
/
..... tj ljj/tl
o 4o mv
8'0
FIGURE 14. Kinetics of/to activation at 22°C. (A) Adjusted steady-state acti- vation relationship a®(V). The data points labeled a®(V) 3 (circles) are the previous experimentally measured points given in Fig. 11, while the data points labeled a®(V) (triangles) were generated by taking the cube root (i.e., n = 3) of the experimentally measured points. The smooth curve fits were generated using the eq(V) and 13a(V) values shown in C (i.e., a®(V) = e~a(V)/[t~(V) + [3a(V)]). (B) Voltage dependence of ]to time con- stants of activation %(V). The solid triangles are the mean %(V) values obtained from computer fit analysis to Eq. 1 (n = 6 myocytes). The smooth curve fit was generated using the aa(V) and 13a(V) values illustrated in C. (C) Derived voltage dependence of the activation rate constants eta(V) and 13a(V). Data points were generated by plotting the reciprocal activation %(V) data presented in B. The smooth curve fits were generated using the aa(V) and 13~(V) equations given in Table I.
CAMPBELL ET AL. lto in Ferret Right Ventricle 589
s ingle g a t i n g var iab le a. T h e ad ju s t ed r e l a t i onsh ip displays a c o n v e n t i o n a l s i gmo id
s h a p e a n d a ha l f -ac t iva t ion p o t e n t i a l o f Vh = + 10 mV. T h e p o t e n t i a l d e p e n d e n c e
(+ 10 to + 70 mV) o f the m e a n best-f i t t ime cons tan t s o f ac t iva t ion o b t a i n e d at 22°C is
g iven in Fig. 14 B. T h e va lues o f Ta(V) d e p e n d systemical ly on m e m b r a n e po ten t i a l ,
d e c r e a s i n g with i nc r ea s ing d e p o l a r i z a t i o n ( range: 9.9 + 2.1 ms at + 1 0 mV to
1.9 -+ 0.4 ms at + 7 0 mV). E q u a t i o n s for the ra te cons tan t s Cxa(V) and [3a(V) (Fig.
14 C) a re g iven in T a b l e I.
Tempera ture dependence of l to gat ing. T h e t e m p e r a t u r e d e p e n d e n c e o f t he d e r i v e d
fully ac t iva ted I - V r e l a t ion a n d the m e a n ra te cons tan t s o f ac t iva t ion a n d inac t iva t ion
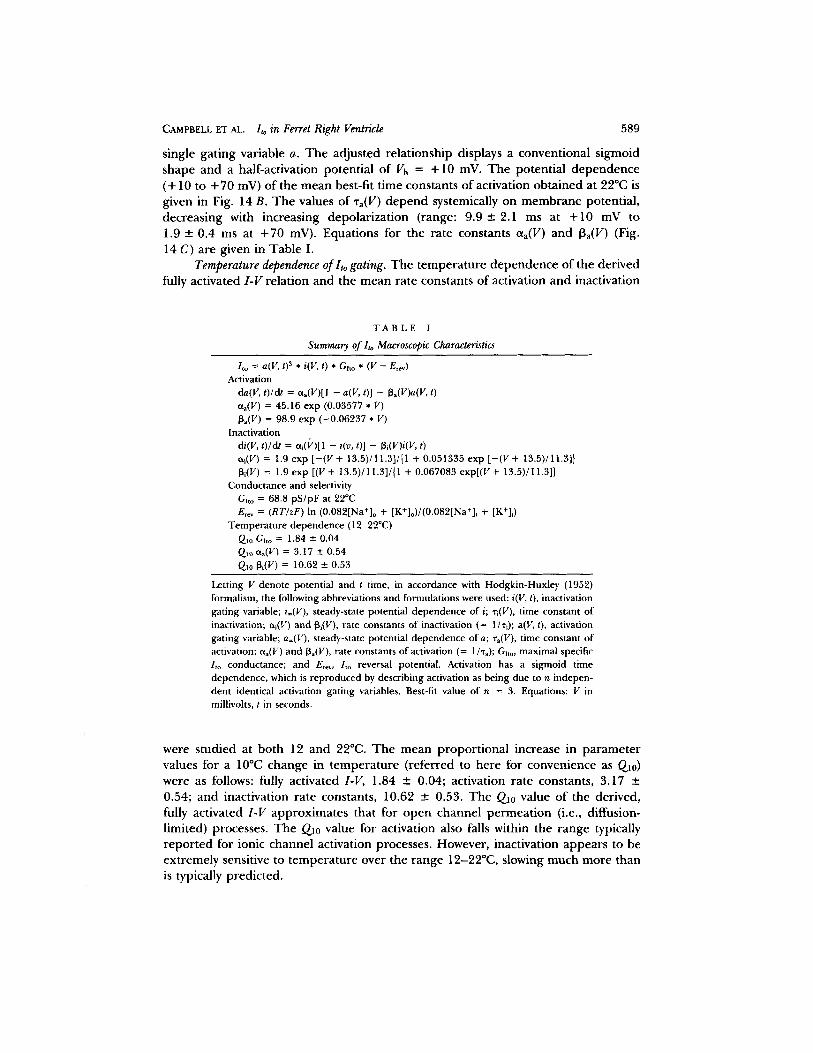
T A B L E I
Summary of 1to Macroscopic Characteristics
/to = a(V, t) ~ * i(V, t) * Gito * (V - E~v) Activation
da(V, t)/dt = e~(V)[I - a(V, t)] - ~a(V)a(V, t) aa(V) = 45.16 exp (0.03577 * V) l~a(V) = 98.9 exp (--0.06237 * V)
Inactivation di(V, t)/dt = eq(I~')[1 - i(v, t)] - [3~(V)i(V, t) ct~(V) = 1.9 exp [ - (V+ 13.5)/11.3]/{1 + 0.051335 exp [ - (V+ 13.5)/11.3]} [3~(V) = 1.9 exp [(V + 13.5)/11.3]/{I + 0.067083 exp[(V + 13.5)/I 1.3]}
Conductance and selectivity Glto = 68.8 pS/pF at 22°C Er~ = (RT/zF) In (0.082[Na+]o + [K+]o)/(0.082[Na+]i + [K+]i)
Temperature dependence (12-22°C) Qi0 Gho = 1.84 -- 0.04 Q~o%(V) = 3.17 +- 0.54 Qi013i(V) = 10.62 - 0.53
Letting V denote potential and t time, in accordance with Hodgkin-Hux|ey (1952) formalism, the following abbreviations and formulations were used: i(V, t), inactivation gating variable; i®(V), steady-state potential dependence of i; ~'i(V), time constant of inactivation; cq(V) and [3i(V), rate constants of inactivation (= l/"ri); a(V, t), activation gating variable; a=(V), steady-state potential dependence of a; "ra(V), time constant of activation; eta(V) and 13a(V), rate constants of activation (= 1/%); Glto, maximal specific /to conductance; and Er~, I,o reversal potential. Activation has a sigmoid time dependence, which is reproduced by describing activation as being due to n indepen- dent identical activation gating variables. Best-fit value of n = 3. Equations: V in millivolts, t in seconds.
were s tud ied at b o t h 12 a n d 22°C. T h e m e a n p r o p o r t i o n a l inc rease in p a r a m e t e r
va lues for a 10°C c h a n g e in t e m p e r a t u r e ( r e f e r r ed to h e r e for c o n v e n i e n c e as Qlo) were as follows: fully ac t iva ted I -V, 1.84 - 0.04; ac t iva t ion ra te constants , 3 .17 _+
0.54; a n d inac t iva t ion r a t e cons tan ts , 10.62 --- 0.53. T h e Q10 va lue o f the de r ived ,
fully ac t iva ted I - V a p p r o x i m a t e s tha t for o p e n c h a n n e l p e r m e a t i o n (i.e., d i f fus ion-
l imi ted) processes . T h e Q10 va lue for ac t iva t ion also falls wi th in t he r a n g e typically
r e p o r t e d for ionic c h a n n e l ac t iva t ion processes . Howeve r , inac t iva t ion a p p e a r s to be
e x t r e m e l y sensi t ive to t e m p e r a t u r e o v e r the r a n g e 12-22°C, s lowing m u c h m o r e t h a n
is typically p r ed i c t ed .
590 THE JOURNAL OF GENERAL PHYSIOLOGY • VOLUME 1 0 1 • 1 9 9 3
D I S C U S S I O N
/to has been observed in mammalian cardiac myocytes enzymatically isolated from multiple regions of the heart, including crista terminalis (rabbit: Giles and van Ginneken, 1985), atrium (rabbit: Clark et al., 1988; Giles and Imaizumi, 1988; human: Escande et al., 1987; Shibata, Drury, Refsum, Aldrete, and Giles, 1989; see Sorota and Boyden, 1991), AV node (rabbit: Nakayama and Irisawa, 1985; see Billette and Giles, 1991), Purkinje fibers (sheep, cow: Callewaert et al., 1986; dog: Binah, 1990; Dangman, 1991), ventricle (mouse: Bendorf, 1988; rabbit: Hiraoka and Kawano, 1989; rat: Josephson, Sanchez-Chapula, and Brown, 1984; Apkon and Nerbonne, 1991; dog: Tseng and Hoffman, 1989; cat: Wasserstrom and Ten Eick, 1991), and possibly primary pacemaking cells of the sinoatrial node (rabbit: Nathan, 1986; Brown, Campbell, Clark, and Denyer, 1987; Denyer and Brown, 1990; see Campbell, Rasmusson, and Strauss, I991c, 1992). One notable exception appears to be guinea pig ventricle, where/to is either absent or relatively small (e.g., Hume et al., 1990). With the possible exception of guinea pig,/to appears to be a nearly universal K + current system in mammalian myocardial tissue.
Our results demonstrate an /to in ferret right ventricular myocytes. Under our recording conditions Ito is composed of a single K+-selective current component whose activation is a conventional voltage-dependent process that does not depend on the influx of either Na + or Ca 2+. Therefore, the Ito that we have isolated and characterized is of the Ca2+-insensitive Ito,1 type (see Binah, 1990; Gintant et al., 1991). However, we cannot rule out the possibility that under more physiological conditions Na + and/or Ca 2+ influx could modulate Ito,1 o r that Na + and/or C a 2+ influx could activate additional currents (e.g., a Ca2+-activated Ito,2). The properties of the calcium-insensitive Ito, I in other cardiac myocyte types will be discussed and compared with our results. For convenience, Itol will be referred to simply as Ito.
Ionic Selectivity Characteristics of I to
The ionic selectivity of/to in ferret right ventricular myocytes is consistent with recent studies on isolated rabbit and dog myocytes in demonstrating that/to is a K + current (e.g., Giles and van Ginneken, 1985; Nakyama and Irisawa, 1985; Clark et al., 1988; Giles and Imaizumi, 1988; Hiraoka and Kawano, 1989; Tseng and Hoffman, 1989). Our derived PNa/PK ---- 0.082 is lower than previously reported for/to in other isolated mammalian cardiac myocyte types (0.11-0.26), but is similar to PNa/PK values of many K + channel types (see Hille, 1992).
Single-Channel Studies
Reports of single-channel properties of / to in cardiac muscle are somewhat limited and variable. Single /to channel conductances measured in the cell-attached mode ( l e t t ing [K]p denote the concentration of K + in the patch pipette) of 14 pS (rabbit atrium, [K]p = 5 mM: Clark et al., 1988) and 19.9 pS (rabbit AV node, [K]p = 5.4 mM: Nakayama and Irisawa, 1985) have been reported. In mouse ventricular myocytes both a 27-pS and a 5-pS channel have been reported ([K]p = 5.4 mM: Bendorf, 1988). The apparent unitary conductance that we have recorded in ferret rigbt ventricular myocytes (~ 4-7 pS, [K]p = 5.4 mM; n = 3) is thus in the lower
CAMPBELL ET AL. Ito in Ferret Right Ventricle 591
range of cardiac K + channel conductances. It is probable that some of the observed differences in conductance are due to experimental factors, such as the concentra- tions of cations in the patch pipette (K +, Na +, Ca 2+, Mg2+). However, it also possible that in different species different K + channel types underlie the cardiac transient outward current or that different regions of the heart possess different Ito channel subtypes. On the basis of conductance, one could speculate that the larger conduc- tance channels observed in rabbit atrium and AV node may be more similar to Drosophila myotube Al-type K + channels (conductances in the range of 12-16 pS, [K]p = 2 mM; e.g., Zagotta, Brainard, and Aldrich, 1988), while the lower conduc- tance channels (mouse, ferret) may be more similar to Drosophila neuronal A2-type K + channels (conductances in the range of 5-8 pS, [Kip = 2 raM; e.g., Solc, Zagotta, and Aldrich, 1987; Zagotta et al., 1988). We hope that these issues will be resolved as the molecular structure of various cardiac K + channels is elucidated.
Our analysis of single-channel gating characteristics is somewhat limited by the difficulties associated with measuring /to channel activity using the cell-attached configuration, our inability to obtain patches containing only a single/to channel, the relatively small size of the unitary conductance, and the very rapid flickering behavior displayed by the channels. Nonetheless, the ensemble averages have confirmed that the observed time course of macroscopic current inactivation could be accounted for at the single-channel level by a single-exponential, voltage-insensitive process. The flickering nature of the single-channel events, which appears to be a poorly resolved bursting behavior, may indicate that the channel open state may itself be a complex aggregation of very short-lived states (e.g., bursts) or subconductance levels. None- theless, the existence of these potential complexities does not seem to affect the overall exponential decay of the current. This is in contrast to the findings in rabbit atrial myocytes by Clark et al. (1988), who reported that the mean averaged /to determined from summed single-channel records inactivated as a double exponen- tial, as did the whole cell/to.
Kinetics of Ito: Inactivation~Recovery
Inactivation of/to in ferret right ventricular myocytes is well described as a first-order process. The half-inactivation potential (V1/2 = -13 .5 mV) is more depolarized than that reported for several cardiac cell types; however, it is essentially identical to that reported for / to in isolated human atrial myocytes (Vii2 = - 1 4 mV; Shibata et al., 1989). Consistent with our observations, time constants of recovery from inactivation in other cardiac preparations generally appear to decrease with increasing hyperpo- larization (e.g., Giles and van Ginneken, 1985; Shibata et al., 1989; Tseng and Hoffman, 1989; Binah, 1990; Gintant et al., 1991). In particular, the inactivation/ recovery kinetics that we have recorded are very similar to those previously reported for /to in human atrial myocytes (Shibata et al., 1989). However, they differ qualitatively from the double-exponential inactivation kinetics reported for rabbit atrial (Clark et al., 1988; Giles and Imaizumi, 1988) and rat ventricular myocytes (Castle, 1992). Therefore, ferret ventricular/to may more closely approximate the time- and voltage-dependent characteristics of human/to than many other commonly studied mammalian cardiac myocytes.
592 T H E J O U R N A L O F G E N E R A L P H Y S I O L O G Y • V O L U M E 101 • 1 9 9 3
Kinetics of Ito: Activation
In isolated mammalian cardiac myocytes it appears that only one other study has at tempted to evaluate the activation power, n, of / to : in rabbit crista terminalis myocytes, activation of/to at 20-21 °C was reported to be a monoexponential process, implying n = 1 (Giles and van Ginneken, 1985). Apkon and Nerbonne (1991) have also analyzed activation o f / to in rat ventricular myocytes as a single exponential process. In contrast, activation of/ to in ferret right ventricular myocytes is distinctly nonexponential and shows a sigmoid onset. Even at 22°C, in unsubtracted records, sigmoid onset of current activation was often readily apparent in the range of potentials + 10 to +30 mV. Scaled capacitive transient subtraction made this sigmoid onset apparent at most potentials. Our analysis of the sigmoidicity of / to activation required curve fitting of data obtained at 12°C. Thus, while the characterization of n at 12°C is entirely consistent with records obtained at 22°C (compare Figs. 12 and 13), we are unable to verify this assumption directly.
It is of interest to compare the activation process of the ferret ventricular /to channel that we have analyzed with the recent measurements of Zagotta and Aldrich (1990) on Shaker Al-type K + channels in cultured embryonic Drosophila myotubes. While the activation/inactivation sequence of the Shaker Al-type channel appears to be more rapid at 22°C than ferret ventricular /to, there are important qualitative similarities as well as differences in behavior between the two channel types. For example, the voltage-dependent term in the exponential portion of the activation gating variable equations are very similar (ferret right ventricle: eta = 45.2 exp [0.036 * V], [~a = 91.8[-0.062 * V]; Shaker: eta = 700 exp [0.037 * V], 13a = 287 exp [ -0 .056 * V]). This implies that the amount of charge moved per putative activation gating particle is very similar (Qfe~et = 2.5; Qs~ke~ = 2.3). However, despite this apparent similarity, our measurements indicate that the total gating charge moved per channel for ferret/to can be calculated to be ,-, 7.5, while that for Shaker A1 can be calculated to be ~9 . (It should be noted that Zagotta and Aldrich [1990] rounded the total charge per gating particle down to 2, and thus calculated a total charge movement per channel of 8.) Thus, the difference in estimated total gating charge movement per channel may be difficult to distinguish between the two channel types considering the level of confidence inherent in the estimation of Q.
Recent advances in the studies of K + channels have revealed that the functional channel appears to be a tetramer (e.g., MacKinnon, 1991; reviewed in Miller, 1991; Jan and Jan, 1992). Given the original n 4 model of Hodgkin and Huxley (1952) for the delayed rectifier K + current of squid giant axon and the underlying assumption that there are four independent gating particles that must activate before the channel opens, it is tempting to generalize that the activation power n should be equal to 4 in all K + channel types. In this regard, other investigators have found that a value of n = 4 is consistent with the sigmoidicity of activation observed for a variety of K ÷ channels (e.g., squid axon: Hodgkin and Huxley, 1952; rat brain [RCK1] and muscle [RMK1]: Koren, Liman, Logothetis, Nadal-Ginard, and Hess, 1990; rat type II alveolar epithelial cells: DeCoursey, 1990; Shaker myotubes [As type]: Zagotta and Aldrich, 1990). However, in a variety of cardiac cell types the reported best-fit activation power of various K + channel types is typically in the range o f n = 1-2 (e.g.,
CAMPBELL ET AL. Ito in Ferret Right Ventricle 593
Hume et al., 1986; Pennefather and Cohen, 1990; Gintant et al., 1991). Our determination of n = 3 is larger than previous estimates of n for other cardiac K + channel types, and is more consistent with the higher n values observed for K + channels in noncardiac tissues.
Our analytically derived mean value of n = 3 should not be interpreted as being fundamentally inconsistent with an assumed tetrameric structure of the ferret right ventricular/to channel. Rather, we suggest that our data are inconsistent with the assumption of four independent processes in the activation sequence; i.e., our findings are not consistent with activation proceeding through four identical, inde- pendent, exponentially distributed processes in the activation pathway (see Vanden- berg and Bezanilla [1991] for a discussion of these issues for squid axon Na + channels). In this sense, our data are consistent with recent gating current measure- ments of Drosophila wild-type Shaker channels expressed in Xenopus oocytes (Bezanil- la, Perozo, Papazian, and Stefani, 1991). These gating current measurements clearly indicate that even though Shaker K ÷ channels may be composed of four identical subunits, the transitions between the closed states are not equivalent. In summary, there is probably not a simple relationship between the putative number of channel subunits and the number of independent states and rate constants required to model kinetically sigmoid activation of / to (see also Solc and Aldrich, 1990; Zagotta and Aldrich, 1990; Bezanilla et al., 1991).
Potential Physiological Implications
The activation and inactivation kinetics that we have characterized (summarized in Table I) are appropriate for /to to be importantly involved in generation and modulation of early phase 1 repolarization, the action potential plateau, and the early phases of action potential repolarization (cf. Giles and van Ginneken, 1985; Clark et al., 1988; Apkon and Nerbonne, 1991). Therefore, due to its overlap with the large and rapidly activating L-type calcium current, Ica,L, present in these myocytes (Qu, Campbell, Whorton, and Strauss, 1991; and Qu, Campbell, Himmel, and Strauss, 1992), it is possible that neuromodulation of ~to (e.g., Apkon and Nerbonne, 1988; Braun, Fedida, Clark, and Giles, 1990; Fedida, Shimoni, and Giles, 1990) could have important effects on the excitation--contraction coupling process independent of any such effects on ICa, L. Extrapolation of our measurements to in vivo neuromodulatory situations must take into account possible problems associated with cell perfusion; nonetheless, our data suggest that basal/to has not been modified by intracellular perfusion.
Frequency-dependent modulation of / to could also contribute to action potential configuration changes with alterations in heartbeat (Binah, 1990). However, due to its relatively rapid recovery kinetics,/to in ferret right ventricle would have a much less pronounced effect on frequency-dependent action potential configuration changes than would the much more slowly recovering/to observed in some other species (e.g., rabbit atrium: Clark et al., 1988; Giles and Imaizumi, 1988). In addition, applying protocols similar to those described by Clark et al. (1988), we did not observe the phenomenon of cumulative inactivation (Qu, Y., and D. L. Campbell, unpublished observations), a property displayed by/to in rabbit atrium (Clark et al., 1988; cf. Aldrich, 1981; DeCoursey, 1990). Finally, the large apparent Q10 of
594 T H E J O U R N A L OF GENERAL PHYSIOLOGY • VOLUME 101 - 1 9 9 3
inactivation (10.62, 12-22°C) would suggest that the influence of/to in later stages of repolarization may depend critically on the preparation temperature. This may be one basis for the wide variability in reported characteristics of/to in different cardiac myocytes.
In conclusion, our data demonstrate the presence of a K+-selective, Ca2+-indepen- dent/ to in ferret right ventricular myocytes with kinetics that are appropriate for it to be importantly involved in modulation of phase 1 and later phases of action potential repolarization. Our measurements indicate that (a) activation of Ito occurs with a sigmoid delay, therefore implying the presence of multiple closed states, (b) inactiva- tion occurs as a monoexponential process and is complete at depolarized potentials, and (c) the channel can proceed to the closed-inactivated state without first entering the open-conducting state, ruling out a strictly coupled inactivation model (cf. DeCoursey, 1990; Patlak, 1991; Hille, 1992). The Hodgkin-Huxley-type a3i model developed from our analysis (Table I) can successfully reproduce the macroscopic behavior of ferret right ventricular/to. However, because Hodgkin-Huxley formalism has been questioned as an accurate biophysical descriptor of channel gating behavior, in Appendix I we present alternative formulations of three different kinetic models as a possible framework for describing/to gating behavior.
A P P E N D I X I : P O S S I B L E K I N E T I C M O D E L S O F
/ t o C H A N N E L I N A C T I V A T I O N
Model 1: Hodgkin-Huxley Type
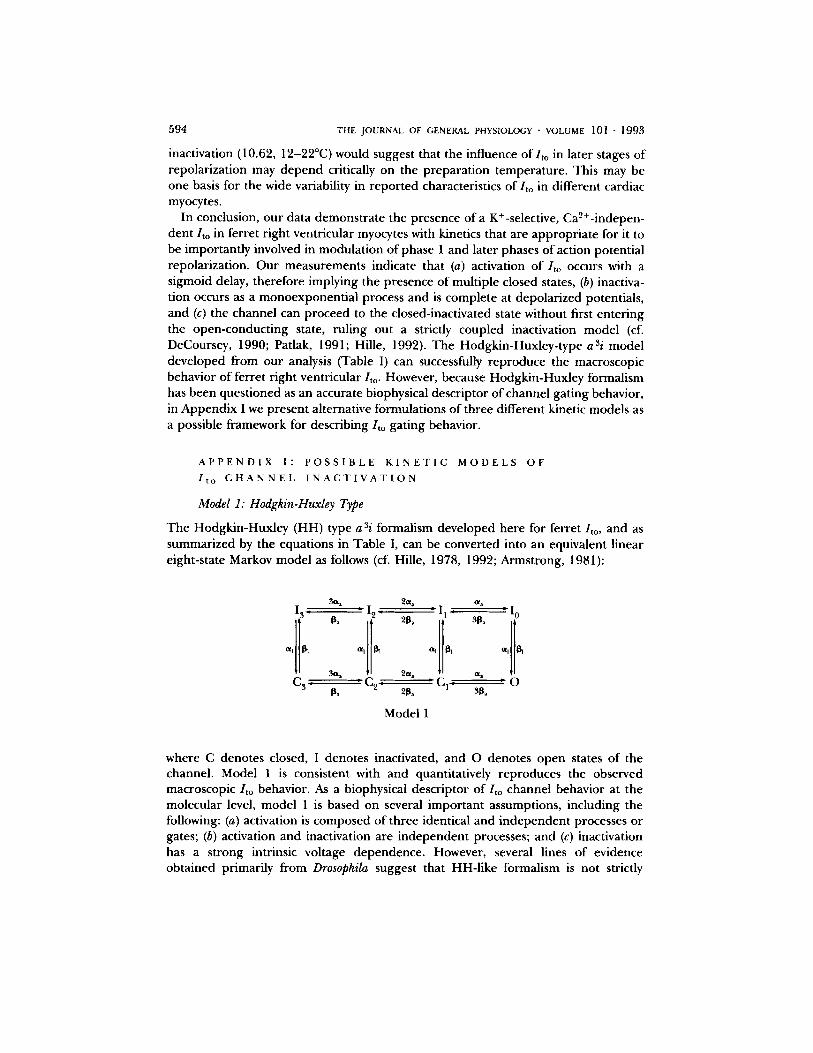
The Hodgkin-Huxley (HH) type a 5i formalism developed here for ferret/to, and as summarized by the equations in Table I, can be converted into an equivalent linear eight-state Markov model as follows (cf. Hille, 1978, 1992; Armstrong, 1981):
3a . 2~ a
13 , 12 - I 1 • • I 0
tILl ~1 ~]~l 1~1 ~1 ~l {3111 ~1
3et a 2 a a aa C 3 , ~ C~. " C 1 • " O
13 a 213 a 31~
Model 1
where C denotes closed, I denotes inactivated, and O denotes open states of the channel. Model 1 is consistent with and quantitatively reproduces the observed macroscopic/to behavior. As a biophysical descriptor of/ to channel behavior at the molecular level, model 1 is based on several important assumptions, including the following: (a) activation is composed of three identical and independent processes or gates; (b) activation and inactivation are independent processes; and (c) inactivation has a strong intrinsic voltage dependence. However, several lines of evidence obtained primarily from Drosophila suggest that HH-like formalism is not strictly
CAMPBELL ET AL. Ito in Ferret Right Ventricle 595
applicable at the molecular level for inactivating K + currents (Solc and Aldrich, 1990; Hoshi, Zagotta, and Aldrich, 1990; for review see Miller, 1991; Jan and Jan, 1992; Zagotta and Aldrich, 1990; Zagotta, Hoshi, and Aldrich, 1990; Bezanilla et al., 1991).
Model 2
Zagotta and Aldrich (1990) have presented a model of the rapidly inactivating Shaker
Az-type channel in cultured embryonic Drosophila myotubes which differs from the HH-type model 1 of cardiac /to in the following respects: (a) voltage-dependent activation is sigmoid and consists of a series of four steps corresponding to four identical, independent subunits; (b) the open state is a bursting state; and (c) rapid inactivation is partially coupled to activation and has no intrinsic voltage depen- dence.
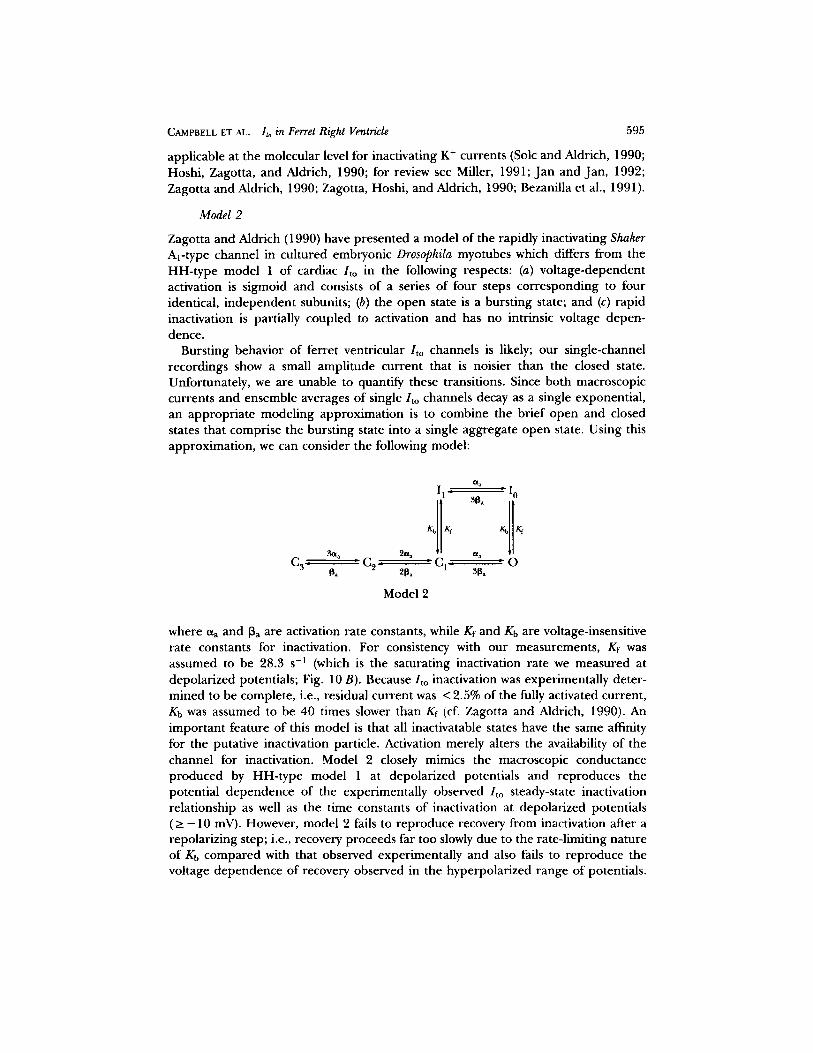
Bursting behavior of ferret ventricular /to channels is likely; our single-channel recordings show a small amplitude current that is noisier than the closed state. Unfortunately, we are unable to quantify these transitions. Since both macroscopic currents and ensemble averages of single/to channels decay as a single exponential, an appropriate modeling approximation is to combine the brief open and closed states that comprise the bursting state into a single aggregate open state. Using this approximation, we can consider the following model:
3~x a
C 3 , C 2
~a 11 • I 0
2~a •a ' C 1 ' O
3[~ ~ 2[~
Model 2
where CXa and [3 a a r e activation rate constants, while Kf and Kb are voltage-insensitive rate constants for inactivation. For consistency with our measurements, Kf was assumed to be 28.3 s -1 (which is the saturating inactivation rate we measured at depolarized potentials; Fig. 10 B). Because/to inactivation was experimentally deter- mined to be complete, i.e., residual current was < 2.5% of the fully activated current, Kb was assumed to be 40 times slower than Kf (cf. Zagotta and Aldrich, 1990). An important feature of this model is that all inactivatable states have the same affinity for the putative inactivation particle. Activation merely alters the availability of the channel for inactivation. Model 2 closely mimics the macroscopic conductance produced by HH-type model 1 at depolarized potentials and reproduces the potential dependence of the experimentally observed / t o steady-state inactivation relationship as well as the time constants of inactivation at depolarized potentials (>_- 10 mV). However, model 2 fails to reproduce recovery from inactivation after a repolarizing step; i.e., recovery proceeds far too slowly due to the rate-limiting nature of Kb compared with that observed experimentally and also fails to reproduce the voltage dependence of recovery observed in the hyperpolarized range of potentials.
596 THE JOURNAL OF GENERAL PHYSIOLOGY • VOLUME 1 0 1 • 1 9 9 3
Model 3
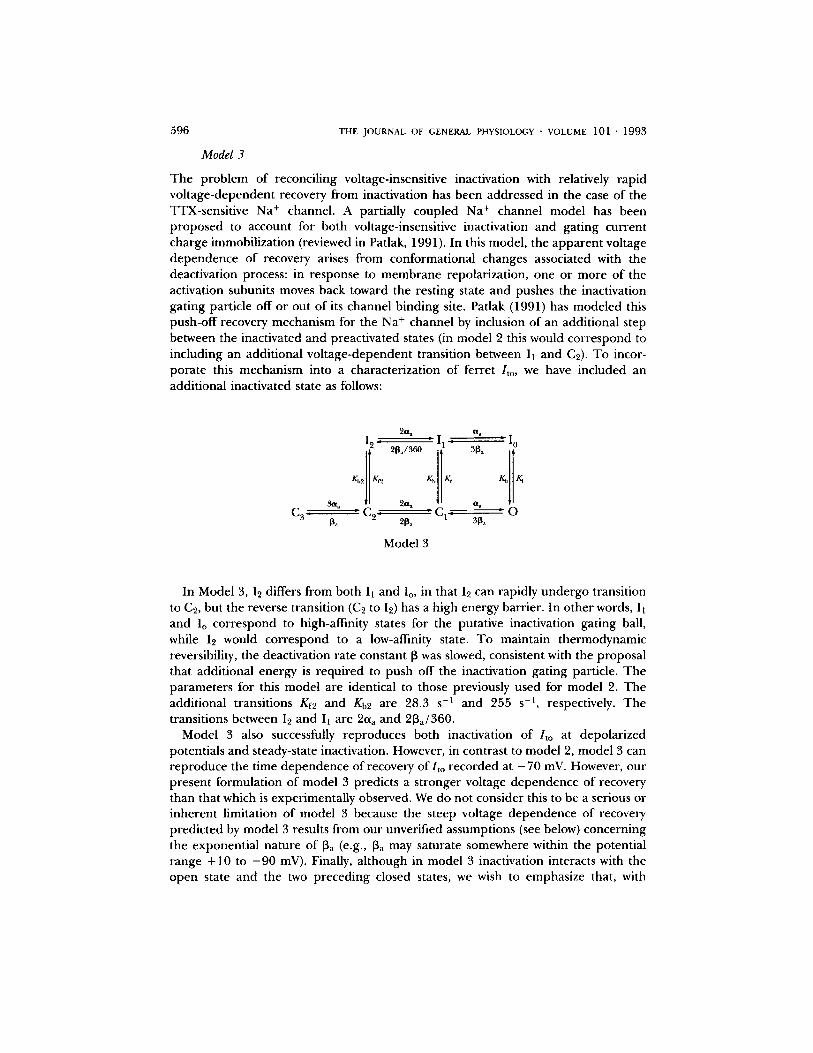
The problem of reconciling voltage-insensitive inactivation with relatively rapid voltage-dependent recovery from inactivation has been addressed in the case of the TFX-sensitive Na + channel. A partially coupled Na + channel model has been proposed to account for both voltage-insensitive inactivation and gating current charge immobilization (reviewed in Patlak, 1991). In this model, the apparent voltage dependence of recovery arises from conformational changes associated with the deactivation process: in response to membrane repolarization, one or more of the activation subunits moves back toward the resting state and pushes the inactivation gating particle off or out of its channel binding site. Patlak (1991) has modeled this push-off recovery mechanism for the Na + channel by inclusion of an additional step between the inactivated and preactivated states (in model 2 this would correspond to including an additional voltage-dependent transition between I1 and C2). To incor- porate this mechanism into a characterization of ferret /to, we have included an additional inactivated state as follows:
~ a
C3
2~t a a a 12 • ' I~, " I 0
2aa aa ~" • C 1 O C 2 2[~a 3~a
Model 3
In Model 3, 12 differs from both I1 and Io, in that I2 can rapidly undergo transition to C2, but the reverse transition (C2 to I2) has a high energy barrier. In other words, Ii and Io correspond to high-affinity states for the putative inactivation gating ball, while I2 would correspond to a low-affinity state. To maintain thermodynamic reversibility, the deactivation rate constant 13 was slowed, consistent with the proposal that additional energy is required to push off the inactivation gating particle. The parameters for this model are identical to those previously used for model 2. The additional transitions Kf2 and Kb2 are 28.3 s -1 and 255 s -l , respectively. The transitions between 12 and 11 are 2Cta and 213a/360.
Model 3 also successfully reproduces both inactivation of /to at depolarized potentials and steady-state inactivation. However, in contrast to model 2, model 3 can reproduce the time dependence of recovery of/to recorded at - 7 0 mV. However, our present formulation of model 3 predicts a stronger voltage dependence of recovery than that which is experimentally observed. We do not consider this to be a serious or inherent limitation of model 3 because the steep voltage dependence of recovery predicted by model 3 results from our unverified assumptions (see below) concerning the exponential nature of 13a (e.g., 13a may saturate somewhere within the potential range + 10 to - 9 0 mV). Finally, although in model 3 inactivation interacts with the open state and the two preceding closed states, we wish to emphasize that, with
CAMPBELL I~T ~ . Ito in Ferret Right Ventricle 597
appropriate values of et, 13, kf, and kb, interaction with one, two, or three preceding closed states is possible. Ultimately, the distinction between such models must rely on gating current measurements.
A P P E N D I X I I : S O U R C E S OF BIAS AND U N C E R T A I N T Y IN ANALYSIS OF A C T I V A T I O N
Because the degree of completeness of inactivation was a possible source of systematic bias in our parameter estimation routines, fixed n = 3/to waveforms were simulated using model 3, which produces incomplete inactivation ranging between 12% at 0 mV and 2.9% at +50 mV (expressed as a percentage of peak/to). These values compare well with the residual current measured from single-channel ensem- ble averages (6.8% of peak at the threshold of activation to 3.0% at approximately +50 mV depolarized from threshold). Incomplete inactivation caused a slight systematic overestimation o fn from 10% at + 10 mV to 2% at +70 mV. This error was in the wrong direction to effect rejection ofn -- 4 and was not of sufficient magnitude to alter rejection of n = 2.
To evaluate the 90% rise time criterion, we simulated/to using an HH-type model (model 1) with a fixed activation power of n -- 3. Simulated fixed n = 3/to waveforms were generated in response to simulated voltage clamp pulses (HP = - 7 0 mV, Vpuls~ = + 10 to +70 mV) having an exponential rise time ('r -- 1.4 ms) and analyzed using our standard fitting procedures. Application of the 90% criterion caused a slight underestimation of the actual value of n = 3 by no more than 5%, with values ranging from n = 2.84 at +10 mV to n = 2.89 at +70 mV. In contrast, using the immediate onset of the clamp pulse (i.e., actual t = 0 ms) caused an overestimation of the value of n by up to 100%. These simulations suggest that the 90% rise time criterion accurately estimates a value for n, subject to the assumptions of independent and identical gating particles. Fitting/to current traces to actual voltage clamp pulse time zero could lead to a serious overestimation of the value of n.
Complete kinetic analysis of activation entails measurement of the kinetics of deactivation (i.e., the time constants of tail currents). /to tail currents could be observed in the range 0 to - 9 0 mV (e.g., for Erev measurements), but hyperpolarized to - 4 0 mV tail currents were both small (due to proximity to Er~v) and rapid (i.e., hard to separate from the capacitive transient). This precluded quantitative analysis of deactivation kinetics in the range of - 4 0 to - 9 0 inV. Unfortunately, in the range where tail currents were better separated from the capacitive transient (- '40 to 0 mV), the activation variable a does not assume a zero value. For the HH-like a3i formulation developed, the tail currents in this range should be composed of at least three closely spaced time constants (~, T/2, ~/3; for details, see Hille, 1992). We had little confidence in the ability of numerical fitting procedures to reliably separate and quantitate these components. We therefore assumed that ~a and ~a were exponen- tially dependent on membrane potential (cf. Solc and Aldrich, 1990; Zagotta and Aldrich, 1990).
We wish to acknowledge the technical assistance of Ms. Anne Crews, Ms. Heather McCaslin, and Ms. Steffani Webb.
598 THE JOURNAL OF GENERAL PHYSIOLOGY • VOLUME 101 • 1993
This work was supported in part by grants from the American Heart Association, North Carolina Affiliate (grant NC 91-G-11) to D. L. Campbell, and the National Institutes of Health (grants 19216, 45132, and 17670) to H. C. Strauss.
Original version received 8 November 1991 and accepted version received 1 October 1992.
R E F E R E N C E S
Adams, D. J., S. J. Smith, and S. H. Thompson. 1980. Ionic currents in molluscan soma. Annual Review of Neuroscience. 3:141-167.
Aldrich, R. W. 198t. InactivatiOn of voltage-gated delayed potassium current in molluscan neurons. A
kinetic model. Biophysical Journal. 36:519-532.
Apkon, M., and J. M. Nerbonne. 1988. Alphal-adrenergic agonists selectively suppress voltage-
dependent K + currents in rat ventricular myocytes. Proceedings of the National Academy of Sciences, USA. 85:8756-8760.
Apkon, M., and J. M. Nerbonne. 1991. Characterization of two distinct depolarization-activated K +
currents in isolated adult rat ventricular myocytes. Journal of General Physiology. 97:973-1011.
Armstrong, C. 1981. Sodium channels and gating currents. Physiological Reviews. 61:644--683.
Bendorf, K. 1988. Three types of single K channels contribute to the transient outward current in
myocardial mouse cells. Biomedica et Biochimica Acta. 47:401-416.
Bezanilla, F., E. Perozo, D. M. Papazian, and E. Stefani. 1991. Molecular bases of gating charge
immobilization in Shaker potassium channels. Science. 254:679-683.
Billette, J., and W. R. Giles. 1991. Electrophysiology of the atrioventricular node: conduction,
refractoriness, and ionic currents. In Electrophysiology and Pharmacology of the Heart. K.
Dangrnan and D. Miura, editors. Marcel Dekker, Inc., New York. 141-160.
Binah, O. 1990. The transient outward current in mammalian heart. In Cardiac Electrophysiology: A
Textbook. M. R. Rosen, M. J. Janse, and A. L. Wit, Futura Publishing Company, Inc., Mount Kisco, NY. 93-106.
Braun, A. P., D. Fedida, R. B. Clark, and W. R. Giles. 1990. Intracellular mechanisms for
al-adrenergic regulation of the transient outward current in rabbit atrial myocytes. Journal of Physiology. 431:689-712.
Brown, H. F., D. L. Campbell, R. B. Clark, andJ . C. Denyer. 1987. Isolated sino-atrial node cells of
rabbit: long, thin cells which are calcium-tolerant.Journal of Physiology. 390:60P. (Abstr.) Callewaert, G., J. Vereecke, and E. Carmeliet. 1986. Existence of a calcium-dependent potassium
channel in the membrane of cow cardiac Purkinje cells. Pfl~igers Archiv. 406:424-426. Campbell, D. L., W. R. Giles, K. Robinson, and E. F. Shibata. 1988. Studies of the sodium-calcium
exchanger in bull-frog atrial myocytes.Journal of Physiology. 403:317-340. Campbell, D. L., Y. Qu, R. L. Rasmusson, and H. C. Strauss. 1991a. Properties of a transient outward
K + current in isolated ferret ventricular myocytes. Biophysical Journal. 59:278a. (Abstr.)
Campbell, D. L., Y. Qu, R. L. Rasmusson, and H. C. Strauss. 1991b. The transient outward potassium current in isolated ferret right ventricular myocytes: a quantitative kinetic analysis. Circulation (Suppl. ll) 84:II-103. (Abstr.)
Campbell, D. L., Y. Qu, R. L. Rasmusson, and H. C. Strauss. 1993. The calcium-independent transient outward potassium current in isolated ferret right ventricular myocytes. II. Closed state
reverse use-dependent block by 4-aminopyridine. Journal of General Physiology. 101:603-626. Campbell, D. L., R. L. Rasmusson, and H. C. Strauss. 1991c. Electrophysiology of the sinus node:
ionic and cellular mechanisms underlying primary cardiac pacemaker activity. In Electrophysiology and Pharmacology of the Heart. K. Dangman and D. Miura, editors. Marcel Dekker, Inc., New
York. 59-108.
CAMPBELL ET AL. Ito in Ferret Right Ventricle 599
Campbell, D. L., R. L. Rasmusson, and H. C. Strauss. 1992. Ionic current mechanisms generating vertebrate primary pacemaker activity at the single cell level: an integrative view. Annual Review of Physiology. 54:279-302.
Castle, N. A. 1992. Identification of two distinct K ÷ currents activated by depolarization in rat
ventricular myocytes. Biophysical Journal. 61:A307. (Abstr.) Clark, R. B., W. R. Giles, and Y. Imaizumi. 1988. Properties of the transient outward current in rabbit
atrial cells.Journal of Physiology. 405:147-168. Cole, K. S., and J. w. Moore. 1960. Potassium ion current in the squid giant axon. Dynamic
characteristic. Biophysical Journal. 1:1-14. Connor, J., and C. F. Stevens. 1971. Voltage clamp studies of a transient outward membrane current
in gastropod neural somata. Journal of Physiology. 213:21-30. Dangman, K. 1991. Electrophysiology of the Purkinje fiber. In Electrophysiology and Pharmacology
of the Heart. K. Dangman and D. Miura, editors. Marcel Dekker, Inc., New York. 161-198.
DeCoursey, T. E. 1990. State-dependent inactivation of K ÷ currents in rat type II alveolar epithelial
cells. Journal of General Physiology. 95:617-646.
Denyer, J., and H. F. Brown. 1990. Rabbit sino-atrial node cells: isolation and electrophysiological
properties.Journal of Physiology. 428:405--424. Duchatelle-Gourdon, I., H. C. Hartzell, and A. A. Lagrutta. 1988. Modulation of the delayed rectifier
potassium current in frog cardiomyocytes by I~-adrenergic agonists and magnesium. Journal of Physiology. 415:251-274.
Dukes, I. D., and M. Morad. 1991. The transient K + current in rat ventricular myocytes: evaluation of
its Ca ~+ and Na + dependence.Journal of Physiology. 435:395-420. Escande, D., A. Coulombe, J. F. Faivre, E. Deroubaix, and E. Coraboeuf. 1987. Two types of transient
outward currents in adult human atrial cells. American Journal of Physiology. 252:H 142-H 148.
Fedida, D., Y. Shimoni, and W. R. Giles. 1990. Alpha-adrenergric modulation of the transient
outward current in rabbit atrial myocytes. Journal of Physiology. 423:257-277. Gabella, G. 1978. Inpocketings of the cell membrane (caveolae) in the rat myocardium. Journal of
Ultrastructural Research. 65:135-147.
Giles, W. R., and Y. Imaizumi. 1988. Comparison of potassium currents in rabbit atrial and
ventricular cells. Journal of Physiology. 405:123-145.
Giles, W. R., and A. C. van Ginneken. 1985. A transient outward current in isolated cells from the
crista terminalis of rabbit heart.Journal of Physiology. 368:243-264. Gintant, G. A., I. S. Cohen, N. B. Datyner, and R. P. Kline. 1991. Time-dependent outward currents
in the heart. In The Heart and Cardiovascular System: Scientific Foundations. 2nd ed. H. A.
Fozzard, E. Haber, R. B. Jennings, A. M. Katz, and H. E. Morgan, editors. Raven Press, Ltd., New
York. 1121-1169. Goldman, D. E. 1943. Potential, impedance, and rectification in membranes. Journal of General
Physiology. 27:37-60.
Gotoh, Y., Y. Imaizumi, M. Watanabe, E. F. Shibata, R. B. Clark, and W. R. Giles. 1991. Inhibition of transient outward K + current by DHP Ca 2+ antagonists and agonists in rabbit cardiac myocytes.
American Journal of Physiology. 260:H1737-HI742. Hamill, O. P., A. Marry, E. Neher, B. Sakmann, and F. J. Sigworth. 1981. Improved patch clamp
techniques for high-resolution current recording from cell and cell-free membrane patches.
Pfl~igers Archiv. 391:85-100. Harvey, R. D., and R. E. Ten Eick. 1988. Characterization of the inward-rectifying potassium current
in cat ventricular myocytes. Journal of General Physiology. 91:593-615. Hille, B. 1978. Ionic channels in excitable membranes. Current problems and biophysical ap-
proaches. Biophysical Journal. 22:283-294.
600 THE JOURNAL OF GENERAL PHYSIOLOGY • VOLUME 101 • 1993
Hiile, B. 1992. Ionic Channels of Excitable Membranes. 2nd ed. Sinauer Associates, Inc., Sunderland,
MA. 607 pp.
Hiraoka, M., and S. Kawano. 1989. Calcium-sensitive and insensitive transient outward current in
rabbit ventricular myocytes. Journal of Physiology. 410:187-212.
Hodgkin, A. L., and A. F. Huxley. 1952. A quantitative description of membrane current and its
application to conduction and excitation in nerve.Journal of Physiology. 117:500-544.
Hodgkin, A. L., and B. Katz. 1949. The effect of sodium ions on the electrical activity of the giant
axon of the squid. Journal of Physiology. 108:37-77.
Hondeghem, L. M., and D. J. Snyders. 1990. Class III antiarrhythmic agents have a lot of potential
but a long way to go: reduced effectiveness and dangers of reverse use dependence. Circulation. 81:686-690.
Hoshi, T., W. N. Zagotta, and R. W. Aldrich. 1990. Biophysical and molecular mechanisms of Shaker
potassium channel inactivation. Science. 250:533-538.
Hume, J. R., W. Giles, K. Robinson, E. F. Shibata, R. D. Nathan, K. Kanai, and R. Rasmusson. 1986.
A time- and voltage-dependent K current in single cardiac cells from bullfrog atrium. Journal of General Physiology. 88:777-798.
Hume, J. R., A. Uehara, R. W. Hadley, and R. D. Harvey. 1990. Comparison of K + channels in
mammalian atrial and ventricular myocytes. In Potassium Channels: Basic Function and Therapeu-
tic Aspects. T. J. Colatsky, editor. Alan R. Liss, Inc., New York. 17-41.
Imaizumi, Y., and W. R. Giles. 1987. Quinidine-induced inhibition of transient outward current in
cardiac muscle. American Journal of Physiology. 253:H704-H708.
Jan, L. Y., and Y. N. Jan. 1992. Structural elements involved in specific K + channel functions. Annual Review of Physiology. 54:537-555.
Josephson, I. R., J. Sanchez-Chapula, and A. M. Brown. 1984. Early outward current in rat single
ventricular cells. Circulation Research. 54:157-162.
Koren, G., E. R. Liman, D. E. Logothetis, B. Nadal-Ginard, and P. Hess. 1990. Gating mechanism of
a cloned potassium channel expressed in frog oocytes and mammalian cells. Neuron. 2:39-51.
Lefevre, I., A. Coulombe, and E. Coraboeuf. 1991. The calcium antagonist D600 inhibits calcium-
independent transient outward current in isolated rat ventricular myocytes. Journal of Physiology. 432:65-80.
MacKinnon, R. 1991. Determination of the subunit stoichiometry of a voltage-activated potassium
channel. Nature. 350:232-235.
Marty, A., and E. Neher. 1983. Tight-seal whole-cell recording. In Single-Channel Recording. B.
Sakmann and E. Neher, editor. Plenum Publishing Corp., New York. 107-122.
Miller, C. 1991. 1990: Annus mirabilis of potassium channels. Science. 252:1092-1096.
Nakayama, T., and H. Irisawa. 1985. Transient outward current carried by potassium and sodium in
quiescent atrioventricular node cells of rabbits. Circulation Research. 57:65-73.
Nathan, R. D. 1986. Two electrophysiologically distinct types of cultured pacemaker cells from rabbit
sinoatrial node. American Journal of Physiology. 250:H325-H329.
Neher, E. 1971. Two fast transient current components during voltage clamp in snail neurons.
Journal of General Physiology. 58:36-53.
Patlak, J. 1991. Molecular kinetics of voltage-dependent Na ÷ channels. Physiological Reviews. 71:1047-1080.
Pennefather, P., and I. S. Cohen. 1990. Molecular mechanisms of cardiac K + channel regulation. In Cardiac Electrophysiology: From Cell to Bedside. D. Zipes and J. Jalife, editors. W.B. Saunders Co.,
Philadelphia. 17-28.
CAMPBELL ET AL. lto in Ferret Right Ventricle 601
Qu, Y., D. L. Campbell, H. H. Himmel, and H. C. Strauss. 1992. ATP reduces L-type Ica
independently of Ca2+-dependent inactivation in ferret ventricular myocytes. Biophysical Journal. 61:400a. (Abstr.)
Qu, Y., D. L. Campbell, A. R. Whorton, and H. C. Strauss. 1991. Modulation oflca by ATP in ferret right ventricular myocytes. Circulation. 84:II-172. (Abstr.)
Rudy, B. 1988. Diversity and ubiquity of K channels. Neuroscience. 25:729-749. Sanguinetti, M. C. 1990. Na~-activated and ATP-sensitive K + channels in the heart. In Potassium
Channels: Basic Function and Therapeutic Aspects. T. J. Colatsky, editor. Alan R. Liss, Inc., New
York. 85-109. Sanguinetti, M. C., and N. K. Jurkiewicz. 1990. Two components of cardiac delayed rectifier K +
current. Differential sensitivity to block by class III antiarrhythmic agents. Journal of General Physiology. 96:195-215.
Shibata, E. F., T. Drury, H. Refsum, V. Aldrete, and W. Giles. 1989. Contributions of a transient outward current to repolarization in human atrium. American Journal of Physiology. 257:H1773- H1781.
Solc, C. K., and R. W. Aldrich. 1990. Gating of single non-Shaker A-type potassium channels in larval Drosophila neurons. Journal of General Physiology. 96:135-165.
Solc, C. K., W. N. Zagotta, and R. W. Aldrich. 1987. Single-channel and genetic analyses reveal two distinct A-type potassium channels in Drosophila. Science. 236:1094-1098.
Sorota, S. 1992. Swelling-induced chloride-sensitive current in canine atrial cells revealed by whole-cell patch-clamp method. Circulation Research. 70:679-687.
Sorota, S., and P. Boyden. 1991. Electrophysiology of the atrial myocardium. In Electrophysiology and Pharmacology of the Heart. K. Dangman and D. Miura, editors. Marcel Dekker, Inc., New York. 109-139.
Tseng, G. N., and B. F. Hoffman. 1989. Two components of transient outward current in canine ventricular myocytes. Circulation Research. 64:633---647.
Vandenberg, C. A., and F. Bezanilla. 1991. A sodium channel gating model based on single channel,
macroscopic ionic, and gating currents in the squid giant axon. Biophysical Journal. 60:1511-1533. Wasserstrom, J. A., and R. E. Ten Eick. 1991. Electrophysiology of mammalian ventricular muscle. In
Electrophysiology and Pharmacology of the Heart. K. Dangman and D. Miura, editors. Marcel Dekker, Inc., New York. 199-233.
Zagotta, W. N., and R. W. Aldrich. 1990. Voltage-dependent gating of Shaker A-type potassium channels in Drosophila muscle.Journal of General Physiology. 95:29-60.
Zagotta, W. N., M. S. Brainard, and R. W. Aldrich. 1988. Single-channel analysis of four distinct
classes of potassium channels in Drosophila muscle. Journal of Neuroscience. 8:4765-4779. Zagotta, W. N., T. Hoshi, and R. W. Aldrich. 1990. Restoration of inactivation in mutants of Shaker
potassium channels by a peptide derived from ShB. Soz, nce. 250:568-571.