the calculation of carbon emissions of shandong province and the comparison with the national...
TRANSCRIPT
Available online at www.sciencedirect.com
Energy Procedia 5 (2011) 1514–1518
1876–6102 © 2011 Published by Elsevier Ltd.doi:10.1016/j.egypro.2011.03.259
IACEED2010
The Calculation of Carbon Emissions of Shandong Province and the Comparison with the National Average
Xiao Hong*
. Library, Shandong Institute of Business and Technology, Yantai, P.R China, 264005
Abstract
This paper, by adopting the carbon emission calculating method for all kinds of energy proposed by IPCC in 2006, calculates the amount of carbon emissions of Shandong province. It turns out that carbon emissions in Shandong increased 2.63 times, carbon emission intensity increased 2.45 times and the carbon emission intensity and the energy intensity by GDP is obvious higher than the average level of China from 1997 to 2008.Taking into account the characteristics of carbon emissions in Shandong Province, the paper tries to propose the corresponding strategies to develop low-carbon economy. © 2011 Published by Elsevier Ltd. Selection and/or peer-review under responsibility of RIUDS Keywords: Energy, Carbon emissions, Shandong province, Industrial structure
1. Introduction
Shandong is one of the provinces whose economy grow fastest, so it has great significance to discuss its energy consumption and carbon emissions for finding energy -saving technology routes and solutions so as to realizing the control objectives of carbon emissions of the country .
There are some papers about regional carbon emissions. Zou Xiuping etc. (2009) Wang Duo and Zhu Yongbin (2008) studied the influential ele ments of carbon emissions on the provincial scale of China[1][2]. Zhang Xiumei etc. (2010) analyzed the effects of carbon emissions and their spatial-temporal patterns in Jiangsu province between 1996 and 2007[3]. Tang Yanqiu and CHEN Jia (2010) studied the status of carbon emissions and the developing strategy of low carbon economy in Chongqing [4]. There has no systematic research on carbon emissions in Shandong Province yet. This thesis applies the carbon emission calculation method proposed by IPCC in 2006 to calculate carbon emissions in Shandong
* Corresponding author. Tel.: 0086-535-6904283 E-mail address:[email protected].

Xiao Hong / Energy Procedia 5 (2011) 1514–1518 1515
province over the years, compare total carbon emissions , carbon emission intensity, and energy intensity by GDP and explore ways of energy saving and emission reduction in this province. 2. Research Methods
Lack of d irectly measured data of carbon emissions in China, most of the existing studies are based on calculations of energy consumption. Accounting to the calculation methodology adopted by 2006 IPCC Guidelines for National Greenhouse Gas Inventories, this paper applies the following formula:
17
1iii CBA
1 A is carbon emissions, i is type of fuel, Bi is the consumption of fuel i, and Ci is carbon emission factor of fuel i. Energy consumption in this thesis is end-use energy consumption. Types of fuel include raw coal, cleaned coal, other washed coal, briquettes, coke, coke oven gas, other gas, crude oil, gasoline, kerosene, diesel oil, fuel o il, LPG, refinery gas, natural gas, other petroleum products, other coking products, heat and electricity. Th is thesis, based on the statistics of energy balance in Shandong from China’s Energy Statistical Yearbook , by employing the calorific value and emission factor of each energy (as is shown in table 1), calculates the energy uses and carbon emissions in Shandong province and China over the years.
Table 1 Calorific Value and Emission Factors of fuel Types
Carbon emissions per capita or carbon emission intensity can be calculated by dividing carbon
emissions by population or GDP, as shown in the following formula:
fuel types Calorific value Carbon oxidation rate Carbon emission factorTC/TJ
Raw coal 20 934 KJ/Kg 0.98 26.8
Cleaned coal 26 337 KJ/Kg 0.98 26.8
Other washed coal 8 374 KJ/Kg 0.98 26.8
Briquettes 20 934 KJ/Kg 0.98 26.8
Coke 28 470 KJ/Kg 0.98 29.5
Coke oven gas 17 375KJ/cum 0.995 13.0
Other gas 5 234 KJ/cum 0.995 13.0
Crude oil 41 868 KJ/Kg 0.99 20.0
Gasoline 43 124 KJ/Kg 0.99 18.9
Kerosene 43 124 KJ/Kg 0.99 19.6
Diesel oil 42 705 KJ/Kg 0.99 20.2
Fuel oil 41 868 KJ/Kg 0.99 21.1
LPG 50 241 KJ/Kg 0.995 17.2
Refinery gas 46 055 KJ/Kg 0.995 18.2
Natural gas 38 979 KJ/cum 0.995 15.5
Other coking products 28 470 KJ/Kg 0.98 29.5
Other petroleum products 41 868 KJ/Kg 0.98 25.8
1516 Xiao Hong / Energy Procedia 5 (2011) 1514–1518
FED
2
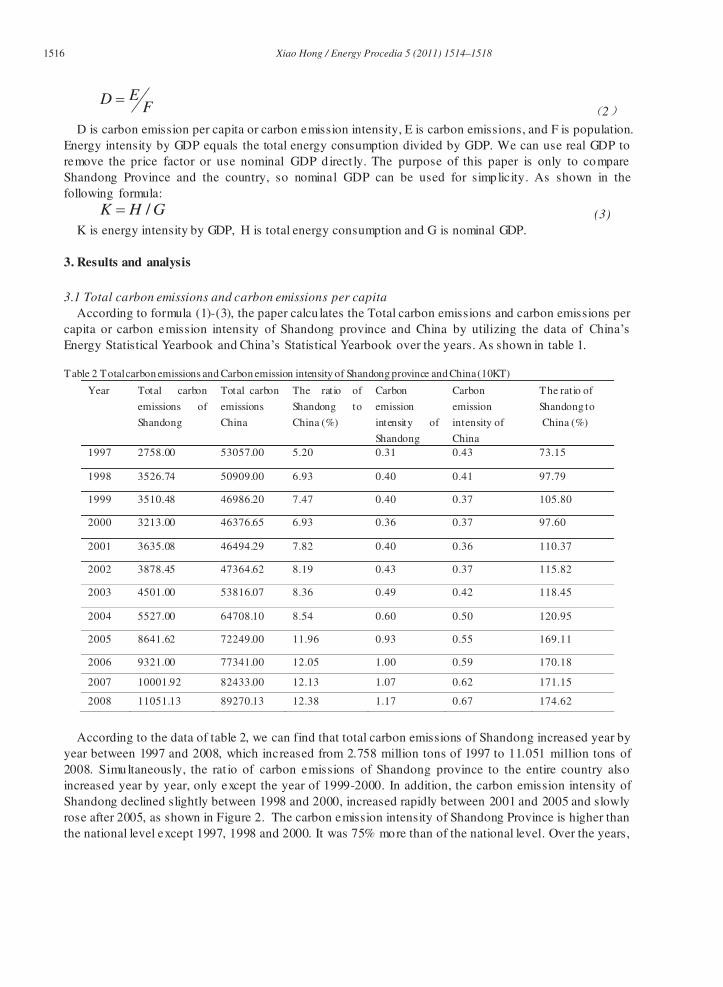
D is carbon emission per capita or carbon emission intensity, E is carbon emissions, and F is population. Energy intensity by GDP equals the total energy consumption divided by GDP. We can use real GDP to remove the price factor or use nominal GDP d irect ly. The purpose of this paper is only to compare Shandong Province and the country, so nominal GDP can be used for simplicity. As shown in the following formula:
/K H G (3) K is energy intensity by GDP, H is total energy consumption and G is nominal GDP.
3. Results and analysis 3.1 Total carbon emissions and carbon emissions per capita
According to formula (1)-(3), the paper calcu lates the Total carbon emissions and carbon emissions per capita or carbon emission intensity of Shandong province and China by utilizing the data of China’s Energy Statistical Yearbook and China’s Statistical Yearbook over the years. As shown in table 1. Table 2 Total carbon emissions and Carbon emission intensity of Shandong province and China (10KT)
According to the data of table 2, we can find that total carbon emissions of Shandong increased year by
year between 1997 and 2008, which increased from 2.758 million tons of 1997 to 11.051 million tons of 2008. Simultaneously, the rat io of carbon emissions of Shandong province to the entire country also increased year by year, only except the year of 1999-2000. In addition, the carbon emission intensity of Shandong declined slightly between 1998 and 2000, increased rapidly between 2001 and 2005 and slowly rose after 2005, as shown in Figure 2. The carbon emission intensity of Shandong Province is higher than the national level except 1997, 1998 and 2000. It was 75% more than of the national level. Over the years,
Year Total carbon
emissions of
Shandong
Total carbon
emissions
China
The ratio of
Shandong to
China (%)
Carbon
emission
intensity of
Shandong
Carbon
emission
intensity of
China
The ratio of
Shandong to
China (%)
1997 2758.00 53057.00 5.20 0.31 0.43 73.15
1998 3526.74 50909.00 6.93 0.40 0.41 97.79
1999 3510.48 46986.20 7.47 0.40 0.37 105.80
2000 3213.00 46376.65 6.93 0.36 0.37 97.60
2001 3635.08 46494.29 7.82 0.40 0.36 110.37
2002 3878.45 47364.62 8.19 0.43 0.37 115.82
2003 4501.00 53816.07 8.36 0.49 0.42 118.45
2004 5527.00 64708.10 8.54 0.60 0.50 120.95
2005 8641.62 72249.00 11.96 0.93 0.55 169.11
2006 9321.00 77341.00 12.05 1.00 0.59 170.18
2007 10001.92 82433.00 12.13 1.07 0.62 171.15
2008 11051.13 89270.13 12.38 1.17 0.67 174.62

Xiao Hong / Energy Procedia 5 (2011) 1514–1518 1517
the resource-based enterprises account for a large proportion in the industrial enterprises of the province, which lead to more energy consumption and that carbon emission intensity has been very high. 3.2 The comparison of carbon emission intensity with other regions
In 2007, the carbon emission intensity of Shandong ranks fifth in all provinces (municipalit ies), which is lower than Shanghai, Shanxi, Beijing and Hebei, ranking the fifth. We compare the carbon emission intensity of Shandong with some other reg ions of China in f igure 1, and finds that the carbon emission intensity of Shandong is significantly higher than the national average.
Figure 1 The carbon emission intensity of Shandong and some other regions of China
3.3 carbon emission intensity and GDP per capita
In 2008, GDP of Shandong ranks second, slightly lower than Guangdong Province. Meanwhile, its GDP per capita ranks the seventh in all provinces (municipalities), lower than Shanghai, Beijing, Tian jin, Zhejiang, Guangdong and Jiangsu. However, there is close relationship between GDP per capita of Shandong and carbon emission intensity, as shown in figure 2. By using SPSS statistical software, we make correlat ion analysis on them and find that Pearson correlat ion coefficient is 0. 873 (α = 0.01) .Figure 1 shows the trend of them is basically the same.
Figure 2 The relationship between GDP per capita of Shandong and carbon emission intensity
3.4 Energy intensity by GDP
Energy intensity by GDP is an important indicator to evaluate economic efficiency. The calculat ion shows that the energy intensity by GDP of Shandong Province is lower than the national average before 2001, and is higher than the national average after 2001.The Energy intensity by GDP of Shandong

1518 Xiao Hong / Energy Procedia 5 (2011) 1514–1518
Province is consistent with the national average between 2003 and 2008, both decreasing slowly. As shown in figure 3.
Figure 3 Energy intensity by GDP of Shandong and China 4. Conclusions
Based on the above discussion, we can find that although the economic g rowth in Shandong province is very fast, the development is at the cost of high emissions, so the growth pattern is urgently needed to change. According to the analysis results of the sectors of carbon emissions of Shandong province, it is necessary to adjust and optimize the industrial structure, save energy, and lower energy consumption. The carbon emissions of primary industry account for the least, but there is still room for emission reduction. The carbon emissions of secondary industry took up nearly 80% of the total in 2007, among which the industry and construction occupied 97% and 3% respectively. Therefore, the key to developing low carbon economy in Shandong is to reduce industrial energy consumption and improve energy utilization efficiency. Moreover, Shandong should increase the proportion of tert iary industry, which can not only reduce carbon emissions and energy consumption, but also reduce pollution to the urban environment and increase employment opportunities.
References
[1] Zou Xiuping, Chen Shaofeng, Ning Miao etc. An Empirical Research on the Influence Factor of Carbon Emission in
Chinese Provincial Regions. Ecological Economy. 2009, 6(3):34-37(in Chinese).
[2] Wang Duo, Zhu Yongbin. Study on the Status of Carbon Emission in Provincial Scale of China and Count ermeasures for
Reducing its Emission. Bulletin of Chinese Academy of Sciences. 2008, 23(2):109-115(in Chinese).
[3] Zhang Xiumei, Li Shengfeng, Huang Xianjin etc. Effects of Carbon Emissions and Their Spatio-Temporal Patterns in
Jiangsu Province from 1996 to 2007. Resources Science.2010, 32(4):768-774(in Chinese).
[4] TANG Yan-qiu, CHEN Jia. Study on the Status Quo of Carbon Emission and the Strategy to Develop Low Carbon Economy
in Chongqing. Sichuan Environment, 2010, 29(1):87-90(in Chinese).