the capacity of performing arts presenting organizations
TRANSCRIPT

The Capacity of Performing ArtsPresenting OrganizationsMark A. HagerThomas H. Pollak
April 2002
Supported by the Doris Duke Charitable Foundation,the Association of Performing Arts Presenters,and The Urban Institute
Center on Nonprofits and PhilanthropyThe Urban Institute2100 M Street, NWWashington, DC 20037(202) 261-5770www.urban.org

♦ 1 ♦ THE URBAN INSTITUTE CENTER ON NONPROFITS AND PHILANTHROPY
THE CAPACITY OF PERFORMING ARTSPRESENTING ORGANIZATIONS
Table of Contents
Executive Summary ....................................................................................................................2
Introduction ................................................................................................................................8
Section 1: Scope of the Study ....................................................................................................9
Section 2: Research Method..................................................................................................... 11
Section 3: Distribution of Organizations in the Study................................................................ 14
Section 4: Scope of Programs and Activities ............................................................................ 18
Section 5: Sustainability and Financial Stability......................................................................... 21
Section 6: Leadership............................................................................................................... 29
Section 7: International Artists and Cultural Diversity .............................................................. 34
Section 8: Audience Development............................................................................................ 37
Section 9: Technological Adaptation ........................................................................................ 41
Section 10: Size and Scope of the Presenting Field................................................................... 43
Conclusions .............................................................................................................................. 45
♦ 2 ♦ THE URBAN INSTITUTE CENTER ON NONPROFITS AND PHILANTHROPY
THE CAPACITY OF PERFORMING ARTSPRESENTING ORGANIZATIONS
Executive Summary
This report summarizes results from a survey of performing arts presenting organizations in theUnited States. The study was commissioned by the Doris Duke Charitable Foundation tosupplement an evaluation of its Leadership Presenting Organizations program, and by theAssociation of Performing Arts Presenters to provide context for a series of presentingorganization convocations and to provide a basis for future planning. The Center on Nonprofitsand Philanthropy at the Urban Institute conducted the research, with assistance from the Centerfor Survey Research at the Ohio State University and the Center for Survey Research at IndianaUniversity, Bloomington. The work received additional support from and is part of the Center onNonprofits and Philanthropy's nonprofit subsector analyses program.
The research focuses on a broad range of performing arts presenting organizations. The researchnot only captures traditional performing arts presenting organizations, such as performing artscenters, but also includes organizations for which presenting is not the primary mission. Further,in addition to capturing data from freestanding, independently incorporated organizations, theresearch also focuses on performing arts centers and presenting programs that are hosted bylarger organizations, such as universities, local governments, museums, and churches.
The research began with the identification of a sampling frame of nearly 7,000 potentialperforming arts presenting organizations that we felt were likely candidates for fitting ourdefinition of a presenting organization. A performing arts presenting organization is anorganization, or a department or program of a larger organization, that works to facilitateexchanges between artists and audiences through creative, educational, and performanceopportunities. The work that these artists perform is produced outside of the presentingorganization. Over 800 presenting organizations responded to either a short or a long surveyform.
Respondents represent the broad variety of organizational types and sizes found in the performingarts field. We present the distribution of this variation in five different ways:
1. Annual Presenting Budget. Nearly one-third of the respondents compose the category ofsmallest budget organizations, with less than $100,000 each in expenditures in fiscal year2000. Another one-third fall into the category of small budget organizations, with annualexpenditures ranging from $100,000 to $500,000. One in five organizations make up themedium budget class, with between $500,000 and $2 million in annual expenditures. Only alittle over one in ten organizations are large budget organizations, with annual expendituresexceeding $2 million.
2. Hosted Status. “Hosted status” refers to whether a performing arts presenting organizationis a freestanding, independent organization or whether it is embedded in a larger organization.

♦ 3 ♦ THE URBAN INSTITUTE CENTER ON NONPROFITS AND PHILANTHROPY
Nearly two-thirds of the organizations in the study are freestanding nonprofit organizations,while the remaining one-third are hosted by other entities. This ratio holds for organizationsof all four budget classes.
3. Community Type. One in three respondents are in small cities, our most commoncommunity type. The smallest number of presenters are in suburban locations, with urban andrural presenters falling in between.
4. Presenter Age. The organizations in the study represent a range of organization ages. Onehundred thirty-seven organizations in the study report that they began presenting theperforming arts before 1960. On the other hand, 209 indicate that they began their presentingactivities in the past decade. The creation of urban presenting organizations fell offsubstantially through the 1980s and 1990s, with the founding of presenting organizations insuburban settings taking up the slack.
5. Organizational Type. Nearly half of the organizations in the study are traditionalperforming arts facilities or presenting programs that are part of an academic institution.However, a substantial minority of respondents are fairs or festivals, museums or othercultural venues with presenting programs, performing groups that also present the work ofothers, or culturally specific presenting organizations.
These different organizational characteristics provide a basis for exploring variations amongorganizational programs and the attitudes of their managers. The report is divided into sixdifferent substantive areas: scope of programs and activities, sustainability and financial stability,leadership, international artists and cultural diversity, audience development, and technologicaladaptation. We present the major points from each section here.
I. Scope of Programs and Activities
This section provides information about the overall size and scope of performing arts presentingorganizations. We observe that the average presenting organization has 8 or 9 staff members,ranging from 2 to 37 between the smallest and large budget categories. Most staff members inpresenting organizations are administrative staff, although some organizations maintain artisticand production staff as well.
By far, music is the most common art form contracted by performing arts presentingorganizations. However, the average number of contracts to performances runs in nearly a 1 to 1ratio, making music one of the most administratively taxing art forms to present. In contrast,nonmusical theatre and Broadway musical theatre are contracted in much fewer numbers butaverage over five performances for each contract.
The majority of presenting organizations select their programming primarily on artistic merit butalso consider their financial goals. Roughly one in five presenters claim that they select theirprograms based exclusively on artistic merit. Two of the study organizations, both of them in thesmallest budget category, indicate that their booking decisions are based almost exclusively ontheir potential to meet financial goals.
♦ 4 ♦ THE URBAN INSTITUTE CENTER ON NONPROFITS AND PHILANTHROPY
Presenting organizations rely on a variety of sources when deciding which artists to book. Threesources were cited as most critical: personal experience at a full-length performance, referencesfrom colleagues, and the general reputation of the artist.
II. Sustainability and Financial Stability
This section focuses on the finances of performing arts presenting organizations, including theirown perceptions of their fiscal health. First, we observe that presenting organizations are roughlyequally likely to own or rent their primary facility, but that large budget organizations are muchmore likely to own than small and smallest budget presenting organizations. Among thoseorganizations that rent, budget size dictates their relationship with their primary facility.Presenting organizations with the smallest budgets tend to be occasional users of the venues theyrent.
We asked presenters to rank their perception of financial health, financial stability, and financialmanagement on a scale from 1 (low) to 5 (high). While positive responses tend to increase withbudget size, presenting organizations of all sizes are optimistic about these dimensions of theirfinances. They are somewhat less positive about their organizations’ fundraising capacity and theircapacity for managing investments.
On average, presenting organizations earn roughly half of their revenues, most of which comefrom ticket sales. Slightly less than half of organizational revenues come from contributions fromindividuals, foundations, business, government, and host institutions. Reliance on contributedrevenues decreases as an organization’s budget increases.
Expenditures on artistic fees is by far the largest expenditure category for performing artspresenting organizations, a generalization that is especially true for organizations with the smallestpresenting budgets. In contrast, presenters with the smallest budgets spend the least onmanagement and general expenses, a category that constitutes 23 percent of annual expendituresfor the average presenting organization. Presenters spend roughly one dollar in eight on directmarketing and fundraising expenses.
Most presenting organizations carry a low fund balance from year to year and do not build up areserve that they can use for investments. National Arts Stabilization, an independent organizationdedicated to improving the long-term stability of arts organizations, suggests that organizationsinterested in establishing an investment reserve try to gather donor-restricted endowment fundsand board-designated quasi-endowments into a sum that equals at least two years of totalorganizational expenditures. However, very few presenting organizations meet this standard.Little more than one-third of the largest budget organizations have endowments plus quasi-endowments that match even one year’s total expenditures.
Nonetheless, endowment-building efforts are growing. More than 10 percent of organizationswith endowments established them in 2000. More than 40 percent of all presenting organizationsintend to conduct an endowment campaign in the next three years.
♦ 5 ♦ THE URBAN INSTITUTE CENTER ON NONPROFITS AND PHILANTHROPY
III. Leadership
This section focuses on different dimensions of leadership. First, we report on how presentingorganizations perceive their own artistic and managerial leadership, both of which rank verypositively on a 1 (low) to 5 (high) scale. However, managers responding to the survey were lessglowing about their ability to recruit qualified personnel and provide competitive salaries. Indeed,organizations with the smallest and small budgets average less than a neutral 3 when assessing thecompetitiveness of their salaries.
We asked presenting organizations to report the salary range into which their highest paid personfalls. Average highest salaries range from $42,400 in the smallest budget organizations to$123,100 in the large budget organizations. Highest salaries also vary substantially by communitytype, organizational type, and geographic location. The highest salaries are found in organizationswith the largest budgets and in organizations that are located in urban areas. Also, the highestsalaries are found in traditional freestanding performing arts facilities. Salaries are lowest amongorganizations without their own facilities, festivals and fairs, and presenting programs run frommuseums and local arts agencies.
Presenters reported their perception of board leadership on the 1 to 5 scale. Board leadershiprated somewhat lower than self-assessments of artistic and managerial leadership, especiallyamong those organizations with smallest, small, and medium budgets. Presenting organizationsvary substantially in terms of the degree to which board members contribute substantial sums tothe organization’s budget. More than one-third of presenters that receive board contributionsreceive less than 5 percent of total contributions from their board. On the other hand, more than11 percent of organizations with boards received more than half of their total contributions fromboard members.
IV. International Artists and Cultural Diversity
This section highlights survey questions on the presentation of artists who live outside the countryand the cultural diversity of the staff, artists, presentations, and audiences of the presentingorganizations themselves. On the issue of international artists, we observe that larger budgetorganizations are generally more involved in the presentation of international artists than theirsmaller counterparts. However, organizations with medium budgets lead the way in both thenumbers of international artists presented and the proportion of all performances presented byinternational artists.
We asked presenting organizations to assess the diversity of their board, staff, presentations, andaudiences on a scale from 1 (low) to 5 (high). While the average assessment of the diversity ofpresentations averages around a value of 4, diversity of audiences rests closer to 3, and diversityof board and staff ranges from 2 to 3. On average, performing arts presenting organizations assessthe diversity of their board and staff as moderately weak.

♦ 6 ♦ THE URBAN INSTITUTE CENTER ON NONPROFITS AND PHILANTHROPY
V. Audience Development
In this section, we consider several measures of efforts to increase the number of audiencemembers at performances, to diversify audiences, or to deepen the performing arts experience foraudiences. On the familiar 1 to 5 scale, presenting organizations rate their capacity for developingnew audiences in the 3–4 range. As is the case for most of these measures, large budgetorganizations are more optimistic about the prospects of audience development than are thesmaller presenters.
We observe that most performing arts presenting organizations do not have a staff member whoseprimary responsibility is audience development. Even among the large budget organizations, onlyslightly more than 40 percent have such a staff member.
Nonetheless, presenting organizations make an effort to collect information on their audiences orotherwise endeavor to develop their audiences. Most presenting organizations collect basiccontact information from audience members, and more than half collect information regardingaudience satisfaction with performances. Presenting organizations of all sizes are involved with avariety of audience development strategies, such as free performances, programs aimed at school-aged youth, and the dissemination of program notes. The use of audience development strategiesincreases with budget size, but even the presenters with the smallest budgets display a range ofaudience development efforts.
VI. Technological Adaptation
Finally, we report briefly on survey questions regarding the use of computer technology in dailyorganizational work tasks as well as in stagecraft. Virtually all of the organizations have access tothe Internet, and most make use of computer technology either in administration or stagecraft.The most widespread use of computer technology among performing arts presentingorganizations is the use of the Internet for communication with audiences or artists. Use of theWorld Wide Web for online promotion of the organization and its season are nearly as common,but these applications are most prevalent among large budget presenting organizations.
Organization size plays a clear role in technological adaptation. Online ticket sales have becomethe norm for the largest presenters but are very rare among the smallest. The role of size is alsoclear in self-assessments of technological adaptation in staging and production. Presentingorganizations with large budgets average a value of 4.2 on the scale from 1 (low) to 5 (high),while organizations with smallest and small budgets rate a full point lower.
Section 10 reports our efforts to extrapolate our survey findings to national estimates of thenumber of attendees and the amount of money earned by and donated to performing artspresenting organizations in 2000. Based on our estimate of 7,000 performing arts presenters inthe United States, we estimate total attendance at 316 million. We estimate collective earnedincome at $5 billion and contributed revenues at $3.7 billion.
♦ 7 ♦ THE URBAN INSTITUTE CENTER ON NONPROFITS AND PHILANTHROPY
Conclusions
The report concludes with 12 observations about the current state of the field of performing artspresenters, all raised in the body of the report and elaborated upon in Section 11:
1. The predominance of small budget presenting organizations in the field as a whole2. The increase in suburban presenting organizations in recent years3. The predominance of venue ownership among larger budget presenting organizations4. Generally optimistic self-assessments of financial health5. Nearly equal reliance on contributions and earned income6. Low administrative costs among small budget presenting organizations7. Predominance of small or nonexistent financial reserves and endowments8. Pessimistic self-assessments regarding competitiveness of salaries9. Rural presenters active in presentation of international artists10. Medium budget presenters particularly active in audience development efforts11. Substantial use of technology, especially among larger budget presenters12. Collectively, substantial revenues from earned and contributed income

♦ 8 ♦ THE URBAN INSTITUTE CENTER ON NONPROFITS AND PHILANTHROPY
THE CAPACITY OF PERFORMING ARTS PRESENTINGORGANIZATIONS
Introduction
Performing arts presenting organizations are an integral part of the performing arts field and animportant contributor to the cultural life of most communities. Presenting organizations, such asperforming arts centers, local arts agencies, and community festivals, play an importantintermediary role between artists and audiences. Increasingly, these organizations are playing aprimary role in the development of artists and the creation and development of new work.
However, partly because they are found in diverse institutional settings, presenting organizationsare often unrecognized as a distinct organizational form, even among arts researchers. Performingarts producing organizations—the theatre troupes, dance companies, musical groups, and operasthat employ artists in the production of art—are the obvious form that we think about when wedescribe the performing arts. However, the entities that present these producing companies, oftenwhen the producing companies are touring to different cities, escape the attention of the generalpopulation, the arts research community, and many institutional funders.
To date, research has provided little information on the scope of the field of performing artspresenting organizations. The Association of Performing Arts Presenters has observed a variety ofongoing changes regarding the use of technology, the development of endowments, and a greaterdiversification of roles that presenting organizations play in their communities. However,researchers have done little to document these kinds of changes. The goal of this report is toaddress this gap by providing a current overview of the field of performing arts presentingorganizations. The work is based on two surveys (a long form and a short form) of presentingorganizations. The survey was developed in close collaboration with the Association ofPerforming Arts Presenters as a means of tapping into the core issues relevant to the field today.
The study was commissioned by the Doris Duke Charitable Foundation to supplement anevaluation of their Leadership Presenting Organizations program. The Doris Duke CharitableFoundation is the principal funder of this work. Additional support was provided by theAssociation of Performing Arts Presenters and the Urban Institute.
♦ 9 ♦ THE URBAN INSTITUTE CENTER ON NONPROFITS AND PHILANTHROPY
Section 1: Scope of the Study
The research project is a study of performing arts presenting organizations in the United States.Our initial challenge was to define the parameters of the performing arts presenting field. That is,we first had to be clear about which kinds of entities constitute performing arts presentingorganizations and which do not. Two distinctions highlight the definition issue.
Producers vs. PresentersOne distinction that guides our research is a field-wide distinction between performing artsproducers and performing arts presenters. Illustrations of pure producers and pure presenters areeasy to generate. A theatre troupe that works only with its own talent to produce plays in a rentedhall is a pure producer and is clearly outside the domain of our study. On the other hand, a localarts center that hosts outside performing artists or arts organizations and does not produce any ofits own talent is a pure presenter and is clearly within the domain of the study.
However, many organizations have elements of both production and presentation. Organizationsthat are primarily presenters that produce some work were clear targets for inclusion, but we alsowanted to include organizations that are primarily producers that nonetheless exhibit someelements of presenting. An example is an orchestra that periodically hosts an international cellistto play with the orchestra for a short series of performances. In the definitions we laid out for thestudy, the orchestra is a producing entity that periodically presents an outside, touring artist. Wewanted to capture this aspect of presenting, although we sometimes found it challenging toconvince such organizations that they met our definition of a performing arts presentingorganization.
Freestanding vs. Embedded EntitiesThe second consideration is whether or not the presenting entity is a freestanding formalorganization. Many performing arts presenters are freestanding nonprofit (and sometimes for-profit) organizations that are easy to define and find because they appear on rolls of incorporatedentities. However, many performing arts presenters do not fit this definition. A great many arehosted in larger institutions, such as universities and local governments.
Many universities have performing arts centers that serve broad university and communityaudiences. These centers are usually not separately incorporated, but they function in essentiallythe same way as a freestanding performing arts center. Universities also host other, less obvious,presenting entities. Individual theatre or music departments, student union program councils, and
Definition: A performing arts presenting organization is an organization,or department or program of a larger organization, that works to facilitateexchanges between artists and audiences through creative, educational, andperformance opportunities. The work that these artists perform is producedoutside of the presenting organization.

♦ 10 ♦ THE URBAN INSTITUTE CENTER ON NONPROFITS AND PHILANTHROPY
university auditoriums or amphitheaters may occasionally present external, touring artists. Localgovernments are another common entity in which presenting programs are hosted. Localgovernments may have a local arts or recreation agency that sponsors a summer festival oroutdoor music series. Some local governments own and operate performing arts facilities thatserve as the community’s primary arts presenter.
Arts presenting activities are also embedded in other kinds of entities. Some museums supplementtheir visual arts emphasis with a performing arts series. The same can be said for libraries. In somecommunities, major churches serve as a venue for touring artists. Fairs and festivals, a majorpresenting type, are sometimes freestanding entities, but are just as likely to be run from schools,churches, agencies of local government, or larger nonprofit organizations.
What Is Included in the Study?
This study sought to include as broad a cross-section of performing arts presenting organizationsas possible. While we focus on traditional freestanding presenting entities, we also include therange of peripheral producing/presenting and hosted programs. The result is a broad overview ofthe full field of performing arts presenting organizations in the United States. While most of theorganizations in the study can be characterized as either freestanding nonprofit organizations orunincorporated entities that are hosted by other institutions, we also include presentingorganizations that are incorporated as for-profit businesses. These presenting organizations are aminority in the performing arts field, but their budgets and activities are included here.

♦ 11 ♦ THE URBAN INSTITUTE CENTER ON NONPROFITS AND PHILANTHROPY
Section 2: Research Method
Our goal was to collect a wide range of information on the activities, structure, and finances of asample of performing arts presenting organizations. The first step in such a project is the creationof a sampling frame, the list of all of the organizations and hosted entities that met our definitionof a performing arts presenting organization. Unfortunately, such a list does not exist and thecreation of such a list requires one to know in advance whether or not an organization is apresenting organization. For example, a list of museums or orchestras is reasonably easy to obtain,but one cannot know which museums have performing arts presenting programs without a fullsurvey of museums. In short, the generation of a sampling frame proved difficult.
Our approach was to generate a list of potential performing arts presenters. This was a list ofapproximately 7,000 entities that we believed were likely to meet our definition. We drew fromtwo main sources when we generated this list: a contact list provided by the Association ofPerforming Arts Presenters, and the Unified Database of Arts Organizations.
The Association of Performing Arts Presenters maintains a database of organizations that contacttheir office. This list includes member organizations, nonmembers that they have identified aspresenting organizations, and other prospective presenting or touring organizations that ArtsPresenters knows less about.
The Unified Database of Arts Organizations (UDAO) is a joint research project of the UrbanInstitute, the National Association of State Arts Agencies, and the National Endowment for theArts (NEA). The UDAO is the most comprehensive listing of arts organizations in the UnitedStates, with approximately 115,000 records. The listing draws on nonprofit arts organizations thatfile with the IRS, as well as state arts agency and NEA grantee and mailing lists. We dreworganizations from two categories that we believed would include the most potential performingarts presenters: performing arts facilities, and fairs and festivals.
Stage 1: The Long FormData collection progressed in two stages. First, we focused our attention on a relatively smallsample of presenting organizations. We drew a random sample of organizations that we contactedby phone to determine whether or not they met our definition of a performing arts presenter. Ourgoal was to deliver our survey instrument to approximately 700 arts presenters. However, missingand bad phone numbers, failure to reach a knowledgeable person by phone at many organizations,and our inclusion of a large number of nonpresenting potential arts presenters required us tosample nearly 2,500 entities in order to generate a final sample of 707 entities that passed a simplephone screen.
We mailed a 10-page survey, a cover letter from the Association of Performing Arts Presenters,and a stamped return envelope to the 707 organizations. After 10 days, we faxed a copy of thesurvey and a reminder cover letter to the nonrespondents. After two weeks, we called all thenonrespondents, and we re-faxed another copy of the survey if they requested it. Two weekslater, we again contacted those who had told us that they would return the survey.

♦ 12 ♦ THE URBAN INSTITUTE CENTER ON NONPROFITS AND PHILANTHROPY
By the end of the first data collection stage, we had received surveys from 303 of the sampleorganizations. However, 31 of these organizations (10.2 percent) claimed that they did not meetour definition of a performing arts presenter, despite the fact that they had passed the phonescreening. We removed these 31 organizations from the sample, resulting in a base of 676organizations.1 With 272 valid responses, we calculate a return rate of 40.2 percent. While thislevel of return causes us to interpret our results cautiously, it is not out of line with typical returnrates for surveys of other kinds of nonprofit or community organizations.
Stage 2: The Short FormWe returned stage 1 nonrespondents to the pool, resulting in a new sampling frame of 6,196organizations. We mailed an announcement letter to all of these organizations and then followedup with a four-page survey, a cover letter from the Association of Performing Arts Presenters,and a stamped return envelope. All of the questions on the four-page survey were drawn fromquestions on the ten-page survey. We also created a Web-based version of the survey andassigned all organizations in the study a unique password for accessing the online survey. Aftertwo weeks, we mailed a reminder postcard to all organizations that had not returned a survey.
In this second data collection stage, we received surveys from 1,054 organizations. Nearly 15percent (155) responded by filling out the Web-based version of the survey. Since we did notprescreen the organizations by phone, we expected a much higher proportion of organizations toclaim that they did not meet our definition of a performing arts presenting organization. This wasindeed the case, as 256 (24.3 percent) of the respondents reported that they had no presentingactivities. This results in 798 valid responses out of 5,940 valid respondents or nonrespondents.This results in a stage two response rate of 13.4 percent.2
We pooled the two data sets, so that questions asked on the short form have as many as 1,070respondents, 272 from the long form and 798 from the short. The overall pooled response ratecan be calculated as well. Of 6,903 organizations contacted, we received responses from 1,357.Of these, 287 did not meet our definition of an arts presenter, reducing our valid returns to 1,070out of 6,616 candidates. This results in a pooled return rate of 16.2 percent. The pooled returnrate climbs to 19.7 percent if we assume that 1,173 of our potential presenters are indeed notperforming arts presenting organizations.
1 The number of true presenting organizations remaining in the sampling frame is unknown because we didnot receive responses from 404 organizations. However, if 10.2 percent of the respondents claimed not tobe presenters, it may be reasonable to infer that roughly 10 percent of the nonrespondents also would notmeet our definition of a performing arts presenting organization. A further reduction of 41 organizations(10.2 percent of 404 nonrespondents) would reduce the sample base to 635 organizations, which places thereturn rate at 42.8 percent (272 returns out of 635 valid sample organizations).
2 However, we presume that many nonrespondents are also not valid presenting organizations. If 24.3percent of respondents are not presenters, then approximately 1,249 of 5,142 nonrespondents may also notbe valid presenting organizations. This assumption reduces the number of presenting organizations in thesecond stage sample to 4,691, resulting in a return rate of 17.0 percent.

♦ 13 ♦ THE URBAN INSTITUTE CENTER ON NONPROFITS AND PHILANTHROPY
ExclusionsWe asked respondents in both stages of the research how important presenting the performingarts is to the fulfillment of their organization’s mission. If organizations cited presenting as a“primary” or “complementary” part of their mission, we included them in the analysis. Weexcluded the 80 organizations (from both stages; 7.5 percent) that said that presenting issecondary to other programming activities or peripheral to their mission. We also excluded the 29organizations (2.7 percent) that did not provide an answer to this question.
On both surveys, we also asked organizations about the number of performances they presentedlast season. Seven organizations reported zero performances, and 101 did not report this number.We excluded these 108 cases.
The report that follows is based on data from the remaining 880 cases, including 230 cases withlong-form data and 650 with short-form data. Throughout the report, we note the conclusions wedraw from the pooled data of 880 cases and those we draw from questions asked only on the longform.

♦ 14 ♦ THE URBAN INSTITUTE CENTER ON NONPROFITS AND PHILANTHROPY
Section 3: Distribution of Organizations in the Study
This study is based on a range of presenter types from across the United States. The purpose ofthis report is to elaborate on the similarities and differences between these presentingorganizations across a wide range of issues. The findings are presented in the following eightsections. Following this section, which describes how the organizations are distributed by keycharacteristics, Section 4 describes the scope of programs and activities, including staffing andissues of program selection. Section 5 focuses on organizational sustainability and financialstability. Section 6 concerns leadership issues, including both staff and board leadership. Section7 elaborates on several survey questions regarding presentation of international artists andcultural diversity. Section 8 discusses issues of audience development. Finally, Section 9 brieflydescribes the results of several questions on adaptation to computer use and technologicalinnovations in the performing arts field. Section 10 reports on our efforts to use survey results toestimate the size and scope of the performing arts presenting field. The report concludes with alist of key findings.
Distribution by Annual Presenting BudgetThroughout this report, we present results according to major relevant categories oforganizational characteristics. The main characteristic that we give attention to is organizationalsize, based on an organization’s annual expenditures on its presenting activities. For thoseorganizations whose mission is exclusively related to presenting the performing arts, thepresenting budget is equal to the total organizational budget. For those organizations with avariety of activities, size is based only on that part of the organization’s budget that is allocatedfor presenting. We focus on four different budget categories, as described in table 1.
Since the field is dominated by community-based performing arts presenting organizations withsmall budgets, we were not surprised to find that most of the organizations in the study fall intothe small budget category. Nonetheless, we are uncertain whether or not this distribution matchesthe true distribution of performing arts presenting organizations. That is, organizations with largebudgets may have been less (or more) likely to fill out the survey, creating an overrepresentation(or underrepresentation) of smaller organizations in the study.
Table 1. Distribution of Organizations, by Annual Presenting Expenses (Budget Size)
Count Percent
Smallest budgets: Up to $100,000 252 31.5
Small budgets: $100,000–$500,000 302 37.8
Medium budgets: $500,000–$2,000,000 157 19.6
Large budgets: More than $2,000,000 88 11.0
Total 799 100.0 a
Did not report financial information 81
note a. Due to rounding, percent columns in tables in this report may not always add to 100.0 percent.
♦ 15 ♦ THE URBAN INSTITUTE CENTER ON NONPROFITS AND PHILANTHROPY
The budget size of the organizations in the study does not necessarily reflect their overallcapacity. As noted above, we asked organizations to report only their presenting budgets, andmany of these budgets are a small portion of the budget of a larger host organization. For anindication of how hosted presenting entities differ from freestanding presenting organizations,look ahead to table 12. This table indicates that the average endowment for organizations with thesmallest budgets is much larger than the average endowment for organizations in the next highestbudget category.
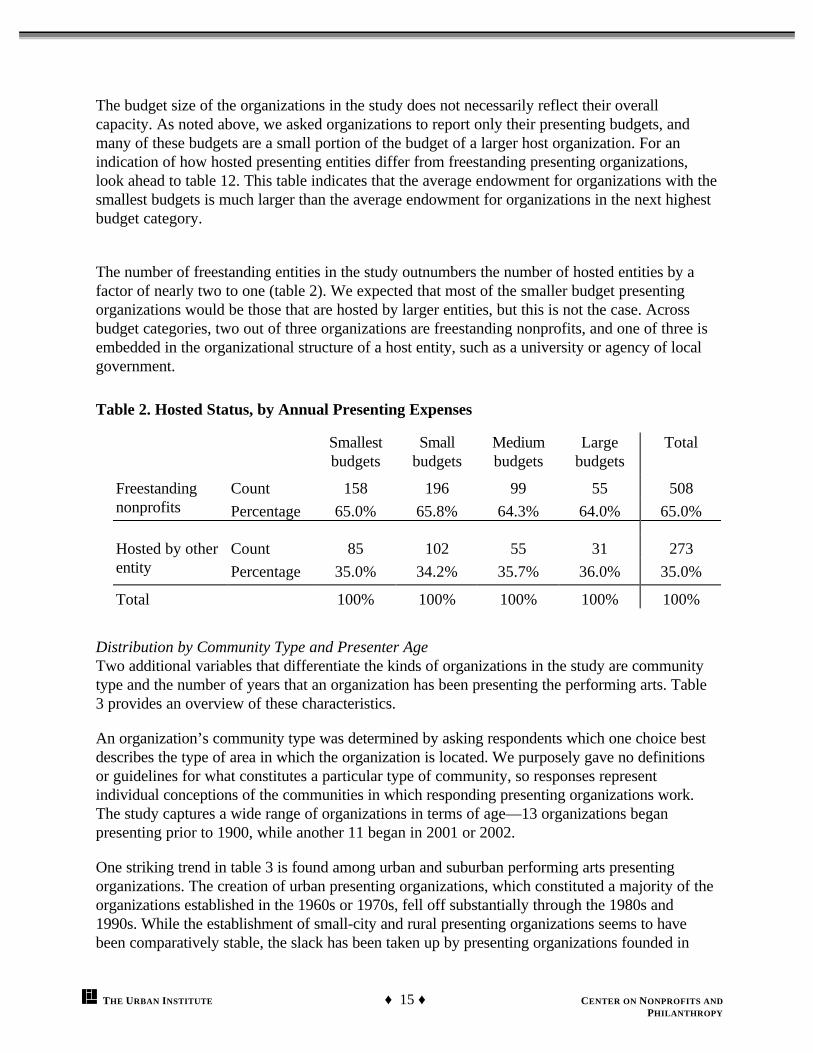
The number of freestanding entities in the study outnumbers the number of hosted entities by afactor of nearly two to one (table 2). We expected that most of the smaller budget presentingorganizations would be those that are hosted by larger entities, but this is not the case. Acrossbudget categories, two out of three organizations are freestanding nonprofits, and one of three isembedded in the organizational structure of a host entity, such as a university or agency of localgovernment.
Table 2. Hosted Status, by Annual Presenting Expenses
Smallestbudgets
Smallbudgets
Mediumbudgets
Largebudgets
Total
Count 158 196 99 55 508Freestandingnonprofits Percentage 65.0% 65.8% 64.3% 64.0% 65.0%
Count 85 102 55 31 273Hosted by otherentity Percentage 35.0% 34.2% 35.7% 36.0% 35.0%
Total 100% 100% 100% 100% 100%
Distribution by Community Type and Presenter AgeTwo additional variables that differentiate the kinds of organizations in the study are communitytype and the number of years that an organization has been presenting the performing arts. Table3 provides an overview of these characteristics.
An organization’s community type was determined by asking respondents which one choice bestdescribes the type of area in which the organization is located. We purposely gave no definitionsor guidelines for what constitutes a particular type of community, so responses representindividual conceptions of the communities in which responding presenting organizations work.The study captures a wide range of organizations in terms of age—13 organizations beganpresenting prior to 1900, while another 11 began in 2001 or 2002.
One striking trend in table 3 is found among urban and suburban performing arts presentingorganizations. The creation of urban presenting organizations, which constituted a majority of theorganizations established in the 1960s or 1970s, fell off substantially through the 1980s and1990s. While the establishment of small-city and rural presenting organizations seems to havebeen comparatively stable, the slack has been taken up by presenting organizations founded in

♦ 16 ♦ THE URBAN INSTITUTE CENTER ON NONPROFITS AND PHILANTHROPY
suburban settings. While suburban organizations account for only about one-eighth of thepresenting organizations founded before 1960, they represent more than one-fifth of thepresenting organizations founded in the past decade.
Table 3. Community Type, by Age
When Organization Began Presenting Performing Arts
Before 19601960s or
1970s1980s
1990s or2000s
Total
35 89 69 45 238Urban
25.5% 33.8% 28.0% 21.5% 27.8%
17 40 35 45 137Suburban
12.4% 15.2% 14.2% 21.5% 16.0%
62 68 84 79 293Small City
45.3% 25.9% 34.1% 37.8% 34.2%
23 66 58 40 187Rural
16.8% 25.1% 23.6% 19.1% 21.9%
137 263 246 209 855Total
100% 100% 100% 100% 100%
Distribution by Organizational TypeFinally, type of organization is an important descriptive variable that indicates the range ofperforming arts presenting organizations represented in the study. Table 4 shows the number ofpresenting organizations of various types that responded to the survey. While many presentingorganizations may legitimately fall into more than one category, we asked organizations to selecta single category that describes them best.
Table 4. Types of Performing Arts Presenting Organizations in Study
Count Percent
Performing arts facilities with presenting programs 263 29.9
Presenting organizations with no facility; and fairs/festivals 218 24.8
Presenting programs that are part of an academic institution 172 19.5
Museums, galleries, and libraries with presenting programs; andother presenting types
95 10.8
Performing groups that present; and promoters/producers 87 9.9Culturally specific organizations 45 5.1
Total 880 100.0

♦ 17 ♦ THE URBAN INSTITUTE CENTER ON NONPROFITS AND PHILANTHROPY
The largest group in the study is “traditional” performing arts facilities with presenting programs.However, they are followed closely by presenting organizations that do not have their ownpresenting facility, including fairs and festivals, and by presenting programs that are part of aschool. The study also includes a substantial number of producing groups that also present thework created and produced by others, and culturally specific presenting organizations that are notalways included in descriptions of performing arts presenters.
The size of the presenting budget, hosted status, community type, number of years as a presentingorganization, and organizational type are important qualities that help us to understand thecharacteristics of performing arts presenting organizations. However, these characteristics do nottell us much about what these presenting organizations do or how they feel about their programsand current challenges. In the following sections, we highlight six different focus areas thatdiscuss these activities and challenges. When activities or challenges differ substantially by one ofthe characteristics described above, we provide a breakdown and discussion of the differences.Clearly, the most prominent characteristic that conditions what a presenting organization does andhow it feels about itself is the size of its budget.

♦ 18 ♦ THE URBAN INSTITUTE CENTER ON NONPROFITS AND PHILANTHROPY
Section 4: Scope of Programs and Activities
This section presents additional descriptive information on how work gets done in performing artspresenting organizations, including descriptions of staffing, artist selection, and the types of artiststhat organizations participating in the study present. While all of the findings in the previoussection are based on questions found on both the long and short form of the survey, the issues inthis section are based on questions found on the long form only. That is, the findings in thissection are based on, at most, 220 organizations.
Table 5 presents the average number of staff members of various types that organizations ofvarious budget sizes support. Staffing of performing arts presenting organizations is consistentwith their image as predominantly administrative organizations. For presenting organizations of allbudget sizes, the largest category of full-time staff members is administrative staff. Nonetheless,presenting organizations are clearly not only administrative entities that book artists or maintainfacilities. A large number dedicate resources to artistry, production, and commission of newworks, which points to a blurred boundary between presenting and producing activities.
Table 5. Average Number of Staff, by Budget Size
Smallestbudgets
Smallbudgets
Mediumbudgets
Largebudgets
Allorganizations
Full-time artistic staff 0.7 0.7 1.1 4.5 1.6
Full-time production staff 0.9 0.7 1.8 11.7 2.7
Full-time administrative staff 0.9 1.7 4.8 21.7 5.1
All full-time staff 2.2 2.8 7.2 36.5 8.5
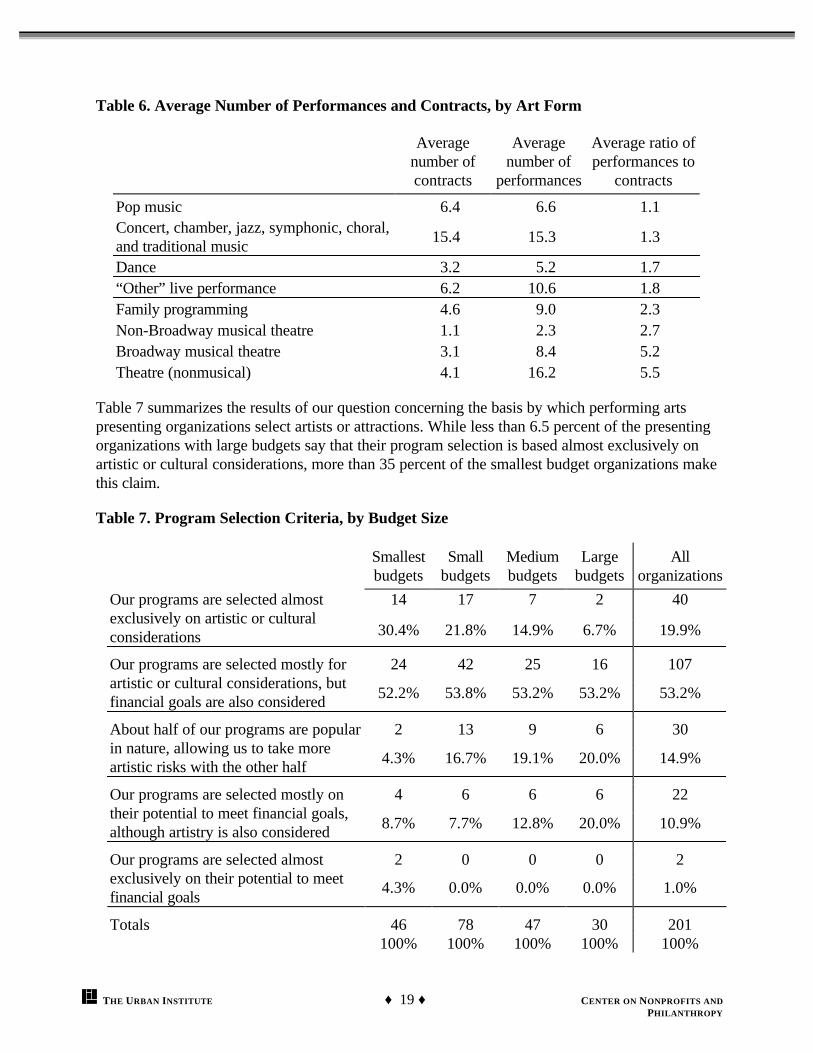
Table 6 illustrates the range of performing arts that the organizations in the study present. Theatreand music are, by far, the most frequent type of performing arts presented by performing artspresenting organizations, at least in the number of performances per organization. These twoforms differ, however, in terms of the number of contracts they must sign in relation to thenumber of presentations. While music organizations average a little over one performance percontract, theatre (nonmusical) organizations average more than five performances for eachcontract they offer.
♦ 19 ♦ THE URBAN INSTITUTE CENTER ON NONPROFITS AND PHILANTHROPY
Table 6. Average Number of Performances and Contracts, by Art Form
Averagenumber ofcontracts
Averagenumber of
performances
Average ratio ofperformances to
contracts
Pop music 6.4 6.6 1.1Concert, chamber, jazz, symphonic, choral,and traditional music
15.4 15.3 1.3
Dance 3.2 5.2 1.7“Other” live performance 6.2 10.6 1.8Family programming 4.6 9.0 2.3Non-Broadway musical theatre 1.1 2.3 2.7Broadway musical theatre 3.1 8.4 5.2Theatre (nonmusical) 4.1 16.2 5.5
Table 7 summarizes the results of our question concerning the basis by which performing artspresenting organizations select artists or attractions. While less than 6.5 percent of the presentingorganizations with large budgets say that their program selection is based almost exclusively onartistic or cultural considerations, more than 35 percent of the smallest budget organizations makethis claim.
Table 7. Program Selection Criteria, by Budget Size
Smallestbudgets
Smallbudgets
Mediumbudgets
Largebudgets
Allorganizations
14 17 7 2 40Our programs are selected almostexclusively on artistic or culturalconsiderations 30.4% 21.8% 14.9% 6.7% 19.9%
24 42 25 16 107Our programs are selected mostly forartistic or cultural considerations, butfinancial goals are also considered
52.2% 53.8% 53.2% 53.2% 53.2%
2 13 9 6 30About half of our programs are popularin nature, allowing us to take moreartistic risks with the other half
4.3% 16.7% 19.1% 20.0% 14.9%
4 6 6 6 22Our programs are selected mostly ontheir potential to meet financial goals,although artistry is also considered
8.7% 7.7% 12.8% 20.0% 10.9%
2 0 0 0 2Our programs are selected almostexclusively on their potential to meetfinancial goals
4.3% 0.0% 0.0% 0.0% 1.0%
46 78 47 30 201Totals100% 100% 100% 100% 100%

♦ 20 ♦ THE URBAN INSTITUTE CENTER ON NONPROFITS AND PHILANTHROPY
Slightly over half of the presenting organizations in the study make their selections based primarilyon artistic quality, although they recognize the need for their choices to meet financial goals. Still,nearly one in five presenting organizations (and roughly one in three of those with the smallestbudgets) say that their selections are made almost exclusively on artistic grounds. Organizationswith larger budgets are more likely to acknowledge the role that finances play in their decisionmaking, although the two organizations that say that they consider only the financial potential oftheir selections are among those organizations with the smallest budgets.
Table 8 illustrates the types of sources that presenting organizations of different sizes rely onwhen making booking decisions. We asked them to rank the usefulness of different sources,ranging from critical (1) to not considered (5). The numbers in table 8 are averages for aparticular category, so lower numbers indicate a higher average reliance on a particular source.
Items in table 8 are ranked according to the preferences of arts presenting organizations withlarge budgets, although the rankings do not differ substantially for smaller entities. On the whole,presenting organizations rely most heavily on personal experience, references, and the reputationof artists when making booking decisions. Booking conferences, booking agents, and promotionalmaterials play a less critical role in these decisions.
Table 8. Average Reliance on Various Sources for Booking Decisions (1=critical to 5=notconsidered), by Budget Size
Smallestbudgets
Smallbudgets
Mediumbudgets
Largebudgets
Own experience at a full-length performance 2.1 1.9 2.0 1.9
References from colleagues 2.0 2.0 2.0 1.9
General reputation of artist 1.9 2.1 1.9 2.0
Audio recordings 2.1 2.5 2.4 2.6
Videotapes 2.4 2.8 2.5 2.6
Critical reviews 2.7 2.9 2.5 2.7
Opinion of professional artist 2.7 2.6 2.8 2.8
Attending a showcase at a booking conference 3.1 2.5 2.6 2.9
Recommendation from booking agent 3.0 3.4 3.1 3.1
Printed promotional material about artist 2.6 2.8 2.8 3.2

♦ 21 ♦ THE URBAN INSTITUTE CENTER ON NONPROFITS AND PHILANTHROPY
Section 5: Sustainability and Financial Stability
This section focuses on the finances of performing arts presenting organizations, including theirown perceptions of their fiscal health and ability to compete. Before turning to these issues,however, we look briefly at the relationship between arts presenting organizations and theirprimary venues. On both the long and short survey forms, we asked presenting organizations toconsider their primary venue, and then tell us whether they own or rent the venue and whetherthey are the exclusive, primary, or occasional user of this venue. Table 9 summarizes theirresponses.
Table 9. Ownership and Usage of Primary Venue, by Budget Size (in percent)
Smallestbudgets
Smallbudgets
Mediumbudgets
Largebudgets
Allorganizations
Owner, exclusive user 12.2 12.1 14.7 25.3 14.9
Owner, primary user 23.0 20.3 35.6 36.8 27.8
Owner, occasional user 11.3 12.4 9.8 11.5 11.6
Subtotal: Own venue 46.5 44.8 60.1 73.6 54.3
Tenant, exclusive user 4.8 7.5 7.4 5.7 5.8
Tenant, primary user 5.2 11.1 14.1 11.5 9.6
Tenant, occasional user 43.5 36.6 18.4 9.2 30.3
Subtotal: Tenant 53.5 55.2 39.9 26.4 45.7
Medium and large budget presenting organizations are more likely to own their primary venue (orbe embedded in a host institution that owns the venue), while smallest and small budgetpresenting organizations are more likely to rent. Smallest and small budget presentingorganizations are also most likely to be only occasional users of the facilities they rent. Whenorganizations from these budget classes own their primary venue, however, they are no more orless likely to be an exclusive, primary, or occasional user than organizations from larger budgetcategories.
We asked presenting organizations that received the long survey a series of questions regardingtheir perception of their financial health and stability. For example, we asked organizations to ratetheir overall financial health on a scale from 1 to 5, with 1 indicating a “weak” condition and 5indicating a “strong” condition. Six of the organizations in the study with smallest budgetsreported a “weak” overall financial health. Two of the organizations with small budgets selectedthis category. None of the organizations with medium or large budgets claimed an overall weakfinancial health. Figure 1 provides a graphic representation of the average values reported bypresenting organizations of different sizes.

♦ 22 ♦ THE URBAN INSTITUTE CENTER ON NONPROFITS AND PHILANTHROPY
Figure 1. On a scale from 1 to 5, how do you rate your organization’s overall financial health ?
1 2 3 4 5 Weak Strong
Smallest Small Medium Large budgets budgets budgets budgets
3.6 3.7 3.9 4.3
The average presenting organization with a large budget scores a 4.3 on this subjective measureof fiscal health, placing it between moderately strong and strong. As budget size categoriesdecrease, however, the average conception of organizational fiscal health decreases. Presentingorganizations with the smallest budgets are the least confident about their financial health.Nonetheless, an average value of 3.6 places them between neutral and moderately strong. Overall,presenting organizations are optimistic about their financial health.
In addition to the general question about financial health, we also asked more specific questionson the long version of the survey about stability, fundraising capacity, financial management, andinvestment management. Figures 2 through 5 provide the average category representations forthese four questions.
Figure 2. On a scale from 1 to 5, how do you rate your organization's financial stability ?
1 2 3 4 5 Weak Strong
Smallest Small Medium Large budgets budgets budgets budgets
3.7 3.9 3.8 4.4
Figure 3. On a scale from 1 to 5, how do you rate your organization’s fundraising capacity ?
1 2 3 4 5 Weak Strong
Smallest Small Medium Large budgets budgets budgets budgets
2.9 3.1 3.4 4.0

♦ 23 ♦ THE URBAN INSTITUTE CENTER ON NONPROFITS AND PHILANTHROPY
Figure 4. On a scale from 1 to 5, how do you rate your organization’s financial management ?
1 2 3 4 5 Weak Strong
Smallest Small Medium Large budgets budgets budgets budgets
3.9 4.1 4.3 4.5
Figure 5. On a scale from 1 to 5, how do you rate your organization’s investment management ?
1 2 3 4 5 Weak Strong
Smallest Small Medium Large budgets budgets budgets budgets
2.7 3.4 3.7 4.3
On the whole, positive ratings tend to increase as budget sizes increase. One exception to thispattern is that presenting organizations with medium budgets are no more certain of their financialstability than organizations with small budgets. Two averages dip below the neutral mark:presenting organizations with the smallest budgets are pessimistic, on average, about theirfundraising capacity and investment management. These concerns are striking given the level ofconfidence that large budget organizations have in these two areas.
We collected more objective information regarding the scope and nature of the finances ofpresenting organizations by asking them about their budgets and financial reserves. The remainderof this section is devoted to budget summaries and discussions of reserves and endowments. Allof this information comes from data collected from the long survey form.
As indicated in table 10, the proportion of income that arts presenting organizations get fromvarious sources varies somewhat by budget size. Smallest budget arts presenting organizationsreceive slightly more than half of their income, on average, from contributions from individuals,foundations, businesses, government, and host institutions. In contrast, large budget presentingorganizations rely more on earned income, deriving roughly one-third of their income fromcontributions. Income from investments is a very small proportion of total revenue for presentingorganizations of all sizes.

♦ 24 ♦ THE URBAN INSTITUTE CENTER ON NONPROFITS AND PHILANTHROPY
Table 10. Revenue Streams, by Budget Size and Hosted Status (in percent)
Smallestbudgets
Smallbudgets
Mediumbudgets
Largebudgets
Freestandingpresenters
Hostedpresenters
Allorganizations
Earned income:Ticket sales 35.0 34.9 39.7 40.6 34.0 39.2 36.4Investment income 3.8 1.4 2.5 3.7 2.9 2.1 2.5Other earned 6.1 15.8 13.7 17.9 16.5 9.4 13.4
Contributed income 50.8 45.9 42.8 34.0 44.9 45.5 45.1
All other income a 4.3 2.0 1.3 3.8 1.7 3.8 2.6
100.0 100.0 100.0 100.0 100.0 100.0 100.0
note a. Where possible, we reallocated items reported in this category to other revenue lines. Revenue categoriesthat we kept in the “other income” line include unlabeled miscellaneous revenues, unrealized gains and assetsreleased from restriction, gains on curtailment of pensions, and (in one case) large interest-free loans from boardmembers.
We hypothesized that the income mix for freestanding and hosted presenters would varysubstantially since hosted presenters seem to receive a high proportion of their contributions fromtheir hosts. For example, a large number of university-hosted presenting organizations reportedthat a university line contribution, often a proportion of student fees, was their primary source ofsupport. Consequently, we were surprised to find that roughly 45 percent of both freestandingand hosted presenter budgets are attributable to contributions. We speculate, however, thathosted presenters must dedicate less time and resources to secure these contributions than theirfreestanding counterparts—time and resources that can be put to other, more productivepurposes. Table 10 also suggests that freestanding presenting organizations rely to a greaterextent than hosted presenting organizations on earned income other than from ticket sales.
We also asked about the ways that presenting organizations spend their money. Table 11 breaksdown types of expenses by budget size. Like revenue categories, expenditure categories vary bybudget size. Arts presenting organizations with the smallest budgets devote a greater proportionof their budget dollars to artistic presentations. As the budget sizes increase, arts presentingorganizations tend to devote greater proportions of their budgets to fundraising andadministrative expenses. While small, medium, and large budget presenting organizations do notdiffer substantially in their marketing and fundraising costs, medium budget presenters spend anotably higher proportion of their budget on management and general expenses. The reasons forthis are not clear, but the finding suggests that medium budget presenters are both less efficientand more stable in their operations than the smaller and larger presenting organizations withwhich they compete for resources.3 This issue calls for verification through further research.
3 High administrative costs are routinely criticized, since they represent a proportion of organizationalexpenditures that potentially could be spent on programs. However, research indicates that organizationswith high administrative costs are more “flexible” and better able to react to crisis than organizations thatdevote a greater proportion of costs to programs.

♦ 25 ♦ THE URBAN INSTITUTE CENTER ON NONPROFITS AND PHILANTHROPY
Table 11. Expenditure Categories, by Budget Size (in percent)
Smallestbudgets
Smallbudgets
Mediumbudgets
Largebudgets
Allorganizations
Artistic salaries, travel, other feesfor presentations
56.2 40.6 31.3 28.8 41.0
Stage and direct production costs 10.2 10.3 10.4 14.3 10.8
Direct marketing expenses 9.2 9.5 8.2 9.4 8.9
Fundraising expenses 2.3 2.3 3.6 5.2 3.0
Management and general expenses 12.1 23.4 34.2 22.9 23.0
All other expenses 10.0 13.9 12.2 19.5 13.2
100.0 100.0 100.0 100.0 100.0
One factor that tempers our ability to draw conclusions about these budget summaries is the allother expenses category. We anticipated that the organizations would be able to divide theirexpenses by the generally accepted accounting categories of program (including presentation andproduction costs), fundraising (including marketing costs), and management/general expenses.We added the “other expense” category as a safety, but did not ask respondents to tell us thekinds of expenses they were including in it. The inclusion of so much expense under “other”(nearly 20 percent, on average, among the largest budget presenters) reflects either pooraccounting and reporting among the presenting organizations or an indication of important budgetexpenses for which we do not account.
On both the long and short form of the survey, we asked organizations to report total operatingexpenses and revenue from their most recently completed fiscal year. Over one-third that reportedfinancial information indicated that their expenses exceeded their revenues. An additional 20percent told us that their expenses precisely equaled their annual revenues. Less than half theorganizations in the study generated a positive operating margin that could be reserved orinvested as a cushion in bad fiscal times. This is not uncommon for arts organizations on thewhole and points to systematic undercapitalization of presenting entities.
Financial reserves are a key resource for organizations that are running deficits or that want toexpand or take artistic risks. The rest of this section focuses on two different types of reserves.One type is unrestricted net assets that management or the board set aside (and often invest) as anoperating reserve. We refer to this type of asset reserve as a quasi-endowment. This type ofreserve differs from the second type of reserve, the endowment, because of the means by whichthe reserve is set aside. While the quasi-endowment is set aside by the decision of staff and board(and is therefore technically unrestricted), the endowment is restricted by decision of its donors.This distinction influences how organizations must account for their reserves, as well as how theycan spend them. The primary purpose of the endowment and quasi-endowment is to generateinvestment income that organizations can use as operating capital.

♦ 26 ♦ THE URBAN INSTITUTE CENTER ON NONPROFITS AND PHILANTHROPY
Table 12 focuses on organizational endowments and quasi-endowments. Roughly two in five(41.4 percent) presenting organizations responding to the long survey form have an endowment,although larger organizations are clearly more likely to have endowments than are smallerorganizations. It is uncommon for the largest organizations to not have an endowment, whilefewer than a quarter of the organizations with the smallest budgets have an endowment.
Table 12. Presenters’ Endowments and Quasi-Endowments, by Budget Size
Smallestbudgets
Smallbudgets
Mediumbudgets
Largebudgets
Median expenses $39,400 $215,250 $985,000 $4,533,300
Percentage of organizations with anendowment
24.4% 32.5% 48.9% 86.7%
Median 2000 endowment $0 $0 $0 $1,450,000Median 2000 endowment amongorganizations with an endowment
$172,500 $125,000 $465,300 $2,500,000
Percent of organizations with a quasi-endowment
34.1% 36.8% 55.6% 60.0%
Median 2000 quasi-endowment $0 $0 $10,000 $226,200
Median 2000 quasi-endowment amongorganizations with a quasi-endowment
$29,300 $27,000 $100,000 $910,400
Percent with either endowment or quasi-endowment
40.0% 51.9% 76.1% 96.7%
Median total endowment + quasi-endowment $0 $0 $100,000 $2,478,500
Median total endowment + quasi-endowmentamong organizations with either anendowment or quasi-endowment
$35,500 $33,000 $200,300 $2,500,000
Median total endowment and quasi-endowment as a percentage of total annualexpenditures (among organizations witheither an endowment or quasi-endowment)
75.6% 18.1% 24.9% 50.9%
Percentage whose endowments + quasi-endowments are more than 100% of totalannual expenditures (among organizationswith endowments or quasi-endowments)
38.9% 22.0% 17.1% 34.5%
Percentage whose endowments + quasi-endowments are more than 200% of totalannual expenditures (among organizationswith endowments or quasi-endowments)
38.9% 19.5% 17.1% 20.7%

♦ 27 ♦ THE URBAN INSTITUTE CENTER ON NONPROFITS AND PHILANTHROPY
Since the mean value for the distribution of endowments is seriously influenced by a few caseswith very high values, we report medians in table 12.4 More than half of medium budget andsmaller organizations do not have endowments; consequently, the median value of endowmentsfor these classes of presenting organizations is $0. However, when one considers only thoseorganizations that have endowments, the median value of endowments for medium budgetorganizations rises to nearly $500,000. Endowed presenters with the smallest budgets exhibit avery high median value relative to annual expenses ($172,500) because the small minority withendowments (10 organizations in this study) have very large endowments. When one considersthe median value for the 18 smallest budget organizations with either an endowment or a quasi-endowment, the median falls substantially to $35,500.
Are these values for financial reserves high, low, or just about right? National Arts Stabilizationsets the bar for an adequate endowment plus quasi-endowment at 200 percent or more of oneyear’s total expenditures. That is, the sum of endowment and quasi-endowment funds should be atleast twice the size of one year’s budget. However, few presenting organizations meet thisstandard. Just over one-third of the largest budget organizations have endowments and quasi-endowments that match just one year’s total expenditures. The smallest organizations, since theirbudgets are small to begin with, have a much smaller amount of money to raise to meet thesestandards. Nearly two in five of the smallest budget presenting organizations not only havereserves that equal one year’s budget, but also meet the standard of having two years’ worth inthe bank.
Two organizations established their endowments as early as the 1950s, but endowments are, onthe whole, a new characteristic of arts presenting organizations. The median endowment age is 12years (established in 1989), and more than 10 percent of the organizations with endowmentsestablished them in 2000. Roughly one in ten organizations with endowments (11.2 percent)report that they have conducted an endowment campaign in the past three years. However, morethan four in ten (42.4 percent) report that they intend to conduct an endowment campaign in thenext three years. Whether or not these new endowments lead to greater stability or a greaterquality or range of program options, the establishment of endowments is a growing phenomenonamong performing arts presenting organizations.
Excessive debt service can imperil an organization, especially if revenues are declining. Manyorganizations that own their venues have mortgage payments, while others have outstanding loansdue to capital improvements or the purchase of working assets. We asked presentingorganizations (those that received the long survey form) about mortgage, equipment, operating,and other loans that will be outstanding beyond one year. Most performing arts presentingorganizations report no long-term debt. When they do, the mean values in each category are notunreasonably high. Only seven organizations in the study reported that their long-term debt isgreater than the total expenditures from their most recent fiscal year. Table 13 reports mean long-term debt by budget size.
4 The median value represents the “middle” value, with half of organizations reporting a lower value andhalf reporting a higher one.

♦ 28 ♦ THE URBAN INSTITUTE CENTER ON NONPROFITS AND PHILANTHROPY
Table 13. Long-Term Debt, by Budget Size
Smallestbudgets
Smallbudgets
Mediumbudgets
Largebudgets
Allorganizations
Mean long-term debt $24,900 $16,200 $173,000 $1,732,300 $366,400
Median long-term debt $0 $0 $0 $0 $0
♦ 29 ♦ THE URBAN INSTITUTE CENTER ON NONPROFITS AND PHILANTHROPY
Section 6: Leadership
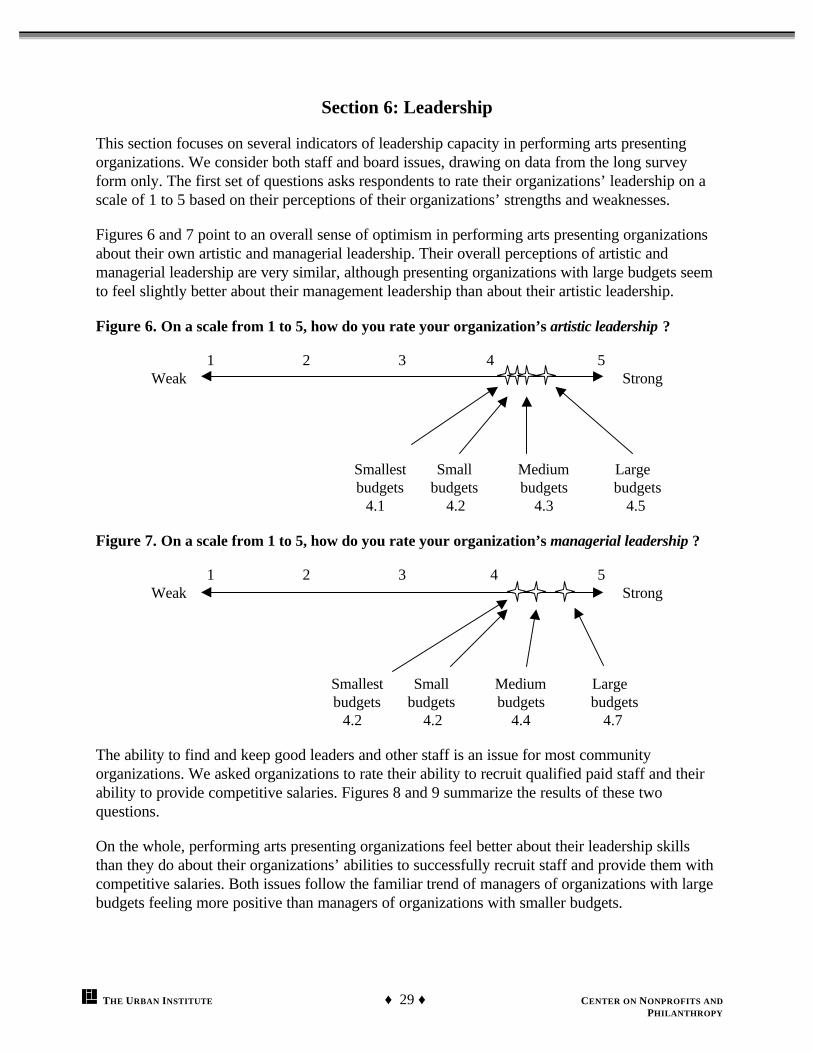
This section focuses on several indicators of leadership capacity in performing arts presentingorganizations. We consider both staff and board issues, drawing on data from the long surveyform only. The first set of questions asks respondents to rate their organizations’ leadership on ascale of 1 to 5 based on their perceptions of their organizations’ strengths and weaknesses.
Figures 6 and 7 point to an overall sense of optimism in performing arts presenting organizationsabout their own artistic and managerial leadership. Their overall perceptions of artistic andmanagerial leadership are very similar, although presenting organizations with large budgets seemto feel slightly better about their management leadership than about their artistic leadership.
Figure 6. On a scale from 1 to 5, how do you rate your organization’s artistic leadership ?
1 2 3 4 5 Weak Strong
Smallest Small Medium Large budgets budgets budgets budgets
4.1 4.2 4.3 4.5
Figure 7. On a scale from 1 to 5, how do you rate your organization’s managerial leadership ?
1 2 3 4 5 Weak Strong
Smallest Small Medium Large budgets budgets budgets budgets
4.2 4.2 4.4 4.7
The ability to find and keep good leaders and other staff is an issue for most communityorganizations. We asked organizations to rate their ability to recruit qualified paid staff and theirability to provide competitive salaries. Figures 8 and 9 summarize the results of these twoquestions.
On the whole, performing arts presenting organizations feel better about their leadership skillsthan they do about their organizations’ abilities to successfully recruit staff and provide them withcompetitive salaries. Both issues follow the familiar trend of managers of organizations with largebudgets feeling more positive than managers of organizations with smaller budgets.

♦ 30 ♦ THE URBAN INSTITUTE CENTER ON NONPROFITS AND PHILANTHROPY
Figure 8. On a scale from 1 to 5, how do you rate your organization’s ability to recruit qualifiedstaff?
1 2 3 4 5 Weak Strong
Smallest Small Medium Large budgets budgets budgets budgets
3.4 3.4 3.8 4.1
While the managers of organizations of all sizes are generally optimistic, average organizationswith smallest and small budgets fall on the weak side of neutral regarding their ability to providecompetitive salaries. Organizations with medium budgets are only slightly more positive thanneutral on this issue.
Figure 9. On a scale from 1 to 5, how do you rate your organization’s ability to providecompetitive salaries ?
1 2 3 4 5 Weak Strong
Smallest Small Medium Large budgets budgets budgets budgets
2.9 2.8 3.3 4.0
The reasons for this concern become clear when one considers the average salary level fororganizations of different sizes and types. We asked respondents to consider the salary of thehighest paid person in the organization, and then to place that salary within one of six salaryranges: up to $30,000; $30,000 to $49,999; $50,000 to $74,999; $75,000 to $99,999; $100,000to $149,999; and $150,000 or higher.5
5 To generate the numbers in table 14, we assume that the range of salaries within a particular categoryaverage around the midpoint of the category The midpoint values assigned to each category are $20,000;$40,000; $62,500; $87,500; $125,000; and $160,000, respectively. The first category midpoint is not theexact midpoint between $0 and $30,000 because we surmise that most people in this category make closerto $30,000 than $0, so $20,000 is a more reasonable estimate for the average. The last category does nothave a midpoint since the category is unbounded. We concluded that $160,000 is a reasonable estimate ofthe average salaries in this highest salary bracket.

♦ 31 ♦ THE URBAN INSTITUTE CENTER ON NONPROFITS AND PHILANTHROPY
Table 14 provides average highest salaries by a variety of organizational characteristics. Thehighest salaries are found in organizations with the largest budgets and in organizations that arelocated in urban areas, although we also need to consider that organizations with the largestbudgets tend to be found in urban areas. The highest salaries are found in traditional freestandingperforming arts facilities; the lowest are among organizations without their own facilities, festivalsand fairs, museums, and local arts agencies. Organizations in New England appear to have highersalaries, but this is explained in part by the fact that our New England respondents tended to havelarger budgets and to be urban-based.
Table 14. Average Estimated Highest Salary, by Various Organizational Characteristics
By budget size By organizational type
Smallest budget $42,400 Presenting facilities with programs $71,200
Small budget $43,700 Culturally specific $59,600
Medium budget $66,100 Producers $56,700
Large budget $123,100 Academic institutions $55,200
Festivals, fairs, & others with no facilities $45,800
By hosted status Museums, local arts agencies, other $45,500
Freestanding $59,300
Hosted $61,100 By geographic location
New England $65,600
By community type Western $65,500
Urban $77,300 Mid-Atlantic $58,900
Suburban $70,000 Southern $58,000
Small city $53,400 Midwest $57,400
Rural $44,900 Mid-America $52,600
An important source of leadership, legitimacy, and funding for many performing arts presentingorganizations is its board of directors. Virtually all of the freestanding organizations in the studyhave a board of directors or governing board, but only slightly more than one-third of the hostedentities have such a board. The mean board size is 21 members, although the mean for presenterswith large budgets (39 members) is nearly twice that size. The median number of board membersis 16 members, although the median for large presenters is 26. Just as we asked long-formrespondents about the artistic and managerial leadership in their organization, we also asked aboutthe strength of their board leadership. Figure 10 illustrates the results from this query.

♦ 32 ♦ THE URBAN INSTITUTE CENTER ON NONPROFITS AND PHILANTHROPY
Figure 10. On a scale from 1 to 5, how do you rate your organization’s board leadership ?
1 2 3 4 5 Weak Strong
Smallest Small Medium Large budgets budgets budgets budgets
3.6 3.5 3.6 4.2
All organizations except the largest have, on average, about the same lukewarm perception oftheir board’s leadership. Comparing figure 10 with figures 6 and 7, which concern artistic andmanagerial leadership, one sees that the average perceived strength of board leadership is lower inall budget categories than the average perception of the strength of artistic and managerialleadership. Part of this difference may be explained by the natural tendency for respondents to ratetheir own leadership more positively than the leadership of others. However, it may also indicate apotential weakness in organization governance.
If boards are not contributing strong leadership to their organizations, at least there is someevidence that they are providing financial support. Only five organizations (among those fillingout the long form) with a board of directors reported that no one on their board contributed to theorganization last year. We asked how much total money board members contributed, and wedivided this number by total contributions to get a measure of reliance on board contributions.The results can be found in table 15.
Table 15. Percentage of Contributions from Board Members
Count Percent Percent of thosewith boards
None 5 2.2 4.4
Up to 5% 39 17.0 34.2
5–50% 57 24.8 50.0
50–99% 5 2.2 4.4
100% 8 3.5 7.0
No board 73 31.7
No report 43 18.7
Total 230 100.0 100.0

♦ 33 ♦ THE URBAN INSTITUTE CENTER ON NONPROFITS AND PHILANTHROPY
Over one-third of the organizations in the study that reported board contributions receive lessthan 5 percent of total contributions from their board. Half of the organizations in the study getmore than 5 percent but less than half of their total contributions from their board. However,more than 11 percent of organizations with boards received more than half of their contributionssolely from their board, with eight organizations reporting that all of their contributions wereboard donations.

♦ 34 ♦ THE URBAN INSTITUTE CENTER ON NONPROFITS AND PHILANTHROPY
Section 7: International Artists and Cultural Diversity
This section focuses on two topics, namely the involvement of performing arts presentingorganizations in the presentation of artists who live outside the United States and the culturaldiversity of the organizations and their constituents. First, we focus on the presentation ofinternational artists. We asked organizations if they present international artists, and we askedquestions about the number of performances and their role in obtaining visas for these visitingartists. The results are found in table 16.
International ArtistsOn three out of the four indicators, larger organizations are generally more involved in thepresentation of international artists than are their smaller counterparts. The first column of thetable indicates the percentage of presenting organizations in each category that presented at leastone international artist last season. Although more than half of the organizations with the smallestbudgets present international artists, they lag behind their larger counterparts. Interestingly,organizations with medium budgets lead the way in both the presentation of international artistsand the number of performances by international artists presented.
Table 16. Presentation of International Artists, by Various Organizational Characteristics
Percentagethat presentinternational
artists
Number ofperformances by
internationalartists last year
Percentage of allperformances that
were byinternational artists
Percentage ofpresenters responsiblefor obtaining visas for
international artists
All 68.2 8.9 15.6 11.5
Smallest budgets 53.3 1.7 21.0 4.2
Small budgets 73.3 7.4 12.0 5.5
Medium budgets 78.6 18.7 16.3 18.2
Large budgets 75.9 14.4 21.9 27.3
Freestanding 66.4 7.3 13.4 14.3
Hosted 70.0 10.7 17.4 7.1
Urban 67.9 11.5 15.6 27.8
Suburban 62.9 10.8 12.5 9.1
Small city 70.1 8.8 17.1 7.4
Rural 69.2 5.0 15.4 2.8

♦ 35 ♦ THE URBAN INSTITUTE CENTER ON NONPROFITS AND PHILANTHROPY
We had expected that urban presenting organizations would be more involved with thepresentation of international artists than presenting organizations in small city or rural settings, butthis is not the case. The only issue for which location seems to make a difference regards takingresponsibility for obtaining visas for international artists, where urban presenting organizations aremuch more involved. Once again, however, this relationship is due in part to the fact that urbanpresenting organizations tend to be the largest presenting organizations, and large organizationshave a greater capacity to manage the bureaucratic process of acquiring a visa. Interestingly,presenters with medium budgets do not lag far behind their larger counterparts in securing visasfor international artists.
Cultural DiversityWe investigated the issue of cultural diversity by asking organizations how they rate the culturaldiversity of their board, staff, presentations, and audience. Figures 11 through 14 illustrate howpresenting organizations responded to these questions. Presenting organizations rate themselvesmoderately weak to neutral on the cultural diversity of their board and staff. Performing artspresenting organizations with large budgets report more diversity, although even their perceptionof the diversity of their staff is on the weak side of neutral. On average, presenting organizationswith medium budgets rate the cultural diversity of their board more weakly than presentingorganizations with smaller budgets.
Figure 11. On a scale from 1 to 5, how do you rate the cultural diversity of your organization’sboard ?
1 2 3 4 5 Weak Strong
Smallest Small Medium Large budgets budgets budgets budgets
3.0 2.8 2.4 3.0
Figure 12. On a scale from 1 to 5, how do you rate the cultural diversity of your organization’sstaff?
1 2 3 4 5 Weak Strong
Smallest Small Medium Large budgets budgets budgets budgets
2.7 2.7 2.4 2.9

♦ 36 ♦ THE URBAN INSTITUTE CENTER ON NONPROFITS AND PHILANTHROPY
Figure 13. On a scale from 1 to 5, how do you rate the cultural diversity of your organization’spresentations ?
1 2 3 4 5 Weak Strong
Smallest Small Medium Large budgets budgets budgets budgets
3.8 4.0 3.6 4.1
Presenting organizations feel much more positively about the diversity of their presentations thanthey do about the diversity of their board and staff. On average, arts presenting organizations ratethe cultural diversity of their presentations as moderately strong. Their assessment of the culturaldiversity of their audiences, however, is less strong. On average, the organizations in the studyrated the diversity of their audiences as neutral.
Figure 14. On a scale from 1 to 5, how do you rate the cultural diversity of your organization’saudience?
1 2 3 4 5 Weak Strong
Smallest Small Medium Large budgets budgets budgets budgets
3.1 3.2 2.9 3.4
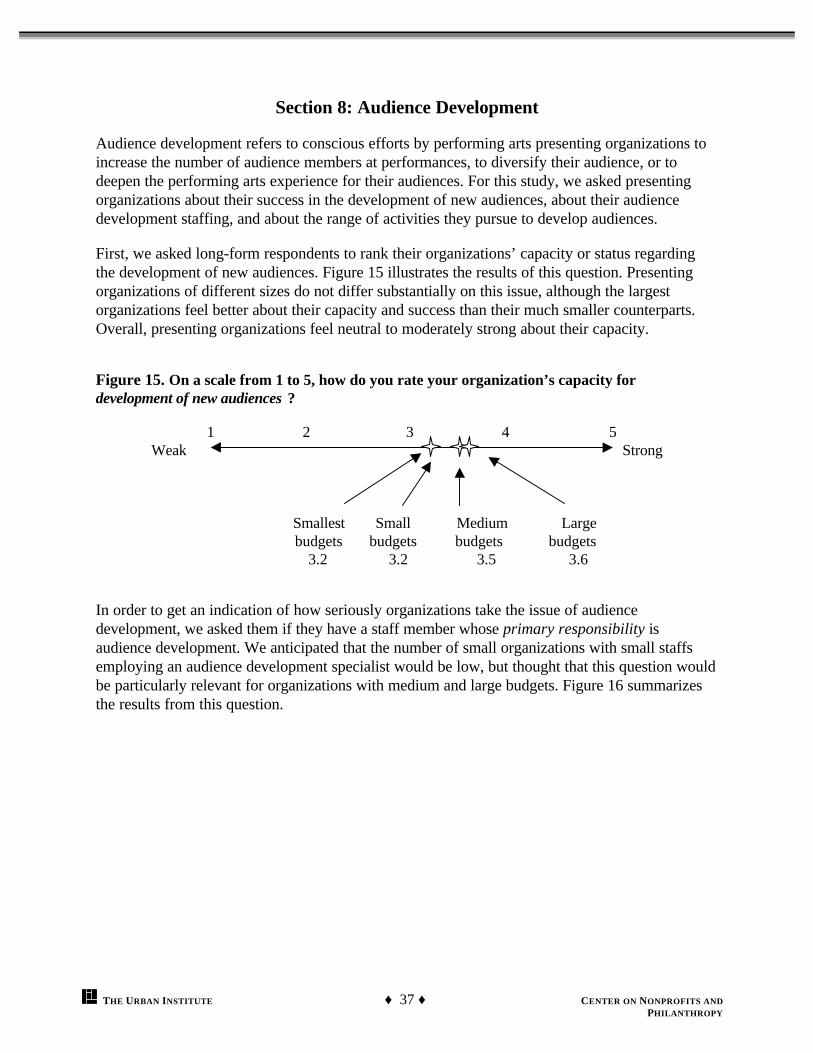
♦ 37 ♦ THE URBAN INSTITUTE CENTER ON NONPROFITS AND PHILANTHROPY
Section 8: Audience Development
Audience development refers to conscious efforts by performing arts presenting organizations toincrease the number of audience members at performances, to diversify their audience, or todeepen the performing arts experience for their audiences. For this study, we asked presentingorganizations about their success in the development of new audiences, about their audiencedevelopment staffing, and about the range of activities they pursue to develop audiences.
First, we asked long-form respondents to rank their organizations’ capacity or status regardingthe development of new audiences. Figure 15 illustrates the results of this question. Presentingorganizations of different sizes do not differ substantially on this issue, although the largestorganizations feel better about their capacity and success than their much smaller counterparts.Overall, presenting organizations feel neutral to moderately strong about their capacity.
Figure 15. On a scale from 1 to 5, how do you rate your organization’s capacity fordevelopment of new audiences ?
1 2 3 4 5 Weak Strong
Smallest Small Medium Large budgets budgets budgets budgets
3.2 3.2 3.5 3.6
In order to get an indication of how seriously organizations take the issue of audiencedevelopment, we asked them if they have a staff member whose primary responsibility isaudience development. We anticipated that the number of small organizations with small staffsemploying an audience development specialist would be low, but thought that this question wouldbe particularly relevant for organizations with medium and large budgets. Figure 16 summarizesthe results from this question.
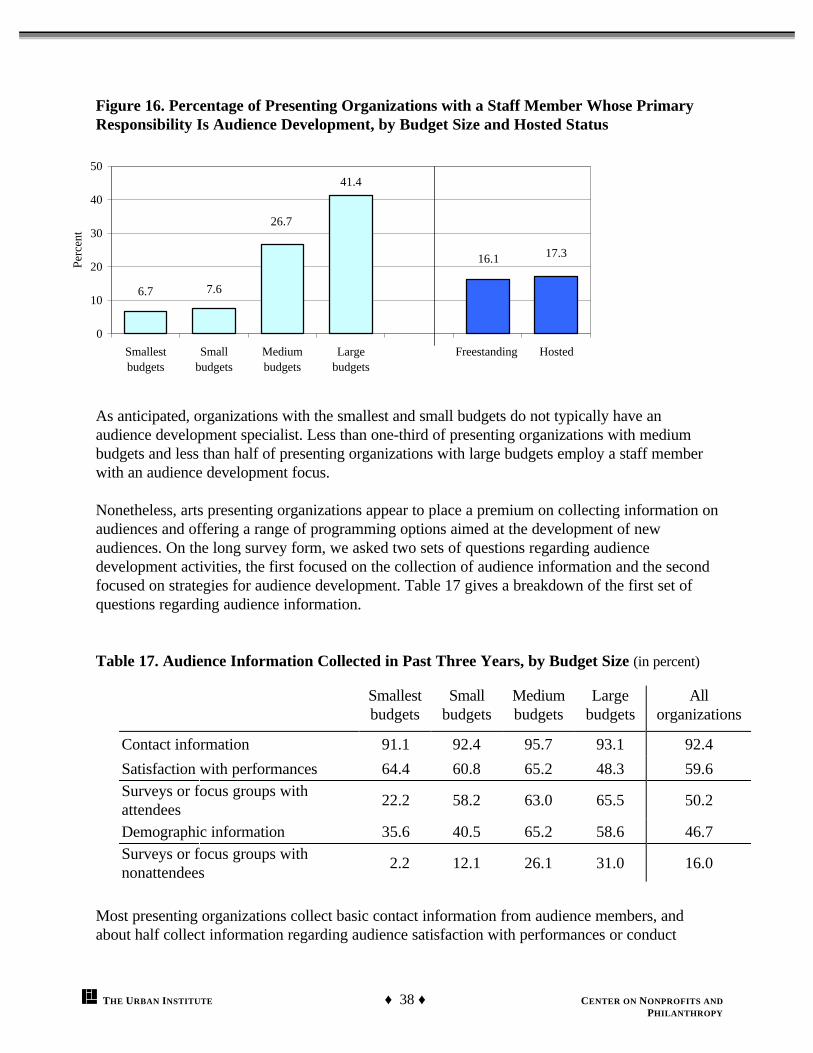
♦ 38 ♦ THE URBAN INSTITUTE CENTER ON NONPROFITS AND PHILANTHROPY
Figure 16. Percentage of Presenting Organizations with a Staff Member Whose PrimaryResponsibility Is Audience Development, by Budget Size and Hosted Status
As anticipated, organizations with the smallest and small budgets do not typically have anaudience development specialist. Less than one-third of presenting organizations with mediumbudgets and less than half of presenting organizations with large budgets employ a staff memberwith an audience development focus.
Nonetheless, arts presenting organizations appear to place a premium on collecting information onaudiences and offering a range of programming options aimed at the development of newaudiences. On the long survey form, we asked two sets of questions regarding audiencedevelopment activities, the first focused on the collection of audience information and the secondfocused on strategies for audience development. Table 17 gives a breakdown of the first set ofquestions regarding audience information.
Table 17. Audience Information Collected in Past Three Years, by Budget Size (in percent)
Smallestbudgets
Smallbudgets
Mediumbudgets
Largebudgets
Allorganizations
Contact information 91.1 92.4 95.7 93.1 92.4
Satisfaction with performances 64.4 60.8 65.2 48.3 59.6Surveys or focus groups withattendees
22.2 58.2 63.0 65.5 50.2
Demographic information 35.6 40.5 65.2 58.6 46.7Surveys or focus groups withnonattendees
2.2 12.1 26.1 31.0 16.0
Most presenting organizations collect basic contact information from audience members, andabout half collect information regarding audience satisfaction with performances or conduct
41.4
17.316.1
26.7
7.66.7
0
10
20
30
40
50
Smallestbudgets
Smallbudgets
Mediumbudgets
Largebudgets
Freestanding Hosted
Perc
ent

♦ 39 ♦ THE URBAN INSTITUTE CENTER ON NONPROFITS AND PHILANTHROPY
surveys or focus groups with attendees. Nearly half collect demographic information, such as ageand income level of attendees. Many fewer have tried to collect information from nonattendees,although a substantial number of presenting organizations with medium and large budgets havedone so. “Other” audience information efforts listed by respondents include collection and analysisof ZIP Codes to see where audiences are drawn from, queries about how audience members areconnected to their host institutions, and participation in a regional audience study.
We had anticipated that the use of audience information collection strategies would increase bybudget category, just as we have seen in most tables of this report. However, that is not the case.In three of five audience information categories, a greater percentage of presenting organizationswith medium budgets pursued a particular strategy than those with large budgets. This findingsuggests that presenting organizations with medium budgets have found it necessary to beparticularly attuned to their audiences.
While collecting information on audiences is one strategy aimed at the development of audiences,we also asked about a range of other strategies. Table 18 lists the types of strategies thatpresenting organizations use for audience development.
Table 18. Use of Audience Development Strategies, by Budget Size (in percent)
Smallestbudgets
Smallbudgets
Mediumbudgets
Largebudgets
Allorganizations
Programs and performances for K–12 68.9 74.7 76.1 93.1 76.9
Free or subsidized performances 73.3 72.2 78.3 82.8 74.7
Program notes 46.7 55.7 63.0 82.8 59.6
Artist residencies 42.2 60.8 65.2 69.0 58.2
Pre- or post-show discussions orlectures
37.8 58.2 65.2 79.3 57.3
Community or public services 57.8 50.6 65.2 55.2 56.9
Services for persons with hearing,sight, or mobility impairments
42.2 50.6 65.2 75.9 54.2
Adult education and outreach 31.1 59.5 45.7 69.0 50.2
Study guides and materials 26.7 45.6 50.0 58.6 43.1
Participation in local audiencecampaigns with other organizations
17.8 27.8 34.8 31.0 28.0
Presenting organizations of all sizes are involved with a broad array of audience developmentstrategies. About three of four presenting organizations deliver programs and performances forschool-aged youth or sponsor free or subsidized performances. Roughly half distribute programnotes, sponsor artists-in-residence, conduct pre- or post-show discussions or lectures, are

♦ 40 ♦ THE URBAN INSTITUTE CENTER ON NONPROFITS AND PHILANTHROPY
involved with community or public services, provide special services for disabled patrons, or havespecial programs for adult education and outreach. Generally, the number of organizations using aparticular strategy increases with budget size. Nonetheless, even presenters with the smallestbudgets display a range of audience development efforts.
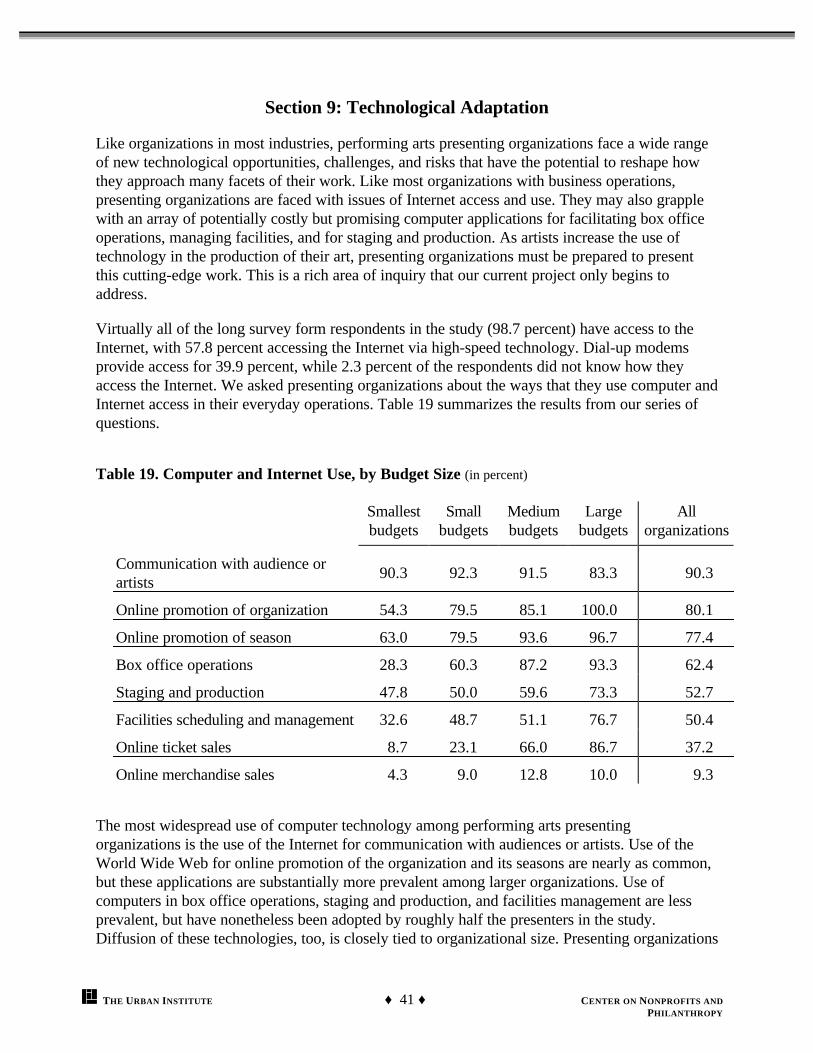
♦ 41 ♦ THE URBAN INSTITUTE CENTER ON NONPROFITS AND PHILANTHROPY
Section 9: Technological Adaptation
Like organizations in most industries, performing arts presenting organizations face a wide rangeof new technological opportunities, challenges, and risks that have the potential to reshape howthey approach many facets of their work. Like most organizations with business operations,presenting organizations are faced with issues of Internet access and use. They may also grapplewith an array of potentially costly but promising computer applications for facilitating box officeoperations, managing facilities, and for staging and production. As artists increase the use oftechnology in the production of their art, presenting organizations must be prepared to presentthis cutting-edge work. This is a rich area of inquiry that our current project only begins toaddress.
Virtually all of the long survey form respondents in the study (98.7 percent) have access to theInternet, with 57.8 percent accessing the Internet via high-speed technology. Dial-up modemsprovide access for 39.9 percent, while 2.3 percent of the respondents did not know how theyaccess the Internet. We asked presenting organizations about the ways that they use computer andInternet access in their everyday operations. Table 19 summarizes the results from our series ofquestions.
Table 19. Computer and Internet Use, by Budget Size (in percent)
Smallestbudgets
Smallbudgets
Mediumbudgets
Largebudgets
Allorganizations
Communication with audience orartists
90.3 92.3 91.5 83.3 90.3
Online promotion of organization 54.3 79.5 85.1 100.0 80.1
Online promotion of season 63.0 79.5 93.6 96.7 77.4
Box office operations 28.3 60.3 87.2 93.3 62.4
Staging and production 47.8 50.0 59.6 73.3 52.7
Facilities scheduling and management 32.6 48.7 51.1 76.7 50.4
Online ticket sales 8.7 23.1 66.0 86.7 37.2
Online merchandise sales 4.3 9.0 12.8 10.0 9.3
The most widespread use of computer technology among performing arts presentingorganizations is the use of the Internet for communication with audiences or artists. Use of theWorld Wide Web for online promotion of the organization and its seasons are nearly as common,but these applications are substantially more prevalent among larger organizations. Use ofcomputers in box office operations, staging and production, and facilities management are lessprevalent, but have nonetheless been adopted by roughly half the presenters in the study.Diffusion of these technologies, too, is closely tied to organizational size. Presenting organizations

♦ 42 ♦ THE URBAN INSTITUTE CENTER ON NONPROFITS AND PHILANTHROPY
with small budgets are less likely to adopt these kinds of technological advances. The gap is mostpronounced in online ticket sales. Online sale of tickets has become the norm for the largestpresenters, while less than 9 percent of the smallest presenters have adopted this advance.
Finally, we asked one question on the long survey form about how presenting organizations feelthey have adapted to technological innovations available in staging and production. Figure 17illustrates how presenting organizations reacted to this question.
Figure 17. On a scale from 1 to 5, how do you rate your organization's adaptation totechnological advances in staging and production ?
1 2 3 4 5 Poor Excellent
Smallest Small Medium Large budgets budgets budgets budgets
3.2 3.2 3.5 4.2
Presenting organizations with the smallest and small budgets tend toward neutral on this question,although organizations with medium budgets are not too different. Organizations with largebudgets, however, feel substantially better about their adaptation to technological advances instagecraft than their smaller counterparts.

♦ 43 ♦ THE URBAN INSTITUTE CENTER ON NONPROFITS AND PHILANTHROPY
Section 10: Size and Scope of the Presenting Field
In this section, we extrapolate findings from the long survey form to create estimates of thenumber of presenters in the United States, the number of people who attend their performances,and the amounts of their earned and contributed income. We rely exclusively on long survey datain this section, although some of the numbers could be generated from the pooled samples. We dothis for two reasons. The first reason regards consistency. In order for our four estimates to becomparable, they should rely on information from the same organizations. The second reasonregards precision. The long survey form received the most vigorous follow-up and attained amuch higher response rate, so we have more confidence in the estimates from the long survey.
Number of PresentersIn Section 2, we estimate that as many as 1,173 of our list of 6,903 potential performing artspresenters are indeed not performing arts presenters. This results in a list of 5,730 organizationsthat likely meet our definition. However, during the course of the project, we uncovered manyadditional presenting organizations that were not included on our initial list. For the purpose ofthe estimates provided in this section, we place the number of performing arts presentingorganizations in the United States at 7,000. This number may be slightly high or slightly low, butwe know it to be approximately accurate.
Based on the returns from the large survey, we can use our 7,000 estimate to extrapolate thenumber of presenting organizations of different types. The largest category of presentingorganizations is traditional performing arts facilities with presenting programs, which numberroughly 2,700. The next largest group, represented by nearly 1,900 organizations, is academicinstitutions with presenting programs. Other types of presenting organizations include presentersthat do not have their own facilities (750); performing groups that also present external artists(425); local arts or recreation agencies (400); festivals and fairs (300); culturally specificpresenting programs (300); museums and libraries with presenting programs (150); andpromoters/producers (75).
Number of AttendeesThe type of presenting organization with the highest average season attendance is fairs andfestivals, which average just over 77,000 attendees. Performing arts facilities with presentingprograms are close behind, averaging just over 76,000 attendees in 2000. The field of 7,000presenting organizations had a total attendance of over 316 million in 2000, which averages toroughly 6 million people a week.
Earned and Contributed RevenuesArts presenters receive over half of their operating capital from earned income, including ticketsales, rentals, concessions, and investments. In 2000, presenters collectively earned nearly $5billion, most of which was used to present their programs.

♦ 44 ♦ THE URBAN INSTITUTE CENTER ON NONPROFITS AND PHILANTHROPY
Giving USA 2001 reports that giving to nonprofit arts, culture, and humanities totaled $11.5billion in 2000. Our research indicates that performing arts presenters—both freestandingnonprofits and presenters that are part of larger organizations—totaled $3.7 billion during thesame time period. Contributed income includes donations from individuals and businesses, grantsfrom foundations and government, and operating stipends from host institutions.

♦ 45 ♦ THE URBAN INSTITUTE CENTER ON NONPROFITS AND PHILANTHROPY
Conclusions
The purpose of this study of performing arts presenting organizations is to provide a currentoverview of the scope, finances, activities, and concerns of the presenting field. This reporthighlights the status of a number of aspects of the sector. However, the following elementsemerged as defining characteristics of the state of the field.
Predominance of Small Presenting OrganizationsThe performing arts presenting field is dominated by small presenting organizations. Presentingorganizations with annual budgets of less than $500,000 outnumber organizations with annualbudgets of at least $2 million by a factor of 6 to 1. Freestanding nonprofit organizationsoutnumber hosted presenters 2 to 1, a finding that holds consistent across organization sizecategories.
Increase in Suburban Presenting OrganizationsMost of the urban presenting organizations in the study were established in the 1970s and earlier.Presenting organizations in small cities, which represent the largest group of organizations in thestudy, have remained steady over time. However, suburban presenting organizations show amarked increase over time. Seventeen of the suburban presenters in the study were foundedbefore 1960, while 45 suburban presenters have been established since 1990.
Ownership of VenuesMedium and large budget presenting organizations are more likely to own their primary venuethan rent it, while smallest and small budget organizations are more likely to rent. Roughly half ofall presenters own their own venues, including nearly three-quarters of the largest budgetpresenters.
Optimism about Financial HealthOn a scale from 1 (weak) to 5 (strong), presenting organizations with the largest budgets ratetheir financial health at an average of 4.3. The average level of optimism decreases with thebudget size of the presenter, but the smallest budget presenters still average on the positive side ofneutral at 3.6.
Reliance on Both Contributions and Earned IncomeArts presenting organizations receive slightly less than half of their income from contributionsfrom individuals, foundations, businesses, government, and host institutions. However, thesmallest budget organizations are the most reliant on contributions, deriving more than half ofrevenues from contributions. In contrast, the average large budget presenting organizationsreceives little more than one-third of revenues from contributions. On the whole, presentingorganization receive slightly more than half of their income from earnings on ticket sales,investments, rentals, coproductions, sale of merchandise and concessions, and other money-generating activities. Income from investments is a very small proportion of total revenue forpresenting organizations of all sizes.

♦ 46 ♦ THE URBAN INSTITUTE CENTER ON NONPROFITS AND PHILANTHROPY
Small Presenting Organizations Avoid Administrative CostsUnlike revenue categories, expenditures categories vary substantially by budget size. Artspresenting organizations with the smallest budgets devote a greater proportion of their budgetdollars to artistic presentations. As the budget sizes increase, presenting organizations devotegreater proportions of their budgets to fundraising and administrative expenses. Medium budgetpresenting organizations appear to have greater difficulty containing these costs than largerbudget presenting organizations.
Endowments Are Small for Most Presenting OrganizationsMany presenting organizations have recently established an endowment or are planning to startone in the near future. Currently, only a small proportion of arts presenters with large budgetshave endowments or other asset reserves that provide their organization with enough investmentdividends to represent a substantial portion of operating capital.
Managers Are Not Optimistic about Competitiveness of SalariesOn a scale from 1 (weak) to 5 (strong), presenting organizations with small and the smallestbudgets are pessimistic (average of 2.8 and 2.9, respectively) about their ability to providecompetitive salaries. The highest salaries are found in organizations with the largest budgets andin organizations that are located in urban areas. Also, the highest salaries are found in traditionalfreestanding performing arts facilities and are lowest among organizations without their ownfacilities, as well as festivals and fairs.
Rural Presenters Active in Presentation of International ArtistsRural presenting organizations are no less likely to present international artists than presentingorganizations based in urban areas. The only issue on which location seems to make a differenceregards taking responsibility for obtaining visas for international artists, where urban presentingorganizations are much more involved.
Medium Budget Presenters Active in Audience DevelopmentMedium budget arts presenting organizations take audience development as seriously as largebudget presenters. They do more to get in touch with their audiences, and they use nearly as manystrategies to develop audiences as do larger presenters. Although they use fewer strategies,smaller presenting organizations also show substantial efforts at development of audiences.
Technology Use Substantial among Presenting OrganizationsAlmost all presenting organizations have access to the Internet. The most widespread use ofcomputer technology among performing arts presenting organizations is the use of the Internet forcommunication with audiences or artists. Use of the World Wide Web for online promotion of theorganization and its seasons are nearly as common, but these applications are more prevalentamong larger organizations. Use of computers in box office operations, staging and production,and facilities management are less prevalent, but have been adopted by roughly half the presentersin the study.

♦ 47 ♦ THE URBAN INSTITUTE CENTER ON NONPROFITS AND PHILANTHROPY
Collectively, Arts Presenters Are an Economic ForceOver 300 million annual attendees provide solid ground for both earned and contributed sourcesof revenue. Earned income in 2000 reached approximately $5 billion, most of which came fromticket sales and most of which was used to present artistic programs. Contributed income fromindividuals and institutions totaled approximately $3.7 billion.