the capital allocation inherent in the federal reserve…/media/tch... · federal reserve’s...
TRANSCRIPT
The Capital Allocation Inherent in the Federal Reserve’s
Capital Stress Test
January 2017

2 THE CAPITAL ALLOCATION INHERENT IN THE FEDERAL RESERVE’S CAPITAL STRESS TEST
EXECUTIVE SUMMARYPost-crisis, U.S. bank regulators have imposed capital requirements that are very high relative to
historical norms and current international standards. They have also imposed more granular capital
requirements, determining the risk of each type of asset and imposing a particular capital requirement
to it. A question arises as to whether this has made a fundamental change in U.S. finance: historically,
banks decided how to allocate capital and thereby which businesses to enter or exit and which loans
to underwrite based on risk adjusted returns on capital; bank capital requirements ensured that
a cushion of capital was available in the event the bank erred in its judgments. Under the current
regime, regulation appears to be playing a significant role in determining how capital is allocated and
credit is underwritten because regulatory capital requirements are so high and granular that they
could be driving banks into or out of certain asset classes.
This research note attempts to determine which businesses or assets are being favored and disfavored
by post-crisis regulatory rules – most notably, the Federal Reserve’s Comprehensive Capital Adequacy
Review (CCAR) stress test, which is the binding capital constraint for a majority of large banks and
their affiliates (including the nation’s largest lenders and broker-dealers). While the models used by
the Federal Reserve in its CCAR stress test remain secret, this note derives the capital requirements
for various asset classes implicit in that test by examining the post-stress regulatory capital ratios
produced by the stress tests controlling for differences in portfolio composition and equity
distributions across banks.
The note then compares those capital requirements with the capital requirements similarly derived
from banks’ own modeled results in the Fed’s stress testing process – the capital requirements they
would impose on themselves if risk management and credit underwriting were left to them. It
also compares the Federal Reserve’s CCAR capital requirements to those imposed under the Basel
standardized approaches to capital, a series of simplified models for measuring credit, market and
other risks agreed to among global regulators, including U.S. regulators.
The results show that the Federal Reserve’s CCAR stress test is imposing dramatically higher
capital requirements on certain asset classes – most notably, small business loans and residential
mortgages – than bank internal (Fed approved) models and Basel standardized models. For some
asset classes – for example, commercial real estate – the Federal Reserve’s CCAR stress test produces
results similar to the results of the banks’ modeled results, and lower capital requirements relative to
the relevant standardized model.
In summary, the results in this note suggests that the asset allocation power of CCAR has been
significantly overlooked, as has the potential effect of CCAR’s choices with regard to the availability
of credit to small businesses and other economic actors.
3 THE CAPITAL ALLOCATION INHERENT IN THE FEDERAL RESERVE’S CAPITAL STRESS TEST
INTRODUCTIONIn the aftermath of the global financial crisis, a series of key capital and other regulations has
been enacted in the United States and elsewhere, including the Basel III capital and liquidity
frameworks and the Federal Reserve’s stress testing program. These regulations have made banks
significantly more resilient, but their design and calibration have altered the incentives of banks to
hold various assets and originate different types of loans.
Traditionally, banks allocated capital among their businesses based on their own assessment of
risk-adjusted return on capital. Some regulatory capital requirements – most notably, a 50 percent
risk weight for mortgages under the pre-crisis Basel I regime – affected bank capital allocation
decisions, but generally banks assessed economic capital and decided asset allocation and credit
underwriting. As capital requirements have grown significantly higher and more granular by asset
post-crisis, that situation has changed.
In this research note, we attempt to identify which specific capital requirements are most likely to
be “binding” for large banks and the implications of binding regulatory constraints for banks’ capital
allocation decisions. In particular, we reach four key conclusions:
1. Despite the large number of different capital requirements to which large U.S. banks are subject, the
Federal Reserve’s Comprehensive Capital Adequacy Review (CCAR) stress tests generally are the most
stringent capital requirements, and therefore are mostly likely to constrain large banks in deciding how
to allocate capital. Under those stress tests, large banks also provide their own estimates of post-stress
regulatory capital ratios, but those tend to be generally less binding than the post-stress capital ratios
resulting from the Federal Reserve’s CCAR models and assumptions.1
2. Although the opacity of the Federal Reserve’s CCAR models and assumptions makes it difficult to
precisely identify CCAR’s implicit capital requirements for different assets at any detailed level, we
are able to estimate the implicit risk weights in U.S. stress tests using the post-stress capital ratios
published by the Federal Reserve under CCAR and banks’ own Dodd-Frank Act Stress Tests (DFAST)
results over the past three stress testing cycles, 2014 through 2016. Specifically, for each major loan
portfolio and for trading assets, we estimate the risk-weights that would best describe banks’ post-
stress regulatory capital ratios under the severely adverse scenario, controlling for differences in
equity distributions. Our main findings can be summarized as follows:
» For commercial and industrial loans, CCAR capital requirements are 25 percent higher than under
banks’ own DFAST projections and 50 percent higher than under the Basel III standardized approach;
1 For example, the Federal Reserve assumes the estimated model parameters are the same for all bank holding companies due to the challenge of estimating a separate model for each bank and to avoid historical bank-specific results prevailing in future stress episodes. This approach implies, for example, that loss given default of a particular type of loan – a key determinant of expected losses - is the same across all banks despite demonstrated differences in banks’ ability to recover the principal of a defaulted loan.
4 THE CAPITAL ALLOCATION INHERENT IN THE FEDERAL RESERVE’S CAPITAL STRESS TEST
» For commercial real estate loans, CCAR capital requirements are 30 percent lower than under banks’
own DFAST projections and 70 percent lower than under the Basel III standardized approach;
» For small business loans, CCAR capital requirements are 80 percent higher than under banks’
own DFAST projections and 220 percent higher than under the Basel III standardized approach;
» For first-lien mortgage loans, CCAR capital requirements are 45 percent higher than under banks’
own DFAST projections and 95 percent higher than under the Basel III standardized approach;
» For consumer loans, CCAR capital requirements are 15 percent lower than under banks’ own DFAST
projections and 45 percent lower than under the Basel III standardized approach;
» For other loans, CCAR capital requirements are 70 percent lower than under banks’ own DFAST
projections and 20 percent higher than under the Basel III standardized approach;
» Lastly, for trading assets, CCAR capital requirements are 20 percent higher than under banks’
own DFAST projections and 340 percent higher than under the Basel III standardized approach.
Alternatively, if data for individual bank exposures were available it would be possible to compare
directly losses generated by the Federal Reserve’s models against other measures of expected loss.
3. Because CCAR is the binding capital requirement, banks will tend to shift lending away from sectors
with higher implicit capital requirements under CCAR, sectors that are disfavored by the severe
macroeconomic scenarios in the tests, and toward sectors with lower capital requirements2. For
example, the results of our analysis are consistent with the slower growth of small business loans
and mortgage loans at large banks, which have higher implicit capital requirements under CCAR,
following the imposition of stress tests in 2011. In addition, large banks hold approximately 60 percent
of all small business loans and closed-end mortgages on their books, and the increase in lending at
banks not subject to stress tests has likely not offset the relative shrinkage in lending at banks subject
to stress tests. In contrast, the capital requirements of commercial real estate loans are somewhat
lower than those under the Basel III standardized approach, which is consistent with their being no
meaningful differences in the growth of such loans at large banks versus other banks.
4. By imposing higher capital requirements on loans to small businesses and mortgage loans, stress tests
are likely curtailing credit availability to the types of borrowers that lack alternative sources of finance. Both
small businesses and the housing sector perform a very important role in the U.S. economy. For instance,
small businesses account for more than 40 percent of private nonfarm gross domestic product and the
2 See an earlier TCH research note on “2016 Federal Reserve’s Stress Testing Scenarios,” March 2016. Available at https://www.theclearinghouse.org/-/media/action%20line/documents/volume%20vii/20160316%20tch%20research%20note%20ccar.pdf?la=en.
5 THE CAPITAL ALLOCATION INHERENT IN THE FEDERAL RESERVE’S CAPITAL STRESS TEST
formation of new businesses contribute substantially for the creation of new jobs. Thus, by curtailing credit
to these two key sectors of the U.S. economy, stress tests may be having an adverse impact on economic
growth and contributing to the widening of income inequality among households. Conversely, our results
also suggest that stress tests impose lower capital requirements for CRE and consumer loans, however these
offsets are likely to be less important from an economic growth perspective as it likely reflects large banks’
concentration in the lower-risk end of the CRE lending spectrum and still tight consumer lending standards.
ESTIMATING THE CAPITAL SURPLUSThe current framework to assess the capital adequacy of large U.S. banks is vast and complex. Under the
Basel III standardized capital requirement, banks are subject to three risk-based capital ratios (common
equity tier 1 capital ratio, a tier 1 capital ratio and total capital ratio); and a non-risk-based capital ratio (the
tier 1 leverage ratio).3 In addition to the standardized approach ratios, thirteen advanced approaches
bank holding companies are required to calculate their risk-based capital ratios under the advanced
approaches and are also subject to a supplementary leverage ratio. Large U.S. banks are also subject to
CCAR stress tests in which banks’ performance is assessed using post-stress capital ratios, three of which
are risk-based and one of which is leverage-based. Moreover, these post-stress capital ratios also vary
by stress scenario – with two scenarios (adverse and severely adverse) designed by Federal Reserve staff
and one stress scenario designed by the BHC (with considerable Federal Reserve staff input) – and two
different set of assumptions on payout policies (DFAST and CCAR). Thus, under the U.S. stress tests, large
banks need to evaluate their regulatory capital ratios in a multitude of different ways. For convenience,
Table 1 lists all capital requirements under Basel III and in stress tests.
In the remainder of this section we describe the methodology used to measure the “capital surplus”
of each bank that participates in the stress tests. The capital surplus is the amount of capital in
excess of the most binding regulatory capital requirement across all of the 28 requirements listed
in Table 1. For instance, a bank passes the quantitative portion of the stress tests if its post-stress
common equity tier 1 ratio is above 4.5 percent, its tier 1 risk-based capital ratio is above 6 percent,
its total risk-based capital ratio is above 8 percent, and its tier 1 leverage ratio is above 4 percent.
Thus, under the U.S. stress tests the capital surplus is defined as:
where j = DFAST/Adverse, DFAST/Severely Adverse, CCAR/Adverse, CCAR/Severely Adverse. We also
normalize the capital surplus by risk-weighted assets for convenience. 4
3 In the U.S., the thirteen bank holding companies subject to the Advanced Capital Adequacy Framework 12 CFR Parts 208 and 225 (Advanced Approaches) are American Express Company, Bank of America Corporation, Bank of New York Mellon Corporation, Capital One Financial Corporation, Citigroup, Inc., Goldman Sachs Group, Inc., JPMorgan Chase & Co., Morgan Stanley, Northern Trust Corporation, PNC Financial Services Group, Inc., State Street Corporation, U.S. Bancorp, and Well Fargo & Company.
4 Since information on the post-stress capital ratios derived from the stress scenario designed by each BHC is not publicly available, the capital surplus under the stress tests excludes those results.

6 THE CAPITAL ALLOCATION INHERENT IN THE FEDERAL RESERVE’S CAPITAL STRESS TEST
Regulatory capital ratioBasel III
Risk-weighting Requirement (%)
Common equity tier 1Standardized approach 4.5 + CCB + GSIB surcharge + CCyB
Advanced approaches 4.5 + CCB + GSIB surcharge + CCyB
Tier 1 risk-based capital ratioStandardized approach 6.0 + CCB + GSIB surcharge + CCyB
Advanced approaches 6.0 + CCB + GSIB surcharge + CCyB
Total risk-based capital ratioStandardized approach 8.0 + CCB + GSIB surcharge + CCyB
Advanced approaches 8.0 + CCB + GSIB surcharge + CCyB
Tier 1 leverage ratio - 5.0
Suplementary leverage ratio Advanced approaches 3.0 + 2.0 (GSIB only)
Regulatory capital ratioStress Tests
Payout Assumptions Scenario Requirement (%)
Common equity tier 1 DFAST Adverse 4.5
Common equity tier 1 DFAST Severely Adverse 4.5
Common equity tier 1 CCAR Adverse 4.5
Common equity tier 1 CCAR Severely Adverse 4.5
Common equity tier 1 CCAR Bank Own Scenario 4.5
Tier 1 risk-based capital ratio DFAST Adverse 6.0
Tier 1 risk-based capital ratio DFAST Severely Adverse 6.0
Tier 1 risk-based capital ratio CCAR Adverse 6.0
Tier 1 risk-based capital ratio CCAR Severely Adverse 6.0
Tier 1 risk-based capital ratio CCAR Bank Own Scenario 6.0
Total risk-based capital ratio DFAST Adverse 8.0
Total risk-based capital ratio DFAST Severely Adverse 8.0
Total risk-based capital ratio CCAR Adverse 8.0
Total risk-based capital ratio CCAR Severely Adverse 8.0
Total risk-based capital ratio CCAR Bank Own Scenario 8.0
Tier 1 leverage ratio DFAST Adverse 4.0
Tier 1 leverage ratio DFAST Severely Adverse 4.0
Tier 1 leverage ratio CCAR Adverse 4.0
Tier 1 leverage ratio CCAR Severely Adverse 4.0
Tier 1 leverage ratio CCAR Bank Own Scenario 4.0 Note: The capital conservation buffer (CCB) is set at a level of 2.5%. The surcharge for global systemically important bank holding companies (GSIB surcharge) currently applicable to U.S. GSIBs ranges from 3.5% for JPMorgan Chase & Co.; 3.0% for Citigroup Inc., Bank of America Corporation and Morgan Stanley; 2.5% for Goldman Sachs and Wells Fargo & Company; and 1.5% for Bank of New York Mellon Corporation and State Street Corporation. The Basel III column lists the capital requirements after calendar year 2019 and thereafter (post-transition). Finally, the countercyclical capital buffer (CCyB) is currently set at a level of 0% in the U.S.
TABLE 1. CAPITAL REQUIREMENTS UNDER BASEL III AND STRESS TESTS

7 THE CAPITAL ALLOCATION INHERENT IN THE FEDERAL RESERVE’S CAPITAL STRESS TEST
In addition, we calculate the capital surplus under Basel III and stress tests separately to assess the
extent to which the capital requirements under each regulatory framework are binding. The capital
surplus under Basel III is defined in a similar way, except that the capital thresholds change as follows:
1. Common equity tier 1 ratio req. = 4.5% (reg. min. )+ 2.5 % CCB + 0% CCyB + GSIB (varies across banks)
2. Tier 1 capital ratio req. = 6.0% (reg. min. )+ 2.5 % CCB + 0% CCyB + GSIB (varies across banks)
3. Total capital ratio req. = 8.0% (reg. min. )+ 2.5 % CCB + 0% CCyB + GSIB (varies across banks)
4. Tier 1 leverage ratio = 5.0% (well-capitalized requirement).
For the advanced approaches institutions, all ratios are calculated using both banks’ internal models
(which are subject to Federal Reserve review and prior approval) and the standardized approach.
The capital surplus is then defined using the regulatory capital ratio that yields the lowest amount
of excess capital above its requirement. Lastly, we also collected data on total leverage exposure
for the advanced approaches institutions and include the enhanced supplementary leverage ratio
in the calculation of the capital surplus for the GSIBs, but only at the end of 2015, the first year the
information is available for such institutions.
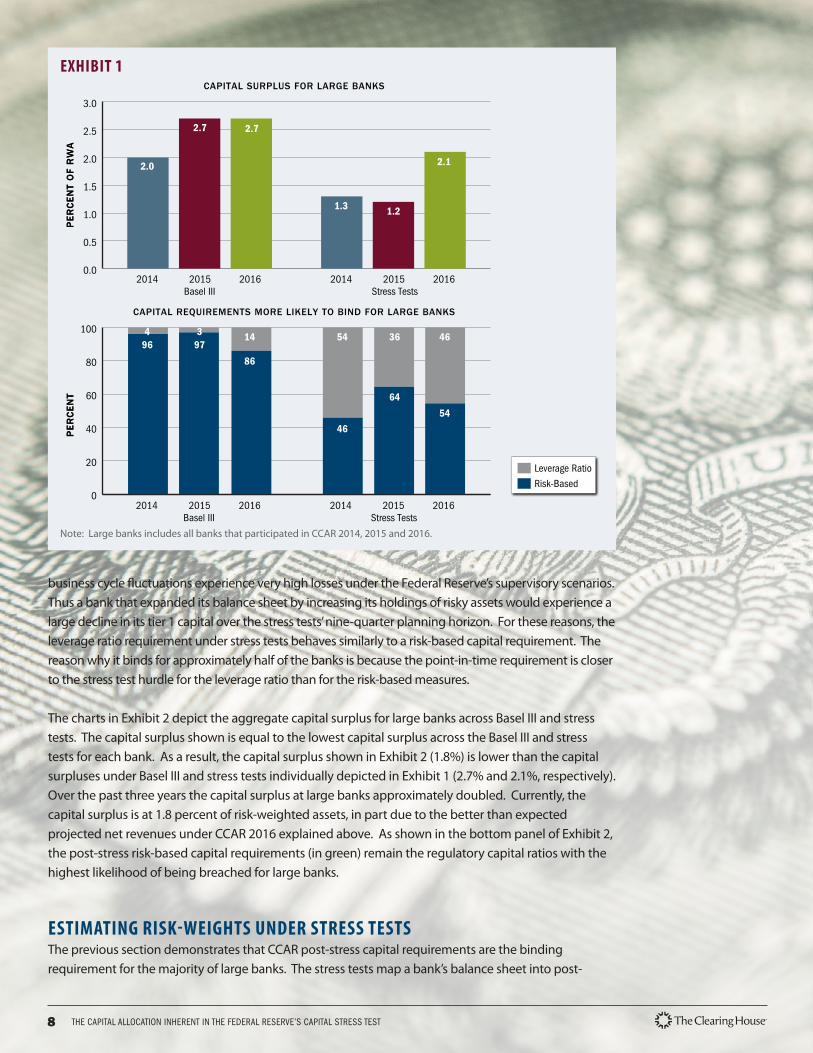
The top bar chart of Exhibit 1 shows the capital surplus for large banks over the past 3 years under
Basel III and CCAR stress tests, respectively. 5 The capital surplus under the stress tests was roughly
half of the capital surplus under Basel III up to 2015, and that difference was halved in 2016 due to an
increase in capital surplus under the stress tests. Notably, the capital surplus under the stress tests
increased in CCAR 2016 as compared to prior CCAR exercises, largely as a result of higher net revenues
under stress, reportedly due to a fall in expenses associated with mortgage related settlements and a
lower decline in fee income during stress as a result of negative short-term interest rates. 6 As shown in
the bottom panel of Exhibit 1, the post-stress leverage ratio yields the lowest capital surplus for about
half of the banks that participate in the stress tests. In contrast, under Basel III, the risk-based capital
ratios are generally the binding requirement, although the inclusion of the enhanced supplementary
leverage ratio in our sample in 2016 raised slightly the incidence of a binding leverage ratio under the
current Basel III rules.
As noted above, the post-stress tier 1 leverage ratio is the requirement within the stress tests most
likely to bind for approximately half of the banks that participate in such exercise. The leverage ratio as
a post-stress minimum requirement operates in a significantly more risk-sensitive manner than does
the point-in-time leverage ratio. Under the stress tests, banks with exposures that are very sensitive to
5 For clarity, the year referenced is with regard to the previous quarter of the applicable CCAR cycle. For instance, 2016 refers to data as of December 31, 2015.
6 See, “Dodd-Frank Act Stress Test 2016: Supervisory Stress Test Methodology and Results,” box 2 on page 20, available at https://www.federalreserve.gov/newsevents/press/bcreg/bcreg20160623a1.pdf.
8 THE CAPITAL ALLOCATION INHERENT IN THE FEDERAL RESERVE’S CAPITAL STRESS TEST
business cycle fluctuations experience very high losses under the Federal Reserve’s supervisory scenarios.
Thus a bank that expanded its balance sheet by increasing its holdings of risky assets would experience a
large decline in its tier 1 capital over the stress tests’ nine-quarter planning horizon. For these reasons, the
leverage ratio requirement under stress tests behaves similarly to a risk-based capital requirement. The
reason why it binds for approximately half of the banks is because the point-in-time requirement is closer
to the stress test hurdle for the leverage ratio than for the risk-based measures.
The charts in Exhibit 2 depict the aggregate capital surplus for large banks across Basel III and stress
tests. The capital surplus shown is equal to the lowest capital surplus across the Basel III and stress
tests for each bank. As a result, the capital surplus shown in Exhibit 2 (1.8%) is lower than the capital
surpluses under Basel III and stress tests individually depicted in Exhibit 1 (2.7% and 2.1%, respectively).
Over the past three years the capital surplus at large banks approximately doubled. Currently, the
capital surplus is at 1.8 percent of risk-weighted assets, in part due to the better than expected
projected net revenues under CCAR 2016 explained above. As shown in the bottom panel of Exhibit 2,
the post-stress risk-based capital requirements (in green) remain the regulatory capital ratios with the
highest likelihood of being breached for large banks.
ESTIMATING RISK-WEIGHTS UNDER STRESS TESTSThe previous section demonstrates that CCAR post-stress capital requirements are the binding
requirement for the majority of large banks. The stress tests map a bank’s balance sheet into post-
EXHIBIT 1
201620152014 201620152014
Leverage Ratio
Risk-Based
0.0
0.5
1.0
1.5
2.0
2.5
3.0
Stress TestsBasel III
0
20
40
60
80
100
Stress TestsBasel III
PE
RC
EN
T O
F R
WA
PE
RC
EN
T
201620152014 201620152014
2.0
496
397
14
86
54
46
36
64
46
54
2.7 2.7
1.3 1.2
2.1
PE
RC
EN
T O
F R
WA
PE
RC
EN
T
CAPITAL SURPLUS FOR LARGE BANKS
CAPITAL REQUIREMENTS MORE LIKELY TO BIND FOR LARGE BANKS
Note: Large banks includes all banks that participated in CCAR 2014, 2015 and 2016.

9 THE CAPITAL ALLOCATION INHERENT IN THE FEDERAL RESERVE’S CAPITAL STRESS TEST
stress regulatory capital ratios, and so can also be viewed as a process that generates risk-weights which
can then be applied to exposures on the balance sheet, just like standardized or advanced approaches risk
weights. In an ideal world, the Federal Reserve would publish the (average) risk-weights consistent with the
projections for expected losses under the severely adverse scenario. However, the risk-weights under the
severely adverse scenario are not provided and, moreover, the models used by the Federal Reserve are not
disclosed to the banks or the public. Thus, we estimate the implicit risk weights in stress tests using the Federal
Reserve’s projection of banks’ post-stress test regulatory capital ratios as well as information on banks’ balance
sheets. Specifically, we use a model to estimate the risk-weights that would best describe banks’ post-stress
regulatory capital ratios under the severely adverse scenario, controlling for differences in equity distributions
across banks. We also repeated the analysis using banks’ own DFAST submissions to report the differences
between the Federal Reserve and the risk-weights implicit in banks’ own stress test estimates.
In the second part of the analysis we use the estimated risk-weights to calculate the amount of capital banks
are required to hold to make various types of loans while satisfying the minimum capital requirements
imposed by the stress tests. Specifically, using the estimation results, we are able to calculate capital
requirements under stress tests and compare them to requirements under the Basel III standardized approach.
Lastly, we then examine whether the stress-test risk weights actually affect bank behavior – that is, whether
they are incentivizing affected banks to deploy less capital to segments with higher implicit risk weights and
more capital toward segments with lower risk weights.
Before we describe the statistical model, it is useful to provide some intuition on how the stress test results
can be used to estimate the implicit risk weights in stress tests. In the stress tests, the Federal Reserve assesses
EXHIBIT 2
Stress tests/Risk-based
B3/Non-riskbased
Stress tests/LR
B3/Risk-based
0.0
0.2
0.4
0.6
0.8
1.0
1.2
1.4
1.6
1.8
2.0
201620152014
0
10
20
30
40
50
60
70
80
90
100
201620152014
1.01.1
1.8
22 19 21
42
135
61
217
38
833
PE
RC
EN
T O
F R
WA
PE
RC
EN
TCAPITAL SURPLUS ACROSS ALL REQUIREMENTS FOR LARGE BANKS
CAPITAL REQUIREMENTS MORE LIKELY TO BIND FOR LARGE BANKS
Note: Large banks includes all banks that participated in CCAR 2014, 2015 and 2016.

10 THE CAPITAL ALLOCATION INHERENT IN THE FEDERAL RESERVE’S CAPITAL STRESS TEST
the impact of a severe macroeconomic scenario on the numerator of banks’ regulatory capital ratios.
This analysis requires projecting banks’ loan losses and revenues over a nine-quarter planning horizon,
and takes as a given banks’ proposed capital actions (dividends and share repurchases). In particular,
as economic conditions deteriorate significantly under the severely adverse supervisory scenario, loan
loss provisions rise and pre-provision net revenues decline, causing a deterioration of a bank’s capital
over the nine-quarter planning horizon. 7 In contrast, the denominator of the risk-based capital ratios
– risk-weighted assets – are essentially unchanged over the planning horizon. Thus, stress tests leave
risk-weighted assets roughly unchanged, and all losses reduce capital levels directly; in effect, a bank
must hold dollar-for-dollar post-stress capital against all such losses. Although there is no straightforward
way of obtaining exact estimates of the stress test risk-weights using publicly available data, we use a
model to estimate the risk-weights that would best describe banks’ post-stress regulatory capital ratios.
Estimates of the implicit risk-weights associated with the post-stress capital ratios allow a meaningful
comparison to Basel III risk-weights under the standardized approach. This approach in turn yields an
estimate of the risk weights for a granular range of exposures in the loan book and trading book, as well
as operational risk. In particular, the estimated model is as follows:
where indexes each bank, indexes each of the risk-based capital ratios in stress tests; represents
the implied risk-weights and denotes the various exposures that are subject to a non-zero
risk weight under Basel III. The specification estimated in equation (1) immediately above has the
following 10 subcomponents: (i) commercial and industrial (C&I) loans; (ii) commercial real estate
loans; (iii) small business loans; (iv) first-lien residential real estate loans; (v) other residential real estate
loans; (vi) consumer loans; (vii) other loans; (viii) trading assets; (ix) operational risk; and (x) securities.
The estimate uses the post-stress risk-based capital ratios under CCAR, and the set of explanatory
variables also includes total payouts to control for differences in equity distributions across banks.8
Since the relationship between post-stress capital ratios and subcomponents of risk-weighted assets is
nonlinear, the model is estimated using nonlinear least squares.9 Lastly, the implicit risk-weights vary
modestly across the three post-stress regulatory capital requirements shown on Table 2 because the
maximum decline in a bank’s regulatory capital requirements varies across the definitions of capital
used in each measure.
7 Risk-weighted assets are weakly tied to the increase in the risk of the exposures or changes in the composition of banks’ portfolios. For instance, market risk weighted assets are assumed to increase as the volatility of the portfolio’s underlying assets rises under the severe macroeconomic scenarios. Credit risk weighted assets are calculated using the standardized approach, thus the risk-weights are invariant to the macroeconomic scenario. However, exposures on loans and securities are assumed to increase at average industry rate for total loans and non-loan assets, respectively.
8 It would have been more accurate to estimate the model using post-stress regulatory capital ratios before distributions. However, bank payouts are not readily available in DFAST/CCAR disclosures.
9 We have only included post-stress capital ratios under CCAR after 2014 (inclusive) even if Federal Reserve’s DFAST post-stress regulatory capital ratios were lower.

11 THE CAPITAL ALLOCATION INHERENT IN THE FEDERAL RESERVE’S CAPITAL STRESS TEST
Common Equity Tier 1 Tier 1 Capital Total CapitalBanks’ own
DFAST CCAR Banks’ ownDFAST CCAR Banks’ own
DFAST CCAR
(1) (2) (1) (2) (1) (2) (1) (2) (1) (2) (1) (2)
Commercial and Industrial loans 2.10*** (0.28)
2.03***(0.23)
2.15***(0.45)
2.13***(0.40)
2.13***(0.27)
2.02***(0.19)
2.71***(0.38)
2.49***(0.32)
1.99***(0.22)
1.90***(0.16)
2.37***(0.32)
2.22***(0.27)
Commercial Real Estate loans 0.19(0.44)
0.26(0.45)
0.58(1.02)
0.58(1.01)
0.67*(0.37)
0.68**(0.32)
0.48(0.41)
0.46(0.43)
0.84**(0.34)
0.85***(0.28)
1.13***(0.37)
1.13***(0.37)
Small Business loans 4.15***(1.16)
3.70***(1.04)
5.17**(2.23)
5.14**(2.12)
3.33***(0.99)
2.97***(0.95)
5.60***(1.32)
5.27***(1.38)
2.80***(0.88)
2.46***(0.85)
3.92***(1.03)
3.63***(1.06)
First Lien Closed-End mortgages 1.33***(0.30)
1.36***(0.28)
1.99***(0.52)
1.99***(0.50)
1.16***(0.31)
1.15***(0.25)
1.72***(0.40)
1.67***(0.39)
1.06***(0.27)
1.04***(0.23)
1.08***(0.33)
1.05***(0.32)
Other RRE loans-0.37 - -0.08 - -0.45 - -0.89* - -0.45 - -0.62 -
(.48) (0.73) (0.55) (0.51) (0.45) (0.51)
Consumer loans1.21*** 1.11*** 0.70*** 0.70*** 1.09*** 1.08*** 0.87*** 0.90*** 1.10*** 1.07*** 0.93*** 0.96***
(0.21) (0.05) (0.26) (0.26) (0.20) (0.06) (0.19) (0.19) (0.16) (0.06) (0.16) (0.16)
Other loans1.37*** 1.14*** 0.25 0.25 1.58*** 1.35*** 0.33 0.41 1.58*** 1.35*** 0.59** 0.64**
(0.31) (0.14) (0.50) (0.50) (0.46) (0.24) (0.32) (0.31) (0.45) (0.24) (0.28) (0.28)
Trading assets1.99*** 1.96*** 2.55*** 2.55*** 2.14*** 2.12*** 2.56*** 2.58*** 1.92*** 1.90*** 2.27*** 2.28***
(0.22) (0.21) (0.31) (0.31) (0.15) (0.12) (0.24) (0.24) (0.12) (0.10) (0.20) (0.20)
Operational risk-0.72 - 2.80** 2.81** -0.77 - 2.22*** 2.20*** -0.78 - 1.77** 1.76**
(0.61) (1.25) (1.23) (0.89) (0.81) (0.82) (0.82) (0.72) (0.74)
Securities0.80*** 0.78*** 0.43** 0.43** 0.81*** 0.85*** 0.45*** 0.47*** 0.81*** 0.84*** 0.57*** 0.58***
(0.18) (0.10) (0.21) (0.21) (0.16) (0.10) (0.16) (0.16) (0.13) (0.09) (0.13) (0.13)
Payout ratio0.29 - 22.12*** 22.03*** 3.94 - 15.99*** 14.6*** 3.16 - 11.04*** 10.05**
(5.45) (6.81) (6.81) (4.38) (5.08) (5.03) (3.68) (3.91) (3.98)
R2 adjusted 0.98 0.98 0.97 0.97 0.98 0.98 0.98 0.98 0.99 0.99 0.98 0.98
Number of observations 89 89 94 94 89 89 94 94 89 89 94 94
Table 2 presents the estimates of our model for the three risk-based regulatory capital ratios
included in the stress tests. We do not include the tier 1 leverage ratio because our model requires
the denominator of the regulatory capital ratio to be risk-weighted assets.10 Within each regulatory
capital ratio, we report the estimated implicit risk-weights using two different sources for the post-
stress regulatory capital ratios – the CCAR results and banks’ own DFAST results.11 According to the
entries in Table 2, almost all coefficients on the various portfolios have economically intuitive signs
and are statistically significant at conventional levels. In a few cases where the coefficients are not
statistically different from zero, we re-estimated the model setting those coefficients to zero, and
those results are shown in column (2) of the table. 12
10 Under the leverage ratio definition all risk-weights should be equal to 100 percent.
11 We were unable to find banks’ own DFAST results for 5 bank-year observations so the sample size is slightly different.
12 The analysis shown on Table 2 combines all the data points for the past 3 CCAR cycles. The results are not significantly different if the analysis is conducted separately for each year.
TABLE 2: NONLINEAR LEAST SQUARE REGRESSIONS FOR POST-STRESS REGULATORY CAPITAL RATIOS
Notes: Sample period is comprised of stress test results for the 2014, 2015 and 2016 cycles. The dependent variable in each specification is the post-stress regulatory capital ratio under banks' own DFAST submissions and CCAR. Each model is estimated using nonlinear least squares and robust standard errors are reported in parenthesis. * p-value < 0.10; ** p-value < 0.05; and *** p-value < 0.01.

12 THE CAPITAL ALLOCATION INHERENT IN THE FEDERAL RESERVE’S CAPITAL STRESS TEST
Across all specifications in Table 2, risk-weights under CCAR are higher than risk-weights under banks’
own DFAST results for the following portfolios:
» For C&I loans, implicit risk-weights are estimated to be between 190 and 200 percent under
banks’ own DFAST submissions across the three post-stress regulatory capital ratios, while they
are estimated to be between 215 and 250 percent under CCAR – so, 20 percent higher;
» For small business loans, implicit risk-weights are estimated to be between 250 and 370
percent under banks’ own DFAST submissions across the three post-stress regulatory capi-
tal ratios, while they are estimated to be between 360 and 530 percent under CCAR – so, 45
percent higher;
» For first-lien mortgage loans, implicit risk-weights are estimated to be between 105 and 135 per-
cent under banks’ own DFAST submissions across the three post-stress regulatory capital ratios,
while are estimated to be between 105 and 200 percent under CCAR – so, 25 percent higher;
» Lastly, for trading assets, implicit risk-weights are estimated to be between 190 and 210 percent
under banks’ own DFAST submissions across the three post-stress regulatory capital ratios, while
are estimated to be between 230 and 260 percent under CCAR – so, also 25 percent higher.
In contrast, for consumer loans and other loans, the estimated implicit risk-weights using the data
from banks’ own DFAST submissions are typically higher than the implicit risk-weights under CCAR.
Thus, it is not always the case that banks’ own implicit risk-weights are lower than the implicit risk-
weights estimated using CCAR results based on the Federal Reserve’s own models. In particular,
» For consumer loans, implicit risk-weights are estimated to be about 110 percent under banks’
own DFAST submissions across the three post-stress regulatory capital ratios, while they are
estimated to be between 70 and 90 percent under CCAR – so, 25 percent lower;
» Finally, for other loans, implicit risk-weights are estimated to be between 110 and 140 percent
under banks’ own DFAST submissions across the three post-stress regulatory capital ratios,
while they are estimated to be between 25 and 65 percent under CCAR – so, 65 percent lower.
As evidenced by the relatively high R2s, all nonlinear specifications fit the data quite well in our
sample. As shown in Exhibit 3, the realized (x-axis) and predicted (y-axis) post-stress CCAR tier
1 capital ratios are close to the 45 degree line, suggesting that the model in equation (1) is a
reasonable one. Specifically, for banks close to the 45 degree line – denoted by the green dots
- the projected post-stress tier 1 capital ratios using our model are about the same as the post-
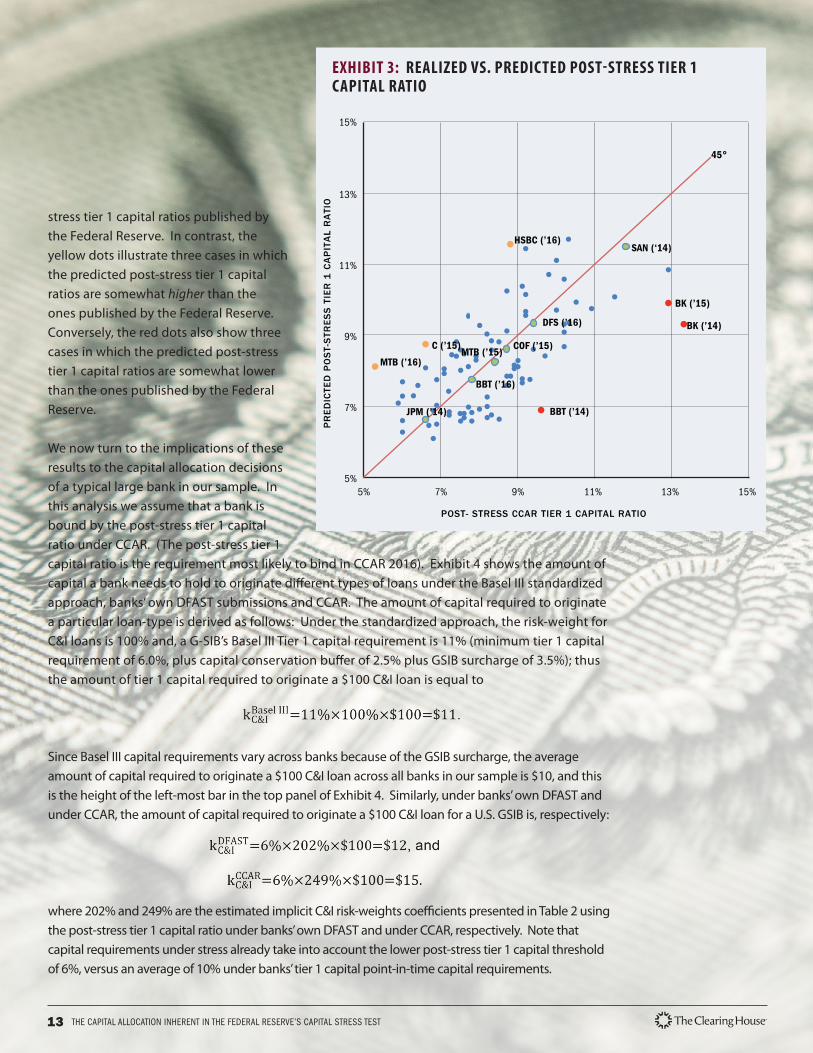
13 THE CAPITAL ALLOCATION INHERENT IN THE FEDERAL RESERVE’S CAPITAL STRESS TEST
stress tier 1 capital ratios published by
the Federal Reserve. In contrast, the
yellow dots illustrate three cases in which
the predicted post-stress tier 1 capital
ratios are somewhat higher than the
ones published by the Federal Reserve.
Conversely, the red dots also show three
cases in which the predicted post-stress
tier 1 capital ratios are somewhat lower
than the ones published by the Federal
Reserve.
We now turn to the implications of these
results to the capital allocation decisions
of a typical large bank in our sample. In
this analysis we assume that a bank is
bound by the post-stress tier 1 capital
ratio under CCAR. (The post-stress tier 1
capital ratio is the requirement most likely to bind in CCAR 2016). Exhibit 4 shows the amount of
capital a bank needs to hold to originate different types of loans under the Basel III standardized
approach, banks’ own DFAST submissions and CCAR. The amount of capital required to originate
a particular loan-type is derived as follows: Under the standardized approach, the risk-weight for
C&I loans is 100% and, a G-SIB’s Basel III Tier 1 capital requirement is 11% (minimum tier 1 capital
requirement of 6.0%, plus capital conservation buffer of 2.5% plus GSIB surcharge of 3.5%); thus
the amount of tier 1 capital required to originate a $100 C&I loan is equal to
Since Basel III capital requirements vary across banks because of the GSIB surcharge, the average
amount of capital required to originate a $100 C&I loan across all banks in our sample is $10, and this
is the height of the left-most bar in the top panel of Exhibit 4. Similarly, under banks’ own DFAST and
under CCAR, the amount of capital required to originate a $100 C&I loan for a U.S. GSIB is, respectively:
where 202% and 249% are the estimated implicit C&I risk-weights coefficients presented in Table 2 using
the post-stress tier 1 capital ratio under banks’ own DFAST and under CCAR, respectively. Note that
capital requirements under stress already take into account the lower post-stress tier 1 capital threshold
of 6%, versus an average of 10% under banks’ tier 1 capital point-in-time capital requirements.
EXHIBIT 3: REALIZED VS. PREDICTED POST-STRESS TIER 1 CAPITAL RATIO
HSBC (’16)
MTB (’16)
BK (’15)
BBT (’14)
BK (’14)
SAN (‘14)
5%
7%
9%
11%
13%
15%
5% 7% 9% 11% 13% 15%
POST- STRESS CCAR TIER 1 CAPITAL RATIO
45°
PR
ED
ICTE
D P
OS
T-S
TRE
SS
TIE
R 1
CA
PIT
AL
RA
TIO
DFS (’16)
COF (’15)C (’15)MTB (’15)
BBT (’16)
JPM (’14)

14 THE CAPITAL ALLOCATION INHERENT IN THE FEDERAL RESERVE’S CAPITAL STRESS TEST
For the C&I loan portfolio we can make the following two observations: (i) the amount of capital required to
originate a C&I loan is about 50 percent higher under CCAR relative to the Basel III standardized approach;
and (ii) the required capital for C&I loans is higher under CCAR reflecting the higher likelihood of default of
such exposures under stress. All of the above calculations are depicted in the top left panel of Exhibit 4.
We redo these calculations for the remaining five major portfolios included in our analysis. The chart
in the top right panel of Exhibit 4 represents the amount of capital required to originate a CRE loan.
The estimated capital requirement for CRE loans is lower under the stress tests than under Basel III
standardized approach. This likely reflects the relatively high quality of CRE loans that are being
originated by large banks, typically loans to finance nonfarm nonresidential properties (e.g., offices)
in supply-constrained markets. As shown in the middle left panel of Exhibit 4, small business loans
have the same capital requirements as C&I loans under the standardized approach; however under
EXHIBIT 4: PORTFOLIO-LEVEL CAPITAL REQUIREMENTS
0
5
10
15
20
25
30
35
CCARDFASTSTANDARDIZED APPROACH
0
5
10
15
20
25
30
35
CCARDFASTSTANDARDIZED APPROACH
0
5
10
15
20
25
30
35
CCARDFASTSTANDARDIZED APPROACH
0
5
10
15
20
25
30
35
CCARDFASTSTANDARDIZED APPROACH
0
5
10
15
20
25
30
35
CCARDFASTSTANDARDIZED APPROACH
0
5
10
15
20
25
30
35
CCARDFASTSTANDARDIZED APPROACH
RE
QU
IRE
D C
AP
ITA
L TO
OR
IGIN
ATE
A $
10
0 L
OA
N (
IN $
)R
EQ
UIR
ED
CA
PIT
AL
TO O
RIG
INA
TEA
$1
00
LO
AN
(IN
$)
RE
QU
IRE
D C
AP
ITA
L TO
OR
IGIN
ATE
A $
10
0 L
OA
N (
IN $
)
RE
QU
IRE
D C
AP
ITA
L TO
OR
IGIN
ATE
A $
10
0 L
OA
N (
IN $
)R
EQ
UIR
ED
CA
PIT
AL
TO O
RIG
INA
TEA
$1
00
LO
AN
(IN
$)
RE
QU
IRE
D C
AP
ITA
L TO
OR
IGIN
ATE
A $
10
0 L
OA
N (
IN $
)
C&I LOANS CRE LOANS
SMALL BUSINESS LOANS FIRST-LIEN MORTGAGE LOANS
OTHER LOANS TRADING ASSETS
15 THE CAPITAL ALLOCATION INHERENT IN THE FEDERAL RESERVE’S CAPITAL STRESS TEST
the stress tests the implicit capital requirement for small business loans is twice as high under banks’
own DFAST submissions and it is three times higher under CCAR. The significantly higher capital
requirements under CCAR are consistent with the stress test scenarios assuming a recession that
includes an increase in the unemployment rate that is very sudden and abrupt.
The middle right panel and lower panels of Exhibit 4 depict the capital requirements for first-lien
mortgage loans, other loans and trading assets, respectively. For mortgage loans and trading assets,
the capital requirements are 180 percent and 340 percent higher under CCAR, respectively, than under
the Basel III standardized approach. For trading assets the higher capital requirements under CCAR are
driven by the global market shock that is part of CCAR. The market shock also applies to DFAST, and
the capital requirement under CCAR is 20 percent higher relative to DFAST. For mortgage loans, the
doubling of capital requirements under CCAR likely reflect the severity of the macroeconomic scenario
in the stress tests which includes a sizable decline in house prices, augmented by the fact that some
banks still hold legacy mortgage loans. That said, the 20 percent difference in capital requirements
between CCAR and DFAST is still significant, so part of the difference in capital requirements must also
be driven by more stringent assumptions in the Federal Reserve’s models.
Despite the large and sudden increase in the unemployment rate in the severely adverse scenario
in stress tests, capital requirements for consumer loans are not higher under the stress tests
relative to the Basel III standardized approach. This likely reflects the very high quality of such
loans currently on banks’ balance sheets, namely loans to borrowers with pristine credit scores
and which have a very low likelihood of default, even under a recession that is worse than the one
experienced during the past global financial crisis.
ARE STRESS TESTS AFFECTING BANKS’ CAPITAL ALLOCATION DECISIONS? Since post-stress capital levels under CCAR are the binding requirement for the majority of banks at least
EXHIBIT 5
90
110
130
150
2016 q12013 q12010 q12007 q1
90
110
130
150
2016 q12014q32013 q12011q32010 q1
IND
EX
(2
01
1:Q
1=
10
0)
IND
EX
(2
01
1:Q
1=
10
0)
RESIDENTIAL REAL ESTATE LOANSFIRST LIEN CLOSED-END LOANS
SMALL BUSINESS LOANSSmall Banks Large Banks
Q3
Q3
Q3
Q3

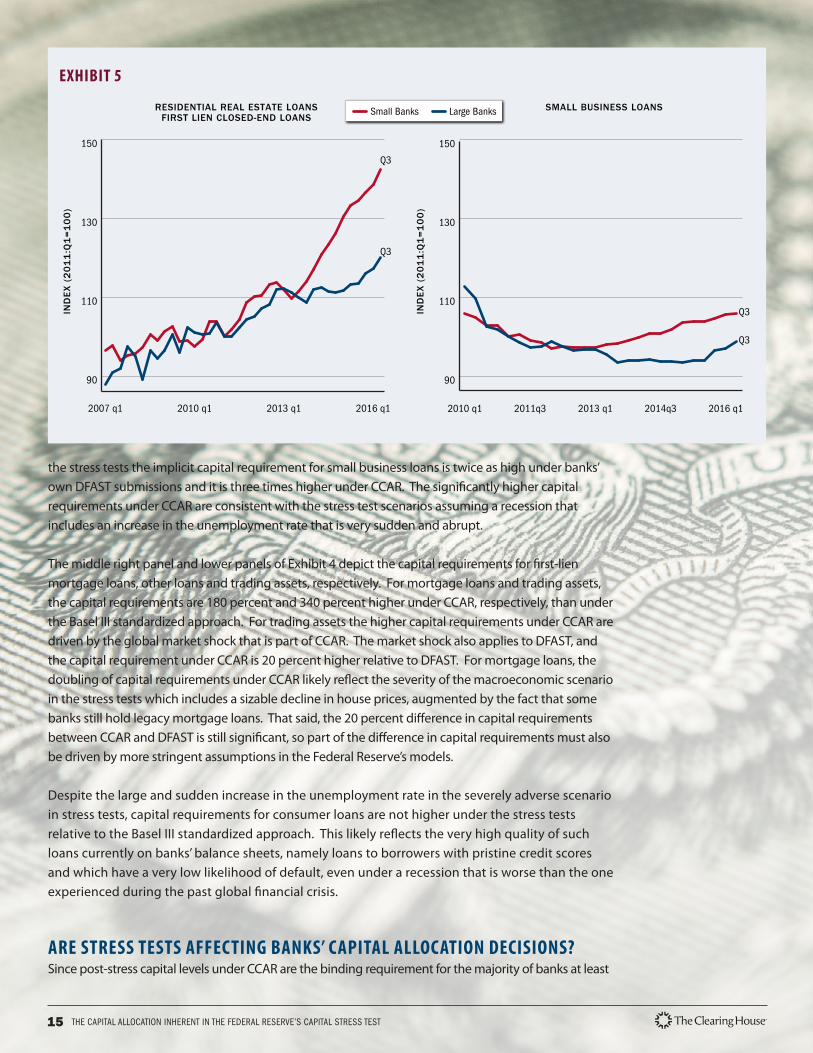
16 THE CAPITAL ALLOCATION INHERENT IN THE FEDERAL RESERVE’S CAPITAL STRESS TEST
after 2014, the significantly higher risk weights for these exposures could be expected to have an adverse
impact on credit availability to asset classes that impose the highest relative CCAR losses – mortgages to
households and loans to small businesses. Indeed, as shown in the left panel of Exhibit 5, while holdings
of residential mortgage loans have stagnated somewhat at large banks, they have been growing at a
moderate pace at banks not required to participate in the stress tests.13 Moreover, as shown in the panel
to the right, holdings of small business loans declined during most of the post-crisis period at banks
subject to the stress tests, while holdings of such loans rose slightly at other banks.
In contrast, CCAR’s implicit risk weights for CRE loans are roughly in line with the risk weights under
the standardized approach and as depicted by the blue line in Exhibit 6, growth of CRE loans was in
fact slightly stronger at large banks during most of the post-2011 period.
In summary, our analysis suggests that CCAR is having an adverse impact on credit provided by
large banks in a majority of (but not all) asset classes.
13 These charts are based on an analysis described in TCH’s blog post on “Is Tighter Bank regulation Restricting Loan Growth?” December 1, 2016.
EXHIBIT 6
90
110
130
150
2016 q12014q32013 q12011q32010 q1
IND
EX
(2
01
1:Q
1=
10
0)
QUARTER
COMMERCIAL REAL ESTATE LOANS Small Banks Large Banks
Q3
Q3