the cash in cover crops - basic farm economics - rulon
TRANSCRIPT

IOWA COVER CROPS CONFERENCERULON ENTERPRISES
[email protected]/17/2015
PLEASE VISIT OUR WEBSITE: www.rulonenterprises.com
THE CASH IN COVER CROPS
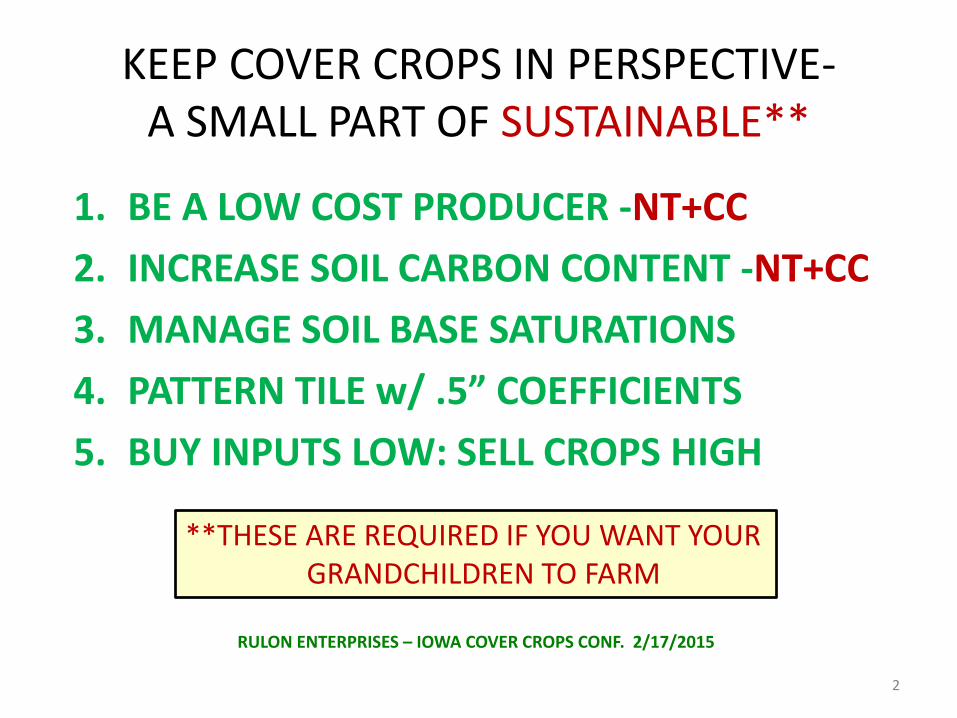
KEEP COVER CROPS IN PERSPECTIVE-A SMALL PART OF SUSTAINABLE**
1. BE A LOW COST PRODUCER -NT+CC
2. INCREASE SOIL CARBON CONTENT -NT+CC
3. MANAGE SOIL BASE SATURATIONS
4. PATTERN TILE w/ .5” COEFFICIENTS
5. BUY INPUTS LOW: SELL CROPS HIGH
2
RULON ENTERPRISES – IOWA COVER CROPS CONF. 2/17/2015
**THESE ARE REQUIRED IF YOU WANT YOURGRANDCHILDREN TO FARM

3
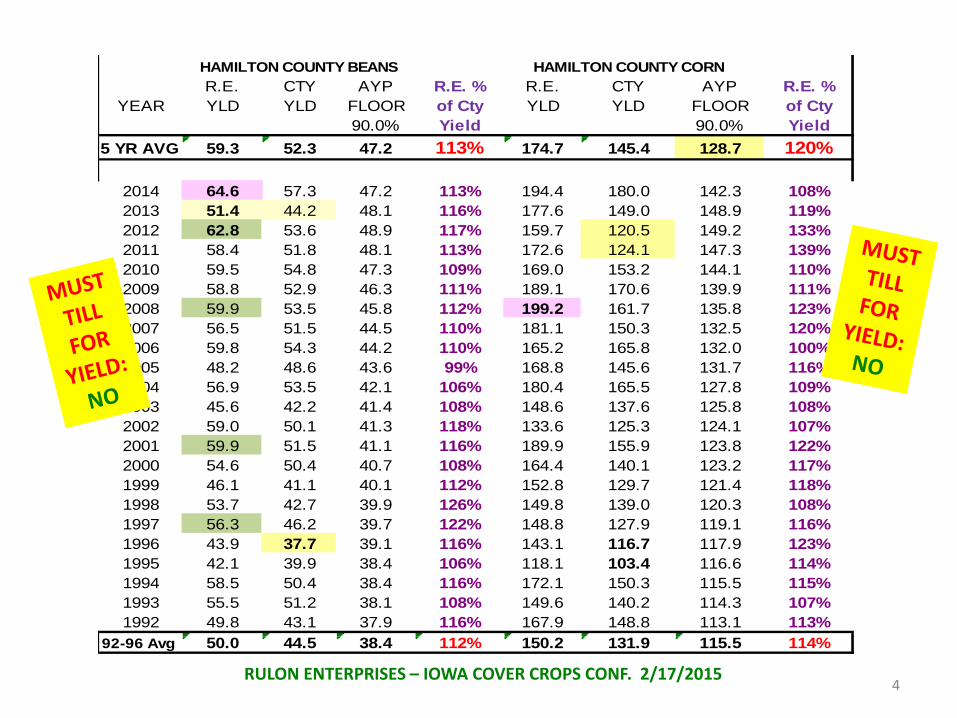
SOIL OXIDATION IS NOT SUSTAINABLE
RULON ENTERPRISES – IOWA COVER CROPS CONF. 2/17/2015
4
HAMILTON COUNTY BEANS HAMILTON COUNTY CORN
R.E. CTY AYP R.E. % R.E. CTY AYP R.E. %
YEAR YLD YLD FLOOR of Cty YLD YLD FLOOR of Cty
90.0% Yield 90.0% Yield
5 YR AVG 59.3 52.3 47.2 113% 174.7 145.4 128.7 120%
2014 64.6 57.3 47.2 113% 194.4 180.0 142.3 108%
2013 51.4 44.2 48.1 116% 177.6 149.0 148.9 119%
2012 62.8 53.6 48.9 117% 159.7 120.5 149.2 133%
2011 58.4 51.8 48.1 113% 172.6 124.1 147.3 139%
2010 59.5 54.8 47.3 109% 169.0 153.2 144.1 110%
2009 58.8 52.9 46.3 111% 189.1 170.6 139.9 111%
2008 59.9 53.5 45.8 112% 199.2 161.7 135.8 123%
2007 56.5 51.5 44.5 110% 181.1 150.3 132.5 120%
2006 59.8 54.3 44.2 110% 165.2 165.8 132.0 100%
2005 48.2 48.6 43.6 99% 168.8 145.6 131.7 116%
2004 56.9 53.5 42.1 106% 180.4 165.5 127.8 109%
2003 45.6 42.2 41.4 108% 148.6 137.6 125.8 108%
2002 59.0 50.1 41.3 118% 133.6 125.3 124.1 107%
2001 59.9 51.5 41.1 116% 189.9 155.9 123.8 122%
2000 54.6 50.4 40.7 108% 164.4 140.1 123.2 117%
1999 46.1 41.1 40.1 112% 152.8 129.7 121.4 118%
1998 53.7 42.7 39.9 126% 149.8 139.0 120.3 108%
1997 56.3 46.2 39.7 122% 148.8 127.9 119.1 116%
1996 43.9 37.7 39.1 116% 143.1 116.7 117.9 123%
1995 42.1 39.9 38.4 106% 118.1 103.4 116.6 114%
1994 58.5 50.4 38.4 116% 172.1 150.3 115.5 115%
1993 55.5 51.2 38.1 108% 149.6 140.2 114.3 107%
1992 49.8 43.1 37.9 116% 167.9 148.8 113.1 113%
92-96 Avg 50.0 44.5 38.4 112% 150.2 131.9 115.5 114%
RULON ENTERPRISES – IOWA COVER CROPS CONF. 2/17/2015

5RULON ENTERPRISES – IOWA COVER CROPS CONF. 2/17/2015
SEED COSTS Cost/Acre Acres Seed Cost
Oats (32#) + Radish (2.5#) $16.38 240 $3,931.20
Oats (24#) + Radish (2.5#) + Clover (6#) $18.40 1005 $18,492.00
Annual Rye Grass (18#) $14.04 200 $2,808.00
Cereal Rye Grass - Plant (35#) $12.05 607 $7,314.35
Cereal Rye Grass - Aerial (40#) $12.05 1,475 $17,773.75
3,527 Seed Cost = $50,319.30
Seed Cost/Acre = $14.27
Planting Costs for Season Quantity Rate Total Cost
Aerial Seeding Cost 1,475 $13.93 $20,546.75
Tractor Hours 140 $35.00 $4,900.00
Labor 210 $15.00 $3,150.00
Fuel 720 $3.50 $2,520.00
Planter Repairs/wear 2,052 $5.00 $10,260.00
Total Other Costs Acres = 3,527 $41,376.75
Planting Cost/Acre = $11.73
Total Cover Crop Cost = $91,696.05
Total Cost/Acre Planted = $26.00
Cover Crop Acres and Costs Fall 2014
WHAT DO COVER CROPS COST?

6RULON ENTERPRISES – IOWA COVER CROPS CONF. 2/17/2015
WHAT ARE THE ECONOMIC BENEFITS OF COVER CROPS?
Data
Source Per acre Acres Total Benefit
Rulon/Mills Fertilizer Saved-P&K (Mills+Rulon+Purdue Tile Discharge) $16.23 3,527 $57,243.21
Mills Fertilizer Saved-N (40#/Ac Invested in OM Increase) $0.00 3,667 $0.00
Rulon Corn Yield Inc.(3yr/9reps CC Plot Data: 7.1bu@$5) $35.50 2,052 $72,846.00
Rulon Soybean Yield Increase (Less Disease:1.95bu@$12) $23.40 1,475 $34,515.00
Rulon Drought Tol.(2004-14 Actual:16%every4th=6.9Bu@$5) $34.50 3,527 $121,681.50
NRCS Biology & Soil Quality (OM increases 2X of no cc) $6.00 3,527 $21,162.00
NRCS Erosion Reduction (2 ton/acre @ $4) $8.00 3,527 $28,216.00
FSA CSP Program Payment ($40,000) $10.91 3,667 $40,000.00
Total Cover Crop Benefit = $335,663.71
Net Economic Benefit = $243,967.66
ROI = 266% Net Benefit/Acre Planted = $69.17
BENEFITS ANALYSIS

7RULON ENTERPRISES – IOWA COVER CROPS CONF. 2/17/2015

Organic Matter 2002 Vs. 2012 = + 1.1%2.4 (1.4 to 4.0) 3.5 (1.7 to 6.1)
INCREASE SOIL CARBON CONTENT : AVG = .5%
RULON ENTERPRISES – IOWA COVER CROPS CONF. 2/17/2015

9
Purdue – NRCS Cover CropN-Rate Soil Quality PlotsCorn into Cereal Rye May 4th, 2013
RULON ENTERPRISES – IOWA COVER CROPS CONF. 2/17/2015

10
Final Stand Corn/Rye = 28,500Final Stand Corn/No Cover = 32,475Final Yield Corn/Rye = 187.6Final Yield Corn/No Cover = 183.4Final Yield Corn/Oats+Radish = 190.5
Cover Crop Yield + 7.1 bu/ac
RULON ENTERPRISES – IOWA COVER CROPS CONF. 2/17/2015

11RULON ENTERPRISES – IOWA COVER CROPS CONF. 2/17/2015
WHAT ARE THE ECONOMIC BENEFITS OF COVER CROPS?
Cereal Rye = + 6.3 Bu/Ac

GRIDS KEEP IT SIMPLE! - 85% Accurate vs. 55% Accurate 2.5 Acre Grids
• Crop removal is a waste of time – erosion, leaching, etc.
• Management zones create variability
• Trust Your DATA (Not your fertilizer dealer’s opinion)
• Everything that matters is explained by CEC and OM
• Costs? Insignificant. Very insignificant.
• RESULT: GEO-REFERENCED Rx driven by Rx Yield Goal
MANAGE SOIL BY BASE SATURATIONS -WE USE 1 ACRE GRIDS
TILLAGE/EROSION MESS THIS UP!!
12
RULON ENTERPRISES – IOWA COVER CROPS CONF. 2/17/2015

13
Mg CANNOT BE FIXED USING FLAT RATE APPLICATIONONCE FIXED, IT STAYS FIXED FOR YEARS
PLANT AVAILABLE NUTRIENTS INCREASE AS Mg DECLINES
2002+ 3 Rx Gypsum Apps = 2007
Purple is above 25% Target is green < 13%
Magnesium Base Saturation
RULON ENTERPRISES – IOWA COVER CROPS CONF. 2/17/2015

pH and Lime Rx
RULON ENTERPRISES – IOWA COVER CROPS CONF. 2/17/2015

15
IT HAS RAINED HARD FOREVER- 15% OF WATERSHED LOSES 50% OF YIELD EVERY YEAR- 275 BU * .5 * .15 * $5 Corn =
= $103/Acre Lost Revenue per Acre per YearPATTERN TILE w/ .5” Coefficients not .375” = + 33%
RULON ENTERPRISES – IOWA COVER CROPS CONF. 2/17/2015
16
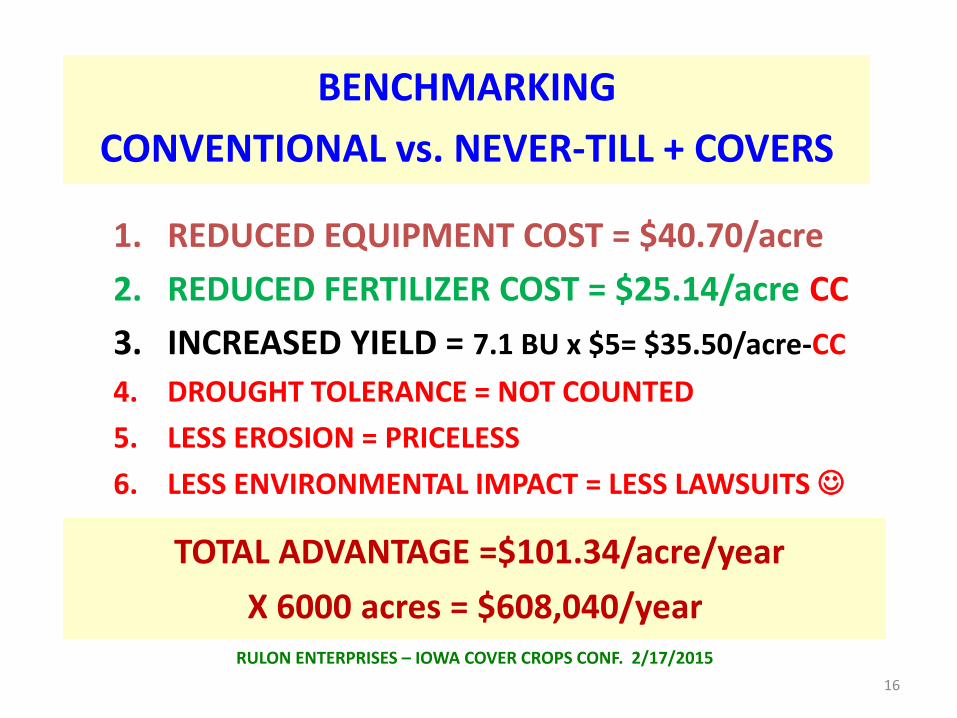
BENCHMARKING
CONVENTIONAL vs. NEVER-TILL + COVERS
1. REDUCED EQUIPMENT COST = $40.70/acre
2. REDUCED FERTILIZER COST = $25.14/acre CC
3. INCREASED YIELD = 7.1 BU x $5= $35.50/acre-CC
4. DROUGHT TOLERANCE = NOT COUNTED
5. LESS EROSION = PRICELESS
6. LESS ENVIRONMENTAL IMPACT = LESS LAWSUITS
TOTAL ADVANTAGE =$101.34/acre/year
X 6000 acres = $608,040/yearRULON ENTERPRISES – IOWA COVER CROPS CONF. 2/17/2015

17RULON ENTERPRISES – IOWA COVER CROPS CONF. 2/17/2015
Comparing the Systems The "Real" Economics of No-Till
Activity or Input Unit Conventional Never-Till
Soil Test $/Acre 2.75 2.75 ($11.00 every 4th year)
Chisel Plow $/Acre 21.60 0.38 (No-till=Zone Build 8% of acres every 4th year)
Spray Fall Weed Control $/Acre 0.00 2.00 ($8.00 every 4th year)
Fall Weed Chem Cost $/Acre 0.00 3.00 (22oz R-up+24D=$12.00 every 4th year)
Cover Crop Seed - AVG $/Acre 0.00 15.28 (Seed & Planting = $26 on 59% of Acres)
Apply Dry Fertilizer $/Acre 6.00 5.00 (Faster + More Accurate + Lower Repairs)
0-11-45 @ $510 Lbs/Acre 165 42.08 (Standard Fertility Program)
11-52-0 @ $505 Lbs/Acre 47 11.87 (Actual usage per year in LT No-Till)
0-0-60 @ $430 Lbs/Acre 65 13.98 (Actual usage per year in LT No-Till)
(Using 1 acre grids and our Rx to maintain levels)
Apply Anhydrous $/Acre 15.00 17.50 ($2.50 to pay for Exactrix System)
82-0-0 @ $660 Lbs/Acre 210 69.30 165 54.45 (LT No-Till increases OM = Increased N avail)
act N= 172.2 135 (Cover crops capturing leaching N)
(Rx N Rate: Yield Goals of 90 to 300)
Apply Preplant Chemicals $/Acre 5.00 5.00
Preplant Chem Cost $/Acre 1/2 Bicep 7.40 10.86 (11oz R-up + 24D + 1/2 BICEP= $10.86)
Field Cultivate + Vert. Till$/Acre 19.10 0.00
Plant Corn $/Acre 14.50 16.50 ($2.00 to pay for expensive no-till planter)
Corn Seed - VT3 $/Acre 93.50 93.50 (Drop 34,000 seeds) $220/bag
28-0-0 @ $270 Lbs/Acre 100 13.50 144 19.44
act N= 28 40
Insecticide/Fungicide $/Acre 15.00 5.00 Better Bio-life reduces applications 66%
Apply Post Chemicals $/Acre 5.00 5.00
Post Chem Cost $/Acre 9.37 9.37 (22oz R-up + 1/2 BICEP= $9.37)
Harvest Corn $/Acre 37.00 38.42 ($.20/bushel)
Hauling Corn $/Acre 14.80 15.37 ($.08/bushel)
Drying Corn $/Acre 23.13 24.01 ($.125/bushel)
Storing Corn $/Acre 27.75 28.82 ($.15/bu= Int-.08: Shrink-.02: Depr/Repairs- .05)
Overhead, etc. $/Acre 125.00 105.00 Estimate based upon 2014 actuals
Net Land Rent Cost $/Acre 250.00 235.00 CSP=$10 + Other Benefits
TOTAL COST = 816.77 737.49
Conventional Yield ADVANTAGE
AVERAGE YIELD = 185 192.1 REQUIRED to have an EQUAL
. Cost per BUSHEL= 21
AVERAGE COST PER BUSHEL = 4.41$ 3.84$

18RULON ENTERPRISES-OHIO NO-TILL CONF. 12/11/2013
PRICES VARY 30 TO 50%COSTS DO NOT