the catfocus tropical cyclone model advanced risk analysis and validation€¦ · ·...
TRANSCRIPT

The CatFocus® Tropical Cyclone ModelAdvanced Risk Analysis and Validation

www.partnerre.com
© 2010 PartnerRe90 Pitts Bay RoadPembroke HM 08, Bermuda
AuthorsDr. Paul Della-Marta, Research, PartnerReManuel Prechtl, Research, PartnerRe
EditorsDr. Sara Thomas, Client & Corporate Communications, PartnerReDr. Erik Rüttener, Research, PartnerRe
Cover Page: Copyright 2010 EUMETSAT
For more copies of this publication or for permission to reprint, please contact:Corporate Communications, BermudaPhone +1 441 292 0888Fax +1 441 292 7010
This publication is also available for download under www.partnerre.com
The discussions and information set forth in this publication are not to be construed as legal advice or opinion.
October 2010, 5,000 en

The last decade has seen events challenge pre-existing views of the potential impact and loss magnitude of tropical cyclones, the most destructive atmospheric peril underwritten by the insurance and reinsurance industries. For insurers and reinsurers, this issue is compounded by ever-increasing global and peak-zone exposures, changing vulnerabilities and the need to maintain a well-diversified risk portfolio.
It is now, more so than ever, essential to stay ahead in the field of the quantitative modeling of this risk, incorporating into models the latest data and advances in the understanding of tropical cyclones and their impact, and to do this in a sophisticated, consistent and verifiable way.
This report, prepared by members of the PartnerRe Research team that built and developed our proprietary CatFocus® models, describes the CatFocus® tropical cyclone model. In particular we take you through some of the advanced modeling aspects that combine to deliver a realistic, validated hazard assessment. Used together with strong underwriting experience, portfolio knowledge and a sound integrated risk management framework, this is a highly reliable tool for natural hazard risk evaluation and assumption.
We hope that this will both inform and also shed light on what lies behind our risk assessments. If you have any questions or would like to discuss any of the topics in this report, please do not hesitate to contact either myself or our Head of Research, Dr. Erik Rüttener ([email protected]).
Ted DziurmanHead of Catastrophe, PartnerRe
Foreword
PartnerRe 2010The CatFocus® Tropical Cyclone Model
1


PartnerRe 2010The CatFocus® Tropical Cyclone Model
3
Introduction Although differing methodologies are used to evaluate tropical cyclone risk, all require accurate knowledge of the underlying insured exposure and definition of hazard, as well as a clear representation of the vulnerability and expected intensity and frequency of occurrence of tropical cyclone events in the given area. Past client loss data can be used as the basis of risk evaluation, but this alone is inaccurate because of short observation periods – catastrophe events are by definition relatively infrequent, making extrapolation to very low probabilities, such as 1 in 100 year or 1 in 250 year events, statistically unreliable – and because of difficulties in adjusting loss data for changes in exposure, vulnerability and policy conditions over time. A more sophisticated approach is to build a model that reconstructs historical wind fields and overlays these onto the portfolio in question to calculate a loss for each event. Such calculations are based on the insurer’s current portfolio, but still only represent a short observation period. The problem of using a limited event set to price catastrophe reinsurance business becomes even more apparent with geographically concentrated portfolios, such as those found on the Caribbean islands, and with single risks, such as offshore oil-rigs. Intuitively in such cases, the observation period needs to be even longer to capture the more infrequent events.
Probabilistic catastrophe models are an accepted solution to the problem of limited observation period for natural catastrophe events. These models serve not only to extend the “event set”, but also provide a complete risk evaluation tool, incorporating vulnerability curves to convert hazard intensity into an estimated level of damage and therefore expected loss for the portfolio.
The CatFocus® tropical cyclone model is an advanced catastrophe model used by PartnerRe, alongside commercial models, to provide a reliable estimation of risk. By developing the CatFocus® suite of proprietary catastrophe models, and by working closely with the scientific community, PartnerRe remains at the forefront of this field with an understanding of the benefits and limitations of each approach. We can thus offer our clients an alternative, informed view of risk and remain a trusted discussion partner in natural hazard risk evaluation.
Tropical cyclones originating in the North East Pacific,
Central Pacific and North Atlantic Oceans are called
hurricanes, whereas those originating in the North
West Pacific Ocean are called typhoons. In all other
ocean basins they are referred to as tropical cyclones.

PartnerRe 2010The CatFocus® Tropical Cyclone Model
4
Modeling tropical cyclone risk at PartnerReThe CatFocus® tropical cyclone model is a proprietary model developed by PartnerRe to assess tropical cyclone risk in the Atlantic, Pacific and southern Indian Ocean basins. It consists of regional models integrated within a consistent framework and is designed to work with all standard exposure data formats. The model is based on a scientifically robust method which PartnerRe helped to pioneer, and incorporates and benefits from strong catastrophe underwriting experience. The model has evolved over time by incorporation of the latest scientific findings and through systematic validation of the model’s capabilities. Each regional model undergoes a systematic cycle of review, benchmark and improvement.
Specific strengths of the CatFocus® tropical cyclone model include:• Robust techniques to process detailed and
aggregate exposure data formats.• Use of the most up-to-date meteorological
tropical cyclone data.• Developed in cooperation with the scientific
community to incorporate the most sophisticated know-how on tropical cyclone behavior.
• Generates the full wind field for each observed and simulated event over time, including comprehensive relationship modeling of Rmax and Wmax (see page 6, Meteorological data) and allowance for eyewall cycles.
• Systematic model biases are actively identified and as far as possible corrected.
• Use of advanced detailed and aggregate vulnerability curves, calibrated against real loss data to accommodate the effects of gustiness and airborne debris.
• Thorough internal consistency and validation checks throughout the modeling process.
Figure 1Structure of the PartnerRe CatFocus® tropical cyclone model.
Tropical Cyclone Model
Hazard VulnerabilityExposure
Financial Loss

PartnerRe 2010The CatFocus® Tropical Cyclone Model
5
This publication takes you through the structural components (hereafter “modules”) of the CatFocus® tropical cyclone model (figure 1). We concentrate in particular on the hazard component, i.e. on the generation of a statistically reliable set of tropical cyclone events and on the validation of those events using independent data. At each stage we highlight the advanced techniques and methodologies employed by the model to explain and substantiate the reliability of the chosen approach.
A term that we will refer to often in this publication is internal consistency – by which we mean agreement between the modeled and observed statistics of hazard and loss. For example, for a large enough area with many observations, the model should reproduce a statistical distribution of wind speeds consistent with those observations. It is important to note that internal consistency does not mean a perfect match between observed and modeled quantities; we are modeling a phenomena which occurs relatively infrequently at a given location. Internal consistency is therefore only expected when we have many observations to compare with our model. If working correctly, the model informs us about the less frequently observed aspects of tropical cyclones and their associated losses.
Starting with exposureThe starting point of all risk assessment centers around exposure modeling, involving the systematic compilation, classification and where necessary the disaggregation of the available exposure data of an insurance or reinsurance risk portfolio.
The following key exposure parameters are used in a tropical cyclone model:• location (geographic coordinates)• risk characteristics (e.g. occupancy, construction
material and design code)• covered value (sum insured)• insurance and reinsurance structure (such as
deductibles and limits).
PartnerRe has developed modeling methodologies that support the processing of all principal industry-standard data formats, including a robust and advanced methodology to deal with aggregate exposure data.
Continuous efforts have been made by insurers and reinsurers towards improved data quality and resolution. However, outside the U.S. market, it is often the case that individual property portfolios are described in aggregate form as a sum insured per geographic unit (typically a CRESTA zone, district or county) and per property line of business (e.g. residential, commercial or industrial). For detailed exposure data, CatFocus® uses the available information specific to each risk, capitalizing on the richness of this data format to provide the best representation of the hazard and vulnerability on a per risk basis (i.e. for the known geographical locations and risk characteristics). Detailed policy information is optimally used to increase the understanding of loss potential for a given exposure.

PartnerRe 2010The CatFocus® Tropical Cyclone Model
6
Aggregate exposure data necessitates the development of robust aggregate models which disaggregate the exposure based on a set of spatial weights derived from the latest population and land-use data. The more detailed the available exposure data in terms of risk characteristics (split by line of business, insurance cover, etc) and the higher the geographic resolution of aggregation zones, the fewer assumptions that have to be made.
Hazard ModelingBuilding an accurate computer model to simulate tropical cyclone events requires quality meteorological data on past events as the basis of the statistical components of the model and the basis of research. The model must incorporate all of the physical elements which combined lead to damage (necessitating an in-depth understanding of these elements and how they interact with one another). Thorough validation of the output of the hazard module is also essential.
Meteorological dataFor each actual tropical cyclone event, best estimates of a cyclone’s position and intensity are recorded by meteorological agencies at 6-hourly intervals. The position, given in latitude and longitude, is the position of the center of the cyclone’s eye. Intensity is defined as the maximum sustained surface wind speed (Wmax). These so called “best track” data are sufficient to represent the smoothed path of each tropical cyclone event, but do not describe the actual size and shape of the full wind field, information which is needed for assessment of expected damage to property across the full geographical area passed over by a cyclone. To recreate this, we also need to know the radius of maximum sustained wind speed (Rmax), which is located near the eye wall, and the radius of gale (34 knots1) wind speed (Rgale), which is a measure of the extent of the cyclone’s circulation. Contrary to what is often assumed, the Rmax alone cannot be relied upon to give a good indication either of the wind profile or of the radial extent of the circulation.
1 One knot is equivalent to 0.514 meters per second, 1.151 miles per hour and 1.852 kilometers per hour. Knots are the units used throughout this publication.

PartnerRe 2010The CatFocus® Tropical Cyclone Model
7
Continuous efforts are being made by national meteorological services and the scientific community to improve the quality and amount of information contained in historical best track data2,3, and to capitalize on technological advancements to collect more and better data on future events. The best track data for hurricane Andrew (1992) was, for example, officially updated by the National Hurricane Center using an updated algorithm to extrapolate recorded flight level wind speed measurements to surface wind speed; this new data had the effect of increasing the landfall estimate of maximum sustained wind speed (Wmax) from 125 to 145 knots4,5. Clearly,6
2 C. W. Landsea, et al, “A Reanalysis of the 1911–1920 Atlantic Hurricane Database,” Journal of Climate, vol. 21, no. 10, pp. 2138–2168, 2008.
3 K. R. Knapp et al, “The International Best Track Archive for Climate Stewardship (IBTrACS),” Bulletin of the American Meteorological Society, vol. 91, no. 3, pp. 363–376, 2010.
4 C. W. Landsea et al, “A Reanalysis of Hurricane Andrew’s Intensity,” Bulletin of the American Meteorological Society, vol. 85, no. 11, pp. 1699–1712, 2004.
5 C. C. Watson and M. E. Johnson, “Hurricane Loss Estimation Models: Opportunities for Improving the State of the Art,” Bulletin of the American Meteorological Society, vol. 85, pp. 1713–1726, 2004.
6 J. P. Kossin and M. Sitkowski, “An Objective Model for Identifying Secondary Eyewall Formation in Hurricanes,” Monthly Weather Review, vol. 137, no. 3, pp. 876–892, 2009.
enhancements such as this have a large effect on tropical cyclone catastrophe models, since many had been calibrated on a wind field generated using the previous best track data together with the insured losses from the event. As regards new technologies, the availability of detailed remote sensing data (satellite microwave imaging) has, in recent years, improved both the observation of tropical cyclones over oceans and our understanding of the evolution of structural changes in tropical cyclones, both leading to positive developments in catastrophe modeling (figure 2).
Figure 2 Satellite microwave images of (a) hurricane Frances on August 30, 2004, and (b) hurricane Katrina August 28, 2005. An eyewall replacement is underway at the time of the image in (a); convection in the primary eyewall (marked PE) is weakening while convection in the secondary eyewall (marked SE) strengthens. The warm (blue) ring between the primary and secondary eye-walls identifies the moat, an area associated with warm and dry, sinking air. In this event, the secondary eye-wall continued to contract and ultimately replaced the primary eye-wall. For comparison, hurricane Katrina in the image on the right (b) exhibits a single (primary) eye wall at the time of the image. Source: Kossin and Sikowsky, 20096
PartnerRe 2010The CatFocus® Tropical Cyclone Model
8
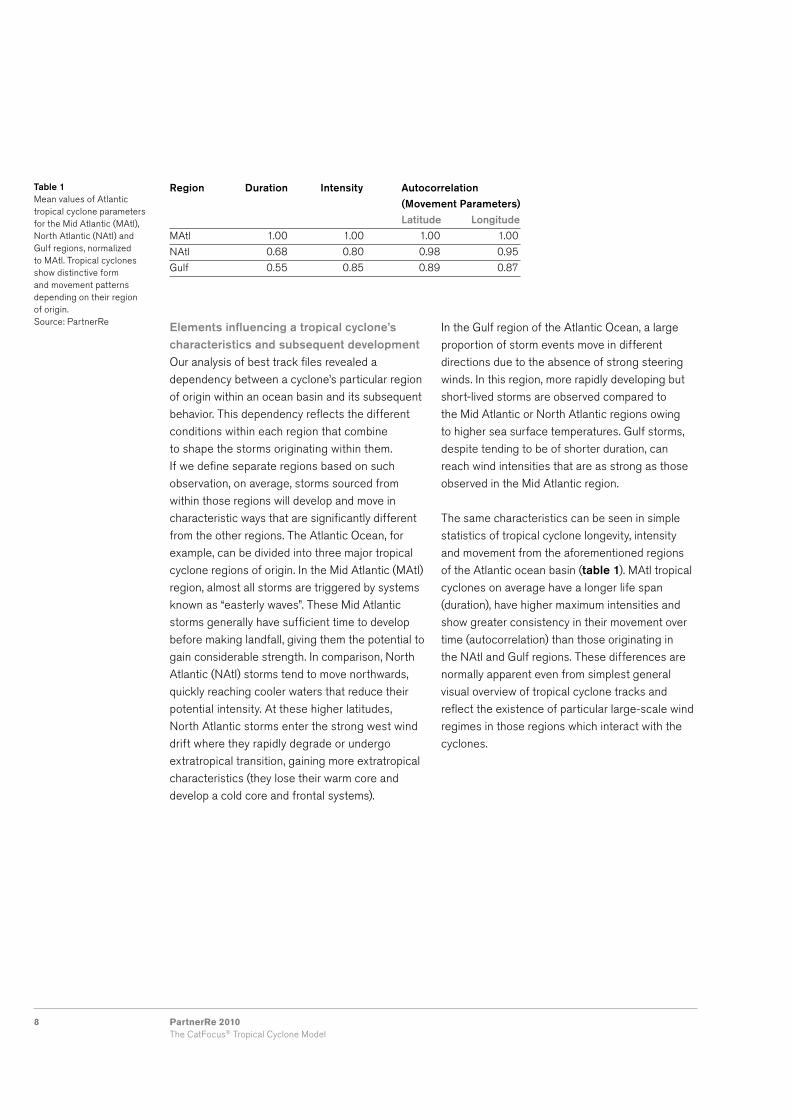
Elements influencing a tropical cyclone’s characteristics and subsequent developmentOur analysis of best track files revealed a dependency between a cyclone’s particular region of origin within an ocean basin and its subsequent behavior. This dependency reflects the different conditions within each region that combine to shape the storms originating within them. If we define separate regions based on such observation, on average, storms sourced from within those regions will develop and move in characteristic ways that are significantly different from the other regions. The Atlantic Ocean, for example, can be divided into three major tropical cyclone regions of origin. In the Mid Atlantic (MAtl) region, almost all storms are triggered by systems known as “easterly waves”. These Mid Atlantic storms generally have sufficient time to develop before making landfall, giving them the potential to gain considerable strength. In comparison, North Atlantic (NAtl) storms tend to move northwards, quickly reaching cooler waters that reduce their potential intensity. At these higher latitudes, North Atlantic storms enter the strong west wind drift where they rapidly degrade or undergo extratropical transition, gaining more extratropical characteristics (they lose their warm core and develop a cold core and frontal systems).
In the Gulf region of the Atlantic Ocean, a large proportion of storm events move in different directions due to the absence of strong steering winds. In this region, more rapidly developing but short-lived storms are observed compared to the Mid Atlantic or North Atlantic regions owing to higher sea surface temperatures. Gulf storms, despite tending to be of shorter duration, can reach wind intensities that are as strong as those observed in the Mid Atlantic region.
The same characteristics can be seen in simple statistics of tropical cyclone longevity, intensity and movement from the aforementioned regions of the Atlantic ocean basin (table 1). MAtl tropical cyclones on average have a longer life span (duration), have higher maximum intensities and show greater consistency in their movement over time (autocorrelation) than those originating in the NAtl and Gulf regions. These differences are normally apparent even from simplest general visual overview of tropical cyclone tracks and reflect the existence of particular large-scale wind regimes in those regions which interact with the cyclones.
Table 1Mean values of Atlantic tropical cyclone parameters for the Mid Atlantic (MAtl), North Atlantic (NAtl) and Gulf regions, normalized to MAtl. Tropical cyclones show distinctive form and movement patterns depending on their region of origin. Source: PartnerRe
Region Duration Intensity Autocorrelation
(Movement Parameters)
Latitude Longitude
MAtl 1.00 1.00 1.00 1.00
NAtl 0.68 0.80 0.98 0.95
Gulf 0.55 0.85 0.89 0.87

PartnerRe 2010The CatFocus® Tropical Cyclone Model
9
An example of a more complex dependency relationship between observed tropical cyclone characteristics (parameters) is the influence of a cyclone’s intensity on its movement pattern. Weak systems will often display relatively random changes in track in comparison to stronger hurricanes. This is explained by the fact that low intensity tropical cyclones often consist of multiple areas of atmospheric convection (i.e. rising air, as for example was displayed by the yellow and red colored areas in figure 2) which are not well concentrated around the center of the cyclone. The areas of convection interact with one another, each contributing to the overall circulation of air and movement of the cyclone as a whole. If a particular part of a weak tropical cyclone exhibits stronger convection than other regions, the movement of the center of the cyclone is affected more than it is in stronger tropical cyclones. In stronger cyclones, convection is organized into ring and spirals patterns, which help to stabilize the circulation of air in the tropical cyclone so that the overall movement of the cyclone cannot be as easily influenced by other areas of convection originating from elsewhere in the cyclone. Stronger cyclones therefore show higher autocorrelation in their movement than weaker ones.
All such tropical cyclone characteristics need to be included in the hazard model to ensure that artificially generated storms are realistic, which in-turn ensures that the statistics of observed and modeled storms are internally consistent.
CatFocus® event simulationBased on the most up-to-date best track files, other meteorological and oceanographic data and our own research, PartnerRe established a stochastic hazard model that simulates an extended track database for hundreds of thousands of tropical cyclone events. The model simulates the parameters of position, intensity (maximum sustained wind speed, Wmax), and Rmax and Rgale (to describe the full wind field). All parameters are consistent with the observed record and over the entire life cycle of each event, including formation (“genesis”), mature stage and period of decay (“lysis”) over land or open seas7. Rmax and Rgale are dependent on storm intensity and current position and all simulated parameters are dependent on the region in which the storm originated.
7 A guided “random walk” method is used as the basis for our stochastic model. The model assumes a stochastic process of tropical cyclone genesis and lysis, each parameter varying with (i.e. a function of) space and time. Each of the key parameters at genesis are initially conditioned random variables, but these are then guided by climatologically derived spatial patterns of the mean and variance of cyclone movement and intensity. Each of these model parameters is modeled conditional on previously chosen values to ensure a correct autocorrelation structure. The spatial patterns are created using spatial analysis techniques which minimize the potential for poor, unrealistic or physically impossible interpolation and extrapolation.

PartnerRe 2010The CatFocus® Tropical Cyclone Model
10
Radius of maximum sustained wind (Rmax) as a function of maximum sustained wind (Wmax)The Rmax/Wmax relationship derived from
observations shows that there is a tendency for Rmax
to be longer for low Wmax values and shorter for high
Wmax values, a phenomenon well explained by the
dynamics which govern tropical cyclones. However, the
considerable variation around (large spread of gray
shading above and below the solid red curve in figure
3a) the derived mean relationship should also be
modeled. For instance, at Wmax = 75 knots (vertical
red dashed lines in figure 3a and figure 3b, the
probability density of the observations after the mean
at Wmax = 75 knots has been subtracted (i.e. the
residuals, which are anomalous values of Rmax, figure
3c and figure 3d), shows that there have been cyclones
with Rmax anomaly values as low as –50 km or
as high as +150 km. Such deviations from the mean
relationship show that not all Rmax values are uniquely
associated with a particular Wmax value. Internal
consistency between observed tropical cyclones and
the CatFocus® stochastic model’s tropical cyclones is
maintained by ensuring that the information from the
mean relationship (figure 3 a, red curve) and also the
information about the residual probability density at
each value of Wmax is used to produce Rmax for our
stochastic storms. The track simulation method draws
samples from these residual distributions ensuring that
the stochastic event set has a similar residual structure
to the historical dataset. Internal consistency is shown
by the similarity in the gray shading in figure 3a and
figure 3b and probability density functions in figure 3c
and figure 3d.
Figure 3Rmax as a function of Wmax (a) is needed to estimate the wind field of observed tropical cyclones in the Atlantic ocean basin prior to routine observation of Rmax and Rgale. This relationship is used as a basis to generate internally consistent Rmax values for the CatFocus® stochastic track wind fields (b). The red curves represent the mean relationship. The gray shading shows the relative density of observed/modeled values, darker gray indicating a higher density. (c) and (d) show the probability density functions at Wmax = 75 knots (a slice thorough the function shown by the dashed red lines in (a) and (b), showing the positively skewed nature of the residuals at a given value of Wmax of the mean relationship. CatFocus® models both the mean and the residuals to deliver internally consistent events.
Rmax anomalies (km)
d)
150100500-50
Den
sity
Rmax anomalies (km)
Den
sity
15050-50 0 100
c)
10050 150
Wmax (knots)
b)
0
CatFocus® Modeled
Rm
ax (
km)
100 15050
Wmax (knots)
Rm
ax (
km)
350
250
150
50
0
350
250
150
50
0
0
Observed
a)

PartnerRe 2010The CatFocus® Tropical Cyclone Model
11
Wind field modelingAs mentioned above, together with position and intensity, our hazard model’s simulations also deliver the parameters necessary to calculate the wind field (Rmax and Rgale) in a way which is consistent with the observed record. These parameters depend on the maximum sustained wind speed (Wmax) and latitude and are derived from various best track data, e.g. McAdie et al 20098 and Demuth et al 20069. A key component of the CatFocus® wind field model is the way it models the relationship between Rmax and Wmax (figure 3). This relationship is needed since many of the early best track data contain only Wmax and not Rmax. Estimating the mean Rmax/Wmax relationship (figure 3a and b, red curves) shows that there is a tendency for Rmax to be longer for low Wmax values and shorter for high Wmax values. However, the mean relationship does not explain the substantial variation in this relationship from one cyclone to another; the gray shading indicates the density of observation points and shows that there is also the possibility of some very short and very long Rmax values (for example at a given Wmax of 75 knots, figure 3c). CatFocus® uses information from the mean relationship and information about the residual probability density at each value of Wmax to produce Rmax for its stochastic storms. This comprehensively modeled relationship between key tropical cyclone parameters is just one of a handful of CatFocus®’s advanced statistical modeling techniques that help to create internal consistency between the statistics of observed and stochastic event sets.
8 C. J. McAdie et al, “Tropical Cyclones of the North Atlantic Ocean, 1851-2006.” Historical Climatology Series 6–2, Prepared by the National Climatic Data Center, Asheville, NC in cooperation with the National Hurricane Center, Tech. Rep., 2009.
9 J. L. Demuth, M. DeMaria, and J. A. Knaff, “Improvement of Advanced Microwave Sounding Unit Tropical Cyclone Intensity and Size Estimation Algorithms,” Journal of Applied Meteorology and Climatology, vol. 45, no. 11, pp. 1573–1581, 2006.
Once we have modeled various dependencies between cyclone variables, e.g. Rmax as a function of Wmax, a wind field model (the modified Rankine vortex equation) is used to approximate the radial shape of the wind field outside the Rmax at any given point in time. The wind field model incorporates features such as the rate at which wind speed reduces with distance from the cyclone eye, the effects of eyewall cycles, and how rotating winds are modified by the forward translation speed of a cyclone and the underlying surface of sea or land.
As regards eyewall cycles, the model approximates the occurrence of secondary eyewall replacement in the stochastic event set by allowing the wind field parameters to vary within the observed bounds (as shown in figure 3), and also ensures that the rate of change in parameters over time is consistent with those observed during eyewall replacement cycles. Together, these aspects of the model create consistency between the observed and modeled frequencies of such events5. Our validation studies (see page 17, Model internal consistency and validation) show that although the wind field model does not resolve the intricate processes of secondary eyewall replacement, it is capable of reproducing loss estimates with considerable accuracy. More complex wind field modeling methods do not necessarily lead to improvements in these estimates5.

PartnerRe 2010The CatFocus® Tropical Cyclone Model
12
Generating the shape of the wind field over time CatFocus® uses a modified Rankine vortex model to
create wind fields10,11. One of the components of the
Rankine vortex equation (the exponent, X) is a variable
that describes the rate at which wind speed reduces
as a function of radial distance from the center of the
cyclone. An exponent of X = 1 would signify the
assumption of “conservation of angular momentum”
for the inflowing air. This would result in a very steep
wind profile, characteristic of extremely compact storm
systems. In reality, much flatter profiles are often
observed (0.4 < X < 0.6), owing to the fact that the
inflowing air loses a significant amount of angular
momentum on its way to the centre due to friction and
convectional processes. This loss of angular momentum
is a major cause of the stabilization of tropical cyclone
vortices. By making Rmax and Rgale dependent on the
actual stage of development of a simulated cyclone,
the CatFocus® wind field model incorporates a dynamic
adaptation of the wind profile. Simulated Category 2
and 3 cyclones have an average exponent of X = 0.6.
In contrast, lower values, representing flatter wind
profiles, are modeled for very low intensity events,
whereas higher intensity events are most likely to have
a steeper profile but with considerably more variability
of the exponent within the storm lifetime due to the
formation of secondary eyewalls. For weak tropical
storms this reflects the fact that the circulation is not
confined to the center. However, as the cyclone evolves
and gains strength, the eye wall tends to contract and
the profile subsequently steepens. “Eyewall cycles”
are a feature of tropical cyclones of all intensities (see
example in figure 2), although there is tendency for the
phenomena to be more frequent for higher intensity
events6. These cycles occur when a secondary wind
maximum evolves beyond the Rgale and then gradually
moves inward to finally replace the original eye wall.
This can lead to a progressive flattening profile for
these storms, explaining the greater variability in the
exponent values.
10 R. H. Simpson and H. Riehl, The Hurricane and its Impacts. Louisiana State University Press, Baton Rouge, 1981.
11 E. R. Boose, D. R. Foster, and M. Fluet, “Hurricane Impacts to Tropical and Temporate Forest Landscapes,” Ecological Monographs, vol. 64, no. 4, pp. 369–400, 1994.
At this stage we need to build in our knowledge of how
rotating winds are modified by the forward translation
speed of a cyclone and the underlying surface of sea
or land. The magnitude of the asymmetry in the wind
field due to forward movement of the storm is controlled
by the variable A, whereas friction caused by winds
flowing over sea and land and how the gustiness
of wind is influenced by the underlying topography are
modeled by the variable G.
Wind speed (W) at a given radius (r) and clockwise
angle () between the direction of movement and
the radial line from the center of the storm to the point
of wind speed evaluation, is given by the following
equation:
W(r,θ) =G (Wmax (Rmax) X – AV(1 – sin(θ))) r > Rmax
G (Wmax – AV (1 – sin (θ))) r < Rmax
–––r
Where:
Rmax is the radius of maximum sustained wind speed
Wmax is the maximum sustained wind speed
G is a combined wind gust and wind friction term
A is an asymmetry factor
V is the translational velocity of the tropical
cyclone eye
X the exponent X controls the shape of the profile
and is derived from observed Rmax and Rgale
or modeled versions of these parameter where
they are not present in the historical records
(as is the case for the stochastic event set wind
field generation).

PartnerRe 2010The CatFocus® Tropical Cyclone Model
13
Frequency modelingTo assess the risk of loss to a portfolio from tropical cyclone hazard, a catastrophe model must also adequately model the frequency of loss (primarily driven by the frequency of extreme wind speeds) for the given location/s. Notably however, tropical cyclone hazard models, whether stochastic or dynamical (modeling the physics of a process), often show inconsistency in the frequency of occurrence of extreme wind speeds at a given location (or within a given region) compared to historical wind observations. This problem becomes greater for rarer, extreme wind speeds. There are several reasons for this inconsistency.
The frequency/intensity relationship of tropical cyclones in studied ocean basins is known to be influenced by large-scale climate phenomena, such the El Niño Southern Oscillation, the Quasi Biennial Oscillation and the Atlantic Multidecadal Oscillation12 on intra-seasonal to decadal time periods. These frequency changes, if clearly visible in the underlying best track data, can be modeled relatively easily either through the hazard or financial/loss modules of the CatFocus® model.
Beyond these large-scale phenomena, there are several other factors that can cause models to produce frequency/intensity values that are not consistent with observation. Sampling issues are perhaps the most obvious reason, i.e. observation reflects only short or inhomogeneous wind speed records (the main reason why stochastic catastrophe models are used), and also that observed events, in being limited, do not cover the full spectrum of possible events. Physics-based models within a stochastic model, together with the statistical theory that models the occurrence of extreme values (in this case extreme wind speeds), can help us explore this range of possible events and identify the important processes involved, thereby filling the observation gaps.
12 “Hurricane Season Variability”, PartnerRe 2007.
Another important factor that can be at play here is systematic model bias, i.e. bias/es in the modeling method despite every effort to minimize such errors. An example of bias would be an incorrect assumption made about the type of extreme wind speed probability distribution, causing a consistent difference in the modeled and observed 1 in 100 year return period wind speed.
It is in fact often difficult to identify the cause/s of frequency differences. On the one hand, observed records are short in length, making extrapolation using extreme value analysis techniques uncertain. In these cases there are grounds for trusting a simulation model more than historical observation, especially if the geographical region of interest is small compared to the spatial scale of tropical cyclone wind fields. On the other hand, we know through experience that statistical and dynamical models can be biased and therefore that they should not be over-interpreted, but where possible, corrected. For instance, where we found regional biases in our model we first recalculated the relevant parameters of the model using the latest best track data and/or corrected our track simulation parameters. In other cases, where our model still showed biases, we used statistical calibration techniques which minimize the frequency differences at various intensities based on extreme value analysis models. The cases presented in figure 4 represent wind speed climatologies after biases in the track generation method have been corrected.
Since the CatFocus® hazard model, put simply, is based on the statistics of observed tropical cyclone data, we would expect it to reproduce the historical return periods of wind speed well for regions where there are a high number of events observed and where the meteorological data collected is reliable. In these regions we would expect the statistics given by our hazard model to be consistent with the historical record, i.e. to show good internal consistency.

PartnerRe 2010The CatFocus® Tropical Cyclone Model
14
Return period (years)
Win
d sp
eed
(kno
ts)
180
160
140
120
100
801 10 100
h)
Return period (years)
Win
d sp
eed
(kno
ts)
180
160
140
120
100
801 10 100
g)
Return period (years)
Win
d sp
eed
(kno
ts)
180
160
140
120
100
801 10 100
f)
Return period (years)
Win
d sp
eed
(kno
ts)
180
160
140
120
100
801 10 100
e)
Return period (years)
Win
d sp
eed
(kno
ts)
180
160
140
120
100
801 10 100
d)
Return period (years)
Win
d sp
eed
(kno
ts)
180
160
140
120
100
801 10 100
c)
Return period (years)
Win
d sp
eed
(kno
ts)
180
160
140
120
100
801 10 100
b)
Return period (years)
Win
d sp
eed
(kno
ts)
180
160
140
120
100
801 10 100
a)
a)
b)
c)
d)
e)f)
g)h)
Figure 4A comparison of historical (black) and stochastic (red) modeled wind gust speeds for grid boxes in the Atlantic Ocean basin according to the central map. The solid curves represent a Generalized Pareto Distribution (GPD) fit made to each set of data. Dashed lines show the approximate 95% confidence intervals. These graphs highlight how observation alone cannot give the full picture of tropical cyclone intensity and frequency at a given location, and especially not at the most extreme wind speeds.
As an example of how internal consistency can be checked, figure 4 shows historical wind speed values (produced by the CatFocus® wind field model) and modeled stochastic wind speed values for selected 50 km grid boxes centered at the positions marked by the central sub-figure. The solid lines show the Generalized Pareto Distribution13 fitted to maximum wind gust speed data from the historic (black) and stochastic (red) event sets. For most locations there is reasonable
13 A probability distribution function based on extreme value theory which is suitable for modeling the frequency/intensity of extreme wind speeds.
agreement between the curves at wind gust speeds of between 80 and 120 knots (there is also good agreement between the distributions below 80 knots, not shown). Above 120 knots there are only between 1 and 7 observations at the given locations over the last 110 years; estimating frequencies from such small samples would not be reliable. The fact that CatFocus® shows relatively good agreement between the historic and stochastic event sets at these high wind speeds is a good test of the model’s internal consistency. However, at more extreme wind speeds there is more likely to be variation between the historic and stochastic event sets. For instance, in (a) our

PartnerRe 2010The CatFocus® Tropical Cyclone Model
15
stochastic model (red curve) indicates that there is substantially more risk of wind speeds above 140 knots than indicated by the historic event set (black curve). This is likely to be the result of sampling issues associated with taking a relatively small area and data set to build the historical climatology, and shows the added value of using a stochastic event set based on track simulations to help inform us of the risk of extreme wind speeds. The opposite situation is shown for Grand Cayman Island (g) where the stochastic set indicates that the historic event set overestimates the wind speed risk.
Such analysis shows that sampling issues play a major role in determining the frequency/intensity relationship. This fact strongly supports the use of track simulation based catastrophe models over the alternative method of using samples from Generalized Pareto Distribution functions fitted to historical values (combined with information on how extreme wind speeds are correlated between locations). Stochastic track simulations avoid sampling errors at small spatial scales and can also model the loss correlations in many different territories in a physically consistent way14. The advantages of stochastic models far outweigh the drawbacks of possible biases (which can in many cases be corrected, as previously discussed).
14 T. M. Hall and S. Jewson, “Comparison of Local and Basinwide Methods for Risk Assessment of Tropical Cyclone Landfall,” Journal of Applied Meteorology and Climatology, vol. 47, pp. 361–367, 2008.
Vulnerability Modeling The vulnerability module determines the ground-up loss to a portfolio of risks for each tropical cyclone event in the “event set” from the hazard module. To do this, the damage ratios of all risks located at any specific site are determined based on the modeled wind speeds. Line of business, occupancy class, building quality, construction type and coverage are all used to identify the relevant vulnerability functions which define the average damage for a given wind speed as a percentage of the total ground-up value. This basic description hides a host of research effort into the production of these functions. Many studies on vulnerability have been undertaken by engineers, including a wide range of wind tunnel experiments and post event onsite analyses. For example, in Australia in the late 1970’s, researchers embarked on studying the impact of wind damage on real buildings through mechanical stress-testing15. The purpose was to evaluate the forces needed to damage or destroy buildings of different types and to characterize common failure types. Following this and other pioneering work in this field, the Saffir-Simpson Hurricane Wind Scale (table 2) was developed in the early 1970’s. Many of the widely used damage assessment tools in the re/insurance industry use vulnerability functions derived from these studies. The vulnerability functions used in CatFocus® are constantly updated as new studies are published and when new data are available16.
15 R. H. Leicester and F. D. Beresford, “The resistance of Australian housing to wind forces,” Commonwealth of Australia, Dept. of Housing and Construction, Australian Government Public Service, Canberra, Australia, Tech. Rep., 1978.
16 P. Skerlj, J. Kleinn, H. Castella, “Hurricane Charley, August 10–15, 2004: Post-Storm Damage Survey”, PartnerRe 2004.

PartnerRe 2010The CatFocus® Tropical Cyclone Model
16
Such work has also led to safer building constructions that mitigate the effects of high winds. However, quite often the results of these studies were based on just one extreme event or, as in the case of wind tunnel experiments, idealized conditions that did not allow for the impact of airborne debris or “gustiness” during a storm. In fact, it is not primarily the static wind load that causes buildings to fail; the dynamic forces of gusty wind and the deconstruction of non-engineered parts, which then serve as airborne missiles, are responsible for much of the damage in a cyclone event. Another crucial risk factor in mitigating damage is building maintenance. It is not surprising therefore that it is often observed that a large number of buildings are completely unaffected by a severe storm, whilst a small proportion are seriously damaged (figure 5). 17
17 National Hurricane Center, National Oceanic and Atmospheric Administration. (2010) The Saffir-Simpson Hurricane Wind Scale. Available: http://www.nhc.noaa.gov/sshws.shtml
It is very important to take all these risk factors into account within the model, and not just to assume that losses will be average. At PartnerRe, we continuously collect and store insurance loss data for a wide range of portfolios and regions. With such data it is possible to calibrate the purely engineering-based loss distributions against real loss data from each region and to better take into account region-specific building features. Examples of the latter include mobile homes in the U.S. or traditional buildings in Japan; these can differ significantly from standard building types in terms of damage characteristics. In addition, our model also uses real loss data to calculate the whole probability distribution, providing a full description of the loss at each hazard intensity, not just the expected average value of damage state. This feature is particularly important when crediting for primary policy deductibles within the financial/loss module of the model.
Category Wind speed Likely effects (knots)1 64 – 82 Removal of shingles or roof parts possible. Unprotected windows may break if struck by flying debris. Serious damage of mobile homes possible especially if they are not anchored. Damage to shrubs and trees. Some coastal road flooding and minor pier damage.2 83 – 95 Removal of roof coverings from poorly constructed buildings. Damages to doors and windows. Unreinforced masonry walls can collapse. Destruction of mobile homes possible. Considerable damage to vegetation. Small craft in unprotected anchorages break moorings.3 96 – 112 Some structural damage to small residences and utility buildings with a minor amount of curtainwall failures. Widespread considerable roof damages. Mobile homes are destroyed or severely damaged. Flooding near the coast destroys smaller structures with larger structures damaged by floating debris.4 113 – 134 More extensive curtainwall failures. Some complete roof structure failure on residences. Substantial window damages to high-rise buildings. Most trees snapped or uprooted. Major erosion of beach areas. Major damage to lower floors of structures near the shore. Terrain may be flooded well inland.5 > 135 Complete roof failure on many residences and industrial buildings. Some complete building failures with small utility buildings blown over or away. Major damage to lower floors of all structures near the shoreline. Massive evacuation of residential areas may be required.
Table 2The Saffir-Simpson Hurricane Wind Scale. The scale corresponds to the 1-minute average sustained wind speed as opposed to gusts which can be 20% higher or more. Source: NOAA17

PartnerRe 2010The CatFocus® Tropical Cyclone Model
17
The financial/loss moduleTo convert the calculated, ground-up losses from all land-falling events into a risk premium for the particular portfolio, calculations within the model modify the individual loss distributions to reflect all relevant insurance and reinsurance conditions. Multiple locations involving separate site and policy deductibles and limits require especially sophisticated treatment. In such cases, the modified individual site loss distributions are subsequently combined to create the overall policy level loss distributions. The appropriate policy level insurance conditions are then applied. The effects of inuring reinsurance are finally calculated to arrive at an estimate of the overall loss and its distribution.
The outcome in all cases is a loss file for the particular portfolio, containing the expected event losses together with the variance of each event loss. In order to calculate a price, the loss file is analyzed to allow for the reinsurance layer structure. These loss files are also stored in CatFocus® and combined with loss files from other contracts for portfolio management purposes.
Figure 5Different levels of damage for similar and adjacent risks following Hurricane Andrew. Gustiness, building maintenance and air-borne debris all strongly contribute to heterogeneity in losses. Mobile homes, a characteristic building type in certain areas of the U.S., display a high vulnerability to wind damage, compared to more permanent structures.

PartnerRe 2010The CatFocus® Tropical Cyclone Model
18
Model internal consistency and validationThe purpose of the CatFocus® model is to produce realistic estimates of loss for individual events and an accurate probability distribution of the expected loss to a risk or portfolio of risks which is consistent with the observed loss probability distribution. This will only be the case if checks of internal consistency and model validation are performed at many different stages of the tropical cyclone risk modeling process. To reiterate, internal consistency refers to broad agreement between modeled and observed quantities and/or their statistics, whereas validation can be performed on more quantifiable elements of the model. The wind field model can, for example, be validated with wind speed measurements obtained from surface measuring stations which were not used to create the wind field in the first place. Key to all model validation studies is the use of data which is independent of the process that was used to build the model in the first instance.
Here we show two more examples of internal consistency and validation, in support of CatFocus® as a highly reliable tool for risk evaluation.
Figure 6 shows a subset of vulnerability functions used in the regional Japan model, each relating wind gust speed (knots) to a mean damage ratio (MDR) for residential and commercial buildings in varying quality. The red circles show the MDRs derived from actual losses to a mixed residential and commercial portfolio. This shows the common difficulty of dealing with insufficiently detailed loss data (in this case there is no distinction between commercial and residential losses). However, the loss data does show that the observed damage ratios lie within the range of the model’s vulnerability functions and thus serve as a validation of the vulnerability functions. As a side point, pricing a reinsurance treaty requires a careful choice of vulnerability functions based on experience and a good knowledge of a specific portfolio composition.
A second example of both validation and internal consistency related to event loss estimates and frequency exceedence curves is shown in Figure 7. Figure 7 (a) compares the modeled and actual loss for a mixed residential, commercial and industrial Japanese wind risk portfolio. Most modeled values lie between 50 and 200% of the actual loss, which in our experience are the approximate limits within which the modeled loss from a robust aggregate model should lie. It should be kept in mind that the actual loss data shown is completely independent of the modeling process, i.e. it has not been used for calibration of the vulnerability module and therefore provides an objective measure of the model’s performance.
70 80 90 100 110 120 130
Mea
n da
mag
e ra
tio (
MD
R)
Wind speed (knots)
Figure 6Vulnerability functions used in the CatFocus® Japan typhoon model. Red circles show the mean damage ratios (averaged within wind speed classes of 2 knots in width) based on provided independent loss data from Japan, data which serves as a validation of the vulnerability functions used in the model.

PartnerRe 2010The CatFocus® Tropical Cyclone Model
19
For the most damaging tropical cyclone, Mireille (1991), modeled loss is well captured by the model. However, the modeled losses of two storms, Tokage (2004) and ShanShan (2006) are severely under-represented because extreme rainfall and associated flood damages are not explicitly accounted for in the hazard module. These loss estimates could be improved through continued hazard model development, however in general, achieving extremely accurate loss estimates from an aggregate model, while desirable, is at the same time unrealistic.
The aim of an aggregate model is to produce modeled losses which are on average representative of as-if18 losses. A tropical cyclone model contains many approximations, each with varying degrees of uncertainty, from representing the true exposure to accounting for the decay of wind speeds over urban and mountainous terrain, to the approximate vulnerability of a particular building type to extreme winds. In this sense the performance of a tropical cyclone model cannot be judged solely on its ability to match modeled and as-if loss, since often the process of creating an as-if loss is also very uncertain.
18 “As-if” losses are past losses that have been adjusted to present day values of wealth and portfolio constitution. The term “as-if” comes from the notion of, “if the same historical tropical cyclone were to happen today, what would be the expected loss?”
Therefore, in combination with modeled loss comparisons, the loss probability distributions based on historic and stochastic event sets should match for lower return period events. Figure 7 (b) shows the loss exceedence frequency curve for the same portfolio using CatFocus® stochastic and historic event sets. Good agreement exists between the CatFocus® historic (black) and stochastic (red) event sets, showing that the model has a high internal consistency. Comparisons with vendor models help to benchmark CatFocus® and offer additional input to our underwriting process.
Net
loss
Return period (years)
10 1001
b)a)
Songda
Shanshan
TokageChaba
Bart
Mireille
Vicki
As-if net loss
Mod
el n
et lo
ss
Figure 7(a) An example of loss validation – comparing modeled net loss (net of deductibles and limits) with independent as-if net loss data. The solid black line represents equal modeled and as-if losses and the dashed black lines above and below this line show the 200% and 50% modeled versus as-if lines for comparison. (b) The return period of loss from the same independent source using the CatFocus® stochastic event set (red) and historic event set (black). Note the logarithmic x-axis.

PartnerRe 2010The CatFocus® Tropical Cyclone Model
20
ConclusionBuilding a reputable tropical cyclone risk model is a challenging task given the physically complex nature of tropical cyclones and the complexity of the relationship between the hazard and the loss caused. However, this summary shows that through the use of sophisticated statistical techniques based on physically sound arguments, together with the best available data, PartnerRe has developed a tropical cyclone model that accurately models the observed relationships between variables and produces loss estimates which are also well verified by independent data.
PartnerRe has strong in-house modeling capabilities and remains at the forefront of research in this field. The direct involvement of our researchers in the underwriting process also ensures that our models fully reflect the business needs that they support. Along-side the valuable outputs from other catastrophe models, we are able to advise our clients as an objective and trusted specialist.


www.partnerre.com