the cathodic reduction of bromate ions on mercury in
TRANSCRIPT

Scholars' Mine Scholars' Mine
Masters Theses Student Theses and Dissertations
1970
The cathodic reduction of bromate ions on mercury in neutral and The cathodic reduction of bromate ions on mercury in neutral and
basic solutions basic solutions
Jaw-Shin Chang
Follow this and additional works at: https://scholarsmine.mst.edu/masters_theses
Part of the Chemical Engineering Commons
Department: Department:
Recommended Citation Recommended Citation Chang, Jaw-Shin, "The cathodic reduction of bromate ions on mercury in neutral and basic solutions" (1970). Masters Theses. 5404. https://scholarsmine.mst.edu/masters_theses/5404
This thesis is brought to you by Scholars' Mine, a service of the Missouri S&T Library and Learning Resources. This work is protected by U. S. Copyright Law. Unauthorized use including reproduction for redistribution requires the permission of the copyright holder. For more information, please contact [email protected].
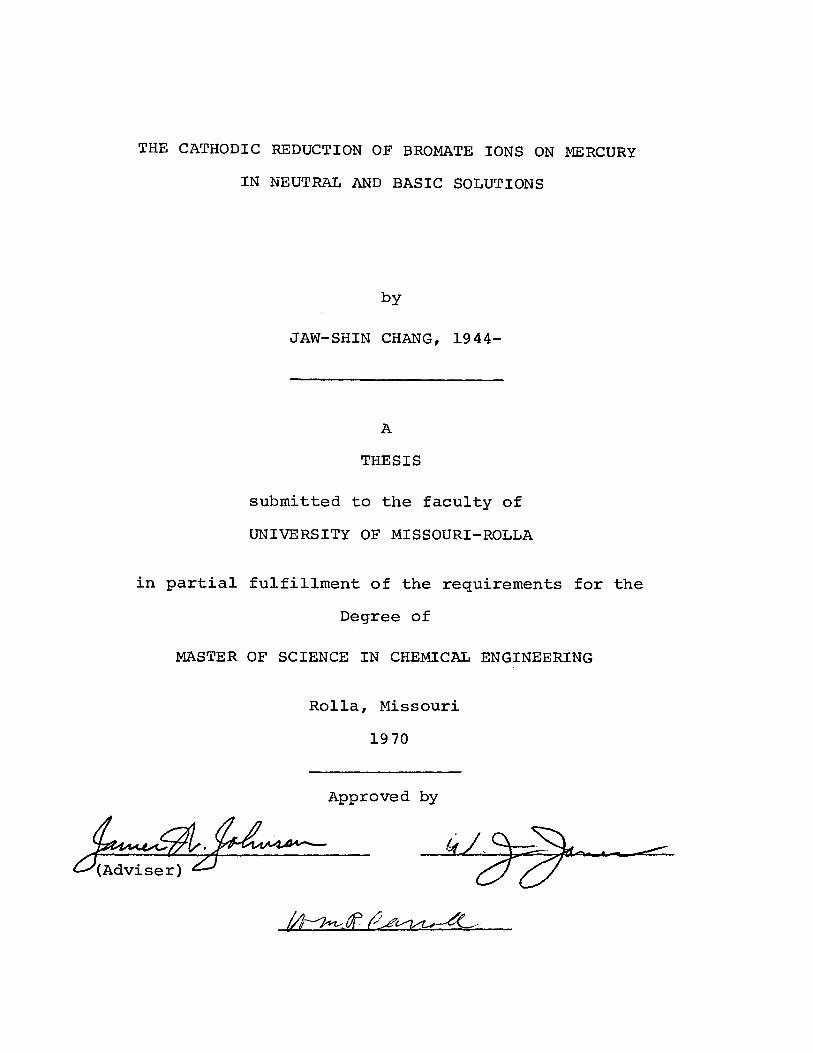
THE CATHODIC REDUCTION OF BROMATE IONS ON MERCURY
IN NEUTRAL AND BASIC SOLUTIONS
by
JAW-SHIN CHANG, 1944-
A
THESIS
submitted to the faculty of
UNIVERSITY OF MISSOURI-ROLLA
in partial fulfillment of the requirements for the
Degree of
MASTER OF SCIENCE IN CHEMICAL ENGINEERING
Rolla, Missouri
1970
Approved by
PUBLICA'I'ION THESIS OPTION
This thesis has been prepared in the style utilized
by the Journal of Electrochemical Society. Pages 1 - 17
will be presented for publication in that journal.
Appendices A, B, C and D have been added for purposes
normal to thesis writing.
ACKNOWLEDGEMENTS
The author wishes to thank Dr. J.W. Johnson, Professor
of Cheruical Engineering, who served as research adviser,
and Dr. W.J. James, Professor of Chemistry and Director
of the Graduate Center for Materials Research, Space
Sciences Research Center, University of Missouri-Rolla.
Their help, guidance and encouragement are sincerely
appreciated.
Thanks are extended to the Graduate Center for
Materials Research for the use of equipment, materials,
and a research scholarship.
ii
iii
TABLE OF CON'l'EN'l'S
Page
ACKNOvlLDGEMENTS •••••••••••••••••••••••••••••••••.••• ii
TABLE OF CONTENTS ••••••••••••••••••••••••••••••••••• iii
LIST 0 ~, FIGURES • • . . . . . • . . . . • • • . . . . • • . . . • . • . . • . . . . • . . i v
LIST OF TABLES •••••••••••••• v
THE CA'l'HODIC REDUCTION OF BrO 3
ON
Hg IN NEUTRAL MJD BASIC SOLUTIO~S •••••••••••••••• 1
Abstract......... . . . . . . . . . . . . . . . . . . . . . . . . . . . . . . 1
In traduction. . . . . . . . . . . . . . . . . . . . . . . . . . . . . . . . . . . 1
Experimental. . ................................ . 2
Results ........................................ 3
Discussion..................................... 4
Bibliography. . . . . . . . . . . . . . . . . . . . . . . . . . . . . . . . . . . 11
Captions for Figures ••••••••••••••••••••••••••• 15
APPENDICES • . . • . • . . . • . • . . . . . . . . . . . • . . . . . . . . . . . . . . . . . . 18
A.
B.
c.
D.
Materials ................................. .
Equipment ................................. .
Analytical . ............................... .
Experimental Data •••••••.••••••••••••••••••
19
21
22
31
VITA .......................... ·.·.·················· 44
LIST OF FIGURES
Figure Page
l. Polarization curves for the
reduction of Bro 3 on Hg at 25°C ..•••.•••.
2. Effect of K+ and Bro 3 concentrations
on the reduction of Bro; on Hg at
16
-1. 3 7 V (SHE) at 2 5° C. • . • . • . • . . . • . . . . • . . • • l 7
iv
TABLE
I.
LIST OF TABLES
PAGE
A Summary of the Efficiencies of Bro3
Reduction on Hg at 25°C ••.•.•..•....•.•. 12
II. Rest Potentials, Tafel Slopes, and
Electrolyte pH's for the Reduction
of Bro; on Hg at 25°C .•...•..••...•...•. 13
III. + -Concentrations of Na and F in the
Plane of Closest Approach for NaF
Solutions in Contact with Hg at 25°C ..•. 14
IV. Flow Chart for the Determination of
Br . . . . . . • . . . . . . . . . . . . . . . . . . . . . . . . . . • . . . 2 5
V. Flow Chart for the Determination of
Bro 3 ••..•........•...................... 28
VI. Data for the Efficiencies of Bro;
VII.
VIII.
Reduction on Hg at 25°C ...•.........•.•. 32
Data for the Efficiencies of Bro;
Reduction on Hg at 25°C (Bro; as a
Basis of Efficiency Determination) ..•... 33
The Current-Potential Relationship for
the Reduction of Bro; on Hg in
0.1 M KBro3
at 25°C ..................... 34
v
IX. The Current-Potential Relationship for
the Reduction of Bro; on Hg in
0. 05 H KBr0 3-1. 0 M KOH at 25°C.......... 35
X. The Current-Potential Relationship for
the Reduction of Bro; on Hg in
0 . 1 Jl1: KBrO 3-1. 0 M KOH at 2 5° C. • . . . • . . . • . 3 6
XI. The Current-Potential Relationship for
the Reduction of Bro; on Hg in
0.2 M KBr0 3-1.0 I1 KOH at 25°C .........•. 37
XII. The Current-Potential Relationship for
the Reduction of Bro; on Hg in
0.2 M KBr0 3-l.O M KOH at 25°C by
the Galvanostatic Method •......•....•... 38
XIII. The Current-Potential Relationship for
the Reduction of Bro; on Hg in
0.2 Jl1: KBr0 3-0.l M KOH at 25°C ........... 39
XIV. The Current-Potential Relationship for
the Reduction of Bro; on Hg in
0.1 M KBr03-0.l M KBr-1.0 M KOH
at 25°C (Run 1) .................•....... 40
XV. The Current-Potential Relationship for
the Reduction of Bro 3 on Hg in
0.1 M KBr0 3-0.l M KBr-1.0 M KOH
at 25°C (Run 2) ......................•.. 41
vi
Vll
XVI. The Current-Temperature Relationship
for the Reduction of Bro; on Hg
in 0.1 M KBro 3-1.0 H KOH • ••••••••••..••. 42
XVII. The Current-Temperature Relationship
for the Reduction of Bro 3 on Hg
in 0.1 Ivl KBro 3-0.l M KBr-1.0 M KOH ...... 43
THE CATHODIC REDUCTION OF Bro; ON Hg
IN NEUTRAL AND BASIC SOLUTIONS
Jaw-Shin Chang
Department of Chemical Engineering
and the
Graduate Center for Materials Research
University of Missouri-Rolla
Rolla, Missouri, U.S.A.
Abstract
The reduction of Bro 3 was studied in neutral and
basic solutions on a stationary Hg surface under activa-
tion controlled conditions. Coulombic efficiency studies
showed that Bro; was reduced to Br with high efficien-
cies. The polarization measurements lead to a proposed
reaction scheme which is consistent with the experimental
observations.
Introduction
The reduction of Bro 3 has been previously studied
primarily on a dropping Hg cathode. Factors affecting
the diffusion-controlled reaction have been well investi-
1-4 gated. The total diffusion current observed
2
corresponds to one of the following net electrode reac-
tions:
( l)
( 2)
The purpose of this investigation was to study the reduc-
tion on a stationary Hg surface under activation-controlled
conditions to obtain more information about the electro-
chemical reaction kinetics. The investigation included
studies of the efficiency of Bro; reduction and the
polarization behavior.
Experimental
The electrolysis cell had two co-axial compartments
separated by a fritted-glass disc. The inner compartment
(50 ml capacity) contained a Pd anode and the outer
compartment (250 ml capacity) a Hg pool cathode with a
surface area of 0.82 cm2 • All solutions employed ana-
lytical grade chemicals and distilled water. Pre-
purified nitrogen was bubbled through the electrolyte to
provide an inert atmosphere and for stirring.
The studies were made in neutral and basic solutions
with Bro; concentrations ranging from 0.05 to 0.2 M and
at 25+0.l°C except as stated. The amount of Br pro-
duced during the electrolyses was used as the basis of
the efficiency determinations, except for a few experi
ments which were based on the Bro; consumption.
The polarization behavior was determined potentia-
statically except as noted. A normal calomel electrode
(NCE) at 25°C was used as the reference electrode. A
salt bridge containing the same electrolyte as the
electrolysis cell was employed to prevent contamination
by the reference electrode. All reported potentials are
3
referred to the standard hydrogen electrode (SHE) at 25°C.
Results
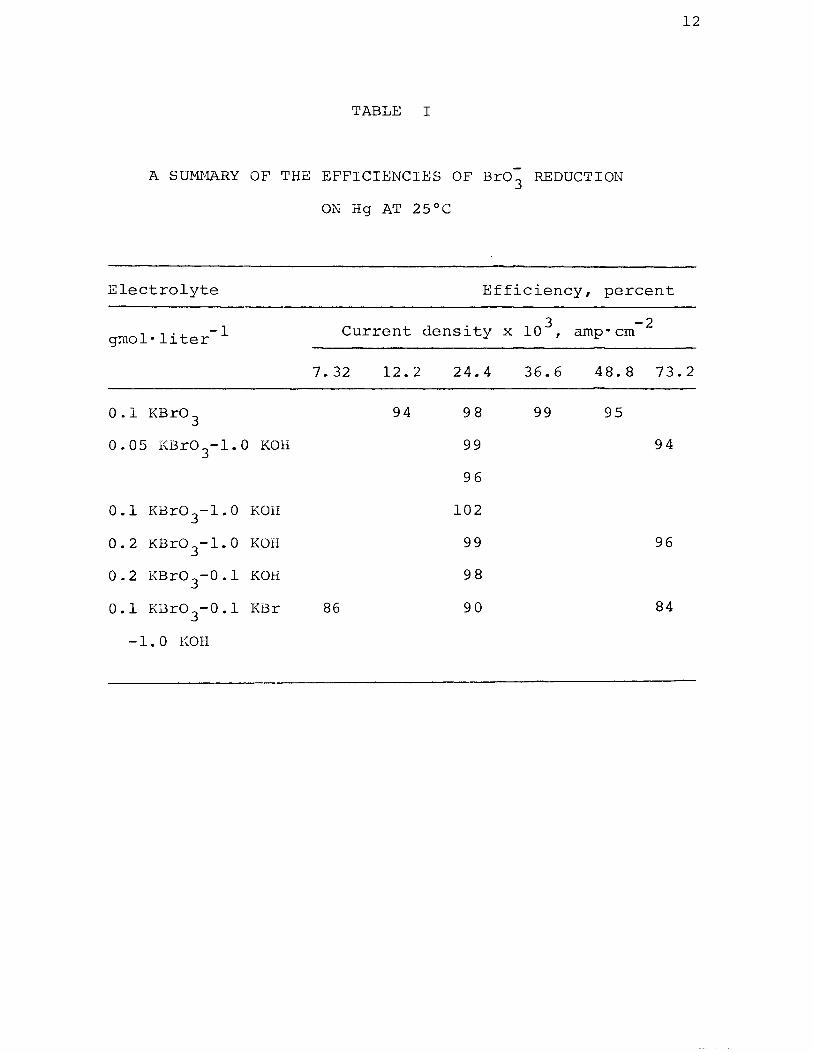
Efficiency Measurements. The efficiencies of the
Bro 3 reduction to Br are summarized in Tab. I. It can
be seen that the efficiencies are generally quite high.
The efficiencies in the KBr-KBr03
-KoH electrolytes were
- * based on the Bro3
consumption during an electrolysis
and were subject to more experimental error than the Br
-** production in solutions initially containing no Br .
In the electrolytes which originally contained Br-, the
anolyte became pale yellow after several hours of elec-
trolysis due to Br2 production from Br oxidation at
the anode.
*Analysis by the Iodometric Hethod.
**Analysis by Mohr's method.
4
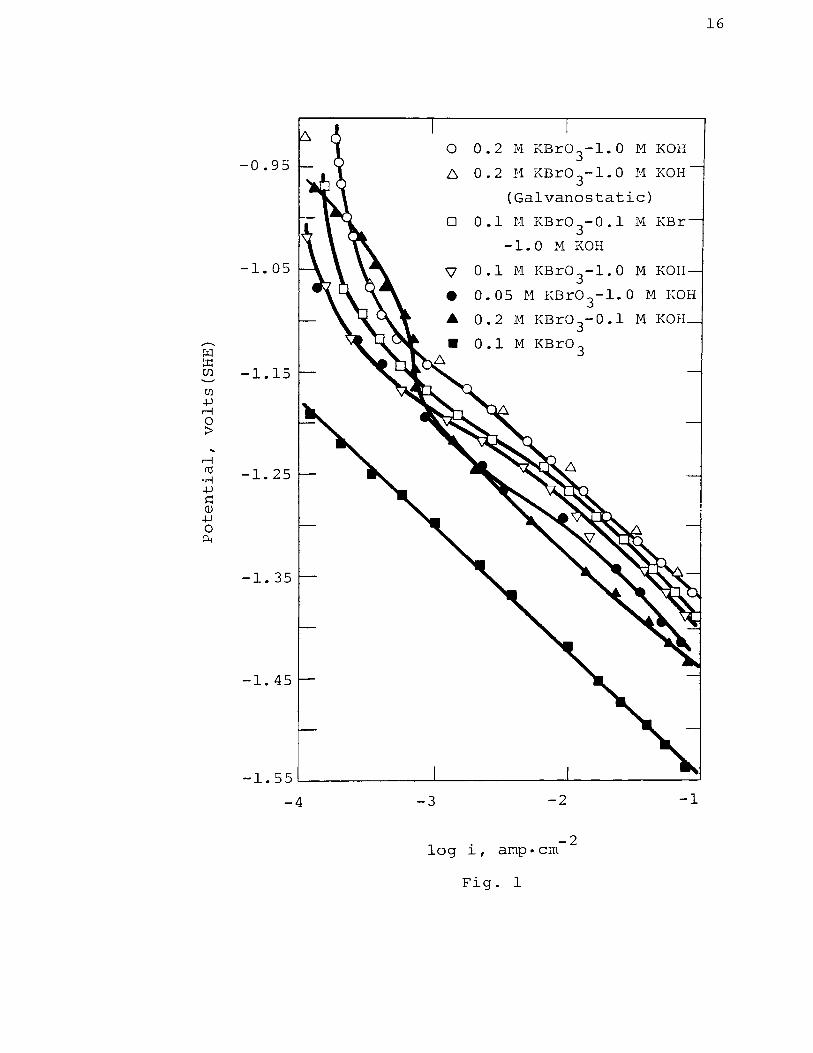
Polarization Measurements. The polarization measure-
ments were carried out with the same electrolytes used
for the efficiency measurements. Semi-logarithmic plots
of V vs. i are shown in Fig. 1. They contain linear
Tafel sections with slopes ranging from 0.100 to 0.125 V.
The rest potentials, Tafel slopes, and electrolyte pH's
are summarized in Tab. II. There were no significant
currents until the potentials were lowered to about 0.7 V
below the rest potentials. The polarization behavior
in 0.2 M KBro 3-1.0 M KOH was also studied galvanostatic
ally. As also seen in Fig. 1, the galvanostatic and
potentiostatic data are essentially the same. Only
very slight effec~were noted with Br- additions.
Discussion
The high efficiencies for the conversion of Bro 3 to
Br (84-102%) indicate this reaction to be the predominant,
if not exclusive, reaction occurring at the Hg cathode
under the conditions of this study. The reduction took
place in the potential region -1.10 to -1.55 V(SHE). The
charge on the cathode during the reduction is an important
consideration as it determines the type of interaction
between the electrode surface and species in solution.
The potential of zero charge (pzc) on Hg in the presence
of KBro3-KBr solutions can be estimated to be between
-0.2 and -0.4 v and to be pH independent.5
Thus, it
5
follows that Bro 3 is being reduced at a cathode that has
a relatively high negative charge. Since repulsive forces
exist between the Bro; and the surface at which it is
being reduced, one of the first points that must be
considered is the method by which the electron transfer
between the two takes place.
One type of reaction scheme that might be suggested
is an indirect one in which some neutral species or cations
in the solutions (i.e., H+, K+, or H20) is first reduced
to a reactive intermediate which remains in or goes into
solution and in turn reduces the Bro 3 . ~his would
circumvent the necessity of contact of the anion with the
negatively charged surface for electron transfer. The
hydrogen ions are at such low concentrations (pH = 13)
that they are not considered. The discharge of K+ to
give an amalgam (K/Hg) or water to give H" (ads) still
leaves the reactive intermediate on the negatively
charged surface and does not fit into this category.
However, if I-I" were desorbed, it could be the reactive
intermediate. Hydrogen evolution on Hg in alkaline
solutions purportly occurs through an initial discharge
of the alkali metal ion which subsequently reacts with
water. The mechanism in 0.1 N NaOH at 20°C has been
. 6,7 g1ven as
+ Na + Hg + e + Na/Hg ( 3)
Na/Hg + H2
0 r.§.s. HgH + Na+ + OH ( 4)
HgH + HgH ~ H2 + 2 Hg ( 5)
The Tafel relation was given as
n = -1.45 - 0.100 log i ( 6)
In the absence of similar information for KOH, it could
be reasonably assumed that K+ behaves similarly to Na+
and that the overpotential equations are related in a
manner similar to the equilibrium potentials, i.e.,
6
nKOH - nNaOH = EK+,K - ENa+,Na = -0.21 V. This gives for
the KOH solution
n = -1.66 - 0.100 log 1 ( 7)
Expressing this in terms of potentials on the normal
hydrogen scale (pH = 13) gives
v = EH+jH - 1.66 - 0.100 log 1
2
= -2.43- 0.100 log i
( 8 )
( 9 )
For hydrogen to be evolved (or in this case H. to be
deposited) at a rate equivalent to Bro; reduction
(l0-4-lO-l amp·cm- 2 ) would require potentials of -2.0 to
-2.3 V. These are sufficiently negative to the potential
region for Bro; reduction that H. (sol) can be eliminated
from consideration as an intermediate. It also does not
appear possible that any soluble reactive intermediate
would be formed from either K+ or water.
It is possible that a reactive intermediate on the
Hg surface is participating in the reduction, although
the problem with repulsive forces would still be present.
The h.e. mechanism mentioned above eliminates H. (ads)
and/or KH (potassium hydride) as being intermediates, but
K/Hg yet remains a possibility. There was some evidence
of amalgam formation because after polarizations for
long periods of time at high c.d. •s were terminated,
hydrogen could be seen slowly evolving from the cathode.
No specific information regarding K/Hg was found, but
Pourbaix8 gives the reversible potential for the forma
tion of Na/Hg as -1.6 V (pH independent). As sodium is
slightly more electropositive than potassium (0 .21 V),
the potential for the formation of K/Hg would probably
7
be in the vicinity of -1.8 V. This potential is gene
rally more negative than that for Bro; reduction, so it
appears that amalgam formation is a parallel reaction that
becomes appreciable only at high current densities. The
efficiency data (Tab. I) show a slight indication of this.
The high reduction efficiencies in themselves are also
evidence against such a reaction intermediate.
Another reaction scheme that is feasible involves
the combination of Bro; and a cation (or cations) into a
neutral or positively charged intermediate that can come
into contact with the negatively charged cathode. The
high coulombic efficiency for conversion to Br indicates
the bromate to be held at the cathode until the entire
reduction reaction has reached or neared completion. A
h . . l . z+ mec an1sm 1nvo v1ng KYBro3 cations has been proposed
by Orlemann and Kolthoff. 3 ' 4 A similar mechanism is
offered here which explains the experimental observations
and differs from the Orlemann-Kolthoff mechanism only
in that KBro 3 is proposed as the intermediate species
and that its formation is a result of ionic association
phenomena.
It is well known that cation concentrations increase
greatly above that of the bulk solution at negatively
charged Hg surfaces. Data for KBr and KBr0 3 are not
available but some estimations can be made from data for
NaF solutions (see Tab. III). The radii of potassium
ions are considerably larger than those of sodium ions 0
(1.33 compared to 0.97 A) causing the attractive forces
between K+ and the cathode to be less than those between
Na+ and the cathode. Though this would result in a
lesser surface (or double layer) concentration forK+,
it would still be expected to be on the order of 5 to 10
times the bulk value. Under these circumstances, there
would be a significant amount of ionic association. As
a first approximation, the extent of association could
be treated as an equilibrium phenomenon, i.e.,
(10)
8
9
and
(11)
From Tab. III, it can be seen that for NaF solutions,
8+8- is approximated by C+C-. Assuming this to be true
also for KBro 3 solutions,
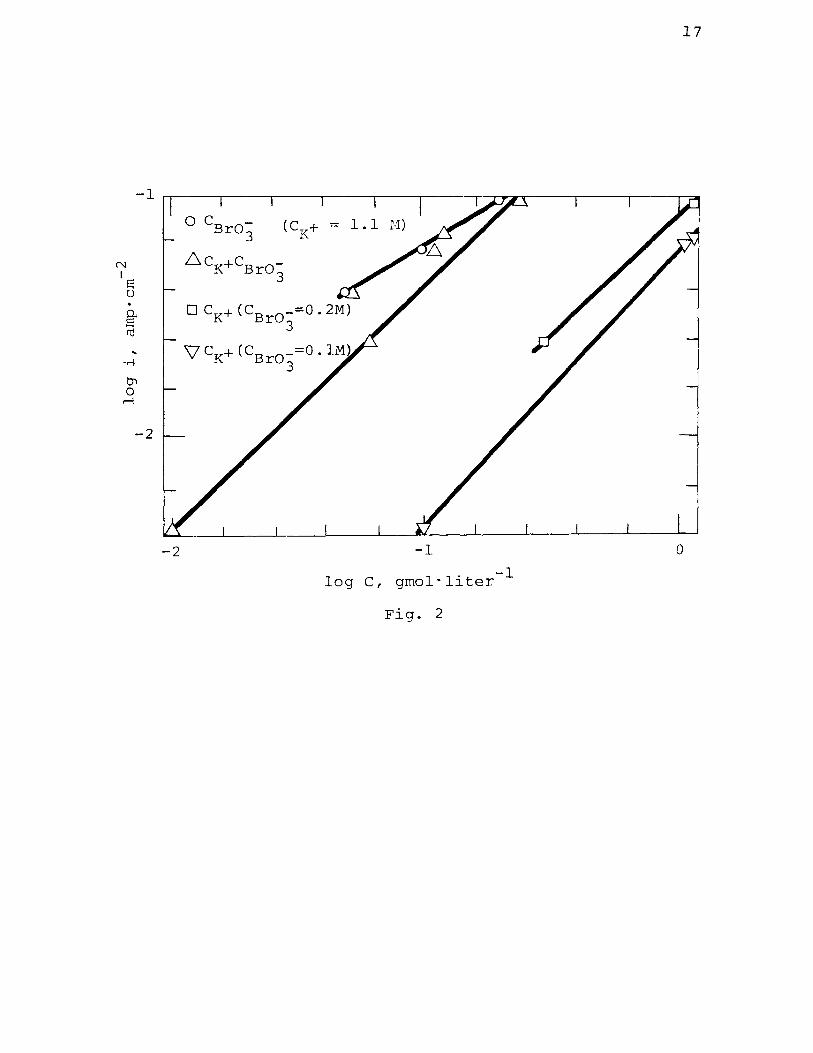
= K CK+ C -Bro3
(12)
If this concept of the reaction is true, then at a given
potential the current should be proportional to the
surface concentration of KBro3
, or
(i} = k 1 8 V KBr0 3
(13)
Substituting eq. (12),
(14)
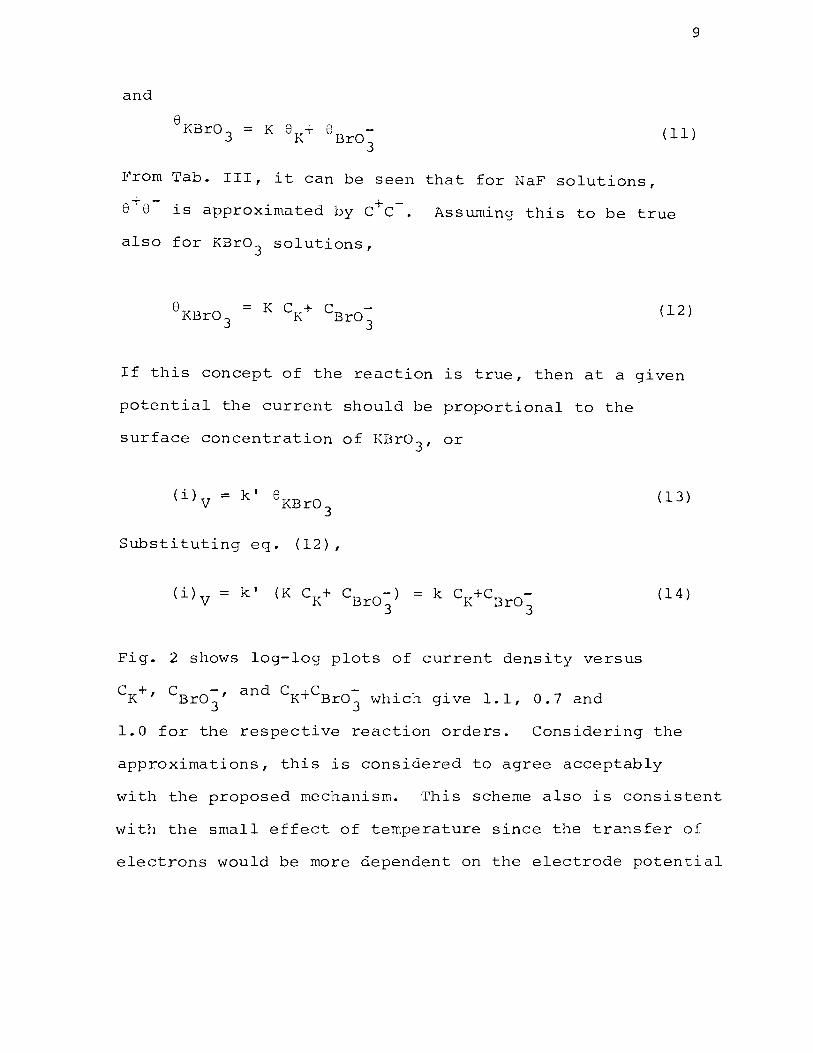
Fig. 2 shows log-log plots of current density versus
1.0 for the respective reaction orders. Considering the
approximations, this is considered to agree acceptably
with the proposed mechanism. This scheme also is consistent
with the small effect of temperature since the transfer of
electrons would be more dependent on the electrode potential
as it affects the surface concentrations than on the
energy of the reacting species. This information, along
* with the Tafel slopes of 2.3RT/aF , which indicate the
first electron transfer to be rate determining, leads to
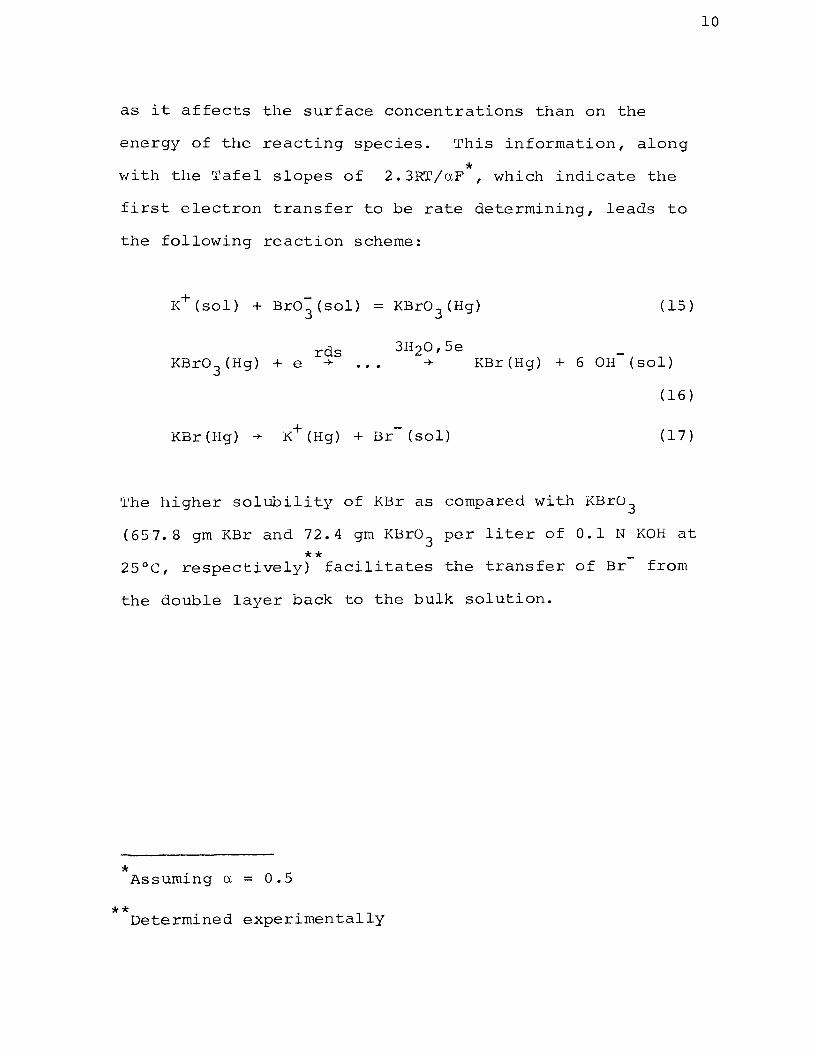
the following reaction scheme:
KBro 3 (Hg) (15)
3H20,5e rds KBr0 3 (Hg) + e + + KBr(Hg) + 6 OH (sol)
(16)
(17)
'I'he higher solubility of KBr as compared with KBrO 3
(657.8 gm KBr and 72.4 gm KBro 3 per liter of 0.1 N KOH at
** 25°C, respectively) facilitates the transfer of Br from
the double layer back to the bulk solution.
* Assuming a = 0.5
** Determined experimentally
10
BIBLIOGRAPHY
1. A. Rylich, Collection Czechoslov. Chern. Communication,
]_, 2 8 8 ( 19 35) •
2. J.J. Lingane and I.M. Kolthoff, J. Am. Chern. Soc., 61
825 (1939).
3. E.F. Orlemann and I.H. Kolthoff, J. Am. Chern. Soc.,
~' 1044 (1942).
4 . Ibid . I §..! ( 19 7 0 ) ( 19 4 2 ) .
5. R. S. Perkins and T .N. Andersen, Hodern Aspects of
Electrochemistry, Vol. 5, Chap. 3, Eds, J. O'M.
Bockris and B.E. Conway, Plenum Press, New York,
19 69.
6. J. O'M. Bockris and R.G.H. Watson, J. Chirn. Phys.,
i2_, 1 (1952).
7. J. O'M. Bockris and E.C. Potter, J. Electrochem. Soc.,
~' 169 (1952).
8. M. Pourbaix, Atlas of Electrochemical Equilibria in
Aqueous Solutions, pp. 129-131.
11
'I'ABLE I
A SUMMARY OF THE EFFICIENCIES OF Br0 3 REDUCTION
ON Hg AT 25°C
12
Electrolyte Efficiency, percent
-1 Current density 10 3 , -2 gmol·liter X arnp·crn
7.32 12.2 24.4 36.6 48.8 73.2
0.1 KBr0 3 94 98 99 95
0.05 KBro 3-l.O KOH 99 94
96
0.1 KBro 3-l.O KOH 102
0.2 KBr0 3-l.O KOH 99 96
0.2 KBro 3-0.l KOH 98
0.1 Kl::3r0 3-0.l KBr 86 90 84
-l. 0 KOH
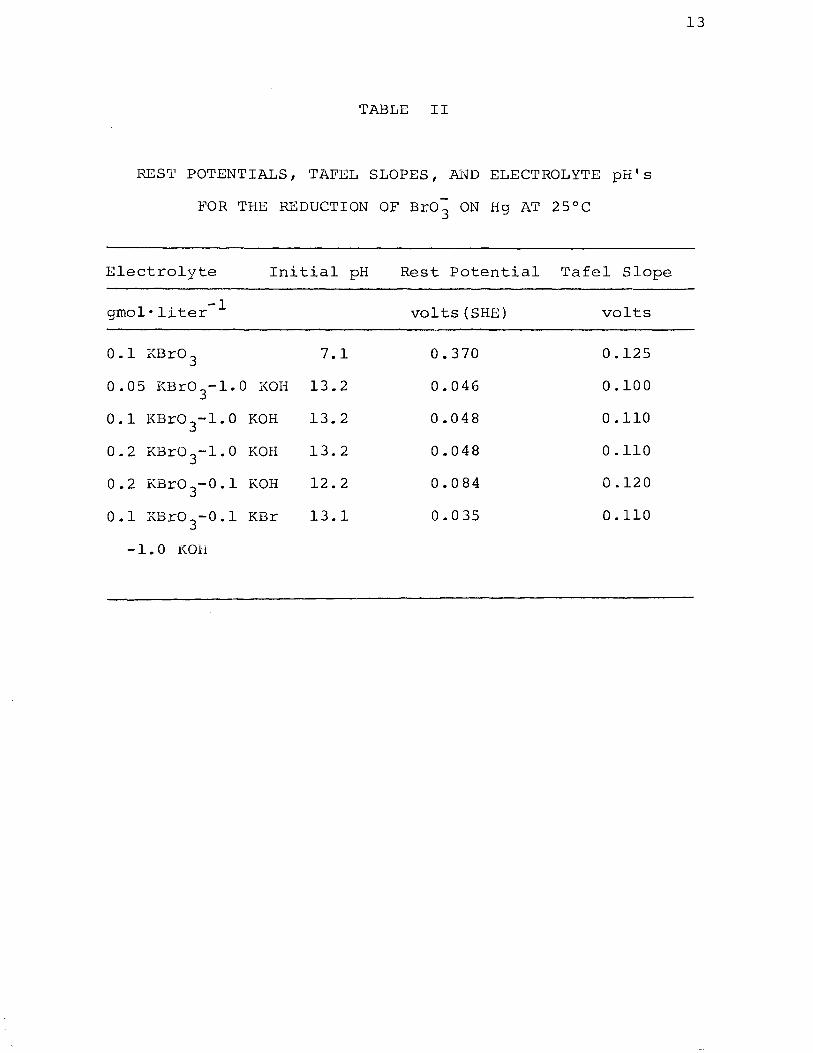
TABLE II
REST POTENTIALS, 'rAFEL SLOPES, Al'JD ELECTROLYTE pH's
FOR THE REDUCTION OF Bro; ON Hg AT 25°C
Electrolyte Initial pH Rest Potential Tafel Slope
gmol·liter -1 volts(SHE) volts
0.1 KBr0 3 7.1 0.370 0.125
0.05 KBr03-l.O KOH 13.2 0.046 0.100
0.1 KBr0 3-1.0 KOH 13.2 0.048 0.110
0.2 KBro 3-l.O KOH 13.2 0.048 0.110
0.2 KBr0 3-0.l KOH 12.2 0.084 0.120
0.1 KBr0 3-0.l KBr 13.1 0. 0 35 0.110
-1.0 KOH
13
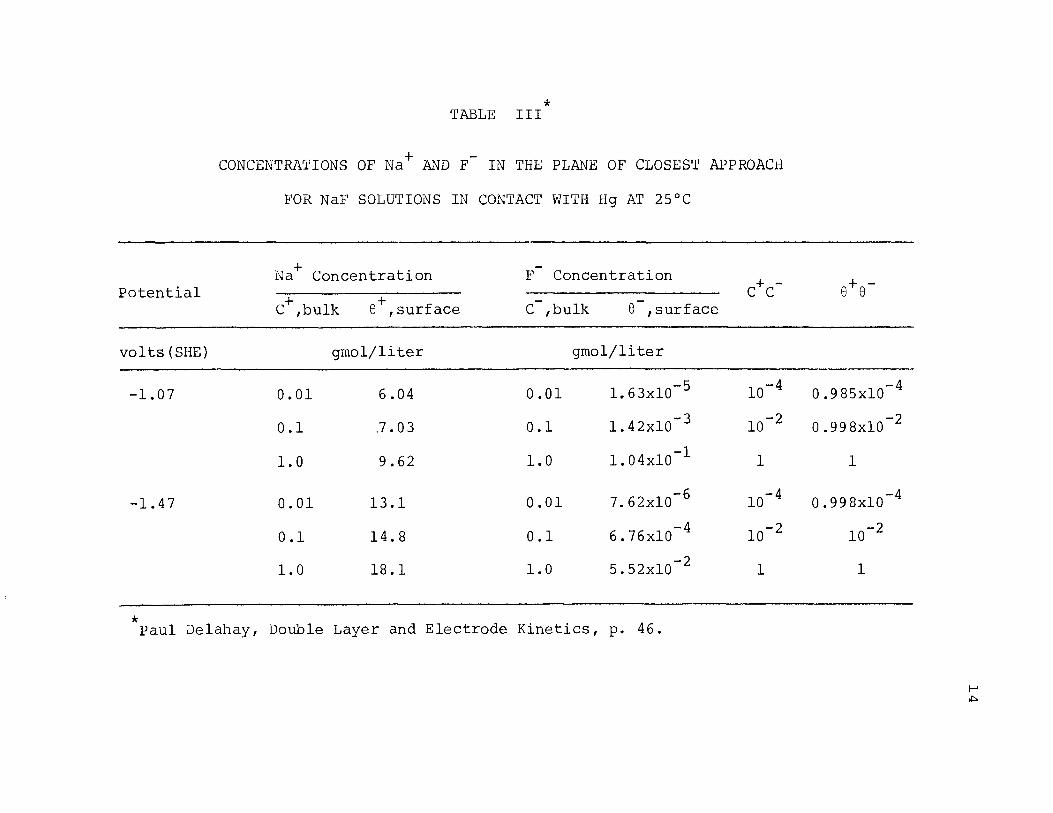
* TABLE III
CONCENTRA'l,IONS OF Na + Ai.1'D F- IN THE PLANE OF CLOSEST APPROACH
FOR NaF SOLUTIONS IN CONTACT WITH Hg AT 25°C
Na+ Concentration F Concentration c+c-
c+,bulk + e ,surface c-,bulk e-,surface Potential
volts(SHE) gmol/liter gmol/liter
-1.07 0.01 6.04 0.01 1. 63xl0-S lo- 4
0.1 .7. 0 3 0.1 1. 4 2xl0 -3 10-2
1.0 9.62 1.0 1. 04xl0 -1 1
-1.47 0.01 13.1 0.01 7.62xl0 -6 10- 4
0.1 14.8 0.1 6.76xl0 -4 lo- 2
1.0 18.1 1.0 5.52xl0 -2 1
* Paul Delahay, Double Layer and Electrode Kinetics, p. 46.
e+e-
0.985x10
0.998x10
1
0.998xl0
10-2
1
-4
-2
-4
f-' ~

CAPTIONS FOR FIGURES
l. Polarization curves for the reduction of Bro 3 on Hg
at 25°C.
2. + Effect of K and Br0 3 concentrations on the reduction
of Bra; on Hg at -1.37 V(SHE) at 25°C.
15
iCil ::c: (J)
Ul +J r-i 0 :>
r-i rU .,., +J ~ (]) +J 0 P-1
0 0.2 M KBro 3-l.O .H KOH -0.95
6 0.2 H KBro 3-l.O H KOH
(Galvanostatic)
0 0.1 r.1 KBro3-o .1
-1.0 M IZOH
-1.05 \1 0.1 ~-1 KBr0 3-1.0 M KOH
• 0.05 M KBr0 3-1.0 M KOH
A 0.2 M KBr0 3-0.l
0.1 M KBr0 3
-1.15
-1.25
-1.35
-1.45
-1.55L-----------~-------------L----------~
-4 -3 -2
-2 log i, amp-em
Fig. 1
-1
16
N I
E: u
-2
O CBrO'] (CK+
.6.cK+cBrO]
-2 -1
-1 log C, gmol·liter
Fig. 2
17
0

18
APPENDICES
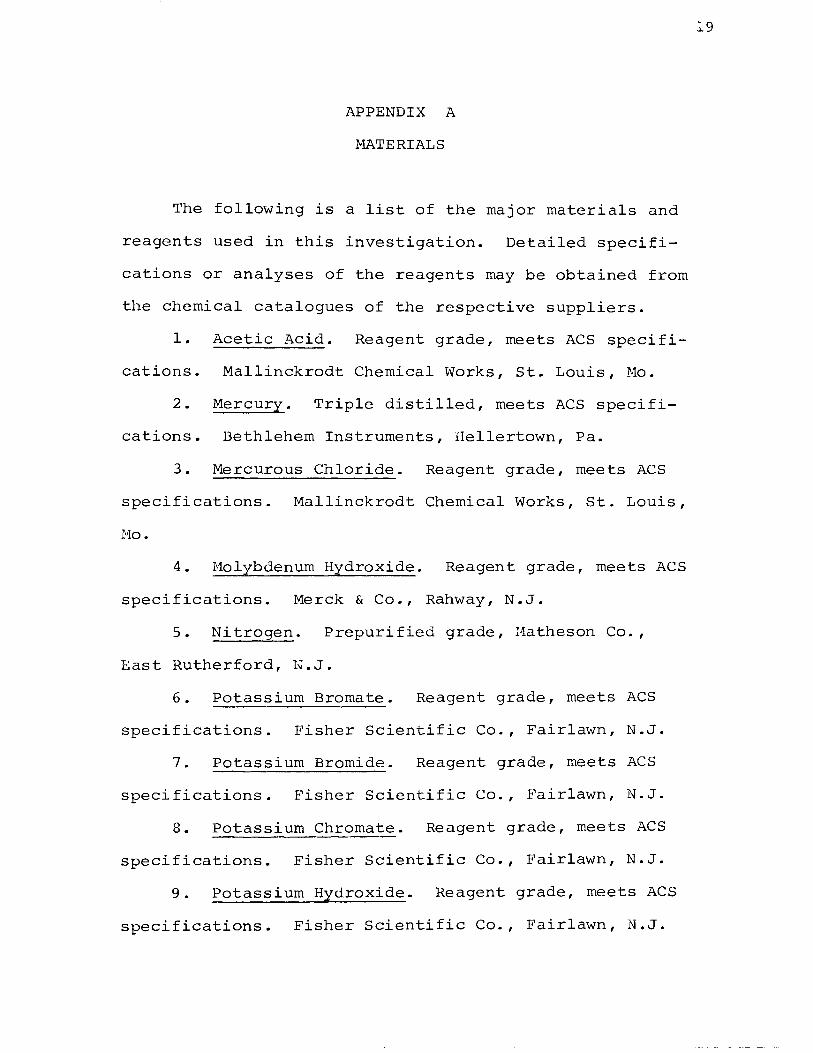
APPENDIX A
MATERIALS
The following is a list of the major materials and
reagents used in this investigation. Detailed specifi-
cations or analyses of the reagents may be obtained from
the chemical catalogues of the respective suppliers.
1. Acetic Acid. Reagent grade, meets ACS specifi-
cations. Mallinckrodt Chemical ~vorks, St. Louis, Mo.
2. Mercury. Triple distilled, meets ACS specifi-
cations. Bethlehem Instruments, Hellertown, Pa.
3. Mercurous Chloride. Reagent grade, meets ACS
specifications.
1'10.
Mallinckrodt Chemical Works, St. Louis,
4. Molybdenum Hydroxide. Reagent grade, meets ACS
specifications. Merck & Co., Rahway, N.J.
5. Nitrogen. Prepurified grade, Matheson Co.,
East Rutherford, N.J.
6. Potassium Bromate. Reagent grade, meets ACS
specifications. Fisher Scientific Co., Fairlawn, N.J.
7. Potassium Bromide. Reagent grade, meets ACS
specifications. Fisher Scientific Co., Fairlawn, N.J.
8. Potassium Chromate. Reagent grade, meets ACS
specifications. Fisher Scientific Co., Fairlawn, N.J.
9. Potassium Hydroxide. Reagent grade, meets ACS
specifications. Fisher Scientific Co., Fairlawn, N.J.
19
20
10. Potassium Permanganate. Reagent grade, meets
ACS specifications. Fisher Scientific Co., Fairlawn, N.J.
11. Silver Nitrate. Reagent grade, meets ACS
specifications. Fisher Scientific Co., Fairlawn, N.J.
12. Sodium Hydroxide. Reagent grade, meets ACS
specifications. Fisher Scientific Co., Fairlawn, N.J.
13. Sodium Thiosulfate. Reagent grade, meets ACS
specifications.
14. Starch.
Fisher Scientific Co., Fairlawn, N.J.
Ordinary Corn Starch.
APPENDIX B
EQUIPl"iENT
The following is a list of the principal equipment
components used in this investigation.
l. Milliammeter. Model 931, Ser. No. 1697,
Weston Electric Instruments Corp., Newark, N.J.
2. Power Supply. Model Sorensen QRB 40-.75, Ser.
No. 775, Raytheon Company, South Norwalk, Conn.
3. Recorder. Type V0!-1-5, Bausch & Lomb Co. , Inc. ,
Dover, N.H.
4. Current Regulator. Materials Research Center,
University of Missouri, Rolla, Mo.
5. Potentiostat. Wenking 66 TS l, Gerhard Bank
Elektronic Gottingen, West Germany.
6. Electrometer. Model 610 C, Ser. No. 63779,
Keithley Instruments Inc., Cleveland, Ohio.
7. Torsion Balance. Style RX-1, Ser. No. 16680 &
16687, The Torsion Balance Co., New York.
8. Semi-micro Balance. Type 26 04, Ser. No.
121211, Sartorius Werks AG., Gottingen, West Germany.
9. Micro-burette. Shelback, 10 ml, 0.05 ml
graduations, Fisher Scientific Co., Pittsburgh, Pa.
10. pH Meter. Model 19, Ser. No. 1596, Fisher
Scientific Co., Pittsburgh, Pa.
21
22
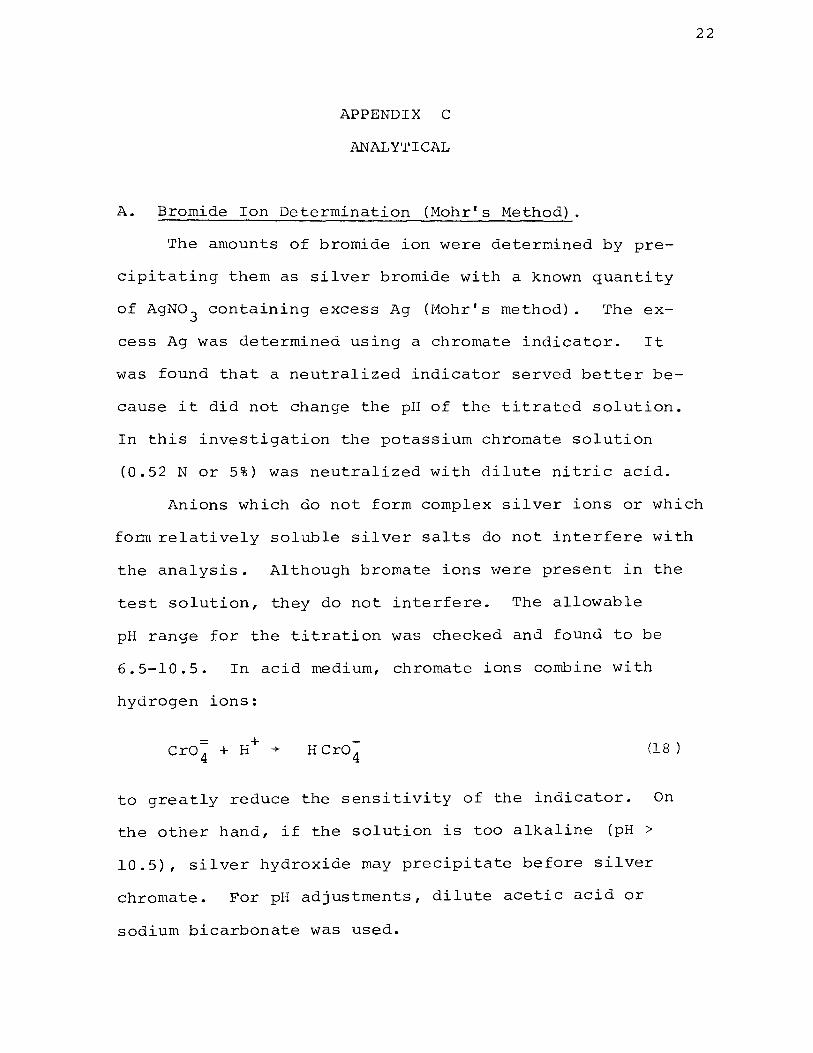
APPENDIX C
ANALY'riCAL
A. Bromide Ion Determination (Mohr's Method).
The amounts of bromide ion were determined by pre-
cipitating them as silver bromide with a known quantity
of AgN0 3 containing excess Ag (I'1ohr's method). The ex-
cess Ag was determined using a chromate indicator. It
was found that a neutralized indicator served better be-
cause it did not change the pH of the titrated solution.
In this investigation the potassium chromate solution
(0.52 N or 5%) was neutralized with dilute nitric acid.
Anions which do not form complex silver ions or which
form relatively soluble silver salts do not interfere with
the analysis. Although bromate ions were present in the
test solution, they do not interfere. The allowable
pH range for the titration was checked and found to be
6.5-10.5. In acid medium, chromate ions combine with
hydrogen ions:
= + Cro 4 + H -+ HCro4 (18 )
to greatly reduce the sensitivity of the indicator. On
the other hand, if the solution is too alkaline (pH >
10.5), silver hydroxide may precipitate before silver
chromate. For pH adjustments, dilute acetic acid or
sodium bicarbonate was used.
1. Preparation of 0.1 N silver nitrate standard
solution. Dry analytical-reagent grade silver nitrate
at 120°C for two hours and then cool in a dessicator.
Weight out 16.978 gm of the dried silver nitrate and
dissolve in distilled water, dilute to 1 liter.
2. Titration of bromide with standard silver
nitrate solution.
Step 1. Transfer the reacted electrolyte into a
beaker. Rinse the cell twice with distilled water and
collect in the same beaker.
Step 2. Measure the pH of the solution in the
beaker, and if not in the range of 6.5-10.5, adjust to
this value with sodium bicarbonate or dilute acetic acid.
Step 3. The volume of the solution from Step 2 was
measured and 60 rnl withdrawn as a sample for the titra
tion.
23
Step 4. Add one ml of neutralized potassium chromate
indicator to the sample.
Step 5. Titrate the solution from Step 4 with 0.1
N AgN03
with constant swirling until the first permanent
reddish-brown color is reached.
Step 6. Repeat titration (Steps 3-5) three times.
Step 7. Carry out blank titration with unreacted
electrolyte as in Steps 2-6 for the reacted solutions.
This difference is the amount of AgN0 3 used for the pre
cipitation of bromide ions.
A flow chart of the bromide ion determination is
shown in Table IV.
3. Sample calculations. Consider a 0.1 1'1 KBro3
electrolyte that has undergone reduction for which the
following were obtained:
Total volume of the reacted solution = 300 ml
Volume of sample = 60 ml
24
Volume of AgN0 3 used for the titration = 7.02 ml
Volume of AgN0 3 used for the blank titration= 0.10 ml
Net amount of AgN03
used= 6.92 ml
From the equation W = V N E, we know that the titer
value is:
1 ml AgN03
= 7.9916 mg Br-
Therefore, for this sample there are
( 6 • 9 2) ( 7 • 9 916) = 55 • 4 mg Br
The total amount of bromide produced is
( 5 5 • 4 I 1 o o o ) ( 3 o o 1 6 o ) = o • 2 7 7 gm
B. Bromate Ion Determination (Iodometric Method).
Iodide exerts a reducing action upon strongly
oxidizing systems with the formation of an equivalent
amount of iodine. Therefore, when iodide is added in
excess to a solution containing bromate, iodine is
liberated according to the equation:
( 19)
25
TABLE IV
FLOW CHART FOR THE DETERHINATION OF Br
Electrolyte: 0.1 M KBro 3-n M KOH 1 n = 0 1 0.05 1 0.1 1 0.2
K+ 1 Bro3 1 OH
~ electrochemical reactions
cathodic compartment
Bro; + 3 H20 + 6 e ~ Br + 6 OH
species: K+ 1 Br031
Br 1 OH
anodic compartment
. K+l spec1es: Bro3
1 OH
+ or H
take sample
titrate against standard AgN0 3 solution
Ag+ + Br AgBr~ yellow
indicator: 5% (0.52 N) neutralized K2cro 4
end point: color change of ppt.
yellow brown-reddish
2 Ag+ + Cr04 ~ brown-reddish
The iodine liberated can be titrated against standard
sodium thiosulfate solution and the bromate ion concen
tration is determined from the volume of Na2s
2o
3 solution
used,
( 20)
26
The starch used as the indicator should not be added until
the yellow color due to the iodine has become very pale.
The end point is taken as the sharp color change from
blue to colorless. A blank titration is unnecessary.
1. Preparation of 0.1 N sodium thiosulfate solution.
Dissolve 15 gm of anhydrous sodium thiosulfate or
25 gm of sodium thiosulfate pentahydrate in conductivity
water and dilute to 1 liter. This solution is titrated
against the standard potassium bromate solution men
tioned below.
2. Standardization of sodium thiosulfate with
potassium bromate.
Step 1. To 10 ml of standard bromate solution, add
2 gm of potassium iodide and 10 ml of 1 N sulfuric acid.
Step 2. Titrate the solution from Step 1 with
sodium thiosulfate standard solution prepared in part 1.
When the color of the liquid has become pale yellow, add
a few drops of starch solution and continue the titration
until the color changes from blue to colorless.
27
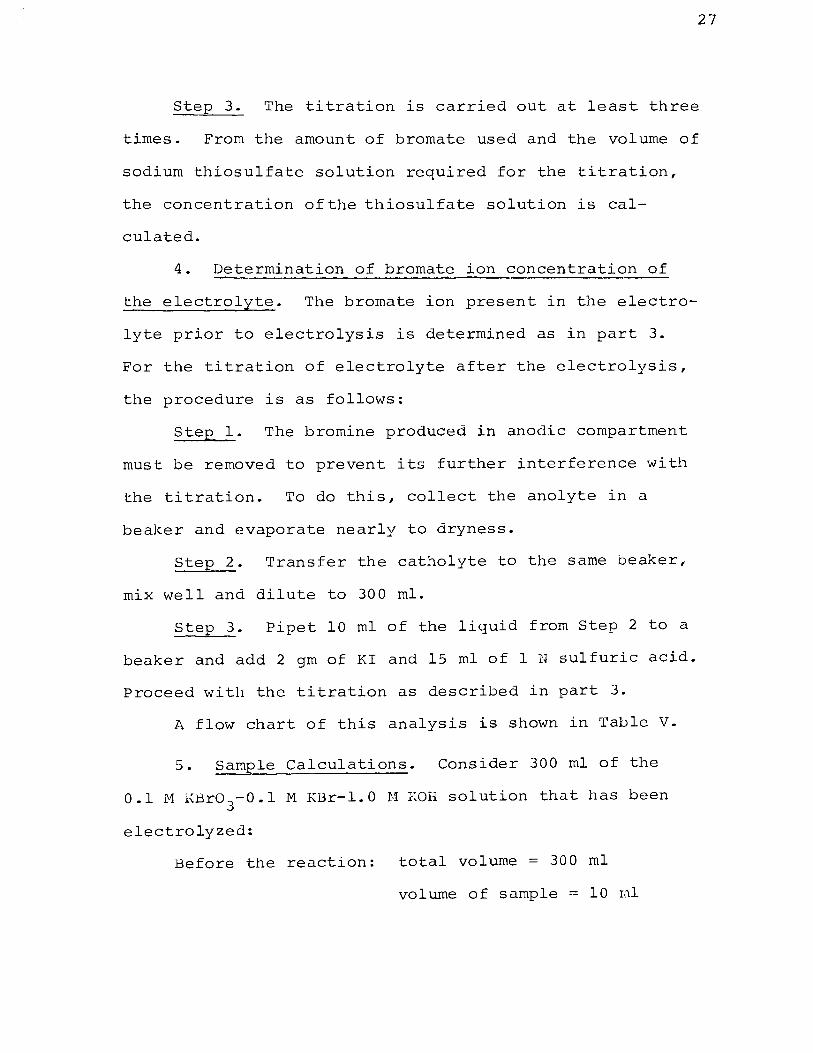
Step 3. The titration is carried out at least three
times. From the amount of bromate used and the volume of
sodium thiosulfate solution required for the titration,
the concentration ofthe thiosulfate solution is cal
culated.
4. Determination of bromate ion concentration of
the electrolyte. The bromate ion present in the electro
lyte prior to electrolysis is determined as in part 3.
For the titration of electrolyte after the electrolysis,
the procedure is as follows:
SteE 1. The bromine produced in anodic compartment
must be removed to prevent its further interference with
the titration. To do this, collect the anolyte in a
beaker and evaporate nearly to dryness.
Step 2. Transfer the catholyte to the same beaker,
mix well and dilute to 300 ml.
Step 3. Pipet 10 ml of the liquid from Step 2 to a
beaker and add 2 gm of KI and 15 ml of 1 N sulfuric acid.
Proceed with the titration as described in part 3.
A flow chart of this analysis is shown in TaLle V.
5. Sample Calculations. Consider 300 ml of the
0.1 M KBro3-o.l M KBr-1.0 M KOH solution that has been
electrolyzed:
Before the reaction: total volume = 300 ml
volwne of sample = 10 ml
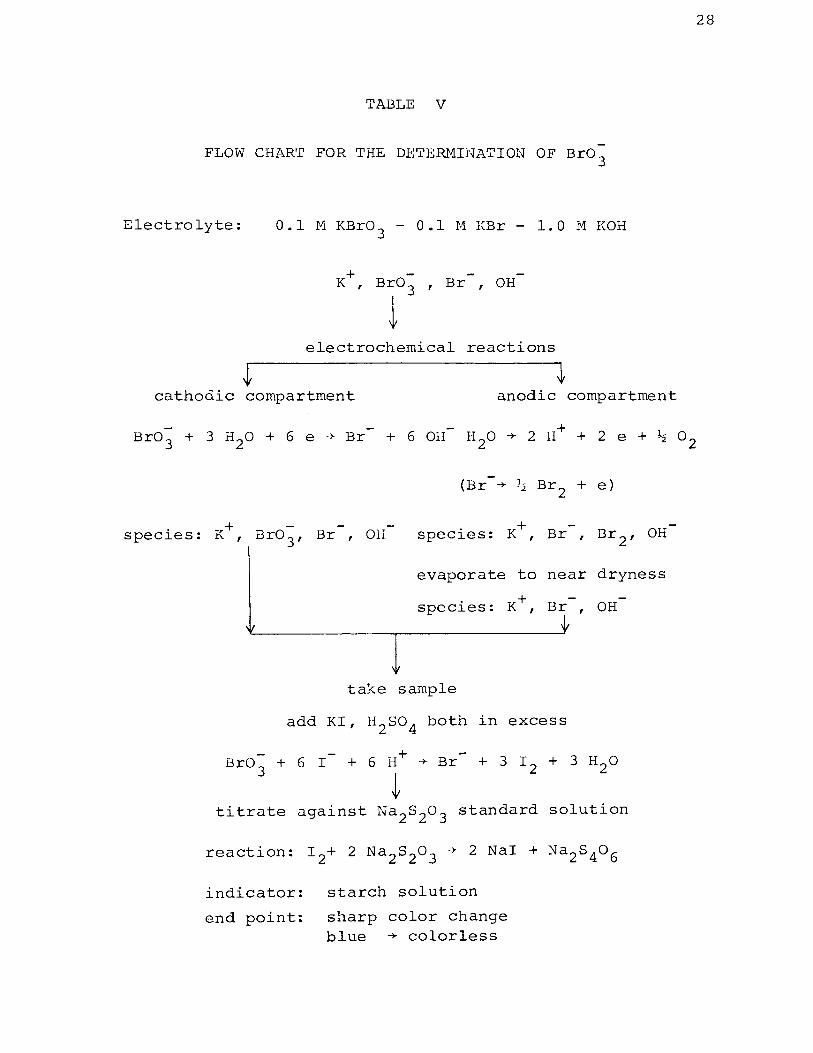
TABLE V
-FLOW CHAR'l' FOR THE DETERMINATION OF BrO
3
Electrolyte: 0.1 M KBr0 3 - 0.1 M KBr- 1.0 M KOH
Br 1 OH
electrochemical reactions
cathodic compartment anodic compartment
species:
-(Br L e) -+ -2. Br 2 +
K+ - species: K+l -I Br0 31 Br I OH Br I Br 21 OH
evaporate to near dryness
K+l -species: Br I OH
take sample
add KI 1 H2so4 both in excess
Bro3
+ 6 I + 6 H+ -+ Br + 3 I2
+ 3 H20
~ titrate against Na 2s 2o3 standard solution
indicator: starch solution
end point: sharp color change blue -+ colorless
28
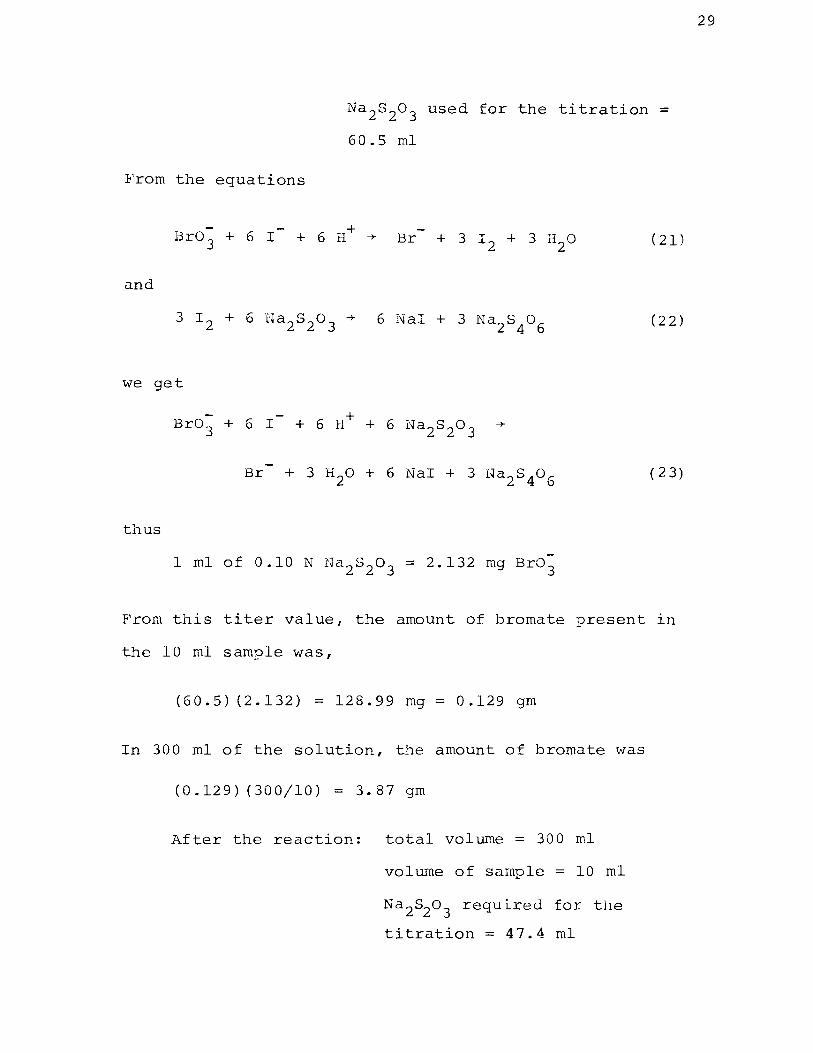
Na 2s 2o3 used for the titration =
60.5 ml
Prom the equations
Br03
+ 6 I + + 6 H -+ ( 21)
and
( 2 2)
we get
-+
( 2 3)
thus
From this titer value, the amount of bromate present in
the 10 ml sample was,
( 6 0 . 5 ) ( 2 • 1 3 2 ) = 12 8 • 9 9 mg = 0 . 12 9 grn
In 300 ml of the solution, the amount of bromate was
( 0 • 12 9 ) ( 3 0 0 I 1 0 ) = 3 • 8 7 gm
After the reaction: total volume = 300 ml
volume of sample = 10 ml
Na 2s2o3 required for the
titration= 47.4 ml
29

30
From the titer value, the amount of bromate present was
( 4 7 • 4 ) ( 2 • 13 2 I 1 o o o ) ( 3 o o 1 1 o ) = 3 • o 3 2 gm
31
APPENDIX D
EXPERI~lliNTAL DATA
Tables VI - VII Efficiency Studies Data
Tables VIII - XV Polarization Studies Data
Tables XVI - XVII Activation Energy Studies Data
Abbreviations used 1n tables:
Wt Theoretical weight of bromide produced, gm
W Experimental weight of bromide produced, gm e
Mt Theoretical weight of bromate reacted, gm
M1 Weight of bromate before the electrolysis, gm
M2
Weight of bromate after the electrolysis, gm
r1 Experimental weight of bromate reacted, gm e
I Current, amp
1 Current density, amp•cm -2
32
'l1 ABLE VI
DATE FOR THE EFFICIENCIES OF Bro 3 REDUCTION ON Hg AT 25°C
X 10 3 Polarization
wt Electrolyte i time
grnols·liter amp-em
0.1 KBr0 3 12.2
24.4
36.6
48.8
0.05 KBr03 24.4
-1.0 KOH
0.1 KBr0 3 24.4
-1.0 KOH 7.32
0.2 KBr03
24.4
-1.0 KOH 73.2
0.2 KBr0 3 24.4
-1.0 KOH
cathode area= 0.82
-2 hours
82.2
28.4
20.0
21.8
34.0
40.0
95.5-114.5
2 ern
34.4
12.0
41.0
gm
0.4087
0.2820
0.2985
0.4330
0.3385
0.3975
0.285-0.340
0.3420
0.3580
0.4080
w e Efficiency
gm percent
0.3844 94
0.2770 98
0.2975 99
0.4095 95
0.3370 99
0.4050 102
0.3015 106-89
0.3400 99
0.3408 96
0.4000 98
Electrolyte
gmols·liter
0.05 KBro 3 -1.0 KOH
0.1 KBr0 3
-0.1 KBr
-l. 0 KOH
TABLE VII
DATA FOR THE EFFICIENCIES OF Bro 3 REDUCTION ON Hg AT 25°C
(Bro; AS A BASIS OF EFFICIENCY DETERMINATIONS)
i X 10 3 Polarization Iv1 Ml M2 M time t e
-2 amp·cm hours gm gm gm gm
24.4 68.5 l. 088 l. 970 0.927 l. 043
73.2 20.0 0.955 l. 970 1. 074 0.860
7.32 147.0 0.702 3.870 3.268 0.602
24.4 67.0 1. 067 3.870 2.910 0.960
73.2 21.0 l. 003 3.870 3.032 0.837
Cathode area= 0.82 2 em
Efficiency
percent
96
94
86
90
84
w w
TABLE VIII
THE CURRENT-POTEN'l'IAL RELA'TIONSHIP FOR THE REDUCTION OF
Br0 3 ON Hg IN 0.1 M KBr0 3 AT 25°C
v v I m X 10 3 i X 10 3
vo1ts(NCE) vo1ts(SHE) -2 amp amp·cm
1.300 -1.018 0.040 0.049
1.400 -1.118 0.050 0.061
1.475 -1.193 0.104 0.137
1.500 -1.218 0.180 0.220
1.525 -1.243 0.310 0.378
1.550 -1.268 0.510 0.622
1.580 -1.298 0.940 1.147
1.620 -1.338 1.900 2.320
1.650 -1. 36 8 3.400 4.150
1.700 -1.418 9.200 11.220
1.725 -1.443 15.000 18.300
1.750 -1.468 22.600 27.570
1.775 -1.493 35.000 42.700
1.800 -1.513 49.000 59. 7 80
1.825 -1.543 68.000 82.960
34
TABLE IX
THE CURRENT-POTENTIAL RELATIONSHIP FOR THE REDUCTION OF
Bro; ON Hg IN 0.05 M KBr0 3-1.0 M KOH AT 25°C
v v I X 10 3 i X 10 3 m
vo1ts(NCE) vo1ts(SHE) -2 amp amp· em
1.100 -0.818 0.105 0 .12 8
1.250 -0.968 0.111 0.135
1.350 -1.068 0.130 0.159
1.400 -1.118 0.243 0.296
1.425 -1.143 0.35 0.427
1.450 -1.168 0.51 0.622
1.475 -1.193 0.76 0.927
1.500 -1.218 1.25 1.525
1.525 -1.243 2.00 2.440
1.550 -1.268 2.90 3.540
1.575 -1. 29 3 8.35 10.187
1.600 -1.318 13.7 16.714
1.625 -1.343 21.2 25.864
1.650 -1.368 32.0 39.04
1.675 -1.393 44.5 54.30
1.700 -1.418 62.0 75.64
35
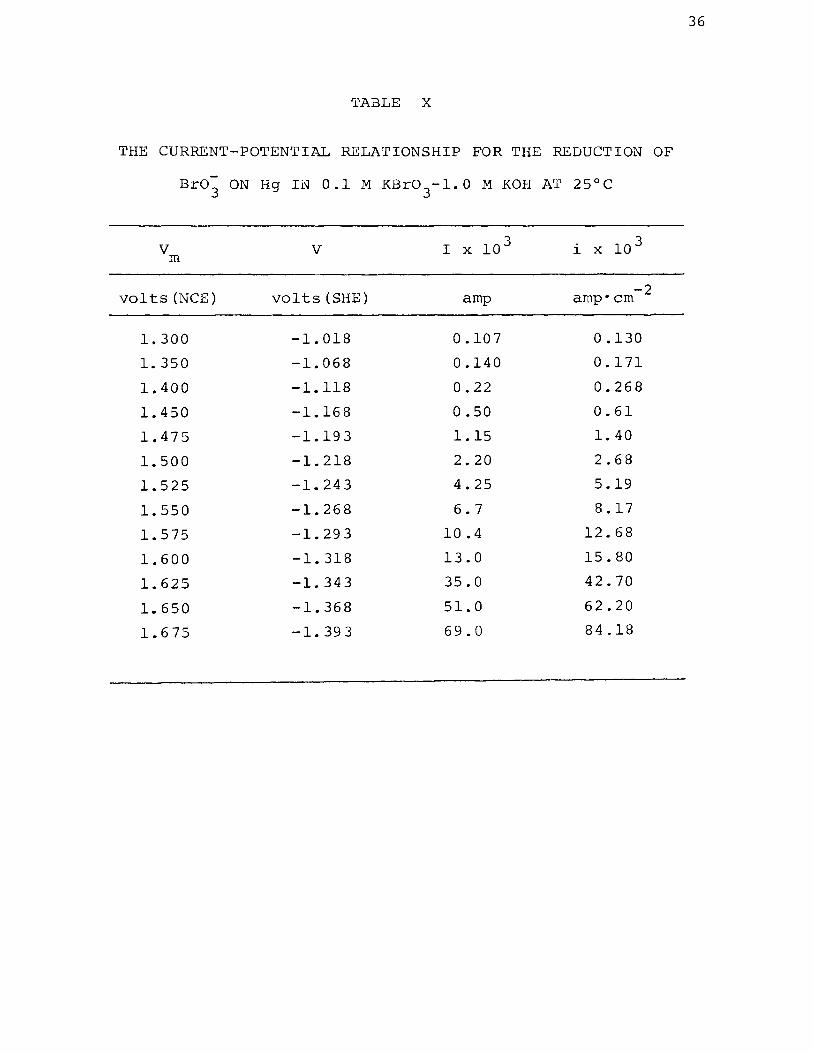
TABLE X
THE CURRENT-POTEN'riAL RELA'riONSHIP FOR THE REDUCTION OF
Bro; ON Hg IN 0.1 M KBro3-1.0 M KOH AT 25°C
v m
vo1ts(NCE)
l. 300
l. 350
1.400
1.450
1.475
1.500
1.525
1.550
1.575
1.600
1.625
1.650
1. 6 75
v
vo1ts(SHE)
-1.018
-1.068
-1.118
-1.168
-1.193
-1.218
-1.243
-1.268
-1.293
-1.318
-1.343
-1.368
-1. 39 3
amp
0.107
0.140
0.22
0.50
1.15
2.20
4.25
6. 7
10.4
13.0
35.0
51.0
69.0
-2 amp· em
0.130
0.171
0.268
0.61
1.40
2.68
5.19
8.17
12.68
15.80
42.70
62.20
84.18
36
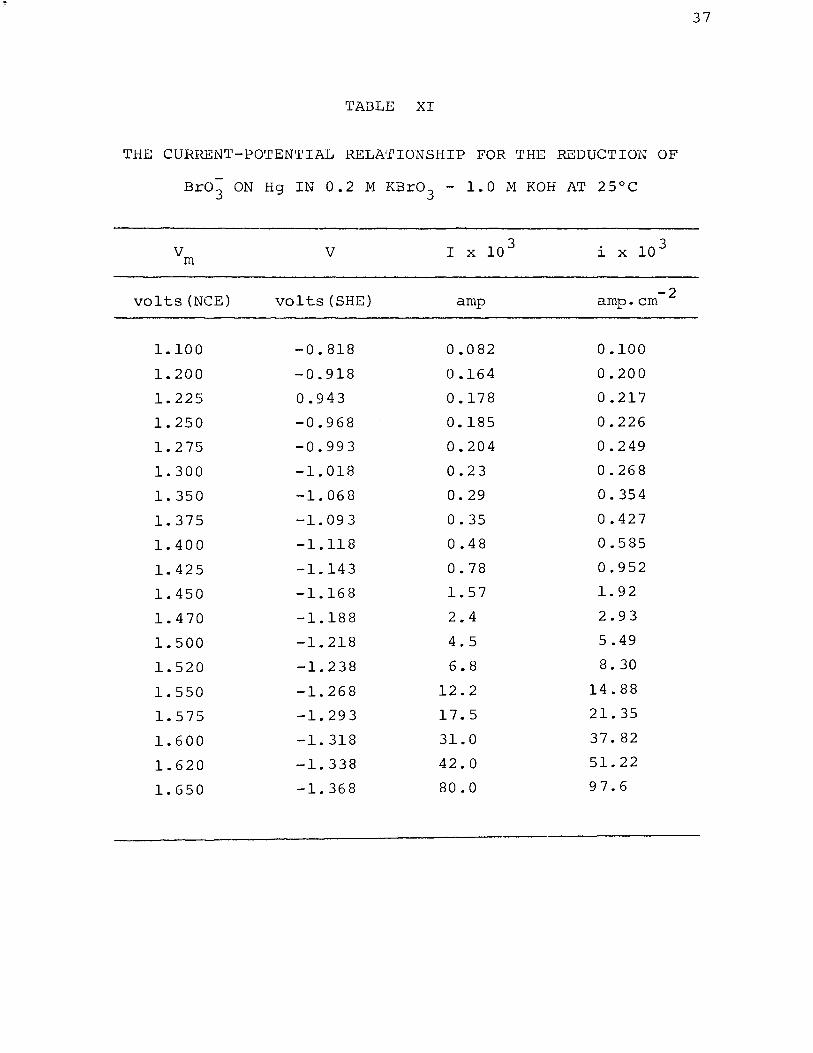
TABLE XI
THE CURRENT-POTENTIAL RELATIONSHIP FOR THE REDUCTION OF
Br03 ON Hg IN 0.2 M KBro 3 - 1.0 M KOH AT 25°C
vo1ts(NCE)
1.100
1.200
1.225
1.250
1.275
1.300
1.350
1.375
1.400
1.425
1.450
1.470
1.500
1.520
1.550
1.575
1.600
1.620
1.650
v
vo1ts(SHE)
-0.818
-0.918
0.943
-0.968
-0.993
-1.018
-1.068
-1.093
-1.118
-1.143
-1.168
-1.188
-1.218
-1.238
-1.268
-1.293
-1.318
-1.338
-1.368
amp
0.082
0.164
0.178
0.185
0.204
0.23
0.29
0.35
0.48
0.78
1.57
2.4
4.5
6.8
12.2
17.5
31.0
42.0
80.0
i X 10 3
-2 amp. em
0.100
0.200
0.217
0.226
0.249
0.268
0. 354
0.427
0.585
0.952
1.92
2. 9 3
5.49
8. 30
14.88
21.35
37.82
51.22
97.6
37
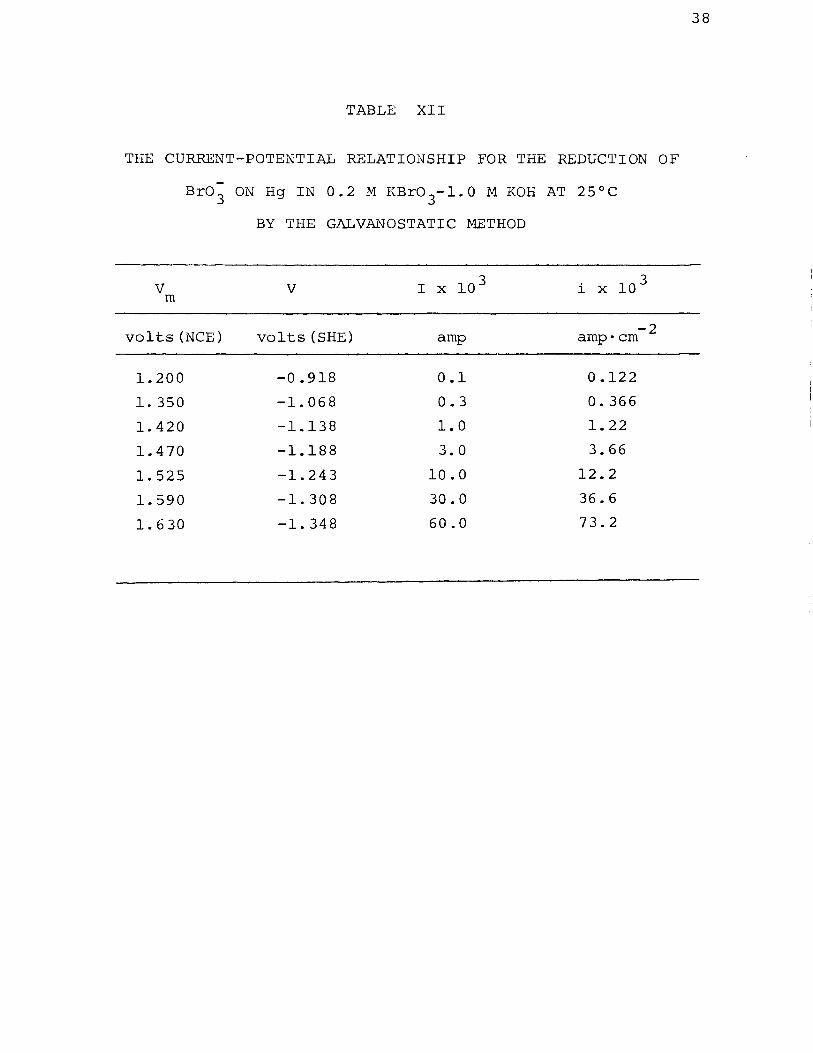
TABLE XII
THE CURRENT-POTENTIAL RELATIONSHIP FOR THE REDUCTION OF
v rn
Br0 3 ON Hg IN 0.2 M KBr0 3-1.0 M KOH AT 25°C
BY THE GALVfu~OSTATIC METHOD
v I X 10 3 i X 10 3
vo1ts(NCE) vo1ts(SHE) -2 amp amp· em
1.200 -0.918 0.1 0.122
1.350 -1.068 0.3 0. 366
1.420 -1.138 1.0 1.22
1.470 -1.188 3.0 3.66
1.525 -1.243 10.0 12.2
1.590 -1.308 30.0 36.6
1. 6 30 -1.348 60.0 73.2
38
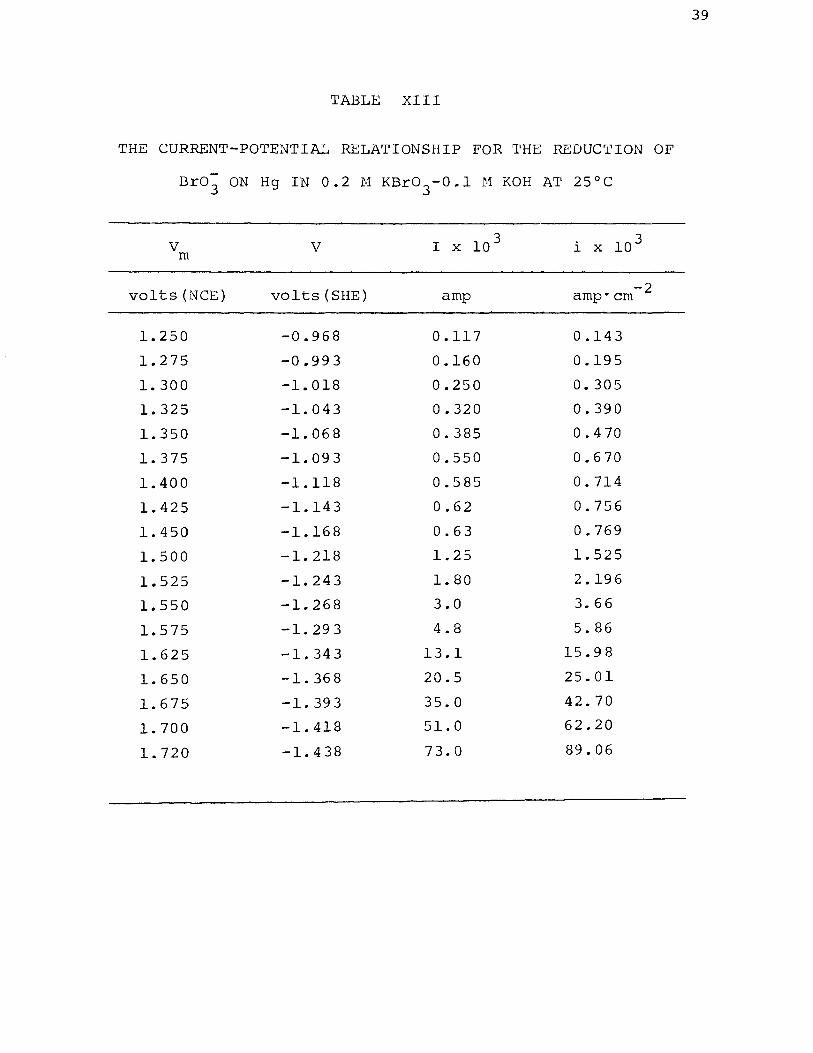
TABLE XIII
THE CURRENT-POTENTIAL RELATIONSHIP FOR THE REDUCTION OF
Bra; ON Hg IN 0.2 M KBr0 3-0.1 M KOH AT 25°C
v m
vo1ts(NCE)
1.250
1.275
1.300
1.325
1.350
1.375
1.400
1.425
1.450
l. 500
1.525
1.550
1.575
1.625
1.650
1.675
1.700
1.720
v
vo1ts(SHE)
-0.968
-0.993
-1.018
-1.043
-1.068
-1.093
-1.118
-1.143
-1.168
-1.218
-1.243
-1.268
-1.293
-1.343
-1. 36 8
-1.393
-1.418
-1.438
I X 10 3
amp
0.117
0.160
0.250
0.320
0.385
0.550
0.585
0.62
0.63
1.25
1.80
3.0
4.8
13.1
20.5
35.0
51.0
73.0
-2 amp· em
0.143
0.195
0.305
0.390
0. 4 70
0. 6 70
0.714
0.756
0.769
1.525
2.196
3.66
5.86
15.9 8
25.01
42.70
62.20
89.06
39
TABLE XIV
THE CURRENT-POTENTIAL RELATIONSHIP FOR THE REDUCTION OF
Br0 3 ON Hg IN 0.1 M KBr0 3-0.1 M KBr-1.0 M KOH
AT 25°C (RUN 1)
v m v I X 10 3 i X 10 3
vo1ts(NCE) vo1ts(SHE) -2 amp amp· em
1.150 -0.868 0.082 0.100
1.250 -0.968 0.142 0.173
1.350 -1.068 0.193 0.235
1.375 -1.09 3 0.27 0.329
1.400 -1. 118 0.35 0.427
1.425 -1.143 0.50 0.610
1.450 -1. 168 0.80 0.976
1.475 -1.19 3 1.40 1.708
1.500 -1.218 2.40 2.928
1. 525 -1.243 5.98 7.33
1.550 -1.268 9.50 11.59
1.575 -1.293 15.2 18.54
1.600 -1.318 24.5 29.89
1.625 -1. 34 3 39.0 47.58
1.650 -1. 368 57.0 69.54
1.675 -1.393 83.0 101.26
40
TABLE XV
THE CURRENT-POTENTIAL RELN.l'IONSHIP FOR TliE REDUCTION OF
Br03 ON Hg IN 0.1 M KBr0 3-0.1 M KBr-1.0 M KOH AT 25°C
( RU1'1 2)
v v I X 10 3 i X 10 3 m
vo1ts(NCE) vo1ts(SHE) -2 amp amp-em
l. 250 -0.968 0.071 0.086
1.300 -1.018 0.130 0.158
1.350 -1.068 0.185 0.226
1.400 -1.118 0.36 0.439
l. 450 -1.168 1.02 1.24
1.475 -1. 19 3 2.00 2.44
l. 500 -1.218 3.4 3. 9 3
l. 550 -1.268 9.8 11.90
1.600 -1.318 23.0 28.06
1.625 -1.343 36.5 44.53
1.650 -1.368 51.0 62.2
1.675 -1. 39 3 72.0 87.8
41
1'ABLE XVI
THE CURRENT-TEMPERATURE RELATIONSHIP FOR THE REDUCTION OF
Br0 3 ON Hg IN 0.1 I1 KBr0 3-1.0 I-1 KOH
(A) V=-1.20 volts (SHE)
r.remperature I X 10 3 i X 10 3
oc amp amp·cm -2
25 2.8 3.42
30 2.8 3.42
35 2.7 3.3
40 2.8 3.42
45 2.8 3.42
(B) v = -1.30 volts (SHE)
Temperature I X 10 3 i X 10 3
oc amp amp•cm-2
20 15.0 18.3
25 15.0 18.3
30 16.3 19.8
35 16.4 20.0
40 16.4 20.0
45 16.5 20.1
42
':i.'ABLE XVII
THE CURRENT-TEMPERA'l,URE RELA'l'IONSIHP FOR THE REDUC'riON OF
Bro; ON Hg IN 0.1 M KBro 3-0.l M KBr-1.0 M KOH
(A) v = -1.20 volts (SHE)
Temperature I X 10 3 i X 10 3
oc amp amp·cm -2
20 3.1 3.78
25 3.3 4.03
30 3.4 4.15
35 3.6 4.38
40 3.8 4.63
(B) v = -1.30 volts (SHE)
Temperature I X 10 3 1. X 10 3
oc amp amp· cm-2
20 22 26.8
25 22.2 27.1
30 22.4 27.3
35 22.8 27.8
40 22.9 28
45 23 28.1
43
VITA
Jaw-Shin Chang was born on November 21, 1944, in
Chiayi, Taiwan.
June, 1962.
He graduated from I-Lan High School in
He entered Cheng Kung University in September, 1962,
and graduated in June, 1966, with a B.S. degree in Chemi-
cal Engineering. After graduation, he served in the
Chinese Army for one year of military service as a Second
Lieutenant. He joined the Asia Cement Corporation in
Taipei from August, 1967, to July, 1968.
He came to the United States and enrolled in the
Graduate School of the University of Missouri-Rolla in
September, 1968.
44