the causal impact of socio-emotional skills training on ... · the predictive power of...
TRANSCRIPT
Working Paper No. 343
The Causal Impact of Socio-Emotional Skills Training on Educational Success
Giuseppe Sorrenti, Ulf Zölitz, Denis Ribeaud and Manuel Eisner
March 2020
University of Zurich
Department of Economics
Working Paper Series
ISSN 1664-7041 (print) ISSN 1664-705X (online)

The Causal Impact of Socio-Emotional Skills Training
on Educational Success*
Giuseppe Sorrenti ⓡ Ulf Zölitz (University of Amsterdam) (University of Zurich)
Denis Ribeaud Manuel Eisner (University of Zurich) (University of Cambridge)
Abstract
We study the long-term effects of a randomized intervention targeting children’s
socio-emotional skills. The classroom-based intervention for primary school
children has positive impacts that persist for over a decade. Treated children
become more likely to complete academic high school and enroll in university.
Two mechanisms drive these results. Treated children show fewer ADHD
symptoms: they are less impulsive and less disruptive. They also attain higher
grades, but they do not score higher on standardized tests. The long-term effects
on educational attainment thus appear to be driven by changes in socio-
emotional skills rather than cognitive skills.
Keywords: Socio-emotional skills, randomized intervention, child
development, school tracking
JEL classification: C93, I21, I24, I26, J24
* We thank Caroline Chuard, Jan Feld, Mark T. Greenberg, Jonathan Guryan, Rahel Jünger, Nicolás Salamanca, Ursina
Schaede as well as seminar participants at the NBER children’s program meeting, the University College London, the
University of Zurich, Royal Holloway-University of London, the University of Konstanz, VATT, the CESifo lunch
seminar, the Ski and Labor Seminar, the z-proso Workshop and the briq Workshop on Skills, Preferences and
Educational Inequality for helpful discussions and comments. Maximilian Mähr and Jeffrey Yusof provided
outstanding research assistance. We gratefully acknowledge financial support from the Jacobs Foundation.
Manuel Eisner: University of Cambridge, Institute of Criminology, [email protected]. Denis Ribeaud:
University of Zurich, Jacobs Center for Productive Youth Development, [email protected].
Giuseppe Sorrenti: University of Amsterdam, Amsterdam School of Economics, [email protected]. Ulf Zölitz:
University of Zurich, Department of Economics and Jacobs Center for Productive Youth Development, IZA, CESifo,
CEPR, [email protected]. The author order of Sorrenti and Zölitz has been randomized following Debraj ⓡ
Robson (2018).

1
1. Introduction
Socio-emotional skills matter. Economists, psychologists, and sociologists agree that socio-
emotional skills are predictive of major life outcomes like educational attainment, employment,
earnings, health, and participation in crime (Barrick and Mount 1991; Heckman and Rubinstein
2001; Noftle et al. 2007; Roberts et al. 2007; Vazsonyi et al. 2007; Almlund et al. 2011). While
the predictive power of socio-emotional skills has been established, there is a heated debate about
how malleable these skills are. If these skills are indeed malleable, interventions targeting
children’s socio-emotional skills may change the trajectory of a life and lead to lasting changes in
educational attainment and labor market outcomes.
In this paper, we study how a randomized intervention among 8-year-old children in
Switzerland affects tracking, high school completion, and university enrollment. The Promoting
Alternative Thinking Strategies (PATHS) intervention is a classroom-based socio-emotional
learning program for elementary school students that aims to reduce behavioral problems
(Greenberg et al. 1995). The intervention consists of weekly lessons and homework assignments
embedded in the school curriculum. It lasts for up to two years and is designed to foster self-
control, patience, social problem-solving skills, self-esteem, emotional intelligence, as well as
academic engagement.
PATHS teaches children to think twice and to look ahead. For example, in one classroom
exercise, children learn to make less impulsive choices in difficult situations with the three-part
“stoplight approach.” First, on the red light, children slow down, take a few deep breaths and
explain the problem they face. Next, on the yellow light, children think about solution options,
consequences of their actions, and plan a solution to the problem. Finally, on the green light,
children execute their plan and evaluate whether it worked. Teachers support children in applying
the stoplight approach in role-play and real-life situations occurring in class such as a conflict with

2
peers. The children also practice this approach in homework assignments: they describe a school-
related social or academic problem, explain solution strategies to parents or classmates, and collect
feedback on their solution strategies. The PATHS intervention includes elements of cognitive
behavioral therapy. It targets problem-solving and regulatory skills that have been associated with
improved externalizing behavior conducive to learning, achievement, and future school success
(Izard et al. 2004; Fantuzzo et al. 2007; Roberts 2007; Raver et al. 2011; Deming 2017).
The PATHS intervention was implemented in 2005 in the city of Zurich in Switzerland. Its
main goal was to reduce disruptive and aggressive behavior by improving children’s socio-
emotional skills (Eisner, Malti, and Ribeaud 2012).1 PATHS was introduced in 28 out of 56
randomly selected public primary schools. Randomization took place at the school level and was
stratified within school districts. The intervention was supposed to last for one school year in
second grade; however, the program was so popular that over 70 percent of schools accepted the
offer to continue with the program for a second year.2
To evaluate the long-term effects of the intervention, we follow the treatment and control
group over 15 years using the z-proso panel. This panel surveys children, teachers, and primary
caregivers on an annual or biannual basis from 2004 until 2018, with the last wave interviewing
individuals at age 20. The data include baseline and follow-up measures of children’s socio-
emotional skills, parenting practices, family and household characteristics, as well as
administrative and self-reported educational outcomes. The combination of multi-respondent
1 See Eisner et al. (2012), and Malti, Ribeaud, and Eisner (2012), and Averdijk et al. (2016), for a more detailed
description. 2 The experimental design included the Triple P parenting training program, which was an additional treatment
implemented in half of the schools in the PATHS treatment group and in half of the schools in the control group. The
Triple P participation rate was only 23 percent (Eisner et al. 2007) and did not affect educational outcomes. This paper
focuses on the PATHS intervention. For completeness, we discuss the additional intervention in Section 4 and provide
evaluation results in the Appendix.

3
survey data matched to administrative education records allows us to provide detailed evidence on
how treatment effects evolve over time and what skills are affected by the intervention.
Our results show that, four years after the intervention, treated children become 4.4
percentage points more likely to get tracked into academic high school (Gymnasium).3 The
treatment effect persists and these children become 7.1 percentage points more likely to complete
academic high school. This effect is economically significant. It represents a 23 percent increase
relative to the mean of the control group. At age 20, twelve years after the intervention, the
treatment group is 21 percent more likely to attend university. The size of this effect is one-seventh
of the treatment effect of the Abecedarian program for college attendance (Campbell et al. 2014)
and one-quarter of the size of the Perry Preschool Program for high school completion
(Schweinhart 1993, Heckman et al. 2010a). Our effect size on academic high school attendance is
very similar to the treatment effect of the Baloo and You mentoring program (Falk, Kosse, and
Pinger 2019).
To investigate how the intervention affected children’s educational attainment, we study
four potential mechanisms. We evaluate changes in: (1) grades and test scores, (2) socio-emotional
skills, (3) children’s classroom behavior, and (4) parenting practices.
We find evidence for the first three mechanisms. First, the intervention increases students’
grades, but it has no impact on academic high school admission test scores. This result suggests
that the treatment effect is more likely to operate through changes in socio-emotional skills rather
than through improved cognitive skills.4 Second, treated children display less attention deficit and
hyperactivity disorder (ADHD) symptoms: they are less impulsive and less disruptive. Treated
3 Ability tracking into secondary school represents a key educational transition in Switzerland. Academic high school
(Gymnasium) is the highest secondary school track in Switzerland. Enrollment in university requires a degree from an
academic high school. Over 62 percent of OECD countries use a similar school-based tracking system (OECD 2004). 4 Borghans et al. (2016) show that teacher-assessed grades capture both elements of a child’s cognitive and socio-
emotional skills.
4
children also display less opposition, defiance, and non-aggressive conduct disorders. Children’s
anxiety, physical aggression, and prosociality are not affected by the intervention. Third, treated
children are less likely to disturb lessons and more likely to focus on the teaching content in class.
We do not find that treated children become more likely to complete their homework assignments,
which suggests that the treatment mostly affects engagement and attention in the classroom.
Fourth, we find little treatment effects on parenting practices.
Taken together, our analysis of the underlying mechanisms paints a consistent picture. The
PATHS program reduces children’s impulsiveness and fosters their decision-making process.
These behavioral changes improve classroom behavior, which is rewarded by higher grades. In the
long run, these improvements in grades lead students to enter the academic high school track and
enroll in university.
This paper contributes to the literature by connecting studies on long-term effects of
childhood interventions to recent evidence on the malleability of socio-emotional skills.5 Although
a number of existing studies hypothesize that the long-term impact of early childhood interventions
are due to changes in socio-emotional skills, the direct empirical evidence for this link is limited.
This paper fills that gap.
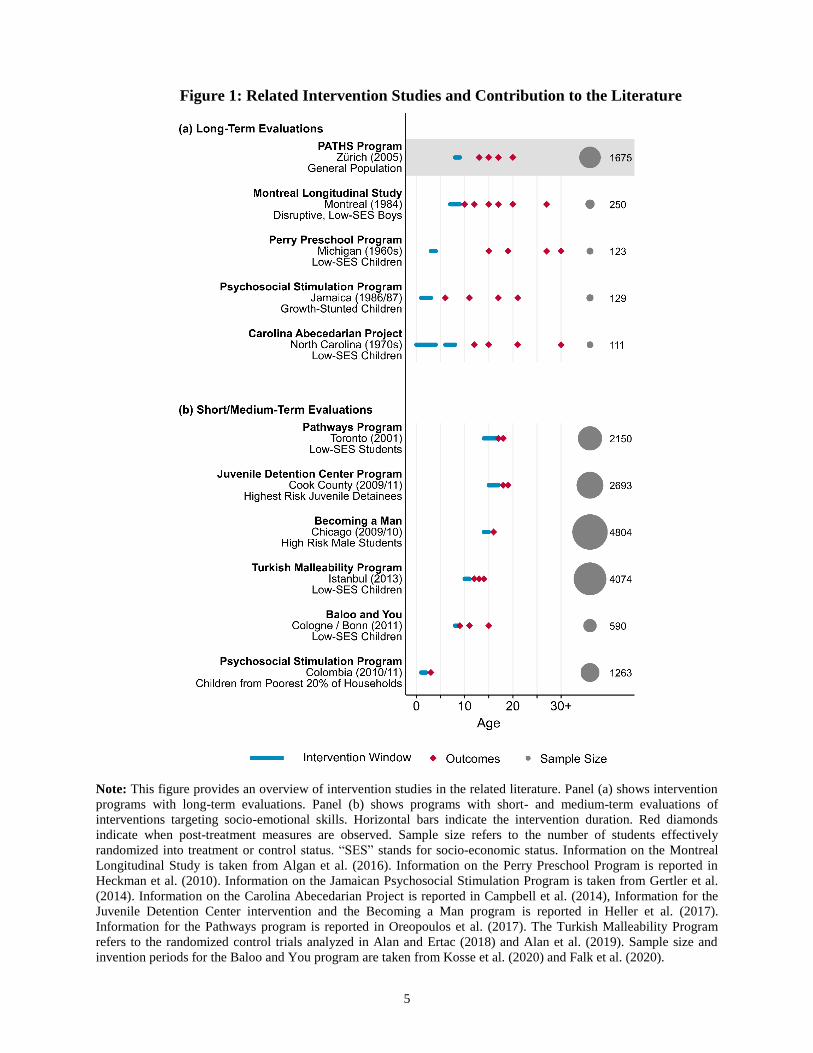
Figure 1 summarizes related intervention studies and our contribution to this literature.
Panel (a) shows childhood intervention programs with long-term evaluations: Campbell et al.
(2002) evaluate the Abecedarian preschool program, one of the oldest early childhood
interventions, and show that the intervention improved IQ, achievement, and college enrollment.
5 Durlak et al. (2011), Taylor et al. (2017), and Blewitt (2018) conduct a meta-analyses of school-based programs to
promote students’ social and emotional development and conclude that these programs are generally effective. Socio-
emotional learning programs are associated with improved attitudes about the self and others, increased prosocial
behavior, lower levels of problem behaviors and emotional distress, and improved academic performance.
5
Figure 1: Related Intervention Studies and Contribution to the Literature
Note: This figure provides an overview of intervention studies in the related literature. Panel (a) shows intervention
programs with long-term evaluations. Panel (b) shows programs with short- and medium-term evaluations of
interventions targeting socio-emotional skills. Horizontal bars indicate the intervention duration. Red diamonds
indicate when post-treatment measures are observed. Sample size refers to the number of students effectively
randomized into treatment or control status. “SES” stands for socio-economic status. Information on the Montreal
Longitudinal Study is taken from Algan et al. (2016). Information on the Perry Preschool Program is reported in
Heckman et al. (2010). Information on the Jamaican Psychosocial Stimulation Program is taken from Gertler et al.
(2014). Information on the Carolina Abecedarian Project is reported in Campbell et al. (2014), Information for the
Juvenile Detention Center intervention and the Becoming a Man program is reported in Heller et al. (2017).
Information for the Pathways program is reported in Oreopoulos et al. (2017). The Turkish Malleability Program
refers to the randomized control trials analyzed in Alan and Ertac (2018) and Alan et al. (2019). Sample size and
invention periods for the Baloo and You program are taken from Kosse et al. (2020) and Falk et al. (2020).
6
Heckman et al. (2010a) and Schweinhart (1993) evaluate the Perry Preschool Program,
which aimed to foster the development of disadvantaged children, and show that program
participants obtained more schooling, had higher earnings, and committed fewer crimes.6 Gertler
et al. (2014) analyze long-term effects of the Jamaican Study that contained an intervention aimed
at improving mother-child interactions through home visits. They find increases of 25 percent in
earnings 20 years after the intervention. Algan et al. (2016) use data from the Montreal
Longitudinal Experimental Study, which aimed to improve socio-emotional skills in boys with
after-school training sessions. This intervention increased self-control and trust during adolescence
and increased educational achievements in early adulthood.
Panel (b) in Figure 1 summarizes more recent interventions explicitly targeting socio-
emotional skills in children. Alan, Boneva, and Ertac (2019) show that an intervention targeting
grit increases students’ perseverance and subsequent math test scores two years after the
intervention. Alan and Ertac (2018) show that an intervention targeting patience improves self-
control and the ability to imagine future selves. These effects lead to more patient intertemporal
choices and persist over a three-year period. Cappelen et al. (forthcoming) show that early
childhood education affects children’s social preferences for fairness and the importance children
place on efficiency relative to fairness. Oreopoulos et al. (2017) evaluate a mentoring and tutoring
program and find that the program increases high school completion by 35 percent and
postsecondary enrollment by more than 60 percent. Kosse et al. (2020) study a mentoring program
for primary school children and show that the program persistently increases prosociality. Falk et
al. (2020) follow these children over time and show that the program also increases the probability
of attending the academic high school track. Heller, et al. (2017) evaluate an intervention in
6 Heckman and Karapakula (2019a and 2019b) follow up on these results and highlight positive long-term effects on
cognitive skills, employment, health, and reduced crime, as well as positive intergenerational spillovers.

7
Chicago similar to PATHS called “Becoming a Man” (BAM). Both programs target emotional
awareness, emotion regulation, and behavioral change in the decision-making process of students.7
We contribute to the literature in four ways. First, we observe children over a decade after
the intervention. This distinguishes us from studies focusing on interventions targeting socio-
emotional skills, which are limited to outcomes observed a few years after the intervention.
Second, in contrast to studies evaluating the long-term consequences of other childhood
interventions, we have a substantially larger sample. With 1,675 individuals, we have more
statistical power than the Abecedarian Program (n = 111), the Perry Preschool Program (n = 123),
the Jamaican Study (n = 129) and the Montreal Longitudinal Study (n = 250). Third, while other
studies almost exclusively focus on disadvantaged children, we evaluate an intervention that
targets children of all backgrounds. Fourth, our detailed survey data allow us to provide evidence
on the underlying mechanisms showing which skills and behaviors are affected by the intervention.
2. The PATHS Training Program
PATHS is a teacher-led program for primary school children that was developed by Mark T.
Greenberg and Carol A. Kusché at the University of Washington for the US context (Kusché and
Greenberg 1994). The program teaches systematic coping and decision-making strategies with the
aim of fostering children’s self-control, emotional understanding, and social problem solving skills
(Greenberg et al. 1995).
PATHS focuses on regulatory skills; it aims to foster social skills and improve
externalizing behavior (Greenberg et al. 1995, 1998). These behavior changes should improve
educational participation, reduce disruptive and aggressive behavior in the classroom, and,
7 Both interventions were originally implemented to reduce future aggression and delinquency. The PATHS
intervention shows, in contrast to Heller et al. (2017), no impact on aggression and delinquency (Averdijk et al. 2016).
This may be due to different environments in Chicago and Zurich. In 2017, for example, the Chicago homicide rate
was 28 times higher and the assault rate 48 times higher than in Zurich.

8
ultimately, reduce violence, delinquency, and crime. Table I, provides an overview of the PATHS
curriculum, which targets the following competences:8
(1) Self-control, patience
(2) Decision-making strategies, social problem solving
(3) Self-esteem
(4) Emotional intelligence
(5) Fairness and rules
[Table I]
(1) Self-control, patience: PATHS targets self-control and patience through several exercises.
Children learn to calm down in stressful situations using breathing techniques. They learn that it
is their own responsibility to avoid exploding in anger and losing self-control through the analogy
of a balloon that can burst. They role-play situations in which they practice ignoring, interpreting,
and handling teasing of other children. They listen to a story of a girl who learned how to control
herself by calming down and recognizing her emotions. The children complete some of these
exercises at home. For example, children interview their parents about situations in which they
had to calm down and write a summary of how their parents managed the situation.
(2) Decision-making strategies, social problem solving: PATHS targets decision-making
strategies and social problem solving based on the stoplight approach. To introduce the stoplight
approach, the teacher uses the stoplight poster shown in Figure A1 in the Appendix. This approach
teaches children systematic decision-making by going through three mental steps before taking
8 Figures A1–A4 in the Appendix provide examples of the teaching material related to the activities summarized in
Table I.

9
action. Each step represents one of phases of the stoplight. The red-light phase is associated with
the word “stop.” In this phase, children must slow down, take a few deep breaths, and explain the
problem they are facing. The yellow-light phase is associated with the word “think.” In this phase,
children reflect on their solution options, think about the possible consequences of their actions,
and make a plan to solve the issue. They also think about how others will respond to their actions.
The green-light phase is associated with the word “act.” In this phase, children execute their plan
and evaluate whether it worked.
After introducing the method in class, the teacher discusses concrete situations in which
children can use the approach. Children then apply the stoplight approach in repeated role-play
exercises that simulate everyday situations. These exercises involve conflict situations with peers,
parents, or teachers, or problems with school assignments. In homework assignments, children
describe their problem-solving approach to a specific situation. They also practice the approach at
home and explain the three steps to their parents, who receive a separate information leaflet about
the benefits of the stoplight approach (Figure A5).
(3) Self-esteem: PATHS aims to increase children’s self-esteem by making them aware of their
strengths and skills. In one of the lessons, children learn to give and accept compliments from
peers and teachers. The teacher explains the concepts of compliments and respect as well as how
to express compliments. Children then practice how to give compliments to each other in the
classroom. In one homework assignment, children exchange compliments with parents and other
family members at home.
In another exercise, the “child of the week” receives special privileges and duties for one
week. As part of this exercise, the child acts as the teacher’s assistant. At the end of the week, the
teacher and classmates prepare a special child-of-the-week certificate with a picture of the child

10
and a series of compliments and anecdotes describing what attributes classmates value in the child.
While this activity is supposed to foster self-esteem, it also teaches children that privilege comes
with responsibilities. They are supposed to learn that being valued by others also requires
contributing to the common good.
(4) Emotional intelligence: PATHS targets emotional intelligence by fostering the understanding
and expression of feelings. In one lesson, the teacher reads stories and children guess what feelings
the protagonist felt. In one homework assignment, children describe their feelings during a recent
emotional situation and discuss with their parents how they dealt with their emotions. With this
exercise, children learn about themselves and become more aware of how their behavior affects
the feelings and perceptions of peers, parents, and teachers. To facilitate the recognition and
expression of feelings, children receive “feelings cards.” These cards show children expressing
different emotions such as happiness, excitement, anger, surprise, sadness, and worry (see Figure
A2 in the Appendix). Children first color these cards and then use them to express their current
emotional state by placing the corresponding card on their table. In a final step, children reflect on
how to demonstrate an emotion. For example, they have to find appropriate verbal responses to
feelings like anger or sadness.
(5) Fairness & rules: Starting with the first PATHS lesson, children discuss the importance of
having rules and manners. They discuss with their teachers in class and parents at home which
rules should be established in the classroom, at home, and in general everyday life. PATHS also
tries to foster children’s understanding of fairness by introducing children to principles of fair
behavior. In one lesson, children have to identify fair and unfair behavior in different situations.
11
In another lesson, the teacher reads a story and the children discuss whether the protagonists’
behavior is fair or unfair.
3. Data and Institutional Background
This section provides the institutional background of this study. First, we introduce the Zurich
Project on Social Development from Childhood to Adulthood (z-proso data collection). Second,
we illustrate the main characteristics of the education system in the Canton of Zurich.
3.1 The z-proso Study
The data we analyze in the paper come from the z-proso panel study (Malti, Ribeaud, and Eisner
2011; Eisner et al. 2012; Averdijk et al. 2016). The study surveys students, teachers, and primary
caregivers9 to investigate the life-course of 1,675 children starting primary school in 2004 in
Zurich, the largest city in Switzerland. Table II provides an overview of the timing of the surveys
and the respondents in eight different waves that took place between 2004 and 2018. By 2018, the
study had followed children over a 15-year period until they were 20 years old. The data include
pre-intervention (baseline) and follow-up measures of children’s socio-emotional skills, parenting
practices, family and household characteristics, and administrative and self-reported educational
outcomes. Appendix B1 describes the data collection, informed consent, and ethics approval in
greater detail.
[Table II]
9 In most cases the primary caregiver is a child’s biological parent. Throughout the paper we use the terms primary
caregiver and parents interchangeably.

12
Two early prevention programs were implemented as part of the z-proso study. The first
intervention was PATHS, the school-based social and emotional learning-based program we focus
on in this paper (see Section 2). The second intervention was the “Positive Parenting Program”
(Triple P). Triple P encourages “positive parenting” by teaching techniques that support desired
child behavior, routines that avoid parent-child conflicts, and techniques that help the child plan
ahead (Sanders 1999). In this paper, we focus on the PATHS intervention. For completeness, we
provide more details on the Triple P intervention in Section 4 and show its treatment effects in the
appendix.
3.2 Education and Tracking System
Figure 2 illustrates the school system and educational transitions in the canton of Zurich. Children
start primary school at age 7. At age 12, after six years of primary school, children are tracked into
different secondary schools.
The highest school track is academic high school (Gymnasium). Students attend this school
for six years and typically graduate when they are 18 years old. It prepares students for university
education and allows them to obtain the Matura degree required to enroll in university. Children
in the lower track attend one of three secondary high schools called Sekundarschule level A, B,
and C. These schools prepare students for vocational education and apprenticeship trainings. Level
A leads to white collar jobs and levels B and C lead to blue collar jobs. Students in all three lower
tracks attend school for three years and are typically 16 years old upon completion.
Which track the children will attend is determined by their grades in their last year of
primary school and their scores on a standardized admission test measuring mathematics and
language skills. Grades and test scores receive equal weight. Parents cannot choose the secondary
school track and have no direct influence on the tracking outcome.

13
Figure 2: School Tracking and Measurement of Educational Outcomes
Note: This figure illustrates the structure of the school system in the canton of Zurich. Children attend primary school
for six years from ages 7 to 12 (Grade 1 to Grade 6). At the end of primary school, at age 12, children are tracked
either into academic high school (Gymnasium) or into regular high school (Sekundarschule). The tracking outcome is
exclusively determined by children’s grades in the final year of primary school and academic high school admission
test scores. Children can either attend academic high school directly starting from Grade 7 (Long-term Gymnasium)
or from Grade 9 onwards (Short-term Gymnasium). The non-academic high school track comprises three lower tracks
called Sek A, Sek B, and Sek C. Children attending regular high school can also transfer to academic high school after
two or three years. The Matura degree obtained upon completion of academic high school is a requirement to enroll
in university. Students graduating from regular high school typically start an apprenticeship at age 16. Apprenticeships
last two to four years. The red vertical bar indicates the intervention period. The yellow bars indicate the points in
time where we observe educational outcomes.
Two additional features characterize the school system in the canton of Zurich. First, after
Grade 3, children are reassigned to new classes and teachers if school size permits. Second,
children can switch between the different tracks throughout secondary school (see also Figure 2).
Students can obtain the Matura degree from an academic high school either through attending
long-term academic high school or short-term academic high school. Tracking into long-term
academic high school takes place after Grade 6. Tracking into short-term academic high school
takes place after Grade 8 or 9. Later transitions are possible if students have sufficiently high
grades and pass the standardized admission test. The share of students in the highest track increases
by 5-10 percent during the three years of secondary school.
14
4. Experimental Design
4.1 Selection of Schools, Randomization, and Definition of Treatment Group
Selection of participating schools: Zurich consists of seven school districts and has a total of 90
primary schools. In each school district, eight schools were randomly selected to participate in the
experiment. All 56 selected schools complied with the request of the City of Zurich’s School and
Sports Department to participate in the study.
Stratification and Randomization: The 56 participating schools were assigned to 14 strata cells.
These cells were constructed by dividing each of the seven school districts into two groups
consisting of four similar-sized schools. Within each strata, each school was randomly assigned to
one of four treatment groups using a random number generated in Microsoft Excel. Schools with
the largest random number in each strata were assigned to the PATHS program (PATHS only).
Schools with the second largest number were assigned to the Triple P program (Triple P only).
Schools with the third largest number were assigned both to the PATHS and Triple P programs
(PATHS & Triple P). Finally, schools with the lowest number received neither the PATHS nor the
Triple P intervention. These schools are the pure control group.
Definition of treatment and control groups: In this paper, we focus on the PATHS intervention
and define the treatment group as the group of schools assigned to the one of the two PATHS
treatment arms—either PATHS only or PATHS & Triple P combined. The control group consists
of the pure control group and the Triple P-only group. Based on this definition, we have 28 treated
and 28 control schools.
We include Triple P schools in the control group because this program had no impact on
children’s educational careers. It also had no impact on children’s problematic behavior or

15
educational outcomes (Malti et al 2011; Eisner et al 2012). We provide these results in Table A1
in the Appendix. Triple P has been shown to be effective for younger children (Doyle,
forthcoming). In our setting, however, it suffered from low participation rates. Only 23 percent of
parents in the treatment group participated, which makes it challenging to detect any treatment
effects.
Given that there are four treatment arms of the original experimental design, we could also
estimate effects for each of the three treatment groups separately. In Section 6.2 we show that this
approach leads to similar results. Alternatively, we could drop all students that received the Triple
P treatment and compare only the pure PATHS with the pure control group. We provide results
based on this alternative sample definition in Section 6.2. While we lose about half of our
observations with this definition, results remain very similar.
4.2 Implementation of the Intervention
In the 2005/06 school year, PATHS was implemented in 28 primary schools in cooperation with
the Department of School and Sports of the City of Zurich. Prior to the implementation, the original
PATHS material was translated and adjusted to the Swiss context by Rahel Jünger in collaboration
with the US developers (Eisner et al. 2007). Rahel Jünger also implemented the program and
conducted the teacher training and supervision. This implementation was done independently from
the evaluation.
To prepare schools for delivering the PATHS intervention, all teachers in charge of running
PATHS lessons participated in a three-day workshop with a PATHS coach. During this workshop
the PATHS coach gave teachers an overview of the key concepts, classroom activities, posters,
toys, and over 400 pages of materials. During the first year of the program, teachers regularly met
their PATHS coach, who gave them feedback and support. PATHS coaches also monitored the

16
implementation and observed six PATH lessons for each participating class. After each of these
observations, the coach provided suggestions for improvements and graded the quality of the
implementation.
The 45-minute PATHS lessons typically took place twice per week. The majority of
children received PATHS lessons throughout the entire Grade 2. PATHS lessons replaced the class
“Humans and Environment” (Mensch und Umwelt), which teaches children about the environment
and organization of Swiss society. To reinforce the practice of PATHS methods, teachers also
applied PATHS strategies in lessons not explicitly dedicated to the PATHS curriculum itself. Over
the course of Grade 2, children received about 45 hours of PATHS lessons and about 20 hours of
PATHS homework assignments (Eisner et al. 2007). Because the majority of teachers, parents,
and children highly appreciated PATHS, over 70 percent of schools continued using the program
for a second year in Grade 3. The program ended for all children at the end of Grade 3 when classes
were reshuffled and students received a new teacher.
Implementing PATHS only cost USD 1,540 per class or USD 67 per student. These costs
were for training and materials. The intervention did not lead to increased salary costs as the
PATHS curriculum replaced an existing subject. We compare the costs of PATHS to other
interventions in Section 8.3.
4.3 Outcome Variables and Descriptive Statistics
Outcome variables: We evaluate the long-term effects of the PATHS intervention on educational
outcomes. The key outcomes of interest are whether individuals attend and complete the academic
high school track (Gymnasium), whether they obtain the Matura degree, which allows them to
enroll in any university, and whether they are enrolled in university at age 20.

17
We observe students’ secondary school tracks at ages 13, 15, and 17 from administrative
school data provided by the Department of Education of the Canton of Zurich. Some children leave
the canton of Zurich and therefore disappear from the administrative data. We therefore
complement the administrative records with self-reported tracking outcomes at ages 13, 15, and
17 based on the z-proso survey.10 We observe whether students complete academic high school
and enroll in university from the wave 8 z-proso survey administered at age 20.
[Table III]
Table III show that 16 percent of the participants attend academic high school at age 13,
right after tracking has taken place. This number increases to 20 percent at age 15 and 26 percent
at age 17.11 Twenty-seven percent of children complete academic high school, and 17 percent are
enrolled in university at age 20.
Baseline measures: Table III shows characteristics of children and parents measured at the
baseline, that is, in the year before the start of the intervention. At this time, children were, on
average, seven years old. Forty-eight percent are girls. Our sample comes from a diverse
population: only 60 percent are Swiss, only 42 percent were born in Switzerland, and only 49
percent of mothers are Swiss. Seventeen percent of households are single-parent households.
About 39 percent of mothers have completed academic high school (Gymnasium), and 16 percent
hold a university degree. Fathers are slightly more educated than mothers, with 52 percent having
10 The z-proso study aims to track individuals even after they moved out of the canton or leave the country and has a
remarkably low attrition rate. At age 20, we observe self-reported education outcomes for over 70 percent of the
original sample (n = 1,675). 11 The proportion of students in academic high school increases over time due to students’ switching to Gymnasium
from lower tracks during different stages of secondary school.

18
completed Gymnasium or other types of higher education and 25 percent holding a university
degree. The average family household income is USD 86,000 per year; 38 percent of families are
entitled to financial aid, and 18 percent report financial problems at the baseline.
Our data contain detailed baseline measures of child behavior assessed through the Social
Behavior Questionnaire (SBQ) (Tremblay et al. 1991; Murray et al. 2019). The SBQ covers the
following domains: ADHD symptoms (disruptiveness and impulsiveness), opposition and
defiance, non-aggressive conduct disorder, anxiety and depressivity, aggression, and prosociality.
At the baseline, SBQ measures are available from teacher, parent, and child reports. The data also
contain measures of parenting practices assessed through the Alabama Parenting Questionnaire
(APQ) (Shelton, Frick, and Wootton 1996). The APQ includes the following domains: corporal
punishment, inconsistent discipline, parental supervision, parental involvement, and positive
parenting.
5. Empirical Strategy
This section introduces our empirical model and provides evidence on the balance between the
treatment and control groups.
5.1. Empirical Model
Our goal is to estimate the treatment effect of the PATHS intervention on educational outcomes.
Equation (1) shows our main empirical model:
𝑌𝑖 = 𝛽1 PATHSi + 𝑋𝑖′𝛾 + 𝜃 + 𝜀𝑖, (1)

19
where 𝑌𝑖 is the outcome of interest of individual i (attendance of academic high school at ages 13,
15, and 17, academic high school completion, and university enrollment at age 20). PATHS is an
indicator showing whether the individual was randomly assigned to the PATHS training program.
𝛽1 is the parameter of interest. It captures the treatment effect of participating in the PATHS
program. Vector 𝑋𝑖 contains baseline control variables. These differ depending on the
specification. In our most complete specification, we include pre-treatment measures of child
characteristics, household characteristics, and child socio-emotional skills. Child characteristics
include age, gender, and Swiss citizenship. Household characteristics include household income,
mother’s age at the baseline, mother’s education, father’s education, and indicator variables for
whether the mother was born in Switzerland and whether she has Swiss citizenship, whether the
household is single-headed, whether the household reports receiving financial aid, and whether the
household reports financial problems. For a child’s socio-emotional skills, we rely on SBQ
measures reported by the teacher and the primary caregiver. These include ADHD symptoms
(disruptiveness and impulsiveness), anxiety and depressivity, aggression, prosociality, non-
aggressive externalizing problem behavior, non-aggressive conduct disorder, and opposition and
defiance. The model always includes strata fixed effects 𝜃 for the level at which randomization
took place. 𝜀𝑖 represents the error term of the model.
We estimate Equation (1) using linear probability models and cluster standard errors at the
school level. We additionally provide p-values based on randomization inference with 10,000
repetitions following Young (2018).
5.2. Balancing Tests
The identifying assumption of our empirical strategy relies on the random assignment of children
to the treatment status. To verify this assumption, we test whether baseline characteristics predict
20
treatment status. In particular, we regress treatment status on each of the pre-treatment
characteristics separately. We use all available characteristics on child and family demographics
and measures for socio-emotional skills, and we estimate a total of 56 regressions.
Table IV summarizes the balancing tests. Column (1) shows the number of statistically
significant coefficients we obtain when regressing the indicator for treatment status (PATHS) on
baseline characteristics. Column (2) shows the number of coefficients we would expect to find
statistically significant due to chance variation. Overall, Table IV suggests that the randomization
was successfully implemented: the number of significant coefficients is similar to the expected
number of significant coefficients under random assignment.
[Tables IV and V]
Table V provides a closer look at unbalanced variables by reporting point estimates from
all 56 balancing regressions. The analysis reveals a substantial and significant imbalance (p < 0.01)
in fathers’ education levels between the treatment and the control group. Given that parental
education is a key determinant of children’s educational outcomes, this imbalance deserves careful
consideration. Children receiving the PATHS intervention come from families with, on average,
less educated parents. Treated children are about ten percentage points less likely to have a father
that holds at least an academic high school degree. This imbalance in fathers’ education levels will
make it harder for us to identify effects of the intervention if the treatment affects children’s
educational outcomes positively. Without accounting for this imbalance, we would underestimate
treatment effects of the PATHS training program. To assess how much this imbalance affects our
results, we will provide results from three empirical specifications. The first specification does not
control for parental education. The treatment effect estimate in this model will be downward biased

21
due to the imbalance in parental education. The second specification accounts for this imbalance
by controlling for parental education. As a final test, we estimate a specification with a full set of
baseline control variables to test the sensitivity of our findings to including a large set of additional
pre-treatment characteristics.12
6. Results
In this section, we provide the main results of our analysis on the impact of the PATHS curriculum
on educational careers. We also test whether these results are driven by selective attrition and
estimate treatment effects for different subgroups.
6.1 Main Results
Table VI shows estimates of the PATHS treatment effect on education trajectories. The outcome
variables in columns (1) to (3) are indicator variables for attendance of academic high school at
ages 13, 15, and 17. The outcome variables in columns (4) and (5) are indicator variables for
academic high school completion and university enrollment at age 20, respectively. Panel A
reports results without control variables. Panel B reports results with additional controls for
parental education to account for the imbalance between treatment and control groups at the
baseline. We refer to this set of controls as randomization controls. Panel C reports results
including randomization controls and a large set of additional baseline control variables.
[Table VI]
12 These additional pre-treatment characteristics include mother’s age, child’s age, household income, as well as
indicators for whether the mother is a Swiss national, whether the mother was born in Switzerland, whether the child
is a Swiss national, whether the child is female, whether the child has been raised in a single-parent household, whether
the household has financial problems, and whether the household receives financial aid.
22
Panel A of Table VI provides estimates of the effect of the PATHS program from
specifications without baseline controls. Despite having less-educated parents, children who
attended the PATHS program appear to do better than children in the control group. While not
statistically significant, the point estimates are positive for all outcomes. For example, treated
children are 3.3 percentage points more likely to attend academic high school at age 17 and 2.3
percentage points more likely to have completed academic high school at age 20.
Panel B shows estimates that account for the imbalance in parental education at the
baseline. In these specifications, we see positive and statistically significant treatment effects for
all educational outcomes. The point estimates show that the PATHS program increases children’s
likelihood of attending an academic high school by 2.3 percentage points at age 13, by 4.1
percentage points at age 15, and by 6 percentage points at age 17. This effect increases with student
age because PATHS students are more likely to transition to the academic track from lower-track
schools. These effects translate into higher graduation grades. Attending PATHS increases
children’s likelihood of completing academic high school by 5.1 percentage points by age 20. This
effect represents a 20 percent increase over the completion rate of the control group. Finally, we
also see that attending PATHS increases children’s likelihood of enrolling in university by 3.6
percentage points (21 percent).
Panel C of Table VI shows results including controls for parental education and a large set
of additional baseline control variables. These additional controls are child characteristics,
household characteristics, and child’s socio-emotional skills. More specifically, we control for age
and gender of the child, the Swiss citizenship of the child, household income, age of the mother,
indicator variables for the mother having Swiss citizenship and being born in Switzerland, single-
parent household status, receipt of financial aid, financial problems reported by the household, as
well as baseline measures of a child’s socio-emotional skills covering ADHD symptoms, anxiety
23
and depressivity, non-aggressive externalizing problem behavior, non-aggressive conduct disorder
and opposition and defiance. Differences in the point estimates between the models with and
without extra control variables provide information on the extent to which correlated
unobservables affect the relationship between the treatment effect and education outcomes. If the
estimates remain similar despite including this large set of observable characteristics, results are
likely robust to factors not included in the estimations (Altonji, Elder, and Taber 2005).
Panel C shows that the results are robust to including a large set of additional baseline
control variables that also substantially increase the R-squared. For these specifications, we have
smaller samples due to missing values in our control variables. However, for each outcome, point
estimates in the model with randomization controls (Panel B) and the full set of controls (Panel C)
are not statistically different from each other. Point estimates in these specifications show that
PATHS increases children’s likelihood of completing academic high school by 7.1 percentage
points (23 percent) and increases their likelihood of enrolling in university by 4 percentage points
(21 percent).
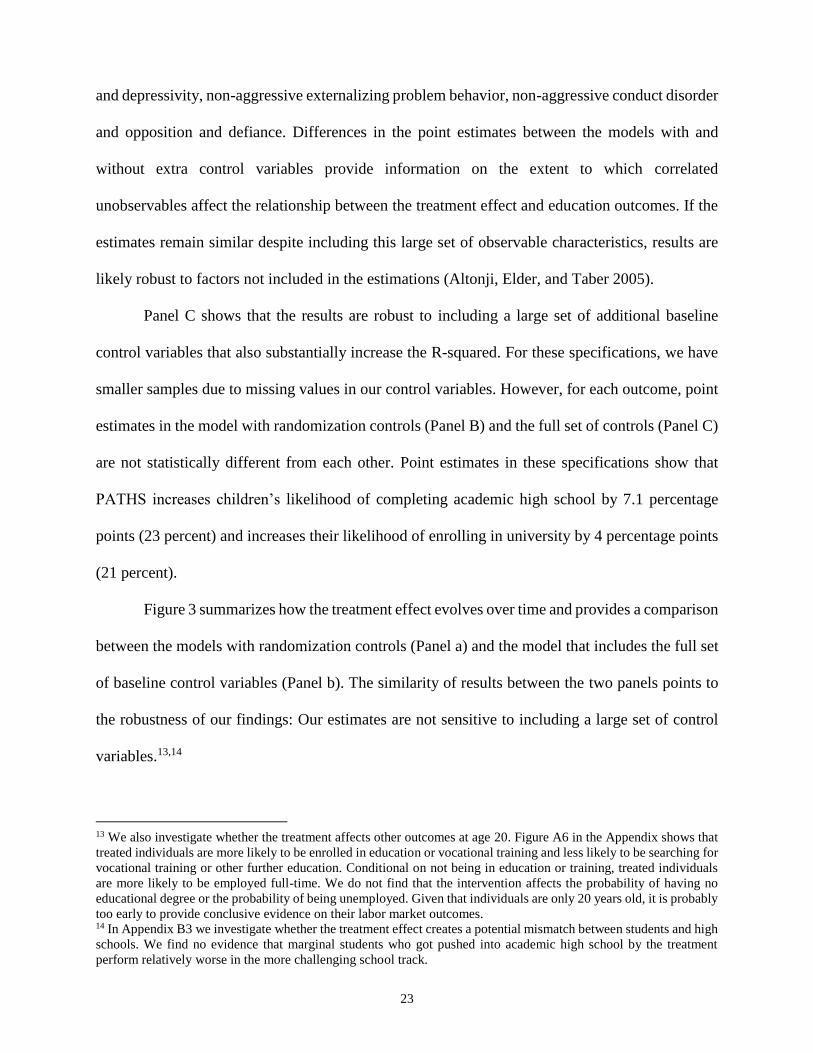
Figure 3 summarizes how the treatment effect evolves over time and provides a comparison
between the models with randomization controls (Panel a) and the model that includes the full set
of baseline control variables (Panel b). The similarity of results between the two panels points to
the robustness of our findings: Our estimates are not sensitive to including a large set of control
variables.13,14
13 We also investigate whether the treatment affects other outcomes at age 20. Figure A6 in the Appendix shows that
treated individuals are more likely to be enrolled in education or vocational training and less likely to be searching for
vocational training or other further education. Conditional on not being in education or training, treated individuals
are more likely to be employed full-time. We do not find that the intervention affects the probability of having no
educational degree or the probability of being unemployed. Given that individuals are only 20 years old, it is probably
too early to provide conclusive evidence on their labor market outcomes. 14 In Appendix B3 we investigate whether the treatment effect creates a potential mismatch between students and high
schools. We find no evidence that marginal students who got pushed into academic high school by the treatment
perform relatively worse in the more challenging school track.
24
Figure 3: Main Results – Treatment Effects on Educational Outcomes
Note: This figure is based on estimates shown in Table VI and shows the treatment effect of the PATHS intervention
on the probability of attending academic high school at age 13, 15, and 17 as well as on the probability of completing
academic high school and being enrolled in university at age 20. All dependent variables are indicator variables and
all specifications are estimated using linear probability models. All models include strata fixed effects for the level of
randomization. In Panel (a), we include randomization controls for mother and father education level and indicator
variables for missing education level. In Panel (b), we include controls for baseline child, parental, and household
characteristics and baseline child SBQ measures. Child controls include age and gender of the child and having Swiss
citizenship. Household controls include household income, age of the mother, indicator variables for the mother
having Swiss citizenship and being born in Switzerland, an indicator for mother and father education level, indicator
variables for missing education level, and indicator variables for single-parent household, household that received
financial aid, and household that experienced financial problems. Controls for baseline child SBQ measures include
measures for anxiety and depressivity, ADHD, non-aggressive externalizing problem behavior, non-aggressive
conduct disorder, opposition and defiance, prosociality, and three measures of aggressive behavior. Each point
estimate is shown with the respective 90 and 95 percent confidence intervals calculated based on standard errors
clustered at the school level.
Overall, we observe large and economically significant effects. In the average class in our
sample, five out of 28 children attend university at age 20. The size of the treatment effect implies
that one additional child—six instead of five children—will attend university due to the
intervention. The size of our treatment effect for attending academic high school (a 20 percent
increase) is very similar to the treatment effect of the mentoring program Baloo and You on the

25
same outcomes in Germany (a 23 percent increase; Falk, Kosse, and Pinger 2019). The effect size
we find is equivalent to one-seventh of treatment effect of the Abecedarian program on college
attendance (Campbell et al. 2014) and about one-quarter of the size of the Perry Preschool Program
on high school completion (Heckman et al. 2010a). We discuss our effect sizes and how they
compare to other childhood interventions in Section 8.
6.2 Robustness Analysis
In this section, we test the robustness of our results in three ways. First, we test whether our
conclusions remain the same if we compute p-values based on randomization inference. Second,
we estimate specifications using the three separate treatment groups based on the original
experimental design. Third, we test whether selective attrition drives our results.
Randomization inference: In the main analysis, we cluster standard errors at the school level,
resulting in 56 clusters. As a robustness test, we compute p-values based on randomization
inference using 10,000 random permutations. With this procedure we account for possible bias in
standard errors due to a small number of clusters. Table VI shows that p-values based on
randomization inference lead to the same overall conclusions.
Three separate treatment groups: Our baseline analysis compares individuals exposed to
PATHS (treatment) to individuals who were not exposed to PATHS (control). However, some
individuals in the treatment and control groups were also exposed to the Triple P program. In Table
A1 in the appendix we show estimates of being assigned to each of the three treatment arms of the
original experiment (PATHS only, PATHS + Triple P, Triple P only) compared to the no-
intervention group (pure control). This table shows that the PATHS treatment effect remains

26
similar to the effect in Table VI and that the Triple P intervention has no significant effect on
educational outcomes. The lack of effects for Triple P is consistent with Eisner et al. (2012), who
show that the intervention had no short-term effects on either parenting practices or child problem
behavior.
Selective attrition: To test for selective attrition, we estimate the effect of attending the PATHS
program on the probability of observing an individual in our estimation sample at four different
points in time: at ages 13, 15, 17, and 20.15 More specifically, we regress an indicator showing
whether we observe the individual in our sample at a given time on a PATHS treatment dummy.
Table A3 shows that the treatment does not affect the probability of being observed in the sample
at different points in time. The PATHS coefficients are small and not statistically significant in all
specifications. Selective attrition does not appear to drive our results.16
6.3 Dosage and Heterogeneous Treatment Effects
In this section, we shed light on dosage effects of the intervention and test whether there are larger
treatment effects for children who were exposed to the program for a longer period. We also
estimate heterogeneous treatment effects to investigate who benefits the most from the PATHS
training program.
15 Data are missing at ages 13, 15, and 17 when individuals move out of the canton of Zurich and refuse to participate
in the survey. Outcomes for academic high school completion and university enrollment are based on self-reported
information and are only available for those individuals participating in the wave 8 survey. 16 Although we do not find any evidence of selective attrition, we also replicate our main results following
Wooldridge’s (2007) inverse probability weighting in Appendix Table A4. We first model attrition for each outcome
variable as a function of the initial assignment to a specific treatment condition and the full set of control variables
used in the baseline analysis. Then, we predict from these models to compute individual weights. In the estimation,
we then weight each observation with the inverse of this probability to account for the probability of being observed
in a specific administrative register or survey wave of the data collection. Appendix Table A4 shows that all main
results remain similar when using inverse probability weighting.

27
Figure 4: Dosage Effects – Two vs. One Year of Treatment
Note: This figure is based on estimates shown in Table A5 and shows the treatment effect of the PATHS intervention
for one versus two years on the probability of attending academic high school at ages 13, 15, and 17 as well as on the
probability of completing academic high school and being enrolled in university at age 20. Treatment effects are
separately shown for children who received the treatment for one (PATHS 1 Year) or two (PATHS 2 Years) years. All
dependent variables are indicator variables and all specifications are estimated using linear probability models. All
models include strata fixed effects for the level of randomization. In Panel (a), we include randomization controls for
mother and father education level and indicator variables for missing education level. In Panel (b), we include controls
for baseline child, parental, and household characteristics and baseline child SBQ measures. Child controls include
age and gender of the child and having Swiss citizenship. Household controls include household income, age of the
mother, indicator variables for the mother having Swiss citizenship and being born in Switzerland, an indicator for
mother and father education level, indicator variables for missing education level, and indicator variables for single-
parent household, household that received financial aid, and household that experienced financial problems. Controls
for baseline child SBQ measures include measures for anxiety and depressivity, ADHD, non-aggressive externalizing
problem behavior, non-aggressive conduct disorder, opposition and defiance, prosociality, and three measures of
aggressive behavior. Each point estimate is shown with the respective 90 and 95 percent confidence intervals
calculated based on standard errors clustered at the school level.
Over 70 percent of schools in the treatment group accepted the offer to continue with the
program for a second year based on the perception of teachers and school principals that the
program was effective. It appears likely that teachers who continued the program were either more
successful in the implementation or had students who were more responsive to the program.

28
Whether a student receives the PATHS intervention for one or two years is therefore endogenous
and we cannot interpret any dosage estimates causally. Nevertheless, we can estimate if longer
exposure to the PATHS training program is correlated with better outcomes.
Figure 4 shows that treatment effect for children treated for two years is approximately
twice as large as the effect for children treated for one year. Although we cannot disentangle
whether this effect is causal or reflects selection bias, it is encouraging to see that children exposed
to the program for a longer time benefit more.
Figure 5: Heterogeneous Treatment Effects
Note: This figure shows heterogeneous treatment effects for the initial tracking outcome by parental education,
family income, father’s employment status, child gender, as well as on baseline child SBQ measure for ADHD
symptoms (disruptiveness and impulsiveness), opposition and defiance, and non-aggressive conduct disorder.
Estimates are based on models in Table VI, Panel B and include randomization controls. The dashed line indicates
the overall treatment effect shown in Table VI, Panel B, column (1). Each point estimate is shown with the respective
90 and 95 percent confidence intervals calculated based on standard errors clustered at the school level.

29
Figure 5 shows heterogeneous treatment effects for the impact of PATHS on initial tracking
into academic high school at age 13. In the regressions underlying the figure, we interact the
treatment variable with an indicator for the respective subgroup shown on the y-axis. We estimate
heterogeneous effects for the following dimensions: parental education, family income, fathers’
employment status, child’s gender, and child’s baseline socio-emotional skills including ADHD
symptoms, opposition and defiance, and non-aggressive conduct disorder. We see little evidence
of heterogeneous treatments effects. None of the treatment effects differ significantly by subgroup.
Figure A7 in the Appendix replicates this analysis for the effect of PATHS on academic high
school completion. This analysis leads to similar conclusions.
7. Mechanisms
In this section, we study four possible mechanisms underlying the effect of the PATHS training
program on educational trajectories. First, we analyze whether PATHS affected the two elements
that determine the tracking outcome: primary school grades and academic high school admission
test scores. Second, we study whether PATHS affected children’s socio-emotional development—
the main target of the intervention. Third, as some of the PATHS activities involve parent-child
interactions, we test whether the intervention affected parenting practices. Fourth, we investigate
whether PATHS affected school-related behavior like classroom disruption and homework
completion. We also conduct a mediation analysis providing suggestive evidence on how much of
the treatment effect can be explained by these mechanisms.
7.1 Effects on Grades and Admission Test Scores
Primary school grades are given on a scale of 1–6 and are based on tests and the subjective
assessments of the primary school teacher. The standardized high school admission test is graded

30
on that same 1–6 scale and covers mathematics, reading comprehension, and writing. The test is
evaluated by an external high school teacher who typically does not know the child. Students’
tracking outcomes are determined by their average primary school grades and their admission test
scores. Both performance measures have equal weight and students with a minimum of 4.5 out of
six are admitted to academic high school.17
We estimate the effect of PATHS on grades and admission test scores using specifications
with randomization controls and specifications with the full set of controls. To simplify the
interpretation of the results, we standardized both outcome variables to have means of zero and a
standard deviations of one.
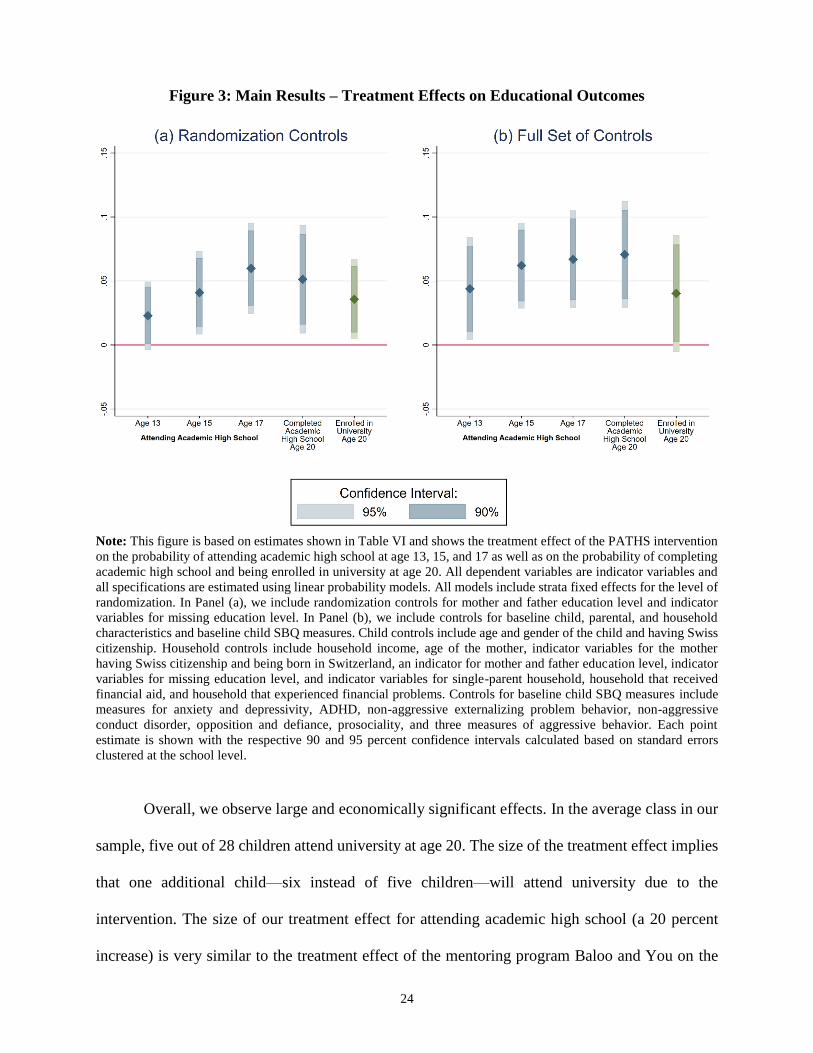
Panel (a) of Figure 6 shows that the PATHS program increases children’s grades by 20
percent of a standard deviation.18 Panel (b) of Figure 6 shows the treatment effect on the admission
test scores. Point estimates on these test scores are lower; they range between 5 and 10 percent of
a standard deviation. While these coefficients are imprecisely estimated and not statistically
significant, we cannot rule out that the treatment had a small positive impact on the standardized
admission test.
Taken together, our results suggest that the intervention raises grades but has only a limited
impact on admission test scores. While test scores mainly capture dimensions of children’s
cognitive skills, grades are more likely to also reflect differences in classroom behavior, aptitude,
and engagement.19 One plausible interpretation for the effects is that treated children display better
17 Participation in the academic high school admission test is voluntary and there is some suggestive evidence that the
treatment increases children’s probability of taking the test (see Table A6 in Appendix). Children who do not take the
test cannot attend academic high school. To account for the fact that we only observe a subsample of children, we
reweigh our observations in Table VI and Figure 6 using inverse probability weighting. 18 Grades are likely determined on a curve within schools and might therefore not be comparable across schools. Given
that all students within a school have the same treatment status, any within-school curving would lead to an
underestimation of treatment effects on (uncurved) grades. 19 Borghans et al. (2016) show that grades capture students’ cognitive skills but also reflect behavioral differences and
differences in personality and socio-emotional skills.
31
classroom behavior that is rewarded with higher grades by the teacher. Our results suggest that
long-term intervention effects are more likely to operate through changes in socio-emotional skills
rather than cognitive skills.
Figure 6: Treatment Effects on Grades and Admission Test Scores
Note: This figure shows the treatment effect of the PATHS intervention on grades and test scores. The dependent
variable in Panel (a) is a student’s standardized grades in Grade 6. The dependent variable in Panel (b) is the test score
in the centralized admission test for academic high school. Admission to academic high school is possible after Grade
6, 8, and 9. Estimates for admission test scores are based on the score obtained from the first time taking the test.
Grades in primary school correspond to the teacher-given grades obtained before taking the admission test. All
regressions are based on inverse probability weighting, with weights constructed by regressing an indicator for
whether we observe the respective outcome on the full set of controls. We winsorize at the first two percentiles to
avoid negative weights. Each point estimate is shown with the respective 90 and 95 percent confidence intervals
calculated based on standard errors clustered at the school level.

32
7.2 Effects on Socio-Emotional Skills
PATHS aims to foster regulatory behavior, smart decision-making, and emotional understanding.
Given these primary goals, we investigate changes in children’s socio-emotional development as
possible mechanisms of the long-term effects of PATHS on educational trajectories.
We measure children’s socio-emotional development with the Social Behavior
Questionnaire (SBQ), which teachers and parents answer. This questionnaire includes the
following six domains: (1) ADHD symptoms (disruptiveness and impulsiveness), (2) opposition
and defiance, (3) non-aggressive conduct disorder, (4) anxiety and depressivity, (5) aggression,
and (6) prosociality. Each of these domains is measured with up to ten subitems that ask about the
prevalence of a specific behavior.20 For every survey wave, we combine all available responses
from teachers and parents. We do this by first computing the sum of standardized answers to each
subitem domain, then take the average of teacher and parent reports and standardize again to obtain
measures with a mean of zero and a standard deviation of one.
Figure 7 shows the PATHS treatment effect on ADHD symptoms and opposition and
defiance. Panel (a) of Figure 7 shows the evolution of the PATHS treatment effect on ADHD
symptoms (disruptiveness and impulsiveness) over time. PATHS causes children to become more
impulsive and disruptive during the intervention period and persistently less impulsive and
disruptive after the intervention is completed.
Seeing more behavioral problems during the intervention is, at first sight, surprising. This
effect goes against the aim of the intervention. One explanation is that the intervention made
teachers and parents more aware of what appropriate child behavior should look like. This possibly
20 Table B1 in the Appendix provides an overview of the items used in the Social Behavior Questionnaire that
constitute the six different SBQ domains. Answers are recorded on a 5-point Likert scale ranging from (1) “never” to
(5) “very often.”

33
Figure 7: Dynamic Treatment Effects on Socio-Emotional Skills I
Note: This figure shows the treatment effect of the PATHS intervention on children’s socio-emotional skills from
ages 7 through 15. The dependent variable in Panel (a) is ADHD symptoms (disruptiveness and impulsiveness). The
dependent variable in Panel (b) is opposition and defiance. All dependent variables are indices standardized to mean
zero and a standard deviation of one. All models include strata fixed effects for the level of randomization. All models
include controls for baseline child, parental, and household characteristics and baseline child SBQ measures. To
provide evidence on balance across the treatment and the control groups, we do not include individual controls in the
estimation of the treatment effect at age 7. For each SBQ measure, we combine measures from teacher and parent
reports by taking the average of the two standardized indices and standardize the resulting index again. For measures
at ages 10, 12, 13, and 15, we rely solely on teacher reports, as there are no parent surveys at these times. Details on
the SBQ items and construct validity are provided in Appendix B2. Shaded areas indicate the baseline and the
intervention periods. The dashed vertical line shows the time when tracking into secondary schools takes place. Each
point estimate is shown with the respective 90 and 95 percent confidence intervals calculated based on standard errors
clustered at the school level.

34
increased awareness may have made them more critical in the short-run. Consistent with this
interpretation, the PATHS developers provide anecdotal evidence showing that teachers raise their
expectations about children’s appropriate behavior during the intervention.
After the intervention, starting from age 10, we see that PATHS reduces ADHD symptoms
by making children less disruptive and impulsive. At age 10, children were also reassigned to new
classes and new teachers who were not involved in the intervention. From this age, our measures
therefore likely reflect child behavior and development more objectively. The treatment effect
persists until primary school completion, when children are 12 years old, and remains visible at
ages 13 and 15.21
Panel (b) of Figure 7 shows the PATHS treatment effect on opposition and defiance.
Opposition and defiance capture behaviors like telling lies, cheating, or ignoring teachers’
instructions. The overall picture is similar to the treatment effect for ADHD symptoms. PATHS
increases opposition and defiance during the intervention and decreases those behaviors after the
intervention is completed. The treatment effects fade out after children transition to secondary
school.
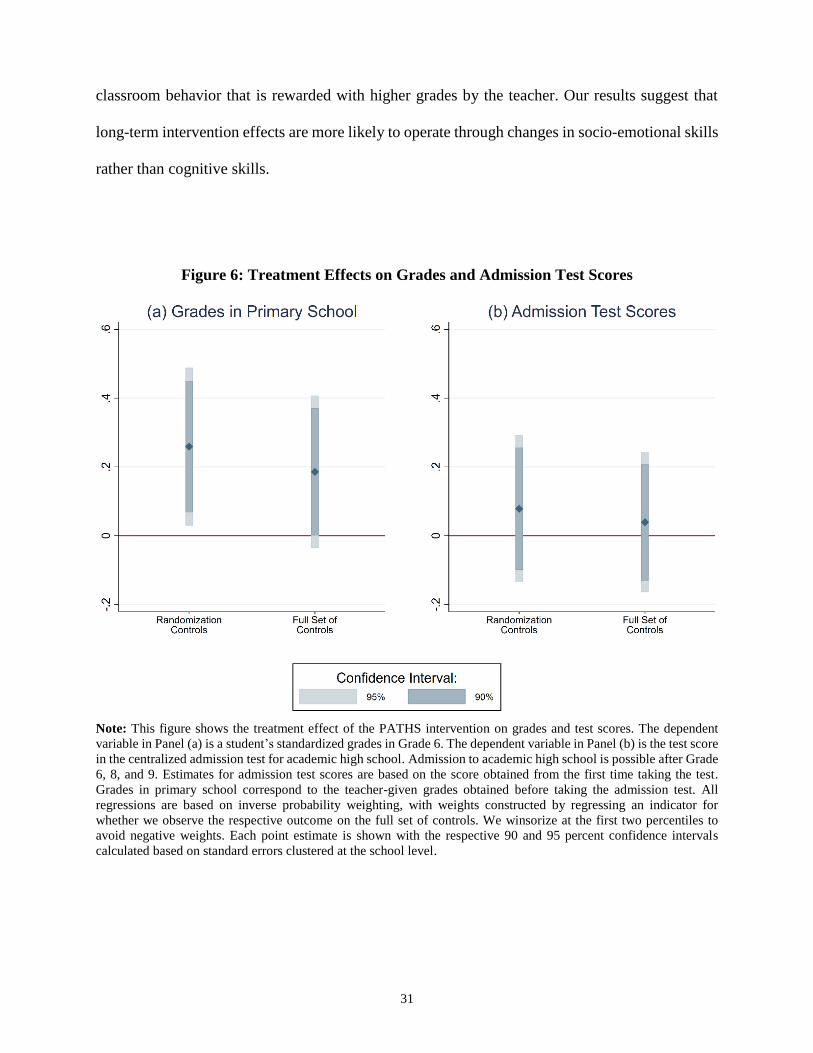
Figure 8 shows the effects of PATHS on non-aggressive conduct behavior (Panel a),
anxiety and depressivity (Panel b), aggression (Panel c), and prosociality (Panel d). PATHS
reduces children’s non-aggressive conduct disorders such as lying, stealing, or destroying other
children’s belongings after the intervention. This effect remains visible until age 11 and fades out
afterward. Anxiety, aggression, and prosociality do not appear to be systematically affected by the
intervention.
21 Appendix Figure A8 reports separate effects for disruptiveness (Panel (a)) and impulsiveness (Panel (b)). The figure
shows that the overall picture is similar for both traits, but perhaps more pronounced for disruptiveness.
35
Figure 8: Dynamic Treatment Effects on Socio-Emotional Skills II
Note: This figure shows the treatment effect of the PATHS intervention on children’s socio-emotional skills from
ages 7 through 15. The dependent variables are non-aggressive conduct disorder (Panel (a)), anxiety and depressivity
(Panel (b)), aggression (Panel (c)), and prosociality (Panel (d)). All dependent variables are indices standardized to
mean zero and a standard deviation of one. All models include strata fixed effects for the level of randomization. All
models include controls for baseline child, parental, and household characteristics and baseline child SBQ measures.
To provide evidence on balance across the treatment and the control groups, we do not include individual controls in
the estimation of the treatment effect at age 7. For each SBQ measure, we combine measures from teacher and parent
reports by taking the average of the two standardized indices and standardize the resulting index again. For measures
at ages 10, 12, 13, and 15, we rely solely on teacher reports, as there are no parent surveys at these times. Details on
the SBQ items and construct validity are provided in Appendix B2. Shaded areas indicate the baseline and the
intervention period. The dashed vertical line shows the time when tracking into secondary schools takes place. Each
point estimate is shown with the respective 90 and 95 percent confidence intervals calculated based on standard errors
clustered at the school level.
7.3 Effects on Parenting Practices
The PATHS training program includes information leaflets for parents and has a substantial
homework component. In these homework assignments, children discuss the curriculum with their

36
parents. The PATHS program therefore may affect parent-child interactions or trigger adjustments
in parenting practices.22
We analyze parenting practices using the Alabama Parenting Questionnaire (APQ) that
captures the following five domains: (1) corporal punishment, (2) parental control and supervision,
(3) inconsistent discipline, (4) parental involvement, and (5) positive parenting. Each domain is
measured with up to ten questions answered by the primary caregiver on a 5-point Likert scale
ranging from “never” to “always.”23 To facilitate comparisons, we standardize each subdomain to
have a mean of zero and a standard deviation of one.
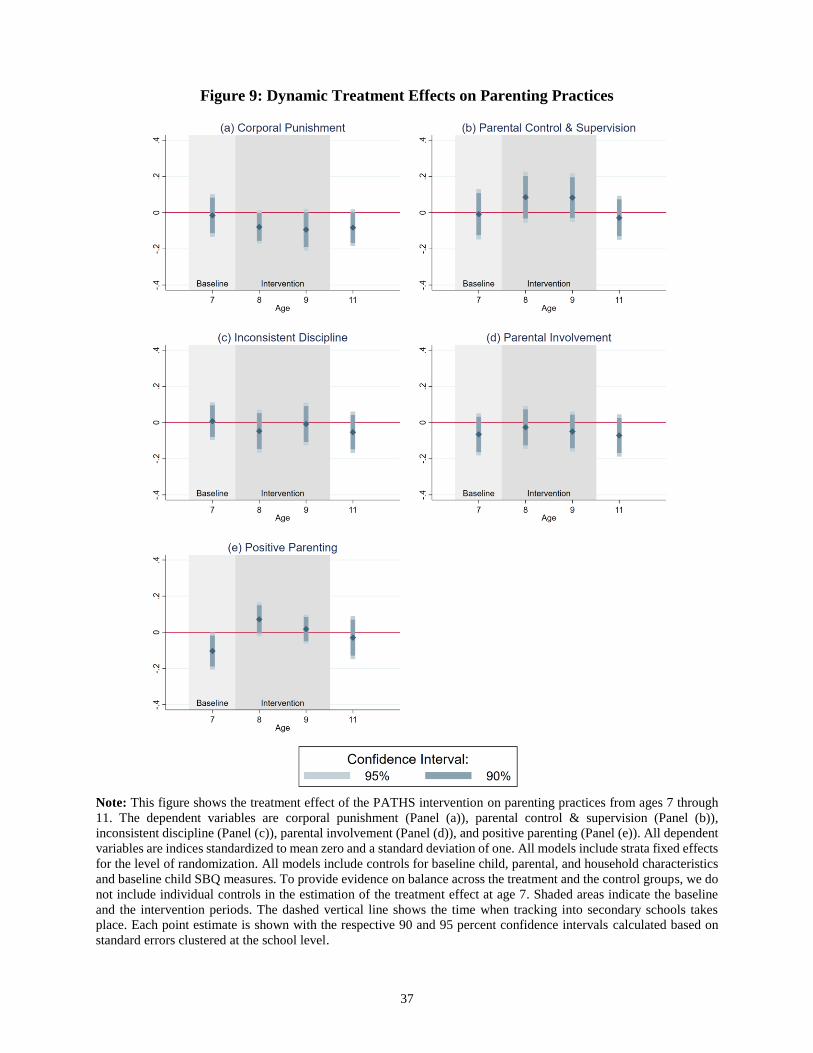
Figure 9 shows the evolution of the PATHS treatment effect on parenting practices over
time. Parents seem to respond to the intervention with less corporal punishment during and right
after the intervention period. When the child is 11 years old, PATHS appears to reduce parents’
hitting and smacking their children by 8.4 percent of a standard deviation. We see no effect on
other parenting practices.
The treatment effect on corporal punishment could be driven by three factors. First,
children exposed to the PATHS program might improve their behavior thereby reducing the
“need” for parental corrective actions. Second, parents might become less impulsive and stop
hitting their kids. Third, parents might feel pressured to report reductions in corporal punishment,
as the PATHS program stresses the importance of non-violent social interactions. Given that
information on smacking, slapping, and hitting is self-reported, how to interpret the effect on
corporal punishment remains ambiguous.
22 Parenting styles and practices may shape child preferences and behavior with effects on children’s education
performance and choices (Doepke and Zilibotti 2017; Doepke, Sorrenti, and Zilibotti 2019). Adjustments in parenting
practices therefore represent a possible mechanism for the observed PATHS treatment effects on educational
outcomes. 23 Appendix Table B3 provides an overview on the survey items used to measure parenting practices. Items remain
the same across surveys conducted in different years.
37
Figure 9: Dynamic Treatment Effects on Parenting Practices
Note: This figure shows the treatment effect of the PATHS intervention on parenting practices from ages 7 through
11. The dependent variables are corporal punishment (Panel (a)), parental control & supervision (Panel (b)),
inconsistent discipline (Panel (c)), parental involvement (Panel (d)), and positive parenting (Panel (e)). All dependent
variables are indices standardized to mean zero and a standard deviation of one. All models include strata fixed effects
for the level of randomization. All models include controls for baseline child, parental, and household characteristics
and baseline child SBQ measures. To provide evidence on balance across the treatment and the control groups, we do
not include individual controls in the estimation of the treatment effect at age 7. Shaded areas indicate the baseline
and the intervention periods. The dashed vertical line shows the time when tracking into secondary schools takes
place. Each point estimate is shown with the respective 90 and 95 percent confidence intervals calculated based on
standard errors clustered at the school level.

38
7.4 Effect on Behavior in Class
In this section, we look at possible intervention effects on school-related behavior. We have
measures on school related-behavior for four different domains: (1) disturbing lessons, (2) being
busy with other things during classes, (3) impertinent school behavior, and (4) neglecting
homework. We observe these outcomes starting from Grade 4, after children are reassigned to new
classes and evaluated by a new teacher. Each domain is measured through a 5-point Likert scale
ranging from “never” to “very often.” To facilitate comparisons, we standardize each subdomain
to have a mean of zero and a standard deviation of one.
Figure 10: Dynamic Treatment Effects on Behavior in Class

39
Note: This figure shows the treatment effect of the PATHS intervention on children’s behavior at school from ages
10 through 15. The dependent variables are disturbing the lesson (Panel (a)), being busy with other things in class
(Panel (b)), impertinent conduct at school (Panel (c)), and neglecting homework (Panel (d)). All dependent variables
are indices standardized to mean zero and a standard deviation of one. All models include strata fixed effects for the
level of randomization. All models include controls for baseline child, parental, and household characteristics and
baseline child SBQ measures. Measures are taken from teacher reports. Shaded areas indicate the baseline and the
intervention periods. The dashed vertical line shows the time when tracking into secondary schools takes place. Each
point estimate is shown with the respective 90 and 95 percent confidence intervals calculated based on standard errors
clustered at the school level.
Figure 10 shows results for school-related behavior. PATHS reduces children’s likelihood
of disturbing lessons by 12.4 percent at age 10. The effect persists throughout secondary education.
We see a similar pattern for children’s ability to focus. Treatment effects are largest immediately
after the intervention at age 10 with an effect equivalent to a reduction of 20.4 percent of a standard
deviation. The effect remains visible after children are tracked. We find no significant treatment
effects for impertinent conduct at school or neglecting homework.
7.5 Mediation Analysis
In this section, we perform a mediation analysis in the spirit of Gelbach (2016). This analysis
provides insights on the relative importance of different mechanisms (mediators) in shaping the
PATHS treatment effect on the education outcomes. This analysis allows us to quantify the
proportion of the treatment effect mediated by all our proposed mechanisms and to separate the
contribution of each single mechanism to the estimated treatment effect.
The results of the mediation analysis should be interpreted with caution. Imai, Keele, and
Tingley (2010) show to be able to interpret this type of analysis causally one needs to make strong
assumptions about the source of variation of the mediators. Despite these limitations, we believe
that this analysis is helpful to see whether the mechanism we study explain treatment effects.

40
We perform the mediation analysis for the following education outcomes: attendance of
academic high school at ages 13, 15, and 17, academic high school completion, and university
enrollment at age 20. As possible mediators, we focus on socio-emotional skills, parenting
practices and classroom behavior.24 We assume that the PATHS treatment has both direct and
indirect effects on education outcomes. The indirect effects run through treatment effects of the
intervention on socio-emotional skills, parenting practices, and classroom behavior. The results of
the mediation analysis will give us an estimate of the importance of these indirect effects.
Panel (a) of Figure 11 shows the results of the mediation analysis.25 Each horizontal bar
represents a specific outcome of interest. Colored areas within the bars illustrate the contribution
of each mediator to the overall treatment effect. The grey area stands for the unexplained share of
the treatment effect. The mediation analysis highlights that our candidate mechanisms explain
about 20–26 percent of the treatment effect. Among the mechanisms we study, socio-emotional
skills appear as the most important mediator of the PATHS treatment effect. For example, socio-
emotional skills explain about 25 percent of the PATHS treatment effect on university attendance
at age 20. The contribution of parenting practices and classroom behavior are smaller and less
stable across different outcomes, suggesting that these are not important mechanisms.
24 The set of mediators includes all variables analyzed as potential mechanisms in Sections 7 except grades and test
scores because these variables are only available for a subsample of students that sit the standardized academic high
school admission test. For the sake of readability, we aggregate all candidate mechanisms into three domains: (1)
socio-emotional skills, (2) parenting practices, (3) and classroom behavior. Given the longitudinal nature of our data,
we only consider measures obtained after the intervention and before the educational outcome is measured. In cases
in which we have multiple observations for the same mediator, we construct a summary index using the covariance
weighting procedure discussed in Anderson (2008). 25 We perform the mediation analysis by decomposing the treatment effect obtained from estimates of the
unconditional outcome equation 𝑌𝑖 = 𝛽1 PATHSi + 𝑋𝑖′𝛾 + 𝜃 + 𝜀𝑖 (Equation 1) in the following way:
𝑑𝑌
𝑑𝑃𝐴𝑇𝐻𝑆= ∑
𝜕𝑌
𝜕𝑀
𝜕𝑀
𝜕𝑃𝐴𝑇𝐻𝑆+ 𝑅, where 𝑌 is the outcome, 𝑃𝐴𝑇𝐻𝑆 is the treatment indicator, 𝑀 is a vector of 𝑘 mediators,
and 𝑅 is the unexplained part of the treatment effect. We estimate two additional specifications. First, we estimate the
conditional outcome equation augmented with the vector 𝑀: 𝑌𝑖 = 𝛽2 PATHSi + 𝑀𝑖𝜑 + 𝑋𝑖′𝛾 + 𝜃 + 𝜖𝑖. Second, we
separately estimate the treatment effect of the intervention on each mediator 𝑗 ∈ 𝑘: 𝑀𝑖𝑗
= 𝛽3𝑗PATHSi + 𝑋𝑖
′𝛾 + 𝜃 + 𝑣𝑖 .
The contribution of each mediator 𝑗 ∈ 𝑘 is then computed as the ratio 𝜑𝑗 ×𝛽3
𝑗
𝛽1. The unexplained part, 𝑅, results from
𝑅 = 1 − ∑𝜑𝑗 ×𝛽3
𝑗
𝛽1
𝑘𝑗=1 .
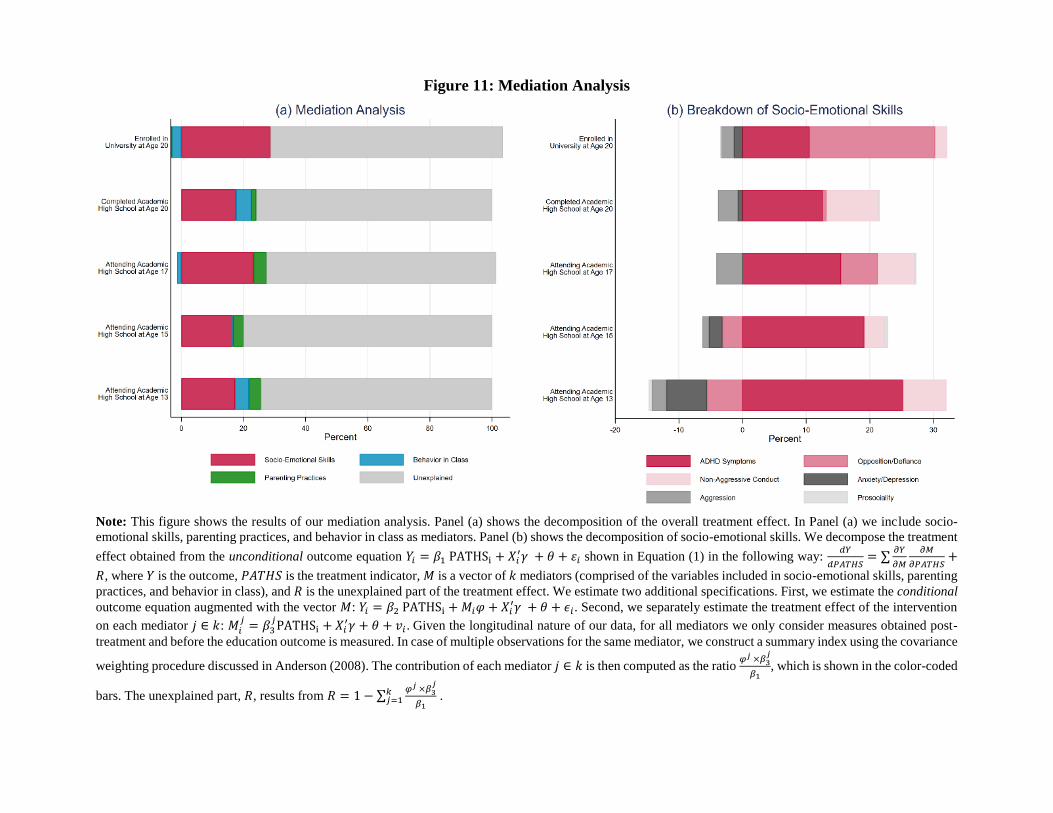
Figure 11: Mediation Analysis
Note: This figure shows the results of our mediation analysis. Panel (a) shows the decomposition of the overall treatment effect. In Panel (a) we include socio-
emotional skills, parenting practices, and behavior in class as mediators. Panel (b) shows the decomposition of socio-emotional skills. We decompose the treatment
effect obtained from the unconditional outcome equation 𝑌𝑖 = 𝛽1 PATHSi + 𝑋𝑖′𝛾 + 𝜃 + 𝜀𝑖 shown in Equation (1) in the following way:
𝑑𝑌
𝑑𝑃𝐴𝑇𝐻𝑆= ∑
𝜕𝑌
𝜕𝑀
𝜕𝑀
𝜕𝑃𝐴𝑇𝐻𝑆+
𝑅, where 𝑌 is the outcome, 𝑃𝐴𝑇𝐻𝑆 is the treatment indicator, 𝑀 is a vector of 𝑘 mediators (comprised of the variables included in socio-emotional skills, parenting
practices, and behavior in class), and 𝑅 is the unexplained part of the treatment effect. We estimate two additional specifications. First, we estimate the conditional
outcome equation augmented with the vector 𝑀: 𝑌𝑖 = 𝛽2 PATHSi + 𝑀𝑖𝜑 + 𝑋𝑖′𝛾 + 𝜃 + 𝜖𝑖. Second, we separately estimate the treatment effect of the intervention
on each mediator 𝑗 ∈ 𝑘: 𝑀𝑖𝑗
= 𝛽3𝑗PATHSi + 𝑋𝑖
′𝛾 + 𝜃 + 𝑣𝑖 . Given the longitudinal nature of our data, for all mediators we only consider measures obtained post-
treatment and before the education outcome is measured. In case of multiple observations for the same mediator, we construct a summary index using the covariance
weighting procedure discussed in Anderson (2008). The contribution of each mediator 𝑗 ∈ 𝑘 is then computed as the ratio 𝜑𝑗 ×𝛽3
𝑗
𝛽1, which is shown in the color-coded
bars. The unexplained part, 𝑅, results from 𝑅 = 1 − ∑𝜑𝑗 ×𝛽3
𝑗
𝛽1
𝑘𝑗=1 .
42
Given the important mediating role of socio-emotional skills, we investigate the
contribution of each of the following six separate skills: opposition and defiance, non-aggressive
conduct disorder, anxiety and depressivity, aggression, and prosociality and ADHD symptoms.
Panel (b) of Figure 11 shows the results of this mediation analysis. The main mediator is reduction
of ADHD symptoms. This variable explains up to 25 percent of the PATHS treatment effect on
educational outcomes. The relative importance of its mediating role is similar across outcomes and
does not depend on the children’s age. Non-aggressive conduct disorders and opposition/defiance
are also relevant mediators, but quantitatively less important. Their mediating role is also less stable
over time. The remaining socio-emotional skills seem to have a negligible role as mediators
(prosociality) or have a negative load as mediators (anxiety and aggression).
Taken together, the mediation analysis described in this section suggests that the PATHS
treatment effect on educational outcomes is driven by treatment-induced improvements in
children’s socio-emotional skills, in particular, by reductions in ADHD symptoms – impulsiveness
and disruptiveness.
8. Comparison of Costs, Benefits, and Previous Evaluations
In this section, we contextualize the main results of this study. We start with the discussion of other
randomized control trials (RCTs) that evaluated the PATHS program. These studies focus on the
short-term effects of PATHS on behavioral outcomes and do not analyze the long-term impacts.
We then compare the size of the treatment effects and the cost of PATHS to related childhood
interventions.
8.1 Previous Evaluations of PATHS
A few studies have evaluated the short-term effects of PATHS in settings where the program was
randomly assigned. These studies suggest that PATHS improves socio-emotional skills, improves
43
academic performance, and reduces aggressive behavior. Greenberg et al. (1995) show that PATHS
increases vocabulary and emotional intelligence of second and third grade children in the United
States. Schonfeld et al. (2015) find similar results and show that PATHS improves reading and
math proficiency in primary school. This effect, however, disappears two years after the
intervention. Crean and Johnson (2013) examine the effect of PATHS on US elementary school
students’ aggressive behavior and find lower levels of aggressive behavior for treated students. The
effect persists over two years after the intervention. Kam, Greenberg and Kusché (2004) evaluate
PATHS in a sample of children with special needs living in the United States. They find positive
effects on externalizing and internalizing behavior and reduced self-reported depressivity three
years after the intervention. Riggs et al. (2006) that show that PATHS fosters inhibitory control
and leads to less disruptive behavior. While some of the results of previous evaluations are
consistent with our evidence on underlying mechanisms, we find no evidence that the intervention
reduced physical aggression in our setting.
8.2 Comparison of Effect Size and Costs of Similar Interventions
In this section, we benchmark our intervention to similar interventions affecting educational
outcomes and targeting child development. Figure 12 illustrates differences in effect sizes across
studies. In our setting, PATHS increases children’s probability of completing academic high school
by 23 percent. This effect size is comparable to effects of other interventions. The Montreal
Longitudinal Study social skills training program increases the probability of completing high
school by 13 to 18 percent (Boisjoli et al. (2007); Algan et al. 2016). The Becoming a Man
intervention forecasts treatment effects of 12 to 19 percent on high school completion (Heller et al.
2017). The Pathways mentoring and tutoring program increases high school completion by 35
percent (Oreopoulos et al. 2017). The Baloo and You mentoring program increases the probability
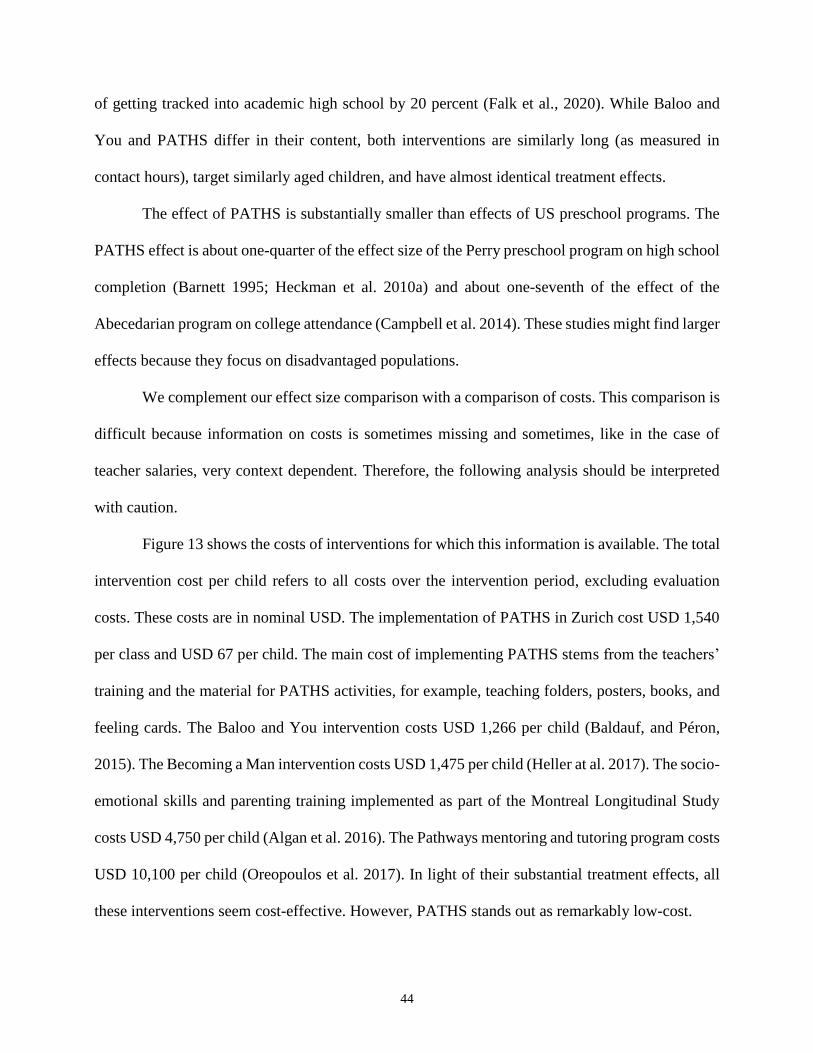
44
of getting tracked into academic high school by 20 percent (Falk et al., 2020). While Baloo and
You and PATHS differ in their content, both interventions are similarly long (as measured in
contact hours), target similarly aged children, and have almost identical treatment effects.
The effect of PATHS is substantially smaller than effects of US preschool programs. The
PATHS effect is about one-quarter of the effect size of the Perry preschool program on high school
completion (Barnett 1995; Heckman et al. 2010a) and about one-seventh of the effect of the
Abecedarian program on college attendance (Campbell et al. 2014). These studies might find larger
effects because they focus on disadvantaged populations.
We complement our effect size comparison with a comparison of costs. This comparison is
difficult because information on costs is sometimes missing and sometimes, like in the case of
teacher salaries, very context dependent. Therefore, the following analysis should be interpreted
with caution.
Figure 13 shows the costs of interventions for which this information is available. The total
intervention cost per child refers to all costs over the intervention period, excluding evaluation
costs. These costs are in nominal USD. The implementation of PATHS in Zurich cost USD 1,540
per class and USD 67 per child. The main cost of implementing PATHS stems from the teachers’
training and the material for PATHS activities, for example, teaching folders, posters, books, and
feeling cards. The Baloo and You intervention costs USD 1,266 per child (Baldauf, and Péron,
2015). The Becoming a Man intervention costs USD 1,475 per child (Heller at al. 2017). The socio-
emotional skills and parenting training implemented as part of the Montreal Longitudinal Study
costs USD 4,750 per child (Algan et al. 2016). The Pathways mentoring and tutoring program costs
USD 10,100 per child (Oreopoulos et al. 2017). In light of their substantial treatment effects, all
these interventions seem cost-effective. However, PATHS stands out as remarkably low-cost.

45
Figure 12: Effect Size Comparison to Other Interventions
Note: This figure shows treatment effect sizes for (academic) high school completion of different interventions in the
related literature. The figure distinguishes between academic high school completion in Germany and Switzerland
(Panel (a)) and high school completion in the United States and Canada (Panel (b)). The effect size for the Baloo and
You program is reported in Falk et al. (2020). The effect size of the Perry Preschool Program is reported in Heckman
et al. (2010). The intervention effect size of the Montreal Longitudinal Study is reported in Algan et al. (2016). The
effect size for the Becoming a Man intervention represents the midpoint of the range of 12 to 19 percent as provided
in Heller et al. (2017). The effect size of the Pathways program is reported in Oreopoulos et al (2017).
PATHS is also substantially less expensive than early childhood education programs like
the Perry Preschool Program or the Abecedarian project. The Perry Preschool Program costs USD
10,000 per child (Web-Appendix of Heckman et al. 2010b). The Abecedarian program costs USD
13,400 per child (Campbell et al. 2014). These striking cost differences reflect that the Perry

46
Preschool Program and the Abecedarian program are high-intensity interventions targeted at
particularly disadvantaged populations.
To summarize, the comparison of effect sizes and costs suggests that PATHS is a low-cost
intervention with substantial positive impacts. Our results suggest that embedding socio-emotional
skills training programs as a general part of the standard primary school curriculum is a good
investment.
Figure 13: Cost Comparison with Other Interventions
Note: This figure shows the cost per treated child of different interventions in the related literature. Cost estimates for
the Becoming a Man, the Montreal Longitudinal Study, and the Carolina Abecedarian Projects intervention are taken
from Heller at al. (2017), Algan et al. (2016), and Campell (2014), respectively. Costs of the Perry Preschool Program
are taken from the web appendix of Heckman et al. (2011). Cost estimates of the Baloo and You intervention in Germany
are based on Baldauf and Péron (2015). Costs of the Pathways program are reported in Oreopoulos et al (2017).
47
9. Conclusion
This paper provides experimental evidence that fostering socio-emotional skills in primary school
children has persistent positive effects on educational careers. We provide evidence on the PATHS
program, a teacher-run intervention that lasts for up to two years in primary school. The
intervention increases the probability of completing academic high school and enrolling in
university twelve years after the end of the intervention.
Our results on underlying mechanisms suggest that the PATHS treatment effect is mainly
driven by changes in some of the socio-emotional skills targeted by the intervention. Treated
children become less impulsive, less disruptive, and display less opposition to teachers and parents.
In class, treated children become less likely to disturb lessons and more likely to focus on the
teaching content. Although we find that treated children have better grades, we find no evidence
that standardized test scores are affected by the intervention. Long-term effects thus seem more
likely to operate through changes in socio-emotional skills rather than cognitive skills.
This paper has two main limitations. The first limitation concerns the general equilibrium
effects of the intervention. It is not clear whether we would observe the same treatment effects on
tracking if the entire population were treated. Academic high schools have capacity constraints and
there is a strong belief in Switzerland that these schools should remain selective. It is therefore
unclear whether a nationwide roll-out of the program would persistently increase overall university
enrollment. The second limitation concerns the external validity of our results outside the Swiss
context. While over 60 percent of OECD countries use tracking policies similar to Switzerland’s,
it is unclear how much of the long-term effects we document are due to children being tracked only
three years after the intervention. Despite these limitations, we think that the reduction in ADHD
symptoms, and improvements in classroom behavior and other socio-emotional skills are valuable
by themselves. Students, parents, and teachers benefit from these changes independently of

48
whether they lead students to a higher secondary school track. We hope that future studies will
provide evidence on the labor market returns caused by the changes in socio-emotional skills we
document in this paper.
Taken together, the results of this study raise an interesting question. Would it be possible
to teach children socio-emotional skills with a subject that is explicitly dedicated to it, similar to
the way math and reading are taught? While it has been shown that teachers have lasting impacts
on behavior (Chetty el al. 2011, Jackson 2018), there is no school subject explicitly designed to
foster socio-emotional skills. The results of this study suggest that primary schools are a promising
place to institutionalize the training of socio-emotional skills.

49
References
Alan, S., Boneva, and T., Ertac, S. (2019), “Ever Failed, Try Again, Succeed Better: Results from
a Randomized Educational Intervention on Grit,” Quarterly Journal of Economics, 134(3),
1121–1162.
Alan, S., and Ertac, S. (2018), “Fostering Patience in the Classroom: Results from a Randomized
Educational Intervention,” Journal of Political Economy, 126 (5), 1865–1911.
Algan Y., Beasley E., Tremblay R. E., and Vitaro, F. (2016), “The Impact of Non-Cognitive Skills
Training on Academic and Nonacademic Trajectories: From Childhood to Early Adulthood,”
Unpublished Manuscript.
Almlund, M., Duckworth, A. L., Heckman, J., and Kautz, T. (2011), “Personality Psychology and
Economics,” in Handbook of the Economics of Education vol. 4, E. A. Hanushek, S. J.
Machin, and L. Woessmann, eds. (Elsevier, 2016), 1–181.
Altonji, J. G., Elder, T. E., and Taber, C. R. (2005), “Selection on Observed and Unobserved
Variables: Assessing the Effectiveness of Catholic Schools,” Journal of Political Economy,
113(1), 151–184.
Anderson, M. L. (2008), “Multiple Inference and Gender Differences in the Effects of Early
Intervention: A Reevaluation of the Abecedarian, Perry Preschool, and Early Training
Projects,” Journal of the American Statistical Association, 103(484), 1481–1495.
Averdijk, M., Zirk-Sadowski, J., Ribeaud, D., and Eisner, M. (2016), “Long-Term Effects of Two
Childhood Psychosocial Interventions on Adolescent Delinquency, Substance Use, and
Antisocial Behavior: A Cluster Randomized Controlled Trial,” Journal of Experimental
Criminology, 12(1), 21–47.
Baldauf, V., and Péron, C. (2015), “Was Bringt’s? SROI-Analyse des Mentoring-Programms Balu
und du. Technical Report,” URL: https://www.eleven.ngo/content/2-blog/86-was-bringts-sroi-
analyse-des-mentoring-programms-balu-und-du-liegt-vor/sroi-bericht-bud-final-
17feb2015.pdf (visited on 26 November 2019).
Barnett, W. S. (1995), “Long-Term Effects of Early Childhood Programs on Cognitive and School
Outcomes,” Future of Children, 25–50.
Barrick, M. R., and Mount, M. K. (1991), “The Big Five Personality Dimensions and Job
Performance: A Meta‐Analysis,” Personnel Psychology, 44(1), 1–26.

50
Boisjoli, R., Vitaro, F., Lacourse, É., Barker, E. D., and Tremblay, R. E. (2007), “Impact and
Clinical Significance of a Preventive Intervention for Disruptive Boys: 15-year Follow-Up,”
British Journal of Psychiatry, 191(5), 415–419.
Blewitt, C., Fuller-Tyszkiewicz, M., Nolan, A., Bergmeier, H., Vicary, D., Huang, T., McCabe, P.,
McKay, T., and Skouteris, H. (2018), “Social and Emotional Learning Associated With
Universal Curriculum-Based Interventions in Early Childhood Education and Care Centers: A
Systematic Review and Meta-Analysis”, JAMA Network Open, 1(8), e185727.
Borghans, L., Golsteyn, B. H., Heckman, J. J., and Humphries, J. E. (2016), “What Grades and
Achievement Tests Measure,” Proceedings of the National Academy of Sciences, 113(47),
13354–13359.
Campbell, F. A., Conti, G., Heckman, J. J., Moon, S. H., Pinto, R., Pungello, E., and Pan, Y. (2014),
“Early Childhood Investments Substantially Boost Adult Health,” Science, 343(6178), 1478–
1485.
Campbell, F. A., Ramey, C. T., Pungello, E., Sparling, J., and Miller-Johnson, S. (2002), “Early
Childhood Education: Young Adult Outcomes from the Abecedarian Project,” Applied
Developmental Science, 6(1), 42–57.
Cappelen, A., List, J. A., Samek, A., and Tungodden, B. (Forthcoming), “The Effect of Early
Education on Social Preferences,” Journal of Political Economy.
Chetty, R., Friedman, J. N., Hilger, N., Saez, E., Schanzenbach, D. W., and Yagan, D. (2011),
“How Does Your Kindergarten Classroom Affect Your Earnings? Evidence from Project
STAR,” Quarterly Journal of Economics, 126(4), 1593–1660.
Crean, H. F., and Johnson, D. B. (2013), “Promoting Alternative Thinking Strategies (PATHS) and
Elementary School Aged Children’s Aggression: Results from a Cluster Randomized Trial,”
American Journal of Community Psychology, 52(1-2), 56–72.
Deming, D. J. (2017), “The Growing Importance of Social Skills in the Labor Market,” Quarterly
Journal of Economics, 132(4), 1593–1640.
Doepke, M., and Zilibotti, F. (2017), “Parenting with Style: Altruism and Paternalism in
Intergenerational Preference Transmission,” Econometrica, 85(5), 1331–1371.
Doepke, M., Sorrenti, G., and Zilibotti, F. (2019), “The Economics of Parenting,” Annual Review
of Economics, 11, 55–84.
Doyle, O. (Forthcoming), “The First 2,000 Days and Child Skills,” Journal of Political Economy.

51
Durlak, J. A., Weissberg, R. P., Dymnicki, A. B., Taylor, R. D., and Schellinger, K. B. (2011),
“The Impact of Enhancing Students’ Social and Emotional Learning: A Meta‐Analysis of
School‐Based Universal Interventions,” Child Development, 82(1), 405–432.
Eisner, M., Nagin, D., Ribeaud, D., and Malti, T. (2012), “Effects of a Universal Parenting Program
for Highly Adherent Parents: A Propensity Score Matching Approach,” Prevention Science,
13(3), 252–266.
Eisner, M., Malti, T., and Ribeaud, D. (2011), “Large-Scale Criminological Field Experiments.
The Zurich Project on the Social Development of Children,” in SAGE Handbook of
Criminological Research Methods, D. Gadd, S. Karstedt, and S. F. Messner eds. (London:
Sage Publications), 410–424.
Eisner, M., Ribeaud, D., Jünger, R., and Meidert, U. (2007), Frühprävention von Gewalt und
Aggression. Ergebnisse des Zürcher Präventions-und Interventionsprojektes an Schulen
(Zürich, Chur).
Falk A., Kosse F., Pinger P., and Schildberg-Hörisch H. (2020), “(In)Equality of Opportunity,
Mentoring, and Critical Educational Decisions,” Unpublished Manuscript.
Fantuzzo, J., Bulotsky-Shearer, R., McDermott, P., McWayne, C., Frye, D., and Perlman, S.
(2007), “Investigation of Dimensions of Social-Emotional Classroom Behavior and School
Readiness for Low-Income Urban Preschool Children,” School Psychology Review, 36(1), 44–
62.
Gelbach, J. B. (2016), “When Do Covariates Matter? And Which Ones, and How Much?”
Journal of Labor Economics, 34(2), 509–543.
Gertler, P., Heckman, J., Pinto, R., Zanolini, A., Vermeersch, C., Walker, S., Chang, S. M., and
Grantham-McGregor, S. M. (2014), “Labor Market Returns to an Early Childhood Stimulation
Intervention in Jamaica,” Science, 344(6187), 998–1001.
Grantham-McGregor, S. M., Walker, S. P., Chang, S. M., and Powell, C. A. (1997), “Effects of
Early Childhood Supplementation With and Without Stimulation on Later Development in
Stunted Jamaican Children,” American Journal of Clinical Nutrition, 66(2), 247–253.
Greenberg, M. T., and Kusche, C. A. (1993), Promoting Social and Emotional Development in
Deaf Children: The PATHS Project (University of Washington Press, 1993).

52
Greenberg, M. T., Kusché, C. A., Cook, E. T., and Quamma, J. P. (1995), “Promoting Emotional
Competence in School-Aged Children: The Effects of the PATHS Curriculum,” Development
and Psychopathology, 7(1), 117–136.
Greenberg, M. T., Kusché, C. A., Mihalic, S. F., and Elliott, D. (1998), Blueprints for Violence
Prevention: Book Ten: Promoting Alternative Thinking Strategies (Boulder, CO: Center for
the Prevention of Violence).
Heckman, J. J., and Karapakula, G. (2019a). Intergenerational and Intragenerational Externalities
of the Perry Preschool Project. National Bureau of Economic Research WP 25889.
Heckman, J. J., and Karapakula, G. (2019b), “The Perry Preschoolers at Late Midlife: A Study in
Design-Specific Inference,” National Bureau of Economic Research Working Paper.
Heckman, J., Moon, S. H., Pinto, R., Savelyev, P., and Yavitz, A. (2010a), “Analyzing Social
Experiments as Implemented: A Reexamination of the Evidence from the High Scope Perry
Preschool Program,” Quantitative Economics, 1(1), 1–46.
Heckman, J. J., Moon, S. H., Pinto, R., Savelyev, P. A., and Yavitz, A. (2010b), “The Rate of
Return to the High Scope Perry Preschool Program,” Journal of Public Economics, 94(1–2),
114–128.
Heckman, J. J., and Rubinstein, Y. (2001), “The Importance of Noncognitive Skills: Lessons from
the GED Testing Program,” American Economic Review, 91(2), 145–149.
Heller, S. B., Shah, A. K., Guryan, J., Ludwig, J., Mullainathan, S., and Pollack, H. A. (2017),
“Thinking, Fast and Slow? Some Field Experiments to Reduce Crime and Dropout in
Chicago,” Quarterly Journal of Economics, 132(1), 1–54.
Imai, K., Keele, L., and Tingley, D. (2010), “A General Approach to Causal Mediation Analysis,”
Psychological Methods, 15(4), 309–344.
Izard, C. E., Trentacosta, C. J., King, K. A., and Mostow, A. J. (2004), “An Emotion-Based
Prevention Program for Head Start Children,” Early Education & Development, 15(4), 407–
422.
Jackson, C. K. (2018), “What Do Test Scores Miss? The Importance of Teacher Effects on Non–
Test Score Outcomes,” Journal of Political Economy, 126(5), 2072–2107.
Kam, C. M., Greenberg, M. T., and Kusché, C. A. (2004), “Sustained Effects of the PATHS
Curriculum on the Social and Psychological Adjustment of Children in Special Education,”
Journal of Emotional and Behavioral Disorders, 12(2), 66–78.

53
Kosse, F., Deckers, T., Pinger, P. R., Schildberg-Hörisch, H., and Falk, A. (2020), “The Formation
of Prosociality: Causal Evidence on the Role of Social Environment,” Journal of Political
Economy, 128(2), 434–467.
Kusché, C. A. and Greenberg M. T. (1994). The PATHS Curriculum. Seattle: Developmental
Research and Programs.
Malti, T., Ribeaud, D., and Eisner, M. P. (2011), “The Effectiveness of Two Universal Preventive
Interventions in Reducing Children's Externalizing Behavior: A Cluster Randomized
Controlled Trial,” Journal of Clinical Child & Adolescent Psychology, 40(5), 677–692.
Malti, T., Ribeaud, D., and Eisner, M. (2012), “Effectiveness of a Universal School-Based Social
Competence Program: The Role of Child Characteristics and Economic Factors,” International
Journal of Conflict and Violence, 6(2), 249–259.
Murray, A. L., Booth, T., Eisner, M., Ribeaud, D., McKenzie, K., and Murray, G. (2019), “An
Analysis of Response Shifts in Teacher Reports Associated with the Use of a Universal School-
Based Intervention to Reduce Externalizing Behavior,” Prevention Science, 20(8), 1265–1273.
Murray, A., Eisner, M., Obsuth, I., and Ribeaud, D. (2019), “Evaluating Longitudinal Invariance
in Dimensions of Mental Health Across Adolescence: An Analysis of the Social Behavior
Questionnaire,” Assessment, 26(7), 1234–1245.
Noftle, E. E., & Robins, R. W. (2007), “Personality Predictors of Academic Outcomes: Big Five
Correlates of GPA and SAT Scores,” Journal of Personality and Social Psychology, 93(1),
116.
OECD (2004), “Learning for Tomorrow's World: First Results from PISA 2003,” OECD
Publishing.
Oreopoulos, P., Brown, R. S., & Lavecchia, A. M. (2017), Pathways to Education: An Integrated
Approach to Helping At-Risk High School Students. Journal of Political Economy, 125(4),
947–984.
Raver, C. C., Jones, S. M., Li-Grining, C., Zhai, F., Bub, K., and Pressler, E. (2011), CSRP’s
Impact on Low-Income Preschoolers’ Preacademic Skills: Self-Regulation as a Mediating
Mechanism,” Child Development, 82(1), 362–378.
Ray, D., ⓡ Robson, A. (2018), “Certified Random: A New Order for Coauthorship,” American
Economic Review, 108(2), 489–520.
54
Roberts, B. W., Kuncel, N. R., Shiner, R., Caspi, A., and Goldberg, L. R. (2007), “The Power of
Personality: The Comparative Validity of Personality Traits, Socioeconomic Status, and
Cognitive Ability for Predicting Important Life Outcomes,” Perspectives on Psychological
Science, 2(4), 313–345.
Riggs, N. R., Greenberg, M. T., Kusché, C. A., and Pentz, M. A. (2006), “The Mediational Role
of Neurocognition in the Behavioral Outcomes of a Social-Emotional Prevention Program in
Elementary School Students: Effects of the PATHS Curriculum,” Prevention Science, 7(1),
91–102.
Sanders, M. R. (1999), “Triple P-Positive Parenting Program: Towards an Empirically Validated
Multilevel Parenting and Family Support Strategy for the Prevention of Behaviour and
Emotional Problems in Children,” Clinical Child and Family Psychology Review, 2, 71–89.
Schonfeld, D. J., Adams, R. E., Fredstrom, B. K., Weissberg, R. P., Gilman, R., Voyce, C., Tomlin,
R., and Speese-Linehan, D. (2015), “Cluster-Randomized Trial Demonstrating Impact on
Academic Achievement of Elementary Social-Emotional Learning,” School Psychology
Quarterly, 30(3), 406–420.
Schweinhart, L. J. (1993), “Significant Benefits: The High/Scope Perry Preschool Study through
Age 2,” in Monographs of the High/Scope Educational Research Foundation vol. 10, L. J.
Schweinhart, and D. P. Weikart, eds. (Ypsilanti: MI, 1993).
Shelton, K. K., Frick, P. J., and Wootton, J. (1996), “Assessment of Parenting Practices in Families
of Elementary School-Age Children,” Journal of Clinical Child Psychology, 25(3), 317–
329.
Taylor, R. D., Oberle, E., Durlak, J. A., and Weissberg, R. P. (2017), “Promoting Positive Youth
Development Through School‐Based Social and Emotional Learning Interventions: A
Meta‐Analysis of Follow‐Up Effects,” Child Development, 88(4), 1156–1171
Tremblay, R. E., Loeber, R., Gagnon, C., Charlebois, P., Larivée, S., and LeBlanc, M. (1991),
“Disruptive Boys with Stable and Unstable High Fighting Behavior Patterns During Junior
Elementary School,” Journal of Abnormal Child Psychology, 19(3), 285–300.
Vazsonyi, A. T., Pickering, L. E., Junger, M., and Hessing, D. (2001), “An Empirical Test of a
General Theory of Crime: A Four-Nation Comparative Study of Self-Control and the
Prediction of Deviance,” Journal of Research in Crime and Delinquency, 38(2), 91–131.

55
Wooldridge, J. M. (2007), “Inverse Probability Weighted Estimation for General Missing Data
Problems,” Journal of Econometrics, 141(2), 1281–1301.
Young, A. (2018), “Channeling Fisher: Randomization Tests and the Statistical Insignificance of
Seemingly Significant Experimental Results,” Quarterly Journal of Economics, 134(2), 557–
598.

56
Tables
Table I: PATHS Activities
Activity
Category
Example Activities
Class Activity: Homework: Parental Involvement:
Self-Control;
Patience
Calming down: Teacher discusses various
methods to calm down with class. Teacher
reads aloud story of a girl that learned how to
control herself.
Teasing: Children learn to ignore people that
tease in a mean way. Children make role-plays
to learn how to interpret and handle teasing.
Calming down: Children
write what their parents do,
when they have a problem
or want to calm down.
Calming down: Children
ask their parents about
situations where they had to
calm down and had to think
about a possible solution.
Social
Problem
Solving
Control signals: Children learn the three steps
of problem solving:
1. Calm down and express own feelings.
2. Think about possible solutions and their
consequences.
3. Try your plan and evaluate it.
Children make role-plays to practice the
problem solving steps.
Problem pot: If children have problems, they
can write them down and put them in the
problem pot. The class will then try to solve
these problems with the help of the control
signals and role-playing.
Generosity: Class plans a project to somehow
help others (e.g. raise money or clean up
neighborhood)
Control signals: Children
have to make their own
control signals.
Generosity: Children
should do something good
to a person and draw/write
about it.
Control signals: Parents
receive an explanation
about when and how they
could use the control
signals.
Self-Esteem Child-of-the-week: In each PATHS lecture a
child is randomly picked to be the teacher’s
assistant during the lecture. Further, the other
children make a list of compliments for the
child-of-the-week. Before that, the children
learn about how to compliment another person.
Compliments: Children
have to give compliments to
other members of their
families and reflect on how
they felt giving
compliments and how the
other person reacted.
Child-of-the-week/
compliments: Parents are
informed that their child is
the child-of-the-week. They
go through the list of
compliments with their
child and add compliments.
Emotional
Intelligence
Emotions: Children get introduced to and
discuss various emotions. Teacher tells a story
about or shows picture of people, and children
have to guess how the person in the story/in the
picture felt in this situation. Child choses an
emotion and the other children try to mimic the
emotion.
Emotions: Children draw a
picture or write about a
situation in which they felt
a certain emotion.
Emotions/appropriate
behavior: Children ask
their parents or other adults
to tell them about a
situation in which they felt
a certain emotion and how
they behaved.

57
Table I: PATHS Activities (continued)
Emotional
Intelligence
(Continued)
Feelings cards: Children receive cards
with faces expressing different
emotions. Children can place a card on
their table to express their current
emotional state.
Appropriate behavior: Children are
given drawings of children behaving out
of an emotion (e.g. anger). They then
have to color the drawings in which they
think the behavior is appropriate.
Fairness
Rules
Classroom rules: Children discuss with
teacher why rules are useful and
establish a set of rules for their
classroom.
Making friends: Teacher reads aloud
story to class about two children
becoming friends. After, discussion and
role-play about friendship and making
friends.
Listening to others: In groups, children
learn to listen to each other to gather
information about the members of their
group.
Manners: Classroom discussion about
good/bad manners and why good
manners are important. Children gather
polite phrases and expressions. Teacher
reads a story and children have to decide
in each situation whether the teacher
reads the polite or impolite version.
Afterwards, children reenact the
situation.
Fairness: Teacher introduces poster
with principles of fair behavior.
Children hear stories/get worksheet with
different situations and discuss in groups
whether the displayed behavior is fair or
not. Children establish ideas on how to
make fair decisions (e.g. coin toss).
Reconciliation: Children gather ideas
and make a list of ways to reconcile.
Rules at home: Children have
to establish a list with the rules
that apply in their home.
Rules: Children have to
interview their parents
about the rules that applied
in their home when they
were children themselves.
Manners: Parents should
discuss with children
good/bad manners and
how they feel when the
child shows bad manners
at home.
Note: This table provides an overview of the main themes of the PATHS curriculum. Besides classroom activities, children also
received homework, which may have involved parents. All major themes of the PATHS curriculum were accompanied with an
information leaflet for parents explaining the current theme and providing suggestions on how to support children with the current
curricular activities.
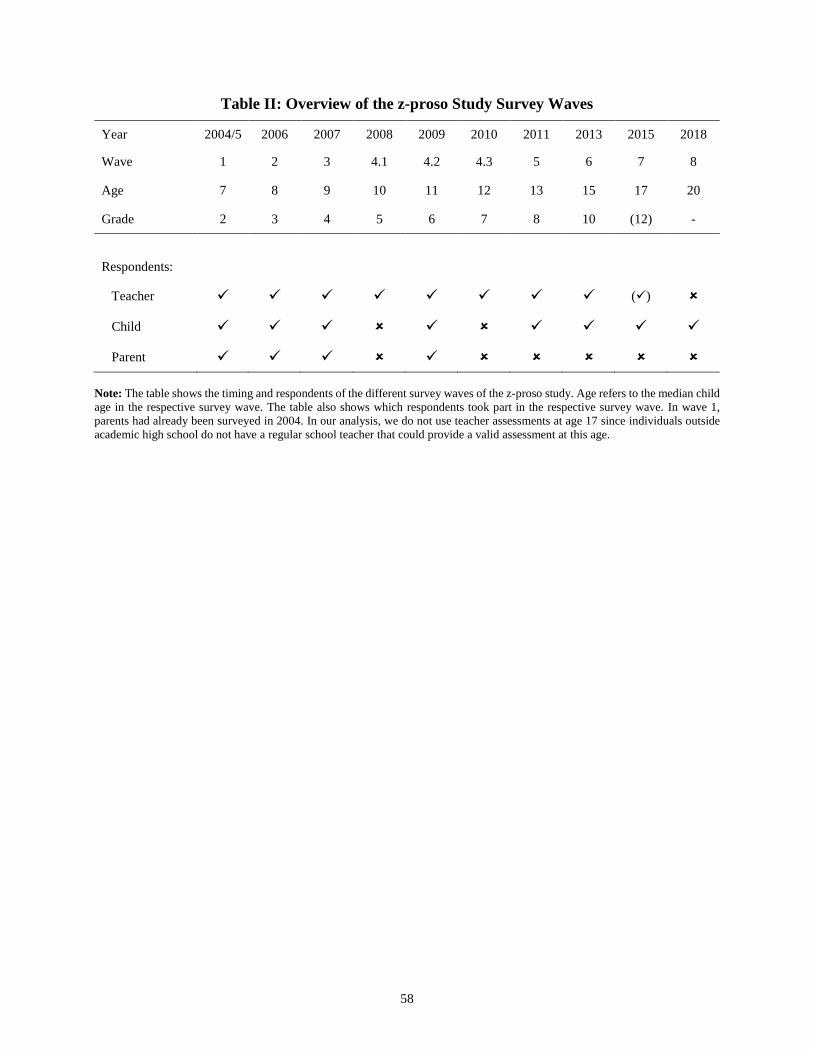
58
Table II: Overview of the z-proso Study Survey Waves
Year 2004/5 2006 2007 2008 2009 2010 2011 2013 2015 2018
Wave 1 2 3 4.1 4.2 4.3 5 6 7 8
Age 7 8 9 10 11 12 13 15 17 20
Grade 2 3 4 5 6 7 8 10 (12) -
Respondents:
Teacher ()
Child
Parent
Note: The table shows the timing and respondents of the different survey waves of the z-proso study. Age refers to the median child
age in the respective survey wave. The table also shows which respondents took part in the respective survey wave. In wave 1,
parents had already been surveyed in 2004. In our analysis, we do not use teacher assessments at age 17 since individuals outside
academic high school do not have a regular school teacher that could provide a valid assessment at this age.

59
Table III: Descriptive Statistics
(1) (2) (3) (4) (5)
N Mean SD Min Max
Educational Outcomes:
Attending Academic High School Age 13 1,589 0.157 0.364 0 1
Attending Academic High School Age 15 1,535 0.202 0.402 0 1
Attending Academic High School Age 17 1,305 0.261 0.439 0 1
Completed Academic High School Age 20 1,185 0.270 0.444 0 1
Enrolled in University Age 20 1,178 0.167 0.373 0 1
In Education or Training Age 20 1,178 0.565 0.496 0 1
Baseline Child Characteristics:
Age in 2005 1,238 7.033 0.396 5.699 8.494
Swiss Citizenship 1,238 0.599 0.490 0 1
Female 1,675 0.481 0.500 0 1
Baseline Child Socio-Emotional Skills (Teacher Report):
ADHD Symptoms (Disruptiveness and Impulsiveness) 1,348 1.246 0.989 0 4
Opposition & Defiance 1,348 0.541 0.815 0 4
Non-Aggressive Conduct Disorder 1,348 0.217 0.405 0 2.500
Anxiety & Depressivity 1,348 0.871 0.762 0 4
Aggression 1,348 0.588 0.684 0 4
Prosociality 1,348 2.171 0.824 0 4
Baseline Child Socio-Emotional Skills (Parent Report):
ADHD Symptoms (Disruptiveness and Impulsiveness) 1,229 1.212 0.646 0 3.778
Opposition & Defiance 1,229 0.966 0.621 0 2.750
Non-Aggressive Conduct Disorder 1,229 0.296 0.326 0 2.800
Anxiety & Depressivity 1,229 0.704 0.464 0 2.556
Aggression 1,229 0.601 0.423 0 2.750
Prosociality 1,229 2.577 0.528 0.600 4
Baseline Parenting Practices (Parent Report):
Corporal Punishment 1,229 0.454 0.489 0 2.667
Inconsistent Discipline 1,229 1.188 0.598 0 3.200
Parental Control & Supervision 1,229 3.686 0.328 2 4
Parental Involvement 1,229 3.189 0.422 1.500 4
Positive Parenting 1,229 3.215 0.514 1.200 4
Baseline Household Characteristics:
Mother Completed at least Gymnasium Degree 1,215 0.393 0.489 0 1
Father Completed at least Gymnasium Degree 1,015 0.518 0.500 0 1
Mother Holds University Degree 1,215 0.160 0.367 0 1
Father Holds University Degree 1,015 0.249 0.433 0 1
Single Parent Household 1,230 0.172 0.378 0 1
Age Mother in 2005 1,218 37.020 5.375 23 53
Mother Swiss Citizenship 1,663 0.486 0.500 0 1
Mother Born in Switzerland 1,219 0.423 0.494 0 1
Family Receives Financial Aid 1,213 0.380 0.486 0 1
Family Reports Financial Problems 1,216 0.178 0.382 0 1
Household Income (in 1000 USDs) 1,132 86.310 48.710 12 270
Note: This table shows descriptive statistics for the variables used our analysis. SD stands for standard deviation.
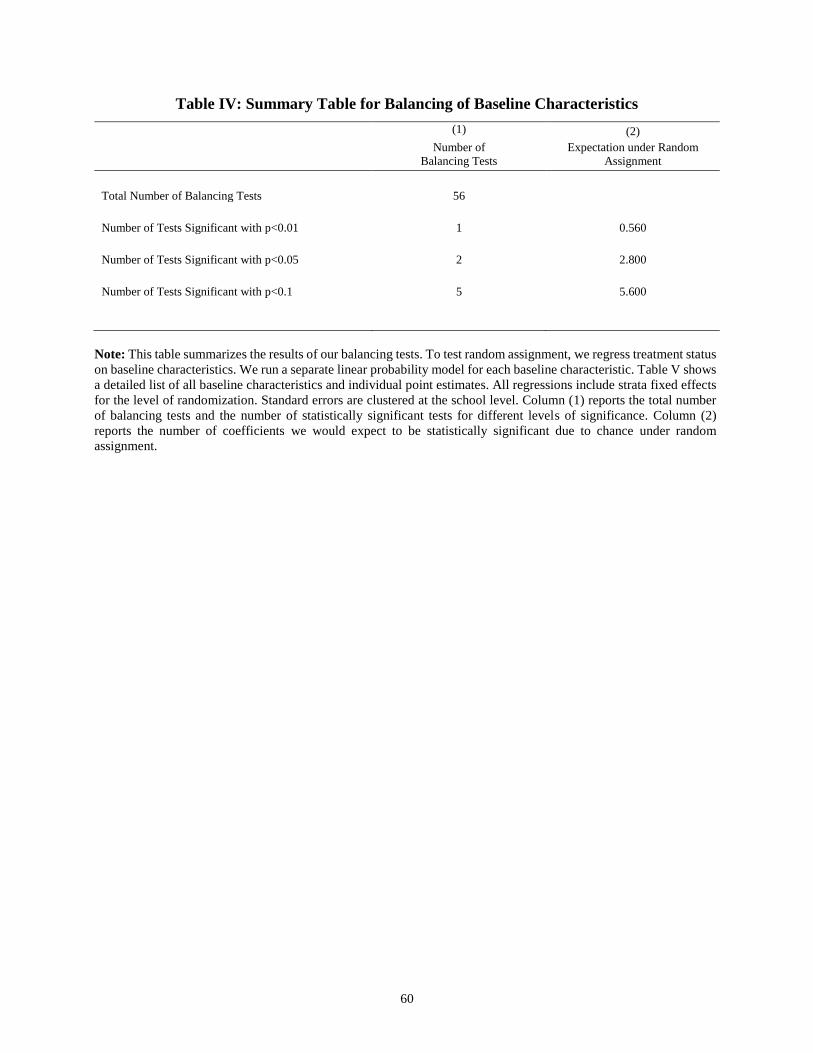
60
Table IV: Summary Table for Balancing of Baseline Characteristics
(1) (2)
Number of
Balancing Tests
Expectation under Random
Assignment
Total Number of Balancing Tests 56
Number of Tests Significant with p<0.01 1 0.560
Number of Tests Significant with p<0.05 2 2.800
Number of Tests Significant with p<0.1 5 5.600
Note: This table summarizes the results of our balancing tests. To test random assignment, we regress treatment status
on baseline characteristics. We run a separate linear probability model for each baseline characteristic. Table V shows
a detailed list of all baseline characteristics and individual point estimates. All regressions include strata fixed effects
for the level of randomization. Standard errors are clustered at the school level. Column (1) reports the total number
of balancing tests and the number of statistically significant tests for different levels of significance. Column (2)
reports the number of coefficients we would expect to be statistically significant due to chance under random
assignment.
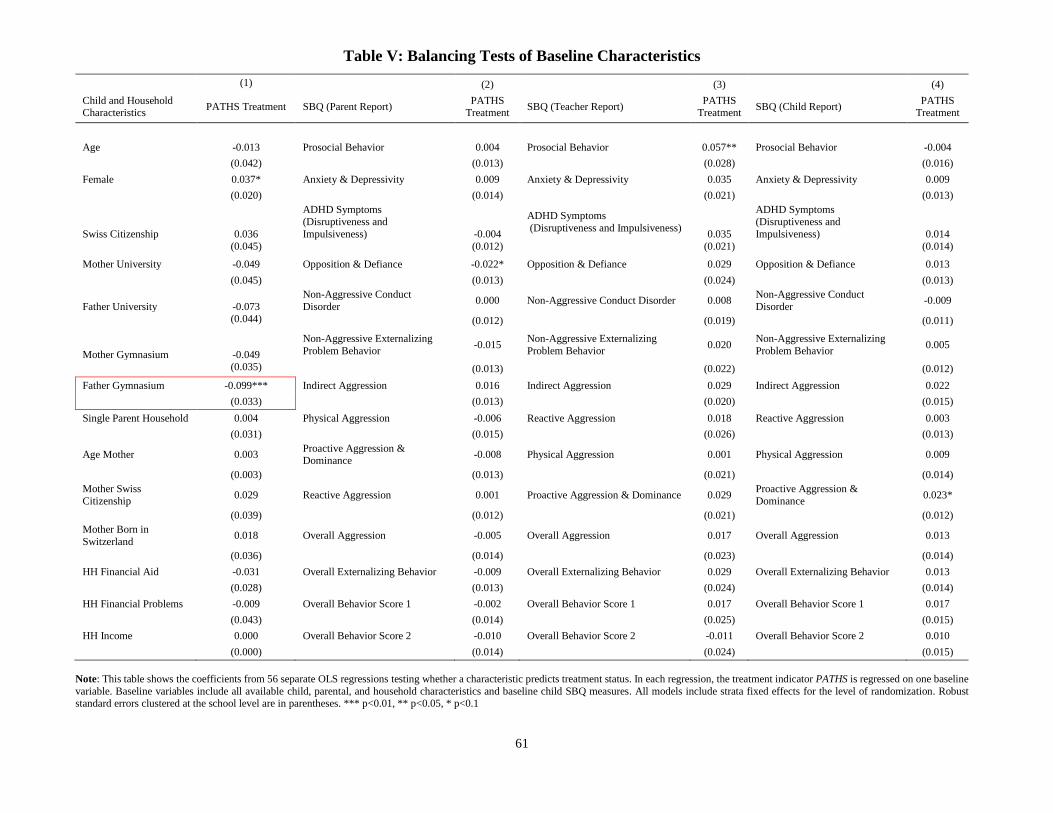
61
Table V: Balancing Tests of Baseline Characteristics
(1) (2) (3) (4)
Child and Household Characteristics
PATHS Treatment SBQ (Parent Report) PATHS
Treatment SBQ (Teacher Report)
PATHS Treatment
SBQ (Child Report) PATHS
Treatment
Age -0.013 Prosocial Behavior 0.004 Prosocial Behavior 0.057** Prosocial Behavior -0.004
(0.042) (0.013) (0.028) (0.016)
Female 0.037* Anxiety & Depressivity 0.009 Anxiety & Depressivity 0.035 Anxiety & Depressivity 0.009
(0.020) (0.014) (0.021) (0.013)
Swiss Citizenship 0.036
ADHD Symptoms
(Disruptiveness and
Impulsiveness) -0.004
ADHD Symptoms
(Disruptiveness and Impulsiveness) 0.035
ADHD Symptoms
(Disruptiveness and
Impulsiveness) 0.014
(0.045) (0.012) (0.021) (0.014)
Mother University -0.049 Opposition & Defiance -0.022* Opposition & Defiance 0.029 Opposition & Defiance 0.013
(0.045) (0.013) (0.024) (0.013)
Father University -0.073
Non-Aggressive Conduct
Disorder 0.000 Non-Aggressive Conduct Disorder 0.008
Non-Aggressive Conduct
Disorder -0.009
(0.044) (0.012) (0.019) (0.011)
Mother Gymnasium -0.049
Non-Aggressive Externalizing
Problem Behavior -0.015
Non-Aggressive Externalizing
Problem Behavior 0.020
Non-Aggressive Externalizing
Problem Behavior 0.005
(0.035) (0.013) (0.022) (0.012)
Father Gymnasium -0.099*** Indirect Aggression 0.016 Indirect Aggression 0.029 Indirect Aggression 0.022
(0.033) (0.013) (0.020) (0.015)
Single Parent Household 0.004 Physical Aggression -0.006 Reactive Aggression 0.018 Reactive Aggression 0.003
(0.031) (0.015) (0.026) (0.013)
Age Mother 0.003 Proactive Aggression & Dominance
-0.008 Physical Aggression 0.001 Physical Aggression 0.009
(0.003) (0.013) (0.021) (0.014)
Mother Swiss
Citizenship 0.029 Reactive Aggression 0.001 Proactive Aggression & Dominance 0.029
Proactive Aggression &
Dominance 0.023*
(0.039) (0.012) (0.021) (0.012)
Mother Born in
Switzerland 0.018 Overall Aggression -0.005 Overall Aggression 0.017 Overall Aggression 0.013
(0.036) (0.014) (0.023) (0.014)
HH Financial Aid -0.031 Overall Externalizing Behavior -0.009 Overall Externalizing Behavior 0.029 Overall Externalizing Behavior 0.013
(0.028) (0.013) (0.024) (0.014)
HH Financial Problems -0.009 Overall Behavior Score 1 -0.002 Overall Behavior Score 1 0.017 Overall Behavior Score 1 0.017
(0.043) (0.014) (0.025) (0.015)
HH Income 0.000 Overall Behavior Score 2 -0.010 Overall Behavior Score 2 -0.011 Overall Behavior Score 2 0.010
(0.000) (0.014) (0.024) (0.015)
Note: This table shows the coefficients from 56 separate OLS regressions testing whether a characteristic predicts treatment status. In each regression, the treatment indicator PATHS is regressed on one baseline
variable. Baseline variables include all available child, parental, and household characteristics and baseline child SBQ measures. All models include strata fixed effects for the level of randomization. Robust standard errors clustered at the school level are in parentheses. *** p<0.01, ** p<0.05, * p<0.1
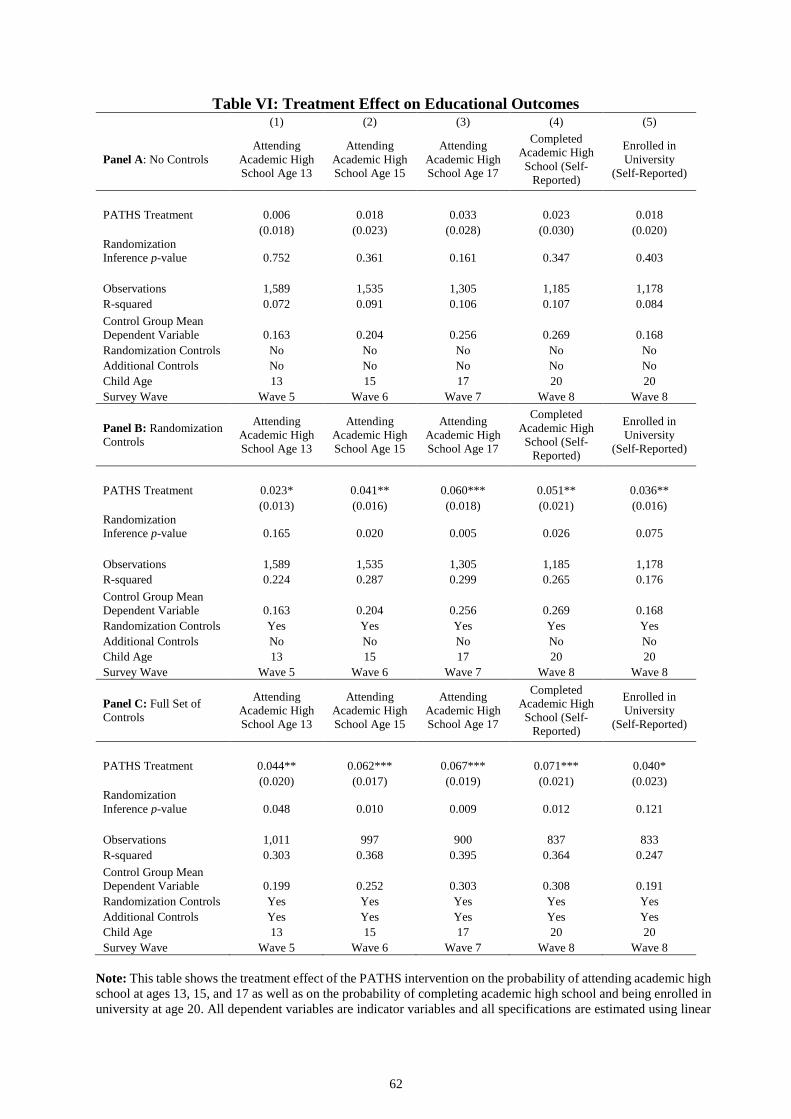
62
Table VI: Treatment Effect on Educational Outcomes (1) (2) (3) (4) (5)
Panel A: No Controls
Attending
Academic High
School Age 13
Attending
Academic High
School Age 15
Attending
Academic High
School Age 17
Completed
Academic High
School (Self-
Reported)
Enrolled in
University
(Self-Reported)
PATHS Treatment 0.006 0.018 0.033 0.023 0.018
(0.018) (0.023) (0.028) (0.030) (0.020)
Randomization
Inference p-value 0.752 0.361 0.161 0.347 0.403
Observations 1,589 1,535 1,305 1,185 1,178
R-squared 0.072 0.091 0.106 0.107 0.084
Control Group Mean
Dependent Variable 0.163 0.204 0.256 0.269 0.168
Randomization Controls No No No No No
Additional Controls No No No No No
Child Age 13 15 17 20 20
Survey Wave Wave 5 Wave 6 Wave 7 Wave 8 Wave 8
Panel B: Randomization
Controls
Attending
Academic High
School Age 13
Attending
Academic High
School Age 15
Attending
Academic High
School Age 17
Completed
Academic High
School (Self-
Reported)
Enrolled in
University
(Self-Reported)
PATHS Treatment 0.023* 0.041** 0.060*** 0.051** 0.036**
(0.013) (0.016) (0.018) (0.021) (0.016)
Randomization
Inference p-value 0.165 0.020 0.005 0.026 0.075
Observations 1,589 1,535 1,305 1,185 1,178
R-squared 0.224 0.287 0.299 0.265 0.176
Control Group Mean
Dependent Variable 0.163 0.204 0.256 0.269 0.168
Randomization Controls Yes Yes Yes Yes Yes
Additional Controls No No No No No
Child Age 13 15 17 20 20
Survey Wave Wave 5 Wave 6 Wave 7 Wave 8 Wave 8
Panel C: Full Set of
Controls
Attending
Academic High
School Age 13
Attending
Academic High
School Age 15
Attending
Academic High
School Age 17
Completed
Academic High
School (Self-
Reported)
Enrolled in
University
(Self-Reported)
PATHS Treatment 0.044** 0.062*** 0.067*** 0.071*** 0.040*
(0.020) (0.017) (0.019) (0.021) (0.023)
Randomization
Inference p-value 0.048 0.010 0.009 0.012 0.121
Observations 1,011 997 900 837 833
R-squared 0.303 0.368 0.395 0.364 0.247
Control Group Mean
Dependent Variable 0.199 0.252 0.303 0.308 0.191
Randomization Controls Yes Yes Yes Yes Yes
Additional Controls Yes Yes Yes Yes Yes
Child Age 13 15 17 20 20
Survey Wave Wave 5 Wave 6 Wave 7 Wave 8 Wave 8
Note: This table shows the treatment effect of the PATHS intervention on the probability of attending academic high
school at ages 13, 15, and 17 as well as on the probability of completing academic high school and being enrolled in
university at age 20. All dependent variables are indicator variables and all specifications are estimated using linear
63
probability models. All models include strata fixed effects for the level of randomization. In Panel A, we do not
include any controls for baseline characteristics. In Panel B, we include randomization controls for mother and father
education level and indicator variables for missing education level. In Panel C, we include controls for baseline child,
parental, and household characteristics and baseline child SBQ measures. Child controls include age and gender of
the child and having Swiss citizenship. Household controls include household income, age of the mother, indicator
variables for the mother having Swiss citizenship and being born in Switzerland, an indicator for mother and father
education level, indicator variables for missing education level, and indicator variables for single-parent household,
household that received financial aid, and household that experienced financial problems. Controls for baseline child
SBQ measures include measures for anxiety and depressivity, ADHD, non-aggressive externalizing problem
behavior, non-aggressive conduct disorder, opposition and defiance, prosociality, and three measures of aggressive
behavior. The table also shows p-values based on randomization inference with 10,000 replications. Robust standard
errors clustered at the school level are in parentheses. *** p<0.01, ** p<0.05, * p<0.1.

64
Appendix A1: Supplementary Tables and Figures
Table A1: Main Results with Separate Treatment Arms
(1) (2) (3) (4) (5)
Attending
Academic High
School Age 13
Attending
Academic High
School Age 15
Attending
Academic High
School Age 17
Completed
Academic High
School (Self-
Reported)
Enrolled in
University (Self-
Reported)
PATHS 0.035* 0.060*** 0.050** 0.058** 0.032
(0.020) (0.019) (0.023) (0.028) (0.020)
PATHS & Triple P 0.012 0.049* 0.062** 0.058* 0.043*
(0.020) (0.026) (0.028) (0.032) (0.025)
Triple P 0.002 0.027 -0.009 0.013 0.003
(0.019) (0.021) (0.026) (0.031) (0.022)
Observations 1,589 1,535 1,305 1,185 1,178
R-squared 0.225 0.288 0.299 0.265 0.176
Control Group Mean
Dependent Variable 0.182 0.213 0.294 0.295 0.191
P-value Difference
between PATHS and
PATHS & Triple P
0.219 0.643 0.630 0.996 0.620
Randomization
Controls Yes Yes Yes Yes Yes
Child Age 13 15 17 20 20
Survey Wave Wave 5 Wave 6 Wave 7 Wave 8 Wave 8
Note: This table shows the treatment effect of the PATHS intervention on the probability of attending academic
high school at ages 13, 15, and 17 as well as on the probability of completing academic high school and being
enrolled in university at age 20. All dependent variables are indicator variables and all specifications are estimated
using linear probability models. We estimate separate effects for all separate intervention arms: PATHS, Triple
P, and the combined treatment PATHS & Triple P. We report p-values of testing the difference between the
PATHS and the PATHS & Triple P coefficients. All models include strata fixed effects for the level of
randomization. In Panel A, we do not include any controls for baseline characteristics. In Panel B, we include
randomization controls for mother and father education level and indicator variables for missing education level.
In Panel C, we include controls for baseline child, parental, and household characteristics and baseline child SBQ
measures. Child controls include age and gender of the child and having Swiss citizenship. Household controls
include household income, age of the mother, indicator variables for the mother having Swiss citizenship and
being born in Switzerland, an indicator for mother and father education level, indicator variables for missing
education level, and indicator variables for single-parent household, household that received financial aid, and
household that experienced financial problems. Controls for baseline child SBQ measures include measures for
anxiety and depressivity, ADHD, non-aggressive externalizing problem behavior, non-aggressive conduct
disorder, opposition and defiance, prosociality, and three measures of aggressive behavior. Robust standard errors
clustered at the school level are in parentheses. *** p<0.01, ** p<0.05, * p<0.1.

65
Table A2: Main Results with Alternative Treatment Definition
(1) (2) (3) (4) (5)
Panel A: Randomization
Controls
Attending
Academic High
School Age 13
Attending
Academic High
School Age 15
Attending
Academic High
School Age 17
Completed
Academic High
School (Self-
Reported)
Enrolled in
University
(Self-Reported)
PATHS Treatment 0.043** 0.070*** 0.058** 0.074** 0.039*
(0.021) (0.021) (0.024) (0.032) (0.022)
Observations 819 798 674 616 613
R-squared 0.257 0.295 0.314 0.295 0.208
Control Group Mean
Dependent Variable 0.182 0.213 0.294 0.295 0.191
Randomization
Controls Yes Yes Yes Yes Yes
Additional Controls No No No No No
Child Age 13 15 17 20 20
Survey Wave Wave 5 Wave 6 Wave 7 Wave 8 Wave 8
Panel B: Full Set of
Controls
Attending
Academic High
School Age 13
Attending
Academic High
School Age 15
Attending
Academic High
School Age 17
Completed
Academic High
School (Self-
Reported)
Enrolled in
University
(Self-Reported)
PATHS Treatment 0.068** 0.089*** 0.041** 0.074*** 0.025
(0.027) (0.020) (0.019) (0.021) (0.027)
Observations 560 551 489 458 456
R-squared 0.358 0.379 0.435 0.404 0.333
Control Group Mean
Dependent Variable 0.231 0.272 0.355 0.345 0.224
Randomization
Controls Yes Yes Yes Yes Yes
Additional Controls Yes Yes Yes Yes Yes
Child Age 13 15 17 20 20
Survey Wave Wave 5 Wave 6 Wave 7 Wave 8 Wave 8
Note: This table shows the treatment effect of the PATHS intervention on the probability of attending academic high
school at ages 13, 15, and 17 as well as on the probability of completing academic high school and being enrolled in
university at age 20. All dependent variables are indicator variables and all specifications are estimated using linear
probability models. The estimation sample in this table includes only the control group and the treatment group that
received the PATHS intervention. All children who received the Triple P intervention are excluded. All models
include strata fixed effects for the level of randomization. In Panel A, we include randomization controls for mother
and father education level and indicator variables for missing education level. In Panel B, we include controls for
baseline child, parental, and household characteristics and baseline child SBQ measures. Child controls include age
and gender of the child and having Swiss citizenship. Household controls include household income, age of the
mother, indicator variables for the mother having Swiss citizenship and being born in Switzerland, an indicator for
mother and father education level, indicator variables for missing education level, and indicator variables for single-
parent household, household that received financial aid, and household that experienced financial problems. Controls
for baseline child SBQ measures include measures for anxiety and depressivity, ADHD, non-aggressive externalizing
problem behavior, non-aggressive conduct disorder, opposition and defiance, prosociality, and three measures of
aggressive behavior. Robust standard errors clustered at the school level are in parentheses. *** p<0.01, ** p<0.05,
* p<0.1.

66
Table A3: Test for Selective Attrition
(1) (2) (3) (4) (5)
Observed at
Age 13
Observed at
Age 15
Observed at
Age 17
Observing
Completion of
Academic High
School
Observing
Enrollment in
University
PATHS Treatment 0.017 0.011 0.001 0.012 0.012
(0.011) (0.015) (0.021) (0.019) (0.019)
Observations 1,675 1,675 1,675 1,675 1,675
R-squared 0.012 0.029 0.063 0.090 0.089
Control Group Mean
Dependent Variable 0.94 0.91 0.783 0.711 0.707
Randomization Controls Yes Yes Yes Yes Yes
Additional Controls No No No No No
Child Age 13 15 17 20 20
Survey Wave Wave 5 Wave 6 Wave 7 Wave 8 Wave 8
Note: This table shows the treatment effect of the PATHS intervention on the probability of observing a student’s
educational outcome at ages 13, 15, 17, and 20. We estimate linear probability models. The dependent variable is
an indicator variable for observing the respective educational outcome. All models include strata fixed effects for
the level of randomization. All models include randomization controls for mother and father education level and
indicator variables for missing education level. The point estimates for the PATHS Treatment indicate whether the
treatment has an effect on attrition. Robust standard errors clustered at the school level are in parentheses. ***
p<0.01, ** p<0.05, * p<0.1.
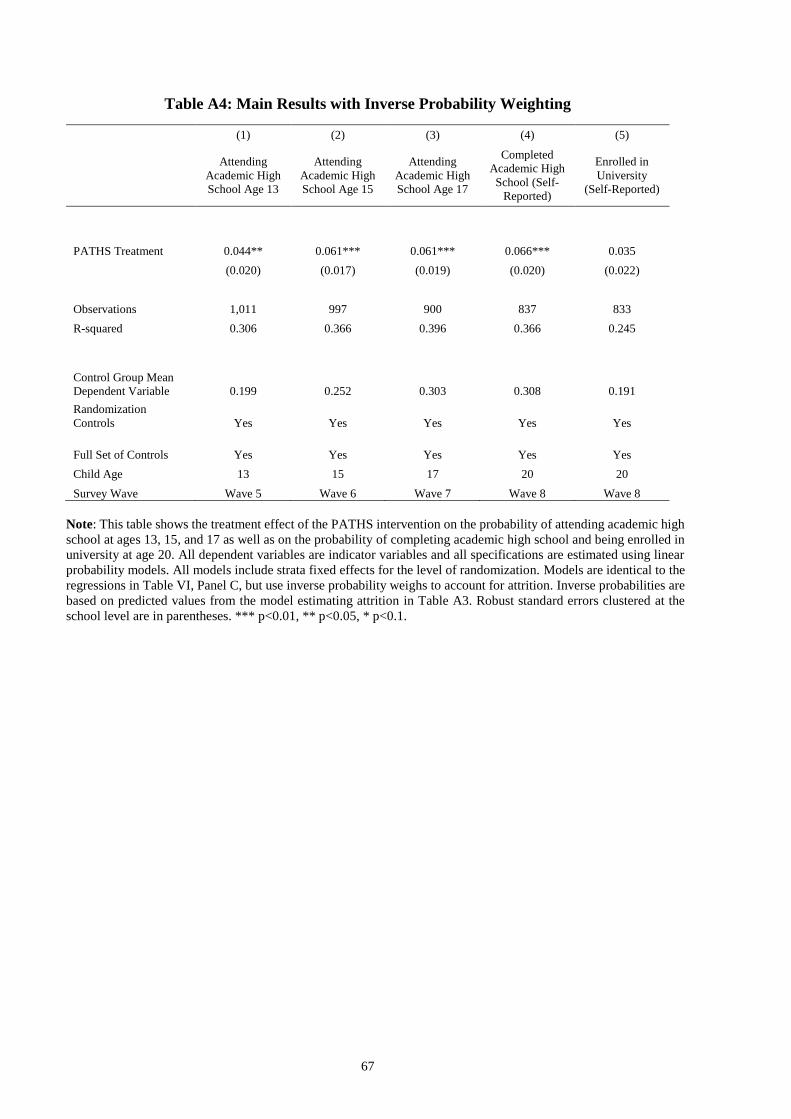
67
Table A4: Main Results with Inverse Probability Weighting
(1) (2) (3) (4) (5)
Attending
Academic High
School Age 13
Attending
Academic High
School Age 15
Attending
Academic High
School Age 17
Completed
Academic High
School (Self-
Reported)
Enrolled in
University
(Self-Reported)
PATHS Treatment 0.044** 0.061*** 0.061*** 0.066*** 0.035
(0.020) (0.017) (0.019) (0.020) (0.022)
Observations 1,011 997 900 837 833
R-squared 0.306 0.366 0.396 0.366 0.245
Control Group Mean
Dependent Variable 0.199 0.252 0.303 0.308 0.191
Randomization
Controls Yes Yes Yes Yes Yes
Full Set of Controls Yes Yes Yes Yes Yes
Child Age 13 15 17 20 20
Survey Wave Wave 5 Wave 6 Wave 7 Wave 8 Wave 8
Note: This table shows the treatment effect of the PATHS intervention on the probability of attending academic high
school at ages 13, 15, and 17 as well as on the probability of completing academic high school and being enrolled in
university at age 20. All dependent variables are indicator variables and all specifications are estimated using linear
probability models. All models include strata fixed effects for the level of randomization. Models are identical to the
regressions in Table VI, Panel C, but use inverse probability weighs to account for attrition. Inverse probabilities are
based on predicted values from the model estimating attrition in Table A3. Robust standard errors clustered at the
school level are in parentheses. *** p<0.01, ** p<0.05, * p<0.1.

68
Table A5: Dosage Effects – Two Years vs. One Year of Treatment
(1) (2) (3) (4) (5)
Panel A:
Randomization
Controls
Attending
Academic High
School Age 13
Attending
Academic High
School Age 15
Attending
Academic High
School Age 17
Completed
Academic High
School (Self-
Reported)
Enrolled in
University (Self-
Reported)
PATHS 2 Years 0.046** 0.076*** 0.088*** 0.078*** 0.056**
(0.017) (0.020) (0.023) (0.025) (0.022)
PATHS 1 Year 0.017 -0.007 0.040 0.031 0.021
(0.031) (0.032) (0.028) (0.023) (0.025)
Observations 1,321 1,282 1,121 1,030 1,024
R-squared 0.226 0.289 0.312 0.276 0.174
Randomization
Controls Yes Yes Yes Yes Yes
Additional Controls No No No No No
Child Age 13 15 17 20 20
Survey Wave Wave 5 Wave 6 Wave 7 Wave 8 Wave 8
Panel B: Full Set
of Controls
Attending
Academic High
School Age 13
Attending
Academic High
School Age 15
Attending
Academic High
School Age 17
Completed
Academic High
School (Self-
Reported)
Enrolled in
University (Self-
Reported)
PATHS 2 Years 0.059** 0.084*** 0.084*** 0.087*** 0.056*
(0.023) (0.019) (0.022) (0.024) (0.028)
PATHS 1 Year 0.044 0.009 0.062 0.037 0.022
(0.034) (0.038) (0.041) (0.033) (0.033)
Observations 933 920 835 777 774
R-squared 0.305 0.370 0.397 0.366 0.246
Randomization
Controls Yes Yes Yes Yes Yes
Additional Controls Yes Yes Yes Yes Yes
Child Age 13 15 17 20 20
Survey Wave Wave 5 Wave 6 Wave 7 Wave 8 Wave 8
Note: This table shows treatment dosage effects of the PATHS intervention on the probability of attending academic
high school at ages 13, 15, and 17 as well as on the probability of completing academic high school and being enrolled
in university at age 20. All dependent variables are indicator variables and all specifications are estimated using linear
probability models. The PATHS treatment effect is separately shown for children who received the treatment for one
(PATHS 1 Year) or two (PATHS 2 Years) years. All models include strata fixed effects for the level of randomization.
In Panel A, we include randomization controls for mother and father education level and indicator variables for
missing education level. In Panel B, we include controls for baseline child, parental, and household characteristics
and baseline child SBQ measures. Child controls include age and gender of the child and having Swiss citizenship.
Household controls include household income, age of the mother, indicator variables for the mother having Swiss
citizenship and being born in Switzerland, an indicator for mother and father education level, indicator variables for
missing education level, and indicator variables for single-parent household, household that received financial aid,
and household that experienced financial problems. Controls for baseline child SBQ measures include measures for
anxiety and depressivity, ADHD, non-aggressive externalizing problem behavior, non-aggressive conduct disorder,
opposition and defiance, prosociality, and three measures of aggressive behavior. Robust standard errors clustered at
the school level are in parentheses. *** p<0.01, ** p<0.05, * p<0.1.
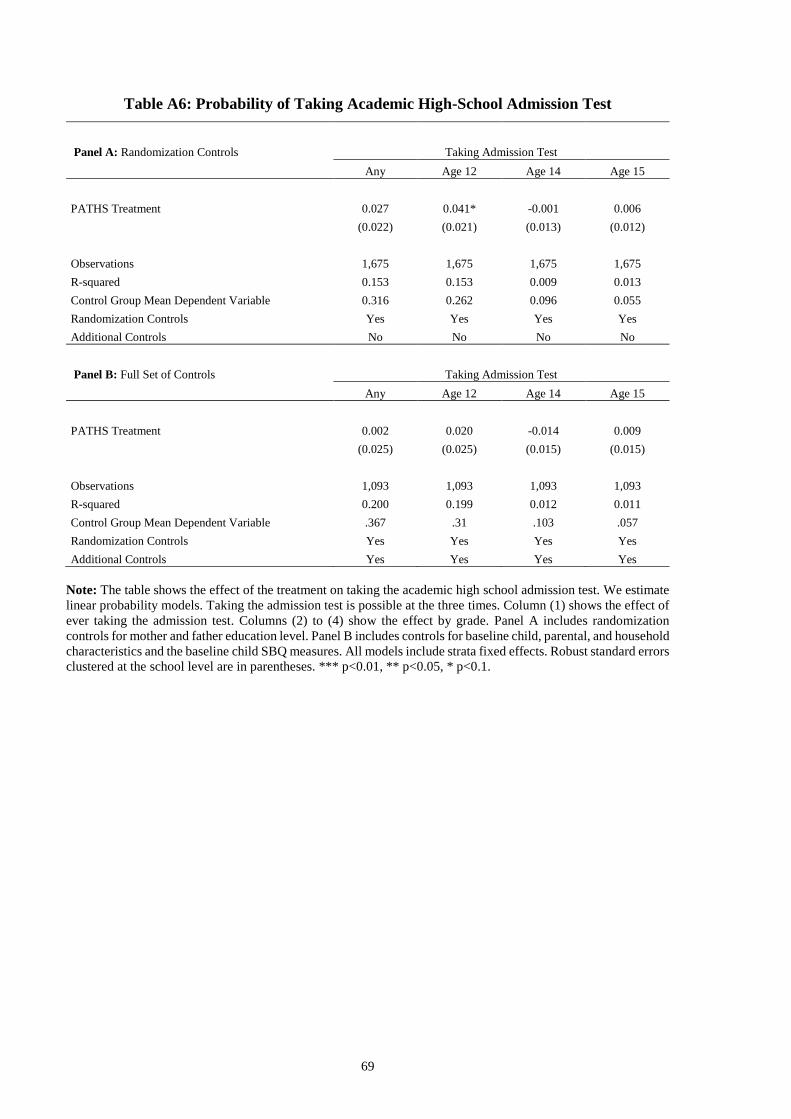
69
Table A6: Probability of Taking Academic High-School Admission Test
Panel A: Randomization Controls Taking Admission Test
Any Age 12 Age 14 Age 15
PATHS Treatment 0.027 0.041* -0.001 0.006
(0.022) (0.021) (0.013) (0.012)
Observations 1,675 1,675 1,675 1,675
R-squared 0.153 0.153 0.009 0.013
Control Group Mean Dependent Variable 0.316 0.262 0.096 0.055
Randomization Controls Yes Yes Yes Yes
Additional Controls No No No No
Panel B: Full Set of Controls Taking Admission Test
Any Age 12 Age 14 Age 15
PATHS Treatment 0.002 0.020 -0.014 0.009
(0.025) (0.025) (0.015) (0.015)
Observations 1,093 1,093 1,093 1,093
R-squared 0.200 0.199 0.012 0.011
Control Group Mean Dependent Variable .367 .31 .103 .057
Randomization Controls Yes Yes Yes Yes
Additional Controls Yes Yes Yes Yes
Note: The table shows the effect of the treatment on taking the academic high school admission test. We estimate
linear probability models. Taking the admission test is possible at the three times. Column (1) shows the effect of
ever taking the admission test. Columns (2) to (4) show the effect by grade. Panel A includes randomization
controls for mother and father education level. Panel B includes controls for baseline child, parental, and household
characteristics and the baseline child SBQ measures. All models include strata fixed effects. Robust standard errors
clustered at the school level are in parentheses. *** p<0.01, ** p<0.05, * p<0.1.
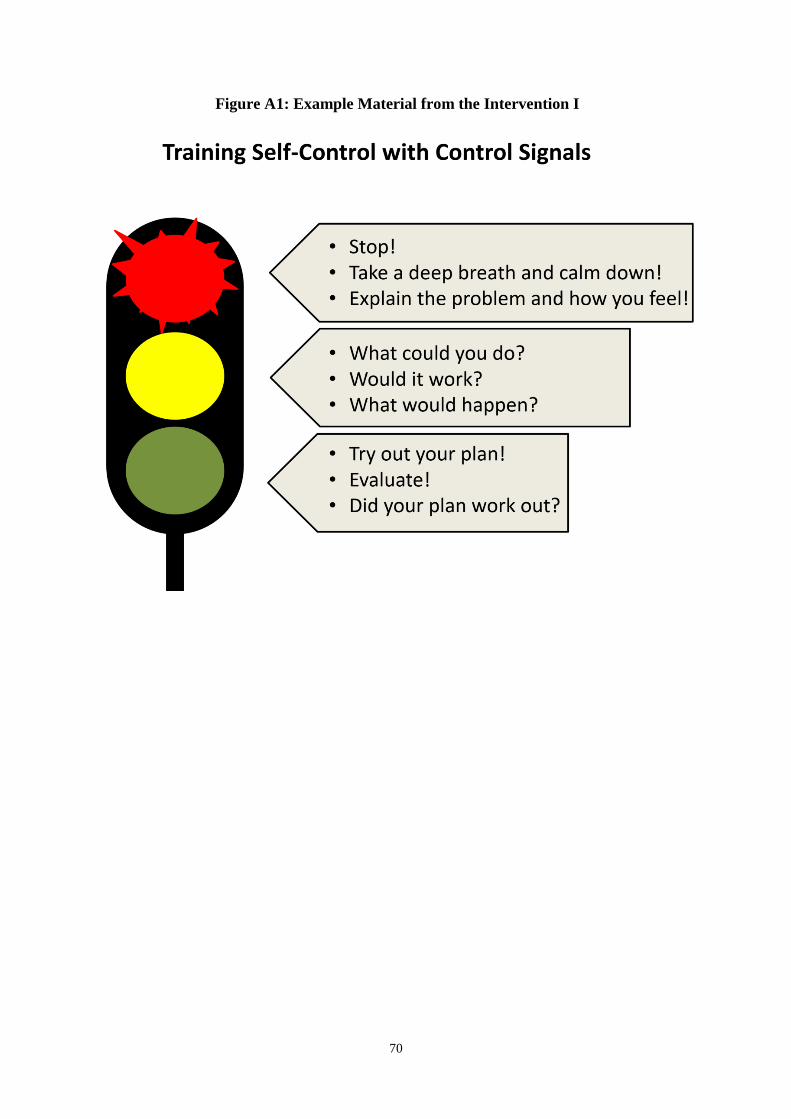
70
Figure A1: Example Material from the Intervention I
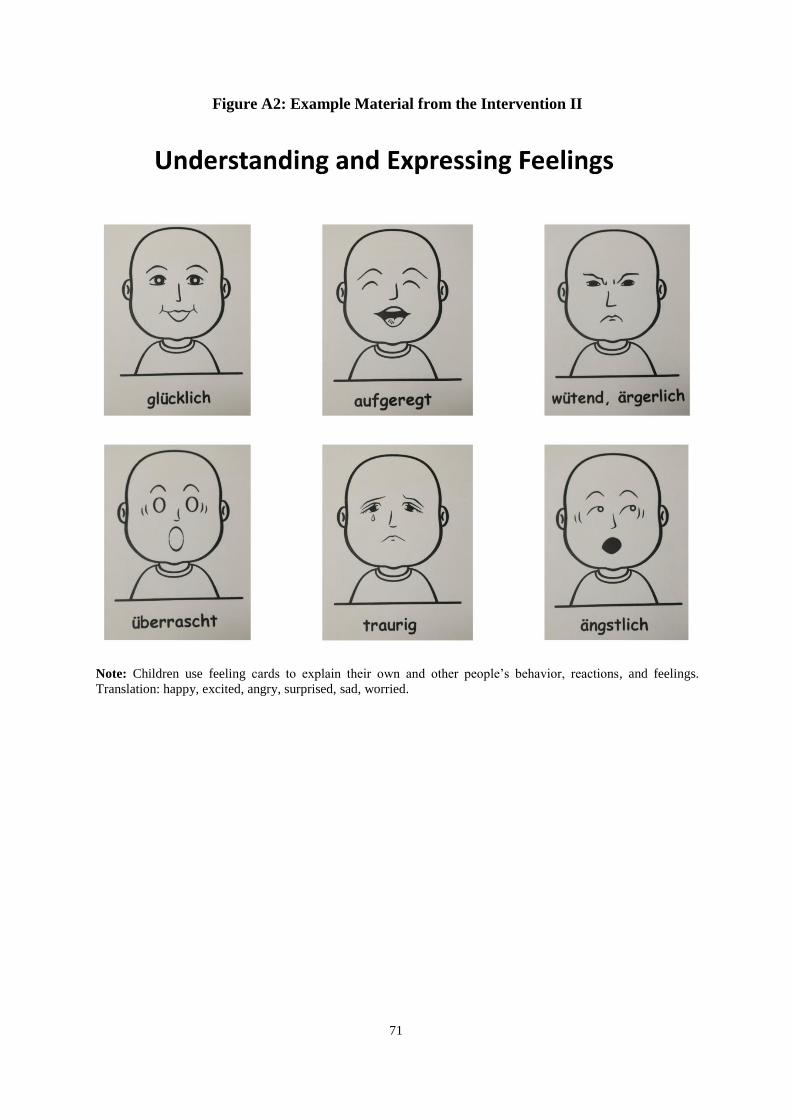
71
Figure A2: Example Material from the Intervention II
Note: Children use feeling cards to explain their own and other people’s behavior, reactions, and feelings.
Translation: happy, excited, angry, surprised, sad, worried.

72
Figure A3: Example Material from the Intervention III
Fairness and Rules: Recognizing Aggression & Unacceptable Behavior
Note: Instructions for children: Color all pictures showing a behavior that is okay.
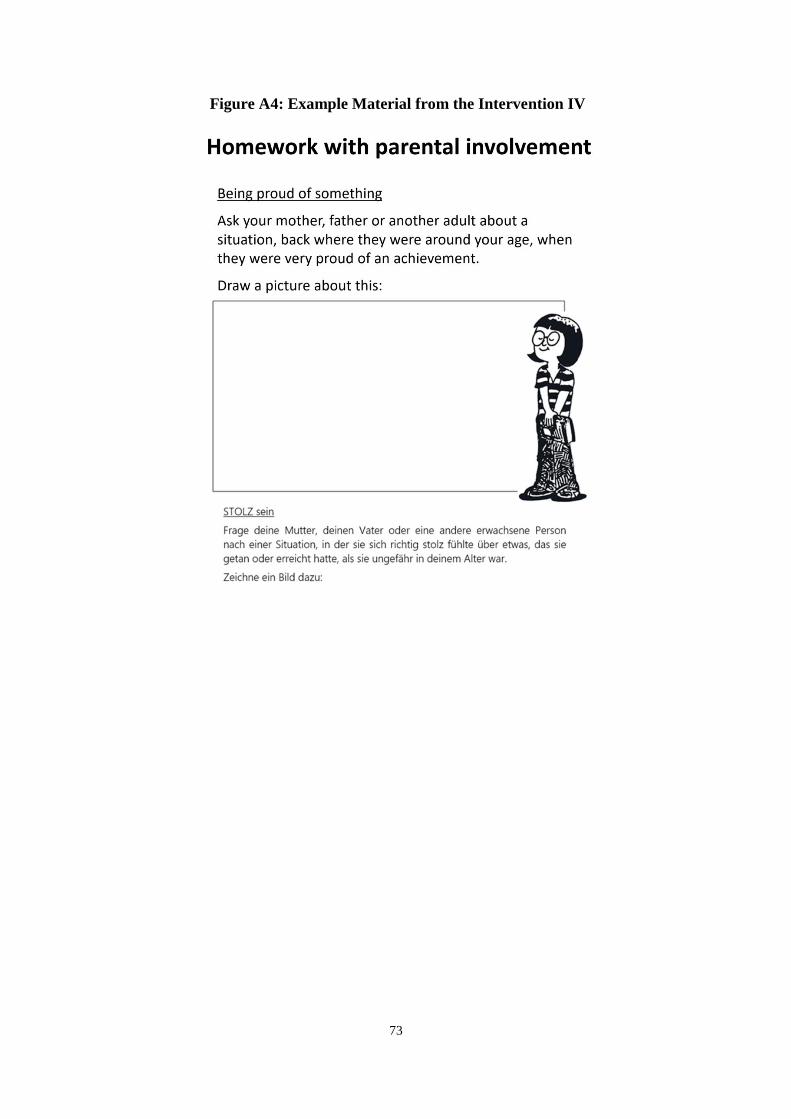
73
Figure A4: Example Material from the Intervention IV

74
Figure A5: Example Material from the Intervention V
Information Leaflet for Parents (a)
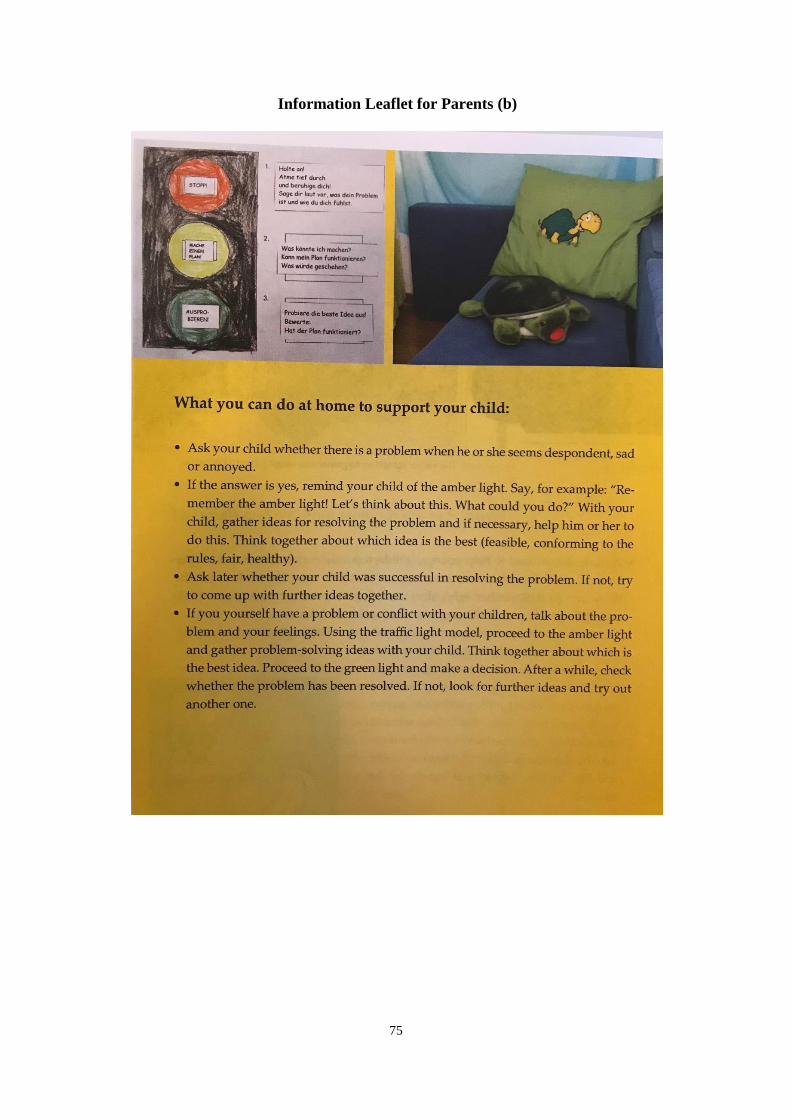
75
Information Leaflet for Parents (b)
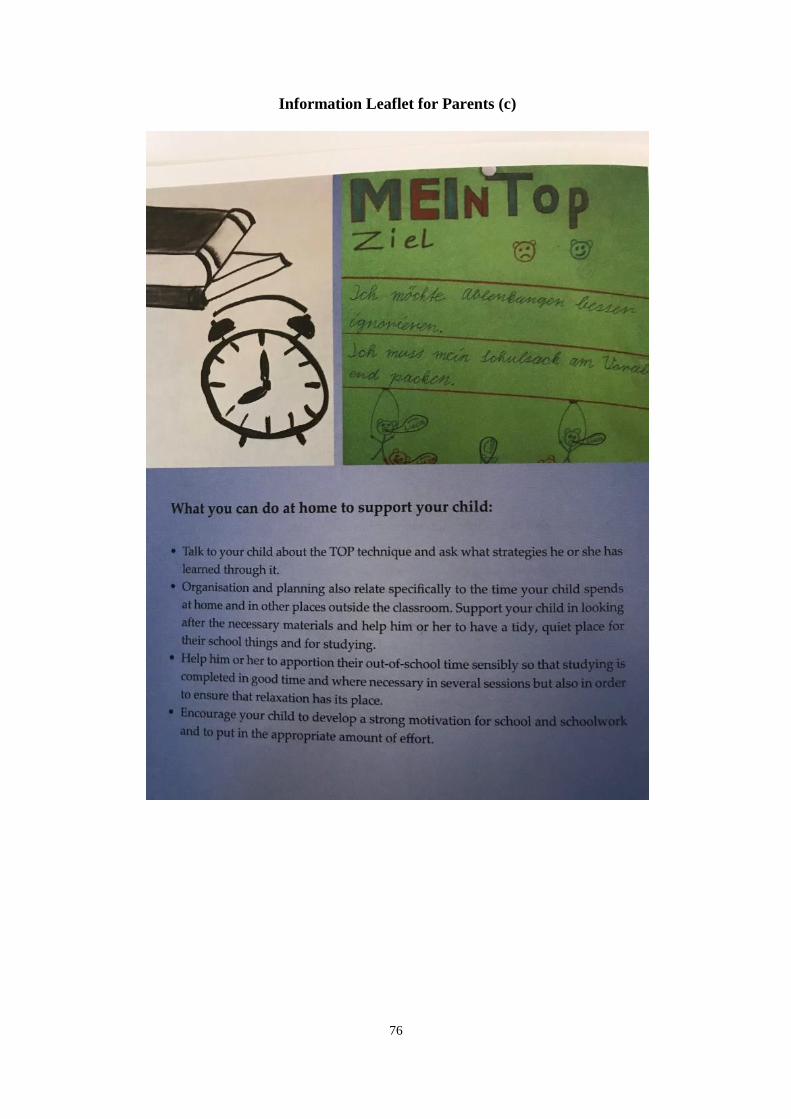
76
Information Leaflet for Parents (c)

77
Figure A6: Treatment Effects on Employment and Education Status at Age 20
Note: The figure shows the treatment effect of the PATHS intervention on employment and education status at
age 20. Employment outcomes are conditional on not participating in any education or training. All dependent
variables are indicator variables and all specifications are estimated using linear probability models. All models
include strata fixed effects for the level of randomization. All models include randomization controls for mother
and father education level and indicator variables for missing education level as well as controls for baseline child,
parental, and household characteristics and the baseline child SBQ measures. Each point estimate is shown with
the respective 90 and 95 percent confidence intervals calculated based on standard errors clustered at the school
level.

78
Figure A7: Heterogeneous Treatment Effects for Academic High School Completion
Note: This figure shows heterogeneous treatment effects for completion of academic high-school depending on
parental education, family income, employment status of the father, the gender of the child, as well as on the
baseline SBQ measure for ADHD symptoms (disruptiveness and impulsiveness), opposition and defiance, and
non-aggressive conduct disorder. Estimates are based on models in Table VI, Panel B and include randomization
controls. The dashed line indicates the overall treatment effect shown in Table VI, Panel B, column (1). All models
include strata fixed effects for the level of randomization. Each point estimate is shown with the respective 90 and
95 percent confidence intervals calculated based on standard errors clustered at the school level.
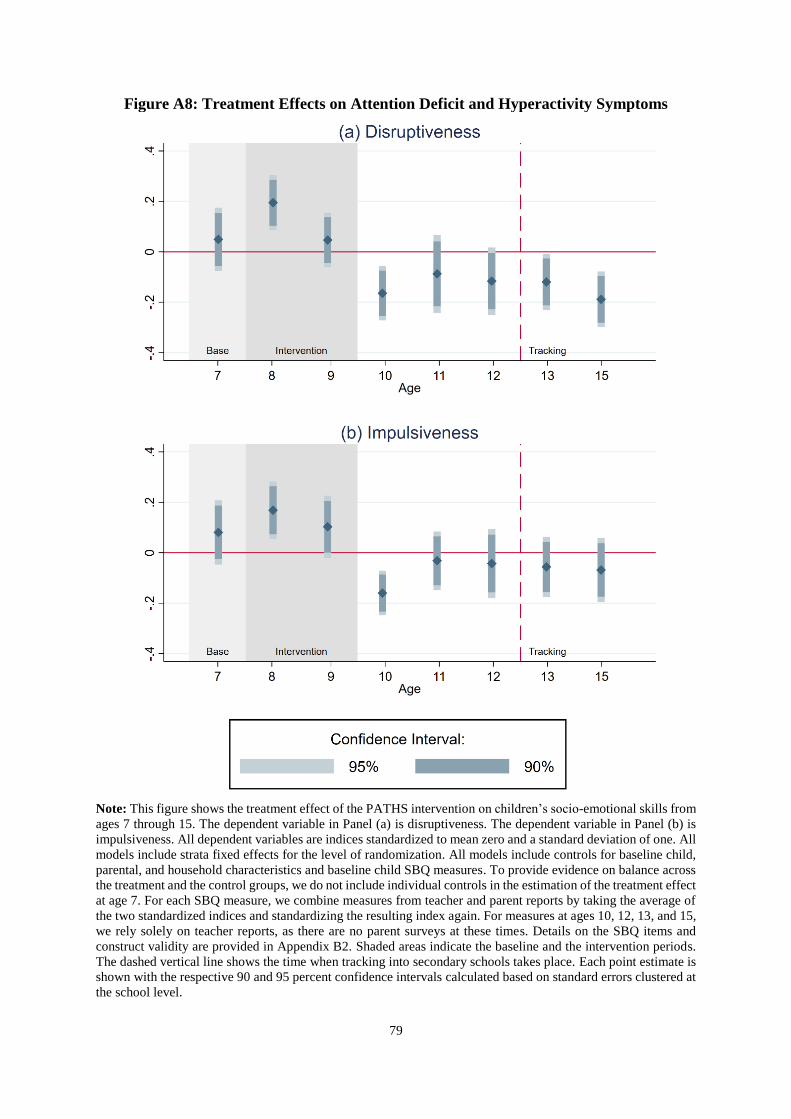
79
Figure A8: Treatment Effects on Attention Deficit and Hyperactivity Symptoms
Note: This figure shows the treatment effect of the PATHS intervention on children’s socio-emotional skills from
ages 7 through 15. The dependent variable in Panel (a) is disruptiveness. The dependent variable in Panel (b) is
impulsiveness. All dependent variables are indices standardized to mean zero and a standard deviation of one. All
models include strata fixed effects for the level of randomization. All models include controls for baseline child,
parental, and household characteristics and baseline child SBQ measures. To provide evidence on balance across
the treatment and the control groups, we do not include individual controls in the estimation of the treatment effect
at age 7. For each SBQ measure, we combine measures from teacher and parent reports by taking the average of
the two standardized indices and standardizing the resulting index again. For measures at ages 10, 12, 13, and 15,
we rely solely on teacher reports, as there are no parent surveys at these times. Details on the SBQ items and
construct validity are provided in Appendix B2. Shaded areas indicate the baseline and the intervention periods.
The dashed vertical line shows the time when tracking into secondary schools takes place. Each point estimate is
shown with the respective 90 and 95 percent confidence intervals calculated based on standard errors clustered at
the school level.

80
Appendix B1: Data Collection and Survey Procedures
In each of the 56 selected schools, all children entering Grade 1 in 2004 were invited to
participate in the first survey wave via their parents, providing a target sample of 1,675
children. For the data collection of waves 1 to 3 at ages 7, 8, and 9, we obtained informed
consent from the parents of participating children, which we renewed for the data collection in
wave 4 at age 11. From wave 5 (age 13) onward, the participants themselves provided direct
informed consent, though parents retained the right to opt their child out of the study. Informed
consent by the youths was renewed at wave 7 (age 17) and wave 8 (age 20).
z-proso entails four main types of data collections, i.e., parent, teacher, child, and youth
surveys. Parent interviews at child age 7, 8, 9, and 11 were usually carried out at the mothers’
home using computer-aided personal interviews (CAPI). Given the highly multicultural
population in Zurich, the standardized interviews were conducted by specially trained native
speakers in nine different languages: German, Albanian, Bosnian/Croatian/Serbian,
Portuguese, Spanish, Italian, Turkish, Tamil, and English. The interviews typically took about
an hour and participating parents received vouchers worth USD 20–50 as participation
incentives.
Teachers of all participating children were invited to complete postal surveys at ages 7,
8, 9, 10, 11, 12, 13, 15, and 17. The teacher survey consisted of a one-page form related to each
participant in the teacher’s class that took five to ten minutes to complete, plus a questionnaire
at the level of the class and of the schoolhouse, which took five to ten minutes to complete. In
the first three years, participation was mandatory for all teachers. After that, teachers who had
to complete more than seven questionnaires were offered book vouchers worth about USD 50
as a participation incentive.

81
Specially trained interviewers conducted standardized computer assisted child
interviews (CAPI) at ages 7, 8, and 9 during regular school lessons (45 minutes). These surveys
were specially designed for the age group and were mostly play-based. At ages 11, 13, 15, and
17 we changed the methodology to classroom-based paper-and-pencil questionnaires. Two to
three research assistants conducted the survey sessions, which lasted 60 to 90 minutes. At age
11, the surveys were conducted during regular school lessons. For later waves, surveys took
place during leisure time and were incentivized with the equivalent of USD 30–60 in cash. At
age 20, the survey was based on essentially the same instrument as in previous waves, but was
administered in a central university computer lab using computer-assisted self-interview
(CASI) methodology. The participation incentive increased to USD 75.
All data collections were in accordance with the Swiss data protection and human
research acts. The most recent review by the Ethics Committee of the Faculty of Arts and Social
Sciences of the University of Zurich took place in early 2018.

82
Appendix B2: Additional Information for SBQ and APQ Measures
Table B1: Social Behavior Questionnaire Items (SBQ)
Domain Survey Items Examples
ADHD symptoms
(Disruptive and
Impulsive)
Is impulsive, acts without thinking about it
Has difficulty awaiting turn in games or groups
Cannot sit still, is restless or hyperactive
Is squirmy, fidgety
Cannot settle to anything for more than a few moments
Is distractible, has trouble sticking to any activity
Can't concentrate, can't pay attention for long
Is inattentive
Opposition and
Defiance
Is disobedient
Ignores teacher/parents
Non-Aggressive
Conduct Disorder
Steals
Destroys things/belongings
Tells lies and cheats
Anxiety and
Depressivity
Cries a lot
Is nervous, high-strung, or tense
Tends to be overly fearful and anxious
Seems worried and concerned
Seems sad, unhappy, or depressive
Is not as happy as other children
Has trouble enjoying him\herself
Stares into space
Appears miserable, depressed or unhappy
Aggression
When child has been teased or threatened, gets angry easily and strikes back
Gets aggressive when contradicted
Gets mad when not getting something
Gets aggressive when something is taken from him/her
Takes part in fights
Attacks others physically
Kicks, bites, or hits other kids
Tortures or tyrannizes others or is mean to others
Intimidates or bullies others in order to get his own way
Tries to dominate others
Threatens others
Humiliates others
Bosses others around
Encourages other children to pick on a particular child
Prosocial Behavior
Volunteers to help clear up a mess someone else has made
If there is a quarrel or dispute, will try to stop it
Will try to help someone who has been hurt
Will invite bystanders to join in a game
Spontaneously helps to pick up objects that another child has dropped (e.g. pencils, books, etc.).
Comforts a child who is crying or upset
Listens to others’ points of view
Shows sympathy to someone who has made a mistake
Is good at understanding other people s feelings
Shares with others
Note: This table shows the survey items for each domain measuring social behavior, taken from the Social
Behavior Questionnaire. Answers were given on a 5-point Likert scale (1 = “never,” 5 = “always”).
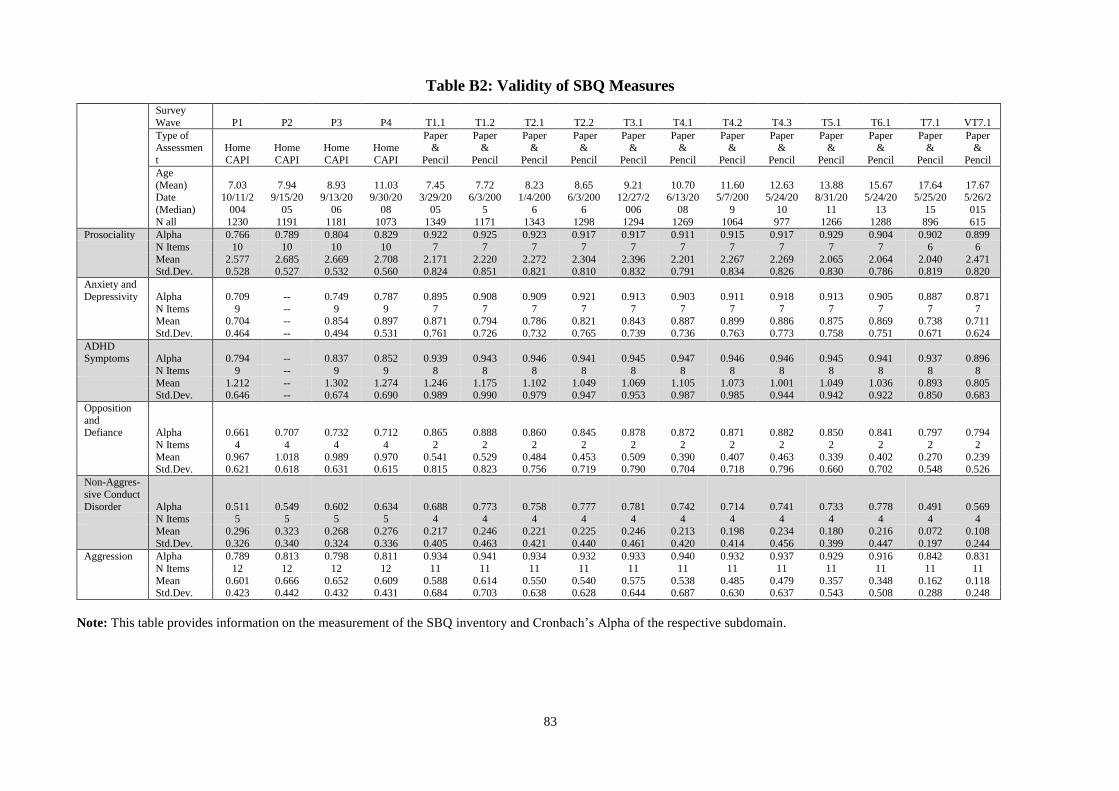
83
Table B2: Validity of SBQ Measures
Survey
Wave P1 P2 P3 P4 T1.1 T1.2 T2.1 T2.2 T3.1 T4.1 T4.2 T4.3 T5.1 T6.1 T7.1 VT7.1
Type of Assessmen
t
Home
CAPI
Home
CAPI
Home
CAPI
Home
CAPI
Paper &
Pencil
Paper &
Pencil
Paper &
Pencil
Paper &
Pencil
Paper &
Pencil
Paper &
Pencil
Paper &
Pencil
Paper &
Pencil
Paper &
Pencil
Paper &
Pencil
Paper &
Pencil
Paper &
Pencil
Age
(Mean) 7.03 7.94 8.93 11.03 7.45 7.72 8.23 8.65 9.21 10.70 11.60 12.63 13.88 15.67 17.64 17.67
Date
(Median)
10/11/2
004
9/15/20
05
9/13/20
06
9/30/20
08
3/29/20
05
6/3/200
5
1/4/200
6
6/3/200
6
12/27/2
006
6/13/20
08
5/7/200
9
5/24/20
10
8/31/20
11
5/24/20
13
5/25/20
15
5/26/2
015
N all 1230 1191 1181 1073 1349 1171 1343 1298 1294 1269 1064 977 1266 1288 896 615
Prosociality Alpha 0.766 0.789 0.804 0.829 0.922 0.925 0.923 0.917 0.917 0.911 0.915 0.917 0.929 0.904 0.902 0.899
N Items 10 10 10 10 7 7 7 7 7 7 7 7 7 7 6 6
Mean 2.577 2.685 2.669 2.708 2.171 2.220 2.272 2.304 2.396 2.201 2.267 2.269 2.065 2.064 2.040 2.471 Std.Dev. 0.528 0.527 0.532 0.560 0.824 0.851 0.821 0.810 0.832 0.791 0.834 0.826 0.830 0.786 0.819 0.820
Anxiety and
Depressivity Alpha 0.709 -- 0.749 0.787 0.895 0.908 0.909 0.921 0.913 0.903 0.911 0.918 0.913 0.905 0.887 0.871
N Items 9 -- 9 9 7 7 7 7 7 7 7 7 7 7 7 7 Mean 0.704 -- 0.854 0.897 0.871 0.794 0.786 0.821 0.843 0.887 0.899 0.886 0.875 0.869 0.738 0.711
Std.Dev. 0.464 -- 0.494 0.531 0.761 0.726 0.732 0.765 0.739 0.736 0.763 0.773 0.758 0.751 0.671 0.624
ADHD Symptoms Alpha 0.794 -- 0.837 0.852 0.939 0.943 0.946 0.941 0.945 0.947 0.946 0.946 0.945 0.941 0.937 0.896
N Items 9 -- 9 9 8 8 8 8 8 8 8 8 8 8 8 8
Mean 1.212 -- 1.302 1.274 1.246 1.175 1.102 1.049 1.069 1.105 1.073 1.001 1.049 1.036 0.893 0.805 Std.Dev. 0.646 -- 0.674 0.690 0.989 0.990 0.979 0.947 0.953 0.987 0.985 0.944 0.942 0.922 0.850 0.683
Opposition
and Defiance Alpha 0.661 0.707 0.732 0.712 0.865 0.888 0.860 0.845 0.878 0.872 0.871 0.882 0.850 0.841 0.797 0.794
N Items 4 4 4 4 2 2 2 2 2 2 2 2 2 2 2 2
Mean 0.967 1.018 0.989 0.970 0.541 0.529 0.484 0.453 0.509 0.390 0.407 0.463 0.339 0.402 0.270 0.239 Std.Dev. 0.621 0.618 0.631 0.615 0.815 0.823 0.756 0.719 0.790 0.704 0.718 0.796 0.660 0.702 0.548 0.526
Non-Aggres-
sive Conduct
Disorder Alpha 0.511 0.549 0.602 0.634 0.688 0.773 0.758 0.777 0.781 0.742 0.714 0.741 0.733 0.778 0.491 0.569
N Items 5 5 5 5 4 4 4 4 4 4 4 4 4 4 4 4
Mean 0.296 0.323 0.268 0.276 0.217 0.246 0.221 0.225 0.246 0.213 0.198 0.234 0.180 0.216 0.072 0.108
Std.Dev. 0.326 0.340 0.324 0.336 0.405 0.463 0.421 0.440 0.461 0.420 0.414 0.456 0.399 0.447 0.197 0.244
Aggression Alpha 0.789 0.813 0.798 0.811 0.934 0.941 0.934 0.932 0.933 0.940 0.932 0.937 0.929 0.916 0.842 0.831
N Items 12 12 12 12 11 11 11 11 11 11 11 11 11 11 11 11
Mean 0.601 0.666 0.652 0.609 0.588 0.614 0.550 0.540 0.575 0.538 0.485 0.479 0.357 0.348 0.162 0.118 Std.Dev. 0.423 0.442 0.432 0.431 0.684 0.703 0.638 0.628 0.644 0.687 0.630 0.637 0.543 0.508 0.288 0.248
Note: This table provides information on the measurement of the SBQ inventory and Cronbach’s Alpha of the respective subdomain.

84
Table B3: Parenting Practices Survey Items (APQ)
Domain Survey Item
Corporal Punishment You spank your child with your hand when he/she has done something wrong
You slap your child when he/she has done something wrong
You hit your child with a belt, switch, or other object when he/she has done something wrong
Parental Control and
Supervision
Your child fails to leave a note or to let you know where he/she is going
Your child stays out in the evening past the time he/she is supposed to be home
Your child is out with friends you don’t know
Your child goes out without a set time to be home
Your child is out after dark without an adult with him/her
You get so busy that you forget where your child is and what he/she is doing
You don’t check that your child comes home at the time she/he was supposed to
You don’t tell your child where you are going
Your child comes home from school more than an hour past the time you expect him/her
You don't know where your child is out
Inconsistent Discipline You threaten to punish your child and then do not actually punish him/her
Your child talks you out of being punished after he/she has done something wrong
You feel that getting your child to obey you is more trouble than it’s worth
You let your child out of a punishment early (like lift restrictions earlier than you originally said)
Your child is not punished when he/she has done something wrong
The punishment you give your child depends on your mood
Parental Involvement You have a friendly talk with your child
You volunteer to help with special activities that your child is involved in (such as sports,
boy/girl scouts, church youth groups)
You play games or do other fun things with your child
You ask your child about his/her day in school
You help your child with his/her homework
You ask your child what his/her plans are for the coming day
You drive your child to a special activity
You talk to your child about his/her friends
Your child helps plan family activities
You attend PTA meetings, parent/teacher conferences, or other meetings at your child’s school
Positive Parenting You let your child know when he/she is doing a good job with something
You reward or give something extra to your child for obeying you or behaving well
You compliment your child when he/she does something well
You hug or kiss your child when he/she does something well
You tell your child that you like it when he/she helps out around the house
Note: This table shows the survey items for each domain measuring parenting style, taken from the Alabama
Parenting Questionnaire (Shelton, Frick, and Wootton 1996). Answers were given on a 5-point Likert scale (1 =
“never,” 5 = “very often”).

85
Appendix B3: Performance Differences After Tracking
One question that arises from our results is whether the treatment effect creates a potential
mismatch between students and secondary schools. Marginal students who got pushed into
academic high school by the treatment may perform relatively worse in the more challenging
school track. We analyze this question by looking at students’ grades in secondary school after
tracking has taken place. While grades are determined on a curve and might not be comparable
across schools’ tracks, this analysis can still provide important information about the relative
performance positions of treatment and control children in their respective school. If the
treatment causes a mismatch between students and schools, we would expect these children to
receive worse grades.
Figure B1 (Panel (a) and Panel (b)) shows the treatment effect for standardized math
and language grades at ages 13, 15, and 17. The figure shows the treatment does not affect
math or language grades in secondary school. Treated and untreated children perform similarly
during secondary school. This similarity seems to confirm that the intervention did not lead to
a mismatch between students and secondary schools. The intervention caused children to enter
more demanding school tracks without reducing their relative performance within these
schools. Once tracked, they do not underperform in comparison to the control group. These
results are consistent with the persistence of the treatment effect in secondary school
documented in Figure 3.
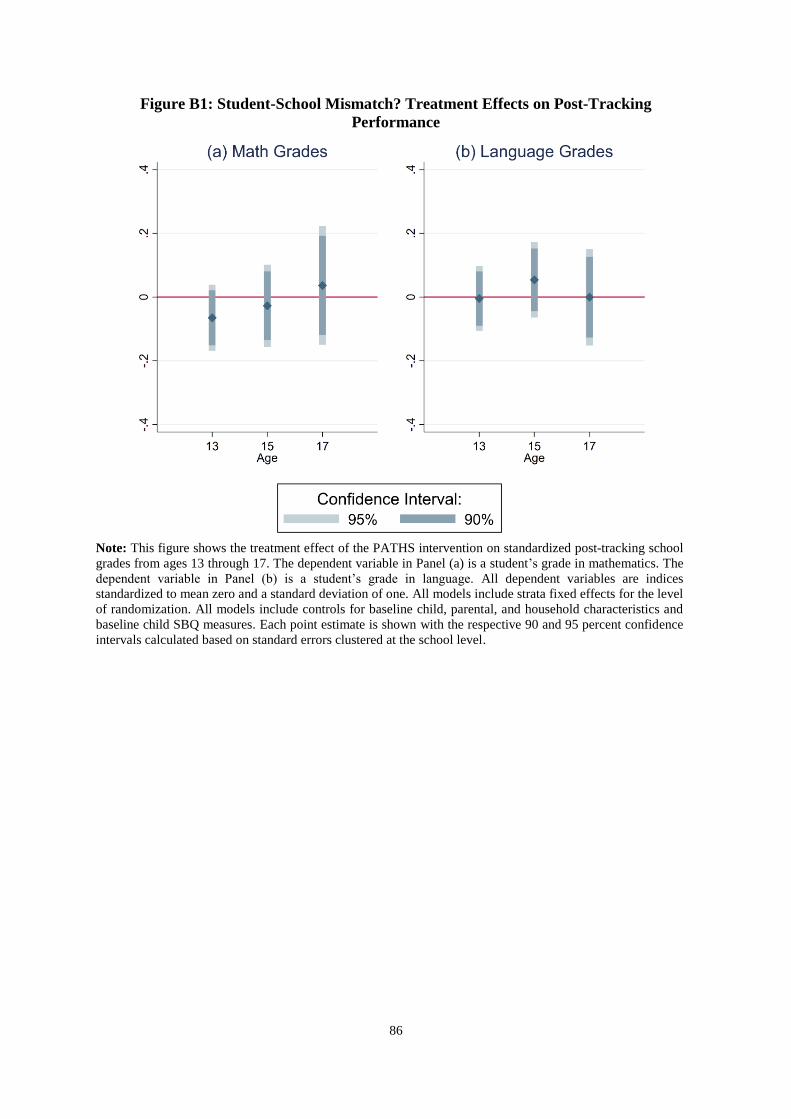
86
Figure B1: Student-School Mismatch? Treatment Effects on Post-Tracking
Performance
Note: This figure shows the treatment effect of the PATHS intervention on standardized post-tracking school
grades from ages 13 through 17. The dependent variable in Panel (a) is a student’s grade in mathematics. The
dependent variable in Panel (b) is a student’s grade in language. All dependent variables are indices
standardized to mean zero and a standard deviation of one. All models include strata fixed effects for the level
of randomization. All models include controls for baseline child, parental, and household characteristics and
baseline child SBQ measures. Each point estimate is shown with the respective 90 and 95 percent confidence
intervals calculated based on standard errors clustered at the school level.