the causes and consequences of investors in people ...people.bath.ac.uk/mnsbr/papers/dti...
TRANSCRIPT

The Causes and Consequences of Investors in People Accreditation
Bruce A Rayton
Work and Employment Research Centre University of Bath School of Management
A report prepared for the Department for Business, Enterprise and
Regulatory Reform (BERR)
July 2007 URN 08/625
Any questions concerning the content of this report may be addressed to:
Bruce A Rayton
Work and Employment Research Centre
University of Bath School of Management
Claverton Down
Bath
BA2 7AY
Email: [email protected]

Acknowledgements
Material from the Workplace Employee Relations Survey (2004) has been made available by the Office of National Statistics (ONS) through the UK Data Archive. We would also like to acknowledge the financial assistance of BERR. None of these bodies is responsible for the views expressed in the paper. The views expressed in this report are the authors’ and do not necessarily reflect those of the Department for Business, Enterprise and Regulatory Reform or the Government.
About WERS 2004
The Workplace Employment Relations Survey (WERS 2004) is a nationally representative survey of British workplaces employing five or more employees and covering all sectors of the economy except agriculture, fishing, mining and quarrying. More information on the survey can be found here:
http://www.BERR.gov.uk/employment/research-evaluation/wers-2004/index.html
The survey is jointly sponsored by the Department for Business, Enterprise and Regulatory Reform, the Advisory Conciliation and Arbitration Service (Acas), the
Economic and Social Research Council and the Policy Studies Institute. It follows in the footsteps of earlier surveys conducted in 1980, 1984, 1990 and 1998.
For further information please refer to the main published outputs from WERS 2004: the first findings booklet (Kersley et al, 2005), a report on small and medium-sized enterprises (Forth et al, 2006), and the 400-page sourcebook of detailed findings (Kersley et al, 2006). The sourcebook is published by
Routledge, while the first two reports are available free from BERR: http://www.berr.gov.uk/publications/index.html Please quote the URN when
ordering. The data from WERS 2004 is now available to users through the UK Data Archive (study number: 5294): http://www.data-archive.ac.uk

1 Introduction and summary of findings
This report uses WERS data to identify both the causes and consequences of workplace adoption of the Investors in People Standard (the Standard). Hoque (2003) suggests that achieving the Standard did not guarantee good training outcomes in the WERS 1998 data. However the Standard has changed substantially since 1998, and there has been substantial interest from other countries in licensing the Standard as a means to improve training (Hoque, Taylor & Bell, 2005). As such, a complete reassessment of the role the Standard plays in the UK economy is warranted: both to understand the effects of the new
Standard on UK workplaces as well as to understand what other countries can expect if they implement the Standard. This report approaches this task through
analysis of the managerial and employee cross sections from 2004 as well as the 1998-2004 panel data. The report examines what governs workplace self-selection into the Standard, determines whether the links between the Standard and training outcomes have changed between 1998 and 2004, and assesses whether the process of seeking the Standard is associated with changes in training over the period. Adoption of the Standard is widespread. The WERS 2004 cross-sectional survey of managers indicates that 36.7 per cent of UK workplaces (covering 46.8 per cent of employees) are accredited by Investors in People. These figures are up from 33.9 per cent of workplaces (covering 33.6 per cent of employees) as reported in WERS 1998.
Rayton & Georgiadis (2006) focus on the WERS98 data and provide evidence suggesting that those workplaces accredited by Investors in People may be revealing their propensity to train by their self-selection into the pursuit of the Standard rather than having their training levels positively influenced by the Standard itself. The evidence presented in this report suggests that the nature of
self-selection into the Standard has changed substantially since 1998, with some evidence that it is now low training workplaces that are particularly drawn to the
Standard. While not entirely flattering, the evidence presented in this report suggests that although the Standard is not good for every workplace there are
some circumstances in which it is capable of delivering meaningful improvements in training outcomes. The report begins with a review of some of the existing literature on Investors in People (section 2) and then moves into the presentation of the results of this study. This is broken into an analysis of the determinants of self-section into the Standard (section 3), the effects of the Standard on training levels in 2004 (section 4), and the effect of the Standard on changes in training between 1998
and 2004 (section 5). Section 6 concludes.
2 Some literature on the effects of Investors in People
The Standard was developed in 1990 by the National Training Task Force, with input from leading business, personnel, professional and employee organisations. The Standard provides a national framework for improving business performance through a planned approach to setting and communicating
business objectives and developing people. The desired result is that employees

can and are motivated to do things that match the needs of their organisations. Unlike other government initiatives to foster training (e.g., National Vocational
Qualifications and Apprenticeships), the Standard is market-based. Companies examine the requirements for achieving the Standard and make a decision about
whether or not to pursue certification. Organizations that can satisfy independent assessors that they meet the assessment criteria are rewarded with recognition by the body in charge of the Standard, IiP UK. The companies can then use the Investors in People logo, etc., in their correspondence, advertising and other activities. The Standard has been substantially revised over the years, but the main focus on the development of staff remains intact. Figure 1 is a diagrammatic representation of an idealized process by which an organization might know that its ‘investment in people is making a difference.’1 Of key
interest is the presence of ‘learning and development’ in the set of actions expected of workplaces meeting the Standard.
Although this report focuses on the impact of the Standard on training, organisations may accrue benefits from the Standard beyond increased training levels. IiP-UK, the organization that administers the Standard, suggests many positive outcomes associated with accreditation. The systems and processes put in place to satisfy the assessors are thought to improve training quality and quantity, thus generating benefits for accredited workplaces. The benefits include improved financial performance, customer satisfaction, employee motivation and lower wastage.2 Bell et al (2002a) employed semiotic analysis in order to consider the sign-value that is associated with the Standard and
explored the symbolic meaning of cultural artefacts, such as ‘the badge’ or ‘the flag’. Their approach enabled them to focus on the meaning surrounding the
Standard. They suggested that ‘organizations are subject to a process of image production and consumption and this process requires them to seek differentiation from other organizations by acquiring quality initiatives’ (p.1071). Similarly, Hoque et al (2005) suggest that adoption patterns for the Standard are an outgrowth of a marketing campaign for the Standard that focused on the ability of prestigious firms to differentiate themselves by adoption of the Standard (p. 148-149). According to Porter (1985), differentiation could be interpreted as a business need for companies. Differentiation advantage can
arise from any part of the value chain. For example, processes that are distinctive and not broadly obtainable to competitors can create differentiation
by reconfiguring the value chain. Porter identified a number of drivers of differentiation advantage and one of these was organizational learning. Therefore, the sign, the badge or the certificate on the wall may be ‘a signifier of a good and effective people management’ (Bell et al, 2002) and also act as a signal to buyers, suppliers, current employees and potential employees. Attainment of the Standard may also represent a signal to the professional peers of decision makers if successful accreditation enhances status in important professional networks.
1 http://www.investorsinpeople.co.uk/Standard/Introducing/Pages/Whatis.aspx
2 http://www.investorsinpeople.co.uk/Standard/Introducing/Pages/Benefits.aspx

The academic literature on the Standard typically identifies a small positive association between attainment of the Standard and the level of training (e.g.,
Sutherland, 2004; Hoque, 2003, 2008), but these effects are not very large and the cross sectional patterns in training activity across accredited workplaces are
not very flattering to the Standard. In particular, Hoque (2003) identified the existence of a set of workplaces that had achieved the Standard and also reported giving no training to employees within the largest occupational group in the workplace, and he suggested that this lack of training activity might be due to the atrophy of the training and development systems introduced to achieve accreditation (p. 566). Hoque (2008) has examined the WERS 2004 cross sectional data and finds similar results. The cross sectional nature of his investigations makes it impossible to identify causation, but Hoque’s evidence
certainly does not paint a positive picture of the Standard.
Despite the character of the academic evidence available on the Standard, there has been substantial interest from other countries in licensing the Standard as a means to improve training (Hoque, Taylor & Bell, 2005). As such, the publication of WERS 2004 provides a timely opportunity to re-examine the Standard. This analysis will facilitate an understanding of what further proliferation of the Standard in the UK might achieve as well as provide adopting countries valuable insight into what outcomes they might reasonably expect.
3 Determinants of self-selection into the Standard
In this section we report the results of analysis of the WERS 2004 managerial questionnaire to understand what drives the decision to go for the Standard. We do this because a realistic assessment of the effect of the Standard on training outcomes requires an understanding of the factors that lead workplaces to seek the Standard. We address this question by specifying a probit model in which a binary variable equalling one if the workplace has obtained the Standard (as indicated by BAWARD in the managerial questionnaire) is regressed against a range of workplace demographics, as well as some variables that indicate each workplace’s approach to planning, doing and reviewing people management issues. The results of this analysis also provide the starting point for the treatment effects models employed in section 4 of this report. The independent variables employed in the probit analysis are summarized by the answers to the questions in Table 1.
Additional variables have been contemplated for inclusion in the ‘doing’ category: in particular variables capturing the extent of various training outcomes. The results of an unreported probit analysis including these training outcomes are not materially different from the results reported in this section.
Table 2 presents the results of our probit analysis. After cases with missing data are dropped we retain data from 2,068 workplaces out of the 2,295 workplaces
included in the WERS data. We weight the data using the establishment weights provided with the data. The model converges in six iterations and correctly predicts 70.89 per cent of the cases.
Examination of Table 2 reveals no effect of firm size on the probability that a workplace will be accredited by Investors in People, though workplaces that are single establishments are less likely to have the Standard than workplaces that

are part of some larger organization. We see evidence that workplaces in the hotel & restaurant industry, financial services, transport & communication and
other business services are more likely to be accredited than manufacturing workplaces. We see no evidence that the home country of any parent company
changes the probability of accreditation, but we see that establishments between five and 10 years of age are more likely than those aged 10-20 to meet the Standard. Public sector organizations and charities are both more likely to be accredited than other workplaces. This is also true of workplaces that recognize at least one union.
We also examined seven variables that reflect the Investors in People focus on, ‘plan, do and review’ in the management of people. The presence of a formal
strategy, and the inclusion of people management issues within this strategy are both positively related to the probability that a workplace is accredited. This is
also true of the presence of a manager or director at a higher level than the survey respondent who spends a major part of his/her time on personnel or employee relations matters. The use of an employee attitude survey is associated with a higher probability of accreditation, as is the use of quality targets. The use of quality circles is unrelated to the probability of accreditation.
These results reveal interesting patterns in the distribution of the Standard. While we are unwilling to suggest that all of these relationships are causal, the estimation of these linkages allows us to examine the effects of these relationships on the assessment of the connections between Investors in People
and a range of training outcomes in the next section.
4 Effects of the Standard on training levels
In this section we report the results of the use of a Heckman two-stage approach to estimate the effects of the Standard on training outcomes. We begin by describing the Heckman method and its advantages, and then move on to explain its implementation before examining estimates of the effect of the Standard on key manager-reported and employee-reported variables.
4.1 Testing for treatment effects
There is an established literature on treatment effects. Greene (2003, p. 787-789) provides a good textbook treatment of the issue, and current academic discussions are available in a special issue of the Journal of Econometrics (v. 125, 1 & 2). This section is intended to motivate the importance of the issues
addressed in this literature, and to demonstrate their applicability to analysis of the Investors in People Standard. We begin by discussing the difference between
these approaches to estimating treatment effects and the simple dummy variable approach often used in the literature.
There have been many statistical advances that allow researchers to interrogate the effectiveness of treatment programs in detail. Studies often focus on the average treatment effect, the local average treatment effect, the marginal treatment effect, and the effect of treatment on the treated (Heckman et al, 2003). The average treatment effect is defined as the expected gain from the
treatment for a randomly selected individual in the population. The local average treatment effect is defined as the expected gain for those individuals who can be

induced to receive treatment by a change in some determinant of treatment selection (e.g., a subsidy). The marginal treatment effect measures the average
gain for individuals who are indifferent between treatment and non-treatment. The effect of treatment on the treated is the average gain achieved by those
individuals who elect for treatment. This paper focuses on the effect of treatment on the treated, as this has been the main focus of the existing literature on the Investors in People Standard. A standard approach to estimating treatment effects has been the inclusion of a binary (dummy) variable in a regression equation, where the binary variable takes the value of one for those cases that have had the treatment and zero for all other cases. Coefficient estimates that are significantly different from zero for
this binary variable are used to suggest that the treatment is having an effect, and the sign and magnitude of the estimated coefficient associated with this
binary variable indicates the direction and size of the effect.
This approach may not be appropriate in an environment where individuals are choosing whether or not to have treatment. This is because it is likely that individual characteristics will play an important role in this decision. Greene (2003, p. 787) uses the example of the impact on earnings of individuals choosing to get a university education. In this example the university education is the treatment and the level of earnings is the context in which any treatment effect is measured. Application of the standard approach would involve an earnings equation that has a dummy variable equalling one if the individual had
a university degree, but the coefficient associated with this dummy variable might be misleading if individuals are self-selecting participation in the
treatment. In particular, it is likely that students who have performed the best at their current educational level will be more likely to pursue a university degree. It also seems likely that these students could already expect to earn more than their non-university-attending counterparts without the benefit of a university education. The true effect of a university education on earnings should be measured in a way that looks for improvements in income over and above this likely initial position.
Put more exactly, the standard approach to measuring treatment effects will overestimate the usefulness of the treatment if individuals who are already likely
to have better outcomes are also more likely to opt for treatment. Conversely, the standard approach will underestimate the size of the treatment effect if individuals who are likely to exhibit better outcomes anyway are less likely to opt for treatment. An example that illustrates this converse effect is the relationship between the purchase of chiropractic back treatment and its effect on back pain. If only the ‘sick’ opt for the ‘treatment’ then a failure to account for this selection bias would lead to an underestimate of the effectiveness of the treatment. In some cases, the direction of the estimated effect could be
reversed upon correction for this selection bias.
An established way of dealing with self-selection in treatment programs is the Heckman two-step approach. This approach originates in Heckman (1979), and it has entered textbooks in various forms.3 The Heckman approach begins by
3 Interested readers should consult Greene (2003, p. 784) for an excellent treatment of the subject.

estimating a probit equation on the decision to go for treatment. The results of this first stage estimation are used to calculate the inverse Mills ratio.4 The
inverse Mills ratio extracted from this ‘treatment equation’ is included as an independent variable in the second stage estimation of the ‘effect equation.’
Identification of the model is achieved by excluding one variable used in the estimation of the treatment equation from the estimation of the effect equation. The chief coefficient of interest in the second stage results is the one associated with the inverse Mills ratio. If this coefficient is significantly different from zero it suggests the existence of self-selection into the treatment, and thus justifies the use of the two-step approach. The sign of this coefficient indicates the nature of the selection process. In particular, a positive sign would indicate an environment where individuals who were already relatively advantaged in the
realization of the effects are more likely to opt for treatment, while a negative sign would indicate the converse. Like the standard approach, the effect of the
treatment is illustrated by the coefficient in the effect equation associated with the binary treatment status variable.
The coefficient associated with the treatment dummy variable in the effect equation is an estimate of the effect of the treatment on the treated. The two-stage approach we adopt is also capable of producing all of the parameters needed to consistently estimate the average treatment effect, the marginal treatment effect and the local average treatment effect (Heckman, 1976), but we focus on the effect of treatment on the treated as this is the focus of the existing literature on the Investors in People Standard.
Our application of the Heckman approach in this paper involves the use of
workplace-level data to estimate the treatment equation and employee-level data to estimate the effectiveness of the Standard. The inverse Mills ratio from this first stage is then associated with each of the employee responses from a given workplace in the estimation of the effect equation. We use data from all available workplaces in the estimation of the treatment equation rather than limiting the analysis to the use of those workplaces that also participated in the employee survey. The approach is the same as the one employed by Schneider et al (2003) in the analysis of the effect of the National Estuary Program on the
character of estuary networks in the United States.
4.2 The regression model
The dependent variables in the effect equations reported here capture the incidence and extent of various training activities in workplaces. We investigate four manager-reported training outcomes and two employee-reported training
outcomes. These are:
• Manager-reported:
4 The inverse Mills ratio is defined in Greene (2003, p. 759), and is sometimes also called the hazard function
for the standard normal distribution. A full formal definition of the inverse Mills ratio is beyond the scope of
this paper, but it is constructed as the ratio of the probability density function to the cumulative density function,
where both are evaluated at the values of the independent variables and probit parameter estimates associated
with each observation.

1. On average, how many days of training did experienced (employees in the largest occupational group) undertake over the past 12
months? (CTRAIN) 2. Is there a standard induction programme designed to introduce new
(employees in the largest occupational group) to this workplace? (CINDUCT)
3. What proportion of experienced (employees in the largest occupational group) have been given time off from their normal daily work duties to undertake training over the past 12 months? (COFFJOB)
4. Approximately, what proportion of (employees in the largest occupational group) are formally trained to be able to do jobs other
than their own? (COTHJOB)
• Employee-reported:
5. During the last 12 months, how much training have you had, either paid for or organized by your employer? (B4)
6. Are people working here encouraged to develop their skills? (C2e)
The independent variables in the treatment equation are the same as those used in generating the results presented in section 3. The independent variables in the effect equations include the Investors in People dummy variable, the inverse Mills ratio calculated from the results of the treatment equation, as well as all of the independent variables from the treatment equation, with the exception of
the indicator describing the people management role of the survey respondent. This variable is withheld to identify the Heckman estimator.5 Additionally, the
effect equations based on employee-reported training outcomes include a range of independent variables capturing employee characteristics as summarized by the following questions:
• How old are you? • Which of the following describes your current status (single, widowed,
divorced, living with partner)? • What is the highest educational qualification you hold? • Is your job permanent, or is it temporary or for a fixed-term? • How many hours do you usually work each week, including any overtime
or extra hours? • Which of the following occupational groups best describes your job at
present? • How much do you get paid for your job here, before tax and other
deductions are taken out? • Are you now, or have you ever been a member of a trade union or staff
association? • Are you male or female? • Are you a member of an ethnic minority? • Do you have dependent children?
5 We check the validity of this identification restriction by examination of a standard (i.e., non-Heckman) model
that includes this variable in the effect equation. The point estimates for this variable are not significantly
different from zero.

These variables provide meaningful explanatory power in the employee-level analyses and facilitate focus on workplace-level effects rather than on those
effects determined by the individual backgrounds of particular employees.
4.3 Results
The key results of the analyses relating to the relationship between the Standard and training outcomes are summarized in Table 3. This table displays descriptions of the various models discussed below, as well as coefficient
estimates for the impact of the inverse Mills ratio and Investors in People on training outcomes. When a significant relationship is identified between the
inverse Mills ratio and the training outcome the table reports the coefficient results for the Standard from the same model. When no significant relationship is identified for the inverse Mills ratio the effect of the Standard is captured by a model that estimates the effect using the standard approach described in section 4.1 (i.e., by excluding the inverse Mills ratio from the analysis). All iterative procedures meet appropriate convergence criteria. The table also displays the type of model used in the estimation. This reflects the nature of the dependent variable. When the dependent variable is binary (e.g., workplaces either have a
standard induction programme or they do not) the appropriate statistical model is a probit model. When the dependent variable has more than two categories
we use an ordered probit estimator (hence the label ‘ordered’).
The first thing of note is the limited evidence of self-selection into the Standard. The only statistically significant coefficient associated with the inverse Mills ratio is associated with the level of employee-reported training (95% level). We see
no evidence of self-selection associated with the other training outcomes, though the coefficient associated with the inverse Mills ratio in the analysis of
managerial-reported training is similar in magnitude to that associated with employee-reported training. These results suggest some value associated with the Heckman approach in this context, but may also indicate that the limited number of useful observations available through the managerial responses (e.g., as low as 1,393) may limit the applicability of the approach here.
Investigation of the marginal effects associated with employee-reported levels of encouragement for skill development reveals a second interesting result: that the Standard is associated with a small improvement in the level of agreement with the statement that managers, ‘encourage people to develop their skills.’
The probabilities associated with answering, ‘strongly agree’ or ‘agree’ rise by 3.3 points and 2.4 points respectively. These differences are small, but they are significant at the 99 per cent and 95 per cent levels respectively. These results contrast with the findings of Rayton and Georgiadis (2006) based on the WERS98 data, where Rayton and Georgiadis also found evidence of self-selection into the Standard by workplaces that already encouraged workers to develop their skills, and an erosion of the sense of encouragement reported by employees once this self-selection phenomenon had been taken into account.
The third notable result is the positive effect of the Standard on both the level and spread of training in the workforce. While we see no evidence of any relationship between the Standard and the use of a standard induction programme, we see positive effects associated with manager-reported and employee-reported training levels, as well as managerial reports of cross-

training (COTHJOB) and training diffusion (COFFJOB). Investigation of the marginal effects associated with the employee-reported levels of training
suggest that meeting the Standard is associated with a 20.3 point reduction in the probability that an employee reports no training. There are no detectable
changes in the probabilities associated with employee reports of less than a day of training, or reports of between 1 and 2 days of training. We see significant increases in the probabilities associated with reports of 2 to 5 days of training, 5 to 10 days of training, and more than 10 days of training (+8.1 points, +6.3 points and +6.7 points respectively). This represents a substantial change in the training reports of employees, and the result is enhanced by the nature of self-selection into the Standard. The negative and significant coefficient associated with the inverse Mills ratio suggests that workplaces that would otherwise be
giving low training are particularly drawn to the Standard. Put differently, workplaces appear to behave like purchasers of medical services, where the sick
are more likely to consume services. This represents a substantial change from previous studies of the Standard in its earlier form using WERS 98 data (e.g., Rayton and Georgiadis, 2006), and this result is worth further exploration in section six in the context of the results presented in section five.
5 Investors in People and changes in training
This section of the report uses the 1998-2004 WERS panel survey. There were 285 workplaces in the 1998-2004 panel claiming accreditation in 1998 as well as 627 other workplaces, of which 150 had applied for accreditation within the previous five years. There is no information about the Investors in People status of the workplaces in the 2004 wave of the panel dataset. Missing data and workplace change further restrict the observations available for analysis. We restrict our analysis to workplaces that report all the relevant information in 1998 and 2004, and for which the two-digit SOC90 occupational group does not change between the two years.6 After accounting for missing data we are left with a sample of 335 workplaces: 122 that were accredited in 1998; 56 workplaces that had applied for the Standard as of 1998; and 157 workplaces in the control group. The separation into three groups: treated, treating, and control; allows useful paired comparisons of the levels of training in 1998 and 2004 in the same workplaces, and also allows regression analysis of the changes in these reported training outcomes.
We construct variables from the panel dataset consistent with the existing literature on the determinants of training. Limitations of the 2004 wave of the panel impose some limits on our ability to insert controls for everything indicated in this literature, but we do have the advantage of specifying the model in level changes. This means that any time-invariant determinants of training are swept out of the regression model. These include location-specific factors which can not
be controlled for in the cross sectional data without exposing the confidentiality of survey respondents. Thus, while we may be forced to omit some variables
shown to be important in previous studies we are able to eliminate specification errors on other margins.
6 We have also widened our sample to include those workplaces with a one-digit (major occupational group)
match. This does not affect the results in any meaningful way.

The 2004 wave of the WERS panel is based on a return to 1,479 of the 2,191 workplaces that participated in the 1998 managerial cross sectional survey. This
second wave survey included only a subset of the questions asked in the 1998 survey in order to facilitate a reasonable response rate. Of the training variables
analyzed in the earlier sections of this document, only the proportion of the largest occupational group receiving training (COFFJOB) and the proportion of the largest occupational group that is trained to do more than their own jobs (COTHJOB) are asked in the both the 1998 and 2004 panel waves. We focus here on the first of these (COFFJOB), and hereafter use it as a measure of the diffusion of training through the largest occupational group. Clearly the level of training and the presence of standard induction programmes would be of interest, but the limitations of the 2004 panel wave make this analysis
impossible.
5.1 Research questions
The work in section four of this report examines the effects of the Standard on training levels, but says nothing about the effectiveness of the Standard for delivering changes in training. IiP-UK suggests that accreditation with the
Standard suggests a commitment to continual review and renewal of employee skills, and in this section we examine the effects of the Standard on changes in
training directly. We begin by posing the following null and alternate hypotheses:
H10 The Investors in People Standard has no effect on changes in training after the Standard has been met.
H11 The Investors in People Standard has a positive effect on changes in training after the Standard has been met.
Rejection of the null hypothesis above suggests a positive effect of the Standard on changes in training, and thus reflects the view presented by Investors in People of a process of constant renewal in Figure 1.
Previous work using the WERS data (e.g., Hoque 2003; Rayton & Georgiadis
2006) omits those workplaces seeking the Standard in an effort to achieve a clear distinction between accredited and non-accredited workplaces. However, if the value of the Standard comes not from holding the Standard but from seeking it, then those workplaces experiencing the benefits of the Standard have been dropped from previous analyses of WERS data. We extend this literature by specifying null and alternate hypotheses associated with the pursuit of the Standard. Specifically:
H20 The process of seeking the Investors in People Standard has no effect on changes in training.
H21 The process of seeking the Investors in People Standard has a positive effect on changes in training after the Standard has been met.
Support for H21 would suggest that the process of meeting the Standard generates an immediate impact on training outcomes. Such benefits could be

completely independent of any benefits associated with holding the Standard, and such evidence could help explain the apparent dichotomy between academic
publications that suggest that the Standard has only limited effects on training activity with the observed differences in training levels apparent by inspection of
the data. Support for H20 would suggest that the observed differences in training levels are not the result of pursuit of the Standard.
The revelation in 1998 of the Investors in People status of a representative sample of UK workplaces and the subsequent return to these workplaces to gather additional information on training in 2004 provides an opportunity to extend the existing literature on the Standard’s effect on levels of training. We can directly examine the effect of the Standard on changes in training, and the
separation of workplaces meeting the Standard (‘treated’) and workplaces that have applied (‘treating’) from a control group with no link to the Standard allows
more meaningful comparison of the effects of the Standard over time.
5.2 Dependent variable
We focus on the percentage of employees in the largest occupational group who
received off-the-job training in the previous year (COFFJOB). Recall that COFFJOB records managerial responses to the question, ‘What proportion of
experienced (workers in the largest occupational group) has had formal off-the-job training over the past 12 months?’ This training is defined in WERS as,
‘training away from the normal place of work, but either on or off the premises.’ This training diffusion measure is constructed using a 7-item Likert scale, where the scale is anchored at ‘none’ and ‘all’, with the intervening five points each corresponding to a 20 per cent band (e.g., 40-59 per cent is in the middle of the scale). We have centred the scale at zero for regression analyses, and coded it such that higher values correspond to more training.
Figure 2 displays the mean values associated with this variable for each of the experimental groups in 1998 and 2004. We can see that the average levels of training have been rising in all groups between 1998 and 2004. The training level is highest in those workplaces seeking the Standard as of 1998 and lowest in the control group. Testing for the difference between the means of these groups reveals a significant difference between the extent of training diffusion in the ‘treating’ workplaces relative to the control group (p=0.028). The other differences between the experimental groups are not significantly different from
zero.
Figure 3 shows a histogram of changes in the percentage of employees in the largest occupational group receiving off-the-job training over the period. The mean change in the proportion of employees receiving off-the-job training is a 0.77 point increase in training on the Likert scale. Exactly what this means for average proportions of workers who receive training is impossible to verify in this data, but recall that a change of one Likert band in the middle of the scale corresponds to a 20 per cent swing. This positive mean value masks substantial variation in training changes across workplaces. There are reports of ‘all’ in 1998 and ‘none’ in 2004 (a value of -6) as well as the converse. These extreme values occur often enough to think that response bias and measurement error are unlikely to explain all of these occurrences. The spread of the responses also suggests meaningful variation worthy of further exploration.

5.3 Independent variables
This regression model employed in this paper draws heavily on previous work on
training levels in the WERS98 data. In particular, we acknowledge the work of Sutherland (2004) in helping us select the variables included in this model.
The Investors in People status of the workplace is of primary importance among the independent variables. We include two dummy variables in our analyses which are based on BAWARD and BAPPLIED in the 1998 wave of the panel dataset. The first is set equal to one if the workplace had met the Standard and is otherwise equal to zero. The second is set equal to one if the workplace had applied for the Standard in 1998 and is otherwise equal to zero. Inclusion of both variables in a regression model allows us to test the training levels of these
groups relative to a control group that had nothing to do with the Standard in 1998.
We use changes in the measure of total employment in the organization (ZALLEMPS) to capture changes in workplace size. We also use this variable in concert with measures of the headcounts in various employee groups in order to ascertain the effects that changes in the mix of employees may have on the levels of training indicated in the workplace. These are discussed in turn.
We include the change in the percentage of the workforce that is male to account for any gender differences in training. The literature indicates that men are seen to place greater emphasis on instrumental or economic concerns while
women are more likely to be concerned with discretionary behaviour within the organisation (Ibrahim and Angelidis, 1994; Smith et al 2001). Since women are
less instrumental than men and may therefore place less value on the investment component of training men may demand more training than women. This argument is supported by variants of human capital theory which suggest that women have a comparative advantage in childcare and are more likely to substitute domestic for paid work (Becker, 1976). Under these conditions ‘they are therefore less available and less committed to paid work and they have less interest in training’ (Fletcher, 2005; p. 573).
We include a series of percentage variables to capture changes in the occupational mix of the workforce. We normalize on the proportion of the
workforce in operative occupations, and include controls for the fraction of employees working as managers, professionals, technical workers, clerical/administrative workers, craft & skilled service workers, personal service workers, salespeople, and those who are in unskilled occupations. These may be important predictors of changes in training because workers in different occupations have different skill sets and expectations, and movements of relatively low-skill jobs out of the UK between 1998 and 2004 may lead to increases in average training levels in workplaces.
We include changes in the proportion of workers who are members of a union.
Union membership has been shown to be a significant indicator of training. For example, Sutherland (2004) finds that the existence and coverage of union membership are significantly related to the amount of training in the WERS98 data.

We include changes in the proportion of full-time employees as another control variable, as there may be greater opportunities for workplaces to gain the
returns on any given training investment in full-time workers relative to part-time workers, and we include changes in percentage of minority employees to
control for differences in the treatment of minority workers.
Consistent with Sutherland (2004) we include the changes in the existence of a formal strategic plan and changes in the proportion of the largest occupational group working in formally designated teams to control for some changes to some common workplace structures which might indicate changes in training levels.
Although we estimate the model in changes, we estimate the model with industry controls. We think this is important because the period from 1998 to
2004 is a period of substantial technological change, and these changes are unlikely to have impacted all industries equally. The period is one of general expansion in the UK economy, but there have been substantial changes in the mix of output over the period. Changes in exchange rates in particular have prompted a decline in the share of UK output from the manufacturing sector. Such variety in the macroeconomic forces at work may induce variety in the changes in training indicated.7
5.4 Regression model
We use the general linear model in the SPSS complex samples module to construct estimates of the effects of the Standard on changes in off-the-job training in the largest occupational group. This approach weights the coefficient estimates and adjusts the standard errors in order to compensate for variations in the sampled proportion of the population in various strata inherent in the sampling strategy of the survey design. We have also used an ordered probit estimator to capture the discrete nature of the dependent variable. These results
mirror the results of the general linear model.
Suppose the levels of training for i workplaces at time t, represented by the i-dimensional vector Tt, are determined according to the equation 1:
ttt ZXT εµλ +′+′= . (1)
Where tX ′ is a matrix of time-varying independent regressors and Z ′ is a matrix
of time-invariant regressors. The regression coefficients are captured by the
vectors λ and µ , and an error vector, tε , which contains residuals that are
independently and identically distributed. Another strategy for estimating λ is to
estimate the model in changes. Lagging equation 1 and taking differences produces:
( ) ( ) ( ) ttttttttt XXZZXXTT υλεεµλ +′−′=−+′−′+′−′=− −−−− 1111 . (2)
This approach allows the estimation of λ without any information on the time-
invariant influences on training levels. This is particularly useful in the context of WERS data, as there are a range of workplace characteristics that are
7 We have run our regressions with and without industry controls without any change to the nature of the
findings.

unobserved because of restrictions on the survey instrument and restrictions on disclosures that might undermine the confidentiality of the survey respondents.
In the context of examining the impact of Investors in People on training, we
could estimate the cross sectional parameter associated with the effect of the Standard on the level of training by observing changes in the status of workplaces. This information is not available in the WERS panel, as this question was not included in the 2004 panel wave, but this would only serve to provide an additional estimate of the regression parameter examined already in Hoque (2003). There would be reductions in bias to the extent that the method allowed more effective control for time-invariant factors (e.g., geography), but the subject of this analysis would still be the same parameter.
Instead of focusing on the same relationship studied in the past, this paper
investigates a model in which changes in training may be influenced by Investors in People status. In particular, we estimate:
( ) tttttt IXXTT υκλ +′+′−′=− −−− 111 . (3)
Equation 3 includes a matrix capturing the Investors in People status of the
workplace at t-1. The modelling strategy is focused on changes in training because differencing of the dependent variable allows us to eliminate the
influence of any time-invariant firm-specific variables on the coefficient estimates, and to focus exclusively on the ability of the Standard to change
training practices. This focus on changes can help us differentiate between competing hypotheses regarding the cause of observed differences in training levels between accredited and non-accredited workplaces.
5.5 Results
This section describes some of the patterns in changes in training for the period from 1998 through 2004. Table 4 displays the results of six regression models. We report on each of the models in turn. All regressions are carried out using the WERS panel weights to generate accurate standard errors.
Model 1 examines the determinants of the proportion of the largest occupational
group receiving off-the-job training in the last 12 months. This model includes only a constant and dummy variable indicators for the Investors in People status of each workplace. This approach amounts to a simple test of the difference between the mean change in training for the control group and the mean change in training for the other experimental groups. Unsurprisingly, this model fits extremely poorly, but importantly reveals that while the observed changes in training are on average smaller in treated workplaces than in the control group, and while changes in the treating group are larger than in the control group,
neither of these differences is statistically significant.
Model 2, which incorporates a series of control variables described above, fits considerably better (R2=0.275). Many of the control variables are significantly related to changes in training. We observe positive relationships between training and changes in the proportion of male employees, managerial employees, professional employees, and personal service employees. We also see some evidence that changes in training are smaller in the electricity industry and the construction industry relative to the manufacturing industry.

Model 3 is estimated using an ordered probit estimator. These results operate as a useful comparator for the results using the general linear model. There is no
measure for an ordered probit model that is directly comparable to R2, but the model converges normally in 44 iterations, and all of the individual values for the
change in training are observed with sufficient frequency to allow reasonable inferences to be drawn form the model. We note that the signs of all the coefficients in Model 3 are the same as those in Model 2. The only changes to the significance pattern observed in Model 2 is the emergence of significance for the changes in the percentage of salespeople in the workplace and the elimination of the significance of the control for those workplaces in the electricity industry.
The picture presented in Models 1-3 is not particularly flattering to the Standard. We see no evidence that having or seeking the Standard generates changes in
the diffusion of training. How can this be reconciled with the results found in the previous section, where we observed some evidence that workplaces with otherwise low levels of training appeared particularly drawn to the Standard? To investigate this we split the sample of 335 workplaces in the sample into three groups: those that offered training to under 20 per cent of employees in the largest occupational group (107 workplaces), those that offered training to between 20 per cent and 79 per cent of these employees (121 workplaces), and those who offered training to 80 per cent or more (107 workplaces). These results are reported as Models 4-6. Model 4 is notable because it demonstrates value associated with seeking the Standard for those workplaces that begin from
a very low level of training diffusion in 1998. This result is significant at the 99 per cent level. We discuss this result in the context of the selection bias
identified in section 4 in the concluding discussion below.
6 Summary and conclusions
The evidence presented in this paper contributes to the literature examining the effect of Investors in People on training. Rayton & Georgiadis (2006) focus on the WERS98 data and provide evidence suggesting that those workplaces accredited by Investors in People may be revealing their propensity to train by their self-selection into the pursuit of the Standard rather than having their training levels positively influenced by the Standard itself. The evidence presented in this report suggests that the nature of self-selection into the Standard has changed substantially since 1998, with some evidence that it is now low training workplaces that are particularly drawn to the Standard. Still, there remain some serious deficiencies in the Standard’s ability to improve training outcomes: most notably on the use of standard induction programmes. Hoque (2008) describes in detail some other deficiencies in the pattern of training in UK workplaces, most notably illustrated by its inability to deliver equal opportunities with regard to training provision.
The combination of the results from sections four and five provide a mutually-reinforcing picture of the attractiveness of the Standard to low-training workplaces. In section four we see statistical evidence that low training workplaces self-select into the Standard. In section five we see evidence that this attraction might be the result of greater efficacy of the Standard at generating changes in training in these workplaces. We are mindful that the definition of training in section five is one of diffusion (rather than level), thus

making it impossible for high-diffusion workplaces to demonstrate improvements, but comparison of the results of models four and five in Table 4
suggests that such measurement artefacts are not driving the results for low-diffusion workplaces.
The results of this report provide some evidence that the Standard is associated with meaningful improvements in a range of training outcomes, but the results are not entirely flattering. In particular, the Standard is often suggested as an example of best practice, and there is little evidence presented in this report that would support such a view. That said the evidence is consistent with benefits associated with the Standard when sought by low training workplaces. The evidence suggests that while the Standard is not good for every workplace there
are some circumstances in which it is capable of delivering meaningful improvements in training outcomes.
References
Alberga, T., Tyson, S., and Parsons, D. (1997). An evaluation of the Investors in People Standard. Human Resource Management Journal, 7(2): 47-60.
Becker, G. S. (1976) The economic Approach to Human Behavior. Chicago: University of Chicago Press.
Bell, E., Taylor, S. and Thorpe, R. (2001) Programmatic change and managerial action: A qualitative study of Investors in People. Human Resource Research Unit Working Paper. Milton Keynes: Open University.
Bell, E, Taylor, S. and Thorpe, R. (2002a). Organisational differentiation through
badging: Investors in People and the value of the sign. Journal of Management Studies, 39(8): 1071-1085.
Bell, E, Taylor, S. and Thorpe, R. (2002b). A step in the right direction? Investors in People and the learning Organization. British Journal of Management, 13: 161-171.
Berry, C. and Grieves, J. (2003). ‘To change the way we do things is more
important than the certificate on the wall’: does Investors in People represent an effective intervention strategy for organisational learning? Learning Organization, 10(5): 294-304.
Collins, L. A., and Smith, A. J. (2004). Understanding the new Investors in
People standard – lessons from experience. Personnel Review, 33(5): 583-604.
Douglas, A., Kirk, D., Brennan, C. and Ingram, A. (1999). The impact of Investors in People on Scottish local government services. Journal of Workplace Learning, 11(5): 164–9.
Down, S. and Smith, D. (1998). It pays to be nice to people: Investors in People and the search for measurable benefits. Personnel Review, 27(2): 143-155.
Fletcher, C. (2005). Outre-Manche/Across the Channel: Ongoing training and
gender in France and Germany. Gender, Work and Organization, 12: 572-590.
Hoque, K. (2003). All in All, it’s Just Another Plaque on the Wall: The Incidence
and Impact of the Investors in People Standard. Journal of Management Studies, 40(2): 543-571.

Hoque, K. (2006) The impact of Investors in People on employer-provided training and the equality of training provision. Employment Research Unit
Conference paper, Cardiff.
Hoque, K.(2008). The Impact of Investors in People on Employer-provided
Training, the Equality of Training Provision and the 'Training Apartheid' Phenomenon", Industrial Relations Journal, forthcoming 2008.
Hoque, K., Taylor, S. and Bell, E. (2005). Investors in People: Market-led Voluntarism in Vocational Education and Training. British Journal of Industrial Relations, 43(1): 135-153.
Ibrahim, N. A., and Angelidis, J. P. (1994). Effect of board member’s gender on
corporate social responsiveness orientation. Journal of Applied Business Research, 10: 35-41.
Kidger, P., Jackson van-Veen, M. and Redfern, D. (2004). Transferring the Investors in People Concept from the UK to the Netherlands. Journal of European Industrial Training, 28(6): 499-518.
Porter, M.E. (1985) Competitive advantage. New York: The Free Press.
Rayton, B.A. and Georgiadis, K. (2006) The effect of the Investors in People
Standard on UK workplaces. Western Economics Association conference paper, San Diego.
Smith, W. J. Wokutch, R. E., Harrington, K. V., and Dennis, B. S. (2001). An examination of the influence of diversity and stakeholder role on corporate
social orientation. Business and Society, 40, 266-294.
Sutherland, J. (2004). The Determinants of Training: Evidence from the
Workplace and Employee Relations Survey. Economic Issues, 9(1): 23-38.
Spilsbury, M., Moralee, J., Frost, D., and Hillage, J. (1995) Evaluation of
Investors in People in England and Wales. Institute of Employment Studies, Research Report 263.

Figure 1: Investors in People process 8
8 http://www.investorsinpeople.co.uk/Standard/Introducing/Pages/Whatis.aspx

Figure 2: Means of proportions of employees in the largest
occupational grouping receiving off-the-job training reported in
the 1998-2004 WERS panel data by experimental group.
0
1
2
3
4
5
Treated Treating Control
1998
2004
Higher values represent more training. Based on 7-point Likert scale responses to COFFJOB in 1998 and 2004. Weighted using the panel weights. Limited to
workplaces that report in both years and maintain same two-digit occupational group as the occupation associated with their largest occupational group.
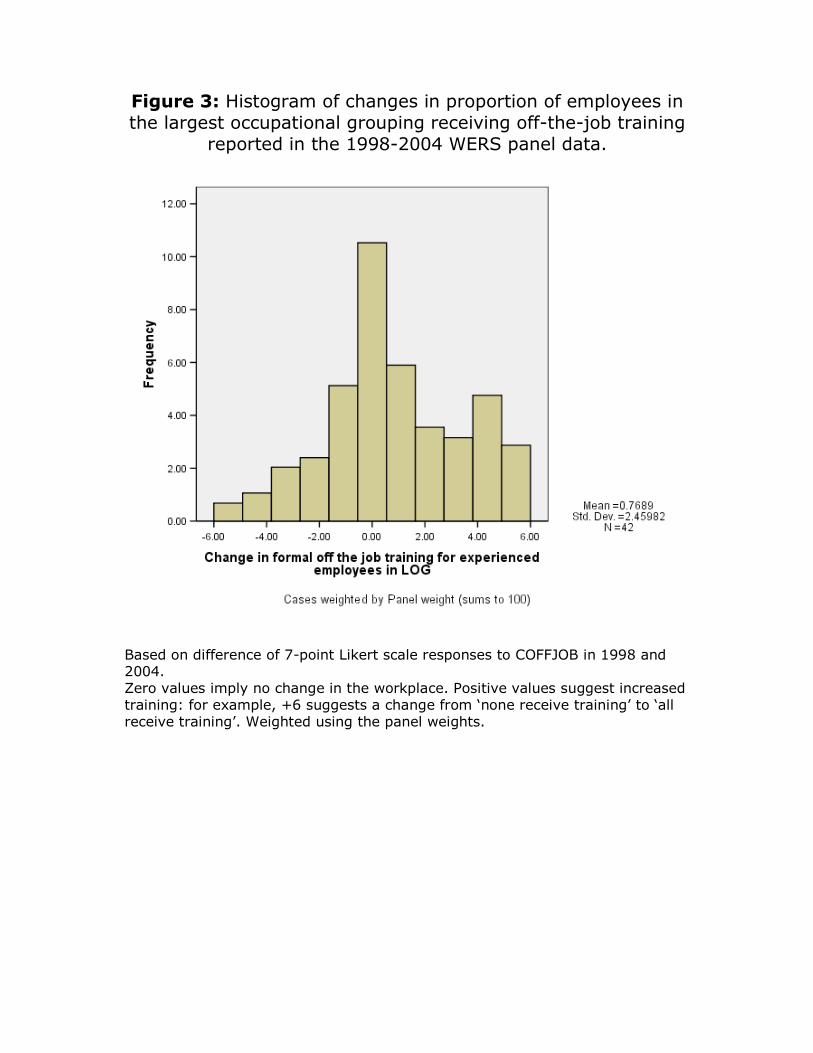
Figure 3: Histogram of changes in proportion of employees in
the largest occupational grouping receiving off-the-job training
reported in the 1998-2004 WERS panel data.
Based on difference of 7-point Likert scale responses to COFFJOB in 1998 and 2004. Zero values imply no change in the workplace. Positive values suggest increased training: for example, +6 suggests a change from ‘none receive training’ to ‘all receive training’. Weighted using the panel weights.

Table 1. Independent variables included in probit analysis
Workplace demographics
What is the main activity of the establishment? (According to SIC 1992 code).
Where is the market for your main product or service (local, national, international, etc.)?
The type of company (reference category is private company).
For how long has this establishment been operating here at this address?
Is the establishment one of a number of workplaces in the UK belonging to the same organization, a single independent establishment, or the sole UK establishment of a foreign organization?
Is the workplace part of the public sector? Currently how many employees work at the
establishment? The extent of specific human capital in the workplace. What is the country of incorporation? What percentage of employees are members of a trade
union?
Respondent demographics
Managerial respondent is female
Is employee relations your major job responsibility or are you more concerned with other matters such as financial management or administration at this workplace?
Planning Is there a formal strategic plan for the workplace? Does this plan address learning and development issues? Is there a board representative tasked with people
management/employee relations issues? Is there someone at the workplace for whom people
management is a major part of their job?
Doing Is an employee attitude survey conducted at the workplace?
Reviewing Quality circles. Reviewing performance relative to quality targets.

Table 2: Determinants of Investors in People accreditation in 2004
Probit analysis of WERS 2004 managerial cross-section using establishment weights.
Dependent variable
Investors
in People
Independent variables
Constant -1.818 **
Number of employees -0.160
Number of employees squared 0.016
Industry (referencecategory: Manufacturing)
Electricity, gas and water -0.199
Construction 0.325
Wholesale and retail 0.257
Hotels and restaurants 0.778 **
Transport and communication 0.534 *
Financial services 0.742 **
Other business services 0.445 *
Public administration -0.494
Education 0.507
Health 0.314
Other community services 0.266
Country of origin (reference category: UK)
USA 0.210
European Union 0.477
Rest of world -0.050
Establishment age (reference category: 10-20 years)
Age < 5 years 0.028
Aged between 5 and 10 years 0.336 **
Age > 20 years -0.099
Type of market for main product (reference category: Regional market)
Local 0.239
National 0.248
International 0.280
Type of company (reference category: private company)
PLC 0.984 **
Charity 0.709 **
Plan
Formal strategy in place 0.461 **
This strategy deals with learning & development issues 0.472 **
Board level representation of PM -0.036
PM specialist at higher level of company 0.448 **
Do
Employee survey 0.391 **
Review
Quality targets 0.230 **
Quality circles 0.002
Other variables
Percent of workforce that are from an ethnic minority -0.339
Percent of workforce that is disabled -0.550
Percent of workforce that are union members 0.582 **
Single independent establishment -0.380 **
Managerial respondent is female -0.068
Managerial respondent is PM specialist 0.013
Degree of specific human capital 0.038
Number of workplaces 1638
*=Significant at 95% level. **=Significant at 99% level.

Table 3: Summary of Heckman two-stage estimates of the effect of the
Standard on 2004 training outcomes.
Probit coefficients
Inverse
Mill's
Ratio
Investors
in
People
Number
of obs.
Model
type
Manager-reported
On average, how many days of training did experienced (employees in
the largest occupational group) undertake over the past 12 months?
(CTRAIN) -0.210 0.185 * 1393 Ordered
Is there a standard induction programme designed to introduce new
(employees in the largest occupational group) to this workplace?
(CINDUCT) 0.263 0.114 1638 Probit
What proportion of experienced (employees in the largest
occupational group) have been given time off from their normal daily
work duties to undertake training over the past 12 months?
(COFFJOB) 0.474 0.259 ** 1625 Ordered
Approximately, what proportion of (employees in the largest
occupational group) are formally trained to be able to do jobs other
than their own? (COTHJOB) 0.329 0.230 ** 1610 Ordered
Employee-reported
During the last 12 months, how much training have you had, either
paid for or organized by your employer? (B4) -0.234 * 0.559 ** 14820 Ordered
Are people working here encouraged to develop their skills? (C2e) -0.043 0.147 ** 14485 Ordered
*=Significant at 95% level. **=Significant at 99% level.
Results computed using WERS weights. The inverse Mills ratio has been included in the second stage effect equations only if it is significant in the estimation of the treatment equation.

Table 4: Regression results for change in share of employees in largest
occupational group that received training in the last year (1998-2004)
DEPENDENT VARIABLE:
0-19% 20-79% 80-100%
Independent variables Model 1 Model 2 Model 3 Model 4 Model 5 Model 6
Constant 0.831 * 1.224 ** 2.224 ** 1.968 ** 2.258 ** 1.801 *
Investors in People accredited in 1998 -0.246 -0.188 -0.074 0.668 -0.176 0.219
Applied for Investors in People as of 1998 0.252 0.655 0.374 2.886 ** -0.131 0.169
Change in total number of employees 0.000 0.000 0.006 ** 0.000 0.000
Change in percentage of male full-time employees 5.867 ** 2.764 ** 12.391 ** -0.726 -0.115
Change in percentage of managerial employees -6.627 * -3.052 ** -0.307 -7.093 ** -0.681
Change in percentage of professional employees -5.764 ** -2.673 ** -5.271 ** -4.299 ** 0.731
Change in percentage of technical employees -3.176 -1.423 -0.875 -2.060 1.120
Change in percentage of clerical/admin employees 1.279 0.868 -2.848 -2.799 3.770
Change in percentage of craft & skilled service employees -0.864 -0.223 -0.546 -0.485 1.608
Change in percentage of personal service employees -5.341 ** -2.320 ** -1.464 -1.395 -0.252
Change in percentage of sales employees -4.234 -1.838 ** -0.655 0.325 1.464
Change in percentage of unskilled employees -0.592 -0.144 1.093 -1.161 1.137
Change in percentage of full-time employees -1.883 -0.891 -6.416 ** 3.039 * 0.899
Change in percentage of minority employees -0.023 -0.008 0.003 0.000 -0.010
Change in percentage of union membership 0.003 0.002 0.001 0.003 -0.015
Change in coverage by a formal strategic plan 0.295 0.153 0.119 0.354 0.612
Change in proportion working in teams 0.016 0.009 -0.128 * 0.005 -0.006
Electricity, gas & water -2.407 ** -1.223 n.a. -0.085 0.360
Construction -3.752 ** -2.125 ** -3.402 0.035 -1.340
Wholesale & Retail -0.726 -0.336 -0.415 -0.582 0.448
Hotels & restaurants 0.710 0.299 -0.416 -1.020 1.276
Transport & Communication -0.972 -0.423 -0.183 -0.667 -0.765
Financial services 0.279 0.286 -3.964 ** -0.121 3.129 **
Other business services -0.920 -0.399 -1.176 -1.492 * 0.733
Public administration -1.192 -0.580 -4.950 ** -0.067 0.480
Education -0.300 -0.082 0.523 0.410 1.354
Health 0.818 0.394 0.999 0.631 1.176
Other community services 0.528 0.364 0.887 1.225 * -2.608
Number of workplaces 335 335 335 107 121 107
R-squared 0.004 0.275 n.a. n.a. n.a. n.a.
Model type GLM GLM Ordered Ordered Ordered Ordered
Results separated by diffusion of
training within largest occupational
group in 1998
Change in the diffusion of off the job training within the largest
occupational group
*=Significant at 95% level. **=Significant at 99% level.
Sample is divided into three groups: those with IiP accreditation in 1998 (treated); those who said they had applied in 1998 (treating); and a reference category composed of those workplaces that were not accredited and had not applied. Change computed from variables coded on 7-item Likert scale inverted from WERS dataset: thus 1=none; 2=1%-19%; 3=20%-39%; 4=40%-59%; 5=60%-79%; 6=80%-99%;7=100%. Results computed using WERS panel weights.