the center of applied space technology and microgravity
TRANSCRIPT


The Center of Applied Space Technology and Microgravity (ZARM) at the University of Bremen, host of the 2001 Summer Session Program from July 15 to September 15 Bremen, Germany. Cover design : Graeme Kaberry, SSP 2001 Report published by: Karl Schmidt Druckerei GmbH, Bremen, GERMANY Additional copies of the Project Report or the executive Summary for this project may be ordered from the International Space University (ISU) Headquarters. The Executive Summary and the Project Report can also be found on the ISU Web site. International Space University – Strasbourg Central Campus Parc d'Innovation Bld Gonthier d'Andernach 67400 Illkirch-Graffenstaden France Tel.: +33 (0)3.88.65.54.30 Fax.: +33 (0)3.88.65.54.47 http://www.isunet.edu/
© Copyright 2001 by the International Space University All Rights Reserved

CASSIOPEE
Acknowledgments The authors express their sincere gratitude and appreciation to the individuals and organisations who contributed their time, expertise and facilities to assist in making this project possible. PROJECT SPONSORS NASA Stennis Space Center, USA DESIGN PROJECT CO-CHAIRS James Burke NASA Jet Propulsion Laboratory, USA Hansjörg Dittus Centre of Applied Space Technology and Microgravity
(ZARM), Germany Vern Singhroy Canada Centre for Remote Sensing (CCRS), Canada DESIGN PROJECT FACULTY John Farrow ISU Strasbourg, France Ray Williamson Space Policy Institute, The George Washington University,
USA DESIGN TEACHING ASSISTANT Lihua Zhang Summer Session Program ‘97, China FACULTY & GUEST LECTURERS Heinrich Bovensmann Institute of Environmental Physics, Germany Mark Helmlinger NASA Jet Propulsion Laboratory, USA Manfred Jaumann BEOS, Germany David Kendall Canadian Space Agency (CSA), Canada Hans Königsmann Microcosm Inc., USA Juergen Mueller NASA Jet Propulsion Laboratory, USA Marianna Shepherd Centre for Research in Earth and Space Sciences (CRESS),
Canada Mark Weber Institute of Environmental Physics (IUP), Germany Matthias Wiegand Astrium, Germany THANKS TO THE FOLLOWING INDIVIVDUALS FOR THEIR ASSISTANCE André van Amstel Wageningen University, Netherlands Leandro Buendia National Greenhouse Gas Inventories Programme,
Intergovernmental Panel on Climate Change, Japan Hugo de Groof European Commission, DG Environment, Belgium Dr. Martin Heimann Max-Planck-Institute for Biochemistry, Germany Errol Levy European Commission, DG Research, Belgium Jean-Paul Malingreau Joint Research Centre, Belgium David Stanners European Environment Agency, Denmark
iii

CASSIOPEE
The International Space University Summer Session Program 2001 in Bremen was made possible through the support of the following organizations.
Additional copies of this Final Report or Executive Summary may be ordered from the International Space University (ISU) Headquarters.
iv

CASSIOPEE
Authors
v

CASSIOPEE
vi

CASSIOPEE
Name Affiliation Home country
Mustafa Aktas Ph.D. student University of Florida, USA TURKEY
Ágnes Bakos Research fellow
National Center for Epidemiology, Hungary
HUNGARY
Eric Bartosch Engineer Sonaca SA, Belgium BELGIUM
Mark S. Bentley Ph.D. student Open University, UK
UNITED KINGDOM
Pierre Boisvert Engineer Canadian Space Agency, Canada CANADA
Erika Brown Masters student
Massachusetts Institute of Technology, USA
USA
Fredrik Bruhn Ph.D. student Uppsala University, Sweden SWEDEN
Viorica Buzdugan General manager RARTEL SA, Romania ROMANIA
Adriano Carvalho Masters student
Federal University of Minas Gerais, Brazil
BRAZIL
Stéphane Dussy Space system engineer EADS Launch Vehicles, France FRANCE
Richard Giroux Ph.D. student
École de technologie supérieure, Canada
CANADA
Andrey Glebov System engineer Loral Space Systems, USA USA
Ryan Granlund RF engineer ComDev Canada, Canada CANADA
Suzanne Green Geomatics specialist
Radarsat International (RSI), Canada
CANADA
vii

CASSIOPEE
Jean-Christophe Gros Engineering student Supaero, France FRANCE
Ulrike Hodits
Technical physics student
Technical University of Vienna, Austria
AUSTRIA
Graeme Kaberry Flying officer
Royal Australian Air Force, Australia
AUSTRALIA
Frédéric Laithier Rocket engine and turbo-pumps
engineer SNECMA, France
FRANCE
Chantal Legault Officer Canadian Air Force, Canada CANADA
Tanqui Li Engineer and research fellow
Institute of Space Medico-Engineering, China
CHINA
Tobias Lutz Engineering student
Technical University Braunschweig, Germany
GERMANY
Aleksander Lyngvi Masters student UNIK / NDRE, Norway NORWAY
Fay Mancebo
Project manager CEHRAM Project, University of
the Philippines – Los Banos, Philippines
PHILIPPINES
Nancy Martineau Masters student Université de Montréal, Canada CANADA
Hazel McAndrews Space scientist QinetiQ, UK
UNITED KINGDOM
Mohammed Merdas Agronomic engineer
Royal Centre for Remote Sensing, Morocco
MOROCCO
Golam Mostafa Computer science student University of Bremen, Germany BANGLADESH
Lars Næsheim Ph.D. student
University of Tromso, Inst. of Physics, Norway
NORWAY
Hiroaki Nishiki Spacecraft engineer JSAT Corporation, Japan JAPAN
viii

CASSIOPEE
Marc Philippi Engineering student
University of Applied Sciences – Aachen, Germany
GERMANY
Incigül Polat
Researcher Information Technologies and
Electronics Research Institute, Turkey
TURKEY
Jefferson Powell Engineer Johnson Space Center, USA USA
Carlos Javier Puig Scientist
International Center for Tropical Agriculture, Colombia
ARGENTINA
Kevin Ramchandar Medical student University of Toronto, Canada CANADA
Scott Reynolds Engineer Sea Launch, USA USA
Moisès Rustullet Ph.D. student University of Girona, Spain SPAIN
Keiko Sato Staff of contract department NASDA, Japan JAPAN
Franck Schrottenloher Aeronautics and space engineer French Air force, France FRANCE
Jerome Simpson
Head, Information Program Regional Environmental Center for
Central and Eastern Europe, Hungary
HUNGARY
Jennifer Sokol Environmental scientist Natural Resources Canada, Canada CANADA
Jean-Luc Verdin Industrial cost auditor ESA, Netherlands BELGIUM
Anton Vrieling Junior scientist
Wageningen University, Netherlands
NETHERLANDS
Andrew Willig Scientist QinetiQ, UK
UNITED KINGDOM
Heping Zhao Director (Dept. of C&DH) Chinese Academy of Space
Technology, China CHINA
ix

CASSIOPEE
Faculty Preface At each Summer Session Program of the International Space University, students carry out two design projects intended to give teamwork experience under stress and to generate analyses and recommendations on topics of current interest in the world’s space programs. In 2001, the two projects were about space-program commercialization (with emphasis on human flight missions) and the use of emerging microtechnology to enhance environmental improvements in Europe. This document presents the results of the environmental project. In considering how microtechnology can be applied to Europe’s environmental needs, the student team had to make choices quickly and focus on a subset of problems. Based on policy priorities as outlined by the European Commission (EC) and pertinent international agencies, they decided to concentrate on the atmosphere, and within that field to emphasize monitoring of greenhouse gases and low-altitude air pollution. With those decisions in hand the team then began analyzing what to measure, why and how to measure it from space, air and ground, and how to develop flight and ground systems to support the measurements and distribute the results to policy agencies and the European public. The results of their analyses are intended to provide a policy justification and technical base for follow-on studies leading to the implementation of a user-driven system. To that end, they explored agency priorities, instrumentation, flight and ground systems concepts, operations and data distribution, all at a level such as to define the general scope of a next pre-project phase. Launching that phase, including demonstration spacecraft and prototype ground activities, is certainly a desired outcome of their work. We, the faculty and teaching assistant for the CASSIOPEE design project, are honored to have been associated with this group of talented and energetic young people, and we commend their results to the reader. ______________ ______________ ______________ ______________ Hans-Jörg Dittus Vern Singhroy James D. Burke Lihua Zhang Co-Chair Co-Chair Faculty member Teaching Assistant ZARM CCRS JPL (retired) CAST
x

CASSIOPEE
Student Preface The ‘CASSIOPEE’ report is the final product of the International Space University’s Summer Session Program 2001, Design Project 2 Team. The Summer Session Program brings students from all over the world into an interdisciplinary, intercultural and international environment, to undergo nine-weeks of intensive lectures, workshops, site visits and project design. The course covers the broad spectrum of space-related disciplines, including space science, engineering, social, legal and managerial principles as they apply to space activities. The culmination of the nine weeks’ activities and teamwork is this report. The opportunity to be able to work with people from multi-disciplinary, diverse language and cultural backgrounds has proven to be both a challenging and rewarding experience. This opportunity enables students to share thoughts, language, opinions and concepts about space, in an atmosphere of friendship, equality and learning. This report has been enriched and enhanced with the international experience and diversified backgrounds of its authors. The 2001 session was hosted at the University of Bremen, Germany from 14 July to 15 September, and was hosted by ZARM, the Centre for Applied Space Technology and Microgravity. Design Project 2 was tasked with investigating European environmental concerns and to design a baseline satellite using innovative micro-technologies to monitor and observe a specified environmental concern. The result being an improved environmental monitoring and management system through space related mechanisms. It was decided through our investigation to concentrate on the monitoring of greenhouse gases (GHG) in the atmosphere across Europe. The political environment was the driving force behind this decision. It is our hope, through this report that we may influence the European Union and its Member States to consider the use of microsatellites to assist in the monitoring and control of GHG emissions, in accordance with domestic and international environment policies and agreements. However, we recognize that this report represents a preliminary study, due to the limited time frame imposed, and further studies are required to refine and improve the results and recommendations before implementation is achievable. We express our gratitude to all those who assisted in producing this report including faculty, staff, visiting lecturers and alumni. We specifically thank the co-chairs James Burke, Hansjoerg Dittus and Vernon Singhroy for their guidance, instruction and assistance. Lastly, we would like to thank the people of Bremen for their hospitality and the opportunity to experience the local culture.
xi

CASSIOPEE
Executive Summary
xii

CASSIOPEE
xiii

CASSIOPEE
xiv

CASSIOPEE
xv

CASSIOPEE
xvi

CASSIOPEE
xvii

CASSIOPEE
xviii

CASSIOPEE
xix

CASSIOPEE
xx

CASSIOPEE
xxi

CASSIOPEE
xxii

CASSIOPEE
xxiii

CASSIOPEE
xxiv

CASSIOPEE
xxv

CASSIOPEE
xxvi

CASSIOPEE
xxvii

CASSIOPEE
xxviii

CASSIOPEE
xxix

CASSIOPEE
xxx

CASSIOPEE
xxxi

CASSIOPEE
xxxii

CASSIOPEE
xxxiii

CASSIOPEE
xxxiv

CASSIOPEE
xxxv

CASSIOPEE
xxxvi

CASSIOPEE
xxxvii
CASSIOPEE
xxxviii

CASSIOPEE
xxxix
CASSIOPEE
Table Of Contents ACKNOWLEDGMENTS ..............................................................................III AUTHORS........................................................................................................ V FACULTY PREFACE .................................................................................... X STUDENT PREFACE....................................................................................XI EXECUTIVE SUMMARY .......................................................................... XII 1. INTRODUCTION................................................................................... 1
1.1 Background......................................................................................................1 1.2 Mission statement ............................................................................................1 1.3 Project objectives.............................................................................................1
2. EUROPE’S ENVIRONMENT .............................................................. 3 2.1 Present status and priority issues.....................................................................3
2.1.1 Introduction................................................................................................3 2.1.2 What are the biggest current concerns in Europe?.....................................4
2.1.2.1 Environmental priorities......................................................................4 2.1.2.2 Hot Spots .............................................................................................5 2.1.2.3 Sectors .................................................................................................5 2.1.2.4 Indicators.............................................................................................6
2.2 European environmental policies ....................................................................6 2.2.1 Worldwide policies affecting Europe ........................................................6 2.2.2 Policy framework.......................................................................................7
2.2.2.1 A Sustainable Europe for a Better World............................................7 2.2.2.2 Environment 2010: Our Future, Our Choice.......................................8 2.2.2.3 Towards a European Climate Change Programme (ECCP)..............10 2.2.2.4 A European Community Biodiversity Strategy ................................10
2.2.3 European policies relating space and the environment............................11 2.3 Targeting the atmosphere: greenhouse gases & atmospheric pollution ........12
2.3.1 Defining a target ......................................................................................12 2.3.2 The Greenhouse Effect ............................................................................12 2.3.3 CO2: A global & environmental problem ...............................................14
2.3.3.1 Carbon cycle......................................................................................14 2.3.3.2 CO2 sources and sinks .......................................................................15 2.3.3.3 Increases in atmospheric CO2 concentration.....................................15 2.3.3.4 Restoring carbon cycle equilibrium ..................................................16 2.3.3.5 Responses to rising CO2 levels..........................................................16 2.3.3.6 Possible future EU measures to reduce CO2 emissions ....................17
2.3.4 Methane....................................................................................................18 2.3.5 Nitrous Oxide...........................................................................................18
2.4 Current capabilities: space-based, airborne and ground-based .....................20 2.4.1 Space-based systems................................................................................20 2.4.2 Airborne systems .....................................................................................22 2.4.3 Ground-based systems .............................................................................22
2.4.3.1 CARBOEUROPE..............................................................................23 2.4.3.2 EuroAirNet ........................................................................................23 2.4.3.3 SOGE ................................................................................................24 2.4.3.4 CORINAIR........................................................................................24 2.4.3.5 EDGAR .............................................................................................24
2.4.4 Combined programmes............................................................................24
xl

CASSIOPEE
2.5 Reporting and scientific gaps ........................................................................25 2.5.1 Reporting gaps .........................................................................................25
2.5.1.1 Policy verification .............................................................................25 2.5.1.2 Is anything not being reported properly? ..........................................25
2.5.2 Data management and modelling.............................................................26 2.5.2.1 Current methodologies ......................................................................26 2.5.2.2 Current modelling .............................................................................27
2.5.3 CASSIOPEE mission objectives..............................................................28 2.6 System requirements .....................................................................................29
3. POLICY AND LAW............................................................................. 40 3.1 Policy.............................................................................................................40
3.1.1 EC/ESA common space strategy .............................................................40 3.1.1.1 The common European strategy........................................................40 3.1.1.2 The necessary instruments ................................................................41 3.1.1.3 CASSIOPEE and the common European Space Strategy.................41 3.1.1.4 Environmental aspects regarding the European Space Strategy .......42
3.1.2 Global Monitoring for Environment and Security...................................42 3.1.3 European research and technology policy ...............................................43
3.2 Institutional model.........................................................................................43 3.2.1 Trends in favor of privatization ...............................................................44 3.2.2 Trends in favor of micro technologies .....................................................45 3.2.3 Looking for spin-offs ...............................................................................45
3.2.3.1 Creation of company .........................................................................45 3.2.3.2 Added value data...............................................................................45 3.2.3.3 Science ..............................................................................................45
3.2.4 Educational reasons .................................................................................45 3.3 Earth observations .........................................................................................46
3.3.1 Earth observation programs at ESA.........................................................46 3.3.2 World wide trends....................................................................................46 3.3.3 Use of small satellites ..............................................................................47 3.3.4 Industrial policy of ESA ..........................................................................48
3.4 Legal aspects: from concept to operational status of the satellites................49 3.4.1 Launching ................................................................................................49
3.4.1.1 Launch contracts and insurance ........................................................50 3.4.2 Access to data – multinational policies....................................................51
3.4.2.1 Global baseline..................................................................................51 3.4.2.2 United Nations principles..................................................................51 3.4.2.3 The World Meteorological Organisation ..........................................51 3.4.2.4 Access to data within the European Union .......................................51
3.4.3 Intellectual property .................................................................................53 3.4.3.1 Main issues........................................................................................53 3.4.3.2 Industrial developments ....................................................................53 3.4.3.3 Dissemination and sales ....................................................................53 3.4.3.4 Authorization and licenses ................................................................54
4. TECHNICAL IMPLEMENTATION ................................................. 57 4.1 Technological approach.................................................................................57
4.1.1 Why use microtechnology for environmental monitoring? .....................57 4.1.2 Current microtechnologies available .......................................................58 4.1.3 Recommendations for future microtechnology developments ................59
xli

CASSIOPEE
4.2 Mission objectives and performances ...........................................................60 4.3 Potential solutions .........................................................................................60
4.3.1 Space based systems: existing and future ................................................61 4.3.2 Air based systems – existing....................................................................62 4.3.3 Ground-based systems: existing ..............................................................63 4.3.4 Existing options – summary.....................................................................64 4.3.5 Feasible options .......................................................................................64
4.4 CASSIOPEE constellation ............................................................................64 4.4.1 Profile and orbit description.....................................................................64
4.4.1.1 Sun-Synchronous Orbit .....................................................................64 4.4.2 CASSIOPEE, a 3-satellite constellation ..................................................67
4.5 Satellite system description ...........................................................................70 4.5.1 Overall architecture..................................................................................70 4.5.2 Subsystems description............................................................................71
4.5.2.1 Payload and instrumentation .............................................................72 4.5.2.2 Communication .................................................................................81 4.5.2.3 Attitude and Orbit Control System....................................................84 4.5.2.4 Power.................................................................................................94 4.5.2.5 Thermal .............................................................................................98 4.5.2.6 Structure ..........................................................................................101 4.5.2.7 On-Board Data Handling system ....................................................106
4.6 Operation .....................................................................................................109 4.6.1 Launch....................................................................................................109
4.6.1.1 Selection process .............................................................................110 4.6.1.2 Launcher selection...........................................................................111
4.6.2 Ground segment .....................................................................................112 4.6.2.1 Mission control centre.....................................................................112 4.6.2.2 Ground station .................................................................................115 4.6.2.3 Ground station in CASSIOPEE project ..........................................118 4.6.2.4 Options for CASSIOPEE project ....................................................119 4.6.2.5 Conclusion.......................................................................................120
5. DATA MANAGEMENT .................................................................... 126 5.1 Data collection and processing....................................................................126 5.2 Calibration and validation of satellite data..................................................127 5.3 Data distribution and flow ...........................................................................128 5.4 Data users ....................................................................................................129 5.5 Data products...............................................................................................130
6. BUSINESS & MANAGEMENT........................................................ 133 6.1 Marketing analysis and case studies............................................................133
6.1.1 Marketing analysis .................................................................................133 6.1.2 Case studies............................................................................................135
6.1.2.1 ENVISAT........................................................................................135 6.1.2.2 METEOSAT....................................................................................135 6.1.2.3 TOPSAT..........................................................................................135 6.1.2.4 MYRIADE ......................................................................................136
6.2 Benefits of CASSIOPEE .............................................................................136 6.3 Costs of CASSIOPEE..................................................................................137
6.3.1 Cost estimation.......................................................................................137 6.3.1.1 Cost estimating methods .................................................................137
xlii

CASSIOPEE
6.3.1.2 Cost by analogy...............................................................................138 6.3.1.3 Parametric cost estimation ..............................................................138 6.3.1.4 Life-cycle cost .................................................................................138 6.3.1.5 Preliminary cost assessment............................................................139
6.4 Financing .....................................................................................................140 6.4.1 Financing the development and operational costs .................................140
6.4.1.1 European Commission ....................................................................141 6.4.1.2 European Space Agency..................................................................144 6.4.1.3 Financial institutional banks & industry .........................................147 6.4.1.4 Comments regarding other avenues for funding .............................147
6.4.2 Life cycle distribution of required funds ...............................................149 6.4.3 Funding of the “next step” for CASSIOPEE .........................................150
6.5 Risk analysis ................................................................................................151 6.5.1 Risk identification..................................................................................151
6.5.1.1 Funding risks ...................................................................................151 6.5.1.2 Technical risks.................................................................................152 6.5.1.3 Implication of loss of satellites........................................................153 6.5.1.4 Macroeconomic risks ......................................................................153 6.5.1.5 Programmatic risks..........................................................................154 6.5.1.6 Political risks ...................................................................................154
6.5.2 Risk reduction and mitigation................................................................154 6.5.2.1 Funding............................................................................................154 6.5.2.2 Technical .........................................................................................155 6.5.2.3 Political, programmatic and macroeconomic risk...........................155
6.5.3 Recommendations..................................................................................155 6.6 Management & operational plan .................................................................155
6.6.1 Outline of management plan..................................................................155 6.6.2 Organisational issues to be addressed....................................................156 6.6.3 Deliverables ...........................................................................................156 6.6.4 Operational goals ...................................................................................157 6.6.5 Gantt chart for implementation of CASSIOPEE ...................................158 6.6.6 Project organisation ...............................................................................159 6.6.7 Task definition .......................................................................................159 6.6.8 Management and operational changes over time...................................160
7. AIR QUALITY MISSION CONCEPT............................................. 164 7.1 Nature and significance of carbon monoxide..............................................165
7.1.1 Ground-level ozone production .............................................................167 7.1.2 Reduction of hydroxyl radical concentrations .......................................167 7.1.3 Global transportation: circulation patterns.............................................167
7.2 Environmental problem solving as a public good .......................................168 7.3 Existing programs and their limitations ......................................................169 7.4 Mission concept...........................................................................................170
7.4.1 System requirements..............................................................................171 7.4.2 Mission profile .......................................................................................171 7.4.3 Orbit description ....................................................................................171 7.4.4 Ground systems......................................................................................173
7.5 Recommendations .......................................................................................173 8. BENEFITS, RECOMMENDATIONS AND CONCLUSIONS...... 177
8.1 Potential spinoffs .........................................................................................177
xliii

CASSIOPEE
8.1.1 Scientific spinoffs (benefits) etc. ...........................................................177 8.1.2 Technological spinoffs...........................................................................177 8.1.3 Policy spinoffs .......................................................................................177 8.1.4 Financial spinoffs...................................................................................178
8.2 Recommendations .......................................................................................178 8.2.1 General recommendations .....................................................................178 8.2.2 Scientific recommendations...................................................................179 8.2.3 Technological recommendations ...........................................................179 8.2.4 Policy recommendations........................................................................180
8.3 Conclusions .................................................................................................180 APPENDIX A: LIST OF ACRONYMS ..................................................... 181 APPENDIX B: LIST OF UNITS................................................................. 188 APPENDIX C: MAJOR EUROPEAN ENVIRONMENTAL ISSUES ... 190 APPENDIX D: SPACE-BASED MONITORING PROGRAMMES ..... 194 APPENDIX E: GROUND-BASED MONITORING PROGRAMS ....... 200 APPENDIX F: REMOTE SENSING PHYSICAL PROCESS................. 204 APPENDIX G: LINK BUDGET ................................................................. 214 APPENDIX H: TT&C.................................................................................. 216 APPENDIX I: TYPICAL TRANSPONDER BLOCK DIAGRAM........ 220 APPENDIX J : COMMUNICATIONS .................................................... 221 APPENDIX K: GROUND SEGMENT BLOCK DIAGRAM ................. 222 APPENDIX L: BASIC GROUND STATION DIAGRAM...................... 223 APPENDIX M: SSP DESIGN PROJECT.................................................. 224 APPENDIX N : CASSIOPPE MYTHOLOGY......................................... 226
xliv

CASSIOPEE
List Of Tables Table 2-1: Environmental status and trends for the EEA Member States .....................4 Table 2-2: Sixth Environment Action Programme Priorities and Objectives................9 Table 2-3: Suggested EU policies for reducing carbon dioxide emissions .................17 Table 3-1: Proposed model highlighting legal aspects ................................................49 Table 4-1: The CASSIOPEE orbital parameters .........................................................65 Table 4-2: Factors for orbit selection...........................................................................66 Table 4-3: Possible absorption features for target gases..............................................76 Table 4-4: AOCS sensor characteristics ......................................................................85 Table 4-5: Comparison of microsatellites in term of actuators....................................91 Table 4-6: CASSIOPEE budgets for AOCS actuators ................................................94 Table 4-7: Battery characteristics ................................................................................96 Table 4-8: Satellite power budget ................................................................................98 Table 4-9: AOCS power breakdown............................................................................98 Table 4-10: Overview of the different techniques for thermal control ......................100 Table 4-11: Satellite mass budget ..............................................................................104 Table 4-12: Launcher characteristics .........................................................................111 Table 6-1: Comparison of [Soh 2001] and CASSIOPEE costs .................................138 Table 6-2: CASSIOPEE overall cost .........................................................................140 Table 6-3: Summary of benefits/detriments of different funding possibilities..........149 Table 6-4: Life cycle distribution of required funds (M€).........................................149 Table 6-5: Risk parameters for different subsystems ................................................152 Table 6-6: Characteristics for different launchers .....................................................153 Table 6-7: Operational Goals of CASSIOPEE and Scheduled Completion Dates....157 Table 6-8: Task breakdown of CASSIOPEE.............................................................160 Table 7-1: WHO guideline values for the “classical” air pollutants [WHO 2000] ...164 Table 7-2: Estimated health impact of ambient air pollution in Europe....................168 Table 7-3: Missions related to emission monitoring..................................................170 Table 7-4: Orbital parameters for the CASSIOPEE air quality mission concept ......172 Table 7-5: Characteristics for the CASSIOPEE air quality mission concept ............172
xlv

CASSIOPEE
List Of Figures Figure 2-1: The Enhanced Greenhouse Effect.............................................................13 Figure 2-2: Concentration of CO2 from trapped air measurements .............................15 Figure 2-3: Annual nitrous oxide emissions for the EU Member States .....................19 Figure 2-4: Percentage of cloud-free pixels versus spatial resolution. ........................30 Figure 3-1: Road map scenario – Institutional Model .................................................44 Figure 4-1: A radiosonde rising skywards ©NASA ....................................................63 Figure 4-2: A 1-day orbit of the CASSIOPEE constellation. ......................................67 Figure 4-3: Number of cloud free pixels against spatial resolution of instrument ......68 Figure 4-4: Nine days of coverage for a single satellite ..............................................68 Figure 4-5: Nine days of coverage for a single satellite ..............................................69 Figure 4-6: Nine day coverage for the 3 satellite constellation ...................................69 Figure 4-7: The coverage over a 500km sample area for the 3 spacecraft ..................70 Figure 4-8: Possible satellite configuration .................................................................71 Figure 4-9: Viewing geometries for a nadir and limb pointing instrument ©ESA .....74 Figure 4-10: Observing reflected solar versus thermal radiation.................................75 Figure 4-11: Selected IR absorption features of our target gases ................................75 Figure 4-12: Functional diagram of a gas correlation radiometer ...............................78 Figure 4-13: The MicroMAPS instrument © Resonance Ltd......................................80 Figure 4-14: Diagram showing the location of the AOCS sensors..............................86 Figure 4-15: Diagram showing trade-offs for actuators ..............................................89 Figure 4-16: Solar activity and satellite life.................................................................90 Figure 4-17: Classification of AOCS actuators ...........................................................92 Figure 4-18: Characteristics of AOCS actuators .........................................................93 Figure 4-19: Courtesy of AFOSR & DARPA University Nanosatellite Program.......94 Figure 4-20: Power control unit schematic..................................................................96 Figure 4-21: Diagram showing spacecraft heat balance ..............................................99 Figure 4-22: CAD simulation of CASSIOPEE structure...........................................105 Figure 4-23: System level interface diagram for OBDH...........................................107 Figure 4-24: Launch vehicle options. ........................................................................112 Figure 5-1:End-to-end data flow................................................................................129 Figure 6-1: Outline of funding options considered....................................................142 Figure 6-2: Analytical and Estimated Life Cycle Cost Distribution..........................150 Figure 6-3: Possible CASSIOPEE project organisation ............................................159 Figure 7-1: European road transport production of pollutants in 1994 .....................165 Figure 7-2: EU15 Emissions of CO [EEA 2000c].....................................................166 Figure 7-3: 1996 EU contributions to tropospheric ozone and climate change.........166 Figure 7-4: A multi-pollutant, multi-effect approach to pollution problems.............169
xlvi

CASSIOPEE
Introduction
1.1 Background Europe has a long history of human occupation, and as such, has suffered environmentally for many years. Through industrialization, the quest for economic gain and improved standards of living, the environmental impacts have increased to alarming levels. The atmosphere, which is only one element of the environment, has been severely impacted by pollutants. Along with many other developed regions, Europe is a key contributor to global pollution. During the last twenty years, environmental concerns on a domestic and international level within Europe have become an important issue. The severe impacts on the local and global environment have become apparent and this has social, and economic impacts. To address these concerns, the European Union (EU) launched the First Environmental Action Programme between 1974-76. It has since assigned one of the European Commission’s 23 General Directorates (DG) with responsibility for managing Europe’s environment. DG Environment is currently implementing the Sixth Environmental Action Programme, 2001-2010. The European Union has been a proactive member of the international community through its participation in environmental conferences and discussions. In Bonn in July 2001, the EU agreed to ratify the Kyoto Protocol and has committed itself to reducing greenhouse gas (GHG) emissions by an average of 5.2% over 1990 levels, by 2012. The commitment of the European Union to reduce greenhouse emissions, coupled with public concern for saving the environment has enabled new political opportunities for the use of modern space and ground technology to support environmental goals. At the same time, new micro-systems are enabling observation and communications missions in a new class with quick response time, low cost and focused objectives. The time is ripe for this convergence to be examined from an international perspective.
1.2 Mission statement The CASSIOPEE design team’s mission is: “We shall define needs and develop innovative solutions for environmental improvement through micro-flight and ground systems. We shall concentrate on Europe.”
1.3 Project objectives The CASSIOPEE design team’s objectives are to:
• Identify environmental needs and priorities; • List ground, air and space-based monitoring programmes relevant to these
needs; • Prepare and document a case study of a user-driven spacecraft, and;
1

CASSIOPEE
• Prepare a set of recommendations for Europe’s policymakers, climate change scientists and space agency executives, to begin implementation of this project concept.
The following report summarises the findings of CASSIOPEE’s design team, and responds to all of the above objectives.
2

CASSIOPEE
2. Europe’s environment This chapter examines the environmental drivers for the CASSIOPEE project from the perspectives of both environmental science and policy. An in-depth explanation of the greenhouse effect and its key gases leads into a review of current space-based, airborne, and ground-based monitoring systems for these gases. The reporting and scientific gaps in this field are examined, highlighting current efforts in atmospheric modelling. Finally, a set of specific design requirements for CASSIOPEE is produced from these investigations.
2.1 Present status and priority issues
2.1.1 Introduction As we approach the issue of providing microsatellite monitoring for Europe’s environmental concerns, two questions immediately arise. First, what do we mean by Europe? And second, how broad a scope do we consider for the term ‘environment’? To begin with, we have defined Europe as those countries under the policy umbrella of the European Environment Agency (EEA). At the time of printing, this included all 15 member states of the European Union (EU), as well as the European Free Trade Association (EFTA) countries (Iceland, Liechtenstein and Norway), Bulgaria, Cyprus, Latvia, Malta, Slovenia and the Slovak Republic. Unlike the European Commission (EC), the EEA is not a policy maker, but instead a policy driver. As stated in their introduction:
The EEA does not aim to replace existing structures, but attempts instead to bring together, in compatible formats, the best available environmental data from the individual countries. This data forms the basis of integrated environmental assessments. The results are disseminated and made accessible to EU bodies, governments, the business community, academia, NGOs (Non-Governmental Organizations) and the general public [EEA Info 1999].
With respect to the scope of the term ‘environment’, we chose to approach this project with a broad perspective. We began with not only the traditional realms of water, land, and atmospheric pollution, but also with biodiversity, environmental security, and disaster management. Recognising that we could not tackle all of the European issues with one microsatellite system, we approached the EEA for guidance on prioritising these issues. For this, the 1999 “Turn of the Century” [EEA TOC 1999] report and the more recent “Environmental Signals 2001” [EEA Signals 2001] became our guiding documents of choice. Table 2-1 [EEA TOC 1999] summarises the current status of the fifteen biggest issues, and their expected trends forecasted to 2010 (2050 for Climate Change and Ozone Depleting Substances):
3

CASSIOPEE
Table 2-1: Environmental status and trends for the EEA Member States
2.1.2 What are the biggest current concerns in Europe?
2.1.2.1 Environmental priorities Recognising that space-based remote sensing technologies are not suitable for monitoring all environmental phenomena, we identified the following issues as priorities within the water, land, and atmospheric distributions:
• Water - water stress, coastal & marine areas • Land - soil degradation, biodiversity, disaster monitoring • Atmospheric - greenhouse gases, ozone-depleting substances, hazardous
substances, transboundary air pollution
4

CASSIOPEE
The nature of these problems, as well as their current status and future trends are provided in more detail in Appendix C. Within this broad framework, the EEA has broken down its efforts in a number of ways, focusing at different times at the national level, in particular ‘Hot Spots’, or on individual ‘Sectors’. Unifying all of these analyses is the concept of quantitative ‘Indicators’ of broader environmental trends.
2.1.2.2 Hot Spots Several regions with a number of severe environmental concerns have been identified as Hot Spots for European environmental action. While most of these regions’ problems are stable or improving, the number of Hot Spots remains high and the affected areas are becoming larger. Current Hot Spot concerns include:
• Sulphur deposition in the Black Triangle, the boundary region of Poland, Germany, and the Czech Republic;
• Acid rain in Germany and the Netherlands; • Hazardous substance deposition and smog in north western Europe; • Impacts of tourist influx in the Mediterranean coastal regions, and; • Traffic congestion, waste mismanagement, and seasonal water stresses in
many urban areas.
2.1.2.3 Sectors In order to help develop effective policy recommendations, the EEA has identified eight sectors for targeting research [EEA Home Page 2001]:
• Agriculture – farming activities cover nearly half of the EU land area, and the EU’s Common Agricultural Policy (CAP) accounts for nearly half of the EU budget. Policies for this sector address a variety of water, land, and atmospheric issues associated with agriculture.
• Energy – a large user of resources, the energy sector is a major driving force behind climate change and air pollution. However, while energy output is on the rise in Europe, conscientious policies in this sector have caused a fall in major air pollutant emissions from power plants.
• Fisheries – this sector looks primarily at the overcapacity in the European fishing fleet and its effect on biodiversity and the marine environment.
• Households – this sector examines the effect of household consumption patterns on a variety of environmental issues, from water use to waste production. As the number and living standards of households in Europe increase, so does the environmental pressure from this sector.
• Industry – the industrial sector tracks the environmental impact of manufacturing and other industry, focusing on policy and financial pressures that can drive down industrial emissions and pollution levels.
• Population and economy – this sector aims to address the issue of decoupling the rising European population and per capita expenditures from environmental damage.
5

CASSIOPEE
• Tourism – as the European tourist market continues to grow, so do its levels of pollution and resource use. This sector examines the issues of developing a more sustainable tourism industry.
• Transport – with rising population and tourist sectors also comes a rise in transportation. Currently, this sector is the fastest-growing consumer of energy and producer of greenhouse gases in the EU.
Policies for increased eco-efficiency have markedly reduced the emissions of greenhouse gases and pollutants; however, many of these reductions have been offset by growth in tourism and the transportation sector, as well as increased energy usage driven by a rising consumer market [EEA Signals 2001].
2.1.2.4 Indicators In order to provide more than just qualitative environmental reporting, the EEA and other agencies have developed metrics to serve as quantitative markers for guiding policy development and other analyses. As defined by the EEA, an indicator is an “observed value representative of a phenomenon to study. In general, indicators quantify information by aggregating different and multiple data […] to reveal complex phenomenon” [EEA Home Page 2001]. For Europe, target indicators of environmental health include such varied measures as consumption of ozone-depleting substances; emissions of CO2, SO2, and N2O; net municipal solid waste requiring disposal per capita per year; and the area of land where nitrates and pesticides targets are exceeded. Above all, these indicators aim to consolidate information from different sources within a cohesive broader perspective so as to provide relevant, value-added data products. These quick “quantitative snapshots” of environmental health permit easy and accurate comparisons by a broad audience of policymakers and the general public [Jimenez-Beltran 1995].
2.2 European environmental policies An assessment of the state of the European environment alone is insufficient for drawing conclusions on environmental priorities. It is also necessary to clarify what government policymakers’ responses are to these priorities. A review of policy must therefore consider global environmental initiatives, as well as European policy responses.
2.2.1 Worldwide policies affecting Europe In a global context, the main driver for international environmental policy is the United Nations (UN). In 1992, this body hosted the United Nations’ Conference on Environment and Development, also known as the Earth Summit, in Rio de Janeiro. At this event, the international community agreed on an ambitious and comprehensive strategy to address environment and development challenges through a global partnership for sustainable development* [CEC COM 53, 2001]. Sustainable Development aims to meet the needs of today without compromising the possibility of future generations to meet their own needs. Sustainable development is now viewed as having three pillars: economic development, social development and environmental protection [CEC COM 53, 2001].
6

CASSIOPEE
The Conference adopted the so-called Rio Principles, Agenda 21, and the Forest Principles, as well as two major legally binding conventions on Climate Change and on Biological Diversity. The Summit also set up the UN Commission on Sustainable Development (CSD) to monitor the implementation of Agenda 21, a long-term blueprint for sustainable development in the 21st century [CEC COM 53, 2000]. At the 19th Special Session of the UN General Assembly in 1997, the European Union (EU) and other signatories of the 1992 United Nations’ “Rio Declaration” committed themselves to drawing up strategies for sustainable development in time for the 2002 World Summit on Sustainable Development (the so-called ‘Rio+10’ event, to be hosted in Johannesburg, South Africa in September 2002) [CEC COM 264, 2001]. The EU has committed itself to not only turning these political commitments into policy action, but also to overseeing the ratification and implementation of all relevant international agreements. The ratification of the Kyoto Protocol** to the United Nations Framework Convention on Climate Change remains perhaps the most important [CEC COM 53, 2001], given the successful outcome of the Sixth Conference of Parties to the Convention (COP-6) in July 2001. What is the Kyoto Protocol? The Kyoto Protocol to the UNFCCC was adopted by over 160 countries at COP-3 in December 1997 in Kyoto, Japan. It represents the first legally binding commitment by the world’s major polluters to reduce emissions of six major greenhouse gases (GHGs). Following COP-6 in Bonn, a commitment was made to work toward an average GHG reduction target for all signatories of 5.2% by 2012. More than 170 countries committed themselves to the agreement reached in Bonn, and ratification of the revised accord is now expected to proceed [Environment Daily 2001].
2.2.2 Policy framework The EU’s Sustainable Development Strategy [CEC COM 264, 2001] provides the official European response to the ‘Rio+5’ commitment on national sustainable development strategies (see above). Sectoral integration strategies have also been developed, including the Sixth Environmental Action Programme (which provides the environmental pillar in this process), and specific action plans under the Biodiversity Strategy, European Climate Change Programme, and EU Chemicals Strategy.
2.2.2.1 A Sustainable Europe for a Better World This strategy [CEC COM 264, 2001] was presented on 15 February 2001 and focuses on a small number of problems which pose severe or irreversible threats to the future well being of European society. Three are presented here as they relate to the environment:
• Emissions of greenhouse gases from human activity […] causing global warming. Climate change is likely to cause more extreme weather events (hurricanes, floods) with severe implications for infrastructure, property, health and nature.
• The loss of biodiversity in Europe has accelerated dramatically in recent decades. Fish stocks in European waters are near collapse. Waste volumes
7

CASSIOPEE
have persistently grown faster than Gross Domestic Product (GDP). Soil loss and declining fertility are eroding the viability of agricultural land.
• Transport congestion has been rising rapidly and is approaching gridlock. This mainly affects urban areas, which are also challenged by problems such as inner city decay, sprawling suburbs, and concentrations of acute poverty and social exclusion. Regional imbalances in the EU remain a serious concern.
In response, the Commission proposes the following objectives and measures:
• Limit climate change and increase the use of clean energy o Meet the commitments under the Kyoto Protocol, and thereafter reduce
atmospheric greenhouse gas emissions by an average of 1% per year over 1990 levels up to 2020.
o Reduce greenhouse gas emissions based on the outcome of the European Climate Change Programme. (See Section 2.2.2.3)
• Manage natural resources more responsibly o Protect and restore habitats […] and halt the loss of biodiversity by
2010. o Improve fisheries management to reverse the decline in stocks.
• Improve the transport system and land-use management o Decouple transport growth significantly from growth in Gross
Domestic Product. o Bring about a shift [...] from road to rail, water, and public passenger
transport. o Promote more balanced regional development.
Other highlights of relevance to CASSIOPEE include ”investing in science and technology for the future.” The EU notes it should contribute to establishing, by 2008, a European capacity for global monitoring of environment and security (GMES). A mechanism for supporting this will be the European Commission’s 5th and 6th Framework Programmes for Research, Technological Development and Demonstration (detailed in Section 3.1.3). The Strategy also mentions that in order to improve policy coherence, “better information is needed,” for example, in understanding the implications of environmental pollution or of chemicals on biodiversity and public health. This same principle can be applied to the issue of climate change, and indeed is raised by the Intergovernmental Panel on Climate Change (IPCC) and detailed in Section 2.5.1.2.
2.2.2.2 Environment 2010: Our Future, Our Choice The sixth Environment Action Programme (EAP) [CEC COM 31, 2001] was presented for adoption on 24 January 2001 and sets out the major priorities and objectives for European environment policy over the next ten years. This document details the respective measures to be taken and outlines four priority areas:
8

CASSIOPEE
Priority Area Objective Tackling climate change To stabilise the atmospheric concentrations of greenhouse
gases at a level that will not cause unnatural variations of the earth's climate. The key priority is to ratify and implement the Bonn targets for the Kyoto Protocol. This is a first step toward the long-term target of a 70% cut.
Protecting nature and wildlife
To protect and restore the functioning of natural systems, halt the loss of biodiversity in the EU and globally, and to protect soils against erosion and pollution. Actions will include implementation of environmental legislation, integration of environment and biodiversity into related policies (e.g. agriculture), and many other new initiatives.
Addressing environment and health
To achieve a level of environmental quality such that the concentrations of man–made contaminants do not give rise to significant impacts on human health. Actions will include research, a review of health standards, a reduction of risks from pesticides, and a new strategy on air pollution.
Preserving natural resources and managing waste
To prioritise waste prevention, followed by recycling, waste recovery, incineration, and as a last resort, land filling. The target is to reduce the quantity of waste going to final disposal by around 20% of 2000 levels by 2010.
Table 2-2: Sixth Environment Action Programme Priorities and Objectives
By the time the 6th EAP draws to a close, at least five Central and East European (CEE) states (Hungary, Czech Republic, Slovenia, Poland and Estonia) will have joined the EU. Three more (Turkey, Cyprus and Malta) are also currently negotiating membership. These states have also contributed to the drafting of the 6th EAP, through the assistance of the Regional Environmental Centre for Central and Eastern Europe [Chodak 2001]. Five horizontal crosscutting approaches have been highlighted to achieve these improvements. These include:
• Implementing existing legislation (through compliance monitoring and publicising successes and failures of national governments);
• Ensuring integration of environmental issues within all sectors of policy-making (this requires better information and ‘sound science’ regarding the occurrence of environmental problems, as well as better assessment of policy effectiveness through indicators and reliable reporting mechanisms);
• Working with industry to ensure ‘green growth’ through incentives and penalties;
• Improving public access to clear and trustworthy environmental information, and;
• Encouraging better local land-use planning. Combined, these policies are expected to bring greater coherence between environment and other sectors (energy, transport, agriculture) and will provide substantial input for the EU position at Rio+10 in 2002 [CEC COM 264, 2001].
9

CASSIOPEE
Furthermore, the enlargement of the European Union may be the biggest single contribution to global sustainable development that the EU can make. The extension of its policies and legislation to CEE will in effect be a leapfrog development, upgrading environmental protection, social development, and economic growth in that region [CEC COM 264, 2001].
2.2.2.3 Towards a European Climate Change Programme (ECCP) The EU’s Climate Change Programme [CEC COM 88, 2000] was released to the European Council on 8 March 2000. Accordingly, the EU intends to begin ratification of the Kyoto Protocol immediately following the Sixth Conference of Parties (COP-6). This means:
• The burden sharing agreement (the reduction target for the EU as a whole) will have to be incorporated into a legal instrument. Its translation into formal policy will allow the ratification of the Kyoto Protocol jointly by the Member States and by the EC.
• An implementation strategy will accompany the ratification instrument, and will illustrate which policies and measures should be undertaken.
The Strategy further emphasises that Member States must commit themselves to establishing and strengthening their domestic policies for reducing greenhouse gas emissions, as well as monitoring their effectiveness. The EU, meanwhile, will focus on priority actions in the energy, transport, and industry sectors, as well as on the development of flexible mechanisms, including emissions trading.
2.2.2.4 A European Community Biodiversity Strategy The Convention on Biological Diversity (CBD), ratified by the EC on 21 December 1993, provides the framework for international action. The EU’s response is the Community Biodiversity Strategy [CEC COM 9842, 2000]. The Strategy aims to anticipate, prevent, and attack the causes of significant reduction of biological diversity (highlighted in Appendix C) at the source. It also proposes a series of action plans and other measures within the context of the Convention for the conservation of natural resources, agriculture, and fisheries. The Community Biodiversity Strategy is developed around four major themes:
• Conservation and Sustainable Use of Biological Diversity; • Sharing of the Benefits Arising out of Utilisation of Genetic Resources; • Research, Identification, Monitoring, and Exchange of Information, and; • Education, Training, and Awareness.
The third theme (most relevant to micro-spacecraft) targets the current incomplete state of knowledge concerning biodiversity, and calls for efforts to identify and monitor the most important components of biodiversity, as well as for the development of a system of indicators to monitor status and threats, based on a species and ecosystems approach. In addition, support for the consolidation and further development of the so-called Clearing House Mechanism (CHM) (the prime vehicle for international information exchange on biodiversity) is also highlighted. The Convention on Biological Diversity (CBD), ratified by the EC on 21 December 1993, provides the framework for international action. The EU’s response is the Community Biodiversity Strategy [CEC COM 9842, 2000]. The Strategy aims to
10

CASSIOPEE
anticipate, prevent, and attack the causes of significant reduction of biological diversity (highlighted in Appendix C) at the source. It also proposes a series of action plans and other measures within the context of the Convention for the conservation of natural resources, agriculture, and fisheries. The Community Biodiversity Strategy is developed around four major themes:
• Conservation and Sustainable Use of Biological Diversity; • Sharing of the Benefits Arising out of Utilisation of Genetic Resources; • Research, Identification, Monitoring, and Exchange of Information, and; • Education, Training, and Awareness.
The third theme (most relevant to micro-spacecraft) targets the current incomplete state of knowledge concerning biodiversity, and calls for efforts to identify and monitor the most important components of biodiversity, as well as for the development of a system of indicators to monitor status and threats, based on a species and ecosystems approach. In addition, support for the consolidation and further development of the so-called Clearing House Mechanism (CHM) (the prime vehicle for international information exchange on biodiversity) is also highlighted.
2.2.3 European policies relating space and the environment The GMES (Global Monitoring for Environment and Security) initiative represents an attempt to bring the European Union and the European Space Agency (ESA) closer together in the context of a global system for monitoring of various environmental parameters and controlling natural and industrial risks [Fekete 2000]. Its broader goals, as they relates to the Joint EC/ESA Document on a European Strategy for Space [CEC COM 597, 2000] are referenced in Sections 3.1.1 and 3.1.2. Within GMES, three concrete environmental themes are addressed:
• global changes, such as climate change as a result of human activity; • environmental stress, such as desertification, and; • local level, natural and man-made disasters.
According to the GMES introductory document [CEC GMES 2000], two areas are given special attention:
• Kyoto Protocol implementation and other Environmental Treaties, and; • Environmental Stress, Population Pressures and Humanitarian Aid.
Feasibility studies are to be undertaken for these areas in order to identify potential support for a forthcoming environment and security policy initiative. Within the context of the Kyoto Protocol, the following results are sought:
• A list of products that demonstrate the capability to determine and monitor land use change and forestry activities.
• Scientific co-operation with other international organisations to promote, maintain and develop systematic observation systems.
In this context, GMES will initially target land use change and forestry [CEC GMES 2000], as reflected in the current (June 2001) GMES Action Plan being finalised by the EC to cover activities for the initial period from 2001 to 2003 [EC/ESA 2001].
11

CASSIOPEE
2.3 Targeting the atmosphere: greenhouse gases & atmospheric pollution
2.3.1 Defining a target Analysis of the current state of the European environment narrowed us down to a set of nine major issues for water, land, and atmospheric monitoring, as detailed in Appendix C. Coupling these with our investigations into the current politically 'hot' issues and our understanding of the limitations of microsatellite remote sensing, we came to focus on the broad area of atmospheric issues. Discussions with the EEA and the Joint Research Centre of the EU directed us away from the issue of stratospheric ozone, which is under thorough investigation by a number of other systems, and hazardous substance emissions, which make poor targets for orbital remote sensing due to their small concentrations. Transboundary air pollution, particularly that of smog and its tracer gas, carbon monoxide (CO), came through the analysis as a significant concern. But while interest at a city policy level was strong, the issue carried little weight at the broader regional levels that we had chosen as the prime focus for the CASSIOPEE baseline concept. Recognising the importance of the air pollution issue, however, we have included it as the primary objective for an alternative mission concept derived from the CASSIOPEE baseline. This system is presented in greater detail in Chapter 7. Greenhouse gases remain a critical issue for Europe from the perspectives of both environmental science and policy. High levels of carbon dioxide, methane, and nitrous oxide emissions in the post-industrial era are placing increased pressures on the global climate. Without a reinforcement of current policy measures, the ‘business-as-usual-scenario’ is likely to end up closer to a 6-8% increase, rather than the desired 8% reduction, compared to 1990 levels [CEC COM 88, 2000]. Such an increase would have wide-reaching effects at both the regional and local levels. In a global context, climate change and the Kyoto Protocol are the most critical environmental policy issues for Europe. Furthermore, a remote sensing system for greenhouse gases fills a distinct gap in current monitoring and modelling efforts. Because there are no existing systems currently monitoring greenhouse gases to the accuracy and precision needed for Kyoto verification, current emissions must be estimated on a country-by-country basis from simple models based on total fossil fuel consumption. Not only is such a system incomplete, but it also lends no data to the process of further modelling. By gathering direct greenhouse gas column data over an extended period with high accuracy and good temporal resolution, more accurate modelling of regional emissions and atmospheric transport can be achieved.
2.3.2 The Greenhouse Effect 24 hours a day, 7 days a week, 365 days a year, sunlight races 8 minutes across the gap between our Sun and our home planet and delivers a payload of incident radiation to our atmosphere – 1350 W/m2 at the equator, averaging out to approximately 343 W/m2 globally, accounting for day-night cycles and indirect lighting at higher latitudes. After scattering and reflection, approximately 84% of this radiation reaches
12

CASSIOPEE
the surface, where it provides around 288 Watts of light and heat energy to each square meter of our planet’s surface. At the same time, the Earth is also emitting radiation back into space, as dictated by Planck’s Law. With an average temperature of 15°C across the globe, this energy output should be equivalent to 390 W/m2 worldwide [Houghton 1997]. A quick look at these two numbers shows us that something is not quite right, and our planet’s climate hangs in the balance. The answer to this energy equilibrium lies in gases composing less than 1% of our atmosphere. Carbon dioxide, water vapour, and other minor components act as an extra insulator for the planet, trapping a fraction of the thermal radiation and reflecting it back towards the Earth. This natural greenhouse effect provides the rest of the energy needed to keep our planet at a temperature capable of sustaining life. Rising amounts of these greenhouse gases, however, are causing an enhanced greenhouse effect and a rise in global atmospheric temperatures. More specifically, since the Industrial Revolution, the quantities of atmospheric carbon dioxide (CO2), methane (CH4), nitrous oxide (N2O), chlorofluorocarbons (CFCs), and other gases have been increasing at rates much above that which the environment can handle. While greenhouse gas sources are both natural and anthropogenic, their recent rise can be traced predominantly to increased use of fossil fuels and burning of the tropical rain forests (See Figure 2-1 [Hutchinson 2000]).
Figure 2-1: The Enhanced Greenhouse Effect
Both positive and negative feedback loops exist within this system. In particular, global warming initiates greater evaporation from land-bound water sinks. This rise in atmospheric water vapour then serves to enhance the greenhouse effect, causing further evaporation, and so on. On the other hand, these same clouds also reflect incoming solar radiation and emit thermal radiation of their own, thereby helping to
13

CASSIOPEE
cool the Earth’s surface. Accounting for such feedback, advanced climate models predict a rise in average global temperatures of approximately 2.5°C if CO2 concentrations were doubled from current levels [Houghton 1997]. Effects of such global warming would reach far beyond a simple rise in temperature. At the broadest level, such changes would interrupt the natural cyclical variations in climate, bringing about an extended inter-glacial period beyond what is predicted by historical trends. In the near term, rising temperatures will lead to redistribution in moisture around the globe, causing some areas to become drier and others to become wetter. Such a redistribution would cause major problems for the world’s agricultural and food production sectors. Warming in the extreme latitudes could cause melting of the polar icecaps and a rise in global sea levels, as well as changes in world weather as a result of changing heat transport patterns by ocean currents. The combination of these changes in regional temperatures, precipitation, and weather patterns would also place additional stresses on many ecological communities, affecting the balance of regional flora and fauna [Mackenzie 1995]. Economically speaking, these shifts also carry an ever-increasing price tag due to loss of human life and property. Due to the complexity of the greenhouse gas phenomena, an absence of long-term measurements, and deficiencies in modelling, the question relating to ‘global warming’ is controversial. However, an accurate and timely monitoring system such as CASSIOPEE would assist in finding answers and informing decision makers on both regional and global scales. The three major GHGs that the system will measure are described in detail below.
2.3.3 CO2: A global & environmental problem While visible light passes fairly easily through atmospheric carbon dioxide, infrared radiation emitted from the Earth's surface has much greater difficulty. This spectral difference causes CO2 to act as a classic greenhouse gas, trapping the Earth's own radiation within the atmosphere. Indeed, CO2 is responsible for over 60% of the emissions-based greenhouse effect. Its 1990 atmospheric concentration of 350 parts per million volume (ppmv) represents a significant increase from an estimated 280 ppmv in pre-industrial times (before 1880) [Jacka 1995]. In nature, the carbon cycle provides a balance between the amount of carbon taken out of the atmosphere each year by plant photosynthesis and the amount put back into the atmosphere by the processes of animal respiration and plant decay. Anthropogenic emissions, however, have disrupted this equilibrium.
2.3.3.1 Carbon cycle Carbon is stored in the nonliving environment as atmospheric CO2, dissolved HCO3
¯, carbonate rocks (limestone and coral - CaCO3), and fossil fuel deposits derived from dead organic matter [Butcher et al. 1992]. Current carbon balances show approximately 750 gigatonnes (Gt) of atmospheric carbon stores, over 38,000 Gt in the deep ocean, and roughly 1,000 Gt in the surface ocean [Schimel et al. 1995].
14

CASSIOPEE
2.3.3.2 CO2 sources and sinks Natural CO2 sources include respiration, totalling 60 Gt annually, and the surface ocean, releasing 90 Gt annually [Schimel et al. 1995]. Anthropogenic sources are dominated by fossil fuel combustion and deforestation and other changes in land use, totalling 1.6 Gt annually [Schimel et al. 1995]. More specifically, 3.7 tonnes of CO2 are released for every tonne of fossil fuel burned, and annual emissions estimates total over 22 billion tonnes each year, with numbers still climbing [Environment Canada 2001]. The ocean’s surface depths also act as a natural sink for atmospheric CO2, providing 92 Gt of carbon uptake each year, as do photosynthesising plants, which absorb 61.4 Gt carbon every year [Schimel et al 1995].
2.3.3.3 Increases in atmospheric CO2 concentration Carbon dioxide levels remained relatively stable for thousands of years until the Industrial Revolution. Ice core samples taken from the polar regions, however, show a rapid increase in carbon levels beginning around 1800, as seen in Figure 2-2 [Jacka 1995].
Figure 2-2: Concentration of CO2 from trapped air measurements
As illustrated by these ice core measurements (from the DE08 ice core of Law Dome, Antarctica) and other direct atmospheric counts, atmospheric carbon dioxide levels have been increasing for at least 200 years [Barnola et al. 1995], [Etheridge et al. 1996], [Beardsmore and Pearman 1987], [Keeling et al. 1989], [Keeling and Whorf 1994], [Thoning et al. 1994] or [Levin et al. 1995]. Such an increase is almost surely indicative of global climatic change [IPCC 1996].
15

CASSIOPEE
Because trees and other vegetation act as natural storehouses for carbon dioxide, deforestation and burning results not only in the release of the carbon dioxide into the atmosphere, but also in the deterioration of this CO2 sink. More land has been cleared for human use in the last 100 years than in all of previous human history, and the CO2 release from this conversion is estimated at greater than 100 billion tonnes [Environment Canada 2001]. One strange factor in this process is that atmospheric increases in CO2 are only about one-half of what was expected due to estimated levels of fossil fuel consumption and deforestation. Two potential explanations for this uptake are:
• Increased growth of forests, especially in North America, and; • Increased amounts of phytoplankton in the oceans.
However, despite these ‘sinks’ for our greatly increased CO2 production, atmospheric concentrations continue to rise.
2.3.3.4 Restoring carbon cycle equilibrium The rate at which the carbon cycle, and more specifically the atmospheric reservoir of CO2, will reach a new equilibrium in response to these increased emissions depends upon the response period of the system itself, particularly the different time constants of the various carbon reservoirs [Watson et al. 1990]. The atmosphere, surface oceans, and terrestrial biosphere equilibrate rapidly. However, exchange with the deep oceans takes place over several decades to centuries, driving the long-term response of the atmospheric CO2 [Watson et al. 1992]. In fact, it is believed the oceans absorb 50% of the actual CO2 in the Earth’s biosphere. The question of how much time remains until the oceans become saturated is still open for debate. Tracking CO2 is neither simple nor easy. Measurements of CO2 in the ocean and terrestrial biosphere are scarce; CO2 released due to human activities is indistinguishable from naturally occurring CO2; and the natural fluxes of carbon between ocean, atmosphere, and terrestrial biosphere are poorly understood.
2.3.3.5 Responses to rising CO2 levels As detailed in Section 2.2, the Kyoto Protocol has set 2008-2012 as the target date for greenhouse gas emission reductions to be implemented. However, despite growths in energy efficiency, the EU’s energy consumption will likely increase by 15% from 1995 to 2010. With more households, more mobility, and more transport, a 30% increase is foreseen in passenger car transport and 50% in freight transport. This will cause a further rise in emissions of carbon dioxide, making climate change issues even more difficult to tackle. The EU target to reduce greenhouse gases emissions by 5.2% over 1990 levels by 2012 is not likely to be met without a major shift in emissions habits. The share of renewable energy sources, now 6%, is increasing, though only modestly. It is unlikely that the target of 12% by 2010 will be met. Recent Member States projections suggest that existing policies and measures would, at best, limit the increase of total EU CO2 emissions to 3% by 2010 over 1990 levels. The largest increase in CO2 emissions would be in the transport sector, with a projected increase
16
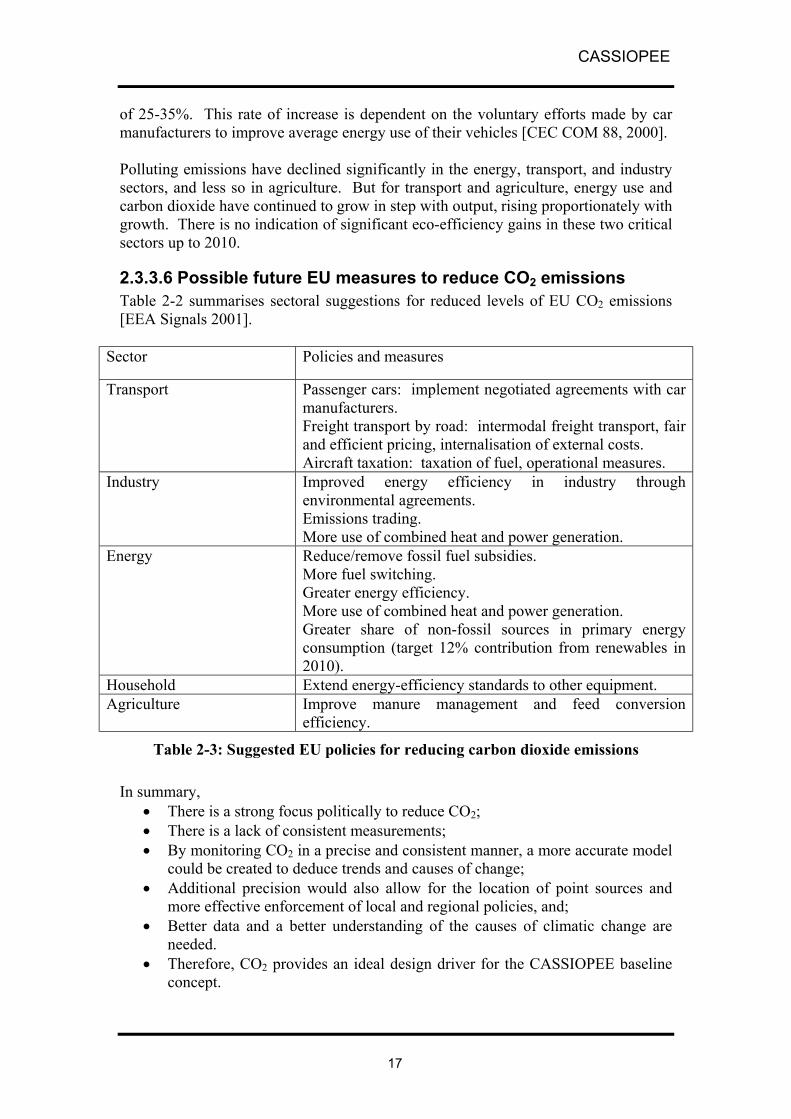
CASSIOPEE
of 25-35%. This rate of increase is dependent on the voluntary efforts made by car manufacturers to improve average energy use of their vehicles [CEC COM 88, 2000]. Polluting emissions have declined significantly in the energy, transport, and industry sectors, and less so in agriculture. But for transport and agriculture, energy use and carbon dioxide have continued to grow in step with output, rising proportionately with growth. There is no indication of significant eco-efficiency gains in these two critical sectors up to 2010.
2.3.3.6 Possible future EU measures to reduce CO2 emissions Table 2-2 summarises sectoral suggestions for reduced levels of EU CO2 emissions [EEA Signals 2001].
Sector Policies and measures
Transport Passenger cars: implement negotiated agreements with car manufacturers. Freight transport by road: intermodal freight transport, fair and efficient pricing, internalisation of external costs. Aircraft taxation: taxation of fuel, operational measures.
Industry Improved energy efficiency in industry through environmental agreements. Emissions trading. More use of combined heat and power generation.
Energy Reduce/remove fossil fuel subsidies. More fuel switching. Greater energy efficiency. More use of combined heat and power generation. Greater share of non-fossil sources in primary energy consumption (target 12% contribution from renewables in 2010).
Household Extend energy-efficiency standards to other equipment. Agriculture Improve manure management and feed conversion
efficiency.
Table 2-3: Suggested EU policies for reducing carbon dioxide emissions
In summary, • There is a strong focus politically to reduce CO2; • There is a lack of consistent measurements; • By monitoring CO2 in a precise and consistent manner, a more accurate model
could be created to deduce trends and causes of change; • Additional precision would also allow for the location of point sources and
more effective enforcement of local and regional policies, and; • Better data and a better understanding of the causes of climatic change are
needed. • Therefore, CO2 provides an ideal design driver for the CASSIOPEE baseline
concept.
17

CASSIOPEE
2.3.4 Methane Methane (CH4) is the primary component of natural gas, and the second largest contributor to the greenhouse effect, behind CO2. This atmospheric trace gas is involved in many chemical reactions in the troposphere and stratosphere. It has an atmospheric lifetime of 10-12 years, significantly shorter than the 50-200 year lifetime expected for CO2 [Pickering & Owen 1994]. The Intergovernmental Panel on Climate Change (IPCC) has classified sources of CH4 as both natural and anthropogenic. The natural sources include wetlands, termites, oceans, freshwater and methane hydrate. Under low temperatures and high pressures, methane hydrate forms a frozen lattice made up of water and CH4. This compound is found underlying our marine sediments, oceans, and polar permafrost in huge amounts. Much research has been undertaken in this area because the immense volumes of gas and the richness of the deposits of methane hydrate make it a strong candidate for development as an energy resource [Pickering & Owen 1994]. Anthropogenic sources of CH4 include coal mining, natural gas and petroleum industry, rice paddies, enteric fermentation, animal wastes, domestic sewage treatment, landfills, and biomass burning. The main sinks are atmospheric (tropospheric hydroxyl and stratospheric oxidation) removal, atmospheric take-up, and removal by soil [Pickering & Owen 1994]. From 1994 to 1996, annual global methane concentrations were estimated at 1,721, 1,728 and 1,730 parts per billion volume (ppbv) [Dillon, 2001]. Although the trend appears to be stabilising, the 1% annual change in concentration is four times the rate of increase of CO2, and is indicative of a trend that could lead to the emergence of methane as the principal greenhouse gas within 50 years. The Kyoto Protocol and UN Framework Convention on Climate Change recognised the need to stabilise methane emissions globally. More importantly, the emissions of methane are also associated with wasted energy, especially from landfills and sewage treatment. Every time energy is used and some of it is wasted, its by-product heat and gases intensify air pollution, adding to the global climate change concern [US EPA 2001].
2.3.5 Nitrous Oxide Discovered by Joseph Priestley in 1793, nitrous oxide (N2O) is perhaps most commonly known for its application as an anaesthetic [Nitrous 2001]. When it comes to the environment, however, this “laughing gas” is no laughing matter. N2O is a powerful greenhouse gas, with a Global Warming Potential (GWP) 310 times that of CO2 [Ritter & Bernd 2001]. In CO2-equivalent terms, nitrous oxide contributes 9% to the greenhouse gas inventory of Europe [EEA Signals 2001]. Nitrous oxide, like most other atmospheric compounds, has both natural and anthropogenic sources. Cyclical variations are produced seasonally by biological sources in soil and water. Anaerobic microbial processes of nitrification and denitrification are further augmented by nitrogen-rich agricultural fertilisers and livestock wastes [EPA N2O 2001].
18

CASSIOPEE
Outside of agriculture, anthropogenic contributions tend to remain fairly independent of these seasonal fluctuations. In the transportation sector, N2O is a by-product of fuel combustion. In industrial processing, a number of sources exist, including adipic acid production in the process of nylon manufacturing and food processing, and nitric acid production in the synthesis of commercial fertiliser and explosives. Other sources of N2O include catalytic converter units on automobiles and human sewage treatment systems [EPA N2O 2001] and [EEA Signals 2001]. Emissions of N2O tend to distribute fairly homogenously in the lower troposphere, due to normal atmospheric and weather dynamics. Eventually, however, the gas migrates to the stratosphere where photochemical reactions transform it into a primary source of reactive nitrogen oxides (NOx) in that region [JPL Chemistry 2001]. Since the 1800’s, concentrations of atmospheric N2O have risen 13% worldwide, and are estimated to be on the rise at a rate of about 0.25% per year [IPCC 1994; EPA N2O 2001]. New programmes in western Europe, however, are helping to cut back on N2O concentrations, and a 2000 EEA report on regional greenhouse gases detailed a 14% drop in nitrous oxide levels for the EU’s 15 Member States during the 1990’s (Figure 2-3 [Ritter & Bernd 2001]). Further modelling suggests that existing policies in agriculture and industry should lead an additional 2% decrease in the region by 2010 [EEA Signals 2001].
N2O Emissions for the EU
330
340
350
360
370
380
390
400
1990 1991 1992 1993 1994 1995 1996 1997 1998 1999
Year
CO
2 Equ
ival
ent (
Tg)
Figure 2-3: Annual nitrous oxide emissions for the EU Member States
Within the 15 states of the EU, the largest sectoral contributors to this problem are agriculture, energy, and industrial processes. In the last decade, the agricultural sector has maintained fairly consistent emissions levels, while energy has shown a 21% increase in N2O. The Industrial sector, particularly since 1997, has made great strides to register a 56% decrease in its emissions [Ritter & Bernd 2001]. As a side note, another minor source of N2O pollution actually has led to positive environmental effects. Following the major campaigns against CFC-powered aerosol
19

CASSIOPEE
cans of the 1980’s and 1990’s, N2O became the propellant of choice [Nitrous 2001]. This minor added burden to the greenhouse gas inventory has made a large stride in the preservation of stratospheric ozone. Beyond the general policies set forward at the Bonn meeting on the Kyoto Protocol, no specific emissions targets have been set for nitrous oxide. Existing policies intended to control total industrial emissions and the reformed Common Agricultural Policy (CAP) are seen as the largest programmatic factors in reducing nitrous oxide levels. Reduced fertiliser application, improved manure management, and improved technology in industrial controls for adipic acid and nitric acid production will also help to cut emissions [EEA Signals 2001]. In summary, while total nitrous oxide levels in Europe are falling, the gas still represents a sizeable greenhouse threat. Furthermore, N2O trends in agriculture and energy point to a continued need for concern in this arena. The widespread distribution of atmospheric gases and the need for extended temporal measurements make N2O a good candidate for space-based remote sensing, and hence, an additional area of focus for the CASSIOPEE baseline concept.
2.4 Current capabilities: space-based, airborne and ground-based
The interest in greenhouse gases has grown very much in recent years and their increasing effect on climate has led to a subsequent increase in monitoring efforts. Ground monitoring systems generally provide data on greenhouse gas emissions. Air-based monitoring programmes generally provide concentration data for the lower atmosphere. Space-based systems are used to make large-scale observations of greenhouse gases. In climate studies, all three systems are integrated with each other, enhancing global greenhouse gas estimations, improving climate models, and developing understanding of emission and fixation mechanisms. In the following sections, past, current, and future ground, air, and space-based programmes are investigated to generate requirements for the new CASSIOPEE instrument.
2.4.1 Space-based systems So far, space-based atmospheric measurements have mainly focused on understanding the chemistry and physics of the atmosphere. Some instruments have been flown to monitor one or two major greenhouse gases. Existing information from other satellites has been analysed to provide secondary data products on greenhouse gas concentrations. However, to date, there is no single spaceborne instrument dedicated to the consistent observation of carbon dioxide, methane, and nitrous oxide. Appendix D presents a summary of past, current, and future space instruments for atmospheric studies. The past instruments include IMG, an Interferometric Monitor for Greenhouse Gases, which flew on the ADEOS satellite and provided data for all three of the gases in question. The instrument, which flew between 1996 and 1997, had an 8 km ground resolution. However, the IMG instrument will not fly on the second ADEOS mission.
20

CASSIOPEE
Another former instrument is HALOE, the Halogen Occultation Experiment, which flew on board the UARS NASA satellite. This instrument provided 8 years of methane data between 1991 and 1999. Current instruments include MOPITT, flying on board the EOS TERRA satellite since 2000. It measures tropospheric pollution, as well as the greenhouse gases, CO2 and CH4, with 22 km ground resolution and 5 km vertical resolution. Future instruments include AIRS, HIRDLS, IASI, IMG, MASTER, MIPAS, MLS, SCIAMACHY, SOPRANO, and TES (See the Acronym list for full names). Among them, SCIAMACHY is the only one which will attempt to measure all the greenhouse gases defined in the CASSIOPEE baseline concept. This ESA instrument will fly on board ENVISAT at the end of 2001, using a high resolution grating spectrometer to improve understanding of atmospheric chemistry and dynamics. Specifications include vertical resolution of 2.3 to 3 km and ground resolution of 30 km across and 240 km along the direction of observation. But even for this mission, greenhouse gas measurements are a secondary objective. The future instruments which plan to measure at least two greenhouse gases are AIRS, HRDLS, IASI, and MIPAS. AIRS (Atmospheric Infrared Sounder) is a NASA instrument with a 13.5 km ground and 1 km vertical resolution. It will provide data on CO2 and CH4 in the lower atmosphere. HRDLS (High Resolution Dynamics Limb Sounder) is an ESA mission that will be launched after 2002 to provide data on CH4 and N2O for the upper troposphere. IASI (Infrared Atmospheric Sounding Interferometer) is one of the future missions of EUMETSAT, 2005. It will sound the lower atmosphere and provide data on CH4 and N2O. MIPAS (Michelson Interferometer for Passive Atmospheric Sounding) is another instrument of ENVISAT, which will measure CH4 and N2O in the stratosphere. Space stations have also provided a platform for space-based remote sensing. MIRS (Multichannel Infrared Spectrometer) flew on Mir between 1996 and 1999. It provided valuable data on CO2, CH4, and N2O concentrations in the lower stratosphere [Lebedev 2001]. Generally, these instruments have been characterised by large swath widths (in the thousands of kilometres range) and spatial resolutions anywhere from one kilometre to tens of kilometres. Normally, spatial resolution varies depending upon whether the satellite is pointing its instrument in the nadir direction, or pointing towards the limb of the atmosphere. The precision of the instruments varies by instrument, generally in the range of 1 to 10 percent. The SCIAMACHY instrument, scheduled to fly aboard ENVISAT, is designed to provide 1% precision for concentrations of CO2 and CH4, and to within 10% for N2O. The IMG sensor has precision of 2-3% for N2O [EOS Aura 2001], while MOPITT has 1% precision for CH4 [ACD NCA 2001]. All these past, current and future instruments have fairly high masses. SCIAMACHY instrument masses 215 kg [SCIAMACHY 2001], MIPAS masses 320 kg [ENVISAT 2001] [ENVISAT 2001], IMG masses 280 kg [UARS MLS 2001], MOPITT masses
21

CASSIOPEE
184 kg [EOS TERRA 2001]. So far, small satellites have not been developed for atmospheric studies. Furthermore, there is a need for a single satellite system to provide consistent high-accuracy measurements of the three primary GHGs in question. Such a system, utilising only one set of measurement and calibration techniques, will provide a coherent set of greenhouse gas data for feeding into both modelling and monitoring efforts.
2.4.2 Airborne systems The main platforms used in airborne measurements are aircrafts and balloons. Generally airborne measurements are carried out within the frame of a broader project, in combination with ground and/or space-based systems. They provide high-quality regional data for distinct periods of time rather than continuous monitoring. In Europe, there are many projects utilising airborne measurements. A selection of them are provided below:
STREAM (Stratosphere Troposphere Exchange from Aircraft Measurements) is funded by EU to investigate the exchange of air masses between the stratosphere and the troposphere. Its in situ gas chromatograph, GHOST (Gas Chromatograph for Observation of Stratospheric Tracers), has been deployed on board a Cessna Citation–II flying to altitudes of 13 km. The instrument measures trace gases, including N2O [STREAM 2001]. Airborne Platform for Earth Observation - Contribution to THESEO (APE-THESEO) was an EU-funded project within the frame of the Third European Stratospheric Experiment on Ozone, comprised of 12 participating European institutions. The Russian M55-Geophysica and DLR Falcon high altitude aircrafts were used as the main platforms for carrying a diverse payload of in situ and remote sensing instruments to altitudes of up to 21 km. The programme provided measurements of CO2 and N2O throughout the 1999 campaign [SA 2001].
Airborne measurements are also applied to validate satellites launched for atmospheric studies. In Europe, studies to launch a campaign for the validation of ENVISAT have been initiated by ESA. Both aircraft and balloons are proposed as measurement platforms for validation. For the SCIAMACHY instrument, a DLR Falcon equipped with Airborne SUbmillimeter wave Radiometer (ASUR), Lidar EXperiment (OLEX), and Airborne MultiAxis Differential Optical Absorption Spectrometer (AMAXDOAS) [Ehret at al. 2001] has been suggested to perform the flight campaign. These instruments will provide in situ measurements of the trace gases observed by SCIAMACHY.
2.4.3 Ground-based systems There are many ground-based atmospheric research programmes in Europe carried out at the local and regional scales including CARBOEUROPE, EuroAirNet, and SOGE.
22

CASSIOPEE
2.4.3.1 CARBOEUROPE CARBOEUROPE is a cluster of EU projects created in 2000 and involving 69 institutions in 15 European countries. The 36 month-long programme has been designed to advance the understanding of carbon fixation mechanisms, sources and sinks for a range of ecosystems, availability of nutrients, changing rates of nitrogen deposition, and possible feedback loops between the terrestrial biosphere and the atmosphere. CARBOEUROPE has more than 30 European test sites between 41° and 65° North Latitude and about 20° West to 25° East longitude. At each of these sites, carbon, nitrogen, energy, and water fluxes are continuously monitored, and some soil carbon and biomass studies are applied. The ground data gathered from these sites will be integrated with air data and climate models to investigate the relation between anthropogenic emissions and ecosystem behaviour [MPIB 2001]. The eight projects of CARBOEUROPE focus on different issues and different scopes. The AEROCARB project was designed to verify carbon balance on European scale, RECAB to quantify and verify carbon balances on regional scale, CARBOEUROFLUX to quantify forest carbon balances on stand scale, FORCAST to understand soil and biomass carbon and nitrogen turnover processes, and CARBOAGE to define guidelines for optimised carbon management in forests. Other projects include CARBODATA to exploit and make widely available the results of the CARBOUROPE projects, EUROSIBERIAN CARBONFLUX to provide a feasibility study for a monitoring system across scales for Siberia, and LBA CARBONSINK, which is the European contribution to a monitoring system across scales in the Amazon [MPIB 2001].
2.4.3.2 EuroAirNet EuroAirNet is a European Air Quality Monitoring programme initiated in 1997 to provide adequate background information for making air quality assessments on the European scale. It is supported by approximately 5000 stations, taking air pollution measurements from air, rain, and material samples on a daily and weekly basis for the European Air Quality Database (AIRBASE). However, the resolution of the measurement systems is not standardised, and the data is generally used for trending, rather than absolute amounts of pollution [EEA TECH12 2001]. The objectives for EuroAirNet fall into three stages:
• Stage1 objective: Air pollution exposure assessment on the European scale by monitoring alone -- requires a network that is representative for the different exposure situations in the various cities and region of Europe;
• Stage 2 objective: Air pollution exposure assessment by a combination of monitoring and modelling -- requires that stations are selected which are suitable for comparison with the calculations models, and;
• Stage 3 objective: The network will support quantitative assessment of exposure and effects, a basis for cost-effective abatement strategies -- requires quantitative information about details in distribution of the exposed objects (population, materials, ecosystems), and dose-response relationship.
The stations are selected in such way to enable:
23

CASSIOPEE
• a general description of European air quality; • a comparison of air quality between cities, and; • an estimation of exposure to various pollutants [EuroAirNet 2001].
2.4.3.3 SOGE SOGE (System for Observation of Greenhouse Gases in Europe) is an ongoing project in Europe, initiated by the EC in 2000 to make in situ measurements of CFCs and HFCFs at four sites around the region. The purpose of the project is to develop a cost-effective long-term European observation system for halogenated greenhouse gases and to assess the impacts of the halocarbons on both the climate and the ozone layer. A combination of measurement and modelling outputs will provide guidance for development of the Kyoto and Montreal protocols [NILU 2001; EORCU 2001].
2.4.3.4 CORINAIR In operation since 1985, COordination of INformation on AIR emissions (CORINAIR) is an ongoing database project dedicated to collecting European atmospheric data. This system relies on the environmental agencies of each country to report their own information for integration. However, there appears to be no set requirement for how the data is collected, and the system is used for trend data, rather than for generating a precise map of Europe’s emissions. The measurement for CO2 is no better than ±10%. CH4 data can be as variable as ±100%, and N2O can be off by as much as two orders of magnitude [IPCC 1997].
2.4.3.5 EDGAR The EDGAR (Emission Database for Global Atmospheric Research) database is a joint project of RIVM (Dutch National Institute for Public Health and the Environment) and TNO (The Netherlands Organisation for Applied Scientific Research) and stores global inventories of direct and indirect greenhouse gas emissions including halocarbons both on a per country basis as well as on a 1 x 1 degree grid [Olivier 1999]. Estimates are based on scientific information and on the distribution of population, cattle, cities, etc. [Pers. communication with A. van Amstel, Sept 2001]. EDGAR was specifically developed for use in global atmospheric models. The database has been developed with financial support from the Dutch Ministry of the Environment (VROM) and the Dutch National Research Programme on Global Air Pollution and Climate Change (NRP), in close cooperation with the Global Emissions Inventory Activity (GEIA), a component of the International Atmospheric Chemistry Programme (IGAC) of the International Geosphere-Biosphere Programme (IGBP) [Olivier 1999].
2.4.4 Combined programmes The United States’ National Oceanic and Atmospheric Administration (NOAA) Climate Monitoring and Diagnostic Laboratory (CMDL) is leading the Cooperative Atmospheric Data Integration Project, GLOBALVIEW, and Cooperative Monitoring Air Sampling. This set of information incorporates data from ships, planes and ground stations to monitor both CO2 and CH4 [GLOBALVIEW-CO2, 2001].
24

CASSIOPEE
2.5 Reporting and scientific gaps
2.5.1 Reporting gaps
2.5.1.1 Policy verification The European Council “Decision 99/296 EC for a Monitoring Mechanism of Community CO2 and Other Greenhouse Gas Emissions” sets the framework for the assessment of GHG emissions within the EU. An Annual European Community Greenhouse Gas Inventory is prepared by the European Environment Agency (through its Topic Centre on Air and Climate Change). This relies on emissions estimates based on mathematical extrapolation of carbon inputs/fuel combustion, and is submitted annually by Member States to the Commission [CEC COM 88, 2000]. This inventory incorporates three indicators:
• Estimated total emissions of individual greenhouse gases by country per annum;
• Estimated emissions of individual gases (CO2, CH4, N2O, PFCs, HFC, SF6) by sector, and;
• Cost estimates of policies and measures for existing and proposed measures for reducing GHG [Pers. communication with D. Stanners, EEA, August 2001].
Since responsibility rests with EU Member States to establish their own policies and measures for reducing greenhouse gas emissions, their effectiveness must be monitored on a continuous basis. In mid-1997, Revised 1996 Guidelines for National Greenhouse Gas Inventories were published by the Inter-governmental Panel on Climate Change (IPCC). (The IPCC, established by the World Meteorological Organisation (WMO) and the United Nations Environment Programme (UNEP) in 1988, has a mandate to assess the scientific, technical and socio-economic information relevant for the understanding of the risk of human-induced climate change) [IPCC 2000]. The Guidelines provide the methodology for estimating national GHG emissions in accordance with the United Nations Framework Convention on Climate Change (UNFCCC), while the 1996 revisions include additional methods, various new default emission factors, and other required data.
2.5.1.2 Is anything not being reported properly? Some methodological inconsistencies between Member States remain, as well as some gaps in the inventories. Not all EU Member States are using the Revised 1996 Guidelines for their national communications (which are typically submitted to the European Environment Agency via the CORINAIR system described in Section 2.4). According to Resources for the Future, a non-profit, non-partisan think-tank, this often yields incomplete and sometimes inaccurate reports. Furthermore, some Member States have presented adjusted national emissions estimates, using their own methodologies, which prevents accurate comparison between states. Improvement and consistency in reporting is therefore required in order to comply fully with the IPCC guidelines for the EC [EEA-ETC 1999]. With the pending ratification of the
25

CASSIOPEE
Kyoto Protocol and the increasing importance of emissions trading, the need for validated data, verified by an independent source is likely to increase considerably in an international context [Weathervane 2001]. In its “Third Assessment Report - Summary for Policymakers” [IPCC 2001a] (draft), the IPCC called for “further action to address remaining gaps in information and understanding” of the climate change phenomenon. In particular, it outlined a need for “additional systematic and sustained observations, modelling and process studies,” and noted its concern about “the decline of observational networks.” The following issues are selected from those identified as high priority areas for action:
• To sustain and expand the observational foundation for climate studies by providing accurate, long-term, consistent data, including implementation of a strategy for integrated global observations.
• To improve observations of the spatial distribution of greenhouse gases and aerosols.
The “IPCC Special Emissions Scenarios-Summary for Policymakers” report [IPCC 2000] provided further and more specific detail regarding the types of data desired on emissions of GHGs:
• New research activities to assess future developments in key GHG driving forces in greater regional, sub-regional, and sectoral detail, which allow for a clearer link between emissions scenarios and mitigation options;
• Improved specification [of] and data for […] non-CO2 GHG and non-energy sectors (such as land use, land-use change and forestry) [and] integration in models;
• Subsequent inter-model comparison to improve scenarios and analyses; • Development of additional gridded (raster format, high resolution) emissions
scenarios which would facilitate improved regional assessment; • Development of methods for scientifically sound aggregation of emissions
data.
2.5.2 Data management and modelling
2.5.2.1 Current methodologies Signatories to the UNFCC (such as the EU) annually submit to the Conference of the Parties, the information required under the so-called Common Reporting Format. This consists of a series of summary and sectoral tables containing estimates of GHG emissions and CO2 removals [UNFCC 2000]. In general, the basic approach to estimating national emissions is similar across the various gases and human activities. Fundamentally, emissions are a product of activity data and emission factors. In reality, these calculations are often more complicated, with several steps being involved in the calculation of each of the general terms [IPCC 1997]. A number of different possible methodologies or variations for calculating a given emission are provided. In most cases, these represent calculations of the same form,
26

CASSIOPEE
but differences exist in the level of detail at which the calculations are carried out. Wherever possible, the methodology provides a tiered structure of calculations, which describes and connects the various levels of detail at which national experts can work, based on the importance of the source category, availability of data, and other capabilities. The methodologies for the estimation of the emissions and removals of GHGs, which are presented and discussed in the Revised 1996 Guidelines, are grouped by the main activity sectors, namely: energy, industrial processes, solvent and other product use, agriculture, land use change and forestry, and waste. The IPCC’s National Greenhouse Gas Inventories Programme (NGGIP) has established a related task force, one of whose ongoing activities is “to develop and refine an internationally-agreed methodology […] for the calculation and reporting of national GHG emissions and removals” [IPCC 2001b].
2.5.2.2 Current modelling The determination of GHG sources and sinks is currently a hot topic for scientific research. Two fundamentally different strategies exist: (a) Bottom-Up
(b) Top-Down (a) The "Bottom-Up Strategy" starts with emission inputs on a grid that are derived from statistical information. These emission input data result from statistical relations between emission indicators (e.g. vegetation, industry, population distribution) and ground- and air-based emission measurements. In the case of the vegetation indicator, a geographically explicit vegetation model that includes climate data and possibly satellite information (e.g. the Greenness Index or the Normalized Difference Vegetation Index, NDVI) enables computing of exchange fluxes on a daily, monthly, or annual basis. Typically the vegetation model output is calibrated and/or tested at single sites where abundant measurements are available. The model then extrapolates this site-specific knowledge over the region of interest (e.g. Europe) using additional geographically referenced datasets, such as soil maps, ecosystem maps, and land-use maps. Subsequently, transport equations and atmospheric chemistry are used to model resulting concentrations of GHGs over the globe. MOGUNTIA is a good example of a bottom-up model that simulates the transport of gases in the global atmosphere [Lelieveld 1989; Zimmermann 1988], while IMAGE is an example of a bottom-up model that can calculate atmospheric concentrations of GHGs within Europe [Alcalmo & Kreileman 1996; Van Amstel et al. 1997]. (b) The "Top-Down Strategy" starts with precise measurements of the GHG concentrations obtained at remote monitoring locations. Because the atmosphere rapidly mixes the effects of heterogeneous local sources and sinks, it may be assumed that background measurements are representative of large areas.
27

CASSIOPEE
In order to quantitatively use this approach, a 3D model of atmospheric transport is used, which provides the connection between (surface) sources and sinks and the measurements at remote locations [Kaminski et al. 1999]. Currently, a worldwide network of about 200 stations is coordinated by NOAA/CMDL to measure CO2; some of these stations also measure other GHGs such as CH4 and N2O [NOAA CDML 2001]. Using an inverse modelling approach, the location and time variations of the GHG sources and sinks are inferred from atmospheric transport and GHG concentration observations [Heimann & Kaminski 1999]. However, due to the large heterogeneity of the sources and sinks of the GHG, the limited number of measuring stations adds a large uncertainty to these inverse modelling results. In order to improve the emission estimates, a Bayesian approach is used in which ‘prior’ or first- guess information on the sources and sinks is obtained from other sources of information (e.g. from gridded bottom-up models or statistical estimates). In the actual inversion procedure, the source information is adjusted such that the atmospheric observations are matched within their measurement uncertainty. Most of the differences between present studies result from differences in how this prior information is specified and how it is adjusted in the inversion procedure [Pers. communication with M. Heimann, Sept 2001].
2.5.3 CASSIOPEE mission objectives At present, each individual country, using the emission indicator approach outlined by the IPCC guidelines, compiles greenhouse gas inventories. At the same time, there exists a lack of techniques and methods to independently measure and monitor greenhouse gas emissions on an international basis, to allow for the verification of these national emission reports. The lack of reliable emission measurements at the regional (sub-national) scale creates severe problems for the calibration and validation of inventory emission estimates. Moreover, some data that tend to be taken for granted, such as national data on harvested areas of crops, are in fact inaccurate, which may directly influence national emission estimates by 10-30% [Denier van der Gon 2000]. Furthermore, emission measurements of some sources depend almost completely on a single technique. If this particular measurement produces biased emissions, there are obvious negative repercussions for emission estimates. Another pressing issue is the lack of reliable seasonal integrated emission measurements at the regional and national scale [Denier van der Gon 2000]. A dedicated satellite system can assist in acquiring such data. To these ends, two main objectives have been identified for the monitoring of GHG by CASSIOPEE:
• Monitor national emissions for verifying Kyoto protocol implementation; • Monitor regional emissions for within-nation control of emissions.
The greatest advantage of a satellite system over aircraft surveys is by consistent predictable revisitation. Ground and air-based systems remain important for the calibration and validation of these satellite measurements, however, as well as a source for complementary local data (See section 2.4).
28

CASSIOPEE
Satellite-derived column GHG concentration measurements can provide very useful additional information to feed the inversion procedures used in the top-down approach [Rayner & O’Brien 2001]. To contribute to emission monitoring, the collected satellite data must be converted from concentration measurements to monthly emission estimates. Inverse modelling then allows tracing the measured concentrations back to their sources and creating monthly emission maps for Europe and its Member States, which subsequently allows the calculation of annual national emissions. The technique of inserting satellite data into the inverse modelling of GHGs is only currently being developed, however. The issue will be addressed by the COCO (COmplete Carbon dioxide Observations) project, coordinated by the Max-Planck-Institute for Biogeochemistry in Jena, Germany. COCO is an EU-funded project that aims to measure CO2 from space by exploiting planned missions between 2001 and 2004. It is expected that this project will result in an operational system, which will most likely be implemented at the European Centre for Medium-Range Weather Forecasts (ECMWF) [Pers. communication with M. Heimann, Sept 2001]. No dedicated satellite system exists yet for measuring greenhouse gases with a high precision. Although the SCIAMACHY instrument on ENVISAT may be able to monitor these gases, it has not been designed for such assessment. Therefore, it is unlikely that this instrument will reach the high precision needed for useful measurements of these gases [Pers. communication with H. Bovensmann, Aug 2001]. Furthermore, a higher spatial resolution is needed to obtain sufficient cloud-free measurements. The CASSIOPEE mission concept will demonstrate that microsatellite technology can be used to generate high accuracy measurements of the principal greenhouse gases and thus make a valuable contribution to innovative and independent greenhouse gas emission monitoring.
2.6 System requirements The CASSIOPEE satellite system must meet several requirements to become useful for the monitoring of greenhouse gases. The main problem associated with GHG emission monitoring and determination is that very small changes due to anthropogenic emissions must be discriminated against the natural variability of these gases. The primary focus of our mission will be the carbon dioxide, because it is the most significant anthropogenic contributor to the enhanced greenhouse effect responsible for global warming. The secondary focus will be on CH4 and N2O. Although the mission will be optimised for CO2, these other gases are to be measured following similar requirements. The anthropogenic variability of CO2 is on the order of 1 ppmv per month. This should be compared with the total concentration of about 360 ppmv and a seasonal variability of 3-10 ppmv. Therefore, the driving force of this system design must be the accuracy of the measurements. The variation in the total column content of CO2 due to a typical emission of 1000 Tg/yr is between 0.07 and 0.7%. To measure this variation with a precision of 10%,
29

CASSIOPEE
measurements with an accuracy between 0.007 and 0.07% of the monthly mean are needed. From Rayner and O’Brien [2001], we can conclude that total column measurements with an accuracy of 1 ppmv are sufficient to determine CO2 emission sources. We do not require height-resolved information, but we do require observations in the absence of clouds. In conclusion, to significantly reduce the uncertainty in the carbon emission budget, an instrument is required which measures CO2 total column with a monthly mean precision of 1 ppmv per grid cell [Rayner & O’Brien 2001]. To provide such precision for an average European country, we need an accuracy of individual measurements between 0.5 and 1.0% with 250 ‘cloudfree’ data-points over an area of 500x500 km per month. This figure is based on analogy with estimates done for the SCIAMACHY mission [Pers. communication with H. Bovensmann, Aug 2001, see also Buchwitz et al. 2000]. Because fractional cloud cover within the field of view affects the quality of the total column measurements of tropospheric gases, ‘cloudfree’ is defined as having fractional cloud cover of less than 10%.. With poor spatial resolution, a single pixel can be imaging both cloud-covered and cloud-free regions of the atmosphere. The probability that a pixel is cloud-free is directly related to the pixel size. Figure 2-5 shows the relationship between fractional cloud cover and spatial resolution.
Percentage of cloud-free pixels vs spatial resolution
0
3
6
9
12
15
5 10 15 20 25Spatial Resolution (km)
Clo
ud F
ree
Pixe
ls (%
)
Chang & Coakley 1993Tian & Curry 1989Derrien 1992
Figure 2-4: Percentage of cloud-free pixels versus spatial resolution.
Because of the requirement for 250 cloud-free data points per month within the area of interest (500x500 km), temporal resolution and spatial resolution are directly linked. With poorer resolution, more measurements will have to be made in order to attain the required number of cloud-free measurements. A higher number of measurements implies a higher temporal resolution. From Figure 2-5 we learn that
30

CASSIOPEE
with a spatial resolution of 10 km, clouds will obscure 90 % of our measurements, and therefore we need 2500 measurements per area per month. Table 2-3 summarises the requirements that will have to drive the design of our satellite system. Gases Measurement Accuracy Horizontal Resolution Temporal Resolution Threshold Target Threshold Target
CO2 CH4 N2O
1.0 % 0.5 % 25 x 25 km 5 x 5 km 250 cloud-free observations per 500x500 km per month
Table 2-3: Requirements for the measurements of gases
31

CASSIOPEE
References [ACD NCA 2001]
Atmospheric Chemistry Division at National Center for Atmospheric Research 4 Aug. 2001. <http://www.acd.ucar.edu/asr98/mop9.htm>.
[AEROCARB 2001]
Airborne European Regional Observations of the Carbon Balance AEROCARB (EU DG research) project web page. 12. Aug. 2001. <http://www.aerocarb.cnrs-gif.fr/project.html>.
[Alcalmo &Kreileman 1996]
Alcalmo, J., and E. Kreileman. “Emission scenarios and global climate protection.” Global Environmental Change Vol. 6, No. 4 (1996): pp. 305-334.
[Barnola et al.1995]
Barnola, J.M., Raynaud, D., Korotkevich, Y.S. & Lorius, C., “Vostok ice core provides 160,000 year record of atmospheric CO2.” Nature, Vol. 329 (1987): pp. 408-414.
[Beardsmore andPearman 1987]
Beardsmore, D.J.; Pearman, G.I.; and O'Brien, R.C. The CSIRO (Australia) Atmospheric Carbon Dioxide Monitoring Program: surface data. 1984.
[Beck et al. 1998] Beck J.P., Krzyzanowski M., and Koffi B. "Tropospheric ozone in the European Union: The Consolidated Report." Presented to the Steering Group on Ambient Air Quality, Brussels, 1998.
[Buchwitz 2000] Buchwitz, M., et al. “A near-infrared optimised DOAS method for the fast global retrieval of atmospheric CH4, CO, CO2, H2O and N2O total column amounts from SCIAMACHY Envisat-1 nadir radiances.” Journal of Geophysical Resources. Vol. 105 (2000): pp. 15231 – 15245.
[Butcher et al.1992].
Butcher, S.S., Charlson, R.J., Orians, G.H., Wolfe, G.V. (eds.). Global Biogeochemical Cycles. London: Academic Press Ltd., 1992.
[CEC 2001] Commission of the European Communities. Key elements of the GMES EC Draft Action Plan Initial Period 2001-2003. Brussels, 27.7.2001.
[CEC COM 31,2001]
Commission of the European Communities. Communication from the Commission to the Council, the European Parliament, the Economic and Social Committee and the Committee of the Regions. "On the Sixth Environment Action Programme of the European Community 'Environment 2010: Our future, Our choice' - The Sixth Environment Action Programme," COM (2001) 31 final 2001/0029 (COD). Brussels, 24.1.2001.
[CEC COM 53,2001]
Commission of the European Communities. Communication from the Commission to the Council and European Parliament. "Ten Years after Rio: Preparing for the World Summit on Sustainable Development in 2002," COM (2001) 53 final. Brussels, 6.2.2001.
[CEC COM 264,2001]
Commission of the European Communities. Communication from the Commission. "A Sustainable Europe for a Better World: A European Union Strategy for Sustainable Development," COM (2001) 264 final. Brussels, 15.5.2001.
32

CASSIOPEE
[CEC COM 88,2000]
Commission of the European Communities. Communication from the Commission to the Council and the European Parliament on EU Policies and Measures to Reduce Greenhouse Gas Emissions. "Towards a European Climate Change Programme (ECCP)," COM (2000) 88 final. Brussels, 8.3.2000.
[CEC COM 597,2000]
Commission of the European Communities. Europe and Space: Opening a New Chapter, COM (2000) 597 final. Brussels, 27.9.2000.
[CEC COM 9842,2000]
Commission of the European Communities. A European Community Biodiversity Strategy, COM (2000) 9842. Brussels, 2000.
[CEC GMES2000]
Commission of the European Communities. GMES: Global Monitoring for Environment and Security. January 2000.
[Chang 1993] Chang, F.L., and J.A. Coakley, Jr. “Estimating Errors in Fractional Cloud Cover Obtained with Infrared Threshold Methods.” Journal of geophysical research - Atmospheres. Vol. 98, No. 5 (1993): pp. 8825-8839.
[Chodak 2001] Chodak, M. "CEE Countries Help Shape EU Environmental Policy." REC Bulletin. Vol. 10, No.1. (2001).
[CORINAIR(1) 2001]
European Topic Centre on Air Emissions web page 11. Sept. 2001. <http://www.aeat.co.uk/netcen/corinair/corinair.html>.
[CORINAIR(2) 2001]
Recommendations for Revised Data System for Air Emission Inventories – Topic Report 12/96 ETC/AE. EEA web page. 5 Sept. 2001. <http://reports.eea.eu.int/92-9167-033-2/en>.
[Csagoly 1998] Csagoly, P. "Its Getting Rather Heated Around Here." The Bulletin: Quarterly Newsletter of the Regional Environmental Center for Central and Eastern Europe. Vol. 8, No. 2 (1998): pp. 12-13.
[Denier van derGon 2000]
Denier van der Gon, H.A.C. et al. "The reliability of Greenhouse Gas emission estimates (with emphasis on CH4 from diffuse sources)." Report to the National Research Programme on Global Air Pollution and Climate Change (NRP-II). The Netherlands: Wageningen University, 2000.
[Derrien 1992] Derrien, M. “Influence of the size of field of view on the contamination by clouds.” Meteo-France Report, Contract No. 9239, 1992.
[Dillon, 2001] Dillon W., Gas (Methane) Hydrates -- A New Frontier. U.S. Geological Survey: Marine and Coastal Geology Program Hole. 2001. Web page. 2 Sept. 2001. <http://marine.usgs.gov/fact-sheets/gas-hydrates/title.html>.
[EC/ESA 2001] European Commission and the European Space Agency. "A European Approach to Global Monitoring for Environment and Security (GMES): Towards Meeting Users’ Needs." Version 2.01, 2001.
33

CASSIOPEE
[EDGAR 2001] Olivier et al. Description of EDGAR Version 2.0. RIVM Report nr. 771060 002 / TNO – MEP Report nr. R96/119 JGJ, 1996. <http://www.rivm.nl/env/int/coredata/edgar/index.html>.
[EEA 1998] European Environment Agency. Europe’s Environment: Second Assessment. European Environment Agency. Copenhagen: Office for Official Publications of the European Communities & Elsevier Science Ltd., 1998.
[EEA Home Page2001]
European Environment Agency. “EEA home page”. September 4, 2001. <http://org.eea.eu.int>.
[EEA Signals2001]
European Environment Agency. “Environmental Signals 2001: Environmental assessment report No 8.” Luxembourg: Office for Official Publications of the European Communities, 2000.
[EEA Info 1999] European Environment Agency. “Information for improving Europe's environment.” Copenhagen: EEA Information Centre, 1999.
[EEA TECH12] European Environment Agency, February 1999. Technical report. 5 Sept. 2001. <http://binary.eea.eu.int:80/t/tech12.pdf >.
[EEA TOC 1999] European Environment Agency. “Environment in the European Union at the turn of the century: Environmental assessment report No. 2.” Luxembourg: Office for Official Publications of the European Communities, 1999.
[EEA/UNEP 1999]
EEA/UNEP. Environmental assessment series No 5, State and pressures of the marine and coastal Mediterranean environment. Copenhagen: EEA Information Centre, 1999.
[EEA/UNEP 2000]
EEA/UNEP. Down to earth: soil degradation and sustainable development in Europe. Environmental Issues No 16. Copenhagen: EEA Information Centre, 2000.
[EEA-ETC 1999] European Environment Agency-European Topic Centre on Air Emissions. “Annex 1 - Greenhouse gas inventory methodology.” Overview of National Programmes to Reduce Greenhouse Gases. 1999.
[Ehret 2001] Ehret, G. et al. “SCIAMACHY validation from the DLR FALCON”. Pre-launch Workshop on the Atmospheric Chemistry Validation of Envisat, ESTEC, Noordwijk, The Netherlands 16-18 May 2001.
[Environment Canada 2001]
Environment Canada. Human Activities and Climate Change web page. 9 Sept. 2001. <http://www.ec.gc.ca/cc/cop5/sia/english/03earth/03d.htm>.
[Environment Daily 2001]
"Kyoto climate protocol comes back to life." Environment Daily. No. 1036, 2001.
[ENVISAT 2001] ENVISAT home page. 23 Aug. 2001. <http://envisat.esa.int/>. [EORCU 2001] European Ozone Research Coordinating Unit. 19 Aug 2001.
<http://www.ozonesec.ch.cam.ac.uk/clusters/Gato_Website/GATO_euproj.htm>.
[EOS Aura 2001] EOS Aura Project Home Page. 3 Aug. 2001. <http://aura.gsfc.nasa.gov/mls/>.
34

CASSIOPEE
[EOS TERRA2001]
EOS TERRA project web page. 5 Aug. 2001. <http://terra.nasa.gov/Brochure/Sect_4-6.html>.
[EPA 2001] Nitrous Oxide Emissions. US Environmental Protection Agency. Nitrous Oxide Emissions. Web page. 1 Sept. 2001. <http://www.epa.gov/globalwarming/emissions/national/n2o.html>.
[ESE 2001] Earth Science Enterprise, NASA Ames Research Centre. 28, Aug. 2001. <http://atrs.arc.nasa.gov/r_t/1997/mission/mission3.html>.
[Etheridge et al.1996]
Etheridge, D.M., L.P. Steele, R.L. Langenfelds, R.J. Francey, J.-M. Barnola, and V.I. Morgan. Natural and anthropogenic changes in atmospheric CO2 over the last 1000 years from air in Antarctic ice and firn. Journal of Geophysical Research 101 (1996): 4115-4128.
[EUROFLUX (1) 2001]
European Commission DG XII Environment and climate programme, EUROFLUX Project web page.<http://www.unitus.it/dipartimenti/disafri/progetti/eflux/euro.html>.
[EUROFLUX (2) 2001]
Mesoscale and Microscale Meteorology Center for Athmospheric Research web page. 15, Aug. 2001.<http://www.mmm.ucar.edu/community/beechforest.html>.
[Fekete 2000] Fekete, A. Earth’s Observation for Environmental Protection. Europe Environment series supplement. Europe Information Service, 2000.
[GLOBALVIEW-CO2, 2001]
GLOBALVIEW-CO2, 2001, Cooperative Atmospheric Data Integration Project. August 31, 2001. <http://www.cmdl.noaa.gov/ccg/globalview/co2/index.html>.
[Hanley 1998] Hanley, A., The Independent, 7 May 1998 and 8 May 1998. [Heimann &Kaminski 1999]
Heimann, M. and T. Kaminski. “Inverse modelling approaches to infer surface trace gas fluxes from observed atmospheric mixing ratios.” In: A. F. Bowman (Editor). Approaches to scaling of trace gas fluxes in ecosystems. Amsterdam: Elsevier, 1999.
[Houghton 1997] Houghton, John. Global Warming: The Complete Briefing, Second Edition. Cambridge: University Press, 1997.
[Hutchinson 2000]
The Hutchinson Family Encyclopedia. "Greenhouse Effect". 9 Sept 2001. <http://ebooks.whsmithonline.co.uk/encyclopedia/64/P0001164.htm>.
[IPCC 1994] IPCC. “Radiative Forcing of Climate Change. The 1994 Report of the Scientific Assessment Working Group of IPCC, Summary for Policymakers.” Geneva: WMO/UNEP, 1994.
[IPCC 1996] IPCC. "Climate change 1995. The science of climate change" (eds.: J.T. Houghton, L.G. Meira Filho, B.A. Callander, N. Harris, A. Kattenberg and K. Maskell). University Press, Cambridge 1996.
35

CASSIOPEE
[IPCC 1997] IPCC. "Revised 1996 Guidelines for National Greenhouse Gas Emission Inventories,". Vols.1-3 1997. Houghton, J.T.; Meira Filho, L.G.; Lim, B; Treanton, K.; Mamaty, I.; Bonduri, Y.; Griggs, D.G. and B.A. Callender (Eds). IPCC/OECD/IEA UK Metereological Office Bracknell. <http://www.ipcc-nggip.iges.or.jp/public/gl/inush.htm>
[IPCC 2000] Inter-Governmental Panel on Climate Change, 2000. IPCC Special Emissions Scenarios - Summary for Policymakers.
[IPCC 2001a] Inter-Governmental Panel on Climate Change, 2001. Third Assessment Report: Summary for Policymakers, Shanghai Draft of 21-01-2001 20:00.
[IPCC 2001b] Inter-Governmental Panel on Climate Change - National Greenhouse Gas Inventories Programme, Sept., 2001. < http://www.ipcc-nggip.iges.or.jp/>.
[IPCC NGGIP2001]
IPCC National Greenhouse Gas Inventories Programme web page. 5 Aug. 2001. Revised 1996 IPCC Guidelines for National Greenhouse Gas Inventories Reporting Instructions (Volume 1). <http://www.ipcc-nggip.iges.or.jp/public/gl/guidelin/annex1ri.pdf>.
[Jacka 1995] Jacka, T.H. Antarctic Ice Cores and Environmental Change, 1995. <http://www.antdiv.gov.au/aad/sci/glacio/issues_glacio/issues_glacio.html>.
[Jimenez-Beltran 1995]
Jimenez-Beltran, Domingo. “Development of Environmental Indicators and Contribution to Green Accounting.” Speech on 3 October 1995.
[JPL Chemistry2001]
Friedl, Randall R. JPL Atmospheric Chemistry Highlights web page. 1 Sept. 2001 <http://remus.jpl.nasa.gov/highlights.htm>.
[Kaminski et al1999]
Kaminski, T., M. Heimann and R. Giering. “A coarse grid three-dimensional global inverse model of the atmospheric transport - 1. Adjoint model and jacobian matrix.” Journal of Geophysical Research-Atmospheres Vol. 104, No. D15 (1999): pp. 18535-18553.
[Keeling andWhorf 1994]
Keeling, C.D. and Whorf, T.P., 1994: Atmospheric CO2 records from sites in the SIO air sampling network. In Trends '93: A Compendium of Data on Global Change. ORNL/CDIAC-65. (eds.: T.A. Boden, D.P. Kaiser, R.J. Sepanski and F.W. Stoss). CDIAC, Oak Ridge National Laboratory, Oak Ridge, Tennessee, U.S.A., 16-26.
[Keeling et al.1989]
Keeling, C.D., Bacastow, R.B., Carter, A.F., Piper, S.C., Whorf, T.P., Heimann, M., Mook, W.G. and Roelffzon, H., 1989: A three-dimensional model of atmospheric CO2 transport based on observed winds; 1, Analysis of observational data. In Aspects of climate variability in the Pacific and Western Americas. Geophys. Monogr. Ser. 55. (ed.: D.H. Peterson). Washington, D.C., pp. 165-236.
[Lebedev 2001] Lebedev Physics Institute Laboratory of Space IR-spectrometry web page. 3 Aug. 2001. <http://www.lebedev.ru/pages/od/istok.html#MIRS>.
36

CASSIOPEE
[Lelieveld et al1989]
Lelieveld, J., P.J. Crutzen, and H. Rodhe. “Zonal average cloud characteristics for global atmospheric chemistry modelling.” Report CM-76/GLOMAC 1. Sweden: Department of Meteorology, University of Stockholm, 1989.
[Levin et al.1995]
Levin, I., Graul, R. and Trivett, N.B.A. “Long-term observations of atmospheric CO2 and carbon isotopes at continental sites in Germany.” Tellus 47B (1995). pp 23-34.
[Mackenzie 1995] Mackenzie, Fred T. & Judith A. Our Changing Planet. Englewood Cliffs, NJ: Prentice- Hall Inc., 1995.
[MAGNETT 2001]
Climate Monitoring and Diagnostics Laboratory web page. 12 Aug. 2001. <http://www.cmdl.noaa.gov/hats/miscprojects/magnett1.html>.
[MPIB 2001] Max-Plank Institut für Biogeochemie, Jena. 17. Aug. 2001. <http://www.bgc-jena.mpg.de/public/carboeur/cluster/index_c.html>.
[NILU 2001] Norwegian Institute for Air Research (NILU) web page. 25. Aug. 2001. <http://www.nilu.no/niluweb/services/soge/>.
[Nitrous 2001] Nitrous Oxide web page. 1 Sept. 2001. <http://www.ch.ic.ac.uk/mim/environmental/html/n2o_text.htm>.
[NOAA CDML2001]
NOAA CMDL. GLOBALVIEW-CO2: Cooperative Atmospheric Data Integration Project – Carbon Dioxide. CD-ROM. Boulder, Colorado, 2001.
[Olivier 1999] Olivier, J.G.J, et al. "Sectoral emission inventories of greenhouse gases for 1990 on a per country basis as well as on 1x1 degree." Environmental Science & Policy. Vol. 2 (1999): pp. 241-264.
[Pers. communication with A. van Amstel, Sept 2001]
Amstel, André van. Personal communication. 6 Sept. 2001.
[Pers. communication with D. Stanners,EEA, Aug 2001]
Stanners, David. Programme Manager, Integrated Assessment and Reporting. European Environment Agency, Copenhagen. Telephone Interview 16 August 2001.
[Pers. communication with H. Bovensmann, Aug 2001]
Bovensmann, Heinrich. Personal communication. August, 2001.
[Pers. communication with M. Heimann, Sept 2001]
Heimann, Martin. Personal communication. September 2001.
[Pickering &Owen 1994]
Pickering K.T. and Owen L.A. An Introduction to Global Environmental Issues. London: Routledge. 1994.
37

CASSIOPEE
[Rayner 2001] Rayner, P.J. and D.M. O’Brien. “The utility of remotely sensed CO2 concentration data in surface source inversions.” Geophysical Research Letters. Vol. 28, No. 1 (2001): pp. 175-178.
[Ritter & Bernd2001]
Ritter, Manfred and Gugele, Bernd. “Technical Report No. 60: Annual European Community Greenhouse Gas Inventory 1990-1999.” Luxembourg: Office for Official Publications of the European Communities, 2001.
[SA 2001] Service de Aéronomie web page. 22 Aug. 2001. <http://www.aero.jussieu.fr/~sparc/News14/14_McKenzie.html>.
[Schimel et al.1995].
Schimel, D., et al. "CO2 and the carbon cycle." Climate Change 1994: Radiative Forcing of Climate Change, and An Evaluation of the IPCC IS92 Emission Scenarios, Intergovernmental Panel on Climate Change (IPCC) Houghton, J.T., et al. (eds.) Cambridge: Cambridge University Press, 1995.
[SCIAMACHY 2001]
Earth Oriented Science Division (EOS) web page. 12 Aug. 2001. <http://www.sron.nl/divisions/eos/scia_tech.html>.
[Slanina et al. 1998]
Slanina, J. et al. Biogenic and anthropogenic volatile organic compounds in the atmosphere. Amsterdam: SPB Academic Publishing, 1998.
[STREAM 2001] Johann Wolgang Goethe-Universität web page. 2 Aug. 2001. <http://www.rz.uni-frankfurt.de/IMGF/meteor/proj_eng.htm>.
[Thoning et al.1994]
Thoning, K.W., P.P. Tans, and W. D. Komhyr. “Atmospheric carbon dioxide at Mauna Loa observatory, 2. Analysis of the NOAA GMCC data, 1974-1985.” J. Geophys. Res., 94 (1989). pp 8549-8565.
[Tian 1989] Tian, L., and J.A. Curry. “Cloud overlap statistics.” Journal of geophysical research – Atmospheres. Vol. 94, No. 7 (1989) pp. 9925-9935.
[UARS MLS2001]
Microwave Limb Sounder (MLS) web page. 16 Aug. 2001. <http://mls.jpl.nasa.gov/joe/um_inst.html>.
[UNFCC 2000] UNFCC Conference of the Parties. Fifth session, Bonn, 25 October - 5 November 1999. FCCC/CP/1999/7. Review of the Implementation of Commitments and of other Provisions of the Convention UNFCCC guidelines on reporting and review, 2000.
[US EPA 2001] US EPA, Climate Change, Methane and other Greenhouse Gases Website. 2 Sept. 2001. <http://www.epa.gov/ghginfo/qa/index.htm>.
[Van Amstel et al1997]
Van Amstel, A.R., C. Kroeze, L.H.J.M. Janssen, J.G.J. Olivier, and J.T. van der Wal. “Greenhouse Gas Emission Accounting.” WIMEK/RIVM report 728001-002, 1997.
[Van Lynden1994]
Van Lynden, G.W.J. The European Soil Resource: Current Status of Soil Degradation causes, impacts and need for action. Strasbourg: Council of Europe, 1994.
38

CASSIOPEE
[Watson et al.1990]
Watson, R.T., Rodhe, H., Oeschger, H. & Siegenthaler, U. Greenhouse gases and aerosols. In: Climate Change: The IPCC Scientific Assessment, Intergovernmental Panel on Climate Change (IPCC), Houghton, J.T., Jenkins, G.J. & Ephraums, J.J. (eds.). Cambridge University Press, Cambridge, pp. 1-40. 1990.
[Watson et al.1992]
Watson. R.T., Meira Filho, L.G., Sanhueza, E. & Janetos, A. Greenhouse gases: Sources and sinks. In: Climate Change 1992: The supplementary report to the IPCC Scientific Assessment, Intergovernmental Panel on Climate Change (IPCC), Houghton, J.T., Callander, B.A. & Varney, S.K. (eds.). Cambridge University Press, Cambridge, pp. 25-46. 1992.
[Weathervane 2001]
Weathervane. A digital forum on global climate policy - News and Notes. Can Satellite Sensors Track Greenhouse Gas Emissions? Sept 2001. <http://www.weathervane.rff.org/>.
[WHO 2000] WMO WDCGG Data Summary, Volume IV-Greenhouse Gases and Other Atmospheric Gases, No. 22, March 2000.
[Zimmermann 1988]
Zimmermann, P.H. “MOGUNTIA: a handy global tracer model, in Air Pollution Modeling and its Applications VI". Edited by H. van Dop, NATO/CCMS, New York: Plenum, 1988: 593-608.
39

CASSIOPEE
3. Policy and law
3.1 Policy
3.1.1 EC/ESA common space strategy Satellite applications and services for travel and transport, environmental monitoring, land-use, search and rescue, and verification of international treaties provide new motives for investing in space activities. European policies support such investments.
3.1.1.1 The common European strategy On 17 November 2000, for the very first time, the Councils of ESA and the EU met to adopt resolutions that will constitute a common framework within which all European players involved in space activities will develop their respective plans of action [ESA 1998-2000]. “Through these resolutions, the European space policy takes a first step into a new phase in which space systems become an integral part of the overall political and economic efforts of European states – whether members of ESA or the EU – to promote the interests of European citizens” said Mr. Rodota, Director general of ESA. The European Strategy for Space identifies three lines of action:
1. Strengthening the foundations for space activities 2. Enhancing scientific knowledge 3. Reaping the benefits for society and markets.
The first line encompasses broadening the use of space technology and guaranteeing access to space through a family of launch vehicles. The second sees Europe continuing to pursue cutting-edge themes of space science and space contributions to the understanding of our planet’s climate. The third line of action has the objectives of seizing market opportunities and meeting the new demands of European society. The European Space Strategy also covers industrial aspects and pays specific attention to encouraging small and medium-size enterprises (SMEs). In the document, public/private partnerships are seen as a model for committing the public sector along with the complete industrial chain to an operational project. The two resolutions adopted endorse the setting up of a cooperative structure that will bring together the ESA Executive and the European Commission. An interim high-level joint Task Force is being set up to make proposals for the continuing development of the European Space Strategy and its implementation [University of Portsmouth Institute of high European Studies-Den Haag, 2001]. In addition to being a partner in the setting up of joint programmes responding to political initiatives of the European Union, ESA will act as the implementing organization for the development and the procurement of the space and ground segments associated with such initiatives.
40

CASSIOPEE
3.1.1.2 The necessary instruments The necessary instruments for economic development, communications, transport and energy infrastructure, environment protection, and peacekeeping have been analysed and guidelines have been discussed at the European level. Global information and communications constitute the nervous system of the knowledge society. Satellites, with their ability to cover and to connect virtually every point around the world, are critical to the effective functioning of this network.
• Communications satellite systems provide economical alternatives to terrestrial infrastructure for various services throughout the world and offer solutions for areas without adequate terrestrial infrastructure. Whereas borders may stop terrestrial communications links, satellite systems provide the means to transfer information across frontiers. They can therefore deliver pan-European or even global information services, thus providing the possibility to co-operate effectively for the development of societies within and outside Europe.
• Navigation and positioning satellite systems form an innovative and seamless global infrastructure for travel and transport, associated services and a multitude of other applications. They also provide highly accurate and reliable time signals, which will become a global reference to synchronize networks for telecommunications, energy, transport, financial transactions etc.
• Observation satellite systems deliver a continuous flow of near-real-time data about any part of the globe, in compliance with international law. This is of vital importance for meteorology and global change studies, treaty verification, identifying environmental problems at regional and global levels, agricultural monitoring, for early warning of crises and for arms control. Here satellites are a unique source of information and can play a pivotal role in EU decision-making for the planning and monitoring of the Petersberg Tasks (conflict prevention and crisis management) [European Commission 1988-2000 COM (2000) 597 final].
Furthermore, space adds a new dimension to many fields of science and technology, contributing to a better understanding of the world in which we live. Science in space has become an integral part of scientific progress in modern society.
3.1.1.3 CASSIOPEE and the common European Space Strategy We are convinced that the project CASSIOPEE can contribute to this global strategy. Its mission takes into account European environmental priorities. Contacts have been established with the European Space Agency and the European Commission in order to assure the coherence of our approach, especially concerning the identification of environmental problems at regional and global levels. Different partners can benefit from the implementation of the project. It will nevertheless be left to the European Union, to ESA and to the Industry to analyse the details of our findings. In Chapter7 we offer recommendations on how to begin this process. The European Space Strategy suggests the need to examine the following elements:
• Independent and affordable access to space
41

CASSIOPEE
• A broad research and technology base with the industrial capability for designing, manufacturing, and operating satellites systems
• An adequate ground infrastructure • A regulatory framework for a harmonious development of the information
society, including aspects of frequency management and orbital slots • Organized market access when possible
3.1.1.4 Environmental aspects regarding the European Space Strategy
Investing in space has two major objectives, namely to fulfill governmental and political needs such as defence, science or public services; and to develop the infrastructures of a modern society, in turn stimulating new markets and services. CASSIOPEE addresses environmental aspects. The project team has defined, analysed and selected environmental needs as the basis for a plan. The data have to meet political needs at international, regional and local levels. Processed data will enhance the decision-making process in Europe concerning environmental matters. The mission is confined to atmospheric, environmental and scientific objectives and does not address security issues.
3.1.2 Global Monitoring for Environment and Security The Global Monitoring for Environment and Security (GMES) initiative provides the common link between Europe’s political requirements on the one hand, and the advanced technical and operational capabilities provided by observation satellites on the other. The definition of European environmental and security information requirements within the broad scope of GMES should provide sufficient political momentum to streamline various– ESA, national, bi-lateral – satellite initiatives and projects in Europe. At the same time the policy states that it is necessary to: identify information gaps, mobilize resources for new initiatives related to the exploitation of space-based information, and establish and co-ordinate an overall coherent plan of action. Preparatory activities within GMES have brought together representatives of the Commission, ESA, national space agencies, EUMETSAT and industry with the aim to establish a rationale for acquiring independent access to space-based information. This implies co-operation between all European actors, addressing:
• Political aspects driven by environment, security and research policies (European environmental policies and those elements of GMES targeting environment are further elaborated in Sec 2.2), but also including input from EU policies for enlargement, external relations, humanitarian aid (e.g. Petersberg Tasks) and development of Third-World,
• Technical aspects – which will involve seeking a common orientation on issues related to the identification of information products on the environment, collection of space-based data, information processing and distribution, and ensuring the appropriate satellite infrastructure.
42

CASSIOPEE
3.1.3 European research and technology policy The European Institutions are involved in the development of industry. The Commission on February 2001 has proposed multi-annual framework programs 2002-2006 of the European Community for Research, Technical Development and Demonstration Activities [European Commission COM (2001) 94 final]. Of course, all the research and developments of interest are mentioned in the framework (e.g. biotechnology), but some are of particular interest for CASSIOPEE:
• Integrating research into technical areas of priority interest for citizens and business. Research is based on progress expected in the development of basic technologies. Access to the information society but also developing effective solutions to complex problems, in particular for environment and environmental monitoring are mentioned.
• Applications of nano-technologies in areas such as chemistry, optics and the environment, aeronautics and space
• GMES platforms for monitoring for environment and security • Advanced research needed to integrate the space segment and the Earth
segment in the field of communication. Sustainable development and global change, matters of priority
• Impacts and mechanism of greenhouse gas emissions on climate and carbon sinks
• Global climate change observation system These policies included in the legal framework support the CASSIOPEE project, and can be useful for other policies in Europe, just as every computing system on a network can be useful to gather data coming from diverse sources.
3.2 Institutional model Deciding about an institutional model depends on many factors related to the present policies developed by the EU and by ESA. The final model will consider the potential actors for the realization of the project. The estimates concerning the cost of the project, the duration of the mission, the specifications of the spacecraft will be influential elements in deciding about an organizational/institutional scheme. The decision in that respect will be made by ESA, eventually in co-operation with the initiator of the project. The initiator will be informed about the recommendation of ESA with regard to the existing possibilities. Several options can be considered:
• ESA as major coordinator of the project • ESA in co-operation with private prime contractor • ESA in co-operation with University and/or Research Institutes • ESA and existing Programs concerning development of small satellites.
43

CASSIOPEE
Other customers
EU / ESA
University
Company Ground stations / GS network
Customer(s) / Operating center
Member states Agencies Other
Figure 3-1: Road map scenario – Institutional Model
Other choices not considering ESA/EU can only be the result of business opportunities concerning the measurements provided by the satellites.
3.2.1 Trends in favor of privatization The Industrial policy of the European Union or/and ESA will definitively influence the way the project will be organized institutionally. There are policy trends in favour of privatisation, of sharing risks at least at the operational level. It is indeed recognized that the private companies are better organized to deal with competitive markets. The emergence of new markets in the new technology sectors is a reality that should be taken into account. A project requiring research and development activities should take place within the framework of a Space Agency which would be able to assume fully its role of procurement agency, acquiring the best proposal for the realization of the project The Enterprise Directorate-General of the European Commission is developing a policy whose goal for the European Union is the creation of a world’s most competitive and dynamic knowledge driven economy. They are encouraging a regulatory and business environment in which innovation and entrepreneurship can flourish. They also intend to improve access to markets for both goods and services and to promote a better understanding and use of services [European Commission SEC (1999) 1481].
44

CASSIOPEE
3.2.2 Trends in favor of micro technologies The European Research policies try to meet all the new challenges focused on micro-technologies from the globalisation of the economy. The space sector also is considered and mentioned regularly.
3.2.3 Looking for spin-offs Spin off can be considered in three ways:
• Creation of companies • Added value data, for example for science • Science
3.2.3.1 Creation of company Industrial policies are used to stimulate economic growth via public support for research, development, and technology transfer. The Leader of a non-profit organization sponsored exclusively by public funds can decide to accelerate the transfer of science and technology into commercial opportunities by capitalizing and spinning off new companies.
3.2.3.2 Added value data The public good is better served by encouraging the private sector to provide value added products. Governments /States have neither resources nor the structure to compete in this area. The governments should be the main customers, supplying the data on a non-exclusive, non-discriminatory basis. Then, to a certain extent, value added data can be provided from initial data (in combination with other data), letting the economic market determine how and what about the pricing policies. (Reference: see Chapter 5) For example, it would be possible to combine existing data with CASSIOPEE measurements in order to generate more accurate outputs enabling the visualization of the location and the origin of C02. Also such data can be used to improve scientific models of the atmosphere.
3.2.3.3 Science CASSIOPEE data can be added to other, e.g., ENVISAT, data to aid in scientific study and modelling of atmospheric phenomena.
3.2.4 Educational reasons The University can rely on graduate students, working on authorized degree programs, to develop improvements to the model based on feedback from its consulting clients. The professor has access to databases not necessarily publicly available. This could enhance the value of the consulting services to his customers. That means that additional research could be conducted at any phase of the project.
45

CASSIOPEE
3.3 Earth observations
3.3.1 Earth observation programs at ESA The European Space Agency (ESA) Applications Directorate is responsible for three areas of work: Navigation, Telecommunications, and Earth Observation (EO). These three elements work in harmony with each other to achieve the Directorate’s main mission, which is to improve the daily life by employing satellite technology and observing our planet from space [ESA AD]. The centres that operate ESA Earth Observation activities are as follows:
• ESTEC in Noordwijk, the Netherlands: development of all major projects, project management, operation of future programs including Earth Sciences.
• ESRIN in Frascati, Italy: mission management and exploitation of data coming from onboard instruments, data processing and distribution.
• ESOC in Darmstadt, Germany: satellite operations, satellite command and control.
Earth Explorer and Earth Watch are the two main categories of missions that were approved at the ESA Council Meeting at Ministerial Level in Toulouse, France on 18-20 October 1995. This is the dual mission strategy based on ESA's post-2000 Earth Observation activities. The Earth Explorers are research/demonstration missions designed to advance our understanding of planet Earth, while the Earth Watch missions will serve specific Earth Observation applications [ESA EO].
3.3.2 World wide trends Recent worldwide trends in Earth Observation market and policies are summarized at the memorandum submitted by the British Association of Remote Sensing Companies at the Trade and Industry Committee meeting in the UK House of Commons on March 14th, 2000 [UK HC 2000]: Changes in the political, economic and technological framework in Europe and elsewhere, particularly the USA, are leading to important changes in the EO market. The world market for geo-spatial information is increasing steadily, although still modest in absolute terms. Recent studies by the EC estimate today's downstream market for EO data and services in Europe at € 200M per year. Projections over the next 10-15 years indicate an overall annual growth in the geo-spatial information market of 15-20%, the total market doubling within six years. Projections assume the continued availability of reliable and timely satellite data, and the availability of efficient and easy-to-use Geographic Information Systems (GIS) to combine data and mathematical models; and related Information Technologies (IT) and communications infrastructure. There is a convergence between civil and military EO missions ("dual use"). This is due to both financial considerations and through declassification of military technology, particularly in the USA. As users become better able to articulate needs, so there is a trend towards more focused EO missions, dedicated to specific applications. For example, the new ESA
46

CASSIOPEE
Earth Explorer missions are clearly targeted towards meeting specific scientific objectives and in a number of commercial developments aimed at providing well-focused operational services. Public funding for technology development is on the decline. ESA and other agencies are looking at new financing arrangements for missions. In particular co-financing with industry and Private Public Partnership (PPP) schemes are being considered as a way towards achieving long-term sustainability in commercial and operational markets. EO is seen increasingly as a tool for the development, implementation and monitoring of environmental policy. Both national and international policies are affected by and react to issues of the environment. Ability to monitor the state of the environment efficiently at all scales and to provide indicators of change is becoming increasingly important. In Europe the EC is taking a lead in defining the potential role for EO through initiatives such as Global Monitoring for Environment and Security (GMES).
3.3.3 Use of small satellites The use of smaller satellites and their use in operational environmental monitoring systems are discussed at the International Academy of Astronautics (IAA) symposium on small satellites for Earth Observation (OE) in Berlin, Germany on November 6th, 1996. Several key speakers contribute to this event representing ESA, NASA, NASDA, DLR, and EUMETSAT. The major conclusions are listed below [IAA 1996]:
• Operational agencies should be wary of adopting technology for technology's sake. Just a decade ago, a popular idea was to increase the size and complexity of platforms. NASA even advocated human serviceable platforms for long-term measurements. It is known that such system architecture is far too expensive.
• The real focus of small satellite technology should not be merely on the satellites, but also on the design and demonstration of subsystems and instruments for Remote Sensing (RS). Primarily the instruments and data handling subsystems determine the size and complexity of the satellite bus.
• Operational agencies are being forced to consider new designs and approaches, because of the following: decreased funding from their governments, a growing and diversifying user community, rapidly rising medium-class launch vehicle costs, and the increasing role of the commercial sector (which is pushing small satellite initiatives). Within the next 15-20 years, operational agencies will seek to utilize proven small satellite technologies to augment their planned programs.
• The operational requirements (rigorous quality control, long-term data continuity, and reliability of environmental measurements) of NOAA and EUMETSAT result in a conservative approach to the development of new capabilities and technologies. It would not necessarily be cost-effective for small satellites to replace or augment existing operational satellite systems, such as the METOP, NOAA, and GOES series. Existing series benefit from the economies of scale inherent in the use of multiple instruments on a single platform.
47

CASSIOPEE
• Before the operational agencies begin to utilize the improvements in technologies that accumulate from the small satellite initiatives, the research community must first demonstrate that these technologies can accomplish some of the following for operational programs: decrease launch costs; allow more instruments to fly on the same satellite bus; adequately provide single-instrument backup for the failure of a critical on-orbit instrument; and, offer new measurements of operational value, while adequately processing and transmitting large volumes of environmental data.
• The operational agencies should seek to have the research agencies (such as NASA, ESA, and NASDA) effectively demonstrate small satellite technologies. The technical solutions must at least match the current measurement quality and offer the reliability necessary to provide long-term data continuity. They must also be cost-effective and their pre-operational demonstration should be relatively transparent to the operational user community.
• Follow-on systems (such as the U.S. NPOESS Program and European METOP-3) should investigate new small satellite technologies, which could augment their operation through additional measurements or added redundancy. Nevertheless, the phasing in of new instrument, subsystem, and platform technologies and platforms would be a tremendous programmatic and financial challenge.
• Small satellites may also be valuable in providing single, prototype operational missions for measurements such as ocean colour, ocean surface winds, ocean height, radio occultation sounding, and ozone. In this manner, they could demonstrate incremental enhancements to operational observing systems, broadening them from meteorology to include fields such as oceanography, atmospheric chemistry, and even climatology. These applications would not replace the main operational missions.
• Small satellites may provide a vehicle for other countries (i.e., Brazil, Turkey, China, Argentina) to play a role in an expanded operational global observing system. Due to the flat or declining budgets of the developed world's space agencies, this is a particularly important factor.
• Small satellites may also allow private companies to demonstrate new Earth observation capabilities of interest to governments, which in turn could apply these technologies to operational programs. This could result in an increase in the number of potential contractors for operational space systems.
3.3.4 Industrial policy of ESA ESA Earth Observation (EO) Market Development program, which is an element of the EO Envelope Program (EOEP), has been initiated in 2000. The main objective of this program is to foster the emergence of a European Downstream Industry offering EO-based services, with the prospect of becoming sustainable, to public and private customers on global market. The broad scope of the priorities of this program can be summarized as [Bally 2001]:
• Integrating new EO products and services into existing operational geo-information services,
• Strengthening market position by exploiting existing investments, • Supporting partnership between data distributors and value-adders,
48

CASSIOPEE
• Taking joint actions with non-EO industries such as Geographic Information Systems (GIS) and Image Processing, to better integrate European EO data into standard commercial tools,
• Preparing transition from ERS to ENVISAT-based commercial services, • Improving service by exploiting multiple EO sources such as SAR and optical, • Testing market for future European EO missions with prototype products and
existing data sources. After the announcement of this program, a high level of industrial interest in EO market development has been observed. Some of the companies with short-term activities in this program include Astrium, Aerospatiale Matra, and Atlantis Scientific Inc.
3.4 Legal aspects: from concept to operational status of the satellites
This section provides an overview of the different legal obligations and considerations in the case of participation of a University for the development of satellites and the creation of a spin off company for the operating phase. This proposed model is optional and highlights legal aspects. In case of participation of the European Space Agency the obligations will be handled by the procurement agency.
Institutions Obligations and Legal Considerations University (Owner) vs. other Launching (contract Company, license State)
ITU Registration via local Authority (Art4 UN Remote Sensing Convention) Designing spacecraft to conform with best debris practices
Operating company (Provider) License for conducting business Developing copyright (protection) and providing license for use of software to the customer(s) Patents in case of development
Customers (EUMETSAT vs. other) Specific or standard contracts Ground Station vs. Ground Stations network
Radio Frequency Transmission License for each Country/ Data access agreement in case of a GS network (Between States and Ground Stations)
Table 3-1: Proposed model highlighting legal aspects
The analysis of the laws for space enables us gain insight into the applicable law and to identify the contents directly related to the project.
3.4.1 Launching In Europe, several countries are considering new laws concerning commercial space activities [Project 2001 Legal framework for the commercial use of outer space]. Of ESA’s member States, only Sweden and the United Kingdom have enacted legislation governing commercial space activities, including launch services. The State laws
49

CASSIOPEE
already in place cover current commercial activities in Europe. However, these laws may not be sufficient to encompass the requirements of international space law. The following international treaties and agreements govern launch activities:
• Outer Space Treaty (OST) (1967) • Liability Convention (1972) • Registration Convention (1976)
The basic framework for launching is the OST, which specifies that:
• States shall be responsible for national space activities whether carried out by governmental or non-governmental activities (article 6)
• States shall be liable for damage caused by their space objects (article 7) • States shall avoid harmful contamination of space and celestial bodies (article
8) The Liability Convention provides that a launching State shall be absolutely liable to pay compensation for damage caused by its space objects on the surface of the Earth or to aircraft, and liable for damage due to its faults in space. The Convention also provides for procedures for the settlement of claims for damages. The Registration Convention provides that member States conducting space launches should provide the United Nations with information on their launchings and register space objects. Only the launching State or Agency can register space objects under the UN regime.
3.4.1.1 Launch contracts and insurance Launch contracts with launching parties generally specify terms of insurance, liability and the responsibilities of the launch provider. Today spacecraft builders offer turnkey services, providing packages that include not only the spacecraft and its delivery in orbit but also insurance and the launch [Project 2001 Legal framework for the commercial use of outer space]. To reduce the financial risks of launch or mission failure, appropriate insurance contracts should be made. The types of insurance to be purchased will depend on the needs of the owner of the satellite. There are four types of space insurance:
• Pre-launch insurance covers risks associated with transportation of the satellite from the manufacturing facility to the launch site, assembly on the launch pad, inspection, and pre-lift-off activities.
• Launch insurance commences where pre-launch insurance ends and terminates when the satellite separates from the rocket and completes an initial operational phase of functionality testing.
• In-orbit insurance commences when normal operations in space begin and ends when the satellite fuel cell depletes. In-orbit insurance usually consists of a (or few) -year renewable policy.
• Third-party liability (TPLL) space insurance covers legal liability arising from damage to a third party during the launch or the in-orbit operations of a satellite program [CNN Commercial Space Insurance].
50

CASSIOPEE
3.4.2 Access to data – multinational policies
3.4.2.1 Global baseline At the global level the UN in 1986 adopted by consensus a set of 15 Principles Relating to Remote Sensing of the Earth from Outer Space. At the Twelfth Meteorological Congress in 1995 the World Meteorological Organization (WMO) adopted Resolution 40 on the policy and practice for the exchange of meteorological and related data and products, including meteorological satellite data. The UN Principles and WMO Resolution 40 provide a baseline for global Earth observation data policies.
3.4.2.2 United Nations principles The UN Principles are not legally binding but they do have great moral and political weight and a nascent legal validity (a so-called 'soft law' status). Through time the UN Principles may and can become legally binding by historical practice because of international customary law. The UN Principles are wide in their scope, provide for legal control over dissemination of data, and because of their public nature are directed towards governments. Principles IV, XII and XIV are key issues in Earth observation. They cover the freedom of the sovereignty of nations, the conditions of access to Earth observation data by a sensed state, and the control of private Earth observation data companies by their national governments. Special attention is given in the UN Principles to the needs of less developed countries (LDCs). While the general intention is to support LDCs, which do not have access to their own Earth observation satellites, there are several LDCs, notably India and Brazil, which have active and successful Earth observation programmes.
3.4.2.3 The World Meteorological Organisation While WMO Resolution 40 is based on international agreement among WMO member states its actual scope is limited. The Resolution adopts only one prescriptive statement when it says: “Members shall provide on a free and unrestricted basis essential data and products which are necessary for the provision of services in support of the protection of life and property and the well being of all nations, particularly those basic data and products in space ... required to describe and forecast accurately weather and climate, and support WMO programmes.” Non-discriminatory access is a firm principle in the UN Principles and is implicit in the free and unrestricted access stated in WMO Resolution 40. It is also a firm principle of the World Data Centres, and by implication the International Council of Scientific Unions.
3.4.2.4 Access to data within the European Union The European Commission can have a useful role in Earth observation data policy through relevant EC Directives. These directives are developed in a broader
51

CASSIOPEE
framework, but they may be helpful in developing more coherent data policies for Earth observation.
• The freedom of access to information The objective of the European Council Directive on the freedom of access to information on the environment is to ensure freedom of access to information on the environment held by public authorities and to set out the terms and conditions under which the information is provided.
• The legal protection of databases Earth observation data are also subject to the European Council Directive on legal protection of databases. In the absence of other, relevant copyright regimes, the Directive provides protection of databases either by copyright or by a sui generis protection, or both. Copyright provides protection based on the selection or arrangement of the database, and sui generis provides protection based upon the content of the database. Copyright protection under sources other than the Directive will continue to apply where appropriate.
• Harmonization of the legal protection for data A European Council Directive on the harmonization of certain aspects of copyright and related rights in the information society has been issued. The Directive will harmonize legal protection for data and software by adapting copyright and related rights to achieve a common basis for copyright protection across national borders. It will also acknowledge the development of electronic transfer of data by allowing for electronic rights management and protection.
• The coverage of environmental data The Directives at a European level are helpful because they cover a wide variety of environmental data. Earth observation data policy cannot develop in isolation. Most Earth observation data are used in conjunction with other environmental data (for example, land use, topography, population) and so the data policies of these will have an impact on the use of Earth observation data. The coherence of data policies and data sharing between European providers must be increased and a coherent long-term archiving policy, mechanism and practice must be developed.
• Environment data - Public good There is a legitimate role for Earth observation as the means to provide a public good. A public good has two main characteristics: non-rivalry and non-excludability. Non-rivalry means that the consumption of the information by one user does not diminish the capability of another user to use the information. Non-excludability means that another user can exclude no user from using the information.
The public good nature of Earth observation may be particularly important in the responses to natural disasters, and for assessing the progress against environmental targets as defined in the Kyoto and Buenos Aires meetings of the Intergovernmental Panel on Climate Change (broadly the post-Kyoto initiatives). The use of such public good justifications would be based upon a set of information requirements, which are not of themselves space-related, but in which information derived from space platforms will play a vital role.
52

CASSIOPEE
A public good approach will have implications for archiving, dissemination and pricing of Earth observation data. There are benefits in both a public good approach and a mass-market approach to the supply of Earth observation data.
3.4.3 Intellectual property
3.4.3.1 Main issues As analytic software, data and data products are developed, they must be protected against duplication, copies and alteration. A number of treaties and laws exist to protect the intellectual property rights of companies that are applicable between the countries. The World Intellectual Property Organization (WIPO), a Specialized Agency of the United Nations promotes the protection of intellectual property worldwide. The European Union added these treaties with joint declarations concerning WIPO Copyright Treaty [WCT 2000] and Council Directive concerning satellite broadcasting [Directive 1993]. However, remote sensing applications still pose many questions and problems for commercial use. Due to the United Nations’ Principles on Remote Sensing, according to Principle IV, every sensed state can have access to the data at reasonable terms and conditions. This chapter summarizes the main issues for CASSIOPEE and remote sensing application, for which intellectual property can be separated into two groups: industrial development, and data dissemination and sales.
3.4.3.2 Industrial developments The use of off the shelf technologies normally will not lead to patents. However, a patent is potentially applicable to a process for building the satellite, or for the instruments. It is highly desirable if a special process or an invention is developed.
3.4.3.3 Dissemination and sales Principles Relating to Remote Sensing of the Earth from Space from the United Nations [UN 1996] define the basic source of law applicable for remotely sensed data. Even if national laws do not enforce these principles, they are considered today as having the force of law. Data processed by the whole system are considered under the same category as literature and artistic products, and as such can be copyrighted. This right derives from two principles: they have an author, which is the company, the owner of the satellite/system or the operator, and they possess originality, which comes from the choice of angle of view or other factors. The copyright of the products includes the right to sale, and also the right not to distribute the data. However, even if there is a trend toward commercialisation of access to data and information of remote sensing, Principle IV (access to data from sensed states) says that access should be at a reasonable price and terms. On another way, Principle XIV says that “States operating remote sensing satellites shall bear international responsibility for their activities and assure that such activities are conducted in accordance with these principles and the norms of international law, irrespective of whether such activities are carried out by governmental or non-governmental entities or through international organizations to which such States are parties”.
53

CASSIOPEE
In other words, access should not be unduly restricted. It appears that if international laws are used as a basic structure, there is no international agreement upon a framework for data distribution and sale. Different countries and organizations have established a range of data policies. As examples of the current practices of other systems, the IEOS (International Earth Observing System) clarified that all IEOS data will be available to all users on a non-discriminatory basis in a timely manner and there will be no period of exclusive data use. The Committee on Earth Observation Satellites (CEOS) has adopted these principles. EUMETSAT also provides data for free or at reproduction cost to operational and research organizations. In the special case of EUMETSAT, it adopted the concept of a distributed Application Ground Segment, including the Central Facilities in Darmstadt, Germany, and a network of elements known as Satellite Application Facilities (SAFs). It will use inputs from meteorological satellites in both geo-stationary and polar orbit. Until data become available from systems such as the Meteosat Second Generation (MSG) and EUMETSAT Polar System (EPS), information from current satellites will be used for development. Other relevant data will be obtained from the World Meteorological Organization's (WMO) Global Telecommunication System (GTS). SAF products will be distributed by satellite, via the GTS or by other means. The resulting products, intellectual property and technical data, including algorithms and software, will be the property of EUMETSAT and will be available to all Member States [EUMETSAT 2000]. The data distribution and sale policy for the products of CASSIOPEE could be the following:
• Data free or at cost of reproduction for European Environmental Agency use, European public users, and scientists.
• Data at nominal cost for non-European users.
3.4.3.4 Authorization and licenses Some authorization and licenses are necessary to make the business possible. The government will register the satellite with the United Nations. A commercial firm would have to seek a license from the state to operate the satellite and a license to use certain radio frequency bands to transmit data to earth and to control the satellite. The firm would also likely need a local license to operate as a business. Because European laws with respect to commercial use of space may change in the near future, the precise rules for gaining authorization and licenses to operate may also change. However, because the Outer Space Treaty makes each state liable for the actions of its citizens in space, Europe will likely develop laws to cover commercial organizations in outer space.
54

CASSIOPEE
References [ESA 1998-2000]
-Resolution on a European strategy for space,16/11/00, M/CXLVIII/Res.1(final). -Joint ESA/EC document on a European strategy for space, 23/10/00, ESA/C(2000)67,Rev.1. -Resolution on European Strategy in the launcher sector, 20/06/00, ESA/C/CXLVI/Res.2 (final). -Resolution on the shaping the future of Europe in Space, 11/05/99, ESA/C-M/CXLI/Res.1 (final). -Resolution on the Agency’s evolution and programmes, 11/05/99, ESA/C-M/CXLI/Res.2 (final). -Resolution on the Long-term Space Policy Committee, 11/05/99, ESA/C-M/CXLI/Res.3 (final). -Resolution on the reinforcement of the synergy between ESA and EC, 23/06/98, ESA/C/CXXXVI/Res. 1 (Final).
[EC 1988- 2000] -2nd Resolution on the European Strategy for Space, 16/11/00, 2305 EU Council Meeting. -1st Resolution on developing a coherent European Space Strategy, 2/12/99, 2112 EU Council Meeting. -Communication from the commission to the Council and the European Parliament- Europe and Space: Turning to a new chapter Joint ESA/EC document on a European strategy for space, 27/9/00, COM(2000)597 final. -“Towards a Coherent European Approach for Space”, 7/6/99, SEC(1999) 789 Final. -Resolution on the co-operation between the EU and European Space Agency, 22/06/98, 2109 EU Council Meeting. -Resolution on the European Union and Space, 22/09/97, EU Council Meeting.
[European Commission COM(2001) 97 final]
Decision of the European Parliament and of the Council concerning the multi annual framework program 2002-2006. <http://Europa.eu.int/comm/research/pdf/com-2001-94-en.pdf>.
[European Commission SEC(1999) 1481]
European Commission, Enterprise Directorate-General, mission Statement, The Commission adopted a new code of conduct for Commissioner and departments. <http://Europa.eu.int/comm/dgs/enterprise/mission.htm>.
[University of Portsmouth, Institute in High European Studies-Den Haag 2001]
Jean-Luc Verdin, “The European Space Policy, Institutional Aspects”, “Is the transfer of competence in matter of policy and Space co-operation from an intergovernmental level to community the solution for establishing and implementing a common European Space Policy”, Dissertation, University of Portsmouth, 2001.
[UK HC 2000] UK House of Commons, Trade and Industry Committee, “Memorandum submitted by the British Association of Remote Sensing Companies”, 14.March.2000.
[IAA 1996] Ratier, M. Reynolds, C. Elachi, K. Terada, H. Röser, “Smaller Satellites and their Use in Operational Environmental Monitoring Systems”, IAA Symposium on Small Satellites for EO, Berlin, Germany, 6.November.1996.
[Bally 2001] P.Bally, O. Grabak, F.M. Seifert, S. Coulson, “ESA – Industry Briefing”, EO Applications Dept., ESA/ESRIN, 2.March.2001.
[ESA AD] ESA Applications Directorate. <http://www.esa.int/export/esaSA/GGGJGU50NDC_index_2.html>.
[ESA EO] ESA Earth Observation Strategy. <http://esapub.esrin.esa.it/bulletin/bullet85/arend85.htm>.
55

CASSIOPEE
[Project 2001 legal framework for commercial use of Outer Space]
A joint research project, Institute of Air and Space Law of University of Cologne and the German Aerospace Centre (D.L.R.), 1 September 2000. <http://www.uni-koell.de/jur-fak/instluft/proj2001/legalframework.html>.
[CNN Commercial Space Insurance]
<http://www.cnn.com/ALLPOLITICS/resources/1999/cox.report/ insurance/endnotes.html>.
[WCT 2000] WCT, 200A0411 Official Journal L089 11 April 2000, Council Regulation for the WIPO Copyright Treaty.
[Directive 1993] 93/83/EEC from 27 September 1993, Council Directive on the co-ordination of certain rules concerning copyright and rights related to copyright applicable to satellite broadcasting and cable retransmission.
[U.N. Principles]
United Nations, “United Nations Treaties and Principles on Outer Space”, 1996. Additional references <http://www.iasl.mcgill.ca>.
[Eumetsat 2000] Policy for dissemination and sales of the Data. <http://www.eumetsat.de/en/index.htlm>.
[Pamela L. Meredith, George S. Robinson]
“Space Law: A Case Study for the Practitioner”, Kluwer Academic Publishers, 1992.
[R. Bender] “ Launching and Operating Satellites”, Kluwer Law International, 1998.
56

CASSIOPEE
4. Technical implementation
4.1 Technological approach Traditionally, spacecraft have been designed using a discrete component approach. This is performed with many different structural components and a high level of subsystems, resulting in an ‘all in one’ product with high development and launch costs [Jackson et al. 1998]. Such an approach requires a long development time, and thus many of technological solutions become outdated by the launch date. Among the existing macrotechnologies that are widely used for environmental monitoring are Earth observation satellites such as SPOT, Landsat TM, RADARSAT, and the instrument SAR. With respect to observing and monitoring greenhouse gases (GHGs) from space, instruments such as MOPITT, IASI, ILAS-II, MLS and MIPAS are being used to study the factors and processes affecting global climate change (see Section 2.4).
4.1.1 Why use microtechnology for environmental monitoring?
In the early 90’s, the advent of the concept of small-sized/microsatellite design provided an alternative approach to significantly decrease costs and enable commercialisation. This breakthrough utilizes alternate spacecraft design methodologies such as scale reduction, repacking/light weighting, microtechnology, high and/or low-level integration and functional design [Jackson et al. 1998]. The keen interest in microtechnology centres mainly on the structuring of macroscopic materials at the micrometer level. In one ESA publication, a list of the main advantages offered by micro/nano-technologies was presented [De Aragon 1998]:
• The total required resources such as mass, volume, and power are reduced.
• Microsystems are produced in a batch process, which adds mass production benefits such as low unit cost.
• High system reliability allows for redundancy through the use of several
microsystems, thereby lowering the unit cost, risks, and resources required per unit.
• System performance per unit cost and mass is higher, which could be used to
reduce the total cost (commercial systems) or to increase the total performance for a given cost.
• Small test facilities will suffice, thereby reducing costs.
• Several synergies between different sectors allow for the production of
common microsystems, and thus help reduce, for each sector, the high development costs and investments required to reach maturity. Joint
57

CASSIOPEE
developments allow these sectors to reach the critical mass needed to fully profit from batch production advantages.
The abovementioned advantages favour the space sector since each point has strong influence on the cost. This miniaturisation approach will allow for allocation of other monies to monitor other environmental concerns, increase the number of satellites looking at the same environmental concern with improved technology, and eventually develop a powerful decision support system to guide policy makers. Another significant impact is the advancement of space science education enabling the present and future space generations to appreciate, support, and actively pursue space science and technology as a career. This advancement will be realized in the areas of space exploration, life science and microgravity science programmes, and the like, which will utilize microtechnology to advance knowledge in the understanding the solar system, medical research, material science, and fundamental physics and chemistry. The results that will be generated from these programmes are intended to provide in-depth monitoring of the environment from space with emphasis on the sources and sinks of GHGs to stabilize global atmospheric concentrations. Other airborne and ground systems using microtechnology have already been conceptualised and implemented. In the air, for instance, microtechnology offers the possibility to install very small sensors on commercial airliners due to their low mass and power consumption. Ground systems microtechnology, on the other hand, offers the opportunity to build up a network of many inexpensive gas-sensors. Data combined from the ground and air sensors would lead to a closer grid of measurements. This would give the user a more accurate set of data, with dense grids for modelling, as well as identification of local sources. In view of the development process, these microtechnology-driven systems will direct those concerned sectors to manufacture applicable instruments with great precision and low cost.
4.1.2 Current microtechnologies available Extensive research shows that there are many different micro-technologies presently available on the market. However, only a few micro-technologies pertaining to ground, air and space systems for atmospheric applications are currently operational. A number of modern micro-technologies are currently being applied to the design of spacecraft sensors for environmental monitoring. The JPL’s Center for Space Microelectronics Technology (CSMT) offers [Shaw et al 1998] APS (Active Pixel Sensors) operating in the ultraviolet, visible and near infrared (UV/VIS/NIR) silicon response bands. These imagers are produced using metal-oxide-semiconductor (CMOS) device fabrication process. Another example is the CubeSat microsatellite designed by Stanford University [OSSS]. This cube-shaped satellite is only 10 cm on each side, and would offer an ideal platform for microtechnology experiments. More advanced technologies like Sensorweb [JPL] can help in building up a network of measurement stations for both air and ground measurements. Sensorweb mainly consists of small devices that can communicate with each other. Small sensors can be placed inside. Data collected from these sensors are transmitted from one sensorpot to
58

CASSIOPEE
another. Due to this a network for data sampling and distribution is created. However, in order to use this technology, we need to develop sensors that are small enough to fit into the Sensorweb devices. Currently, several companies and institutions are making efforts to design microtechnology sensors, such as Differential Optical Absorption Spectroscopes (DOAS) [SCIAMACHY 1998], Fourier Transform InfraRed spectrometers (FTIR) [SCIAMACHY 1998] and Quantum Well Infrared Photo detectors (QWIP) [Guanapala et al.]. With such small devices, this Sensorweb could be distributed on buildings, cars, and commercial airliners. Data collected from these stations could be joined with information gathered by Micro Weather Station and micro hygrometers [Hoenk et al.] to give a complete set of environmental data. Further monitoring of ground-level pollutants is covered by some initiatives as EUROAIRNET and INTAIRNET. As described in Section 2.4, EuroAirNet, utilizes a network of ground stations to receive information regarding air pollutants. The advantages of this network include [Larssen et al. 1999]: involvement and support of 29 countries, widely distributed stations, and frequent repetition of the measurements (1-24 hours) making it possible to measure air pollutants (i.e. SO2, NOX, NO2, O3, lead, CO, and benzene) with a high level of accuracy. INTAIRNET (Intelligent Air Monitoring Network), on the other hand, is being carried out by the EC using mobile communicating micro-stations with low-cost integrated gas sensors. The goal of this network is to communicate the air quality conditions anywhere in the EU via the Internet in quasi-real time. This network will be complemented by data from fixed air control stations to measure NO2, NO, O3, CO, and CO2. This network is still in the development phase, but should be in operation by December 2002 [IST 2001].
4.1.3 Recommendations for future microtechnology developments
In order to profit from the total scale of advantages, we offer the following recommendations for future microtechnology applications for the environment:
• Increase the number of microsatellite constellations using microtechnology to enhance environmental monitoring through higher revisit times;
• Utilize microsatellites in conjunction with other remote sensing instruments to
increase the accuracy of mapping efforts for incorporation into Geographical Information Systems (GIS);
• Develop an integrated system of sensors observing different environmental
concerns, such as natural and man-made disasters;
• Develop newer GHG models using the CASSIOPEE data. Collaborate with ground and airborne systems for validation, calibration, and investigation of the accuracy of data, instrument, and methodology, respectively. This model will improve understanding of the distribution, concentration, and sources of greenhouse gases.
59

CASSIOPEE
• Use single, versatile microsensors capable of looking at multiple atmospheric components to enable a higher level of observation of gas concentration in different levels of the atmosphere.
• In lieu of existing regulations and high pricing, utilize Memoranda of
Understanding to provide easy and timely access to satellite data through international and regional cooperation.
• Utilize small satellites as an affordable and politically acceptable means of
fulfilling surveying needs for the large and remote territories of developing nations.
• Develop microtechnologies for predicting weather and climate trends.
Effective planning will enable strategic warning to affected regions, therefore enabling preparation and evacuation.
4.2 Mission objectives and performances The CASSIOPEE mission has been put forward to provide the policy makers of the EU a viable option in the monitoring of greenhouse gases in view of the information required for adherence to the Kyoto Protocol. To maximize the effectiveness of the satellite system, microtechnology will be used to provide a fast time to operation with a compact implementation. This space-based system will be augmented with the integration of advanced ground and airborne systems to effectively evaluate, correlate, and verify the sensed data. In addition to providing a system to meet all mission objectives, the new technology utilised will also prove to comprise a feasible and reliable option for the sensing of both the European and World environments. As described in section 2.4, the objective of CASSIOPEE is to provide:
• Measurement of concentration of CO2, CH4 and N2O to an accuracy of 1% single measurement precision;
• Net accuracy of 0.03% over a 1 month period, and; • Temporal resolution of 250 cloud free measurements, within a 500x500 km
area, per month. Performance of the system will not only be established based on the ability of the system to meet the above requirements, but will also be measured by the ability to disseminate the sensed data to the end users in a timely and reliable fashion, and to validate the use of microtechnology for this operation.
4.3 Potential solutions The requirements as set out in Section 2.6 are well defined in terms of resolution and accuracy and hence the options available to meet them are fairly limited.
60

CASSIOPEE
Section 2.5 identified gaps in the existing observational systems and stressed the concerns over the decline in observational networks across the globe and also in systematic and sustained observations. These issues should be addressed with a system that provides the necessary long-term monitoring. Firstly, existing land, air and space-based systems (reviewed in Section 2.4) could enable an approach where all relevant data could be collated, processed and distributed to a required user centre. This would place emphasis on data integration rather than collection methods. Conversely, a new system could be designed to target the goals as described in Section 2.6. This would be the case if there are no existing systems that provide sufficient, spatial and/or temporal coverage of the required atmospheric constituents. The applicability of these options with respect to our mission requirements is reviewed below.
4.3.1 Space based systems: existing and future Among the space-based instruments very few measure CO2 due to the highly dispersive nature of the gas. Systems exist that provide data on the other target gases: CH4 and N2O. However, those instruments that do measure useful density profiles or gas concentrations have either finished their operational lifetime or have yet to be launched. This leaves a gap in satellite systems providing appropriate data. Current instruments include MOPITT, an infrared gas correlation spectrometer on board TERRA, a NASA satellite. From a near-circular, sun-synchronous orbit with an inclination of approximately 98.2 degrees, distribution measurements of CH4 are made which would require further data sources to provide information on the full complement of gases and would therefore not be sufficient alone to satisfy our requirements. IASI planned for METOP-1, Europe’s first operational polar-orbiting weather satellite, will measure of atmospheric temperature profiles and density profiles of CO2 and is due for launch in late 2005. One concern for our system is the start of the data collection; this must begin in sufficient time for states to obtain useful information about their CO2 emissions before 2012 (in order to make reductions in GHG generation and comply with the Kyoto protocol). This further narrows the field of existing useful systems. There are other drawbacks to these instruments such as insufficient resolution or accuracy, which makes them unsuitable for our specific requirement. Another option exists to place an instrument on the shuttle or the ISS. The shuttle would be unsatisfactory due to its inherent short mission duration. Placing an instrument on board the ISS would be similar to the MIRS spectroradiometer experiment on the MIR PRIRODA module. This thermal spectrometer was used to collect high resolution measurements of CO2 and trace species. However the expense and risk of not being selected for a long-duration experiment on the ISS and the issue of obtaining sufficient dedicated coverage over Europe would pose problems.
61

CASSIOPEE
4.3.2 Air based systems – existing a) Many air-based sensors measure the various GHGs. These are mainly American systems, hence are little use for European measurements. A project being carried out by Frankfurt University called SPURT (see Section 2.4) is intended to measure all three of the gases needed, with coverage from the subtropics to the arctic. However, this is in preliminary design stages and would require added data sources to obtain full coverage of Europe. b) Another option would be to place sensors on commercial airliners. Problems would arise in finding instruments with small enough mass and power that airline companies would be willing to carry such devices. The data collection would also currently be restricted to air lanes and may not provide the full coverage needed (although this may change in the future with the advent of GPS-based navigation systems). The policy issues involved in this type of monitoring could also pose a problem and airlines may charge unreasonable amounts for use of their aircraft. c) Using unmanned aerial vehicles (UAVs) as observational platforms is also an option. Remotely-operated solar-powered aircraft, experimental in nature and capable of extremely long duration flights at high altitudes (~23km), can carry large instrument payloads. HELIOS is one example of such a vehicle that could loiter, as pilots put it, over an area and make detailed observations of the environment around the clock. Unlike most satellites, the payload would always be over the target. Als, remote piloted vehicles (RPVs) could cut costs and provide an affordable vehicle or Air Taxi for payloads while alleviating the constraints of mission duration, altitude and flight over inhospitable terrain. Such platforms as these would require a parallel effort in developing lightweight, micro-miniaturised sensors for carrying out the target atmospheric research (See Section 4.1.2) d) After a cursory investigation on the use of high altitude balloons (see Figure 4-1) to collect data, several considerations for such a system would be cost, the applicability of long-duration balloon systems for this application, control of the balloon trajectory, and setting up a communications infrastructure. Careful consideration of balloon design, envelope materials and fabrication, lightweight and efficient power generation and energy storage could make a series of stratospheric balloons a good solution. However, the ground coordination of such a system together with the development of the necessary microtechnology, would present new problems. Other considerations such as highly variable meridional winds driving the balloons toward the poles, make this a feasible but highly technically challenging option.
62

CASSIOPEE
Figure 4-1: A radiosonde rising skywards ©NASA
One complication with systems such as the UAV’s and high-altitude balloons is coverage. An aircraft at 23 km carrying an instrument with a field of view of approximately 2.5 degrees can view an area of about 1km. As we need a reasonably large number of measurements over an area of 500km x 500km each month cloud-free, this may pose a problem for airborne systems in general (as it would for satellites) due to Europe’s prevalent cloud cover. Furthermore, integration of existing data on a European scale would be difficult due to the lack of coordination or standards on data quality. Also one of our main drivers is to obtain a large number of measurements over each 500km x 500km region of Europe each month in order to formulate averages. This would be a very expensive task if dedicated aircraft with the appropriate instruments were to be deployed over these regions, especially when considering that long term data collection (i.e. 4-5 years) is needed.
4.3.3 Ground-based systems: existing Ground-based sensing is likely to be done on a local level and would require considerable data management and collation tasks and routines to be established so as to have a coherent data product. One system integrating ground based sensor data, into a central database, is EuroAirNet (see Section 2.4). This European Air Quality Monitoring Network takes data from existing ground monitoring stations to serve information needs at the European level. More than 30 European countries have a multitude of air quality monitoring networks in operation, with a total of more than 6000 monitoring stations. Problems include the lack of coverage over some areas (such as France) and the omission of CO2 from the measurements.
63

CASSIOPEE
A ground-based system such as this would provide acceptable data for our requirements, but integration over the whole of Europe and a standard set for managing the data processing and archiving would be necessary in order to have clear data products output. Such system could also operate in tandem with a space-based system much like the ARGOS data collection relay system. ARGOS collects information from remote buoys and sensors and relays it down to the user, improving global coverage and scope of data collection.
4.3.4 Existing options – summary The options available for using present data pose problems in both data collection and integration and coverage. Airborne and ground systems tend to be localised, and a large number of sensors would be needed to cover all of Europe. In-situ measurements are valuable when monitoring point sources for gas emission, but our requirements need only a value per defined area per month. More information would also complicate the collection, processing, and distribution of the data. Weighing the needs for coverage, revisit time, expense of the system, etc. leads to a conclusion that an air or ground-based system would result in very complex data management issues as no real architecture has been set up for a complete Europe-wide data collection service.
4.3.5 Feasible options The air and ground systems discussed above all have drawbacks that are not easily overcome, such as the data integration required to formulate a product (rather than validation of measurements through integration after processing) and the significant consideration of coverage. This points toward a space-based system to obtain the required data. From the review of existing space-based sensor products, there appears to be a ‘gap’ in atmospheric monitoring for GHGs. A high resolution system providing high accuracy, monthly averages of total column concentrations of the relevant gases would fill a niche within the monitoring community and provide unique measurements that would satisfy our requirements without building new ground-based monitoring towers or balloon constellations.
4.4 CASSIOPEE constellation
4.4.1 Profile and orbit description
4.4.1.1 Sun-Synchronous Orbit Sun-Synchronism defines the relationship between orbital altitude and inclination. In the range of orbits under consideration to provide adequate European coverage, the inclination is about 98 degrees, a retrograde, near polar orbit. This high inclination is well adapted to an Earth observation mission. The sun-synchronism is also desirable for optical instruments and above all because it is favourable for the design of the
64

CASSIOPEE
power subsystem of the satellite (as it provides relatively constant solar illumination angles).
Altitude (km) 600 Circular velocity (km/s) 7,558 orbit Angular velocity (deg/min) 3,723 Escape Velocity (km/s) 10,688 delta V Req. to deorbit (m/s) -156.7 Sun-Synchronous Inclination (deg) 97.79 Revolutions per day 14.85 Period (min) 96.69 Max Eclipse(MIN) 35.49
Table 4-1: The CASSIOPEE orbital parameters
The reasonable altitude to have a high ground resolution but not to spend too much fuel on compensating the air drag effects is 600-800 km. There is no great advantage of having an eccentricity, but we have chosen a Sun-Synchronous orbit altitude of 600 km with an inclination 97.79 to cover the whole Europe. A lower inclination could have been chosen, which would make the launch cheaper, but the inclination must be at least as great as the most Northern latitude, in order to cover Norway and Sweden. The RAAN (Right Ascension of Ascending Node) has been chosen in such a way that the local time of the ground track is 12 am (such that the ground which is observed is in full sun on one side of the orbit and mid-night on the other side of the orbit) or 6 am (such that there is dawn and dusk coverage on the ground, which may offer strange illumination conditions). A spacecraft in such an orbit makes about 14.85 revolutions in a day and spends only a small fraction of its time above Europe. The question of ground stations has little influence on the choice of the orbit in this case. However, because it is a low-Earth orbit, there is quite a big need for on-board storage capabilities. Eclipses are quite different for a geostationary satellite orbit or for a low-Earth satellite orbit, but again they would not be a driver for orbit selection. (Eclipse times are included asappendix). The factors to be considered for the selection of the orbit for each instrument include:
65

CASSIOPEE
Consideration Influence Factors Orbital Parameter observation frequency swath width; revisit altitude
global access maximum latitude ; spacing between ground -track inclination, altitude
regular ground pattern synchronous or drifting orbit altitude regular illumination conditions sun-synchronism inclination and altitude aliasing of solar tides sun-synchronism inclination and altitude aliasing of all tides repeat period altitude accessibility of celestial sphere orbital precession inclination and altitude discontinuities in orbit orbital maintenance frequency altitude mission lifetime orbital decay gross altitude instrument spatial resolution/radar transmission power gross altitude radar PRF altitude range permanent cold radiator surface sun-synchronism inclination and altitude
Table 4-2: Factors for orbit selection
Some of these factors are fundamental and have an impact on the overall concept of the system. In particular, the selection of a sun-synchronous orbit is of primary importance and has driven the physical configuration of the spacecraft. The gross altitude range, within some tens of kilometres of 800km, is also critical to design.
66

CASSIOPEE
Figure 4-2: A 1-day orbit of the CASSIOPEE constellation.
4.4.2 CASSIOPEE, a 3-satellite constellation It has been decided to use a constellation of 3 satellites mainly for an easier fulfilment of the requirements. The minimal requirements for a correct environmental study are to acquire 250 cloud-free measurements in an area of 500x500 km each month. Each satellite is provided with a linear sensor, which is taking single pixel images in a spatial resolution of 15 km2. With this size, the probability of getting a free cloud pixel is about 6,58%.
67

CASSIOPEE
Percentage of cloud-free pixels vs spatial resolution
0
2
4
6
8
10
12
14
16
0 5 10 15 20 25Spatial Resolution (km)
Clo
ud F
ree
Pixe
ls (%
)
Figure 4-3: Number of cloud free pixels against spatial resolution of instrument
In this situation, in order to get the necessary amount of cloud free pictures, the satellite must make almost 4167 samples in an area of 500x500 km. Each satellite can take 133 samples in this area with a daily review between 3 and 6 times. Using a constellation of 3 satellites in the same plane separated by 120°, we achieve the needed coverage.
Figure 4-4: Nine days of coverage for a single satellite
68

CASSIOPEE
Figure 4-5: Nine days of coverage for a single satellite
Figure 4-4 and Figure 4-5 show the 9 days coverage of one single satellite with a sample area of 500 km2. This is not enough for the environmental study due to the low probability of having a cloud free image. In Figure 4-6 the full coverage of the constellation over nine days is shown.
Figure 4-6: Nine day coverage for the 3 satellite constellation
A sample region is shown in Figure 4-7.
69

CASSIOPEE
Figure 4-7: The coverage over a 500km sample area for the 3 spacecraft
As shown, with a 3-satellite constellation, the full coverage is reached. Each satellite reviews the area a minimum of 3 times every 9 days making possible the required data acquisition.
4.5 Satellite system description
4.5.1 Overall architecture The spacecraft requirements derived by the payload have led to a three-axis stabilised platform design using only reaction/momentum wheels and magnetorques. The spacecraft design employs components that are to both standard and non-standard. This means that some of the components are readily available on the market while others are currently being space qualified. Radiation shielding of the spacecraft is only applied to the sensitive parts and shall be sufficient to tolerate a 600 km Sun Synchronous Orbit (SSO) for at least 4 years. The spacecraft presented in Figure 4.8 is 60x50x40 cm and most of the volume is taken up by the payload.
70

CASSIOPEE
Figure 4-8: Possible satellite configuration
If the spacecraft goes into an unwanted spin during orbit injection or during operation it could be lose due to lack of power from the solar panels. Therefore, the solar panels are mounted on all sides of the spacecraft. Furthermore, radiators are mounted on the sides facing away from the Earth and Sun. The spacecraft centre of mass has been planned to have a balanced spacecraft, and will be in the centre. Fixed to the earth-facing side of the spacecraft is an omni directional S-band antenna, while on the opposite face is a GPS antenna and the launcher separation interface, which can be modified as required for the appropriate launch vehicle. The payload is directly connected to the radiators, but is isolated from the rest of the spacecraft in order to lower the temperature of the instrument to about 80K.
4.5.2 Subsystems description The CASSIOPEE spacecraft bus has been designed to utilise new technology of low mass and innovative solutions within the various subsystems to create an end product, which falls into the microspacecraft class. The CASSIOPEE satellite has seven discrete subsystems: communications, attitude and orbit control, power, thermal, structure, on board data handling and of course the instrument. Each demonstrates the increased level of integration and miniaturisation that can be achieved with recent developments in equipment designed for space-based systems.
71

CASSIOPEE
• The instrument, a gas filter correlation radiometer, requires a small telescope to protrude from the main body of the spacecraft to allow photon collection. The requirement for a pointing accuracy of a few degrees with a pointing knowledge of better than 0.1 degrees has driven the AOCS design.
• The satellite communication subsystem operates a dual S-band receiver and transmitter for uplink and downlink of data from the instrument and TT&C. A data rate of 9.6 kbps uplink and 1Mbps downlink is available using D-BSPK for modulation.
• The AOCS system can effectively be split into two sections, the sensors themselves that measure the current position and pointing of the spacecraft and the actuators that control this positioning and pointing. The components we used for accurate sensing are: inertial measurement units, a star tracker, magnetometers, sun sensors and GPS receivers, all of which show promising development in the microtechnology area in the future. The actuators themselves operate a 3-axis spin-stabilised system utilising reaction wheels and magnetorquers. For translational control of the satellite in orbit, two colloidal micro thrusters will be used, this will provide corrections in the case of orbital drift and provide orbit maintenance.
• The power subsystem consists of thin-film, high-efficiency solar panels covering all faces of the spacecraft body, an area of approximately 1.48m2, producing a minimum power level of 80W. The panels demonstrate a tolerance to radiation in ground tests and are still under development. There are also on board batteries for use during eclipses.
• The thermal control of CASSIOPEE will consist of both passive and active methods in order to maintain the required temperature range for the instrument focal plane and the electronic components. MLI and radiators will facilitate the heat flux into deep space and minimise the radiation absorbed and a heating system will be used during spacecraft eclipse.
• The structure of the spacecraft is a carbon-fibre composite box-shaped structure of dimensions 40cm x 50cm x 60cm. This will provide stiffness, strength and shock qualities as required by the launch and operational environment.
• The on-board data handling system has a high performance RISC processor with a highly reliable CAN data bus and a data storage capability of 2GB. As many space agencies today have adopted the CCSDS recommendations for telemetry and telecommand these have been adhered to.
4.5.2.1 Payload and instrumentation
4.5.2.1.1 Payload selection criteria Having analysed the prime areas of concerns for Europe’s environment, the measurement of greenhouse gases is a priority for investigation. The specific requirements are:
• Total column measurement of the concentrations of CO2, CH4 and N2O • Single measurement precision of better than 1% • Greater than 250 “cloud free” measurements in a given 500 x 500 km area /
month • An archive of the above data spanning a minimum of 4 years
72

CASSIOPEE
With this in mind, and considering the constraints of a microsatellite bus identified elsewhere in this study, the following instrument proposal was defined.
4.5.2.1.2 Remote sensing of the atmosphere As stated previously, in order to meet the requirements of temporal and spatial coverage required the only realistic solution is to provide a satellite. Since any realistic design puts the sensor well above the region of the atmosphere we wish to investigate, the only option is to use "remote sensing". Remote sensing is any technique that gathers information about an object without physical proximity or contact. For most cases this means relying on electromagnetic radiation interacting with the object under observation and then being collected and analysed at a distance by instrumentation. There are a variety of processes that can be used to monitor parameters of the atmosphere, but for measuring trace gas concentration, we are mainly concerned with absorption of radiation. In this process the amount of radiation passing through a gas from a known source is reduced by a quantifiable amount. Further details on the physical processes underlying the techniques described here can be found in Appendix F.
4.5.2.1.3 Instrument selection The following paragraphs address just some of the trades that were studied in order to select an appropriate instrument to meet the environmental requirements specified. This list is not meant to be exhaustive, but to summarise some of the key points and design drivers. A. Nadir vs. limb scanning Nadir instruments look straight down from the satellite towards the Earth (the nadir direction). This has the advantages that the spatial resolution achieved (i.e. the footprint on the Earth) is small and that such instruments are generally fairly simple. Limb sounding, on the other hand, involves pointing at the limb of the Earth (effectively looking at the horizon as seen from orbit). This has the advantage that the background is space (i.e. it is cold!), so signals have less interference. It also allows vertical profiles to be built up, although at the expense of spatial resolution. Additionally the longer path lengths allow lower concentrations of trace gases to be detected.
73

CASSIOPEE
Figure 4-9: Viewing geometries for a nadir and limb pointing instrument ©ESA
Figure 4-9 (adapted from http://envisat.esa.int/instruments/sciamachy ) above shows the geometry of these two situations. Although limb sounding offers some compelling advantages, in the end our requirements drive the design to a high spatial resolution giving a high probability of cloud-free data. Therefore a nadir-pointing instrument has been identified here as most appropriate for CASSIOPEE B. Radiometer vs. Spectrometer Any spectral information (i.e. variation with frequency) gained can be very useful both for diagnostic checks on the frequency range being observed and for the intrinsically useful information gathered. However, a spectrometer would greatly increase the complexity of the system in terms of design, operation, data rate etc. More importantly, such an instrument typically looks at narrow spectral lines, decreasing the amount of energy per unit time available in any given channel (and hence decreasing the signal-to-noise ratio (SNR), increasing the integration time and lowering the spatial resolution). For CASSIOPEE, we would like to resolve features with bandwidths on the order of 0.01 cm-1, something hard to achieve with standard spectroscopy. C. Thermal IR vs. Reflected Radiation Remote sensing of the atmosphere can take place at various wavelengths, but fundamentally the radiation seen has two sources for a nadir-pointing instrument. First we can work with thermal (emitted) infrared radiation; this is electromagnetic energy emitted from the Earth and lower atmosphere at a characteristic temperature. Second we can look at atmospheric absorption of the much stronger reflected solar radiation signal. The black body curves corresponding to these two cases are shown in Figure 4-10 [adapted from JARS, 1996]. Obviously, the peaks of these curves (where most energy is given off and hence where any instrument would be most sensitive) are at quite different wavelengths.
74

CASSIOPEE
Figure 4-10: Observing reflected solar versus thermal
radiation
There are various factors to consider when deciding which of these is appropriate for a given mission. First, the reflected solar flux is much higher than thermal emission and so the signal to noise ratio is higher and the sensitivity of the instrument is much increased. It is quite variable, however, since the albedo of the Earth’s surface varies dramatically depending on the type of terrain (ocean, land etc.). This information can be gathered from other sources, however, providing we know where our instrument is pointing when each measurement is taken (a constraint on the spacecraft itself). Second, measuring the lower troposphere where many of the sources of the gases we wish to measure are found is confounded by the increased temperature of the atmosphere at low altitudes. This large thermal background signal gives a much-reduced SNR at these heights. Finally the method of using reflected sunlight is only possible during the day, whereas use of thermal IR can potentially occur at all times.
75
Figure 4-11: Selected IR absorption features of our
target gases
To make a decision we must once again look to our requirements and see that achieving high resolution (and therefore cloud free) data is a priority. This means we need as short an integration time as possible to prevent blurring due to spacecraft motion. To minimize this effect we want to collect as much energy per unit

CASSIOPEE
time as possible and reflected solar radiation is generally an order of magnitude better in this respect. Therefore our instrument design will focus on measurements based on reflected solar energy but consider using emitted radiance where possible. D. Selection of Absorption Bands As discussed previously, the selection of appropriate absorption bands is vitally important. The figure included here shows a few such features. A “first order” analysis is possible by looking at such plots; features exhibiting almost total absorption may well saturate and therefore lose quantitative information, whilst overlapping spectral features are hard to de-convolve. In order to fully complete this analysis, however, it is necessary to combine molecular spectroscopy information from a source such as the HITRAN database with a radiative transfer model. An example of this is the MODTRAN code. This will allow final selection of appropriate absorption features and hence selection of the necessary filters and gas cell pressures. A few of the possible absorption features are tabulated here:
Gas species Reflected radiation band Thermal radiation band CH4 2.3 µm 3.3 µm or 7.8 µm N2O 2.3 µm 4.5 µm or 7.8 µm CO2 2.0 µm 4.3 µm
Table 4-3: Possible absorption features for target gases.
E. Swath width Many remote sensing satellites use a scan mirror to give them a wider swath width (i.e. to extend the reach of the sensor in the cross-track direction). This is mainly used when global coverage is required, to “fill in the gaps” left between successive passes of the satellite. Since we are not aiming for global coverage with CASSIOPEE, this is less of a constraint. Also we are limited by our integration time and the fact that our baseline is a single IR detector (see below), hence the number of data points we can receive per second is also limited. Inclusion of such a system would also add another mechanical failure point, which should be avoided if possible. For these reasons it has been decided that the baseline instrument design will not have a scan mirror assembly. F. Number of detectors With a sufficiently large field of view one could imagine having an array of infrared detectors on the focal plane, each subtending a “pixel” of solid angle on the Earth’s surface. This would greatly increase the number of measurements taken in any given period of time. The downside is that for a given optical telescope the integration time goes up in proportion with the number of detectors we have (since the energy is being split between them).
76

CASSIOPEE
It may be possible to use a linear array of several detectors in order to increase the cross-track swath width (instead of a scan mirror) but in order to calculate this it is necessary to study the energy emitted in the chosen wavelength ranges at the top of the atmosphere. Since the scope of this project has not allowed a detailed model to be constructed, the current design is based around a single detector at the focal plane. G. Cloud Cover Determination method Because this instrument is working in the infrared, cloud cover over the target area is a major limitation. This has driven the requirement of needing a high spatial resolution and short revisit time. In order to determine the validity of each measurement taken it is necessary to determine the cloud coverage simultaneously with each measurement. For the purposes of our work, “cloud free” has been defined as “having less than 10% cloud coverage”. This does not necessarily mean that cloudy pixels are useless, however. If there is enough spatial resolution in the cloud cover data to determine the percentage coverage per pixel it may be possible to reconstruct the column density data. Equally if the cloud top height is known we can say that the signal we have is coming purely from absorption in the atmosphere from that point upwards, and again some data extraction is possible. The main alternatives for determining the cloud cover that we have identified are:
• Use an existing EOS or meteorological satellite instrument • Carry a micro-camera onboard the spacecraft • Add another band for a gas with a well known vertical absorption profile • Use ground based (e.g. radar or lidar) derived cloud data
The first option requires a spatial resolution of much better than 15km x 15km in order to get statistics on the percentage of cloud cover per pixel. Landsat, for example, has an “automatic cloud cover assessment” algorithm that is applied to data once downlinked before archiving. Option two has not been fully investigated, but would probably produce a large amount of data (much larger than the primary instrument itself!) and hence require a redesign of the data handling systems. An alternative would be to develop some kind of onboard cloud discrimination algorithm that would downlink only the data corresponding to cloud-free pixels, vastly decreasing the data requirements on the spacecraft. This would probably require a variety of types of data onboard, however (i.e. multi-spectral imagers), and would vastly increase the complexity of the instrument. The third option is attractive because it only requires the provision an additional band to the instrument. In operation we would look at an oxygen band, which is a well mixed gas and has a well defined vertical profile. Together with models of the density
77

CASSIOPEE
distribution and radiative transfer the amount of absorption seen in this band (arising only from above the cloud tops) will yield a value of the cloud height. The optimum solution would be to combine option one with option three to give data on both the cloud coverage during each measurement and the height of that cloud present. Utilising both of these should much improve the number of useful pixels.
4.5.2.1.4 Final instrument selection From the above considerations, amongst others including compatibility with a micro-spacecraft bus, a gas correlation infrared radiometer was chosen. The details of such a sensor are explained in the following sections.
4.5.2.1.5 Instrument detailed design A gas filter correlation radiometer sensor uses a sample of the gas being measured as a filter, making the sensitivity very high by allowing all spectral bands within a broad feature to be observed simultaneously.
Figure 4-12: Functional diagram of a gas correlation radiometer
The basic principle of a radiometer is that radiation emitted or reflected from the Earth’s surface “trickles” up through the troposphere by being absorbed and re-emitted repeatedly from different layers. The sensor in orbit sees the end product of this process as a spectrum of radiation with absorption features consisting of sharp lines grouped into broader bands. The basic functional blocks of such a sensor are shown schematically in Figure 4-12 [adapted from MOPITT Team]. The incident radiation is collected and focused using a small telescope. Light is then passed through a small cell containing a sample of the gas to be measured. The pressure and temperature of this gas are recorded
78

CASSIOPEE
simultaneously with each measurement. This results in partial absorption of the spectral lines corresponding to this target gas, whilst radiation from other gases is not affected. The pressure of gas in this cell can be varied in some way in order to modulate the amount of absorption taking place (generally by either increasing the pressure or the length of the optical path). The radiation then falls onto a detector that generates a signal corresponding to the amount of energy in a limited range around the centre of the chosen absorption feature. So this technique acts as an almost perfect filter, picking out via this modulation only that radiation corresponding to the gas in the reference cell. The absorption cell serves two purposes – first, it allows this modulation and hence unique identification of the signature of the gas. Second, it allows sensing of the atmosphere at different depths by effectively looking at different parts of the absorption band (see Appendix F). By combining these techniques and an efficient (i.e. many electrons per received photon) detector the response of such an instrument is very much improved over a basic radiometer and potentially allows measurements to be made with the desired precision of less than 1%. A first order design of this system has been made by analogy with an existing instrument called MicroMAPS, produced by Resonance Ltd. of Ontario, Canada for the (cancelled) Clark spacecraft [Resonance Ltd, 1997]. This has a heritage from the Measurement of Atmospheric Pollutants from Satellites (MAPS) payload flown onboard the Shuttle, but is much miniaturized from this by using a rotating gas cell chopper capable of carrying up to eight gas cells and a single IR detector. Since this instrument has the capability to carry so many gas cells, this has been used to avoid as many moving parts as possible. Thus instead of using pressure modulated gas cells, our instrument will carry two cells at different pressures for each gas to be measured. Equally, the chopper, a device that allows switching of a calibration source into the instrument and reduced detector noise, has been changed from a mechanical system to an electro-optical design by NASA’s Goddard Spaceflight Center (GSFC). Thus the only moving part in this instrument is the rotating gas cell chopper. A spreadsheet “trades model” was established to further define some of the instrument parameters. This looked at the effects of spatial resolution on the number of cloud-free data points (extrapolating from cloud statistic published in peer reviewed journals), the number of data points per pass assuming an average integration time, etc. The mass was based on the MicroMAPS design with a margin for the addition of further gas cells, calibration hardware etc. if necessary. Power was again derived by analogy with the same instrument. Note that in the current design it is only required to have the instrument switched on and collecting data for the portion of the orbit in which Europe is visible. This means that all
79

CASSIOPEE
requirements on data, power, pointing etc. driven by the payload can be relaxed during much of the orbit. A small telescope is all that is required for this instrument – we are not diffraction limited and therefore the limit on our resolution comes from the integration time of our detector in order to achieve a reasonable SNR (for example a value of 100). The integration time itself is affected by the photon collection efficiency (i.e. the aperture of our telescope, losses in our optics etc.), the amount of energy at the required frequency emitted by the atmosphere, and the efficiency of the detectors at turning photons into electrons. The optical design has not been investigated in any detail but would require refining once modelling has shown the radiation flux we can expect at our instrument for each chosen wavelength of observation. The time to take a single measurement (below) is derived from those values used on the MOPITT gas correlation radiometer. During this period, a measurement through two gas cells at different pressures and many calibration data points are taken for each gas.
4.5.2.1.6 Summary of instrument parameters Mass: ~ 15kg Power: ~ 20W average during operation Dimensions: 30 x 20 x 20 cm Detector type: HgCdTe Detector temperature: 90K <T< 110K Data rate: 25kps (when data-taking) IFOV: 15km x 15km Swath width: 15km (more with array) Telescope Aperture: ~ 2 cm Telescope field of view: ~ 2.4º Time per measurement: 0.5s
Figure 4-13: The MicroMAPS instrument © Resonance Ltd
4.5.2.1.7 Spacecraft parameters • Pointing accuracy: ± 5 degrees • Pointing knowledge: Better than 0.1 degrees
80

CASSIOPEE
4.5.2.1.8 Data recovery The raw data (including housekeeping TM) produced by the instrument will contain something similar to the following fields for each data point taken, for each gas:
• Radiometric channel outputs (i.e. detector "count" value) • Correlation cell pressure • Correlation cell temperature • Chopper frequency • Detector temperature • Spacecraft timestamp
This very raw data must somehow be converted into a more useful form. Like most of remote sensing this task falls into the category of “inverse modelling” – we are looking at the end result of a complex chain of events and must try to reconstruct the source process. In order to do this, a forward radiative transfer model of the atmosphere is required, along with meteorological data on the atmospheric temperature and pressure (either measured directly or inferred from models). Surface reflectivity or emissivity is also required for each data point. All of these data should be available either from models or from existing satellite or ground-based services. Various levels of data products are envisaged, ranging from raw data to calibrated, geo-referenced CH4, CO2 and N2O column depths to monthly-averaged country-by-country greenhouse gas output data (combining data with models). In order to ensure the accuracy of this data a comprehensive validation programme must be undertaken using complementary measurements from other space- and airborne instrumentation to confirm the correct operation, calibration and interpretation of the data. Only after this should the final data products be released to the end users (see Section 5).
4.5.2.1.9 Conclusions • Gas correlation radiometry has the potential to make very high-resolution
measurements of greenhouse gas concentrations from space. • A suitable instrument can be designed to fly on a microsatellite bus • Further work is needed to identify the optimum absorption features to observe
and to complete the optical design
4.5.2.2 Communication
4.5.2.2.1 Communications architecture For space missions, communications relate to the exchange of commands and engineering data between a satellite and ground controllers, as well as the processing and transmission of data from payload to the users.
81

CASSIOPEE
The communications architecture includes the configuration of satellites and ground stations necessary for a space mission and the network that links them together. It has the following elements:
• Satellites – the spacecraft elements of the system • Ground stations – the Earth- based antennas and receivers • Control centre – the command authority, which controls the satellite and all
other elements in the network Information moves between these elements on various links:
• Uplink – data sent from ground station to the satellite • Downlink – data sent from the satellite to a ground station
Communications link allow a satellite system to function by carrying tracking, telemetry and command data or mission data between its elements.
4.5.2.2.2 Parameters for CASSIOPEE project The communication subsystem is responsible for sending telemetry, receiving telecommands, and sending also payload data to the ground. Dual cold redundant transmitters provide standard S-band telecommunication between spacecraft and ground with D-BPSK modulation. Dual hot redundant receivers perform a ground to spacecraft S-band telecommunication at 9.6 Kbps data transmission. The receivers are connected to the decoders and the data are distributed to the onboard data handling subsystem. For the CASSIOPEE project the following parameters have been selected:
• Orbit: Sun-synchronous • Inclination: 97.79 degrees • Altitude: 600 Km • S-band downlink frequency: 2020 – 2120 MHz • S-band uplink frequency: 2200 – 2300 MHz • Data Rate: 1Mbps downlink • Link Availability: 0.99 • Digital Modulation of signal • D-BPSK modulation • TT&C data rate: 9.6 Kbps uplink • Antenna: Isotropic ⇒ G=1dB • Power: 1W • Total Power Consumption of Communications Subsystem: 5W • Total Mass: 5Kg
For a schematic of communications, see Appendix J.
82

CASSIOPEE
4.5.2.2.3 Link design An important input to the design of this system is the altitude of the satellite – 600 km. This determines how long the satellite is in view from the ground station as the satellite passes overhead. In order to view the satellite all the times when it is not blocked by the earth, a ground station will have to look very close to the horizon. Unfortunately, an antenna pointing at the horizon has many problems. At the horizon, the signal from the satellite will be at its weakest. There are two reasons for this. First, the satellite will be at its farthest distance from the ground station (signal strength is inversely proportional to the distance squared). Second, the satellite signal is passing through more of the atmosphere, thus increasing signal attenuation. Also, the noise at the antenna will be greatest looking along the horizon. With the antenna perpendicular to the ground, noise from the ground is greatest and the attenuation from the atmosphere, clouds and rain generates even more noise. Thus we have the lowest signal to noise ratio along the horizon. Increasing the minimum inclination of the antenna (0 deg. is pointing to the horizon and 90 deg. is pointing straight up), increases the signal to noise ratio at the satellite, thus allowing a practical design. For this project has been selected a sun-synchronous orbit at 600 km, with an inclination of 97.79 deg, so the satellite will be over Europe for 10 minutes. The frequency bandwidth is S-band, so ground station commands will be transmitted via uplink operating in the 2020-2120 MHz Earth-to-Space spacecraft operations band and both telemetry and payload data will be transmitted on 2200-2300 MHz, Space-to-Earth operations band downlink. The operation in S-band (around 2 GHz) allows minimal propagation loss through Earth atmosphere (less than 1dB) and rates up to approximately 1Mbps. This is usually adequate for Earth-orbiting missions (including GEO). An isotropic antenna (antenna gain=1dB and a power of 1W at SSPA on satellite) has been selected for transmitting data from spacecraft to ground. An important parameter of the satellite is the EIRP (Effective Isotropic Radiated Power), calculated in the conditions mentioned above. This results in a free space loss of 165.8 dB. For a communication link at this inclination the atmosphere and rain attenuation must be taken into account. From Maral, 1998, the atmospheric attenuation is 0.5 dB. The determination of the loss due to the rain is much more complicated because of the random nature of rainfall. The main requirement is to determine what loss can be tolerated for some percentage of time. To do this correctly requires a determination of the rain statistics in the area of the ground station. For Europe the typical value for the attenuation due to the rain for a ground station situated in a temperate climate will not exceed, at 2 GHz, S-band 0.5 dB. The total loss due to the space, atmosphere and rain is therefore 166.8 dB. The next step is to consider the ground station used for receiving data from the CASSIOPEE payload. For this receiving station, a 2.4m antenna with G/T of 13dB/K. and a noise temperature of 290 K has to be considered. It has assumed that the industry standard rate half convolution code is used to reduce the required signal to noise ratio. Normally, for uncoded BPSK or QPSK modulation
83

CASSIOPEE
with differential encoding (to remove 90 or 180 degrees phase ambiguities in receiving signal), an Eb/No (energy per bit per noise power density) of 10.5 dB is required to obtain a BEP (Bit error Probability) of 10 E-6 in case of QPSK modulation, and 11.2 E-6 in case of D-BPSK modulation. Also to be considered is the signal coding which in case of D-BPSK modulation is differential Viterbi encoding with rate ½ at transmission. With rate half differential coding the Eb/No can be reduced at 6.0 dB for the same BEP of 10E-6. In order to obtain the required BER, it has to be increased. This is obtained by implementation of the degradation factor, which is in the range of 0.5 to 1.5dB according to the complexity of the demodulator. Another technique used for improving quality of transmitted signals, which is used with differential encoding, is FEC (Forward Error Correction). At the receiver there must be used a differential demodulator and differential encoder. The calculation of the link budget must take into consideration the payload and the telemetry, tracking and command signals, because only one antenna will be used for transmission and receiving of both signals. Link budget calculation are available in Appendix G. Regarding the ground station a small station has been selected with an antenna of 2.4 m diameter, and a power radiated of 2W. The data rate is 1Mbps for payload data and telemetry for downlink and 9.6 Kbps for telemetry on uplink. On board the spacecraft, a S-band transceiver module will allow transmission of housekeeping and payload data, and will receive commands from Earth. A diplexer is therefore required to isolate transmitted and received signals. For more information on TT&C, see Appendix H.
4.5.2.3 Attitude and Orbit Control System
4.5.2.3.1 Navigation sensors configuration Navigation sensors used for Attitude Control System (ACS) are: 2 Inertial Measurement Units (IMU) Each one composed of one 3-axis Fibre Optic Gyro (FOG) and one 3-axis Accelerometer (ACM). IMU provides satellite angular rate and acceleration measurements. 1 star tracker (STR) The STR provides accurate inertial attitude. It is used to update the satellite IMU-based attitude propagation. STR is also used to perform an in-flight estimate of the gyro drift in order to get the full FOG performance.
84

CASSIOPEE
2 magnetometers (MGN) MGN provides rough 3-axis attitude update. It can be used to point the satellite in a direction where the STR is ensured to point towards the celestial vault (avoiding Sun or Earth dazzling). MGN is also used in case of a STR failure to update the satellite attitude. 3 nominal/redundant Sun Acquisition Sensors (SAS) The SAS is used to point the satellite towards the Sun in survival mode. This pointing shall guarantee safe power and thermal conditions during the survival mode, in order to allow the Control Centre to perform a diagnosis of the failure and to study the recovery of the mission. The SAS also provides 2-axis inertial attitude measurements to update the satellite when the STR has failed. 2 GPS receivers The GPS is used to provide orbit parameters of the satellite (Position, Velocity and Time measurements). Sensors main characteristics Once the different types of sensors as well as their respective quantities were determined, we identified sensors that best satisfied our needs (compromise between high accuracy, low power, low mass and low cost). The various characteristics of the chosen sensors are summarised in Table 4-4. To each of these types of sensors correspond at least one product currently available on the market that fits the characteristics. Sensor Quantity Weight
[kg] Dimensions [mm]
Voltage [V]
Power [W]
Operating temperature [°C]
IMU 2 0.75 90 90 90 5 to 15 12 -55 to 70
STR 1 3 350 150 150 10 -20 to 50
MGN 2 0.22 150 40 40 6 to 15 0.01 -40 to 80
SAS 3 n/r 0.15 110 110 30 0 0 -80 to 80
GPS 2 0.08 80 110 2 5 2.1 -30 to 70
n/r: nominal/redundant
Table 4-4: AOCS sensor characteristics
When the satellite is in Earth-pointing mode, the STR is oriented toward deep space and the SAS allows Sun detection whatever the Sun’s position. The GPS antennae are also oriented toward deep space.
Implementation issue:
85

CASSIOPEE
1 STR
2 IMU 2 GPS 2 SAS 2 SAS
2 GPS Antennae
2 SAS
- Z
EARTH
2 MGN
Figure 4-14: Diagram showing the location of the AOCS sensors
Sensors utilization profile After separation from the launcher, the satellite detumbling and angular rate stabilisation is ensured by FOG measurements. Then, the star acquisition manoeuvre is performed with the MGN and the FOG in order to orient the satellite in a rough Earth-pointing mode. The STR is then ensured to point towards the celestial vault in order to acquire accurate inertial attitude. A few minutes of stable inertial phase are required in order to estimate the gyro drift. The combination of FOG and MGN allows for propagating the satellite attitude. Nominal mode: the attitude updates are periodically performed by using STR measurements. This allows a 0.2 deg class attitude update. Degraded pointing mode: when the STR is failed, the combination of MGN and SAS (through a Kalman filter) allows for a 0.5 to 1 deg class attitude update. Survival mode: in case of major detected problem (but not isolated), this mode allows the satellite to be brought in a safe configuration in terms of thermal conditions, power supply and communication capabilities. To do so, the navigation algorithms are using robust dedicated and not power-consuming sensors such as the SAS, in combination with the FOG. Redundancy principle
In order to save power consumption, the GPS and the IMU are used in cold redundancy, meaning that the nominal equipment is ON while the redundant equipment is OFF. When a failure is detected on the nominal equipment, the redundant equipment is switched ON. The other sensors are used in hot redundancy, meaning that both of the nominal and redundant sensors are kept ON during the mission.
86

CASSIOPEE
Failure Detection and Isolation (FDI)
• STR failure is isolated via the voting of the two MGN measurements
• FOG failure is isolated via the voting of the measurements from the STR and one MGN
• GPS failure is isolated via the voting of the measurements from one ACM and the Control Centre acceleration propagation based on the propulsion measurements
• ACM failure is isolated via the voting of the measurements from one GPS and the Control Centre acceleration propagation based on the propulsion measurements
Since such an FDI design might be too complicated to be implemented in a microsatellite, the failure mode analysis of the navigation sensors (compared probability of failure) can lead to the selection of a set of sensors to be failure monitored.
The service that provides AOCS measurements is one failure-tolerant. The FDI main principles that allow for this failure tolerance are detailed as follows:
• MGN failure is isolated via the voting of the measurements from one MGN and the STR
• SAS failure is isolated via the voting of the measurements from the redundant SAS and the STR
Future trends We could significantly reduce the overall mass, power consumption and costs of CASSIOPEE’s navigation sensors by using new components that are currently being developed. The revolution of MEMS (MicroElectroMechanical Systems) began about ten years ago. These new sets of technologies enable mass production and miniaturisation of large numbers of integrated sensors, actuators and computers. These micro-sensors and actuators can be produced using modified silicon semiconductors and fabrication techniques. Three concepts characterise them:
• Miniaturisation (resulting in low mass but also high operating frequency and low thermal constant)
• Microelectronics (leading to intelligent systems, enabling closed loop feedback).
• Multiplicity (rather than designing a component, it is more effective to design a pattern of interconnection among millions of identical components; this method reduces the unit production costs)
However, as sizes shrink down, new errors appear. Hence there is a limitation in the miniaturisation process. A solution is to develop bulk machined sensors rather than surface machined sensors so that the full thickness of the silicon wafer can be used.
87

CASSIOPEE
Many MEMS navigation components are currently being developed, such as:
• Micro gyros • Micro accelerometers
• Micro machined sun and earth sensors • Micro machined magnetometers
These new components are:
• Cheaper (to build and to launch) • Simpler
• Micro FOG
• Lighter
• Lower power consuming • Higher performing (higher accuracy and signal-to-noise level)
A good example of the technology currently developed is a micro gyroscope that is smaller than a shirt button and weighs less than 1 gram. It works by measuring vibrations instead of using conventional rotating parts that need lubrication and finally wear out. The life of such a component can then reach 15 years. Another example is the development of digital CMOS (Complementary Metal Oxide Semiconductor) cameras, coupled with APS technology (Active Pixel Sensor) for Sun, star and horizon sensing, with a wide field of view and the ability to return directly the intensity of a given pixel rather than an entire row. Another issue is the integration of sensors, actuators and control electronics together into one single unit. This would lead to higher reliability and reduced costs, decrease in the number of individual parts, and elimination of manual assembly steps. These very promising technologies are still being developed and not mature yet. However, MEMS will certainly begin to replace conventional systems units within the next few years. This gradual revolution, as opposed to a drastic change, will first lead to the fusion of old and new technology. It seems indeed that fibre optic gyros and hemispherical resonator gyros combined with MEMS are the most promising technologies for lighter and smaller gyro sensors.
4.5.2.3.2 Actuators The attitude control system’s actuators are an important part of the spacecraft, being directly related to aspects such as mission life, pointing accuracy, launch and orbit insertion. For the actuators, we can summarize these trade-offs using the following scheme:
88

CASSIOPEE
Communication Antenna pointing accuracy
►
►
Thermal Requirements from the actuators’ or fuels’ limitations
Payload & Instrument Instrument pointing accuracy Repeatability of measurements
►
►
Structure Flexibility constraints Thrusters’ loads and location Centre of mass constraints Inertia constraints
Mission Requirements Mission life Station keeping Deorbiting Orbit insertion Accuracy/stability
►
AOCS – actuators Spin vs. 3-axis Active vs. passive stabilization On orbit vs. ground determination Actuation device selection Orbit determination Modelling of disturbances
►
Power Power required for the actuators
▼ System’s integration
Performance Power budget Mass budget
Figure 4-15: Diagram showing trade-offs for actuators
Our first data from the different other sub-systems are the following:
• The instrument requires a pointing accuracy of ±5°; • Repeatability of measurements: it was defined that the definition of the
observed place is more important than the accuracy of repetition of the ground tracks. Therefore, attitude and orbit determination system is more critical than the attitude and orbit actuators;
• The mission life depends on the solar activity and therefore on the date of launch. The lifetime curve as shown in Figure 4-16 (based on http://science.msfc.nasa.gov/ssl/pad/solar/predict.htm) can be achieved if the satellite is launched in 2005. The solar activity directly impacts the decrease in altitude, but based on preliminary calculations with such a launch we can ensure more than five years in terms of life and we are sure that the satellite will re-enter the atmosphere and be burnt out before 25 years.
89

CASSIOPEE
Cassiopee Life Time
0
100
200
300
400
500
600
2005 2010 2015 2020 2025
Time (Years)
Altit
ude
(km
)
Figure 4-16: Solar activity and satellite life
• Some propulsion systems such as thrusters are sometimes needed to keep the satellite on its orbit and must work against space perturbations such as atmospheric drag (especially in LEO), asymmetry of Earth’s gravity field, influence of other celestial bodies and Earth’s magnetic field. Considering the level of life and orbit characteristics for CASSIOPEE, no orbit keeping is required. Drag acts in a direction opposite to the velocity vector and removes energy from the orbit. Eventually, the orbit’s altitude becomes so small that the spacecraft re-enters the atmosphere. In addition solar radiation pressure causes periodic variations in all orbit elements. For satellites below 800 km altitude, acceleration from atmospheric drag is greater than that from solar radiation pressure. Furthermore, all calculations confirm that with our spacecraft’s mass and life time, it will go back to Earth alone at its life end; therefore, no thrust is needed to deorbit it in order to avoid creation of debris.
• We assume that the launcher or other chemical propulsion systems will supply the insertion in selected orbit. This way is commonly used for microsatellites in LEO.
• We must guarantee that the orbital parameters are going to be within certain constraints during the whole mission in spite of disturbances. However, if we
90

CASSIOPEE
have excessive stability it will take a lot of energy to change the satellite’s position or orientation.
Some typical solutions for microsatellites (attitude actuators) can be seen in Table 4-5. Satellite Actuators Name Orbit Mass Size Type Characteristics Safir 2 SSO
850 km 65 kg 500*500*500mm 3 Magnetorquers
+Gravity gradient boom Accuracy = ±10°
Tubsat SSO 726 km-98.4°
44.8 kg 320*320*320mm 3 Reaction Wheels + Magnetorquers
1 W per Wheel < 1 kg per wheel 80*80*70mm per Wheel
Tsinghua-1 50 kg 330*330*640mm 3 Reaction Wheels + 3 Magnetorquers + Gravity gradient boom (back-up)
HETE-2 625 km-circ 135 kg h850mm φ660mm
3 orthogonal coils + 1 Momentum Wheel
1800rpm
Thai-Puhtt SSO 772 km-98°
70 kg 3 Magnetorquers + 1 Momentum wheel dual redundant + pressurized cold gas
∆V=7 m/s Nitrogen at 400 bar 4*0.1 N thrusters
Table 4-5: Comparison of microsatellites in term of actuators
All systems listed in the previous table are based on the three-axis control instead of spin. The main reason is that spin control requires a strict distribution of mass in order to maintain the stability (extra-cost) and also constrains the instrument. In addition, a three-axis concept gives us a more versatile bus that can be easily be adapted to other payloads and missions. We classify the different possible actuators using the Figure 4-17:
91

CASSIOPEE
AOCS Actuators
Gyro Stiffness Single/Dual
Gravity
Geomagnetic
Momentum
Thruster
Wheels
Magnetic
Boom
Chemical,
Figure 4-17: Classification of AOCS actuators
The main drivers to select the best-adapted system are the reliability, the pointing accuracy, the mass/power tandem and the cost. First, we have pushed away from a system-based design that includes thrusters only, such as cold gas or electric technologies. Electric systems need a relative high power, with some exceptions, for example the colloid or MEMS technologies which are not demonstrated yet1,3. In addition, a design trade-off was made to estimate the required Ibit (thrust during time). It concluded that CASSIOPEE needs about 10-4 Ns for attitude correction, which is typically in the range of cold gas thrusters. We decided not to use booms because they impose a lot of constraints on the project such as:
• Structural constraints, • Restrictions on the mission (Nadir pointing, dimension of the launcher), • Usually heavy mass and vibration problems (flexible structure), • Low accuracy.
The main disadvantages of orthogonal coils (magnetorquers) are the difficulty to three-axis stabilize and the inaccuracy in Earth’s magnetic field models. Indeed, roll axis is easily controlled, but it is more difficult for the yaw and pitch axis. Furthermore, the pointing ability is really dependent of our magnetic field knowledge. On the other hand high reliability, small mass and power are main advantages. Finally, based on the principles of the angular momentum, wheels are often used because they have the advantage of being very precise, they don’t increase the complexity of the spacecraft, they don’t require consumables and the cost is
92

CASSIOPEE
reasonable. The trade-off is that they need an additional system to unload them. Thrusters or magnetorquers are usually used. Our choice for CASSIOPEE We have decided to associate wheels with magnetorquers so that the magnetorquers can provide a rough control and a momentum in order to discharge the wheels. This system will provide some redundancies in the sense that if we have a failure in the wheel system, we will still be able to operate only with magnetorquers (with less accuracy though). In case we have a failure of magnetorquers we can still operate with the wheels, but with some sacrifice on the mission life. Based on our trade-off analysis2, we have determined the main characteristics of the wheels and especially the required angular momentum (H=0.22 Nms), we have then used a database from ZARM listed in Figure 4-18. DR01 (Teldix GmbH) Mass: ~ 1kg per wheel Power: ~ 1W per wheel Dimensions: φ80 x h70 mm Angular momentum: 0.1 Nms Max speed: 5000 rpm Reaction torque: 0.06 Nm Temperature: from –15 to 55°C Used in German Tubsat
Courtesy of ZARM
Courtesy of ZARM
MT6-2 (ZARM) Mass: ~ 0.312kg Power: ~ 0.36W per magnetorquer Dimensions: L321 mm Max dipole: 8.5 Wbm Linear dipole: 6 Wbm Temperature: from –40 to 60°C Used in Canadian Quicksat
Figure 4-18: Characteristics of AOCS actuators
To conclude the selected system for CASSIOPEE, actuators provide a good three-axis stabilization. It allows an easy integration on the platform and could therefore lead to a standardisation of platforms for many different instruments in LEO. We have used proven technology and available industrial products because they bring the best answer to our requirements in terms of reliability, power, mass and cost. Our choice has a weak point, because we have assumed that there is no need for translations of the satellite. A way to reduce this weakness is to add one additional
93

CASSIOPEE
thruster system to provide us with a linear degree of freedom allowing the displacement of the spacecraft. Since this system is risk mitigation for our model we can afford to try a revolutionary system that is not certified yet. CASSIOPEE could be an opportunity to have this technology tested in space. We estimate the value of the drift at 25m per orbit, which gives us 4.2E-03 m/s of ∆V per orbit. Assuming a life of 5 years the total required ∆V for correction is about 114 m/s. For a spacecraft of 55 kg on a drift of 4.2e-03m/s of ∆V per orbit, an engine with an Impulse bit (Ibit) smaller than 0.23 Ns will provide us a continuous correction throughout the orbit. The requirement for the lifetime is given by 114 m/s of total ∆V. These two requirements can be fulfilled by colloidal micro thrusters1,3 based on new microtechnology because they need less power (0.5-1W), Isp is quite high (450-1350s), Ibit is sufficient (10-8 Ns), the ∆V is adequate (100-300 m/s) and the mass of this kind of non demonstrated technology is small (0.5kg). We suggest to put two modules of thrusters on the main correction axis in opposite directions. They can also provide redundancy in the sense that we can fire just one thruster and turn the satellite 180° and fire it again to stop CASSIOPEE in any needed correction.
Stanford University microthruster (under development) Mass: ~ 0.5 kg (per module) Power: ~ 0.1 W (per module) Isp: 500 s
Dimensions: 100 x 100 x 200 mm Thrust: 1 µN
Figure 4-19: Courtesy of AFOSR & DARPA University Nanosatellite Program
The summary of technical characteristics for AOCS actuators for CASSIOPEE is given below:
CASSIOPEE AOCS Actuators Mass Budget 4.936 kg Power Budget 4.280 W Cost Estimation 100 kEuros
Table 4-6: CASSIOPEE budgets for AOCS actuators
4.5.2.4 Power
4.5.2.4.1 Power subsystem overview The power subsystem of a spacecraft can be subdivided into three main components:
• Primary power generating unit (e.g. solar energy); • Power management unit and distribution system, and; • Energy storage unit.
94

CASSIOPEE
The main driver for sizing the power subsystem is average and the peak power consumption of the payload at end of life of the satellite. In doing this, we take into account the degradation of the power subsystem over time (loss of solar array efficiency and battery degradation). We can then assure that even after several years of mission, the power generated will still be sufficient to fulfill the mission objectives.
4.5.2.4.2 Power system selection and design Several types of power generation systems exist. For our mission, the best choice is to use solar array as the main power generation system and batteries as power storage system.
• Identify requirements o These are the top-level requirements: mission life, orbit, and payload
definition • Select and size power source
o Considering mission type, average require power, and spacecraft configuration
• Select and size energy storage o Considering average and peak power requirement
• Identify power regulation and control o Considering mission life, power source requirements, and thermal
control requirements A. Solar array Based on preliminary power analysis, we have chosen to use thin film solar cells currently under testing at both NASA and Uppsala University, Sweden. These cells will be covering the entire outboard and side faces of the satellite. This will produce at least 80 W of power when in sunlight, which is more than enough power to support all functions and battery charging requirements. The characteristics of these solar cells are as follows: very high efficiency (>16%), a very high power density, and a medium resistance to radiation. These cells are still under development but should be industrially produced soon. B. Batteries The main characteristics of the battery system are:
• Depth of discharge; • Lifetime, and; • Number of charge discharge cycle.
Refer to Table 4-7 for information regarding the comparison of different battery technologies. (http://www.aa.washington.edu/courses/aa421/aa420_files/class_notes/power.pdf)
95

CASSIOPEE
Table 4-7: Battery characteristics
The secondary power system for our satellite consists of Lithium Ion-Polymer batteries. Batteries are intended to be used during eclipses, which are relatively short-lived (17 minutes maximum) for dawn-dusk sun-synchronous orbits. Modern Lithium Ion-Polymer batteries provide about 950mA/h for a weight of 20.5g, which makes a very small and optimised power system feasible on a microsatellite. This technology is still under development and has never been tested in space environment, but their characteristics are very promising. However, the long ‘rapid charge time’ for this kind of batteries is an issue and needs further studies to fully understand all of the implications.
C. Power regulation and control To regulate and distribute the electrical energy through the power bus of the satellite, we use a series connected boost converter. These are composed essentially of a DC-to-DC converter.
Figure 4-20: Power control unit schematic
96
CASSIOPEE
The design concept for the power control unit, illustrated in Figure 4-20, is based on designs with heritage from numerous satellites. When the sun illuminates the solar panels, they set the bus voltage. Power is also supplied to the Lithium Ion-Polymer batteries during this period in order to charge them through the Battery Charge Regulator (BCR). Peak power tracking is included in this scheme. A controller must operate in a loop with a DC-to-DC converter and controls the regulator in such a way as to manipulate the input voltage to the regulator.
4.5.2.4.3 Electric propulsion requirement In order to use the colloidal thruster propulsion system we need a high voltage power conversion unit. The propulsion system requires a power of 1W but a voltage of 6kV. This device is basically a transformer; the biggest problem with this kind of device is the corona effect. This phenomenon can cause electric arc between conductors, because of the air pressure decrease when going from ground level to space vacuum. Two solutions exists to address this problem:
• Turn off the high voltage equipment during the launch phase and the outgassing periods of the satellite.
o This method is the safest, but not always practical, due to the possibility of not being able to switch on the instrument once in space.
o This equipment is not a vital part of CASSIOPEE mission and therefore this solution can be acceptable.
• Design the instrument in a way to avoid power surges.
o Typically this is achieved by designing the power circuit with additional shielding against a power surge.
o Since the mass of the total spacecraft is one of the main drivers of the CASSIOPEE mission, this solution might not be the best choice.
In all cases handling high voltage require several precautions:
• Assure a good separation of high and low voltage circuitry. • Protect low voltage sections against high ampere power surge. • Isolate ground to provide a way to predict the currents path when arcs occur. • Allow venting of enclosed volume and vent paths open. • Round off all metal edge.
4.5.2.4.4 Power requirement summary Table 4-8 outlines the estimated satellite power budget. The AOCS include Sun Sensors, Gyros, Communication, Payload, Magnetometers (MGN), Star tracker, GPS receiver, and Reaction/Momentum wheels. The breakdown of the different components of the AOCS is shown below in tables 4.8 and 4.9:
97

CASSIOPEE
AOCS 28.4 W (nominal)
Structure 0 W Communication 1 W
Payload 20 W OBDH 3 W
Thermal 10 W Power 1 W
Table 4-8: Satellite power budget
Sun sensors 0 W
Gyros 12 W MGN 0.01 W
Star tracker 10 W GPS 2.1 W
Magnetorques 1.08 W Reaction Wheels 3.0 W
Colloidal Thrusters 0.2 W
Table 4-9: AOCS power breakdown
The main data are listed below,
• Peak Power consumption 74.1 W. • Nominal Power consumption 44.1 W. • Peak power from Solar Arrays, 80W when in full sun. • The solar arrays mounted on the spacecraft are providing 14V. • Rechargeable batteries are provided to power the spacecraft during eclipse,
producing 12V during discharge. • A battery charge controller circuit. • Solar array peak-power tracking circuitry, for each solar array panel. • A voltage regulator to provide power at ± 5V. • A set of power-switching circuitry, to provide 12-14V and ± 5V power
through a number of computer-controlled switches, each equipped with a maximum-current shut-off capability.
4.5.2.5 Thermal
4.5.2.5.1 Operational environment overview To assure reasonable functioning conditions for all the equipments and payload in the extreme environment of space, extensive work must be done on the thermal design. For an appropriate thermal analysis and design of the spacecraft, the orbit is of great importance. Due to possible variations in the geometry of the orbit, the thermal analysis should be repeated for any change in the orbital parameters.
98

CASSIOPEE
The CASSIOPEE mission will be put in Low Earth Orbit (LEO), in a sun synchronous orbit. Given these conditions, the satellite will receive radiation from different sources:
Figure 4-21: Diagram showing spacecraft heat balance
• Direct solar radiation: on average 1350 w/m2 (± 5% along the orbit of the Earth around the sun) mainly in the 500-550 nm wavelength.
• Albedo radiation from the Earth: caused by reflection of the solar radiation over the earth. The average value along one orbit around the earth is 34 % of the direct solar radiation. The wavelength is identical to that of the direct sun radiation.
• Thermal emissivity of the Earth: the thermal emission of the Earth is mainly in the 10- 12 micrometer wavelength. The thermal emission value is comprised between 30 and 230 w/m2.
We must also add to these figures the thermal emission of the equipment inside the spacecraft itself. The computer and the power regulation unit are usually the most heat dissipative equipment in a spacecraft.
4.5.2.5.2 Technology overview It is possible to use three different kinds of heat transfer to ensure the temperature equilibrium inside the spacecraft. These are described here:
99

CASSIOPEE
• Convection: Cannot occur in space, however it is possible to use heat pipes whose working principle is convection. This method will not be used in our design due to the lower reliability of these devices as well as a higher costs involved.
• Conduction: Conduction will be taken into account, but will not be the main driver of the thermal design. Conduction can only occur between two materials in contact inside the spacecraft.
• Radiation: This will be the preferred choice for our thermal design. Radiation is the only way of transferring heat without any medium.
Radiation remains the only way of heat rejection out of the spacecraft; it will be characterised for each surface by emissivity, absorptivity, and reflectivity factors.
Passive Semi-passive Active Thermal coating
Paint Metallized tapes
Anodised, sputter or other coating techniques
Heat pipes Heaters Resistances
Isotope
MLI blankets Capillary pumped loops Thermostats and temperature Controllers
Radiating surfaces Louvered radiators Pumped coolant loops with cooled plates and radiators
Phase change devices Evaporative cryogenic Dewars
Cryocoolers
Table 4-10: Overview of the different techniques for thermal control
To reduce complexity and possible failures, the thermal control of our spacecraft will use as many passive controls as possible:
• Thermal insulation: such as Multi Layer Insulation (MLI) must protect the spacecraft from excessive heating or cooling, whilst still allowing the internally generated heat to be rejected.
• Passive systems for cooling: such as radiators (very high emissivity panel facing the cold space). The parts facing the dark space can be exposed to extreme temperatures as low as 4 degrees Kelvin.
• Active systems for heating: heaters are used to keep equipment within specified temperature ranges throughout all mission phases, including eclipses. The orbit of the spacecraft (sun synchronous - 600 km alt.) implies for some of the orbits a maximum eclipse time of 17 minutes.
• Variable emittance panels: only to be used if required. These panels are very new and innovative technology and can provide a very precise and simple way to control the satellite temperature.
The small satellites, given their low mass, do not have much thermal inertia and, therefore, are often difficult to thermally control with traditional means such as the first three methods.
100

CASSIOPEE
Temperature control is achieved by a combination of thermostats with thermistor surveillance and thermistor-guided software control. Except for the variable emittance panels, all technology discussed here is well known and proven.
4.5.2.5.3 Specification for our spacecraft • Average temperature between -20 and +45 ° C inside the spacecraft. • Instrument/payload temperature range must be 70 to 100 Kelvin • The solar panels must be kept as cool as possible (under 100°C) for efficiency.
4.5.2.5.4 Thermal analysis flow plan • 1. Identify thermal environments and interfaces with other systems. • 2. Determine component/subsystem temperature requirements. • 3. Perform preliminary analysis.
o Simple finite difference models, hand calculations o Work with design and structural on key thermal interfaces
• 4. Component/subsystem development tests if needed. • 5. Performed detailed thermal modelling and analysis. • 6. Presentation of design and analysis results to customer. • 7. Perform qualification tests to demonstrate requirement compliance (and
margin). o Thermal-vacuum o Thermal cycling o Temperature withstand
• 8. Update detailed thermal model. • 9. Document analysis and test results.
For our satellites, view factor calculation (i.e. the difference in heat flux from the different sides of the spacecraft) will be easy, due to the simple box shape concept. It will nevertheless be necessary to do a complete computer analysis to verify the thermal design with software such as ESATAN or ESARAD. To complete and confirmed the result of the numerical analysis, tests in vacuum chambers must also be implemented.
4.5.2.5.5 Non-thermal requirements All external surfaces, including the solar cells, blankets, and radiator will be finished with an electrically conductive Indium Tin Oxide (ITO) coating to comply with electrostatic requirements.
4.5.2.6 Structure
4.5.2.6.1 Introduction to structures Satellite structures can be divided into three basic categories: primary, secondary and tertiary structures. This section of the report will briefly describe these three types, provide some background information on the structural options, and then give the recommendations of the Structures team for CASSIOPEE spacecraft.
101

CASSIOPEE
The primary structure of a satellite is one of the most basic and critical subsystems in the design of a spacecraft. It is often referred to as the ‘backbone’ of the satellite because it provides the strength, stiffness, rigidity, and an interface with the launch vehicle to directly receive the loads and vibrations transmitted during launch. Secondary structures consist of mounting platforms, support beams, and mechanisms for deployable structures such as antennas and solar panels. The final type of structure, the one that is most often overlooked, is the tertiary structure. It consists of brackets and housings for the subsystems to integrate onto.
4.5.2.6.2 Factors for CASSIOPEE structure The concept of the structure for the CASSIOPEE spacecraft shall allow the most efficient and effective combination of all subsystems into the completed design while satisfying the mission requirements. Several factors had to be considered when selecting the most favourable structure for the CASSIOPEE spacecraft. The selection process needed to assess factors such as the structural configuration or shape, materials, cost, manufacturability, strength and stiffness, thermal characteristics, potential risks, tooling costs, and build time. Therefore the Structures team investigated various options, especially those already in use in existing microsatellite technologies, and determined a set of candidate options suitable for CASSIOPEE. It is also important to add that much iteration was made, to final arrival at a completely integrated design.
4.5.2.6.3 Structural configuration options The Structures team initially evaluated basic spacecraft types such as gravity gradient, 3-axis, and spin stabilized and compared them with the requirements of the payload and the CASSIOPEE mission. Gravity gradient type spacecraft have seen some use in microsatellites and were initially looked into for the CASSIOPEE mission. However, their ability to provide an accurate pointing platform for the CASSIOPEE payload was a concern. Other types of spacecraft such as 3-axis stabilized were a better candidate for providing a more suitable platform. Spin stabilised satellites are usually of a cylindrical shape and often decoupled into two separate spinning assemblies, an inner and outer assembly. For a microsatellite, the mechanism required to support spinning assemblies detracted from choosing this type of spacecraft for CASSIOPEE. Research on these types also indicated that the majority of the spacecraft mass is typically found in the outer portion of the spacecraft. This may prove difficult for CASSIOPEE since the payload, which composes a significant portion of the spacecraft mass, needed to be stable at the centre of the satellite. Other more exotic configuration types for spacecraft were also researched including inflatable structures. However these appeared to still be of an experimental nature with much higher risks than traditional spacecraft stabilization designs. Therefore, we selected 3-axis stabilization for CASSIOPEE.
102

CASSIOPEE
4.5.2.6.4 Material options Although satellite structures have traditionally only accounted for about 20 percent of the spacecraft total dry mass, significant weight savings may be gained in the proper selection of materials, especially for micro satellites. Wide selections of material are available for building microsatellite structures. In addition to common machined aluminium structures, microsatellites made of composite materials such as carbon or KevlarTM offer a favourable spectrum of characteristics including low weight and high stiffness and strength. Complexity of fabrication, cost and required support equipment were additional factors that had to be compared and evaluated. Structures made of aluminium-lithium alloys, metal matrix composites, and precision-machined processed aluminium structures were also looked into by the team. After reviewing the various options, we narrowed the material choices to two candidates: an aluminium-lithium structure or a carbon fibre composite structure. As a weight-saving alternative to conventional aluminium structures such as 2090 and 2014, aluminium-lithium alloys may be able to provide immediate weight savings of 7 to 20 percent while providing a fair increase in stiffness and strength for some alloys. Types of aluminium-lithium alloys currently available include, WeldaliteTM and alloys 2090 and 8090. Although aluminium lithium alloys are appearing in launch vehicle designs, they have not yet been widely used in microsatellite structures. This may be due to an inherited characteristic for increased toughness at cryogenic temperatures. Although this property is attractive for launch vehicle cryogenic tanks, the CASSIOPEE spacecraft would not benefit as much from this characteristic. Carbon-carbon composites also offer very good weight savings, often with densities as low as 1760 kg/m3 with exceptionally high stiffness and strength characteristics resulting in a modulus of elasticity of 300,000 MPa. Carbon-carbon composites are finding wider use in micro-spacecraft applications due to these characteristics. When compared with traditional aluminium structures, spacecraft designers are now able to decide between a lighter structure of similar material thickness with increased strength and stiffness, or a thinner material thickness of equivalent strength and stiffness but much lighter.
4.5.2.6.5 Selected structure for CASSIOPEE spacecraft Based on the above evaluations of structural configurations, materials, and the needs of other subsystems, the Structures team was able to determine the most suitable design for the structure of the CASSIOPEE spacecraft:
• Box-shaped configuration (3-axis stabilization) • Approximate dimensions of 40 cm x 50 cm x 60 cm • Carbon frame truss structure • Panels of carbon composite, 1 mm thickness
These features will provide exceptional stiffness, strength, and shock qualities that will satisfy the mission requirements. In addition, the estimated weight of this structure assembly is expected to be only 3 kg.
103

CASSIOPEE
To fabricate the carbon composite truss structure, a mold of the desired shape will first be fabricated from aluminium. Carbon composite fibres will be layered onto the aluminium mold with each layer orientation along an alternating axis. Using multiple layers with varied orientations will allow a structure capable in strength and stiffness in all directions. Once the multiple layers of carbon have been applied to the aluminium mold, the structure will be placed in an etch bath to dissolve the aluminium and leave a completed one-piece carbon composite structure of the truss. Panels of carbon composite will also be used across all six sides of the box-shaped structure (with planned cut-out areas to support subsystem components such as payload and attitude control optics). Approximately ten layers of carbon fibre will be layered in varied orientations to provide panels of omni-directional strength and stiffness characteristics. Sufficient stiffness is provided by this structure to place the eigenfrequencies at approximately 120 Hz. This should be adequately decoupled from the highest advertised frequency generated by the selected launch vehicle. Testing to validate these estimates will be performed per the following section. Team members experienced in Computer Aided Drafting (CAD) software were able to take the above inputs (as well as inputs from other subsystems) to draft a computer simulation of the CASSIOPEE spacecraft design. Based on these assumptions we’re also able to present the preliminary assessment of the mass budget table, which is the following:
subsystem Mass (nominal) AOCS 10.4 kg
Structure 5.0 kg Communication 0.6 kg
Payload 15.0 kg OBDH 1.5 kg
Thermal 2.5 kg Power 14.0 kg
Table 4-11: Satellite mass budget
104

CASSIOPEE
Figure 4-22: CAD simulation of CASSIOPEE structure
Moving structural mechanisms were determined not to be necessary in support of other subsystems. Available areas on the surfaces of the box structure were assessed to be able to provide sufficient electrical power without the addition of deployable solar arrays. No other moving mechanisms such as communication or payload support devices were required.
4.5.2.6.6 Future work - structure validation testing In the next phases of this project, structural characteristics such as eigenfrequencies, shock levels, and subsystem component fit compatibility will be validated using Finite Element Modelling (FEM) and limited physical testing on one of the three flight models. Using FEM analysis of the proposed design, a structural static test and a dynamic analysis will be performed. The structural static test will model and identify the overall resistance and deflection of the structure as a simulated load is applied. It will also identify the weak points of the structure and validate the minimum margin of safety. A dynamic analysis will also be performed using the FEM tool to estimate the eigenfrequency of the structure. Once the FEM analysis has been completed and any necessary updates incorporated, a physical validation test will be performed on one of the three CASSIOPEE flight models. In lieu of performing a costly full-scale test scenario at a major test facility, an abbreviated vibration and acoustic test will be performed at a university to be selected to validate the predicted characteristics. The testing will not be performed at
105

CASSIOPEE
loads or levels that reduce the integrity or useful life of the CASSIOPEE structure. It will only be used to validate or revise as necessary the estimates for the true structural properties. To verify component level fit checks and wire routing, visual inspections will be used during the assembly process to validate component compatibility and dimensional properties.
4.5.2.7 On-Board Data Handling system On-Board Data Handling System (OBDH) is the centre of data acquisition, classification, storage and distribution on-board a satellite. It is also a manager of the satellite resources, operation status, task schedule, and fault process strategies.
4.5.2.7.1 Requirements The OBDH provides other subsystems and payloads with a series of services, which include command, telemetry, data transfer, on-board time maintenance and distribution, data storage, and satellite operation management. The satellite commands include telecommand, which the ground station sends to control the satellite, and onboard management commands, which is produced by the OBDH itself to manage the on-board operation procedures. The OBDH provides two kinds of command channels, i.e. on/off command channels and memory load command channels. The on/off command channels output single impulse to switch application devices, such as relays or electronic circuits. The memory load command channels output binary bit streams which carry special control message to application process. Both of the on/off command and memory load command can be immediately executed and/or time programmed. OBDH collects the telemetry data, such as analogue signals, double level voltage signals, binary bit stream, from the other subsystems and payloads. The OBDH converts the analogue signal into digital data, organises all of the telemetry data and forms a download telemetry data flow according to a specific data format. The OBDH provides data transfer links from onboard subsystem/applications (payloads) and ground stations/applications (users) in two directions of uplink and downlink. Users can transfer any data they need, including computer programs upload and memory data download, though the data transfer links. Onboard time is very important to many space missions. For example, the remote sensing data should be marked with the time stamp to identify the sensed target. The OBDH is in charge of maintenance an on-board time and provides it for other subsystem/applications (payloads). The on-board time should be able to be compared and adjusted to consist with the ground time standard. Generally the data storage capability is required for a remote sensing satellite. The remote sensing data that are acquired in orbit flight will be stored into memory at first, and then downloaded to ground stations when the satellite flies over them. The OBDH has a service of payload data storage and download.
106

CASSIOPEE
The OBDH has also on-board operation procedure management functions, including power control/distribution, thermal control, fault process, etc. In addition, for microsatellites the OBDH design requirements must satisfy the need of low cost, low mass, and low power consumption.
4.5.2.7.2 Allocations The OBDH allocations are as below:
• Data storage capability: 2GB (including 1GB for redundancy); • Space link data rate: 2Kb/s for uplink, 1Mb/s for downlink (coded, 512 Kb/s
uncoded); • Redundancy strategy: 2 computers and 1 data bus. • Power consumption: 3W; • Weight: 1500g (embedded remote units not included).
4.5.2.7.3 Architecture The OBDH consists of CPU board, embedded remote terminal unit (RTU), data bus, telemetry (TM) interface, and telecommand (TC) interface. The OBDH architecture is shown in Figure 4-23.
TML Interface
TC Interface
CPU Board
CPU Board
To Transponder From Transponder
Data Bus
Embedded RTU
Embedded RTU
Embedded RTU
……
Figure 4-23: System level interface diagram for OBDH
The CPU board is the centre of the OBDH and accomplishes most of data handling tasks. It also includes memory for payload data storage and a clock to produce onboard time. Actually, one of the two CPU boards is on duty and the other is standby. The CPU board can be switched by telecommand. The TC interface receives uplink data flow from the transponder. It identifies and decodes the direct telecommand and outputs electric impulses to the relevant channel, then delivers the other uplink data to the computer board. The direct telecommand has high reliability because it does not pass through the computer, data bus, and RTU. Therefore it can be used to switch the critical onboard devices, such as the CPU
107

CASSIOPEE
board. The telemetry interface converts CPU outputs data into a continuous binary bit stream, which is transmitted by the transponder. The embedded RTUs are the interfaces between the OBDH and the other subsystems. They can send both on/off and memory load telecommands to, and acquire telemetry data from, the other subsystems and payload. The RTUs are embedded into relevant subsystems and payload, instead of having independent construction. The data bus connects the CPU and all of the embedded RTUs and provides a data transfer link between them.
4.5.2.7.4 Data bus The data bus MIL-STD-1553B is most widely used onboard spacecraft, but one of its obvious cons is its high power consumption, especially for microsatellites. An alternative is the Controller Area Network (CAN bus). According to the ISO 11898 standard, its data rate is up to 1Mb/s, and the bus controller has very low power consumption. One of the outstanding features of the CAN protocol is its high transmission reliability. The CAN controller registers a station’s error and evaluates it statistically in order to take appropriate measures. These may extend to disconnecting the CAN node producing the errors.
4.5.2.7.5 Processor The desired processor for OBDH should be low cost, low power consumption, high performance, high reliability, and commercial real-time operating system-supported. There are numerous choices within the Hitachi SuperΗ family of RISC processors, and the SH7709 seemed to be a good choice. It is inexpensive, computationally robust (80 MIPS), consumes little power (330 mW), and fully supported by VxWorks. The SH7709 also provides three serial interfaces, two of which are buffered, and a large number of input/output ports for digital interfacing.
4.5.2.7.6 Fault tolerance strategy The single event failure is not allowed in the OBDH, because the OBDH is a critical part of the satellites, which has quite long lifetime of 3 to 6 years. Therefore redundancy is necessary. The OBDH uses two computers, one of them is on duty and the other is standby. They are switched by telecommand. Considering that the CAN bus has high reliability and the measures of fault process, the OBDH only uses one data bus.
4.5.2.7.7 CCSDS standard CCSDS (Consultative Committee for Space Data System) is achieving dominance as the basis for telemetry and telecommand communication protocols. While CCSDS is most readily viewed as a set of standards for the transmission of data between a spacecraft and a ground system, its utility easily extends to the implementation of interfaces between spacecraft subsystems. Hence, methods for implementing CCSDS-based spacecraft-to-payload application data protocols over the CAN bus protocol are needed.
108

CASSIOPEE
The CCSDS “standards” are actually not standards at all, but rather recommendations generated by the international committee. However, many of the recommendations have become International Organization for Standardization (ISO) standards, and many space agencies adopt the CCSDS Recommendations as their own agency standards. The basic elements of the CCSDS standards consist of formats for telecommand and telemetry packets and frames. CCSDS also proposes standards for items such as time formats and data compression algorithms. When dealing with end-to-end protocols (spacecraft to ground to end user), additional concepts are needed to ensure reliable transfer such as data encoding and telecommand verification protocols. These concepts are also addressed by CCSDS. The CCSDS telemetry and telecommand standard is patterned after the familiar ISO layered network model. However, in the design of OBDH protocols within the confines of the spacecraft itself, the packetisation and segmentation layers are paramount and, in some applications, portions of the transfer layer as well.
4.5.2.7.8 Software The OBDH software will be based on a commercial real time operating system. One of the available choices is VxWorks. It is widely used and has a very well developed environment. The application software is divided into a series of processes, each of which completes an independent function. The onboard software has a capability of on-orbit modification. Whenever the payload operation requirement is changed, some fault process is needed, or a fault of onboard software itself is discovered, the software can be modified easily. In these cases, some of the processes can be suspended, and some of new ones can be uploaded and activated. The other concept on the OBDH software is reusability. The software should be designed as generalized and modulated, so that it can be used in different satellites without, or with as little as possible, modification.
4.6 Operation
4.6.1 Launch Often some of the greatest expenses (and risks) of implementing a satellite program are associated with the launcher. Therefore, a detailed selection process should be performed of all available launchers based on parameters such as launcher capability, cost, risk, availability, and sometimes the political environment. This section provides a brief overview of the launch vehicle selection process, the resulting recommended launcher, and two backup choices if the primary choice becomes unavailable or unfeasible. This study only provides an initial assessment of these launchers, therefore a more detailed analysis is part of our recommended next steps. (See Section 8). The launcher team relied on a set of basic assumptions for properly selecting the launcher. These assumptions included the following:
109

CASSIOPEE
• Spacecraft required to be placed to 600 km altitude • Sun-synchronous orbit of 97.79° inclination • All 3 satellites preferably to be launched at the same time on a single launcher
for minimizing cost • Spacecraft mass of 55 kg each and approximate size of 400 × 500 × 600 mm
each • Additional weight for dispenser/adaptor assumed to be approximately 85 kg
(resulting in 250 kg total for 3 spacecraft, dispenser and adaptor) • Each satellite will have a minimal propulsion system to assist orbital
placement The launcher team decided to recommend using a dedicated small launcher as opposed to larger vehicles with secondary payload capability. This is primarily due to the limited availability of large vehicles with secondary capabilities launching to the CASSIOPEE orbit. In addition, waiting for large vehicles to launch may provide only one or two slots to be launched at a time and not the required three spacecraft. Therefore, unless an available large launcher suddenly becomes available, it is recommended that the CASSIOPEE team assume purchase of a dedicated small launcher.
4.6.1.1 Selection process The primary means for selecting the proper launcher was through use of a screening process that assessed existing launchers with respect to cost, performance capability, and reliability. Of an initial selection of 74 launchers from 9 different countries, an initial scan of the estimated costs was performed using the ‘International Reference Guide to Space Launch Systems and the Internet’. Launchers with estimated costs much greater than $20M were immediately removed from the list. The remaining launchers were then assessed for their performance capabilities for reaching the desired sun-synchronous orbit at 600 km. Each launcher’s detailed capability to deliver the three spacecraft at once was considered. This also included evaluations of the launchers’ available envelope inside the fairings (see Table 4-12). Although the Pegasus XL launcher was suggested in previous design reviews, further investigation revealed that its payload capability of just less than 250 kg was marginal when considering the possible additional mass of a 3-satellite dispenser (which is currently not available for Pegasus). In addition, the available payload envelope required for three CASSIOPEE satellites appeared to be constricting. Future evaluations of available launchers should revisit the Pegasus XL capabilities. The reliability of the remaining launchers was also evaluated. Three launchers, two with previous launch experience and one with no launch history, were chosen. The final choices and their technical characteristics are listed in Table 4-12.
110

CASSIOPEE
Vehicle Rockot Vega Kosmos 3M
Performance SSO [kg] 1000 1000 (LEO) 775 Cost Max M$ 15 20 12 Cost Minimum M$ 13 20 12 First Flight 1994 2005 1967 Total Orbital Flight 1 N/A 420 Launch Vehicle Successes 1 N/A 398 Reliability 1 N/A 0,947619
Table 4-12: Launcher characteristics
4.6.1.2 Launcher selection A Russian launcher, Rockot (Figure 4-24a), was selected as the recommended choice for the CASSIOPEE mission through an assessment of cost, performance capability and reliability. The Rockot was also favoured for its Breeze M upper stage. The Breeze M has attitude control thrusters and multiple restart capability that could assist the spacecraft in reaching their orbital destinations. Two additional launchers, Vega and the Kosmos 3M (Figure 4-24b and Figure 4-24c) launch vehicles, were recommended as backups to Rockot. Their ability to lift the spacecraft to orbit was capable and their payload envelopes appeared to be sufficient. Multiple restarts (more than two) did not appear to be available for these launchers, therefore more reliance may be required of the spacecraft propulsion systems or of the dispenser system. Due to the dynamic state of the launch vehicle industry, a follow on assessment of launchers should be performed in the future to evaluate the current state of vehicles. Reliabilities change as launchers consistently operate (and occasionally fail) as well as an increasing selection of new vehicles from which to choose. Details of available dispenser and separation systems should also be reviewed in further detail in conjunction with potential launch service providers. Finally, it is the recommendation of the launcher team that once the launch vehicle selection has been re-verified and go ahead given for CASSIOPEE, the details of the top candidate launchers be solicited via the bidding process. After which, a final selection can be made based upon bids that include contractual details of how the launcher services provider can best support the CASSIOPEE mission.
111

CASSIOPEE
(a)
(c)
(b)
Figure 4-24: Launch vehicle options.
Clockwise from left-top: • ROCKOT http://www.csr.utexas.edu/grace/; • Vega http://www.esa.int/; • Kosmos 3M http://www.friends-partners.org/mwade/index.htm.
4.6.2 Ground segment
4.6.2.1 Mission control centre
4.6.2.1.1 Introduction The following are the four critical functions carried out by mission control centre (MCC):
• Maintain communications with the spacecrafts to receive telemetry from them, transmit commands to them, and schedule and receive data from remote stations, if there is network for TT&C. Communications are accomplish through a communications network that links remote command, telemetry and tracking stations with the MCC.
112

CASSIOPEE
• Determine the state of spacecraft, especially its health, from spacecraft housekeeping data.
• Generate command messages to be transmitted to the spacecraft that that will determine the future states of the spacecraft to maintain its health.
• Archive the telemetry data, covert it to engineering and operationally meaningful data and archive and transmit the processed data to the users.
Tasks carried out at the MCC may include the following:
• Anomaly evaluation • Attitude determination and control • Data distribution • Guidance and trajectory control • Orbit determination • Periodic reports of status • Power budgeting • Subsystem evaluation • Telemetry processing • Thermal monitoring • Time synchronization of spacecraft and remote TT&C stations
Nominal commands messages are prepared at the MCC, sent to a TT&C station and than transmitted to spacecraft. Usually a limited number of backup commands are also ready for transmission that will place the spacecraft in a safe mode to allow time for troubleshooting. In some cases the payload operations and control centre are together and constitute a MCC. In this case the working area generally includes:
• Display of spacecraft health • Display of the spacecraft trajectory and ground track(s) • Display the operational status of ground stations and significant systems • Computer simulations or simulators of the major and critical subsystems • Terminals and displays for supporting data processing facilities.
A communications network controlled by a satellite communications centre is required to ensure communications between remote stations and the MCC. This network must be able to handle the following:
• Voice circuits for communication between remote station and the MCC. • Data and video circuits for experimental data • Data circuits for telemetry and command messages • Data circuits to perform tests • Voice circuits for astronauts on manned missions. • High – priority data, especially to support spacecraft operations are generally
needed in near real time, so dedicated terrestrial and submarine cables, microwave relay and satellite communications link are used.
113

CASSIOPEE
4.6.2.1.2 Existing facilities We analysed the ESA infrastructure, ESOC (European Space Operations Centre) for TT&C network, in order to use one station for TT&C in our project. ESOC is located in Darmstadt, Germany. This is mission control for most ESA space projects and it typically juggles half a dozen at a time via a worldwide network of tracking stations. During project planning, ESOC advises on the orbits and ground links. Hazards of space debris - the many thousands of fragments of space hardware that orbit the Earth - are also ESOC’s concern. The ESA ground station network (ESATRACK) is used to support TT&C operations (Telemetry, Tracking and Commanding) for a specific satellite mission or mission phase. It comprises five ground stations in Redu (Belgium), Kourou (French Guiana), Villafranca (Spain), Kiruna (Sweden) and Odenwald (Germany). ESOC also uses additional ground stations in co-operation with the national organisations. ESOC hosts the general-purpose ESA Operations Control Centre (OCC)-- the facilities of which provide all the necessary functions to handle spacecraft & ground-segment control, orbit & attitude determination, and data acquisition & processing. Within the OCC, the different functions are handled from within separate, dedicated rooms. The Main Control Room (MCR) is used for the preparation (testing and simulation phases) of new missions and during critical mission control phases, e.g. LEOP or special operations (deep-space missions) as well as for emergency or contingency operations, which, normally require a larger flight control team. The control, monitoring and supervision of the ESTRACK network of ground stations are conducted from the Ground Configuration Control Room. This room is occupied 24 hours per day, 365 days per year. ESACOM is the multi-purpose communications network of the European Space Agency. It supports both local communications within an ESA site (ESOC, for example) as well as inter-site communications between ESA establishments, ground stations and offices. It also provides communications services between ESA and its external partners, including other space agencies, research and academic institutions and the general space industry. OPSNET is the Agency's ground communications network dedicated to the support of spacecraft operations. Established as a closed private wide-area-network (WAN), it interconnects control centres with ground stations and sites at which satellites are physically located during Spacecraft Validation Tests (SVTs). The network continuously provides links with both the Voice Switching System and the Teletype Message Switching System of NASA's NASCOM network. Additional links with NASA and other external organizations; in particular CNES (France), DLR/GSOC (Germany) and NASDA (Japan) are established as and when required by projects. OPSNET provides for the transfer of both data and voice traffic. Its services are
114

CASSIOPEE
provided 24 hours per day, 365 days per year. The network management centre for the entire OPSNET is located at the Communications Control Room at ESOC.
4.6.2.1.3 SSTL global ground stations network We analysed other networks, for example the SSTL ground station network infrastructure and facilities in order to understand how a ground network operates (see Appendix K) and what we can use in the CASSIOPEE mission for TT&C operation and data collecting from the spacecraft.
4.6.2.1.4 Mission command and control ground station Compact and low-cost mission control ground stations have been developed by SSTL to operate the microsatellites once in orbit. PC based, these ground stations are highly automated, interacting autonomously with the microsatellite in orbit to reduce manpower requirements and to increase reliability.
4.6.2.1.5 SSTL's mission control centre SSTL's Mission Control Centre is located at 51N 1W at the Surrey Space Centre, Guildford UK, and supports all operational SSTL bus microsatellites. One of its unique features is the high level of autonomy. The centre deals with an average of 88 satellites passes per day and is the primary station responsible for command and control of 11 microsatellites. At the heart of the Mission Control Centre is a tracking computer running custom written tracking software. The tracking computer is augmented by a GPS receiver for precise time keeping and uses a priority-based set of rules to assign each half of the ground station to the satellites in view.
4.6.2.2 Ground station
4.6.2.2.1 Introduction Typically three functions are carried out by remote ground stations: telemetry, tracking and command. These functions can be performed in separate and distinct stations or co-located. The command station transmits commands and data to the spacecraft that are generally prepared by MCC. Usually the spacecraft retransmits the message received from ground station for comparison and verification at the ground before transmission of the enable signal to the on-board computer processor that signifies that the signal is valid. If the enable signal is not received, the message will be disregarded. Most command systems also use error detecting and correcting codes to confirm the authenticity of the received signal. Whenever a command signal is planned to be transmitted or there is an opportunity to send commands, backup messages should be available to respond to possible emergency situations. Telemetry station collects telemetry from the spacecraft and transmits it to the MCC through the communications network. To minimize the amount of data transmitted over the network, a subset of the data is usually transmitted to the MCC, with the complete set of archived for recall or transmission later time.
115

CASSIOPEE
Tracking station collect data from which ephemeris of the spacecraft can be determined. This data collection can be one-way radio frequency (RF) range, and range – rate measurements through continuous wave (CW) Doppler and range – difference systems, two-way RF range and range – rate measurements through specially development ranging system, azimuth and elevation measurements. When orbit manoeuvres are to occur, timeliness is important and provisions must be made to transmit the data in near real time to MCC. Generally, tracking data are not needed in abundance in near real time; so the bulk of the data can be archived at the tracking site and transmitted via communications network when convenient. In missions where the precise orbit determination is required, the number of co-operating tracking stations can be 10 or 20. To ensure good coverage around the orbit, these stations are generally distributed worldwide. Global coverage is especially important for low and medium altitude spacecraft for which precise ephemeris are required because of the global variations in the geopotential.
4.6.2.2.2 ESA ground network for TT&C We analysed the ESA infrastructure at ESOC (European Space Operations Centre) for the TT&C network, in order to assess its usefulness for our project. The following stations are currently part of ESATRACK (antenna dish sizes are also included): Kiruna: 15m S-band and X-band station primarily supports satellites ERS-1 and ERS-2 mission. It is equipped with equipment for tracking, telemetry and command operation as well as for reception, recording, processing and dissemination of data from the sensor instruments on-board the two satellites. The station operates in S-band for uplink and downlink and in X-band for downlink only. Kourou: 15m S-band and X-band station also known as KOUROU 93. The Kourou station will be used for XMM mission during its routine phase, and for other satellite’s Launch and Early Orbit Phase (LEOP). The technical facilities comprise uplink and downlink equipment, timing and calibration equipment and a ground station/ESOG communication system. Operational spacecraft command and receive system in S-band. Redu: 4.5m, 4.5m, 13.5m The stations provide tracking capabilities in VHF, C-band, L-band, S-band, Ku-band and Ka-band, and provide in-orbit tests (IOT) of telecommunication satellite. The S-band station is presently used for W3 (Eutelsat). The next ESA Science project to use S-band station is Integral. Currently the various activities supported at Redu can be grouped into four categories: Telemetry, tracking and command (TT&C) services, Control and Monitoring services, in-orbit testing services for communication satellite payloads, Data relay services. Villafranca: 12m, 15m, 15m. The stations provide tracking capabilities in VHF, C-band, L-band, S-band, X-band and Ku-band. The S-band station VIL-1 will be used by ESA Science project, Cluster-II. The S-band station VIL-2, provides satellite’s Launch and Early Orbit Phase (LEOP). Odenwald: 15m, 15m, 13,5m, 10m
116

CASSIOPEE
Malindi: 10m S-band station with uplink and downlink equipment, a ranging system, timing and calibration equipment, a station computer and the station/ESOG communication system. The S-band facilities can be used for L-band and X-band operations. Maspalomas: 15m for S-band and X-band. A pilot GPS Tracking and Data Facility (TDAF) is currently in operation with comprises a control centre located at ESOG and six remote stations, one of which is located at Maspalomas station, operating under the control of ESOG. The GPS-TDAF is designated to achieve high accuracy orbit determination and to perform error analysis for future space missions. Perth: 15m S-band and X-band station used for XMM mission during its routine phase and for satellite’s Launch and Early Orbit Phase (LEOP). There is a S/X band antenna, a telemetry and telecommand system, ranging system, timing and calibration equipment and ground station/ESOG communication equipment. A base Type A is available for the Transportable Station. Transportable: 5.5m to support S-band spacecraft operations (tracking, telemetry and command) for spacecraft in launch and early orbit phase (LEOP) or near earth orbit. The station is presently located at Villafranca site and is used as backup station for Kiruna for satellite ERS-1 and ERS-2.
4.6.2.2.3 SSTL global ground stations network SSTL is unique in that it monitors, controls and maintains a series of small satellites from its mission control ground station facility at the University of Surrey in England (See figure in Appendix). This capability and experience gives SSTL the ability to:
• Design and produce low cost - high performance small satellite ground stations
• Design, maintain and develop both ground and space segment software • Provide complete operations training and experience to customers using
existing small satellites • Provide support and back-up to in-orbit operations for customers • Collaborate in the operation and implementation of missions • Provide maintenance and assistance for customer installations
4.6.2.2.4 Other projects In other projects as that of DLR and the German space company OHB-System Bremen, BIRD project, has been proposed a small satellite ground station for TT&C and receiving payload data. The BIRD small satellite mission shall demonstrate the scientific and technological value and the technical and programmatic feasibility of the combination of ambitious science and new, not yet space-proofed advanced technologies with a small satellite mission conception under low-budget constraints. In the project FedSat- An Advance Micro Satellite Based on a MicroSil Bus realised by Cooperative Research Center for Satellite Systems, a small satellite ground station 2.4m for TT&C and receiving data from payload.
4.6.2.2.5 User ground stations
117

CASSIOPEE
SSTL's Low Earth Orbit Satellite Communications Terminal (SCT) provides reliable digital store-and-forward communications from a compact desktop or field station. It is ideal for civil or military message file transfer and remote site data collection and remote control applications - on land or sea. Easy to use, the SCT is powered by an internal battery for fully portable operation. SSTL are developing portable ground stations, palmtop terminals and pagers to meet the many applications now possible with the Surrey microsatellite. Demonstration equipment is available.
4.6.2.3 Ground station in CASSIOPEE project The ground station has to perform telemetry, tracking and command of the spacecraft and to receive data from payload. This ground station proposed for CASSIOPEE mission will use existing hardware on the market, already used in other projects. According to the existing technologies, this is valuable equipment. In the CASSIOPEE project the ground station proposed the following configuration:
• 1Mbs receiving data • 2.4 m antenna for uplink and downlink with gain 32 dB • 2W radio frequency unit for S-band • G/T of antenna 13 dB/k • Program track • D-BPSK demodulation for downlink and uplink • Compact design.
This station will receive the signal from spacecraft in S-band, and will demodulate for obtaining telemetry data, will be processed for determining the required commands, and will delivery the data from payload to data management centre.
4.6.2.3.1 Hardware The maximum downlink bit rate of the system is 1 Mb/s. The ground station will be able to receive scientific data and housekeeping’s from satellite at a minimum elevation angle, with a BER of 10-6. The antenna system consists of parabolic aluminium reflector of 2.4m diameter and an integrated diplexing feed / transceiver / converter front-end for receiving and transmission at S-band. The downlink components consist of a D-BPSK receiver and a Bit & Frame synchroniser cards. Time synchronisation and location of the station will be done by reception of GPS data. An I/O interface, will function as an interface to the GPS Antenna & Receiver. The modem for is used for uplink. The control computers are connected to a LAN data communication and archiving. This system runs under Windows NT operating system. As a ground station has not the main responsibility for mission operation, there is no system redundancy. Defective components must be replaced in case of failure.
118

CASSIOPEE
4.6.2.3.2 Software The software for ground station has a modular structure, which is run under the Windows NT operating system. The software function can be separated into following groups:
• Station control • Downlink • Uplink • Data Processing
Because the resources for implementation of software are limited, these functions will occur stepwise. First all basic functions, which are necessary to receive, store and display the scientific and housekeeping data, will be implemented, then the functions for uplink and finally the higher-level data processing algorithms. Functions of the software for station control are:
• Display satellite position, program antenna • Control, display and log status information • Automatic update of time and TLE data • Perform station electronics diagnostics
Functions of the software for downlink are:
• Manage downlink schedules • Receive, display and store payload and housekeeping’s data • Warnings for out of limit parameters
Functions of software for uplink are:
• Manage uplink session preparations • Maintain telecommand and telemetry databases • Communication with ground station operation center • Transmission of telecommands to the satellite
Functions of software for data processing are:
• Generation of higher level data products • Near online classification • Alarm generation
The remote data is received from the satellite and than is processed by a classification algorithm, and than is transmitted to the users through a commercial company.
4.6.2.4 Options for CASSIOPEE project The options for our project are the following:
• To use one ESA network for TT&C data and to collect data from satellite • To use a station from one of North Europe countries for TT&C data and to
collect payload data from satellite. • To build a new dedicated earth station for our project, which can be installed
at: o Facilities of one North European countries
119

CASSIOPEE
o Institute for performing data management o Commercial company which can sell the products – This station can do
also automatic processing of data immediately after it has been received. In this case there is more autonomy of the system and the station can be install direct to commercial company.
• To build a ground station only for receive data from the payload, and not for telemetry, in case that satellite will have sensor for GPS, and can perform on board tracking and telemetry operation.
o In this case the ground station can be installed direct to the research institute or at the commercial company, which can be used to sell the product.
In the next step process toward CASSIOPEE, exploration of the following options is recommended:
• We have to address ESA to discus the possibilities for using one of the ground stations from the network, for TT&C data and for receiving data from the payload. In this case we have to use communication link to the data management centre. This data processing centre has to be located at a research institute or at the commercial company facilities.
• We have to discuss direct with Space Agency from one of the North Europe countries, which has the satellite TT&C station and can offer services to other satellites, as Sweden and Norway. In Sweden there are two stations: Kiruna and, Esrange and Stockholm for TT&C or in Norway at Tromsö. In this case we have to use communication link to the data management centre. This data processing center has to be located at the user’s facilities.
• In this case we have to build a dedicated earth station for TT&C and data collection from payload, which can be installed in one of countries from North Europe. This dedicated earth station will be small station with a 2.4m antenna and with 2W radio frequency unit. This station can be installed in the facilities of space agencies, at one research institute from European countries, or direct to commercial company if it will be decided to give to one company the right to find a commercial possibility to sell the data. In the case the ground station will be installed at space agency or at one research institute, will be requested a communication link from the station to the company which will sell our data.
4.6.2.5 Conclusion The actual technologies for ground station permit to build an autonomous ground station able to perform TT&C of the spacecraft, to receive data from payload and to perform the management of the data. It has to be mentioned that if ESA is interested in coordinating the project, they will decide about the optimal solution based on specifications of the spacecraft and on its mission.
120

CASSIOPEE
References [ROMINFOR, 2000]
ROMINFOR, 2000. Micro and Nanotechnologies bulletin. <http://www.imt.ro>.
[De Aragon,1998]
De Aragon, A. M. 1998. Future applications of micro/nanno-technologies in space systems. ESA, Bulletin N°85. <http://esapub.esrin.esa.it/bulletin/bullet85/mart85.htm>.
[Shaw et al,1998]
Shaw, T.; Pain, B.; Olson, B.; Nixon, R.; Fossum, E.; Panicacci, R. and Mansoorian, B. 1998. Active-Pixel-Sensor Digital Camera on a Single Chip. NASA Tech. Briefs Issue, Vol. 22 N°10. <http://csmt.jpl.nasa.gov/csmtpages/Technologies/CMOS.html>.
[OSSS] OSSS (One Stop Satellite Solutions, Inc). The OSSS CubeSat Kit. <http://www.osss.com/products/cubesat.html>.
[IST, 2001] IST (Information Society Technologies), 2001. IST Programme Projects, number IST-1999-12615. European Commission. <http://www.cordis.lu/ist/projects_s.htm>.
[Larssen et al,1999]
Larssen, S.; Sluyter, R. and Helmis, C. 1999. Criteria for EuroAirNet: The EEA Air Quality Monitoring and Information Network. Technical Report N°12. European Environment Agency. <http://europa.eu.int>.
[JPL] Sensor Web for Atmospheric Monitoring. JPL. NASA. <http://sensorwebs.jpl.nasa.gov>.
[SCIAMACHY, 1998]
SCIAMACHY Validation Requirements Document. 1998. SCIAMACHY Validation Documents. Series 01. <http://www.knmi.nl/onderzk/atmosam/sciavalig/document/draft.html>.
[Guanapala etal,]
Guanapala, S.; Sundaram, M.; Liu, J.; Bandara, S.; Pool, F.; Shott, C.; Hoelter, T. and Laband, S. Sharp Infrared Eyes: The Journey of Quantum-Well Infrared Photodetectors from Concepts to Large, Inexpensive Sensitive Arrays in Handheld Infrared Cameras. Centre for Space Microelectronics Technology. <http://csmt.jpl.nasa.gov/csmtpages/Technologies/QWIPS.html>.
[Hoenk et al] Hoenk, M.; Vanzandt, T.; Cheng, D. And Kaiser, W. Surface Acoustic Wave Hygrometer: Measuring Water Vapor in Earth’s Atmosphere. Centre for Microelectrics Technology. <http://csmt.jpl.nasa.gov/csmtpages/Technologies/MicroWeather.html>.
[Jackson et al,1998]
Jackson, B. and J. Campbell (1998). The Subsystemless Satellite – A new paradigm for the next generation of small satellites. Paper presented at the 12th AIAA/USU Conference on Small Satellites (SSC98-V-5). <http://www.sdl.usu.edu/conferences/ smallsat/proceedings/12/ssc98/5/sscv5.pdf>.
[Global Aerospace Corporation 1998]
Kerry T. Nock. Global Constellation of Stratospheric Scientific Platforms. 4 Feb. 2000. <http://peaches.niac.usra.edu/files/studies/abstract/397Nock.html>.
121
CASSIOPEE
[Dryden Research Centre2000]
Dryden Research Centre .UAV-based earth science studies chosen for refinement. 29 August 2000. <http://www.dfrc.nasa.gov/EAO/PressReleases/2000/00-72.html>.
[EuroAirNet 2000]
EuroAirNet. 5 September 2001. <http://www.nilu.no/niluweb/services/euroairnet/>.
[James R.Wertz et al]
Space Mission Analysis and Design, Third Edition, by James R. Wertz and Wiley J. Larson.
[ENVISAT] Envisat Design Phase A. [STK SOFTWARE]
STK. SOFTWARE v4.2.0 a.
[W. Sun et al] Earth Observation Microsatellite Disaster Monitoring Network Through International-Co-operation, W.Sun and Prof. M. Sweeting, IAF-99-B.1.03.
[Larson et al,1992]
Larson, W., and Wertz, J., “Space Mission Analysis and Design”, Kluwer Academic Publishers, 1992, ISBN-881883-01-9.
[Da Silva Curielet al]
Da Silva Curiel, R.A. and Jolly, G. “The GANDER Constellation for Maritime Disaster Mitigation”, IAA-98-C.1.02.
[Larson et al,2000]
A-L. Larsson, G. Niklasson and L. Stenmark, Functional Surfaces for Thermal Control, 3rd Round Table on Micro/Nano-Technologies for Space, ESTEC, 15-17 May 2000.
General reference
Bernath, P.F., “Atmospheric Chemistry Experiment (ACE): An Overview”, J. Demaison, editor, Kluwer, Dordrecht, 2001.
General reference
Clerbaux, C. et al “Remote sensing of CO, CH4, and O3 using a spaceborne nadir-viewing interferometer.” Journal of Geophysical Research 103 (1998). pp 18,999-19,013.
General reference
Drummond, J.R. et al “Early Mission Planning for the MOPITT Instrument”, SPIE 44th Annual Meeting, 18-23 July 1999, Denver, CO.
General reference
Eyre, J.R. “Inversion methods for satellite sounding data.” April 1992. <http://www.ecmwf.int/services/training/rcourse_notes/ DATA_ASSIMILATION/INVERSION_METHODS/Inversion_methods.html>.
General reference
Eyre, J.R. “Inversion methods for satellite sounding data.” April 1992. <http://www.ecmwf.int/services/training/rcourse_notes/ DATA_ASSIMILATION/INVERSION_METHODS/Inversion_methods.html>.
General reference
Francis, G.L. et al “Channel radiance calculations for MOPITT forward modeling and operational retrievals”, SPIE 44th Annual Meeting, 18-23 July 1999, Denver, CO.
General reference
Gille, J. et al “The EOS MOPITT experiment: Extracting the information from the measurements”, SPIE 44th Annual Meeting, 18-23 July 1999, Denver, CO.
General reference
Japan Association of Remote Sensing. “Types of Remote Sensing” 1996. <http://whitekjh.new21.org/rsnote/contents.htm>.
122

CASSIOPEE
General reference
King, M.D. “Radiative Transfer, Light Scattering, and Satellite Orbits” 2000. <http://www.coloradocollege.edu/environment/remote/Scattering%20&%20Orbits.pdf>.
General reference
MOPITT Team. “MOPITT Mission Description Document” 1993. <http://www.atmosp.physics.utoronto.ca/mopitt/mdd_93/>.
General reference
Peckham, G.E., “Instrumentation and Measurement in Atmospheric Remote Sensing.” Reports on Progress in Physics 54 (1991). pp 531-578.
[Resonance Ltd., 1997]
Resonance Ltd. “MicroMAPS-A Low Cost Orbital Remote Sensor for the Detection of CO and N2O” 1997. <http://www.resonance.on.ca/mmaps.html>.
General reference
Rayner, P.J., O’Brien, D.M. „The utility of remotely sensed CO2 concentration data in surface source inversion.” Geophysical Research Letters 28 (2001). pp 175-178.
General reference
Stephens, Graeme LK. Remote Sensing of the Lower Atmosphere. New York: Oxford University Press, 1994.
General reference
Teague, P., Russel, S. “A Global Greenhouse Gas Monitor”, The 14th Annual AIAA/ Utah State University Conference on Small Satellites, 2000.
General reference
Tolton, B.T., Plouffe, D. “Sensitivity of radiometric measurements of atmospheric CO2 column from space.” Applied Optics 40 (2001). pp 1305-1313.
[Piscane et al,1994]
Pisacane, V. and Moore, R., Fundamentals of Space Systems, Oxford University Press Inc, 1994.
[Maral, 1998] Maral,G. and Bousquest, M., Satellite Communications Systems, John Wiley&Sons, 1998, ISBN-0471-970379.
[Meller et al] Meller, Sripruetkiat, Makovec: Digital CMOS Cameras for Attitude Determination, 14th AIAA/USU Conference on Small Satellites.
[Janson] Janson: Silicon Satellites for 21st Century Missions, the Aerospace Corporation – The Second International Conference on Integrated Micro Nanotechnology for Space Applications.
[Janson, 2001] Janson: Nanotechnology – Tools for the Satellite World, 6th ISU Annual International Symposium, 2001.
[Kim, 2001] Kim: Vision of Future Space Systems Based on Recent MEMS and Nano-technology Developments, Korea Aerospace Research Institute, 6th ISU Annual International Symposium, 2001.
[Satter] Satter: The Promises of Nanotechnology: Will they be kept?, California Institute of Technology, Jet Propulsion Laboratory.
[Hulsing, 1998] Hulsing: MEMS Inertial Rate and Acceleration Sensor, IEEE Aerospace and Electronics Systems Magazine, November 1998.
[Beliveau et al99]
Beliveau, Spencer, Thomas, Roberson: Evaluation of MEMS Capacitive Accelerometers, IEEE Design & Test of Computers, October-December 1999.
[Berlin et al,1997]
Berlin, Gabriel: Distributed MEMS: New Challenges for Computation, IEE Computational Science & Engineering, January-March 1997.
123
CASSIOPEE
[Allen et al,1998]
Allen, Kinney, Sarsfield, Daily, Ellis, Smith, Montague, Howe, Boser, Horowitz, Pisano, Lemkin, Clark and Juneau: Integrated Micro-Electro-Mechanical Sensor Development for Inertial Applications, IEE AES Systems Magazine, November 1998.
General reference
Thrusters Options for Microspacecraft: a review and evaluation of State-of- the art and Emerging Technologies, AIAA Progress in Astronautics and Aeronautics Vol187, Juergen Mueller.
General reference
The Design, Development and Testing of a Propulsion System for the SNAP-1 Nanosatellite, 14th Annual/USU Conference, D Gibbon, Dr J Ward.
General reference
AFOSR and DARPA <http://www.nanosat.usu.edu/presentations/microprop>.
General reference
Larson, W., and Wertz, J., “Space Mission Analysis and Design”, Kluwer Academic Publishers, 1992, ISBN-881883-01-9.
General reference
Siegel, Richard W. 1999. "Summary of the WTEC Study of Nanostructure Science and Technology." Presentation at "Vision for Nanotechnology R&D in the Next Decade," January 27-29, 1999.
General reference
Rebello, J.H.D., Straub, D.H., and Subramaniam, V.V., "Diamond Growth from a CO/CH4 Mixture by Laser Excitation of CO: Laser Excited Chemical Vapor Deposition," J. Appl. Phy., Vol. 72, No.
General reference
Panel on Small Spacecraft Technology, “Technology for Small Spacecraft” page 31 –41, National Academy Press, 1994.
General reference
Nasa Preferred Reliability Practices, “High Voltage Power Supply Design And Manufacturing Practices”, Practice N° PD-ED-1202, Lewis Research Center.
General reference
Larson J. Wiley and James R. Wertz, “Space Mission Analysis and Design”, Third Edition, Space Technology Library; 1999.
General reference
A-L. Larsson, G. Niklasson and L. Stenmark, Functional Surfaces for Thermal Control, 3rd Round Table on Micro/Nano-Technologies for Space, ESTEC, 15-17 May 2000.
General reference
Panel on Small Spacecraft Technology, Technology for Small Spacecraft (pages 42 – 49), National Academy Press, 1994.
General reference
Larsen, Wiley, and James Wertz, Space Mission Analysis and Design 3rd Ed., Space Technology Library, Microcosm Press & Kluwer Academic Publishers, 1999.
General reference
Grastataro, C. and Thomas Butler, “Development of a Composite Structure for Forte”, Los Alamos National Laboratory, 1995.
General reference
Killough, R., McLelland, M. “Designing Command and Telemetry Systems Using MIL-STD-1553 and CCSDS”, The 14th Annual AIAA/ Utah State University Conference on Small Satellites, 2000.
General reference
Jensen, J., D., Swenson, C., M. “Command and Data Handling Subsystem Design for the Ionospheric Observation Nanosatellite Formation (ION-F)”, The 14th Annual AIAA/ Utah State University Conference on Small Satellites, 2000.
General reference
CCSDS “Pecket Telemetry”, CCSDS 102.0-B-4, 1995. <http://www.ccsds.org>.
124

CASSIOPEE
General reference
CCSDS “Telecommand Part 2 – Data Routing Service”, CCSDS 202.0-B-2, 1992. <http://www.ccsds.org/>.
General reference
CCSDS “Telecommand Part 3 – Data Management Service”, CCSDS 203.0-B-1, 1987. <http://www.ccsds.org/>.
General reference
Masamichi Shigehara, “ Introduction to Space System –design and development of satellite–(Japanese),” Baifuhdoh, 1995.
General reference
Willey J. Larson and James R. Wertz, “Space Mission Analysis and Design,” Microsm, Inc. and Kluwer Academic Publishers, 1992.
General reference
Steven J. Isakowity, Joseph Hopkins Jr. and Joshva Hopkins, “International Reference Guide to Space Launch Systems-Third Edition-,” the American Institute of Aeronautics and Astronautics, Inc., 1999.
General reference
“ROCKOT User’s Guide,” EUROCKOT Launch Services GmbH.
General reference
ESA’s web site: <http://www.esa.int/>.
General reference
Grace’s web site: <http://www.csr.utexas.edu/grace/>.
General reference
Encyclopedia Astronautica: <http://www.friends-partners.org/mwade/index.htm>.
[SSTL Webpage]
<http://www.sstl.co.uk/sevices/mn_groundstations.html>.
[ESOC Webpage]
<http://www.esoc.esa.de/external/mso/fac.html>.
[DLR Webpage-1]
<http://www.ba.dlr.de/NE-WS/projects/bird/navigation.html>.
[Brown et al] Brown, B., Wicks, A., Boland, L., Gardner, S., and Graham, E., FedSat – An Advanced Micro-Satellite Based on a MicroSIL Bus.
[DLR Webpage-2]
<http://www.ba.dlr.de/NE-WS/projects/bird/navigation.html>.
125

CASSIOPEE
5. Data management Data management is an overview of the organizational structure of data handling, processing, and delivery to the user. The institutions involved in each of the steps and their responsibilities are defined. An agency-sponsored program is assumed and therefore ESA, ESRIN, and ECCMWF have been identified as key partners in the data management component. The data flow from these institutions have been defined, as each player will interact with the other to deliver the required data to the users. The main users have been defined the general public, national policy agencies, and the scientific community The policy requirements for GHG indicate a need for monthly reports, therefore real-time data products are not required. The main products from CASSIOPEE will be monthly emission map derived from inverse modeling techniques and monthly concentration maps.
5.1 Data collection and processing Many different operational models exist for the ground receiving station and processing facilities involving microsatellite technology. Some of the possible models considered include an agency-sponsored program with a commercial operational component, an agency-sponsored program within a university-based operational component, and a completely agency-sponsored and operated program. Given the Industrial Policy of ESA, which outlines the main goals and priorities for the organization (refer to Section 3.3.4), one structural model for data management has been investigated. The structural model assumed to be the most accurate for this satellite design, assuming the mandate is to provide policy makers with the required information to monitor greenhouse gases, is the agency sponsored and operated program. ESA would therefore assume this role in the agency-sponsored structure. Data collection procedures would rely on ESA’s current structure of receiving stations and the associated scientific processing facilities of the European Space Research Institute (ESRIN). ESA will ultimately make the decision of the receiving and operational structure according to their policy and agreements with member states. This section simply presents one possible data management structure as part of the larger organizational system described in Figure 3-1. ESRIN is responsible for coordinating the earth observation data received from the more than thirty ground stations world-wide. This vast amount of data is then processed and stored at ESRIN so that it can be used in various applications and distributed to users all over the world. Management information systems developed and operated by ESRIN include documentation systems for the collection, archiving, retrieval and distribution of information. ESRIN pursues ESA’s objectives of increasing interaction with users in order to develop new products and services, while supporting the competitiveness of the European space industry (ESA, 2001). ESRIN also cooperates with international organisations such as the European Commission and United Nations agencies, and plays an important role in numerous international projects such as the International Geosphere/Biosphere Program and the Committee for Earth Observation System (http://www.esa.int/export/esaCP7.html). European Centre for Medium-Range Weather Forecasts (ECMWF) is an international organization supported by 22 European states. The principal objectives of the Centre are the development of numerical methods for medium-range weather forecasting, the
126

CASSIOPEE
scientific and technical research directed to the improvement of these forecasts, as well as the collection and storage of appropriate meteorological data. In addition, the Centre makes available a proportion of its computing facilities to its member states for their research, which is where the CASSIOPEE mission satellite program can benefit (http://www.ecmwf.int/about/index.html). Facilities have been developed at ESA and ESRIN for the various satellite programs, including the ERS-1 and ERS-2 (Earth Resources Satellites). The structure of processing and operations for the ERS satellite program can act as a guide for the data generated from CASSIOPEE. The ground segment is responsible for data reception, archiving and processing of instrument data (raw data). In the case of ERS data, a separate facility, the Earthnet ERS-1 Central Facility (EECF), manages the cataloguing, user requests, payload operation planning, data dissemination and quality control of data products (ESA, 1998). The EECF is the main body driving the data processing and handling requirement, including the user interface, which provides data ordering and data catalogue searching. The data products available from this satellite program include raw data available near-real time, fast delivery products generated within hours of the data acquisition, and off-line products generated for regional analysis which are processed to various levels of precision. The policy requirements for greenhouse gases indicate a need for monthly reports; therefore near-real time access to data is not considered. Data processing for CASSIOPEE would occur at ESRIN using the off-line product generation method. ECMWF would also be involved in producing off-line products, and modelling products for the various users.
5.2 Calibration and validation of satellite data After the raw signal data has been downlinked from the satellite instrument to the ground station, a number of calibration and first order processing procedures are required before the data is sent to the analysis centre (ESRIN). The raw data is typically first checked for missing or corrupted data, and then auxiliary data is incorporated into transfer models to produce emission spectral information. The data processing steps to convert data from spectral values to atmospheric gas concentrations will be similar to the processing of data from ENVISAT (http://envisat.esa.int/) and the MOPITT instrument (http://www.eos.ucar.edu/mopitt/val_plan/v4.pdf). Pressure and temperature measurements will be incorporated as well as trace gas volume-mixing-ratio retrieval models. The calibrated and first-level processed data will then be transferred to ESRIN for concentration calculations and atmospheric inverse modelling. Validation of the derived satellite data with independent measurements is required for accuracy assessment and verification. Validation data can be derived from in situ airborne measurements, remote sensing satellite or ground based measurements, and atmospheric model calculations. The data validation source must have an acceptable level of data continuity and validity to ensure long-term use of a stable data source. Investigations have been completed for the ENVISAT SCIAMACHY and MIPAS instruments detailing the most realistic and cost effective approaches of validating space measurements (http://www.knmi.nl/onderzk/atmosam/sciavalig/document/draft.html). The document has identified key validation components necessary for operational satellite
127

CASSIOPEE
remote sensing programs. Current ground-based measurement networks are recommended as the base for the validation due to the lower costs associated with existing instrumentation and previously established networks. Intensive validation must occur during the commissioning phase of the program as the initial calibration and precision of the instruments are assessed. Algorithms and modelling must have accurate independent measurements in order to determine the accuracy of the measurements for scientific classification (ESA Report, 1998). Long-term monitoring of the satellite instruments is critical for data consistency and stability, as well as for maintaining the quality of the operational component. Accurate validation of the data will quantify the measurements by providing an accuracy range and will allow for refinement of retrieval algorithms and models described in Section 2.5.2.2.
5.3 Data distribution and flow The data flow structure consists of the receiving component, processing and calibration, as well as delivery to the end users. Figure 5-1 (source: Green, J. 2001. Space Informatics. International Space University Lecture Notes) shows an overview structure of an agency-sponsored program. Depending on the decisions made by ESA on the ground services allotted for this satellite project, the data may be distributed free of charge or sold at the cost of reproduction. ESA’s ground receiving network would be utilized in the agency-sponsored structure to receive the data and perform satellite control measures. Data processing and calibration activities would be controlled at the ground station operation centre. The processed data would then be directed to the data distribution facilities, identified as ESRIN for this satellite program. ESRIN’s responsibility would be to validate the data (through the integration of independent measurements) and calculate gas concentrations, which would then be sent to ECMWF for modelling. ECMWF would receive the processed and calibrated point measurement data from ESRIN to produce modelled data maps for national policy agencies, using inverse modelling techniques. The European Topic Centre on Air and Climate Change would also be interested in this data source.
128

CASSIOPEE
Users Users Users
Data Distribution Facility
Users Users 6. Users
Data Reception
Space Network ESA
Mission Control
Modelling Facility
Figure 5-1:End-to-end data flow
5.4 Data users Three broad groups of users have been identified for the resulting data products, with an additional commercial user component. Each user is associated with certain needs and requirements; therefore, the quantity and temporal and spatial resolution of the data also differs with each level of user, depending on their purpose and level of precision required. The first level of data is defined as the public user. This is the most broad and averaged data product produced, consisting of highly processed and averaged data, with coarse spatial resolution, and updated infrequently. This information could be posted on the World Wide Web for general public access and made available as educational information for schools and universities. Spatial maps showing monthly and yearly concentrations covering the European continent are an example of a data product for this type of user. The second level of user is identified as the national policy level users including agencies responsible for monitoring and reporting on the status of gas emissions and concentrations. The user’s needs are more specific since the data must address specific policy requirements. Monthly maps and tables with a defined accuracy are needed for decision makers in the policy and monitoring agencies. The European
129

CASSIOPEE
Environment Agency and member states would be such a user of monthly greenhouse gas concentration and emission maps. The third level of user would be the scientific and modelling community. This would utilize the most detailed data produced by the processing and have the highest temporal resolution. These users would receive the data after the initial processing and calibration procedures, one level above the raw data. This data could be used in point source calculations or in modelling and algorithm development, with higher temporal resolution than monthly maps. Individual swath data and point location data could be analysed and monitored in detailed investigations. The other possible set of data users are within the commercial sector. The possible commercial spin-offs include value added products and services, as well as data distribution to countries other than the European region. Commercial companies may use the available satellite data as a base layer to produce value added products, by assimilating with other data sets, and developing data integration techniques, and data presentation techniques. Acquiring and distributing data to other countries who are interested in greenhouse gas concentrations over their countries may prove to be a viable commercial activity in the longer term flowing the Kyoto ratification.
5.5 Data products Various ground, air and satellite programs are currently acquiring numerous greenhouse gas measurements and other atmospheric parameters. Some of these products will be used in our design for validation purposes and some will be integrated to produce model outputs. The main sensors that will have relevance to our data products include the ENVISAT instruments, and those belonging to EUROAIRNE, and the MOPPIT instrument. The MIPAS and SCIAMACHY instruments on board ENVISAT-1 will measure similar gases as proposed by CASSIOPEE, with less frequent visits and coarser resolution (http://imksgi1.fzk.de:8080/imk2/ame/ame_tsk.htm). These values, nevertheless, may be used to validate our data products when the satellite is launched. EUROAIRNET can provide an excellent network of ground monitoring stations to provide data for validation and product integration (http://www.nilu.no/niluweb/services/euroairnet/). The MOPITT instrument is currently acquiring CO and CH4, with a repeat cycle of 4 days and a spatial resolution of 22 km. MOPITT data products are generated for individual swaths, regions and global coverage (http://www.atmosp.physics.utoronto.ca/MOPITT/home.html). The CH4 component measured by both satellite sensors can act as a validation measure to check both satellite instruments, whereas the CO2 and N2O gases from CASSIOPEE can contribute to the CO gas values from MOPITT, as each of these sensors are contributing a unique gas measurement. These data products will complement each other to produce an excellent monitoring tool for policy makers on the concentrations and emissions of greenhouse gases. The main data products from CASSIOPEE will be regional and national emission maps of annual emission totals for the EU member states. Thematic gas concentration maps and emission maps for each country or areas of approximately 500km by 500km will be produced. Point source data products could also be produced on various temporal scales for users with more interest on detailed regional studies and
130

CASSIOPEE
monitoring. Integration of more than one gas component (from the CASSIOPEE sensor or other sensors) could be produced to compare gas concentrations and emission. In order to produce the monthly emission and concentration maps of Europe, other data inputs aside from the required validation and calibration components will be necessary for modelling. One set of models based on the ground level emission activities, the ‘bottom-up’ approach (described in Section 2.5.2.2) requires climate data and satellite-derived land cover information (Wang et al., 2001). These models start with emissions inputs on a grid then calculate the resulting concentrations, theoretically modelling the atmospheric transport and chemistry. ‘Top-down’ approach models, start with concentration measurements fields and calculate emissions on a grid. These models are more complex and have until now been based on a small number of worldwide ground-based concentration measurements. Compared to the vast number of greenhouse gas sources and sinks, the currently available concentration measurements are insufficient for accurate model improvement. Therefore, ‘top-down’ models have not yet been demonstrated to be very accurate. The data from CASSIOPEE should greatly improve the availability of concentration measurements, assisting in model development. ‘Top-down’ modelling will be used to convert CASSIOPEE derived concentration measurements into emission maps. The technique of inserting satellite data is only currently being developed; the COCO project coordinated by the Max-Planck Institute for Biogeochemistry, will address this issue. The project will be finalised in 2004, and the findings will greatly benefit CASSIOPEE. Martin Heimann of the Max-Planck Institute for Biogeochemistry has identified this institute as a potential partner for CASSIOPEE algorithm and model development. The ECMWF will be the operator of the model (personal communication Martin Heimann, 2001). Life Cycle Assessment (LCA) methodologies are another environmental management tool currently used by the Society of the Environmental Toxicology and Chemistry (SETAC). The LCA is used to model transport and sources of atmospheric emissions as a process or activity (Curran, 1995). The gas measurements from CASSIOPEE can contribute significantly to the ‘top-down’ model approach by providing accurate gas concentrations, and increased spatial and temporal coverage. Other satellite, ground, and airborne measurements would be incorporated into the modelling process for validation and model improvement.
131

CASSIOPEE
References General reference
<http://www.atmosp.physics.utoronto.ca/MOPITT/home.html>.
General reference
ESA, 1998. <http://earth.esrin.esa.it/ers/eeo3.324>.
General reference
ESA. 2001. ESRIN. 5 September 2001. <http://www.esa.int/export/esaCP/GGGYA78RVDC_index_0.html>.
General reference
ESA Report, 1998. ENVISAT mission: product summary overview. Editor Bob Harris. Noordwijk : European Space Agency. - iv, 84 p. : ill. ; 30 cm. - (ESA SP. ; 1221). ISBN 9290924802.
General reference
Wang, K.Y., J. A. Pyle, D. E. Shallcross. 2001. Formulation and Evaluation of IMS, and Interactive Three-Dimensional Tropospheric Chemical Transport Model 1. Model Emission Schemes and Transport Processes. Journal of Atmospheric Chemistry, 3: 195-227, 2001.
General reference
personal communication Martin Heimann, 2001.
General reference
Curran, M.A. 1996. Environmental Life-Cycle Assessment. McGraw-Hill Companies Inc., USA.
132

CASSIOPEE
6. Business & management A complete solution for any project must demonstrate a certain level of feasibility throughout all aspects of the project. The business and management aspects of CASSIOPEE are no exception and, in fact, are of paramount importance to ensure that the public will consider implementing such a project. This chapter will investigate the different marketing, cost, finance and management considerations for CASSIOPEE. In particular, it will perform a analysis of the market and demonstrate that it demands a solution such as CASSIOPEE examine benefits and the costs of the mission based on state-of-the are costing models, determine possible sources of funding to cover the costs of various phases of the mission, identify many of the risks inherent in the design, building, launching and operating of CASSIOPEE and, finally the chapter will discuss possible management and operational plans that would facilitate the implementation of this project.
6.1 Marketing analysis and case studies
6.1.1 Marketing analysis CASSIOPEE is visualized in a non-profit context, supplying a public good. A non-profit organization is defined as: "... one that exists to provide for the general betterment of society, through the marshalling of appropriate resources and/or the provision of physical goods and services. Such organizations do not exist to provide for personal profit or gain and do not, as a result, distribute profits or surpluses to shareholders or members" [Sargeant 1999]. This definition still necessitates a market analysis for a non-profit project; will this public good fill an existing need, and is the cost acceptable compared to the gain? The macroeconomic consequences of a probable climate change as described by the IPCC are huge. Inundation of land through sea-level rise, disruption of agriculture through altered rainfall patterns, destruction of infrastructure by more frequent extreme weather are just some possible consequences. The Kyoto protocol for reduction of greenhouse gas emissions addresses this risk by forcing the signatories to reduce these emissions. This reduction has a cost, which has been considered too high by many nations. For the EU, the cost of implementation has been estimated to be minimum 0.06% of GDP, or € 3.7B per year. The Kyoto protocol contains statutes providing penalties in case of non-compliance. The most important is if a signatory exceeds its quota for the first commitment period. Then it will have to make up for its deficit during the next period, with a thirty percent penalty of the exceeding amount subtracted from the quota. It is therefore evident that the cost of monitoring by almost any means will be negligible compared to the cost of exceeding emission quotas. If, for the sake of argument, one assumes a linear relationship between cost and emissions, the estimated cost of CASSIOPEE is comparable to the cost of a one percent quota overrun for one year. Because of the economic implications of incurring a penalty,
133

CASSIOPEE
and in a wider perspective, the implications of the protocol loosing its credibility with a resulting increase in greenhouse gas emissions, verification by as many independent methods as feasible should be performed. As of today, there is no observation network in place specifically aimed at efficient control of the adherence protocol. The next question is therefore: What is the best way of monitoring? Greenhouse gases may be measured by:
• Ground instruments • Scientific balloons • Aircraft mounted instruments • Satellite
CO2 may be measured in situ, or through remote sensing. Remote sensing may be performed by balloon, airplane or satellite.
• Measuring CO2though a ground network is very difficult, if not impossible. CO2 emissions come from point emitters, ranging from smokestacks to a single cigarette. A ground sensor must be located sufficiently distant from any of these to give meaningful data. Given the population density of Europe, there are very few suitable locations.
• Balloon probes pose a risk to aircraft traffic, and have a high per unit cost (> € 1500).
• Scientific aircraft can only give limited coverage in time and space. Mounting sensors on commercial aircraft will give dense spatial and temporal coverage. However, their irregular, but non-stochastic, coverage will make statistical analysis very complex.
(Obtained via personal communication with Knut Bjorheim, Head of technical division, Norwegian Meteorological Institute). The three first methods are not satisfactory for an emission control-monitoring network for practical or scientific reasons. Three possible satellite arrangements are possible:
• A single GEO satellite • A single LEO satellite • A constellation of LEO satellites
As pointed out in Section 4.4, only the last configuration will yield adequate sampling frequency when cloud cover is taken into account. The decision to use a constellation of satellites is therefore very much determined by technological constraints. We deem it unnecessary to do a cost-comparison of the alternatives, as they do not fit these constraints. The conclusions of this analysis may be summed up as:
• There is a market niche for a greenhouse gase monitoring system linked to the Kyoto protocol.
• There are compelling economic reasons for establishing such a system. A micro satellite constellation like CASSIOPEE is the only technologically feasible implementation.
134

CASSIOPEE
6.1.2 Case studies We have looked at four satellite programs; two big satellites, one small satellite, and one production system for small satellites. The information gathered is heterogeneous; time constraints have not permitted a thorough information gathering and a comparative analysis. Rather, we have selected one environmental monitoring satellite and examined its data distribution policy, a non-profit satellite organisation, the structure and cost of a microsatellite, and the motives behind a microsatellite production system.
6.1.2.1 ENVISAT ENVISAT is a multi-instrumented satellite financed by ESA that will be launched in November 2001. Instruments for ozone measurement, spectrographic imaging, sea surface temperature measurement and radar imaging are installed. ENVISAT is a scientific satellite, and is thus covered by ESA's Earth Observation Data Policy, which divides users into two categories, defined by ESA as:
• Category 1: ESA will fix the price for all ENVISAT data intended for category 1 use at or near the cost of reproduction of the data. Research and applications development use in support of the mission objectives, including research on long term issues of Earth system science, research and development in preparation for future operational use, certification of receiving stations as part of the ESA functions, and ESA internal use fall into this category.
• Category 2: All other uses that do not fall into category 1 use, including operational and commercial use [ENVISAT].
6.1.2.2 METEOSAT The METEOSAT satellites belong to EUMETSAT, the European meteorological satellite organisation. The main task of EUMETSAT is to make meteorological observations over Europe from space within the observational framework of WMO. Currently, the organisation has two satellites in GEO, at 0 degrees and 63E. They are equipped with a radiometer to observe EM emissions in the visible, IR, and water vapour absorption wavelengths. Spatial resolution is dependent on latitude and longitude; typically 7km x 7km over central Europe. Temporal resolution is once every thirty minutes. The data, both raw and processed, are considered core data as defined by WMO (World Meteorological Organization), and are therefore freely available to registered users. EUMETSAT is funded by its member states, with contributions calculated on the basis of each nation's GNP. Financial issues are decided with a weighted majority voting, other issues are decided on a one nation-one vote basis. EUMETSAT programmes are typically large, five-year endeavours [EUMETSAT].
6.1.2.3 TOPSAT TOPSAT is a low-cost imaging satellite funded jointly by the British National Space Centre and the UK's Ministry of Defense. It is project-managed by QinetiQ. Standard SSTL modules will provide power, orbit determination, telemetry and telecommand, on-board computing and control interfaces. Time delay integration is available to achieve the necessary signal to noise ratio of the images.
135

CASSIOPEE
Image data is captured and stored into memory. The data can be immediately downloaded to the mobile ground station for processing and display. Alternatively, it can remain stored on board until it is recovered via ground station. The Topsat project is managed by a consortium of four UK space organisations: QinetiQ, SSTL, The Rutherford Appleton Laboratory (RAL) and Infoterra, formerly NRSC. Topsat has a budget of 30 million EUR, including launch [QINETIQ].
6.1.2.4 MYRIADE MYRIADE is a microsatellite program developed by CNES. It is a small satellite design process; instead of marketing an already specified satellite, CNES markets its capability of producing satellites within a specified mass/complexity range. The most important motivation for developing MYRIADE was to have a project with more focus on innovation than on minimizing risks. Innovation is not limited to technical solutions, but also includes managerial methods. The shorter time span of MYRIADE projects – in the order of two years – represents a much more rapid feedback of lessons learnt into both MYRIADE and other similar activities at CNES. The satellites can be put in LEO orbits between 400 and 1200 km altitude, have three-axis stabilisation, and have some standard infrastructure. Four scientific satellites will be launched between 2002-2004. No exact figures have been found for the cost of a MYRIADE satellite. However, it may aptly be called a "faster, better" program. The aim is to decrease time span of projects, and thus increase technology feedback, not necessarily to create a cheaper solution than would be possible with bigger satellites. [Belleval, 2001]
6.2 Benefits of CASSIOPEE The primary aim of CASSIOPEE is to monitor greenhouse gas (CO2 N20 and CH4) emissions for Kyoto protocol emission monitoring. This is goal provides to the project the largest public gain as was outlined in Chapter 2. However, the project will also have other benefits to society:
• Scientific Benefit of Improving Existing Models The reliability of scientific models increases with the availability of both data for input, and data for verification of the outputs. Consistent time series of measurements are extremely important for spotting trends. CASSIOPEE will also be able to supply unprecedented temporal and spatial resolution, permitting hitherto impossible correlations of phenomena with CO2 concentration. In addition all three gases measured will, for the first time, be able to be consistently measured and can then be compared scientifically.
• Macroeconomic Benefits Many of the industrialized countries are highly interested in developing their space industries to stimulate the development of high-tech industries to replace the low-tech ones that are disappearing. The space industry generates both jobs and know-how. Micro-satellites are attractive in this context because they require less initial investment than many other space activities.
• Management Technique Spin-Offs
136

CASSIOPEE
During the past decade there has been a growing trend within the space engineering community to avoid big, expensive satellites and instead produce several cheaper satellites. This reduces project size, and thus exposure in case of failure. This approach has its limits when it comes to lowering total mission costs; the required miniaturization of payload can increase costs; distribution of payload over several small satellites may be more expensive than putting them on one big; operational costs can increase etc. However, it has made it easier for a traditionally risk-averse industry to become more daring in its engineering concepts. A big incentive for the large space companies to invest in micro-sat development has been to learn how to manage small projects. As pointed out in the case studies, this has been an important goal in the MYRIADE projects. It may be considered yet another aspect of the "Faster, Better, Cheaper" mission concept, and how to utilize the greater dynamics of small, short-term projects for high-tech, high complexity projects.
• Data Management Spin-Offs Data management is both a big risk factor and a possible source of spin-off technology. The constant increase in capacity of computer hardware and rapid appearance of new and/or low-cost software technology represents new possibilities for developing cheaper data management solutions which will have applications within signal decoding, image analysis, and scientific data dissemination. However, software development carries a notoriously high risk, and it is difficult to predict whether this will become a benefit or a liability for the project.
6.3 Costs of CASSIOPEE This section introduces one aspect of the finance analysis. The cost is of primary importance for assessing the feasibility of the project.
6.3.1 Cost estimation Since the early development of space programs, the methods of developing a mission have significantly changed. The traditional scheme of a design process was driven by technical and scientific performance achievements. The cost assessment was determined afterwards. However, for more than a decade, emphasis on budget restrictions has increased the role of cost assessment in the engineering process. Concurrent engineering processes are required to succeed in a “Faster, Better and Cheaper” context. As outlined in this section, cost assessment for microsatellite programs has evolved throughout the past decade, but the reliability of such models is still of concern.
6.3.1.1 Cost estimating methods Three main techniques are used to estimate project cost: Cost by Analogy, Parametric Cost Estimation, and Engineering Cost Estimation. Each of these has advantages and disadvantages.
• Cost by Analogy is easily accomplished, but it gives only a ‘rough order of magnitude’ (ROM) cost estimation, which has 20% accuracy at best. It compares the proposed project to similar projects of the past that have a known cost.
• Parametric Cost Estimation uses key system variables to infer a global cost for the project. It is based on data gathered from similar space missions. The
137

CASSIOPEE
accuracy of the estimation is better than the Cost by Analogy but takes more efforts to be accomplished.
• Finally, the Engineering Cost Estimation makes use of the engineering work breakdown structure to associate specific cost for each component. This method is used only for subsequent design phases of the project since it demands a high level of details in the mission design.
On the basis of these considerations, for our project, only the Cost by Analogy and a first approximation of Parametric Cost Estimation are presented.
6.3.1.2 Cost by analogy This method is limited by the availability of data on similar projects. A project similar to CASSIOPEE has been presented at the ISU 2001 Symposium on Microsatellites [Soh 2001]. The analogous project makes use of a constellation of four microsatellites for air pollution monitoring and operations are scheduled for seven years. The entire life cycle of the project costs is expected to be 10 years, which includes maintaining and upgrading ground systems. By analogy, we can infer a ROM cost for our project, which includes a three satellites constellation operating for four years. The overall life cycle is expected to be eight years. It has to be highlighted that those figures do not include launch cost. Parameters Analyzed cost for
[Soh2001] Analogous costs for CASSIOPEE
Life cycle 10 years 7 years Operational lifetime 7 years 4 years Number of satellites 4 3 Dev. and prod. Cost € 33.8M € 26M Operational cost € 27M € 11M Life cycle cost € 118M € 63M
Table 6-1: Comparison of [Soh 2001] and CASSIOPEE costs
Note: A learning curve effect has been taken into account to compare the four versus the three satellites constellations.
6.3.1.3 Parametric cost estimation Parametric Costing gives closer insight in the cost of the mission by addressing costs related to specific parameters. The change in processes from big satellites to small satellite design has urged many companies to evaluate the potential of traditional parametric models. It was apparent that ‘big satellite’ models were not suitable to assess the cost of small spacecraft designs due to the new microsatellite business approach and new technologies [Bearden 2001]. The Aerospace Corporation has been studying small satellite missions since 1991, and its main product is the Small Satellite Cost Model (SSCM). To our knowledge, this cost model is the most suitable one to date for microsatellites cost estimation.
6.3.1.4 Life-cycle cost Life-Cycle cost of a program is mainly separated in three components: Research and Development phase, Production phase (which includes the first flight qualified unit),
138

CASSIOPEE
and Operations and Maintenance (O&M) phase. Since most of the components of subsystems are ‘off the shelf systems’ (while not necessarily space qualified yet), we have adapted the research and development cost of the model in the first unit production cost. The Production and the O&M phases are detailed for the three main mission segments: Space, Launch and Ground segments. The Space segment has been estimated with the SSCM, while the launch and ground segment make use of both SSCM and Cost by Analogy.
6.3.1.4.1 Space segment: The payload has been evaluated with respect to similar instruments. The spacecraft bus is estimated using the SSCM, as its integration, assembly and test. The first unit includes the space qualification of some components, while the second and third spacecraft cost less because of the learning process among the production team. The flight software cost has been estimated with the number of source lines of code expected.
6.3.1.4.2 Launch segment: The Eurockot launcher is chosen as a preliminary basis. The average cost for such a launch is around € 16M [Isakowity 1999]. Assuming only one launch, the mission is insured upon rocket failure. The cost of insurance has been inferred to be around 12% of the recurrent cost for three new satellites. The launch support includes planning and operations related to launch and ’in orbit testing’. It also includes the integration of our spacecrafts to the launch vehicle. One alternative to reduce the launch cost would be to use the ESA Vega rocket, which is forecasted to start its demonstration test campaign by 2005. Our spacecrafts could serve has the payload on the qualification launches, and as such, the launch vehicle costs would be negligible. While this does have some increase in risk in terms of scheduling and overall risk in launcher reliability, this may be justified by the reduction in cost.
6.3.1.4.3 Ground segment: The small quantity of data to be collected and processed reduces the need to use a complex infrastructure. The use of existing ground stations in Europe would be sufficient and economically interesting. In addition to a limited amount of hardware, a 4 man-year operation has been taken into account for the cost assessment.
6.3.1.5 Preliminary cost assessment From this preliminary analysis, the cost for the entire CASSIOPEE mission would be around € 40M, which is in the range of most small spacecraft projects. However, more specific cost assessment has to be performed in the next phase of the project, allowed by a more accurate definition of the mission’s subsystems.
139

CASSIOPEE
Space segment
First Unit Cost (FY00 - M€)
Production of 2 additional Units Cost (FY00 - M€)
Total Cost (FY00 - M€)
Payload 0.35 0.6 0.95 Spacecraft Bus 3.39 5.98 9.37 Integration, Assembly, &
Test 1.18 2.08 3.25 Software 1.00 - 1.00 Program Level 0.97 1.71 2.68 Subtotal 6.53 9.77 17.25 Launch segment Launcher 16 Insurance
(12% Recurrent) 1.76
Launch support 0.52 Subtotal 18.27 Ground segment (4 years) Software 0.80 Ground equipment 0.70 Ground operation and
support 2.40
Subtotal 3.90 Total Life-cycle
cost 39.43
Table 6-2: CASSIOPEE overall cost
6.4 Financing A number of possible sources have been identified to finance our environmentally driven microsatellite program. These sources are based on the primary environmental goals that structure the entire mission: the (improved) monitoring of greenhouse gases with the goal of verifying the Kyoto protocol, on the one hand, and the improvement of the models used to determine the current and produced levels of greenhouse gases in the environment on the other.
6.4.1 Financing the development and operational costs The largest and, therefore, most challenging aspect of CASSIOPEE from a funding perspective is the acquisition of funds for development and operational costs. This section examines a number of different potential fund providers, and evaluates them based on a number of criteria, including: quantity of funds available, compatibility of the CASSIOPEE goals with the mandate of the funding programme, risk involved in the funding options, and advice given by experts.
140
CASSIOPEE
This section deals only with the funding of the development and operational costs. Possible funding options for future advances in CASSIOPEE – including possible phase A or pre-phase A studies are mentioned in Section 6.4.3. An outline of the funding options considered here is shown in Figure 6-1.
6.4.1.1 European Commission The European Commission offers a variety of opportunities for funding through the various Directorate Generals. Many of these seem quite appropriate to the mission of CASSIOPEE. Specifically, we have looked at the Directorate Generals (DGs) of Environment, Information Society, Research, and the Joint Research Centre (JRC). In addition, we examined the possibility of the European Environment Agency (EEA) aiding, either directly or indirectly, to the funding process.
141

CASSIOPEE
JRC
ESA
Earth Watch
Earth Explorer
Technological Demonstration Programme
Data UserProgramme
Member States
Environment Ministries
National SpaceAgencies
EC
DG Research(FP5)
DG Environment
EEA DG INFSO
Info Soc
Energy, Environment &Sustainable Development
Financial InstitutionalBanks
EIB Private Banks
Industry
Figure 6-1: Outline of funding options considered
142

CASSIOPEE
6.4.1.1.1 DG ENVIRONMENT DG Environment has a mandate that appears to correspond almost exactly to the aims of CASSIOPEE. Its Sixth Environment Action Programme has identified climate change as the first of the programme’s four priority issues. More specifically, the programme states that its objective is “to stabilise the atmospheric concentrations of greenhouse gases at a level that will not cause unnatural variations of the earth's climate” and that “the key priority for the 6th Programme will be the ratification and implementation of the Kyoto Protocol”[DG Env 2001]. However, there are two difficulties in obtaining funding from DG Environment. Firstly, in the year 2000, the amount of funding granted to different beneficiaries (including corporations, non-profit organizations, government ministries, etc) ranged from 5000 to € 615000 [EC 2001]. In other words, the DG does not have sufficient resources to fund a program of the order of magnitude of CASSIOPEE. Secondly, discussions with DG Environment officials (teleconference with Jean-Paul Malingreau) have revealed that while the DG would not be initially interested in funding the development of such a project, it may be interested in the data obtained from it.
6.4.1.1.2 DG INFORMATION SOCIETY The idea of procuring finances from DG Information Society came with the realization of the integration of information and data sources that would be necessary to combine the microsatellite-provided data with that data from existing ground, air and mathematical systems. The use of these multiple sources of information to provide coordinated data processing will likely be a large information technology (IT) development. However, within the mission statement of the DG, there is no direct support for the type of IT involved in this project. Also, as in the case of DG Environment, DG Information Society does not finance large projects such as this one (financing ranged from 2000 to 80000 € in 1999) [EC 2000].
6.4.1.1.3 JOINT RESEARCH CENTRE While the mission of the JRC is “to provide customer-driven scientific and technical support for the conception, development, implementation and monitoring of EU policies,” the focus is more on scientific and technological research, not on environmentally driven solutions or demonstrations [JRC 2001]. Secondly, the JRC does not directly have the ability to finance a project of the scale of CASSIOPEE. (The entire JRC budget is € 300M [JRC 2001]) It is important to note that many JRC projects obtain funding through the DG Research Fifth Framework Program (FP5), and that the JRC is one route to that source of funding. It is also possible to submit program proposal directly to DG Research through one of the FP5 programs (see below).
6.4.1.1.4 DG RESEARCH AND THE FIFTH FRAMEWORK PROGRAMME Within the framework of DG Research and its major implementation instrument, the FP5, we have identified three possible routes to obtain funding for CASSIOPEE. Two
143

CASSIOPEE
of these routes – via the JRC and through the FP5 Information Society Technologies Programme (which is administered by DG Information Society) – have already been discussed. The most applicable route to DG Research, however, lies through the FP5’s thematic programme: Energy, Environment and Sustainable Development (EESD). The EESD is especially relevant in that it specifies one of its key actions as “global change, climate and biodiversity.” The budget of this programme is larger than that of most of the other DGs, being € 2125M for the 1998-2002 time frame. Of this, however, only € 1083M are allocated to the Environment and Sustainable Development sub-programme which is most applicable to this project [EESD 2000]. Dividing this sum among four key action areas, generic and infrastructure research, as well as the administrative/executive costs associated with the FP5, it turns out that there are not large enough sums available to fund CASSIOPEE. Also, similar to DG Environment officials, executives from DG Research stated that they (and EC in general) were unlikely to fund the development of a microsatellite project. Instead, they pointed to ESA for such focused Earth Observation development. (Obtained from teleconference with Jean-Paul Malingreau, DG Environment and an informal meeting with Errol Levy, DG Research).
6.4.1.2 European Space Agency ESA was recommended by various experts in space business and financing as the most probable source of funding, and we were able to identify a number of different programs within ESA that are closely related to the mandate of CASSIOPEE. These included the Data User Programme (DUP), Technical Demonstration Programme, and, most significantly, ESA’s Earth Observation Strategy. The Earth Observation Strategy is sub-divided into two major programmes: the Earth Watch Programme and the Earth Explorer Programme. It is also significant to note the existence of the Earth Observation Envelope Programme (EOEP) which basically supports the development (currently) of the Earth Explorer missions.
6.4.1.2.1 DATA USER PROGRAMME ESA’s Data User Programme (DUP) was set up with its first goal as “defining, establishing and validating market-oriented services for information products derived from Earth-observation data [Guignard 1998].” We envisaged this programme as a possible source of funding when considering the possibility of producing and selling of value-added products. If this possibility had matured, then the DUP would have been an excellent programme to fund the initial set-up of the data networks and processing capabilities. However, after having determined that it was unlikely that there was a sufficient market to set up the products and value-added products as a private enterprise (see Marketing Analysis & Case Studies, Section 6.1) the possibility of the DUP as a source of capital became extremely remote.
6.4.1.2.2 TECHNOLOGY DEMONSTRATION PROGRAMME Insofar as CASSIOPEE’s technical solution could be viewed as a technological demonstrator, some attention was briefly given to ESA’s Technology Demonstration Programme (TDP). However, it very quickly becomes apparent that it is not feasible to use this programme as a source of any significant amount of funding. Firstly, the programme is an optional programme without access to a large amount of money.
144

CASSIOPEE
Secondly, the programme is focused more on the opportunities and benefits of on-board autonomy than on the environmental or remote sensing aspects of CASSIOPEE. Finally, most of the programme’s resources are currently in use. Present funding is split almost entirely between two main activities: a research operation to produce supportive software for automated systems, and PROBA, a microsatellite project researching on-board autonomy.
6.4.1.2.3 EARTH WATCH ESA’s Earth Observation Strategy, now entitled “The Living Planet,” presents a strategy that has goals very close to those supported by CASSIOPEE. Its three objectives are: “to develop our knowledge of the earth, to preserve the Earth and its environment, and to manage life on Earth in a more efficient way” [ESA 2001]. While all of these represent ultimate goals of the project, preserving the environment via monitoring climate change substances as required by the Kyoto protocol is the primary focus of CASSIOPEE. Clearly, the Living Planet is a possible programme through which funding can be obtained. Earth Watch missions – one of two broad divisions of missions within The Living Planet - are considered as the pre-operationally funded missions that are well defined to suit the needs of specific users. Its missions tend to focus on the development of long term and, ideally, self-sustaining earth observation projects. In particular, Earth Watch missions tend to offer only initial development funding, with funding for the operational phase of these missions to come from other places. ESA states that it “will undertake Earth Watch missions in partnership with industry, commercial venture organisations, agencies (such as EUMETSAT) or other public entities like the EC” [ESA 2001]. As stated before, CASSIOPEE fits very well into the overall mission of ‘The Living Planet.’ It also fits very closely the model of an Earth Watch mission in that it is designed to ultimately serve the needs of well-defined users (firstly the decision-makers of the states which signed the Kyoto Protocol, and secondly the scientists who improve the atmospheric models using the data provided by this project’s technical solution. See Section 2, and Section 6.2). The only difficulty with respect to fulfilling a role as an Earth Watch mission is that it has already been established (Section 6.1) that there is currently no commercial market large enough for CASSIOPEE to be feasible. In short, under Earth Watch, public funding would be required for the operational phase of CASSIOPEE. Since the operational costs are small enough (Section 6.3) it is feasible to obtain funding for operations from the EC via DG Environment or DG Research. Either of the options would be possible because our mission falls within the mandate of both of these organizations. So certainly this becomes an extremely promising option; however, there are a few shortcomings. The most obvious of these is that funding must be coordinated jointly between two public organizations. While this may at first seem unlikely and difficult, such a set-up may be facilitated via the Global Monitoring for Environment and Security (GMES) initiative between ESA and the EC. Despite this, a joint operation such as this, whereby the EC must commit to funding CASSIOPEE operations after
145

CASSIOPEE
Earth Watch status ends some 3 or more years in the future necessarily involves an inherent added risk.
6.4.1.2.4 EARTH EXPLORER The other missions identified within the Living Planet Programme are the Earth Explorer missions. While Earth Explorer shares the same goals of the Living Planet with Earth Watch, Earth Explorer “focuses on process studies and the demonstration of observing techniques [and] is foreseen as a significant European contribution to fill the gap in current data provisions and in paving the way for advances in operational observing system.” [ESD 1998]. This too, fits very well into the goals and benefits of CASSIOPEE, which will demonstrate for the first time ever that greenhouse gases – in particular carbon dioxide, nitrous oxide and methane – can be measured by an inexpensive microsatellite constellation to an accuracy and precision that can be used in the verification of international policies. This, and the resulting monitoring for the Kyoto Protocol, is the primary goal of CASSIOPEE and, as such, places it squarely within the realm of the Earth Explorer missions. There are two different types of Earth Explorer missions: “Core Missions will respond directly to specific areas of public concern and will be selected through widespread consultation within the research and scientific communities. … Opportunity Missions will use smaller, low-cost satellites, and will be less complex and quicker to implement. They will be more frequent and respond to evolving situations or areas of immediate environmental concern” [ESA 2001]. Given this basis, it seems likely that CASSIOPEE would be very favourably considered within the realm of possible opportunity missions. ESA officials have stated that the latest limit on funding for Earth Explorer Opportunity Missions is € 110M. The obvious deduction from all of this information is that CASSIOPEE’s prime and ideal source of funding is to submit a proposal to be an Earth Explorer Opportunity Mission. Of the two most feasible funding alternatives (the first one being through Earth Watch and described above), this is the one which we would favour most because of the better matching of our mission with the Earth Explorer mandate and because of the greater simplicity – and thus, lower risk – involved in the financing.
6.4.1.2.5 A WORD ON THE GMES INITIATIVE CASSIOPEE can be seen to be falling well under the umbrella of the GMES initiative (as was mentioned briefly in Section 3.1.2) between EC and ESA, and, as such, it can be viewed as both a proponent and a client of the plan. Of particular interest to us, is that The common ‘EC/ESA masterplan’ for GMES has made special note of the Kyoto Protocol as a consideration of its policy drivers: “The KYOTO Protocol in particular calls for specific contributions by the different parties to the setting up of global observing systems. The recent US decision not to ratify the Protocol makes it even more important for Europe to play a leading role in global environmental management. GMES will support such a role by organising and facilitating access to the relevant global information”
146

CASSIOPEE
This makes it very clear that CASSIOPEE’s mission falls squarely under the umbrella of the GMES agreement, which puts it on very firm ground for ESA and/or EC funding. Finally, it is important to note that both Earth Watch and Earth Explorer Programs are a part of the current GMES plan, however it is significant to note exactly where they are located within that plan. The Earth Watch Programme is currently being incorporated into GMES, under what is known as GMES strand 2. The Earth Explorer Programme is considered as part of strand 3 of GMES, which is not part of the GMES 2001-2003 implementation plan.
6.4.1.3 Financial institutional banks & industry Looking for funding away from the public sector, there are two major subgroups of Financial Institutional Banks from where financing theoretically possible: the European Investment Bank (EIB), and the broad class of private banks. Certainly, these alternatives have the amount of funds necessary, however they are a very unlikely and undesirable source of funding. They are undesirable because of the high cost of the capital that would be obtained from them (i.e. interest rates). Indeed, over the proposed 8-year development and operational lifetime, these costs could easily double the overall cost of the mission. Also, the banks are an unlikely source because of the high risks inherent to space projects (see Section 6.5 on Risk Management) combined with large capital requirements before the beginning of operations. We briefly investigated the possibility of obtaining investments from industry, however this seemed quite infeasible, especially for the design phase of the project. This reflects the standard distribution of funding sources over the course of an industry’s development, and is due to the high risks involved at the onset of innovative programs. Clearly, investment for profit is very difficult to justify in the initial phases of (relatively) high-risk space ventures.
6.4.1.4 Comments regarding other avenues for funding A number of other organizations and operational plans were considered in order to fund CASSIOPEE. This included examining the role of EEA in financing environmental solutions, examining the possible role of EU member states towards financing their commitments within the Kyoto Protocol and considering the possibility of some sort of PPP financing option to fund the operational stage of the project.
6.4.1.4.1 EEA Officials at the EEA stated emphatically that the EEA does not provide project resources. That being said, however, the EEA can serve a possible role in obtaining funds – especially via the EC. Theoretically, proposals to the EC regarding environmentally driven projects would be evaluated in consultation with the EEA. While this does happen occasionally, in practice, this is not a routine procedure.
6.4.1.4.2 MEMBER STATES Officials within ESA, various DGs and the EEA all emphasized the importance of support from EU and ESA member state(s). This was essential in order to provide full encouragement to the funding body that the project would meet the needs of its
147

CASSIOPEE
members. At the very least of course, there must be a carrier from one member state to take a proposal based on CASSIOPEE to the EC or ESA. Also, the idea of obtaining funding directly from a member state was looked into briefly. Many countries have policies and programmes that support technological developments from small and medium-sized enterprises (SMEs). An example of this is Germany’s ZUTECH which supports “future technologies for SMEs”. Unfortunately, the level of funding is inadequate. European countries rarely individually fund projects of the scale of CASSIOPEE. Instead, this was the designed purpose of both the EC and ESA, and it is for this reason that these two sources were investigated most thoroughly.
148

CASSIOPEE
Funding Programme Considered
Quantity of Available Funds
Compatibility of programme mandate with CASSIOPEE goals
Risk involved with programme
Experts Advice
DG Environment NO YES LOW NEG DG INFSO NO NO -- -- JRC NO (not really) -- -- FP5 – EESD NO YES LOW NEG ESA – TDP NO NO -- -- ESA -- DUP NO NO -- -- ESA – Earth Explorer YES YES LOW POS ESA – Earth Watch YES YES MED POS Member States MAYBE SOME MED ?? Financial Banks YES NO HIGH NEG Industry YES NO HIGH NEG
Table 6-3: Summary of benefits/detriments of different funding possibilities
Table 6-3 summarizes the characteristics of the different programmes that have been investigated and demonstrates why the Earth Explorer Programme is CASSIOPEE’s best possible funding source and how the Earth Watch Programme is also a very promising option.
6.4.2 Life cycle distribution of required funds While the total costs presented in Section 6.3 are one of the biggest factors looked at by potential financers of a project such as CASSIOPEE, these funding organizations also want to be able to predict the allocation of funds necessary for the entire lifetime of the project. In order to determine this, estimates of the percentage distribution of costs over the different phases of the project were obtained using a logical evaluation of how costs would be distributed over time as well as the expertise of the various members of the project. The resulting distribution of required funding as well as the sector breakdown of these costs within the project is shown in Table 6-4.
2002 2003 2004 2005 2006 2007 2008 Total Space 3.45 6.90 5.18 1.73 17.25 Ground 0.30 0.30 0.30 0.38 0.08 0.08 0.08 1.50 Launch 17.64 0.64 18.27 Operations 0.60 0.60 0.60 0.60 2.40 Total 3.75 7.20 5.48 20.34 1.31 0.68 0.68 39.43 Cumulative 3.75 10.95 16.43 36.76 38.08 38.75 39.43
Table 6-4: Life cycle distribution of required funds (M€)
149

CASSIOPEE
The results obtained using the method described above were compared with a standard time spreading of costs model that was developed using the past experience of actual space programs [Wertz 1999]. This model analytically produced the estimation of cost distribution over the proposed lifetime of CASSIOPEE. The analytical model distribution is plotted in Figure 6-2 against the estimates seen in Table 6-4. The analytical model clearly validates the estimations used to produce Table 6-4, with the only deviation between the curves occurring – expectedly – due to the large one-time cost of launching.
0.00
5.00
10.00
15.00
20.00
25.00
30.00
35.00
40.00
45.00
2002 2003 2004 2005 2006 2007 2008
Mission timeline
Cum
ulat
ive
cost
[M€]
Estimated cost spreadingAnalytical cost spreading
Figure 6-2: Analytical and Estimated Life Cycle Cost Distribution
6.4.3 Funding of the “next step” for CASSIOPEE Equally as important as funding the actual design, development, and operations of CASSIOPEE is the funding of what has been termed the “next step” in CASSIOPEE’s development plan. This next step would involve more detailed analysis and feasibility studies in many of the different sections that are incorporated into the CASSIOPEE environmental solution. It is difficult, at this current time, to put an exact figure on the costs of this “next step” because these costs would depend upon exactly which studies, designs and analyses would be carried out. This, it is anticipated, will be more exactly defined by the European “carrier” organization that will eventually set up a formal proposal to design and operate CASSIOPEE. Despite this uncertainty as to the exact make-up of this next step of CASSIOPEE, it is certain that it will require a much smaller amount of financing than the development and operational costs. Because of this, there are many more possible sources of funding available.
150

CASSIOPEE
The avenues approached in Section 6.4, can again be examined with respect to funding more in-depth studies of the CASSIOPEE solution. It is clear on the basis of the compatibility between CASSIOPEE and the mandate of various EC programs, that only DG Environment and DG Research (through the FP5 program) can be considered as viable options for next step funding. Contacts at DG Environment (teleconference with Jean-Paul Malingreau) suggested that DG Environment was generally not interested in sponsoring satellite programs. DG Research, however, is a very possible option for financing the next step in the development of CASSIOPEE. Through the EESD thematic program under FP5, there are enough funds for supporting a mandate inclusive of CASSIOPEE’s mission. ESA, under the framework of their Earth Observation Envelope Program (EOEP) has some funds allocated to aid in a more detailed research and analysis of possible future ESA proposals. This, it would seem, would be ideal for CASSIOPEE, as we have identified ESA as the most likely financer of the eventual solution. There is also the possibility of appealing to ESA for funding directly, not in response to an ESA program request for ideas. Other possibilities also exist for next-step funding of CASSIOPEE. Member states – particularly the states associated with the organization that will eventually propose CASSIOPEE to ESA – are one promising source of funding. Also, the EU has some funding options available for the enhancements of projects such as these. Finally, it is very possible that universities may make some of their research funding available to investigate and promote the next phase of CASSIOPEE. This could be used alone, or in combination with other finance arrangements listed above.
6.5 Risk analysis
6.5.1 Risk identification Monitoring the environment is public good. In other words, this will be a non-profit mission targeting public benefit. This means that the financial risks will be different from those of a project aimed at making a profit. For a profit-seeking project, insufficient revenue stream is a risk that is important to address. However, the objective of CASSIOPEE is not profit, and hence, the major risk of the project is being able to secure start-up and operational funding. To perform a risk analysis the different individual risks have to be identified. Due to the time limitations of this report, a quantitative risk analysis was not performed. Instead a qualitative risk analysis was done with the purpose of identifying the individual risks and then discussing how to reduce these risks.
6.5.1.1 Funding risks It is possible that other projects have some of the same mission requirements as CASSIOPEE. Should this occur, the CASSIOPEE mission would no longer be unique. This will have a major impact on the ability to get funding for the constellation. Potential social and public benefits are also a concern to funding sources. If the benefits addressed under Section 6.2 are not as great as was initially estimated, the
151

CASSIOPEE
national authorities in different countries will not see the justification for a system like CASSIOPEE. With the mission statement and requirements that are defined under this project, a low cost mission is foreseen. The cost of CASSIOPEE should therefore be reasonable and should not significantly exceed the costs of earlier microsatellite projects. The higher the CASSIOPEE costs, the lower the probability of securing funding. This problem is irrespective of which of the funding options described within Section 6.4 is utilised. There will not be any income generated from the project, as there is not a foreseen market large enough to support doing so. Therefore full funding must be obtained to make the project possible. If only part of the required funding is found the chances are small for the project to succeed.
6.5.1.2 Technical risks Because some of the systems have never flown in space before, the technical risk of the constellation’s current design is high. Table 6-5 shows the different subsystems in the satellites and shows that at least three components are not space qualified. In addition some of the space-qualified instruments have little or no space heritage (i.e. just flown in space a few times). This increases the risks for the spacecraft to fail in orbit. The onboard propulsion system has not flown in space before and thus the risks for not maintaining the correct orbit are greater than with conventional propulsion systems.
Subsystems Redundancy Space qualified
Reliability Heritage Global evaluation of risk
Propulsion No No High Sensors Yes, single
fault except star tracker
Yes, except for GPS receiver
Some Low
Actuators For some part Yes High Some Low Structure N/A Yes High, but
concerns with the epoxy
No complete C-F structure flown yet
Med
TT&C Yes Yes High High Low Payload No No Not known No space
history for the current technology
Med
OBDH Yes Yes High High Low Thermal No Yes High High Low Power No Yes High High Low Launcher N/A N/A 93% Yes High
Table 6-5: Risk parameters for different subsystems
152

CASSIOPEE
As in all space projects, the launcher is a big risk factor. Different launchers have completely different risks and the higher the risk, the higher the insurance premiums. The characteristics of some of the various launchers considered for the CASSIOPEE project are shown in Table 6-6. This clearly demonstrates some of the trade-offs that must be considered between cost, performance and reliability. (For CASSIOPEE, performance, as listed in Table 6-6, is not extremely important due to the small mass of the payload.) It is important to note that despite the apparently perfect reliability of the Rockot SSLV and Taurus launchers, this is not nearly statistically significant due to the limited number of attempted launches (1 and 3 respectively).
* Based on historical data
Vehicle Kosmos 3M Rockot SSLV
Taurus Ariane 4
Vega
Performance SSO [kg] 775 1000 660 2845 ? Cost Max M$ 12 15 20 85 ? Cost Minimum M$ 12 13 18 65 ? First Flight 1967 1994 1994 1990 2005 Total Orbital Flight 420 1 3 86 0 Launch Vehicle Successes 398 1 3 83 0 Reliability* 0.948 1 1 0.965 N/A
Table 6-6: Characteristics for different launchers
6.5.1.3 Implication of loss of satellites The loss of satellites is the most damaging occurrence that could happen to the project. If a satellite is lost, the mission objectives might not be met. However as the system is designed at present, the loss of one satellite may not jeopardize the whole mission. If a satellite is lost, the revisit time of the system will decrease and hence the coverage. How much the revisit time will decrease is dependant on which satellite is lost. The first satellite in orbit is more critical than the other two. This means that it is more harmful to lose a satellite when all satellites are in orbit than to lose one during launch. If the first satellite is lost during launch it is always possible to put another satellite into the same orbit, provided the satellites are launched with different launchers.
6.5.1.4 Macroeconomic risks Because the mission is focusing on Europe, the funding will most likely be obtained from European sources. This will in most cases imply that European companies will be used in the development of the satellite. In case the project would receive private funding, it would be possible to use companies in other countries for development. Contracts could be handed to the qualified contractor with the most competitive bid regardless of nationality. As well as increasing the total risk of the project due to the stricter constraints for not exceeding budget, this would also increase the currency and interest risks.
153

CASSIOPEE
However, according to OECD statistics, in the year 2000 the economic situation in Europe was very stable, the unemployment rate was low and the future looked bright (Statistisk årbok 2001). Even though the technology market has experienced a rough time over the last year, the probability of having a major setback in the European economy is not likely. Since the introduction of the Euro, currency risk in Europe has diminished. Therefore macroeconomic risks of doing a project like CASSIOPEE are small.
6.5.1.5 Programmatic risks One important programmatic risk factor that affects CASSIOPEE and other small satellite projects is that they require a lean management structure. The risk here is that each individual is of greater significance for the project than each individual in a much larger project. To lose one person may have big impacts on the overall schedule and therefore on the costs.
6.5.1.6 Political risks Recently the Kyoto agreement has been a hot topic as the political attitude towards environmentalism for the moment is quite high. It is difficult to determine if this interest will increase or decrease the following years, but the trend in the last few years has been that politicians care more and more for the environment. However, there is a risk that, over time, the interest for the Kyoto agreement will decrease. If CASSIOPEE is primarily funded by ESA, a restriction on what type of launcher may be implemented is possible. For instance, occasionally it has been seen that ESA restricts the launchers to the ESA launchers available. Ariane 5, Vega and Ariane 4 are the only available ESA launchers. Ariane 4 is not an alternative for this kind of satellite and Vega is not qualified yet. This may constrain the launch to an Ariane 5 “piggy back” launch. A “piggy back” launch results in a higher risk of postponement because the satellite is not the prime payload of the launch. This is because it would be the first part of the launch payload to be removed in case of uncertainties or difficulties.
6.5.2 Risk reduction and mitigation To ensure the success of the mission and to get the necessary funding, a risk reduction and mitigation plan has to be conducted. In the following section different ways of how to mitigate risks discussed above are considered.
6.5.2.1 Funding One of the main risks discussed is the risk for not getting funding. There are several ways this risk can be dealt with. One possible mitigation technique is to try to get funding from multiple agencies and authorities and reducing costs for each individual institution. This decreases the risks for not getting funded, but at the same time increases the risks for any single funding source to withdraw from CASSIOPEE at one point in time. Since microsatellites are considered as high-risk projects, authorities themselves, may want to not spend too much money on one project, but rather split the risk with other funding organizations.
154

CASSIOPEE
One way to reduce costs, and thus decrease finance risks, is to use a free launch. A feasible example of this is to use some of the qualification launches of the Vega Launcher, which are scheduled to be in 2005 (roughly the same time at which CASSIOPEE has tentatively scheduled its launching). This will increase the risk since the launch then will be a qualification launch. This will also increase the insurance costs of the launch. However, the benefits of the Vega qualification launches include decreased costs and a decrease in the risks of being removed from the payload that are inherent in piggy-back launches. No matter which launchers are used, one way to reduce the risk of losing all the satellites is to launch the satellites on three different launches, this will lead to higher risk of losing one satellite and higher cost of the mission. This is a trade-off that has to be taken into consideration.
6.5.2.2 Technical Due to the high risks inherent in microsatellite projects, it has been normal to insure the satellites only for launch, and not for their operational period. This option is being recommended for CASSIOPEE as well. By insuring the launch, we insure the satellites during the phase of the project with the highest inherent risk, and so mitigate that risk. However, it is unlikely that the risk reduction achieved by insuring them throughout their operation is cost-effective. For launch insurance, the higher the reliability, the less insurance premium; hence a Vega launch will have a higher premium compared to an Ariane 5 launch. When selecting launcher the launch costs, the reliability and the insurance premiums have to be compared.
6.5.2.3 Political, programmatic and macroeconomic risk Political, programmatic and macroeconomic risks are hard to reduce. However, if the funding process is started at a point where the political climate for environmentalism is good, it will be easier to get funding.
6.5.3 Recommendations Because loss of the satellite that has six passes over Europe will have much larger consequences for the mission than the loss of any of the two other satellites (which have only 3 passes), it could be preferable to launch just one satellite on the first launch. If first launch is a success, the other two next satellites could be launched in one launch. While this would be a solution to minimize the launch risk, it is not necessarily a cost-effective strategy. And, in fact, to minimize funding requirements – and , in so doing, decreasing financial risk – we are recommending a single launch for the entire constellation.
6.6 Management & operational plan
6.6.1 Outline of management plan This section details the outline of a management plan for the implementation of the CASSIOPEE micro satellite constellation. This plan represents the work that will be performed to meet the needs of the CASSIOPEE project and its goals.
155

CASSIOPEE
This management plan describes the activities of the project as a whole, at the highest level. At this phase of the project, only the broadest outline of a possible management plan can be produced, based on expert advice and the experience of likely funding institutions.
6.6.2 Organisational issues to be addressed • The CASSIOPEE project has not yet achieved any public recognition or
visibility; this will change when the system is presented at the IAF Congress in October 2001.
• The CASSIOPEE project does not currently have an organization to support its implementation. This could be achieved by a number of solutions:
o A preliminary-design team derived from the ISU 2001 CASSIOPEE team could form a company for the development of CASSIOPEE
o A partnership in industry or academia could be formed to develop CASSIOPEE
o A spin-off company could be formed to develop CASSIOPEE In order to create a suitable company structure, especially for a relatively small project, a matrix structure would be best. The reasons for ignoring a hierarchical system are simple. Large companies use such a system to organize facilities and resources in the most cost effective way. As a CASSIOPEE company would not have any resources or facilities, and it would be too expensive to develop them for just one mission, the most viable structure is a matrix one.
6.6.3 Deliverables In order to integrate well with the funding structure used by ESA, the most likely funding body for the CASSIOPEE project, we will provide six monthly milestones reports during all phases of the project. In addition to these milestones we would provide launch and check out phase, end of operations and science reports at the appropriate times shown on the Gantt chart (Section 6.6.5). All deliverables would be timed to correspond with cost requirements so the next stage of the project would be funded on receipt of previous phases milestone.
156

CASSIOPEE
6.6.4 Operational goals Goal Reference
Goal Completion Date
CAS1 To present CASSIOPEE project to policy makers Oct 2001 CAS2 Develop CASSIOPEE group or partnership Jan 2002 CAS3 Negotiate Phase A funding for CASSIOPEE Mar 2002 CAS4 Deliver practical solution for greenhouse gas
monitoring Jan 2003
CAS5 Design and build CASSIOPEE satellite system Jan 2005 CAS6 Develop integrated user driven ground segment Jan 2005 CAS7 Investigate greenhouse gas emissions as applicable
to Kyoto agreement Jan 2008
CAS8 Determine commercial viability of environmental monitoring
Jan 2008
Table 6-7: Operational Goals of CASSIOPEE and Scheduled Completion Dates
The scheduled plan to achieve these goals is shown below in section 6.6.5.
157

CASSIOPEE
6.6.5 Gantt chart for implementation of CASSIOPEE Shown below is the estimated timeline for the project: The length of different phases is shown along with dates for fixed milestones.
158

CASSIOPEE
6.6.6 Project organisation The key personnel in the CASSIOPEE project would be the item managers for each function of the mission. Project Manager Most Likely ESA Personnel who will interface with the CASSIOPEE management group. Item managers CASSIOPEE or partner organisation personnel The CASSIOPEE group could be a matrix structure where a management group ran in parallel with the other groups rather than directing the entire project. There would be task or item managers for each specific area possibly organized as below:
SpacecraftTask 3
InstrumentsTask 2
Data handlingand down link
Task 6
Space Segment
GroundsegmentTask 4
OperationsTask 5
System assembly,integrationand testTask 7
Ground
ManagementTask 1
Management
LaunchTask 8
Launch
Cassiopee
Figure 6-3: Possible CASSIOPEE project organisation
For each of the tasks, an item manager would be assigned and he/she would develop a team to complete the required task. If a partnership in industry was created then the team would include industrial partners/contractors to carry out the work. Work tasked in-house would have to be accounted in terms of people required and hours needed to complete the work. Outside contractors would probably be tasked via fixed price contracts. While this would probably increase cost, it would also reduce risk.
6.6.7 Task definition The mission is defined below in terms of a task breakdown for each element of the matrix structure of a possible CASSIOPEE group.
159

CASSIOPEE
Task Number
Title Description
Task 1 Management This task covers the management of the entire programme and reporting of the status of the mission to the funding body. The task includes the definition of end-to-end mission specifications to sub-system level to enable assessment of preliminary design and confirmation of cost and schedule for the programme. Management also has responsibility for document control and maintenance of quality standards. Alignment of project with academic programme of work to support CASSIOPEE mission.
Task 2 Instruments The platform will utilize an existing spacecraft bus into which standard instruments will be integrated. The development required here should relate to the inter-operation of the new and COTS components selected for the mission.
Task 3 Spacecraft Production of flight model space segment and integration ready for launch.
Task 4 Ground segment
Integration of ground segment with requirements of users as defined by funding body, within distribution policy of the funding body.
Task 5 Operations
Operation of CASSIOPEE including technical assessment of system.
Task 6 Data handling and downlink
Production of unit to control radiometers, receive data and transmit to ground through funding-body-selected ground link.
Task 7 System assembly, integration and test (AIT)
Integration of radiometers, spacecraft and data handling equipment as a space system of three satellites. End-to-end testing of ground and space segments and system level launch and environmental testing.
Task 8 Launch provision
Identification, negotiation and purchase of suitable launcher providing guaranteed access to space within project timeline.
Table 6-8: Task breakdown of CASSIOPEE
6.6.8 Management and operational changes over time As the mission matures the number of personnel required in each task group will change. This makes fixed price contracts for specific activities attractive as it reduces the flux in personnel that CASSIOPEE would otherwise face. As an example of this, described below is a likely operations team scenario. The time line starts six months before launch and it is assumed that the satellite is near
160

CASSIOPEE
completion and all data formats for the down-linking of data are specified, and that all onboard software is written. As it is possible that CASSIOPEE will utilize an ESA ground station, it is assumed that data from the satellite will be sent to a central position and have to be processed to the level of a data product. It is also possible that crossover work with universities has provided suitable algorithms for implementation with CASSIOPEE data. Launch minus six months The operations team leader will identify a team to complete the work and get commitments of time from them. The team would typically include:
• A technical leader • 2 support scientists • 2 processing personnel
During this period the best possible algorithms should be identified and coded into controlled software, which should be thoroughly tested and made deployable to whichever computing system is required. Launch minus two months: Data from the engineering model should be collected and the end to end system (or a close simulation) used to test the real data output from the satellite. Assessments of bit error rates should be made and robust data correction algorithms implemented within the processing suite. Adjustments and calibration techniques, and their software implementations should be thoroughly tested and validated. One week post launch: Check out commands should be uploaded to satellite so initial state of health can be processed. First data take commands sent to satellite and data downloaded to checkout sensor and integrity of processing system. Six months post launch: During this period all necessary adjustments and refinements should have been made. This process may be very complex and extended if many different lighting and atmospheric conditions have to be taken into account. During the first year of operations it would be expected that the manager, technical leader and both support scientists would work full time on the project, with the processing personnel spending half their time familiarizing themselves with the project. In subsequent years the day-to-day operation would lie with the junior members of staff and some oversight by managers and the technical leader. The work scoped out in this period would not include public outreach or ground-truthing programmes for CASSIOPEE.
161

CASSIOPEE
References [Bearden 2001] Bearden, David A. “Small-satellite Costs” Crosslink: The Aerospace
Corporation magazine of advances in aerospace technology (Winter 2000/2001), pp.33-44.
[Bonnefoy 2001]
Bonnefoy, R. & Arend H., 1996 (cited Aug 2001, updated Feb 1996) ESA’s Earth-Observation Strategy. <http://esapub.esrin.esa.it/bulletin/bullet85/arend85.htm>.
[DG Env 2001] Commission of the European Communities, Environment 2010: Our future, Our choice, The Sixth Environment Action Programme, Brussels, January 2001.
[ESD 1998] Earth Sciences Division, ESA (Chris Readings, co-ord), The Earth Explorer Programme: The Science and Research Element of ESA’s Future Earth Observation Programme, ESA Publications Division, Noordwijk, The Netherlands, 1998.
[ENVISAT] ENVISAT. ENVISAT home page. 6 September 2001. <http://envisat.esu.int>.
[ESA 2001] ESA (pub), 2001. (Cited Sept 2001, updated Feb 2001), ESA Satellite Applications Observing the Earth Living Planet. <http://www.esa.int/export/esaSA/GGGQPU8RVDC_earth_0.html>.
[ESA 2001b] ESA (pub), The common ‘EC/ESA masterplan’ for GMES INFORMATION NOTE, Paris, France, 2001.
[EUMETSAT] EUMETSAT. EUMETSAT home page. 6 September2001. <http://www.eumetsat.de>.
[EC 2000] European Commission, 2000, (cited Aug 2001) Financial Instruments. <http://europa.eu.int/information_society/basics/financial/index_en.htm>.
[EC 2000b] European Commission, Economic Evaluation of Sectoral Emission Reduction Objectives for Climate Change, Report from European Commission - Environment, 2000.
[EC 2001] European Commission, 2001, (cited Aug 2001) Funding Opportunities. <http://europa.eu.int/comm/environment/funding/intro_en.htm>.
[EESD 2000] European Communities, 2000, (cited Aug 2001) CORDIS: EESD: Energy, Environment and Sustainable Development Home Page. <http://www.cordis.lu/eesd/>.
[JRC 2001] European Communities, 2001, (cited Aug 2001) Joint Research Centre. <http://www.jrc.cec.eu.int/index.asp>.
[Guignard 1998]
Guignard, J-P, Pittella, G., and Hougs, S., The Earth Observation Data User Programme, ESA Bulletin, ESA & ESRIN, 1998.
[Isakowity 1999]
Isakowity, Steven J., Hopkins, Joseph Jr. and Hopkins Joshva, International Reference Guide to Space Launch Systems, 3rd Edition, American Institute of Aeronautics and Astronautics, 1999.
[NRC 2000] National Research Council, The Role of Small Satellites in NASA and NOAA Earth Observation Programs, National Academy Press, Washington D.C., 2000.
[Sargeant, 1999]
Sargeant, A.: Marketing Management for Nonprofit Organizations, Oxford University Press, Oxford, 1999.
[Soh 2001] Soh, W. “Air Pollution Monitoring Using a Constellation of Small Satellite” Proceedings of the 2001 ISU Symposium.
[Wertz 1999] Wertz, James R and Larson, Wiley J. Space Mission Analysis and Design. Torrance: Microcosm Press, 1999.
[QINETIC] <http://www.qinetic.com>.
162

CASSIOPEE
[Belleval 2001] C. Belleval: The CNES Micro-satellite MYRIADE Program as a Laboratory for Innovative Methods of Space Project Management. ISU Symp. "Smaller Satellites:Bigger business?" 2001.
163

CASSIOPEE
7. Air quality mission concept With increasing population, infrastructure, and highly developed industry, Europe has serious impacts on its natural environment. Air quality is a major concern to local and national governments, and therefore additional environmental research focusing on air pollution is included as a separate mission concept for the CASSIOPEE system. Above their natural concentrations, many gases in the atmosphere are poisonous to humans and animals and damaging to plants. This is especially true for ozone (O3), sulphur dioxide (SO2), nitrogen dioxide (NO2), carbon monoxide (CO), and a wide range of volatile organic compounds (VOCs). Some of the latter, including benzene and butadiene, are even carcinogenic. When referring to all these potentially toxic gases, we simply use the term “air pollutants”. The World Health Organization (WHO) guideline values for the major air pollutants are provided in Table 7-1.
Compound
Annual ambient air concentration [µ g/m3]
Observed effect level [µ g/m3]
Uncertainty factor
Guideline value [µ g/m3]
Averaging time
100 000 15 minutes
60 000 30 minutes
30 000 1 hour Carbon monoxide 500-7000 n.a. n.a.
10 000 8 hours
Lead 0.01-2 n.a. n.a. 0.5 1 year
200 1 hour Nitrogen dioxide 10-150 365-565 0.5
40 1 year
Ozone 10-100 n.a. n.a. 120 8 hours
1000 2 500 10 minutes
250 2 125 24 hours Sulphur dioxide 5-400
100 2 50 1 year n.a. not applicable
Table 7-1: WHO guideline values for the “classical” air pollutants [WHO 2000]
When the local air pollution is dominated by emissions from one source sector and well-established emission ratios exist for the substances in question, the levels of one pollutant can be determined from the measurements of another. For example, traffic-related benzene and lead levels may in some circumstances be estimated from corresponding CO concentrations [WHO 2000]. In European urban areas, especially in some Western European cities, the most important air pollutants come from the transport sector, despite rigorous and effective measures taken to reduce car emissions. Figure 7-1 (Respective production of pollutants by the road transport sector in 1994 for 28 European countries [EEA 1997]) gives their respective production by the road transport sector. These pollutants have overtaken emissions from high-sulphur coal, oil, and industrial combustion processes
164

CASSIOPEE
[WHO 2000]. The continuing growth in vehicle use means that efforts to reduce emissions from individual vehicles are in danger of being overtaken by increases in the volume of traffic [EEA 1997]. Furthermore, in Eastern Europe, old cars are still being used even if they are unable to meet modern pollution control requirements.
6.5%
62.9%
0.9% 5.5%
24.5%
68.9%
0.8%
38.7%
0%10%20%30%40%50%60%70%
SO2 NOx NH3 N2O CO2 CO CH4 NMVOC
Figure 7-1: European road transport production of pollutants in 1994
The air pollution from motor vehicles includes both primary and secondary pollutants. Primary pollutants, produced by petrol-powered vehicles, include carbon monoxide (CO), nitric oxide (NO), benzene, particulate matter (PM), and lead. Much of the lead emitted by vehicles burning leaded petrol emerges as particles. Diesel engines, on the other hand, produce little CO but large quantities of CO2 and soot. Secondary pollutants, produced by photochemical reactions, include NO2 and O3. Reducing the amount of automobile pollution, and thereby reducing both of these classes of pollutants, is a hard and lengthy process.
7.1 Nature and significance of carbon monoxide Carbon monoxide, mainly resulting from vehicle use, is both a toxin and a representative tracer of other types of pollution. It is the most widely distributed and frequently occurring air pollutant. CO is emitted into the atmosphere as a result of combustion processes and is also formed by the oxidation of hydrocarbons and other VOCs. Fortunately, CO does not persist in the atmosphere, but is quickly converted to CO2. However, CO can reach dangerous levels in very localized areas, such as heavily travelled intersections or city streets. Figure 7-2 shows EU15 total carbon monoxide (CO) emissions falling from 1990 to 1996 by 20%, mainly through the introduction of catalytic converters on gasoline-powered automobiles [EEA 2000c]. There are no internationally agreed emission reduction targets or emission ceilings for CO.
165

CASSIOPEE
Figure 7-2: EU15 Emissions of CO [EEA 2000c]
Release of CO seems to exert its main effect in an indirect way. CO contributes to ozone formation (see Section 7.1.1), which is subject to control under the EU Ozone strategy. In addition, an increase in CO concentrations may also result in enhancing the concentrations of greenhouse gases in the troposphere [Wayne 2000] (see Section 7.1.2). Figure 7-3 (sector contributions in the EU to tropospheric ozone and climate change in 1996 [EEA 2000c]) illustrates the various sector contributions in the EU to tropospheric ozone and climate change.
Figure 7-3: 1996 EU contributions to tropospheric ozone and climate change
Because very few natural processes emit CO, this gas is a useful indicator of human activities. Increasing levels of CO correlate with increases in air pollution. Thus tracking CO from space [Resonance Ltd 1997] is a good way to observe the impact of human activity on Earth.
166

CASSIOPEE
7.1.1 Ground-level ozone production Prior to 1971, it was thought that the nitrogen reactions were the only mechanism responsible for the build-up of ground-level ozone. In that year, however, the work of Crutzen showed that CH4 and CO oxidation in polluted air were also responsible for the build-up of tropospheric ozone [Crutzen 1974, Levy 1974]. Since then, photochemical production within the troposphere, by the oxidation of CO in the presence of NOx, has been recognized as an important source of O3 [Chameides et al. 1992, IGOS 2000]. Evidence now suggests that in situ production of O3 is more significant than transport from the stratosphere [Liu et al. 1987; Mauzerall et al. 1996; Wang et al. 1997]. In most regions of the troposphere, production of O3 is limited by the availability of NOx [Chameides et al. 1992].
7.1.2 Reduction of hydroxyl radical concentrations Another global issue is the tropospheric self-cleaning capacity. Many compounds in the atmosphere are removed by reaction with the hydroxyl radical (OH) [Greiner 1967, Weinstock 1969, Levy, 1971]. The hydroxyl radical (OH) is the most important oxidant in the Earth's troposphere because it is largely responsible for the removal of many of the pollutants released due to human activity. In particularly, the OH radical is prominent in the removal of greenhouse gases such as methane. Once in the atmosphere, CO can be transported over long distances, eventually converting to CO2 by taking oxygen atoms from the hydroxyl radical [Chameides et al. 1992]. Elevated levels of CO will therefore reduce tropospheric OH concentrations. This will leave less chance for the atmosphere to clean itself of other pollutants and to remove greenhouse gases. Monitoring CO can allow us to understand the atmosphere cleansing processe and its implications for pollution levels [MOPITT 1993].
7.1.3 Global transportation: circulation patterns CO serves as a tracer for tropospheric air transferred into higher levels of the atmosphere. It is associated with deep convective activity that, above continental regions, often penetrates into the stratosphere. Deep convection has the potential to clean out pollutants in the lower atmosphere and to inject them rapidly into the middle and upper troposphere, thereby affecting global scale chemistry [Wuebbles et al. 1993]. CO is also an excellent tracer for observing global transport in the troposphere, which represents a challenge for scientists because of the variation in wind and weather patterns [NCAR 1999]. It lasts long enough in the atmosphere for the gas to be tracked, and its lifetime is short enough to prevent it from mixing evenly in the atmosphere, which would obscure its sources and paths. As such, the measurement of CO profiles has been identified as being of primary importance to improve our understanding of the environmental system [WMO 1985, Eos 1987, MOPITT 2001]. CO allows observers to follow other pollutants, such as nitrogen oxides (NOx), lead and benzene. These pollutants are produced by the same combustion processes but cannot be directly detected from space. CO monitoring can therefore help to identify the sources of air pollution.
167

CASSIOPEE
7.2 Environmental problem solving as a public good The main environmental problems associated with pollutant emissions are acidification and eutrophication of water and soils, and damage to natural ecosystems, cultural heritage and crops. In addition, exposure to air pollution can cause adverse health effects, most acute for children, asthmatics, and elderly people [WHO 2000] (see Table 7-2, WHO European Center for Environment and Health, Concern for Europe's tomorrow, 1995).
Estimated health impact of ambient air pollution in Europe
Indicator of health deficiency Proportion of the health deficiency attributed to the pollution
Estimated number of cases (annual)
Cough and eye irritation in children 0.4-0.6% 2.6-4 million
Lower respiratory illness in children 7-10% 4-6 million
Lower respiratory illness in children causing a medical visit 0.3%-0.5% 17-29 thousand
Ambulatory visits due to respiratory disease 0.2-0.4% 90-200 thousand
Decrease of pulmonary function by more than 5% 19% 14 million
Incidence of chronic obstructive pulmonary disease 3-7% 18-42 thousand
Hospital admissions due to respiratory disease 0.2%-0.4% 4-8 thousand
Table 7-2: Estimated health impact of ambient air pollution in Europe
Currently most of the European environmental agencies consider local and transboundary air pollution to be one environmental issue, especially since the effects of air pollution are interpreted as being interrelated through common causes, sources, and impacts (see Figure 7-4). Nowadays, policies to reduce emissions are increasingly considering pollution problems together in a multi-pollutant, multi-effect, multi-national approach.
168

CASSIOPEE
Figure 7-4: A multi-pollutant, multi-effect approach to pollution problems
Despite projected further emission reductions, ground-level O3 concentrations are expected to exceed EC threshold values by EEA member countries during the next decade [EMEP 1999, http://reports.eea.eu.int/signals-2000/en/page011.html EEA 2000a]. Substantial further reductions of emissions of ozone precursor pollutants are required to achieve the proposed NECD targets or the looser CLRTAP targets for 2010 [EEA 2000a].
7.3 Existing programs and their limitations A wide variety of non-satellite instruments and platforms are available and in operation for making routine CO measurements. However, global images of the pollutants are rare. The MAPS instrument - which has flown aboard the Space Shuttle four times from 1981 to 1994 – provided scientists with a near-global database of atmospheric CO levels. Since 1999, the MOPPIT instrument gives a complete view of the world's tropospheric levels of CO. MOPITT data have confirmed that CO can indeed travel great distances and thus local efforts need must be linked with a comprehensive national policy [MOPITT 1993]. Unfortunately these images only qualify the level of CO concentrations. Therefore, even an instrument giving a simple yes or no with a certain confidence level would be useful: the requirement of detection accuracy is not very high (± 20%) [IGOS 2000].
169

CASSIOPEE
Past/Current Missions
TOMS/SBUV O3, SO2, aerosol
O3, NO2, SO2, HCHO, H2O, O2/O4, clouds, aerosol GOME/ERS-2
MAPS/Shuttle CO
MOPITT/EOS-Terra CO, CH4
Polder/ADEOS Aerosol and Cloud Parameter
Future Missions
SCIAMACHY/ENVISAT O3, NO2, N2O, BrO, CO, H2O, SO2, HCHO, CO2 and CH4,O2/O4, cloud, aerosols
TES/EOS-AURA HNO3, O3, NO, H2O etc.
OMI/EOS-AURA O3, SO2, NO2, aerosol, clouds
O3, NO2, SO2, HCHO, H2O, O2/O4, clouds, aerosol GOME-2/METOP
IASI/METOP O3, H2O
Polder/ADEOS-2 Aerosol and Cloud Parameters
Table 7-3: Missions related to emission monitoring
In the following section, a system capable of measuring local CO concentrations throughout Europe and to producing high-resolution weekly regional maps of its distribution in the troposphere is described.
The CASSIOPEE baseline system can be adapted to the measurement of carbon monoxide in the lower part of the atmosphere. The mission could provide high-resolution monthly data on the concentration of CO in European cities. A single satellite would show local decision-makers the value of space-based data, especially when combined with a distributed ground system, revealing a more detailed picture of local pollution. The first satellite carrying this instrumentation would be a demonstration system, which is a prerequisite for the timely development of new services. Should there be a significant interest in data, a constellation of similar smallsats could make a useful contribution to air monitoring by providing better temporal and spatial resolution. Such satellites would also provide scientists involved with global and regional climate
7.4 Mission concept
170

CASSIOPEE
research valuable data to create and improve current models, as described in Section 2.5
7.4.1 System requirements The air-quality mission concept is comprised of several separate elements:
4. The baseline CASSIOPEE microsatellite bus with a CO reference cell 5. Airborne sensors for similar CO measurements 6. A network of ground sensors distributed through Europe’s 20 largest cities 7. A ground facility to process and integrate data from 1-3 above
7.4.2 Mission profile The baseline CASSIOPEE microsatellite system uses a gas correlation radiometer to measure greenhouse gases. These are extremely flexible sensors, capable of measuring any stable gas that has detectable absorption/emission features in the range of the infrared detector. See Section 4.5.2.1 for an explanation of the instrument operation. The baseline CASSIOPEE instrument design is based on the MicroMAPS instrument, built by Resonance Ltd. for the (cancelled) Clark spacecraft [Resonance Ltd 1997]. MicroMAPS is a low cost orbital remote sensor for the detection of CO and N2O. To obtain readings of CO concentration in the atmosphere, it is configured to observe the earth's IR radiance in a band centred at 4.67 microns.
The required spatial resolution could be achieved through the use of an eccentric, diving orbit. Instead of a 600km circular orbit, as used by the baseline CASSIOPEE mission, a 280x900km orbit would be better for spatial resolution. By lowering the altitude of perigee specifically so that the “dive” occurs at high latitudes, resolution is improved by a factor of greater than two. The orbital dive will precess around the northern latitudes, passing over North America, Russia and Japan (based on the parameters in Table 7-4).
The resolution of the system will also be increased by other factors. At lower altitudes there is several times the signal reaching the sensor. Due to the mode of operation of the sensor, this allows greater along-track resolution because the field of view can be divided into several smaller areas. There is a trade-off, because in the dive, the speed of the sensor over the ground will be higher, giving less time to integrate.
The problem remains however, of how cross-track resolution can be improved. This is where a departure from the CASSIOPEE baseline occurs. A CO sensor would probably require a movable mirror. Only a small moving collecting mirror would be required and with microtechnology actuators, should not produce significant extra
The baseline CASSIOPEE could be adapted to fly MicroMAPS, or a modified version of the baseline CASSIOPEE payload. Some CASSIOPEE systems changes are required to support this new instrument. Specifically, to get a significant spatial resolution, a change to the orbit is needed.
7.4.3 Orbit description
171

CASSIOPEE
integration requirements for power. The mirror would need around three times the radius of the original aperture to collect sufficient signal. With these two system parameter changes in place, a much higher resolution system can be implemented. The functional requirements on the orbit are shown in Table 7-4. They follow from the mission objectives and the performance requirements on the payload system.
Orbital parameters
Apogee 900km
Perigee 280km
Inclination 70o
Argument of perigee 75 o Right Ascension 120o of ascending node True Anomaly 0 o
Table 7-4: Orbital parameters for the CASSIOPEE air quality mission concept
The baseline resolution of CASSIOPEE is 15x15 km. A CO sensor flown at the suggested orbit would provide approximately 3.5x3.5 km resolution at perigee. It is assumed that a system with measurable swath of 16 degrees is used; this creates a revisit time of around one week. CASSIOPEE will be able to collect data throughout the day. However, because maritime areas are cloudy places, the chance of obtaining cloud free imagery is low. Cloud cover will remove a high percentage of the imaging opportunities. Table 7-5 provides the capabilities of the instrument for a 280x900km orbit.
Instrument Characteristics
Spectral bands 4.67 µm (CO)
Swath (at 280km) 80 km across track
Spatial resolution 3.5 km along track
Duty cycle less than 10%
Data rate ~100 kbits
Mass 15 kg
Power 20 W
Table 7-5: Characteristics for the CASSIOPEE air quality mission concept
The orbit suggested would also allow many of opportunities for examining pollution in other major cities across the northern hemisphere. Southern Hemisphere countries could not be offered the same resolution service; however, at 900km, the system could provide a much broader overview of regional CO. Several countries working together could share the data.
172

CASSIOPEE
7.4.4 Ground systems The sensor data from air, ground, and space-based sensors would be delivered to a central data processing facility, such as ESRIN, the European Space Agency's Centre in Frascati, where the main activities are centred on the acquisition, archiving and dissemination of data from Earth Observation missions. The operational model for the ground receiving station and processing facility would be similar to the one described in Section 5.1 for the CASSIOPEE baseline.
These data would be processed and integrated with ancillary information from other satellites and critical meteorological and chemical parameters to produce an improved monitoring tool for policy and decision makers on the concentrations and emissions of air pollutants. The main data products from this air-quality CASSIOPEE mission would be detailed maps of the EU member states showing the distribution of CO emission at regional scales.
Concentrations of CO have increased in northern high latitudes since 1850, suggesting higher anthropogenic emissions. Carbon monoxide is a serious health and environmental hazard. Steps need to be taken on a regional, national, and local level to mitigate the effects of its long-range atmospheric transport and the increasing number of hotspots (very localized areas with dangerous levels of CO).
The next course of actions would be to fund a pre-phase A study of CO tropospheric pollution and detection. This study should eventually lead to the design of an integrated system of satellite, airborne, and ground sensors. These sensors will provide an integrated system, producing thematic images of pollution in large European cities. This will enable environmental agencies to monitor sources and improve regulation.
In addition, these high-resolution regional maps of CO distribution in the troposphere will allow integration of a number of research and monitoring activities in the field of the atmospheric environment, as well as coordination of national and international environmental policy decisions affecting the environment in the 21st century. We
In addition, the network of ground sensors and the ground facility would be parts of existing networks [Burke, Zhang 2001], such as the European-wide air quality monitoring network. This network, with acronym EUROAIRNET [Larssen et al. 2000], exists to obtain and distribute reliable and comparable information from more than 5000 ground sites. Such an initiative is part of new EU policy approaches for monitoring and controlling both internal and trans-boundary air pollution.
7.5 Recommendations
The purpose and long-term goal of this air quality mission concept is to provide data, scientific assessments, and other information on the atmospheric composition and related physical characteristics of the background atmosphere. These are required for improving the quality of the air we breathe, as well as understanding the role of air pollution in the troposphere’s chemistry. In particular, the air quality CASSIOPEE measurements will be essential to the understanding of the linkage between changing atmospheric composition and changes of regional climate. Air quality research will be an integral part of the various global climate-observing programs.
173

CASSIOPEE
hope that this brief investigation will encourage further discussions of the scientific and technological rationale for using microsatellite technology in regional CO mapping and monitoring.
174

CASSIOPEE
References [Burke 2001] Burke, J.D. and Zhang, L. “Air Quality Improvement Through
Microtechnology”. Annual International Space University Symposium, Strasbourg. Ed. M. Rycroft, Proceedings in press, Kluwer Academic Publishers, 2001.
[Chameides et al.1992]
Chameides, W.L. and Lodge, J.P. Surface Level Ozone Exposures and their Effects on Vegetation: “Tropospheric ozone: formation and fate”, 1992. 1-30.
[Crutzen 1974] Crutzen, P. J. “Photochemical reaction initiated by and influencing ozone in unpolluted tropospheric air”. Tellus, 26, 1974. 45-55.
[EEA 1997]
European Environment Agency. “Are we moving in the right direction? TERM 2000”. Environmental issues series No 12, 2000.
[EEA 2000c]
[Eos 1987] Earth Observing System - Science Steering Committee Report, 1987.
[IGOS 2000] “The Report of The IGOS Ozone Project”, Version 8, 2000. [Larssen et al. 2000]
Larssen, S. et al., “Criteria for EUROAIRNET”. European Environment Agency, February 1999. <http://binary.eea.eu.int:80/t/tech12.pdf 20 October 2000.
[Leeuw et al. 1999]
De Leeuw, F. , A. Camu. “Exceedance of EC Ozone Threshold values in Europe in 1998”. Summary based on the information reported in the framework of the Council Directive 92/72/EEC on air pollution by Ozone. Report to the Commission by the European Environment Agency Topic Centre on Air Quality, 1999>.
[Levy 1971]
[MOPITT 2001]
European Environment Agency. “Air Pollution in Europe in 1997”. Copenhagen, Denmark, 1997.
[EEA 2000a] European Environment Agency. “Environmental signals 2000: Environmental assessment report No 6”. Luxembourg: Office for Official Publications of the European Communities, 2000.
[EEA 2000b]
European Environment Agency. “Emissions of atmospheric pollutants in Europe, 1980-1996”. Topic report No 9/2000 EEA, 2000.
[EMEP 1999] Programme for Monitoring and Evaluation of the Long-Range Transmission of Air Pollutants in Europe (EMEP) Summary Report. “Transboundary Photo-oxidants in Europe”. Meteorological Synthesising. Oslo, 1999.
[Greiner 1967] Greiner, N.R. “Hydroxyl Radical Kinetics by Kinetic Spectroscopy Reaction with H2, CO and CH4 at 300 K”. J. Chem. Phys., 46, 2795, 1967.
Levy II, H. “Normal atmosphere: Large radical and formaldehyde concentrations predicted”, Science, 173, 1971. 141-143.
[Levy 1974] Levy, H. II. “Photochemistry of the Troposphere”. Advances in Photochemistry. Eds John Wiley & Sons, New York, 1974. 369-524.
[Liu et al. 1987] Liu SC, Trainer M, Fehsenfeld FC, Parrish DD, Williams EJ, Fahey DW, Hübler G and Murphy PC. “Ozone production in the rural troposphere and the implications for regional and global ozone distributions”. Journal Geophysical Research 92, 1987. 4191-4207.
[Mauzerall et al. 1996]
Mauzerall, D.L., Jacob, Dj., Fan, S.-M., Bradshaw, J.D., Gregory, G.L., Sachse, G.W. and Blake, D.R. “Origin of tropospheric ozone at remote high northern latitudes in summer”. J. Geophys. Res. 101 (D2), 1996. 4175-4188.
[MOPITT 1993] MOPITT Team. “MOPITT Mission Description Document” 1993. <http://www.atmosp.physics.utoronto.ca/mopitt/mdd_93/>. MOPITT Team. “MOPITT Mission Objectives”. <http://hirdls.eos.ucar.edu/mopitt/overview/overview.html>.
175

CASSIOPEE
[NCAR 1999]
Wayne, R. P. “Chemistry of Atmospheres”. Clarendon Press, Oxford, Third edition, oxford, 2000.
NCAR News Release 1999-40, 1999. <http://www.ucar.edu/communications/newsreleases/1999/mopitt99.html>.
[Resonance Ltd 1997]
Resonance Ltd. “MicroMAPS-A Low Cost Orbital Remote Sensor for the Detection of CO and N2O” 1997. <http://www.resonance.on.ca/mmaps.html>. <http://www.walberg.com/MMAPS.htm>.
[Wang et al. 1997] Wang, W., and M. E. Schlesinger. “The dependence on convection parameterization of the tropical intraseasonal oscillation simulated by the UIUC 11-layer atmospheric GCM”. J. Climate, 12, 1999. 1423–1457.
[Wayne 2000]
[Weinstock 1969] Weinstock, B. “Carbon monoxide: Residence time in the Atmosphere”, Science. 166, 224, 1969.
[Wuebbles et al. 1993]
Wuebbles, D. J., J. S. Tamaresis, and K. O. Patten. “Effects of Increasing Trace Gas Emissions on Global Atmospheric Chemistry and Climate: An Interim Report”. U.S. Environmental Protection Agency, Research Triangle Park, NC, 1993.
[WHO 2000] World Health Organization (WHO). “Air Quality Guidelines for Europe”. WHO Regional Publications, European Series, No. 91, 2000.
[WMO 1985] World Meteorological Organization. Report No. 16: “Atmospheric Ozone”. 1985.
176

CASSIOPEE
8. Benefits, recommendations and conclusions This chapter summarises the scientific, technological, policy, and financial spinoffs that can be expected to arise from the implementation of CASSIOPEE. Recommendations follow regarding proposed future action items and a general conclusion on the results of CASSIOPEE is drawn.
8.1 Potential spinoffs
8.1.1 Scientific spinoffs (benefits) etc. 1. CASSIOPEE will improve understanding of the levels and spatial and
temporal variation of GHG emissions from both natural and anthropogenic sources.
2. The mission will assist in advancing the development of model-based estimation of biogenic emissions. This is achieved through increased spatial and temporal satellite observation, and integration with satellite-based terrestrial vegetation data sets and high-resolution ecosystem data, leading to more accurate prediction of climate change.
3. CASSIOPEE will support innovative space-based assessment and modelling of GHG emissions. This will ensure a long term, integrated environmental compliance and monitoring strategy for regional and global observations, and climate studies, including GHG emissions.
8.1.2 Technological spinoffs 1. The mission will allow the envisioned instrument to be qualified, tested, and
validated for use on future space/air or possibly ground-based systems. 2. The mission will provide Europe with experience in design and utilisation of
constellations of microsatellites. 3. The mission may be expanded with more ground receiving stations to obtain
global coverage, and foster technology transfer of environmental data collection from microsatellites in other regions of the world.
8.1.3 Policy spinoffs 1. The mission will support compliance with the Kyoto Protocol, through
accurate reporting and verification of national GHG emission totals by an independent international evaluation system.
2. CASSIOPEE will result in the production of more detailed emission maps for regions in Europe and elsewhere and the characterisation of respective sources.,
3. Through the implementation of CASSIOPEE, Europe will show its political leadership concerning global monitoring of climate change and to demonstrate its intent and transparency. Moreover, cooperation with international partners and the sharing of global information will enhance understanding and speed negotiations on environmental issues.
4. The mission will support the work of the IPCC’s National Greenhouse Gas Emission Inventory Programme and its revisions to the 1996 Guidelines for GHG emission reporting.
177

CASSIOPEE
5. Environmental problems and security are major issues in Europe. CASSIOPEE will provide the common link between political requirements defined with European treaties, and the technical and operational capabilities provided by observation satellites. Developing regional information gathering capacity will help Europe meet its own commitments to sustainable development.
6. CASSIOPEE’s envisaged results will contribute to more effective policy responses and strategies targeting regional and sectoral GHG emission sources.
7. CASSIOPEE will assist in the implementation of the Global Monitoring for Environment and Security initiative, and enhance cooperation between international public bodies and agencies including the EC, ESA and IPCC.
8. Timely results, available in a short timeframe (2-3 years), will enable scientists to better understand and model environmental problems.
9. CASSIOPEE will demonstrate the existence of innovative technologies that can support policymaking. A successful mission with specific requirements will open roads for new thinking and actions concerning the development and implementation of new instruments for public and private purposes.
10. CASSIOPEE will contribute to the restructuring taking place in the European space industry. Thechallenge exists to demonstrate its value within the so-called new Space Infrastructure presently developed in Europe.
8.1.4 Financial spinoffs 1. The CASSIOPEE mission will stimulate an emerging market for
microtechnologies, through innovative microspacecraft design and demonstration.
2. The mission will offer a cost effective mechanism for Kyoto compliance monitoring.
3. CASSIOPEE will strengthen national space industries by enhancing know-how and acquisition. Furthermore, companies will obtain knowledge and experience in management techniques for small projects by the execution of microsatellite projects.
4. Value added products will be generated through the integration of CASSIOPEE data with additional geo-spatial data and the development of data presentation techniques.
5. The relatively low-cost concept of microsatellites will allow developing countries to manage their own environmental monitoring satellites, which can assist in their sustainable development, and increased market opportunities for European companies.
8.2 Recommendations Several steps are needed for CASSIOPEE to become a reality. The following recommendations state what will have to be done in the near future.
8.2.1 General recommendations 1. The International Space University’s CASSIOPEE project team encourages
Europe’s policymakers, scientists and space agencies to build upon the valuable groundwork performed during July-September 2001, and calls the
178

CASSIOPEE
relevant institutions to investigate in more depth the technological innovation offered by microspacecraft to the monitoring of GHGs.
2. The formation of a small, dedicated team is proposed to further this initiative, and to enhance the relations established with the European Commission, European Environment Agency, Joint Research Centre, European Space Agency and Inter-governmental Panel on Climate Change. This could be achieved through the release of funding from the European Space Agency, by the EC’s 5th and 6th Framework Programme for Research, Technological Development and Demonstration, other EC programmes or by Parties to the United Nations Framework Convention on Climate Change.
3. An institutional framework should be developed listing all the key partners for the CASSIOPEE mission and their responsibilities. Potential partners are: ZARM, ECMWF, and Max-Planck-Institute for Biogeochemistry, as well as the those institutes mentioned under 2.
8.2.2 Scientific recommendations 1. A system should be developed in Europe to combine present ground, and
airbased efforts in measuring and monitoring GHGs and to assure the quality of this data. This system can build on current programmes like CARBOEUROPE or EDGAR. This data may help in the calibration and validation of data from the CASSIOPEE mission, and furthermore support the modelling of GHG emissions.
2. Good models should be developed that allow the use of satellite data to relate measured GHG concentration values to the sources of emission. Inverse modelling is the current technique that can be used for this. For the emission modelling purpose, our project should be executed in close collaboration with the Max-Planck-Institute for Biogeochemistry in Germany. They coordinate the EC-financed COCO project (2002-2004), which will address the insertion of data from planned satellite missions in inverse modelling techniques.
8.2.3 Technological recommendations 1. The technology design of all subsystems should be further developed. An
implementation analysis should be carried out and components and systems should be tested and evaluated. The future progress for the CASSIOPEE design will depend greatly on which technologies are implemented. The overall mass, power consumption and costs of CASSIOPEE's subsystems could be significantly reduced by using new components currently being developed. This would result in the loss of heritage in the technology, but if new applications involve a large number of satellites in a constellation (i.e. for improved global coverage) then this would be a considerable benefit. The interfaces between the subsystems and the requirements for these interfaces must be considered along with risk analysis and accurate cost analysis.
2. The ground segment should be reviewed in light who will handle the downlinking and data transmission.
3. We recommend the current state of the launch vehicle market to be reassessed to determine what is the best option for launching CASSIOPEE.
179

CASSIOPEE
8.2.4 Policy recommendations 1. An industrial policy will have to be further developed and implemented in
order to re-enforce initiatives for demonstrating the appropriateness and value of new technologies for short-term space missions.
2. The European GMES initiative should be implemented in a coherent fashion with respect to existing structures and policies. IT must be included in the EU’s cooperation protocols and programs, and must assist in the promotion of European environment and security policy.
3. European policies should encourage the involvement of industries by creating a political framework for industrial earth-observation and monitoring activities. Public-private partnership should be encouraged and laws for the commercial use of outer space should be developed.
4. The problem and the monitoring of GHGs should be addressed globally and not only at the European level. Once CASSIOPEE proves to produce valuable results in Europe, the system can be expanded to other regions of the world.
8.3 Conclusions Although there are still many steps to take before CASSIOPEE will meet its objectives to monitor annual national GHG emissions and contribute to the creation of monthly regional emission maps, the concept is shown to have a strong foundation for achieving its goal. The continuation of the project, coordinated by a small working group is encouraged. Envisaged among its initial tasks are the completion of a more in-depth verification of the various elements described in this report, the identification of interested partners, and the soliciting of start-up financing. We thus believe the basis for an innovative, highly valuable mission has been established.
180

Appendix A: List of Acronyms
acronym or abbreviation
meaning
ACM ACceleroMeter ACS Attitude Control System ADEOS ADvanced Earth Observation Satellite AEROCARB Airborne European Regional Observations of the CARbon
Balance AIRBASE European AIR quality dataBASE AIRS Atmospheric InfraRed Sounder AIT Assembly, Integration and Test AMAXDOAS Airborne MultiAXis Differential Optical Absorption
Spectrometer AOCS Attitude and Orbit Control System APE-THESEO Airborne Platform for Earth observation to the THird European
Stratospheric Experiment on Ozone APS Active Pixel Sensor ARGOS Accident Reporting and Guidance Operation System ASUR Airborne SUbmillimeter wave Radiometer BCR Battery Charge Regulator BEP Bit Error Probability BER Bit Error Rate BPSK Binary Phase Shift Key C/No Carrier power-to-Noise power spectral density ratio CaCO3 Calcium Carbonate CAD Computer Aided Drafting CAN Controller Area Network CAP Common Agricultural Policy CARBOAGE Age-related dynamics of CARBon exchange in European forests CARBODATA CARBon Balance Estimates and Resource Management -
Support with DATA from Project Networks Implemented at European Continental Scale
CARBOEUROPE coordination and dissemination of CARB On research results in light of the implementation of Kyoto Protocol in EUROPE
CARBOEUROFLUX An investigation on CARBon and energy exchanges of terrestrial ecosystems in EUROpe
CASSIOPEE Concepts for Advanced Small Satellites to Improve Observation and Preservation of the European Environment
CCD Charge Coupled Device CCGG Carbon Cycle Greenhouse Gas group CCl4 Carbon tetraChLoride CCSDS Consultative Committee for Space Data System CBD Convention on Biological Diversity

CEC
Commission of the European Communities CEE Central and East European CEOS Committee on Earth Observations Satellites CFC ChloroFluoroCarbon CH3CCl3 Methyl CHloroform CH3Cl Methyl CHloride CH4 Methane CLAES Cryogenic Limb Array Etalon Spectrometer CLRTAP Convention on Long Range Tran boundary Air Pollution
(UNECE) CMDL Climate Monitoring and Diagnostics Laboratory CMOS Complementary Metal Oxide Semiconductor CNES Centre National d’Etudes Spatiales CO Carbon monOxide CO2 Carbon diOxide COCO COmplete Carbon dioxide Observations COP Conference Of Parties CORINAIR COoRdination of Information on AIR emissions CPU Central Processing Unit CSIRO Commonwealth Scientific and Industrial Research Organisation CSMT Center for Space Microelectronics Technology CW Continuous Wave DC/DC Direct Current to Direct Current converter D-BPSK Differential demodulation BPSK DE-BPSK Differential Encoding BPSK DE-QPSK Differential Encoding QPSK DG (i.e. DG Environment, DG Research)
Directorate-General
DLR Deutsches zentrum für Luft- und Raumfahrt DOAS Differential Optical Absorption Spectroscopes D-QPSK Differential demodulation QPSK DUP (ESA’s) Data User Programme EAP Environment Action Programme EC European Commission ECCP European Climate Change Programme ECMWF European Centre for Medium-Range Weather Forecasts EDGAR Emission Database for Global Atmospheric Research EEA European Environment Agency EEC European Economic Commission EECF Earthnet Ers-1 Central Facility EESD Energy, Environment and Sustainable Development (FP5
subprogram)

EFTA European Free Trade Association EIB European Investment Bank EIRP Effective Isotropic Radiated Power EM ElectroMagnetic EMEP cooperative Programme for Monitoring and Evaluation of the
long range transmission of air pollutants in Europe ENVISAT ENVIronmental SATellite EO Earth Observation EOEP EO Envelope Program EOS Earth Observation System ERS Earth Resources Satellite ERS-1 European Remote sensing Satellite 1 ERS-2 European Remote sensing Satellite 2 ESOC European Space Operations Center EPA Environmental Protection Agency EPS Eumetsat Polar System ERS Earth Remote-sensing Satellite ESA European Space Agency ESARAD ESA RADiation analyser ESATAN ESA Thermal Analyser ESATRACK ESA ground station network ESOC European Space Operations Centre ESRIN European Space Research INstitute ESTEC European Space research and TEchnology Centre EU European Union EUMETSAT EUropean METeorological SATellite organization EuroAirNet European Air quality monitoring Network FDI Failure Detection and Isolation FEC Forward Error Correction FEM Finite Element Modeling FOG Fiber Optic Gyro FORCAST FORest Carbon nitrogen Trajectories FP5 5th Framework Program FTIR Fourier Transform InfraRed spectrometers FY Fiscal Year GDP Gross Domestic Product GEIA Global Emissions Inventory Activity GEO Geostationary Earth Orbit GHG GreenHouse Gas GHOST Gas cHromatograph for Observation of Stratospheric Tracers GIS Geographic Information Systems GMES Global Monitoring for Environment and Security GOES Geostationary Operational Environment Satellite GPS Global Positioning System

GPS-TDAF GPS Tracking and DAta Facility GS Ground Station GSFC Goddard SpaceFlight Centre GSOC Ground Space Operations Centre G/T Gain to equivalent noise Temperature ratio of a receiving
equipment GTS Global Telecommunication System GWP Global Warming Potential H2S Hydrogen Sulphide HALOE HALogen Occultation Experiment HCHO Formaldehyde HCO3¯ Bicarbonate HFC HydroFluoroCarbons HCFC HydroChloroFluoroCarbons HRDLS High Resolution Dynamics Limb Sounder HITRAN HIgh-resolution TRANsmission (molecular absorption database) HPA High Power Amplifier IASI Infrared Atmospheric Sounding Interferometer IEOS International Earth Observing System IFOV Instantaneous Field-Of-View IGAC International Global Atmospheric Chemistry programme IGBP International Geosphere-Biosphere Program ILAS II Improved Limb Atmospheric Spectrometer-II IMAGE Integrated Model to Assess the Greenhouse Effect IMG Interferometric Monitor for Greenhouse gases IMU Inertial Measurement Unit INTAIRNET INTelligent AIR monitoring NETwork I/O Input/Output IOT In-Orbit Tests IPCC Intergovernmental Panel on Climate Change IR InfraRed ISO International Organization for Standardization ISS International Space Station IT Information Technology ITO Indium Tin Oxide ITU International Telecommunication Union JPL Jet Propulsion Laboratory JRC Joint Research Centre Landsat Land satellite (American earth resources satellite) LBA CARBONSINK the future of the tropical forest CARBON SINK, european
contribution to the Large-scale Biosphere-atmosphere experiment in Amazonia
LCA Life Cycle Assessment

LDC Less Developed Country LEO Low Earth Orbit LEOP Launch and Early Orbit Phase LIDAR LIght Detection And Ranging LNA Low Noise Amplifier LAN Local Area Network MAPS Measurement of Air Pollution from Satellites MASTER Millimetre –wave Acquisitions for Stratosphere / Troposphere
Exchange Research MCC Mission Control Centre MCR Main Control Room MEMS MicroElectroMechanical System METOP METeorological Operational Polar satellites of eumetsat MGN MaGNetometer MicroMAPS Micro-Measurement of Air Pollution from Satellites MIPAS Michelson Interferometer
for Passive Atmospheric Sounding MIRS Multichannel InfraRed Spectroradiometer MLI Multi Layer Insulation MLS Microwave Limb Sounder MODTRAN TRANsmission MODel MOGUNTIA Model Of the Global UNiversal Tracer transport In the
Atmosphere MOPITT Measurements Of Pollution In The Troposphere MSG Meteosat Second Generation NASA National Aeronautics and Space Administration NASCOM NASA COMmunications network NASDA NAtional Space Development Agency (of Japan) NCAR National Center for Atmospheric Research NDVI Normalized Difference Vegetation Index NECD Directive on National Emission Ceilings for certain atmospheric
pollutants (EU) NGGIP National Greenhouse Gas Inventories Programme NGO Non-Governmental Organization NH3 Ammonia NIR Near Infra Red NMVOC Non Methane Volatile Organic Compounds NO Nitric Oxide N2O Nitrous Oxide NO2 Nitrogen diOxide NOAA National Oceanic and Atmospheric Administration NPOESS National Polar-orbiting Operational Environmental Satellite
System

NRP dutch National Research Programme on global air pollution and climate change
O&M Operations and Maintenance O3 Ozone OB&DH On Board Data Handling system OCC Operations Control Centre OLEX Ozone-and-aerosol Lidar system OPSNET OPerationS NETwork OSSS One Stop Satellite Solutions, Inc. OST Outer Space Treaty PCB PolyChlorinated Biphenyl PFC PerFluoroCarbon PM Particulate Matter (Appendix-CO) PM Phase Modulation (Ch. 4.6.2) POP Persistent Organic Pollutants PPP Private Public Partnership QPSK Quaternary Phase Shift Key QWIP Quantum Well Infrared Photo detector RAAN Right Ascension of Ascending Node RADARSAT RADAR SATellite RAL Rutherford Appleton Laboratory RF Radio Frequency RISC Reduced Instruction Set Computing RIVM RIjksinstituut voor Volksgezondheid en Milieu (National
Institute of Public Health and the Environment) ROM Rough Order of Magnitude RPV Remote Piloted Vehicles RTU Remote Terminal Unit RX Receive tX – transmit S/N Signal-to-Noise power at user’s end SAF Satellite Application Facility SAR Synthetic Aperture Radar SAS Sun Acquisition Sensor SCIAMACHY SCanning Imaging Absorption spectroMeter for Atmospheric
CHartographY SCT Satellite Communications Terminal SETAC Society of Environmental Toxicology And Chemistry SF6 Sulphur hexaFluoride SME Small and Medium-size Enterprise SNR Signal-to-Noise Ratio SO2 Sulphur diOxide SO3 Sulphur triOxide SOGE System for Observation of Greenhouse gases in Europe SOPRANO Sub-millimetre Observation of PRocesses in the Atmosphere

SPOT Satellite Pour l’Observation de la Terre SSCM Small Satellite Cost Model SSO Sun Synchronous Orbit SSPA Solid State Power Amplifier SSTL Surrey Satellite Technology Limited STR Star TRacker STREAM Stratosphere TRoposphere Exchange from Aircraft
Measurements SVT Spacecraft Validation Test TBT TriBuTyltin TC TeleCommand TDAF Tracking and DAta Facility TDLAS Tunable Diode Laser Absorption Spectroscopy TES Tropospheric Emission Spectrometer THESEO THird European Stratospheric Experiment on Ozone TM TeleMetry (Ch. 4.5.2) TM Thematic Mapper (Ch. 4.1.1) TNO Netherlands Organization for applied scientific research TPLL Third-Party LiabiLity TT&C Telemetry Tracking and Control TX Transmit UARS Upper Atmosphere Research Satellite UAV Unmanned Aerial Vehicle UN United Nations UNEP United Nations Environment Programme UNFCCC United Nations Framework Convention on Climate
Change UV Ultra Violet (wavelength) VHF Very High Frequency VIS VISible (wavelength) VOC Volatile Organic Compound VROM Dutch Ministry of the Environment WCT Wipo Copyright Treaty WDCGG World Data Centre for Greenhouse Gases WHO World Health Organization WIPO World Intellectual Property Organization WMO World Meteorological Organisation WAN Wide-Area-Network ZARM Zentrum für Angewandte Raumfahrtechnologie und
Mikrogravitation(Center of Applied Space Technology and Microgravity)

Appendix B: List of Units
acronym or abbreviation
meaning
ºC degree Centigrade C Carrier power cm centimeter
dB deciBel dB/K deciBel per Degrees Kelvin dBi decibel incident Eb Energy per information bit Eb/No Energy per bit per noise power density Ec Energy per channel bit G Gain g gram G/T Gain to equivalent noise temperature ratio of a receiving
equipment GB Giga Byte GHz Giga Hertz Gt Giga-tonne Hz Hertz Ibit Impulse bit Isp specific Impulse (in second) K Kelvin degree kb/s kilobits per second kg kilogram kg/m3 kilogram per cubic meter km kilometer m meter M Million m/s meters per second m² square meter µN micro Newton mA/h milli Amper per hour Mbps / Mb/s Megabits per second MHz Mega Hertz mm millimeter MPa mega Pascal mW milli Watt N Newton Nm Newton meter nm nanometer

Nms Newton meter second Ns Newton second ppb parts per billion ppm parts per million ppmv parts per million volume R bit Rate rpm revolution per minute Tg Teragram V Volt W Watt W/m2 Watt per square meter Wbm Weber meter

Appendix C: Major European Environmental Issues Appendix: Status and trends of major European environmental issues
Definition Areas of Concern Major Sectors Positive StepsWATER
Water Stress "Water Stress occurs when the demand for water exceeds the available amount during a certain period or when quality restricts its use."
Areas with low rainfalls, high population and intense agricultural / industrial activities.
Agriculture, Industry, and Households
A decrease of heavily polluted rivers due to the reduction of point source release. A significant reduction (50-80%) in pollution by organic compounds over the last 15 years.
Coastal & Marine Degradation of "the area of land and sea bordering the shoreline and extending seaward through the breaker zone" [EEA Home Page 2001]
The main threats to European coastal areas are: water pollution and eutrophication, decline of marine biodiversity, land use and landscape deterioration, increased erosion of coastal areas and coastal erosion. Decline of fisheries in almost all regional s
Transport, Industry, and Fisheries
Inputs of six important hazardous substances (cadmium, mercury, lead, zinc, lindane and PCB7) into the northeast Atlantic fell significantly between 1990 and 1998.

LANDBiodiversity "Variability among living organisms
from all sources including, inter alia, terrestrial marine and other aquatic ecosystems and the ecological complexes of which they are part, this includes diversity within species and of ecosystems" [CEC COM 9842, 2000]
Degradation of the rural environment; and increasingly significant risks to the valuable natural and biodiversity assets of central and eastern European countries, as well to those remaining in southern and Mediterranean countries and in northern and west
Agriculture, Forestry, Fisheries, Urbanisation, Industry, Transport, Tourism, and Energy
The EC's Community Biodiversity Strategy aims to anticipate, prevent and attack the causes of significant loss of biological diversity. It also proposes a series of “Action Plans” for the conservation of natural resources, agriculture, fisheries, regional
Soil Degradation Loss or deterioration of soil's function. Areas of urban sprawl, extensive infrastructure, and coastal areas. Industrial contamination primarily in north west Europe.
Transport, Agriculture, and Industry
Disasters Natural and manmade disasters, including floods, landslides, and oil spills.
Disasters have devastating effects on ecosystems, human health and all the economic sectors.
Agriculture, Forestry, Urbanisation, Industry, Transport, and Tourism,
The number of major oil spills related to marine transport accidents or offshore installation accidents are decreasing.

ATMOSPHERICGreenhouse Gases
(See Ch 2.3)Carbon dioxide (CO2), nitrous oxide (N20), methane (CH4), water vapour, and other gases form a barrier to escaping radiation from the Earth's surface, causing the greenhouse effect.
The effects are: changes in the incidence of climatic extremes, especially high-temperature extremes, loss of habitats, increasing flood hazards, elevated sea levels. These effects have impacts on ecosystems, health, key economic sectors such as agricul
Energy, Transport, Industry, Agriculture, Population, Transport, Tourism
CO2 emissions have decreased by more than 1% in the last decade but with variations between member state countries due to their different policies and energy efficiency. The level of CH4 is decreasing.
Ozone-depleting substances
Significant depletion of the stratospheric ozone layer is being affected by chlorine and bromine and also the anthropogenic based compounds.
Stratospheric ozone layer depletion lead to increases in UV-B radiation, which threaten human health and eco-systems.
Cooling, Aerosol Propellant
The use of ozone depleting substances has decreased at a faster rate than were required for international measures.
Hazardous substances
Includes heavy metals, dioxins, persistent organic pollutants (POPs), polycyclic aromatic hydrocarbons (PAHs) and other chemical compounds.
Pollution affects soil, groundwater, marine water and air. There are severe gaps in information about chemical exposures and associated effects to wildlife, eco-systems and humans, particularly for sensitive groups such as infants, children and the elderl
Waste disposal and industry (Europe is one of the largest chemical-producing regions in the world)
Control measures have reduced chemical risk and some of the emissions released into the atmosphere. The concentrations of persistent organic pollutants and heavy metals have decreased. It is important to mention that for 75% of the large volume chemicals

ATMOSPHERICTransboundary air
pollutionIncludes sulphur dioxide (SO2), nitrogen oxides (NOx), ammonia (NH3), volatile organic compounds (VOCs), and different toxic materials such as heavy metals and persistent organic pollutants (POPs). The pollutants -mainly carbon monoxide (CO) and methane (
Main effects include the acidification of water and soil by SO2, NOx and NH3. NOx and NH3 are also contributing to eutrophication of waters. NOx and VOCs are involved in generation of tropospheric ozone, causing summer smog having harmful effect on huma
Transport, Energy, Industry, and Agriculture
SO2 , VOCs and NOx emissions have been reduced significantly since 1980. For SO2, the 5th EAP target of 35% reduction from 1985 levels by the year of 2000 was met in 1994.
The table provides compiled information from [EEA TOC 1999] and [EEA 2001].

Appendix D: Space-Based Monitoring Programmes
Sensor name Satellite Platform/ Operation Status
Mission Technical Properties
AIRS Atmospheric Infrared Sounder
NASA’S EOS PM-1 December, 2001.
Makes measurements of the Earth's atmosphere and surface to improve weather prediction and to observe changes in Earth's climate. AIRS provides also measurements of greenhouse gases, CO2 and CH4.
Measurement Type: Multispectral Infrared Spectrometer Waveband: 3.7 – 15µ m and 0.4-1-0 µm. It has 2400 bands in the infrared and visible. Spatial resolution: In limb mode vertical resolution: 1km In down-looking mode: 13.5 km Swath width: 1650 km
CLAES The Cryogenic Limb Array Etalon Spectrometer
UARS 1991 - 1993
Measures temperature profiles, and concentrations of ozone, methane, water vapor, nitrogen oxides, and other important species including CFCs, in the stratosphere. CLAES also maps the horizontal and vertical distributions of aerosols in the stratosphere.
Measurement Type: Cryogenically cooled infrared spectrometer measuring thermal emission from the Earth's limb. Spatial resolution: In limb mode vertical resolution: 2.5 km Altitude range of the measurements extends from about 10 to 60 km.

HALOE The Halogen Occultation Experiment
UARS 1991- 1999 (UARS is still in operation, but from HALOE, nothing received since 1999)
Provides data on vertical profiles of Ozone (O3), Hydrogen Chloride (HCl), Hydrogen Fluoride (HF), Methane (CH4), Water (H2O), Nitric Oxide (NO), Nitrogen Dioxide (NO2), Aerosol Extinction, Aerosol Surface and Temperature versus pressure.
Measurement Type: Use solar occultation Waveband: 3530-3610 cm-1, 1585-1615 cm-1, 1497-1523 cm-1, 0960-1085 cm-1. Spatial resolution: In limb mode vertical resolution: 1.6 km Altitude range of the measurements extends from about 15 km to 60-130 km, depending on the channel.
HIRDLS High Resolution Dynamics Limb Sounder
EOS CHEM-1 2002 - 2008
HIRDLS is designed to sound the upper troposphere, stratosphere and mesosphere to determine global distribution of temperature and concentrations of O3, H2O, CH4, N2O, NO2, HNO3, N2O5, CFC11, CFC12, ClOlNO2, aerosols and the locations of polar stratospheric clouds and cloud tops.
Measurement Type: Infrared Limb Scanning Radiometer Waveband: 6.12 – 17.79 µm Spatial resolution: In limb mode vertical resolution: 1 km In down-looking mode: 400 km Swath width: 2000 – 3000 km Revisit capability: 4 days

IASI Infrared Atmospheric Sounding Interferometer
METOP-1 EUMETSAT future mission, launch year 2005
Measures tropospheric moisture and temperature, column integrated contents of ozone, carbon monoxide, methane, dinitrogen oxide and other minor gases which affect tropospheric chemistry. Also measures sea surface and land temperature
Measurement Type: Michelson interferometer Waveband: 3.4-15.5µm with gaps at 5µm and 9µm Spatial resolution: In limb mode vertical resolution: 1- 30 km In down-looking mode: 25 km Swath width: 2230 km Revisit capability: 5 days
IMG Interferometric Monitor for Greenhouse Gases
ADEOS 1996-1997
High accuracy measurement of the earth's radiation budget, surface temperature, atmospheric temperature profiles and measurement of atmospheric constituents: a. Density profiles of CO2 and H2O, b.Total ozone, c.Mixing ratios of CH4, N2O and CO in the troposphere
Measurement Type: Michelson-type Fourier Transform Spectrometer (FTS) Waveband: 3 bands: 3.3 - 4.3 µm, 4.0 - 5.0 µm and 5.0 - 14.0 µm Spatial resolution: In down-looking mode: 8 km

MASTER Millimetre -wave Acquisitions for Stratosphere / Troposphere Exchange Research
ESA Future Atmospheric Chemistry Explorer Mission, 2003- 2013.
Measures upper troposphere/ lower stratosphere profiles of O3, H 2O, CO, HNO3, SO 2, N2 O, pressure and temperature. Provides data for study of exchange mechanisms between stratosphere and troposphere, and complementary information for studies on global change.
Waveband: 199-207, 296-306, 318-326, 342-348GHz Spatial resolution: In down-looking mode: 3km
MIPAS Michelson Interferometric Passive Atmospheric Sounder
ENVISAT-1 2001 – 2006
Measures stratospheric O3, H2O, CH4, N2O, HNO3, and Climatologically important parameters which are CH4, N2O, O3. Provides data on chemical composition, dynamics, and radiation budget of the middle atmosphere Monitors stratospheric O3 and CFC's.
Measurement Type: Fourier transform spectrometer Waveband: 4.15 mm - 14.6 mm. Spatial resolution: In limb mode vertical resolution: 3 km, vertical scan range 5-100km In down-looking mode: 30x300 km
MIRS Multichannel Infrared Spectroradiometer
On PRIRODA module of the MIR orbital Station In operation between 1996 – 1999.
Measures CO2, H2O, O3 and trace species of CH4, HNO3, N2O, CFC-11(CCl3F), CFC- 12(CCl2F2).
Measurement Type: Thermal Spectrometer Waveband: 4 - 16 micrometer Spatial resolution: In limb mode vertical resolution: 3.5 km In down-looking mode: 0.65 x 2.5 km at nominal altitude of 400 km.

MLS Microwave Limb Sounder
EOS-CHEM 1 2002- 2008
Measures lower stratospheric temperature and concentrations of H2O, O3, ClO, BrO, HCl, OH, HO2, HNO3, HCN, and N2O, for their effects on (and diagnoses of) ozone depletion, transformations of greenhouse gases, and radiative forcing of climate change.
Measurement Type: Microwave limb sounder Waveband: 200, 300, 600 GHz and 2.5 THz. Spatial resolution: In limb mode vertical resolution: 3-6 km In down-looking mode: 30 km across and 300 km along the direction of observation.
MOPITT Measurements of Pollutants in the Troposphere
TERRA In operation since February 24, 2000
Provides data of global distribution of carbon monoxide (CO) and methane (CH4) in the troposphere to enhance the understanding of the lower atmosphere system and particularly its interaction with the surface/ocean/biomass systems.
Measurement Type: Gas correlation spectroscopy Waveband: 2.3, 2.4 and 4.7µm Spatial resolution In limb mode vertical resolution: 4 – 5 km In down-looking mode: 22 km Swath width: 640 km Revisit capability: 4 days

SOPRANO Sub-millimetre Observation of Processes in the Absorption Noteworthy for Ozone
ESA Future Mission
Provides temperature profiles and trace gases in the upper troposphere to mesosphere including ClO, O3, HCl, NO, BrO as first priority, and HOCl, CH3Cl, H2O, N2O, HO2, HNO3 as second priority
Waveband: Sub-millimetre 499.4-505, 624.5-626.6, 628.2-628.7, 730.5-732, and 851.3-852.8GHz. Spatial resolution: In limb mode vertical resolution: 2 km In down-looking mode: Not Applicable (Limb viewing instrument) Swath width: 10-50km tangent height range
TES Tropospheric Emission Spectrometer
EOS CHEM-1 NASA’s future mission, launch year 2003
Provides 3-D profiles on a global scale of all infra-red active species from surface to lower stratosphere. Measures greenhouse gas concentrations, tropospheric ozone, acid rain precursors, gas exchange leading to stratospheric ozone depletion.
Measurement Type: IR imaging Fourier transform spectrometer (FTIR) Waveband: SWIR-TIR: 2.3-15.4µm Spatial resolution: In limb mode vertical resolution: 2.3km vertical resolution. In down-looking mode: 50km x 5km (global), 5km x 0.5km (local) Swath width at Limb mode: global: 50km x 180km local: 5kmx 18km Revisit capability: 4 days
References in Ch. 2.4

Appendix E: Ground-Based Monitoring Programs Program Operation
Status/ Coverage Area
Mission Additional Information
EUROCARBO Cluster of Projects to Understand and Quantify the Carbon Balance of Europe
In Operation since 2000-2003 Covers whole Europe
-to advance the understanding of carbon fixation mechanisms
-to quantify the magnitude of the carbon sources/sinks for a range of European terrestrial ecosystems
to understand how these constrained by climate variability, availability of nutrients, changing rates of nitrogen deposition and interaction with management regimes.
Participants: 69 Institutes in 15 European countries Funded by European Union. Measurement Site: More than 30 sites Location of test sites: North - South transect, going from about 41° to 65° North Latitude and from about 20° West to 25° East longitude. Measurements: Soil carbon and biomass studies, continuous measurements of carbon, nitrogen, energy and water fluxes at forest stand scale. Modeling studies:
- Techniques are developed for upscaling ecosystem models from stand and ecosystem level to landscape (bottom-up approach) and for downscaling results of inverse atmospheric modelling from the continental and regional level to ecosystems (top-down approach).
- Atmospheric mesoscale models are coupled to
terrestrial ecosystem models to bridge the existing gap at regional level.

EUROAIRNET European Air Quality Monitoring Network
- In Operation since 1997. - Covers whole Europe
- to provide the Community and the Member States with objective, reliable and comparable information at the European level enabling them to take the requisite measures to protect the environment, to assess the results of such measures and to ensure that the public is properly informed about the state of the environment
Participants: All EEA countries. Program is carried out by the coordination of EEA. Measurement Site: Approximately 5000 monitoring stations already exists from all around the Europe. Measurements: Some of the measured pollutants are SO2, SO4,NOx, NH4, HNO3, O3. Ca+2, Cl-, H+, ionic calcium, hydrogen, particulate matters (Pm10 and PM2.5). Air, rain and material samples are used in measurements. Additionally, some meteorological parameters such as humidity, temperature are measured for to be used in Modeling studies. Measured data is reported to European Air Quality Database (AIRBASE).

CORINAIR A program to establish the atmospheric emission inventories of the European countries.
In operation since 1985. Covers Europe
to produce a methodology and a system allowing to satisfy all European needs on air emissions inventories.
Participants: All EEA countries. The program was initiated by EEA. Emission Inventory: CORINAIR deals with the acidification, photochemistry and greenhouse effects. CO2, CO, N2O, NH3, CH4, NOx, SO2, NMVOC are inventoried. Sources: More than 240 emission sources were defined within the program.
EUROFLUX Long Term Carbon Dioxide and Water Vapor Fluxes of European forests and Interactions with the Climate System
In operation 1996 – 1998. Covered Europe
- to estimate the CO2 exchanges between atmosphere and forests in Europe,
- to quantify CO2 sinks of
forest ecosystem.
Measurement Site: 15 stations in 10 countries which are Iceland, Finland, Denmark, Netherland, Belgium, Italy, Sweden, Scotland, Germany and France those all represented 17 very different European Ecosystems. Measured parameters: Some sorts of measurement were applied to the forest canopies so as to estimate the CO2 exchange between forests and atmosphere, and to quantify CO2 sinks. Some of the parameters measured were carbon dioxide, water vapour, sensible heat, momentum fluxes, biomass components.
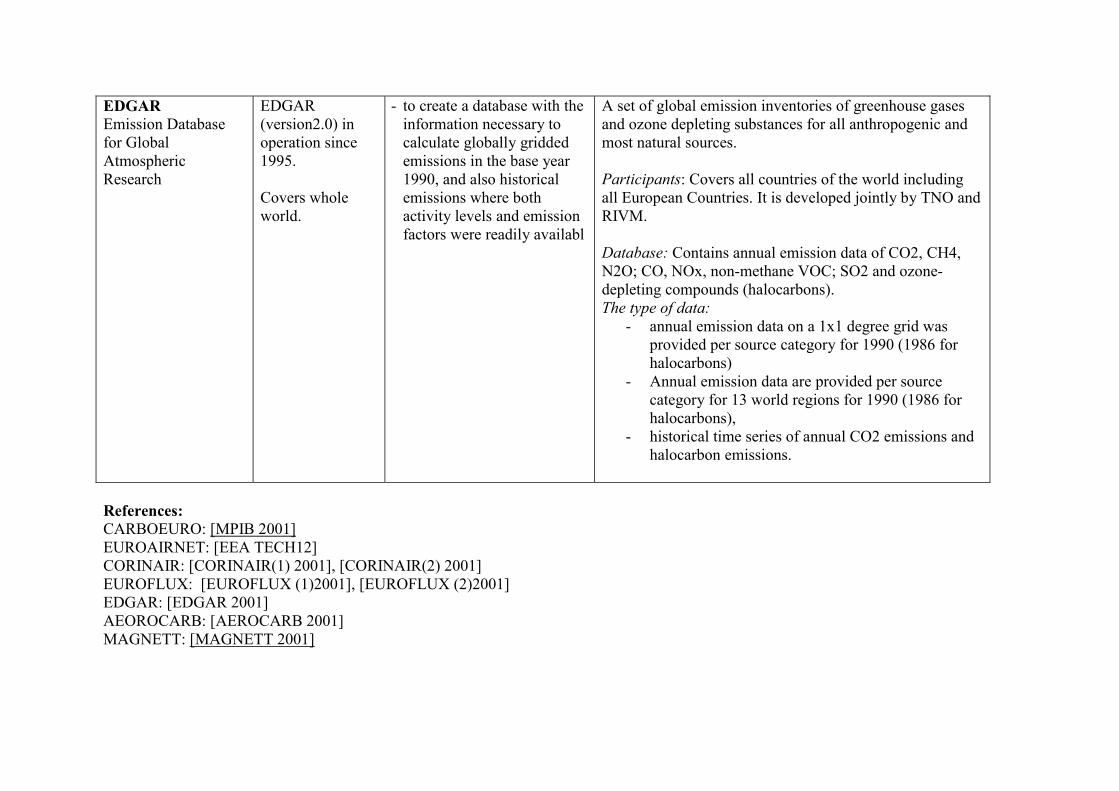
EDGAR Emission Database for Global Atmospheric Research
EDGAR (version2.0) in operation since 1995. Covers whole world.
- to create a database with the information necessary to calculate globally gridded emissions in the base year 1990, and also historical emissions where both activity levels and emission factors were readily availabl
A set of global emission inventories of greenhouse gases and ozone depleting substances for all anthropogenic and most natural sources. Participants: Covers all countries of the world including all European Countries. It is developed jointly by TNO and RIVM. Database: Contains annual emission data of CO2, CH4, N2O; CO, NOx, non-methane VOC; SO2 and ozone-depleting compounds (halocarbons). The type of data:
- annual emission data on a 1x1 degree grid was provided per source category for 1990 (1986 for halocarbons)
- Annual emission data are provided per source category for 13 world regions for 1990 (1986 for halocarbons),
- historical time series of annual CO2 emissions and halocarbon emissions.
References: CARBOEURO: [MPIB 2001] EUROAIRNET: [EEA TECH12] CORINAIR: [CORINAIR(1) 2001], [CORINAIR(2) 2001] EUROFLUX: [EUROFLUX (1)2001], [EUROFLUX (2)2001] EDGAR: [EDGAR 2001] AEOROCARB: [AEROCARB 2001] MAGNETT: [MAGNETT 2001]

All
Selected IR absorption features of our targetgases
Appendix F: Remote Sensing Physical Process There are three main physical processes by which we observe properties of the atmosphere. These are: Extinction - attenuation of radiation from a source (Sun or Earth) due to absorption or scattering Emission - emission of electromagnetic radiation directly from atmospheric molecules Scattering - radiation from an environmental source or active sensor is scattered into a sensor All three contribute to any process that we observe in the atmosphere and all happen continuously throughout. We observe these processes as modifications of the “perfect” black body curve that would be present for an ideal emitter in free space. There are two types of spectra that give us data on a gas through its emission and absorption. The first is atomic absorption / emission and this occurs when an electron makes a transition from one atomic state to another. The second more complex but more easily accessible data come from molecular absorption / emission. These derive mainly from vibration and rotation of the bonds securing atoms in the molecules that we are trying to observe. Typically this kind of interaction is shown by strong absorption or emission in the infrared. Is it these spectral features that we use as diagnostics of the state of the atmosphere – for example the line width gives information on temperature, the amount of absorption / transmission tells us the amount of that absorber over a particular height range etc.

The figure re-printed here shows again the absorption spectra for our three target gases for a particular portion of the infrared spectrum. Suffice to say that these represent a signature by which we can both identify the gas present and quantify its amount. As can be seen there are many separate features present for any gas – the selection of exactly which part or parts of the spectrum are examined is critical for the success of atmospheric remote sensing. Interference from bands with similar spectra, or from water (which is responsible for a wide ranging absorption feature) and where the band lies in relation to the black body curve (i.e. how “bright” this feature will be) are all-important considerations. The gases that we are measuring and their concentrations in the atmosphere are: Molecule Volume fraction Comments
CO2 3.45 x 10⁻⁴ Slightly variable; mixed up to 100km, dissociated above
CH4 1.65 x 10⁻⁶ Mixed in troposphere, dissociated in mesosphere
N2O 3.5 x 10⁻⁷ Slightly variable at surface, dissociated in stratosphere and mesosphere
Radiative Transfer Complex models are usually built up to describe the interaction of radiation and gases in different parts of the atmosphere. These models have to include all of the processes listed above that are occurring in parallel. Thus (thermal) radiation emitted from the Earth or reflected sunlight is absorbed by the lower atmosphere at a characteristic frequency, and then re-emitted. This process continues from layer to layer until reaching the instrument. This process of radiative transfer is characterised by the initial radiation flux, and the height integral of the Plank function multiplied by a weighting function giving the change of transmittance with respect to altitude. This latter term weights the Plank function in the part of the atmosphere that is emitting radiation. This means that the function peaks at the point where the radiation seen at the top of the atmosphere originates, and hence specifies what layer is being “sensed”. In fact even within an absorption band vertical information can be obtained. In the band centre, where absorption is strongest, radiation arises from the upper atmosphere (radiation emitted at lower levels is absorbed). Further from the centre point, in the band “wings”, absorption is weak and hence a larger atmospheric path is required to produce this attenuation, thus the radiation emitted has a source lower in the atmosphere. Gas Correlation Radiometry

This section attempts to describe in more detail the workings of a gas correlation radiometer, as detailed earlier. The actual useful signal produced for any gas is derived from the signal detected for at least two different gas cell pressures. The difference in the amount of absorption between different modulation states of the cell produces a difference signal that is close to zero everywhere apart from at the target gas lines where it increases. This is shown schematically in the graphs below. What this diagram shows is that the correlation system basically defines a filter that samples different portions of the pressure-broadened line wing (and hence different source depths in the atmosphere) depending on the modulation. There are various methods of modulating the absorption in the cell. Pressure modulation simply has a mechanical piston that is used to vary the pressure. Any mechanical system does, of course, have an inherent risk attached and so an alternative solution is to simply carry two or more cells of the same gas at different pressures and switch between them using a mirror or other electro-optical system.
The “filter” effect of multiple gas cell pressures Adapted from [MOPITT Team, 1993]
In most systems a chopper is also used. This is a mechanical or electro-optical system that periodically “chops” or interrupts the radiation. This can serve several purposes. Firstly during the times when the incident radiation is being eclipsed a calibration target can be applied. Secondly low frequency noise is often a problem in infrared detectors. This can be removed by modulating the signal with a chopper and demodulating using a phase-sensitive detector and narrow band filter around the modulation frequency. This appendix shows the absorption features of the gases in question and identifies those that are potentially useful for this experiment. It can already be seen that the bands tabulated below have some overlap, particularly for methane and nitrous oxide. The latter has a rather more complex set of absorption lines, as can be seen below, and so an alternative selection if no doubt possible.
Gas species Reflected radiation band Thermal radiation band
Wavelength (µm)
Wavenumber (cm-1)
Wavelength (µm)
Wavenumber (cm-1)

CH4 2.3 4350 3.3
7.8 3030 1282
N2O 2.3 4350 4.5 7.8
2222 1282
CO2 2.0 5000 4.3 2326 The following plots show the absorption profiles of the gases under consideration. They were provided by Genspect and are derived from the “HITRAN database, across the entire spectra range of each gas … calculated assuming a standard Earth atmosphere and at ground level.”


Possible instrument types According to the atmospheric properties, molecular vibrations occur at frequencies corresponding to infrared wavelengths; CO2, CH4 and N2O exhibit spectral signatures in the thermal infrared. The present research and development of the sensor technology manifests that the infrared detector is the becoming method for the space-based earth atmospheric monitor. The design of the infrared radiometer is dominated by the wavelength selection technique that may be based on filters, diffraction grating or an interferometer. Here we give some review of the typical infrared detectors, and discuss the feasible for our microsatellite application. Gas correlation radiometer Gas correlation radiometry is a technology that has been under development for many years. In this technique, onboard gas cells filled with the target gases provide measurements of a specific gas, and various forms of selective chopper have been used to switch the radiation. The spectral response can match the emission spectrum even for the very narrow line widths corresponding to mesospheric altitudes. The brightness temperature is much higher than that which would be observed by a simple filter radiometer that averages radiation over its passband, so the sensitivity and accuracy of the measurement will be increased. This technique does not require the absorption lines to be resolved and is characterized by high signal-to-noise ratio. Selective chopping also reduces problems and overlapping bands from other molecular species. The disadvantages of this measurement includes: Problems may arise from Doppler line shift due to satellite motion. For high accuracy measurement, some form of compensation must be adopted. This method cannot be used with chemically active gases such as ozone because of the difficulty of stable containment. A gas correlation radiometer typically uses some kind of mechanical device, such as a shutter or chopper, to switch its internal optical paths. The MicroMAPS, MAPS and MOPITT instruments are this kind of instrument. MicroMAPS has been used to detect CO and N2O. It is a typical microsatellite instrument. MAPS was used to detect CO, and worked in short duration of shuttle mission. MOPITT has been used to monitor the CO and CH4, carried by NASA’s Terra platform that was launched to low Earth orbit in Dec.1999.

The NASA Langley Research Center (LARC) has developed a new kind of Gas Filter Correlation Radiometer (GFCR), it uses electro-optical path switching that is completely non-mechanical. The GFCR approach offers distinct advantages over conventional mechanical gas sensors, such as faster response, higher reliability, improved signal-to-noise ratio, and a less complex and more compact design. It is expected to be used in the near future. Fourier Transform Infrared Radiometer(FTIR) A Fourier transform spectrometer is kind of interferometer type device, it can detect the limb emission spectra in the middle and upper atmosphere. It observes a wide spectral interval throughout the mid infrared with high spectral resolution. Due to its spectral resolution capabilities and low-noise performance, the detected features can be spectroscopically identified and used as input to suitable algorithms for extracting atmospheric concentration profiles of a number of target species. The spectral resolution of a FTIR is mainly determined by the maximum path difference achievable in the particular interferometer, for the instrument of our mission, the spectral resolution must be sufficient to resolve individual atmospheric emission lines.
The Schematic concept of FTIR
The advantage of an FTIR over spectrometers with dispersive elements (like gratings or prisms) lies in the fact that a single detection element can be used to record a broadband spectrum (limited only by the spectral response of the detector) with high spectral resolution, while for dispersive spectrometers either a scanning detector must be used , or a large array detector must be employed, which simply doesn't exist yet in the mid infrared. Thus an FTIR is the only way so far to obtain complete high resolution IR-spectra with good sensitivity. The drawback of an FTIR is its mechanical complexity, comprising moving optical elements which have to be guided with a very high precision over an extended distance, and very high alignment stability required for all optical components in the interferometer. To the instrument design, the alignment constraints become even more challenging as the optics are cooled down to -70° C to reduce the thermal self-emission. The IMG (Interferometric Monitor for Greenhouse gases) instrument is the precursor of the high resolution FTIR. Flown on the Earth-observing satellite MIDORI, it had been used to detect CO2,CO,CH4,N2O and others trace gases. MIPAS (the Michelson

Interferometer for Passive Atmospheric Sounding), an instrument onboard Envisat is a typical FTIR instrument; it monitors high resolution gaseous emission spectra at the earth’s limb. It operates in the near- to mid-infrared where many of the atmospheric trace-gases playing a major role in atmospheric chemistry have important emission features, such as CH4, N2O, O3, HNO3, H2O etc. The CO2 detector is prepared for the future mission. It has big mass, volume and high power need. It is a design challenge for microsatellite application, the data process and analysis may be done by ground instrument. Etalon-based filter system The Australia scientists development a kind of spaceborne instrument is called GGC-the Greenhouse Gas Monitor. It is to view and scan the sun-glint region on the Earth’s surface, and detect the absorption of sunlight in its path through the atmosphere. The present design goal is to detect CO2, CH4,O2 and H2O. And it is a kind of tunable etalon spectrometer. It is effectively a narrow-band Fabry-Perot interference filter with a voltage-tunable refractive index, and a versatile instrument capable of addressing carbon emission / greenhouse gas issues. This instrument has a very compact construction can be used as a microsatellite sensor.
Schematic concept of an etalon-based filter system
Instrument Comparison and Review The gas filter correlation technique is feasible to be used to observe a broader range of species, and it will give get high spectral resolution infrared spectrometer. MicroMAPS system and Etalon-based filter system have mini structure, through suitable design improvement, it will be used in microsatellite. The FTIR device has complicated structure and high alignment stability requirement. It may not be installed into microsatellites in the near future. For the greenhouse gases monitor, the integrated measurement of CO2 ,CH4 and N2O is a challenge for design and manufacture. The measurement of CO2 is highly sensitive to the atmospheric temperature profile and so for CO2, passive measurements such as absorption spectroscopy are ideal, as they can offer high sensitivity to gas concentrations, high signal-to-noise ratios and without the need for absolute calibration.

Some new technology and future instruments The important factors of space-base instrument, especial for microsatellite applications, are low mass, small size and low power. The Sandia National Laboratory, jointly with Honeywell and MIT, is developing a sensor known as “Polychromator” for space application. This is an electrically programmable diffraction grating that can be programmed to synthesize the spectra of molecules. It will be used as the reference cell in a gas correlation radiometer to enable remote chemical detection of most chemical species. This method would be to replace the reference cell in a correlation radiometer for remote optical sensing. Another predevelopment is µChemLabTM, which used the micro-fabrication technology to develop a small(palm-top computer size), lightweight, and autonomous system, the system can provide rapid, sensitive, and selective detection of target analytes. An array of chemical sensors with different sensing chemistries is an alternative approach to develop micro-instruments. This technology will great lift level of the microsatellite application. Reference W. JinXue et al. Measurement of pollution in the troposphere(MOPITT) Data Validation plan: National Center for Atmospheric Research, Ver.4.0, Jan.1998 C. Readings et al. Envisat MIPAS An Instrument for Atmospheric Chemistry and Climate Research:SP-1229 ‘Envisat-MIPAS’ March 2000 M. Suzuki et al. Feasibility Study of Advanced Observation of Earth's Atmosphere Using Fourier Transform Infrared Spectrometer. National Institute for Environmental Studies, Environment Agency 16-2 Onogawa, Tukuba, Ibaraki, 305-0035, Japan P. Teague et al. A Global Greenhouse Gas monitor :Vipac Engineers & Scientists Ltd. Australia. < >
<
http://www.sdl.usu.edu/conferences/smallsat/proceedings/14/tsiii/iii-2.pdf G. PECKHAME. Et al. Instrumentation and Measurement in Atmospheric Remote Sensing <http://www.phy.hw.ac.uk/~peckham/pubs/rpp91.pdf J. Paul et al Adaptive Distributed Infrared Remote Sensing Instrument Concept for Microsatellites 2000 <http://www.ece.uwaterloo.ca/~camera/PDF/SPIE_mosaic.pdf> ESA MIPAS Concept, 2000
http://envisat.esa.int/instruments/mipas/descr/concept.html> Committee of Peaceful uses of Outer Space ,1998 http://www.oosa.unvienna.org/Reports/AC105_729E.pdf Different Satellite Instrument,2000

http://www.ifm.uni-kiel.de/ch/solas/CommonIssues.pdf Measurement and Visualization of The Distribution of Methane Gas,2000 < http://criepi.denken.or.jp/RD/nenpo/1999E/99seika18.pdf> T.L.Anderson etl. Satellite Instruments for Tropospheric Chemistry. 1999 <http://web.mit.edu/igac/www/is_book/pdfs/5-text.pdf> The GMOE Spectrometer ,2001 <http://www.iup.physik.uni-bremen.de/gome/gomeinst.html > Morrison A. The Earth Observer - he Earth Observer - September/October 1997, Vol. 9 No. 5 <http://eospso.gsfc.nasa.gov/eos_observ/9_10_97/p08.html> The Greenhouse Effect,1998 <http://www.dar.csiro.au/info/material/info98_2.htm> Global Climate Change and The Enhanced Greenhouse Effect.,2000 <http://www.biology.ualberta.ca/courses.hp/bio381/topic-14-Large.htm>

Appendix G: Link Budget Link Budget Up link (ground station to satellite) 1. Ground station Type of modulation D-BPSK 9.6 Kbit/s Power 2 W 3 dBW Ground station cable loss 3.5 dB Ground station antenna gain 2.4 m 29.5 dBi Ground station EIRP 29 dBW Maximum distance 2200 Km Transmitter frequency 2108.87 MHz Free space loss 165.8 dB Atmospheric losses 0.5 dB 2. Microsatellite Spacecraft antenna gain 1 dB Spacecraft cable loss 0.5 dB Total power at Rx input (-) 136.3 dBW T system 1295 K 31.1 dB Rx IF bandwidth 100 KHz 50 dB G/T (-) 30.1dB/K C/No 62.5 dBW/Hz Eb/No 12.5 dB

Link Budget Down link (satellite to ground station) 1. Satellite Type of modulation D-BPSK 1 Mbit/s
2280.18
924.1 K
Power 1 W 0 dBW Satellite cable loss 1.5 dB Satellite antenna gain 1 dBi Satellite EIRP (-) 0.5 dBW Maximum distance 2200 Km
Transmitter ferquency MHz Free space loss 167.7 dB Atmospheric losses 0.5 dB 2. Ground station Ground station G/T 13 dB/K Antenna gain 2.4m 32 dBi Receiver second IF bandwidth 1.3 MKz 61.2 dB System noise temperature 29.6dB C/No 72.9 dBW/Hz Eb/No 11.7 dB

Appendix H: TT&C
Telemetry is data received from the spacecraft, generally about the status of its systems. During the launch and early orbit, telemetry allows ground technicians to check the commands are being carried out correctly, e.g. those boosters are being fired or that the antenna and solar panels are being deployed. Throughout the mission, it enables the mission control centre to survey the ‘insides’ of the satellite, its configuration, its status, and in case of failure, it provides the basis for decisions that have to be made.
1. Introduction Telemetry, Tracking and Command (TTC) are vital functions of spacecraft. They allow data to be communicated between ground and spacecraft for spacecraft control and command. The communication is through a telecommunication link established between the control station on the ground and the satellite. The three functions of telemetry, tracking and commanding are essential for satellite. Telemetry is necessary to monitor and evaluate the satellite. Telecommand is used to control satellite functions. Finally, tracking is necessary for ranging. The ranging data are used by the ground control to determine the satellite orbit and for orbit control. The number and accuracy of functions being monitoring in the satellite determine the telemetry data rate. With a multiplexer is obtained a single beam of telemetry data even there are different parameters monitored. The TT&C data rate selected is 9.6 Kbps 2. Telemetry
3. Command The telecommand link is used to upload commands to the spacecraft, particularly when mission characteristics are not defined after launch. Two possible formats of command messages that could be sent to the spacecraft are: - Discrete commands used for equipment on/off operation - Proportional commands used for orbit control. Before commands are executed the contents of each command are retransmitted to the ground through telemetry channel for verification. The spacecraft must be protected against miscommanding by using well-protected command sequences. Real time and stored command sequences are processed at rates up to 9.6 Kbps. 4. Ranging TTC’s third function is tracking and ranging. Transponder demodulates the ranging signal contained in the uplink and remodulates it into the downlink. Thus, by measuring the return propagation time, the distance between the ground station and the spacecraft can be estimated. Moreover, the transponder has the ability to generate

a down link carrier phase coherent with the uplink carrier, allowing precise estimations of orbit and speed from measurements of Doppler offset and rate of downlink frequency at the ground station. The ranging signals are transmitted through telemetry transmitter in the form of digital signal. 5. Regulatory aspects and standardization The question of frequency bands is of fundamental importance for telecommunication systems. The use of the frequency spectrum for RF transmission by all telecommunication systems is highly regulated by the International Telecommunication Union (ITU) in Geneva and is subject to formal registration and approval by the ITU authorities. 6. Selection of a Frequency Band The frequency band used by TTC system is dictated by propagation, performance and regulatory requirements. The majority of the TTC systems use S-band (around 2 GHz), which allows minimal propagation loss through Earth atmosphere (less than 1dB) and rates up to approximately 1Mbps. This is usually adequate for Earth-orbiting missions (including GEO). 7. TT&C Specifications - Uplink transmission frequency band 2020 – 2120 MHz (Earth to the space) - Downlink transmission frequency band 2200 – 2300 MHz (space to Earth) 8. TT&C Architecture The architecture of TT&C comprises two transponders each with transmitter and receiver and two command decoders. The interface with the rest of satellite is via the On Board Data Handling (OBDH) system. The uplink carrier with telecommand (TC) signal from the ground station is receive by the antenna and applied to both receiver inputs via a diplexer. The signal consists of a 2 GHz carrier phase modulated by an 8KHz or 16KHz subcarrier, itself D-BPSK modulated with TC data. The two receivers work in ‘hot redundancy’ and output the modulated carrier at baseband to active decoder. The decoder recovers the TC data and sends it to OBDH. The active transmitter generates a downlink carrier phase modulated and frequency coherent with the uplink carrier, which allows measurement of Doppler by the ground station, aiding satellite localisation. The uplink signal also contains the ranging signal, which is demodulated by the receiver and transmitted back to the ground with the telemetry (TM), using differential phase modulation on a single downlink carrier. The transmitter amplifies the modulated signal, which is connected to the antenna via the diplexer and RF switches. The transmitted and received signals use the same antenna but they are isolated from one another by the diplexer. The receive signal is applied to two ‘hot redundant’ receivers. ‘Hot redundancy’ minimises interruption of control in emergencies and

increases reliability by avoiding power on/off cycles of the receivers. The transmitters are switchable; the selection of the transmit signal is made via the RF Distribution Unit (FRDU). This switching capability together with the redundant architecture allows a ‘crossed’ scheme where the transmitter of one transponder can be used with the receiver of other. A TTC transponder comprises:
Packet telemetry
- A receive chain which tracks the uplink telecommand signal received from ground, demodulates the commands data (TC) and forwards this to the onboard data handling. It also demodulates the ranging signal (RNG), which is than fed to the input of the transmitter for retransmission to ground - A transmit chain which modulates the telemetry data (T M) and ranging signal onto the downlink carrier. Compliance with CCSDS Recommendation CCSDS (Consultative Committee for Space Data Systems) issued the recommendations for space data system standards. Many of the recommendations have become standards, and many agencies have adopted them as their own agency standards. CCSDS 401.0-b Recommendations refer to radio frequency and modulation systems for earth stations and spacecraft. CCSDS issued a set of standards for the transmission of data between a spacecraft and a ground system, and is extended to the implementation of interfaces between spacecraft subsystems. Regarding the telemetry, telecommand and communication protocols these recommendations are dominant. CCSDS Recommendation for TT&C transmission Telecommand for ground station and spacecraft: 8 or 16 KHz, PSK, sine wave- subcarrier, modulation and waveform NRZ (Non Return to Zero) choice telecommand data waveforms 4000/2 esp. n, where n=0,1,2,3….,9. PCM/PM/BPSK; 4000/2 exp. N, where n=1, 2, …, 6 Medium-rate modulation; range of TC bit rates. Telemetry for ground station and spacecraft NRZ-M Modulation: use with suppressed carrier system
Sine wave: Cat A subcarrier waveform 221/241 Transponder ratio: 2020-2120 MHz to 2200-2300 MHz

Ranging signal Ranging signal >100 KHz for ground station Differential one-way ranging tones 4MHz Spacecraft transponders will have two- sides pre-detection filter bandwidth of not less than 250 KHz followed by a second filter of not less than 3 KHz. For Category A mission’s ground to spacecraft links, sine wave ranging shall be used when operated simultaneously with tele-command.

Appendix I: Typical Transponder Block Diagram Uplink Composite Digital Command Comm
Data to OBDH
Receiver Detecto
Signal RF Commands Subsystem
Carrier & Digital Bus Subcarriers Modulated (From Antenna) Cmd Tlm onto Cmd Tlm Subcarrier Coherent Drive Ranging Signal Digital Telemetry on Spacecraft’s Health And Status from
Control fo
Downlink OBDH Subsystem
Transm Si
Composite Signal Downlink Digital Mission or
and r
Exciter/ itter
Condition r
Telemetry gnals
RF Carrier& Telemetry Science Telemetry Subcarriers Cmd Tlm Digital Bits Cmd Tlm from Payload or (To Antenna) Modulated Data Storage

Appendix J : Communications
Data 2
Clock 2
Data 1 Clock 1
Rx Hybrid
RX Filter
RX Filter
LNA-1
LNA-2
FSK Rx-1
Bit Synch
Bit Synch
FSK Rx-2
Diplex
TX PM BPSD
TX Hybrid
TX Filter
TX PMBPSK
TX Filter
TCXO S-band
Data 1 Clock 1
Data 2
Clock 2
Preamp 1
Viterbi Encode
Preamp 2
Viterbi Encode

Appendix K: Ground Segment Block Diagram 2.4 m Dish & LNA
10MHz G
RS-232
Antenna Drive
HPA
S-band PM
Subcarrier
Packetiser
X-band D/Conv
Variable Demod
De-Packetiser
Universal
10MHz
Ethernet OCC Telemetry
PS Antenna
RS-232
Ethernet OCC

Appendix L: Basic ground station diagram
To To
Spacecraft Data Users
To Station Component From MCC
To SSOC, POCC MCC
Receive RF Equipment Down conversion Demodulation G/T
Mission Data Recovery Equipment
Bit Synchronizer Buffer
Data User Interface Switching Communications Connections
Station Control Center Configuration
Operation
Antenna System G/T EIRP Steering
Transmit RF Equip. RF Carrier Modulation EIRP
TT&C Equipment Telemetry Tracking
Command
Basic ground station diagram

Appendix M: SSP Design Project Design Project 2: Micro-spacecraft and Europe's Environment Micro-spacecraft and Europe's Environment Introduction: At the ISU 2000 summer session in Bremen, a student team will execute a project to use space systems for meeting urgent environmental needs in Europe. In doing a focused European case study, the team will develop solutions also applicable in other parts of the world. With microtechnology providing exciting new opportunities for fast action at low cost, the team is expected to show the way to innovative and practical applications of ground, airborne and space systems to improving environments. Objectives: The two objectives of the project - equal in priority - are: (a) to provide experience in multidisciplinary teamwork and (b) to produce a report that can influence space and environmental developments in Europe. Background: Highly industrial civilizations exert great pressure on their natural environments. With the formation of the European Union and various international agencies, plus action by people concerned with saving nature and maintaining the quality of human and other life, new political opportunities exist for the use of modern space and ground technology in support of environmental goals. At the same time, new micro-systems are enabling observation and communications missions in a new class with quick response time, low cost and focused objectives. The time is ripe for this convergence to be examined from an international perspective. An ISU student team, unconstrained by previous plans or policies, may document new ways for gathering and disseminating reliable data, to be used in concert with existing and planned ground, air and space data sources, to open a new era in environmental improvement for Europe. Method: The student team is expected to perform at least the tasks listed below. In addition to this list, team members are invited to be creative and innovative in developing new ideas that can be explored and documented within the scope of a summer project. Tasks: (a) Based on prior work, including that accomplished by the team design project in the sixth ISU Master of Space Studies curriculum (MSS 6) which produced a worldwide list of existing ground-based, airborne and space programs and plans relevant to applications of micro-spacecraft to help solve environmental problems in temperate industrial regions. (b) With the help of faculty, teaching assistants, team-building experts and project advisors choose a practical scope for the micro-spacecraft design project and devise a team organization and work plan.

(c) Investigate technical and organizational initiatives for using space, air, water and ground microtechnology toward the economical and innovative solution of Europe's environmental problems. Coordinate this task with ongoing activities such as those of the EU's European Environment Agency. Explore and briefly document applications of the results to temperate industrial regions elsewhere. (d) Conduct and document a technical, management, business and policy case study of a user-driven micro-spacecraft system architecture and a micro-spacecraft flight-system and instrument payload design for a baseline selection of observation and data products covering Europe. Include bibliographic references to current programs, for example TERRA, Meteosat, ERS-1 and 2, ENVISAT and existing ground systems. Include analysis of small satellite constellations for achieving frequent coverage of environmentally critical regions. (e) With the results of this baseline case study in hand, briefly document, via a bibliography, other European applications, including space and environmental sciences, as well as applications of the designed system in temperate industrial regions beyond Europe. (f) Document tasks (a) through (e) in a report of about 200 pages in length, plus an Executive Summary of about 10 pages, to be printed and distributed by the end of the ISU 2001 summer session. The report is to be written in English and the Executive Summary will be released in both English and German. On a non-interference basis with the report tasks, produce an electronic version to be released as a CD-ROM after the end of the session. Topic selection criteria: In selecting specific topics for tasks (a) through (f), the student team is expected to apply the following criteria: (1) Workable: Generating a complete, integrated product with clear conclusions in nine weeks? (2) Realistic: Technically, economically, politically feasible? Potentially profitable in medium term? (3) Innovative: Likely to stimulate new and unprecedented ideas? (4) Focused: Having clearly defined and stable objectives? (5) Enabling: Advancing human and organizational commitment to environmental improvement? (6) Beneficial to team: Useful to students as alumni in their later careers? (7) Fostering teamwork: Stimulating creativity and a drive toward consensus? (8) Interdisciplinary: Engaging the talent and energy of students in all ISU Departments? (9) International: Inherently requiring a cooperative multinational approach?

Appendix N : CASSIOPPE Mythology
1Once upon a time, according to Greek legend, Cassiopeia -- queen of Ethiopia, wife of Cepheus, and mother of Andromeda -- who was an arrogant woman, insulted the god Neptune by saying her daughter was more beautiful than his. Neptune became angry and sent a sea monster to ravage the land and devour Andromeda who was chained to a rock to await the sea monster. However, our hero Perseus, who wore winged sandals, saved her and they lived happily ever after, except that they were all placed in the sky. Perseus was required to spend eternity in the sky with his beautiful wife and his in-laws. I hope he got along
with them. Neptune condemned Cassiopeia to her throne and she must revolve eternally around the North Star in the heavens. Because he was angry with her, she must hang upside down for several months every year. There are 5 constellations in the autumn sky associated with this story. Queen Cassiopeia, her husband King Cepheus, the winged horse Pegasus, beautiful, chained princess Andromeda, and the hero Perseus all revolve through the night sky. Picture courtesy of Windows to the Universe, http://www.windows.ucar.edu
1. Windows to the Universe team. cassiopeia. Boulder, CO: ©2000-01 University Corporation of Atmospheric Research (UCAR), ©1995-1999, 2000 The Regents of the University of Michigan, September 2000. Online. Available: http://www.windows.ucar.edu . 5 September 2001.