the challenge of china’s rise as a science and technology ... · the rise of china as an s&t...
TRANSCRIPT
Reinhilde Veugelers
(reinhilde.veugelers@
bruegel.org) is a Senior
Fellow at Bruegel.
Comments from Jianwei Xu
and Guntram Wolff, and the
assistance of Enrico Nano,
are gratefully acknowledged.
This Policy Contribution
updates previous Bruegel
work: Veugelers (2011) and
Veugelers (2013).
Executive summary
China is building up its global competitiveness in knowledge-intensive sectors
and its ambition to be a global leader in science and innovation by 2050 seems well within
reach. China outperforms the European Union in terms of expenditure on research and
development as a share of its GDP, and already produces about the same number of scientific
publications, and more PhDs in natural sciences and engineering, than the United States.
China aspires to produce and capitalise on home-grown scientific talent,
but its growth model for science still involves sending out its increasingly better locally-
trained scholars to the best institutes in the world and reaping the benefits when they return
in the later stages of their careers, after they have fully developed their capabilities and built
their networks. The US remains the favoured destination for Chinese students, which has led
to the creation of US-Chinese science and technology networks and connections that are
mutually beneficial: enabling China to catch up and helping the US to keep its position at the
science frontier.
The EU has much less-developed scientific connections to China than the US.
The EU should take steps to engage more with China if it is not to miss out in the future
multipolar science and technology world.
Policy Contribution Issue n˚19 | July 2017 The challenge of China’s rise
as a science and technology powerhouseReinhilde Veugelers
2 Policy Contribution | Issue n˚19 | 2017
1 IntroductionThe creation of scientific knowledge and its use in technology and economic and societal
development has become increasingly global and multipolar. Europe and the United States
have traditionally led in scientific development, but China in particular has emerged as a new
science and technology (S&T) powerhouse.
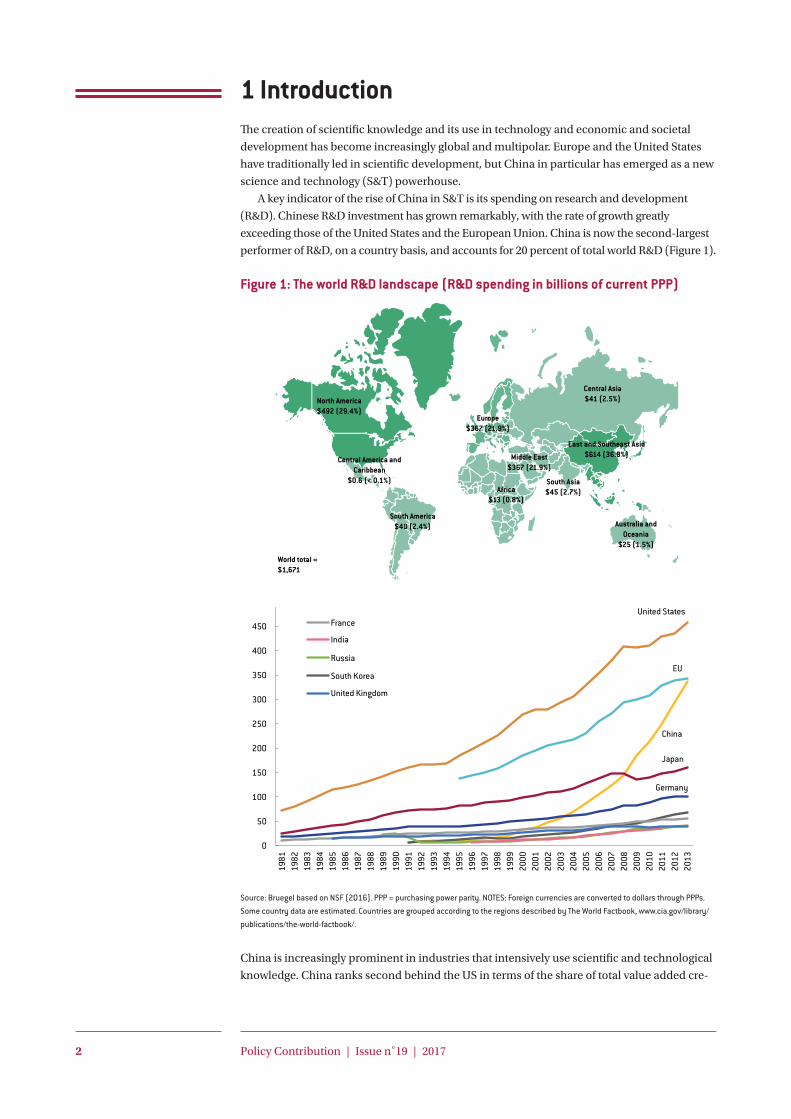
A key indicator of the rise of China in S&T is its spending on research and development
(R&D). Chinese R&D investment has grown remarkably, with the rate of growth greatly
exceeding those of the United States and the European Union. China is now the second-largest
performer of R&D, on a country basis, and accounts for 20 percent of total world R&D (Figure 1).
Figure 1: The world R&D landscape (R&D spending in billions of current PPP)
Source: Bruegel based on NSF (2016). PPP = purchasing power parity. NOTES: Foreign currencies are converted to dollars through PPPs. Some country data are estimated. Countries are grouped according to the regions described by The World Factbook, www.cia.gov/library/publications/the-world-factbook/.
China is increasingly prominent in industries that intensively use scientific and technological
knowledge. China ranks second behind the US in terms of the share of total value added cre-
0
50
100
150
200
250
300
350
400
450
500
1981
1982
1983
1984
1985
1986
1987
1988
1989
1990
1991
1992
1993
1994
1995
1996
1997
1998
1999
2000
2001
2002
2003
2004
2005
2006
2007
2008
2009
2010
2011
2012
2013
United States
EU
China
Japan
South Korea
Russia
India
Germany
France
United Kingdom
North America$492 (29.4%)
Central America and Caribbean
$0.6 (< 0.1%)
South America$40 (2.4%)
World total =$1,671
Africa$13 (0.8%)
Europe$367 (21.9%)
Middle East$367 (21.9%)
Central Asia$41 (2.5%)
East and Southeast Asia$614 (36.8%)
South Asia$45 (2.7%)
Australia and Oceania
$25 (1.5%)
100 200 300 400 500 600

3 Policy Contribution | Issue n˚19 | 2017
ated by high-tech manufacturing (Figure 2, upper panel). In commercial knowledge-intensive
services (business, financial and information), China has now surpassed Japan to move into
third place behind the US and the EU (Figure 2, lower panel).
Figure 2: The rise of China in high tech (current US dollars, billions)
Source: Bruegel based on NSF (2016).
China’s rise in science and technology is not an accident. Successive Chinese leaderships
have seen S&T as integral to economic growth, and consequently have taken steps to develop
China’s S&T infrastructures. In the twelfth five-year plan (2011-15), China listed the pro-
motion of scientific and technological progress and innovation as a major tool for support-
ing strategic economic restructuring. Technology development and innovation also figure
prominently in the current thirteenth five-year plan (2016-20). China’s National Medium-and
Long-Term Programme for Science and Technology Development (MLP), introduced in 2006, is
an ambitious plan to transform the Chinese economy into a major centre of innovation by the
year 2020, and a global leader in science and innovation by 2050. Among the goals of the MLP
are that R&D expenditure should rise to 2.5 percent of GDP – a target that has largely already
been reached. The MLP also puts the emphasis on “indigenous innovation”, with a goal for the
country’s reliance on foreign technology to decline.
0
100
200
300
400
500
600
1999
2000
2001
2002
2003
2004
2005
2006
2007
2008
2009
2010
2011
2012
2013
2014
United States
EU
China
Japan
Other developed
Other developing
Value added created by high-tech manufacturing ($ billions)
500
1,000
1,500
2,000
2,500
3,000
3,500
4,000
4,500
1999
2000
2001
2002
2003
2004
2005
2006
2007
2008
2009
2010
2011
2012
2013
2014
United States
EU
China Japan
Other developed
Other developing
Value added created by business, financial and information services ($ billions)

4 Policy Contribution | Issue n˚19 | 2017
The rise of China as an S&T powerhouse is likely to affect S&T in the US and Europe. The
US S&T model has traditionally been at the frontier and very open. Because the US science
and engineering workforce is highly dependent on migrants, especially from Asia, the rise
of China has provoked deep concern about the sustainability of the American capacity for
innovation and international competitiveness. An added concern is the more recent trend in
the US to move to a more restrictive immigration policy. This comes on top of a reluctance to
allocate public funding to support the building of S&T infrastructure1.
The EU has focused on catching up in S&T terms with the US. The failure to attract and
keep the best scientific brains is also a persistent area of concern for the EU (Veugelers, 2017).
However, the EU is mostly focused on building and sustaining its integrated internal market
for research (the European Research Area, ERA) and removing barriers to intra-EU mobility of
researchers. Although ERA is posited to be an open area, its international strategy is marked
by pronounced EU-supported, intra-EU collaboration, with the risk of overlooking the US and
emerging Asia as partners.
2 A multipolar science world: trends 2.1 China’s increasing share of scientific outputThe US has led the world in the production of scientific knowledge for decades, in terms of
both quantity and quality. However, since 1994, the EU, considered as a bloc (including the
United Kingdom), has outperformed the US in quantity, measured by the number of scientific
papers published in internationally peer-reviewed journals2. But the biggest change has come
from outside the traditional science powers of the US, EU and Japan: China now publishes
more than any other country apart from the US (Table 1).
Table 1: The rise of China in science
Share of world scientific papers
2003
Share of world scientific papers
2013
Average annual growth rate in scientific papers
2003-13
US 26.8% 18.8% 7.0%
EU 31.0% 25.4% 4.9%
Japan 7.8% 4.7% 1.7%
SKorea 2.0% 2.7% 10.4%
China 6.4% 18.2% 18.9%
Source: Bruegel based on NSF (2016).
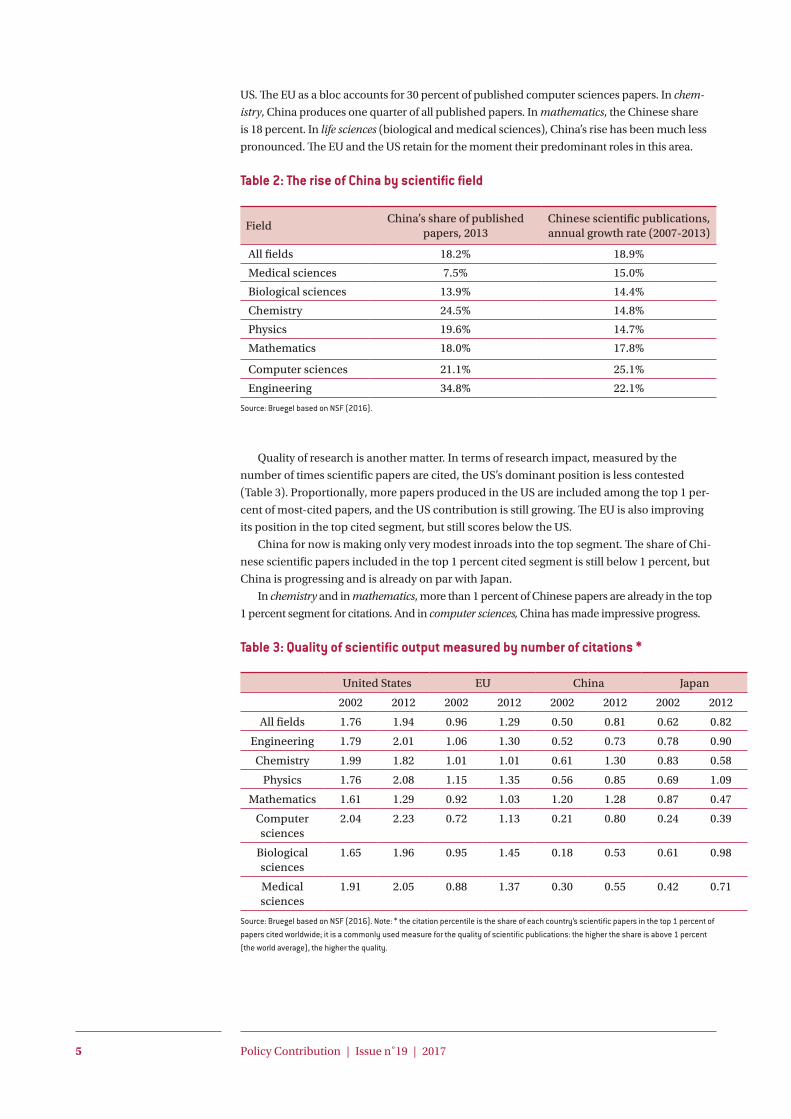
China’s scientific priorities are shown by the big increase in its share of published papers in
the fields of computer sciences and engineering (Table 2). In engineering, China accounted for
more than one third of papers published worldwide in 2013 –by far the largest national share.
The US share is 12 percent and the EU share 19 percent. In computer sciences, China is respon-
sible for more than one fifth of all papers published worldwide, compared to 14 percent for the
1 See eg http://www.kauffman.org/key-issues or https://itif.org/publications.
2 Publications and citations as recorded by Thomson’s ISI-Web of Science journals, which includes only journals
that satisfy a number of quality criteria (internationally peer-reviewed). These journals have an English-language
bias as well as a disciplinary bias in favour of biomedicine and life sciences.
5 Policy Contribution | Issue n˚19 | 2017
US. The EU as a bloc accounts for 30 percent of published computer sciences papers. In chem-
istry, China produces one quarter of all published papers. In mathematics, the Chinese share
is 18 percent. In life sciences (biological and medical sciences), China’s rise has been much less
pronounced. The EU and the US retain for the moment their predominant roles in this area.
Table 2: The rise of China by scientific field
FieldChina’s share of published
papers, 2013Chinese scientific publications, annual growth rate (2007-2013)
All fields 18.2% 18.9%
Medical sciences 7.5% 15.0%
Biological sciences 13.9% 14.4%
Chemistry 24.5% 14.8%
Physics 19.6% 14.7%
Mathematics 18.0% 17.8%
Computer sciences 21.1% 25.1%
Engineering 34.8% 22.1%
Source: Bruegel based on NSF (2016).
Quality of research is another matter. In terms of research impact, measured by the
number of times scientific papers are cited, the US’s dominant position is less contested
(Table 3). Proportionally, more papers produced in the US are included among the top 1 per-
cent of most-cited papers, and the US contribution is still growing. The EU is also improving
its position in the top cited segment, but still scores below the US.
China for now is making only very modest inroads into the top segment. The share of Chi-
nese scientific papers included in the top 1 percent cited segment is still below 1 percent, but
China is progressing and is already on par with Japan.
In chemistry and in mathematics, more than 1 percent of Chinese papers are already in the top
1 percent segment for citations. And in computer sciences, China has made impressive progress.
Table 3: Quality of scientific output measured by number of citations *
United States EU China Japan
2002 2012 2002 2012 2002 2012 2002 2012
All fields 1.76 1.94 0.96 1.29 0.50 0.81 0.62 0.82
Engineering 1.79 2.01 1.06 1.30 0.52 0.73 0.78 0.90
Chemistry 1.99 1.82 1.01 1.01 0.61 1.30 0.83 0.58
Physics 1.76 2.08 1.15 1.35 0.56 0.85 0.69 1.09
Mathematics 1.61 1.29 0.92 1.03 1.20 1.28 0.87 0.47
Computer sciences
2.04 2.23 0.72 1.13 0.21 0.80 0.24 0.39
Biological sciences
1.65 1.96 0.95 1.45 0.18 0.53 0.61 0.98
Medical sciences
1.91 2.05 0.88 1.37 0.30 0.55 0.42 0.71
Source: Bruegel based on NSF (2016). Note: * the citation percentile is the share of each country’s scientific papers in the top 1 percent of papers cited worldwide; it is a commonly used measure for the quality of scientific publications: the higher the share is above 1 percent (the world average), the higher the quality.
6 Policy Contribution | Issue n˚19 | 2017
2.2 China’s growing R&D workforceThe rise of China in science and in knowledge- and technology-intensive industries requires a
growing R&D workforce. The share of China’s workforce active in public and private R&D was
only 0.19 percent of total employment in 2013, considerably below the levels in the US (0.87
percent), EU (0.77 percent) or Japan (1.02 percent). But the Chinese score has been rising
rapidly: its average annual growth rate between 2009 and 2013 was 11 percent (compared to
2 percent in the EU and no growth in Japan; NSF, 2016). Numbering about 1.5 million, China
had in 2014 more full-time equivalent researchers in employment than the US (1.3 million),
more than twice the number in Japan, and about 85 percent of the EU number3.
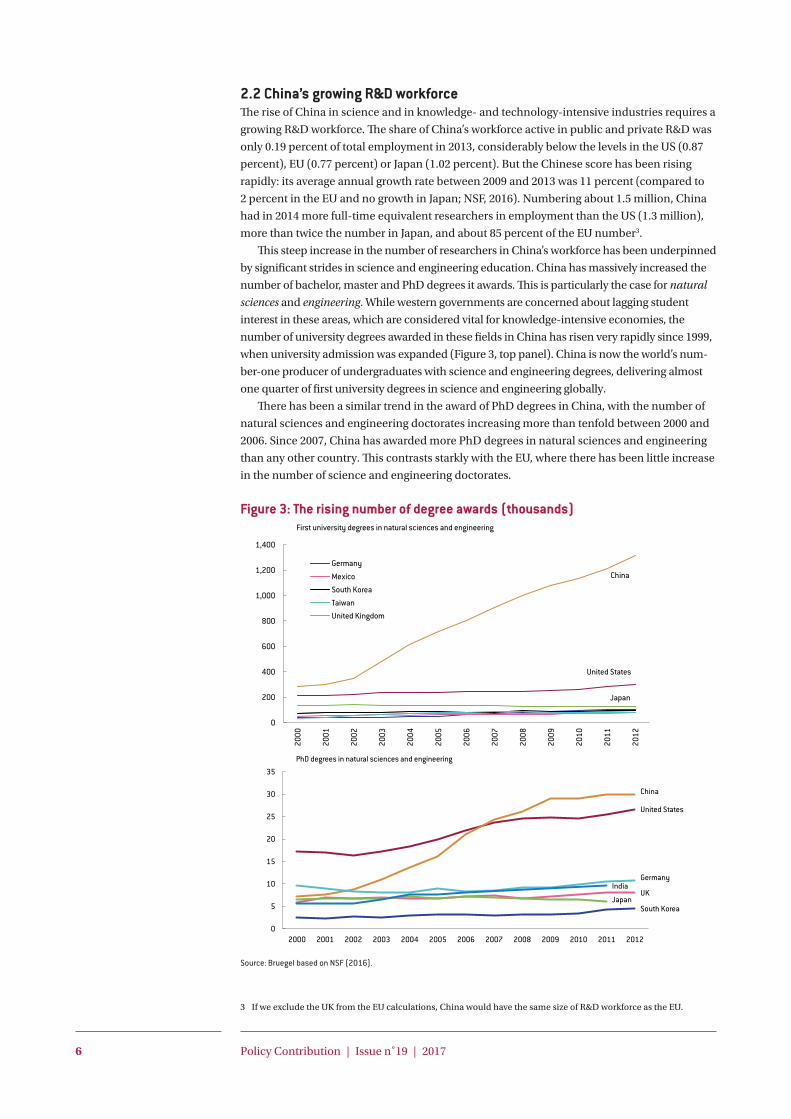
This steep increase in the number of researchers in China’s workforce has been underpinned
by significant strides in science and engineering education. China has massively increased the
number of bachelor, master and PhD degrees it awards. This is particularly the case for natural
sciences and engineering. While western governments are concerned about lagging student
interest in these areas, which are considered vital for knowledge-intensive economies, the
number of university degrees awarded in these fields in China has risen very rapidly since 1999,
when university admission was expanded (Figure 3, top panel). China is now the world’s num-
ber-one producer of undergraduates with science and engineering degrees, delivering almost
one quarter of first university degrees in science and engineering globally.
There has been a similar trend in the award of PhD degrees in China, with the number of
natural sciences and engineering doctorates increasing more than tenfold between 2000 and
2006. Since 2007, China has awarded more PhD degrees in natural sciences and engineering
than any other country. This contrasts starkly with the EU, where there has been little increase
in the number of science and engineering doctorates.
Figure 3: The rising number of degree awards (thousands)
Source: Bruegel based on NSF (2016).
3 If we exclude the UK from the EU calculations, China would have the same size of R&D workforce as the EU.
0
200
400
600
800
1,000
1,200
1,400
2000
2001
2002
2003
2004
2005
2006
2007
2008
2009
2010
2011
2012
United States
ChinaGermany
United Kingdom
Japan
Mexico
South Korea
Taiwan
First university degrees in natural sciences and engineering
0
5
10
15
20
25
30
35
2000 2001 2002 2003 2004 2005 2006 2007 2008 2009 2010 2011 2012
United States
China
Germany
UKJapan
India
South Korea
PhD degrees in natural sciences and engineering

7 Policy Contribution | Issue n˚19 | 2017
The Chinese programme to build-up scientific capacity has been concentrated on a
selected set of institutes. Of China’s 1700 chartered institutes of higher education, 6 percent
absorb 70 percent of scientific research funding and produce about a third of all Chinese
undergraduate students, two-thirds of graduate students and four-fifths of doctoral students.
China’s top universities are Tsinghua University and Beijing University. Both are among the
top 100 universities in the Shanghai Academic Ranking of World Universities4. The US con-
tinues to dominate this ranking. In the 2016 edition, 15 of the first 20 places are taken by US
universities, with Harvard persistently in first place. UK universities take three positions in the
top 20 (Cambridge, Oxford, University College London), while Switzerland and Japan each
have one institution in the top 20. Chinese universities are not yet to be found in the top 50.
Nevertheless, Tsinghua is ranked 58 and Beijing 71.
But the position of Chinese universities in the ranking of the world’s top institutes is
already stronger in the scientific fields that have been targeted to support China’s economic
build-up in selected high-tech sectors: in engineering, Tsinghua is in fourth position (with
Massachusetts Institute of Technology in first); in sciences Beijing is in twenty-second position
(with University of California, Berkeley in first); in computer sciences Tsinghua is in twenty-
fifth place (with Stanford first); and in mathematics, China has four slots in the top 50.
3 A multipolar science world: the impact on science in the west
In this section we look at the impact of China’s scientific rise on science on the west: will a
shift of scientific power to China dry up the flows of scientific talent from east to west, crip-
pling the western science machine? And are the rising Chinese scientific centres new partners
for scientific collaboration with the west?
3.1 Shifting patterns in the international mobility of students & scholarsIncreasing Chinese scientific power has provoked concern in the west that the flow of Chinese
talent will slow. US universities import much of their scientific talent from abroad, particu-
larly from Asia, and particularly from China. There are therefore particular worries in the US
about being able to continue to attract the best of the world’s brains to power the US science
machine. This concern, however, is so far not justified by the data, as this section will show.
More internationally mobile students (both undergraduates and graduates) go to the
United States than to any other country. Although the numbers of international students
going to the US continue to increase, the US share declined from 25 percent in 2000 to 19 per-
cent in 2013 (OECD, 2015a). Still, the number of international undergraduates enrolled in the
US in 2013-14 was 42 percent above the number in 2001-02. China accounts for 30 percent of
foreign students in the US and the numbers keep on rising: about 45 percent of the growth in
US international undergraduate enrolment between 2013 and 2014 was accounted for by the
increase in the number of students from China (18 percent compared to the previous year;
NSF, 2016).
Among PhD students, the Chinese represent by far the largest group of foreign PhD recipi-
ents in the US, taking 29 percent of all PhDs awarded to foreign students in 2013, representing
4 ARWU (Academic Ranking of World Universities) ranks world universities according to six indicators, including
the number of alumni and staff winning Nobel Prizes and Fields Medals, number of highly cited researchers
selected by Thomson Reuters, number of articles published in the journals Nature and Science, number of
articles indexed in the ‘Science Citation Index – Expanded and Social Sciences Citation Index’, and per capita
performance.
8 Policy Contribution | Issue n˚19 | 2017
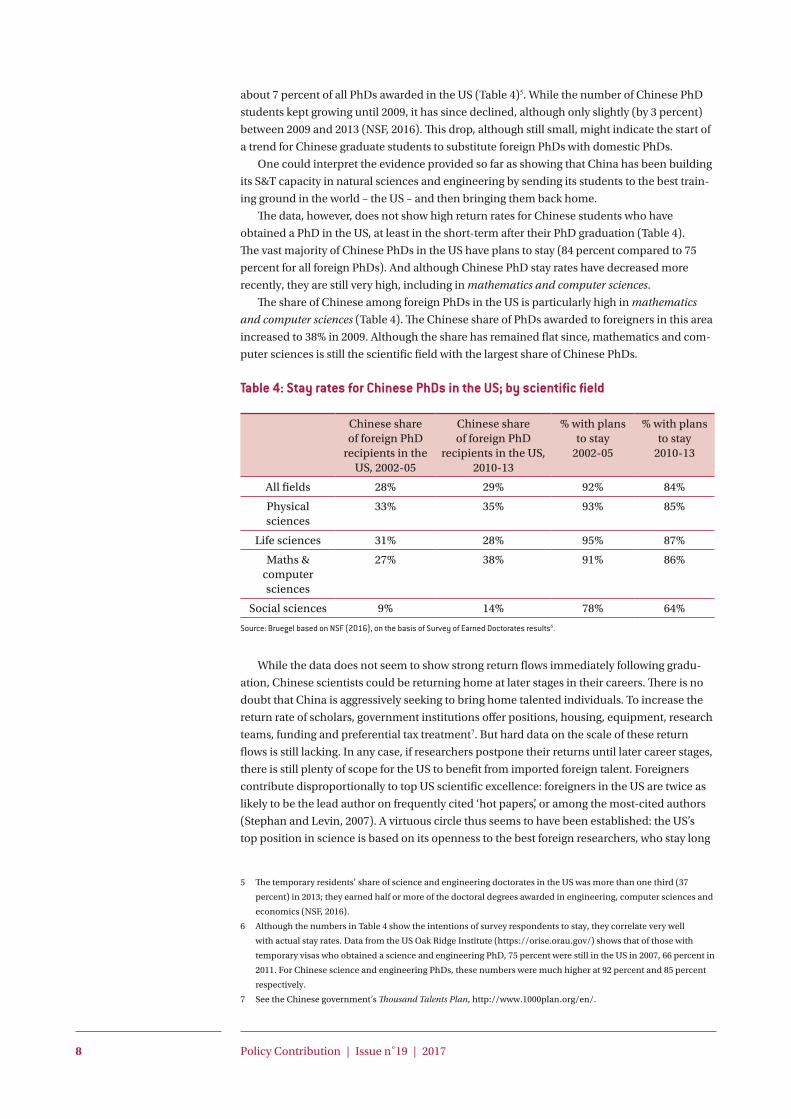
about 7 percent of all PhDs awarded in the US (Table 4)5. While the number of Chinese PhD
students kept growing until 2009, it has since declined, although only slightly (by 3 percent)
between 2009 and 2013 (NSF, 2016). This drop, although still small, might indicate the start of
a trend for Chinese graduate students to substitute foreign PhDs with domestic PhDs.
One could interpret the evidence provided so far as showing that China has been building
its S&T capacity in natural sciences and engineering by sending its students to the best train-
ing ground in the world – the US – and then bringing them back home.
The data, however, does not show high return rates for Chinese students who have
obtained a PhD in the US, at least in the short-term after their PhD graduation (Table 4).
The vast majority of Chinese PhDs in the US have plans to stay (84 percent compared to 75
percent for all foreign PhDs). And although Chinese PhD stay rates have decreased more
recently, they are still very high, including in mathematics and computer sciences.
The share of Chinese among foreign PhDs in the US is particularly high in mathematics
and computer sciences (Table 4). The Chinese share of PhDs awarded to foreigners in this area
increased to 38% in 2009. Although the share has remained flat since, mathematics and com-
puter sciences is still the scientific field with the largest share of Chinese PhDs.
Table 4: Stay rates for Chinese PhDs in the US; by scientific field
Chinese share of foreign PhD
recipients in the US, 2002-05
Chinese share of foreign PhD
recipients in the US, 2010-13
% with plans to stay
2002-05
% with plans to stay
2010-13
All fields 28% 29% 92% 84%
Physical sciences
33% 35% 93% 85%
Life sciences 31% 28% 95% 87%
Maths & computer sciences
27% 38% 91% 86%
Social sciences 9% 14% 78% 64%
Source: Bruegel based on NSF (2016), on the basis of Survey of Earned Doctorates results6.
While the data does not seem to show strong return flows immediately following gradu-
ation, Chinese scientists could be returning home at later stages in their careers. There is no
doubt that China is aggressively seeking to bring home talented individuals. To increase the
return rate of scholars, government institutions offer positions, housing, equipment, research
teams, funding and preferential tax treatment7. But hard data on the scale of these return
flows is still lacking. In any case, if researchers postpone their returns until later career stages,
there is still plenty of scope for the US to benefit from imported foreign talent. Foreigners
contribute disproportionally to top US scientific excellence: foreigners in the US are twice as
likely to be the lead author on frequently cited ‘hot papers’, or among the most-cited authors
(Stephan and Levin, 2007). A virtuous circle thus seems to have been established: the US’s
top position in science is based on its openness to the best foreign researchers, who stay long
5 The temporary residents’ share of science and engineering doctorates in the US was more than one third (37
percent) in 2013; they earned half or more of the doctoral degrees awarded in engineering, computer sciences and
economics (NSF, 2016).
6 Although the numbers in Table 4 show the intentions of survey respondents to stay, they correlate very well
with actual stay rates. Data from the US Oak Ridge Institute (https://orise.orau.gov/) shows that of those with
temporary visas who obtained a science and engineering PhD, 75 percent were still in the US in 2007, 66 percent in
2011. For Chinese science and engineering PhDs, these numbers were much higher at 92 percent and 85 percent
respectively.
7 See the Chinese government’s Thousand Talents Plan, http://www.1000plan.org/en/.
9 Policy Contribution | Issue n˚19 | 2017
enough to contribute to the build-up of quality science, maintaining the US in its top position,
which ensures it can keep on attracting the best foreign talent (Veugelers, 2017).
The presence of foreign PhD students in the EU, including Chinese students, is less sys-
tematically recorded. In general, the imperfect evidence shows that the PhD student popula-
tions of EU countries have fewer foreigners compared to the US, and the geographic sources
of foreign PhD students are different, with geographical, cultural and political links being
more important relative to the US, and a less strong Asian presence compared to the US (see
for example Moguerou, 2006).
The EU introduced in 2007 a new programme to support the research ideas of individual
scientists, who are selected by peer review on the basis of scientific excellence: the European
Research Council (ERC) grants. So far about 7,000 grants have been granted. In addition to
supporting EU scientists, the intent was to use the ERC grants to attract leading scientists from
outside the EU. So far, only about 8 percent of ERC grants have been allocated to scientists
from non-EU countries. Of these, the greatest amount went to US scientists (40 percent), and
only 4 percent to Chinese nationals. Nevertheless, ERC grants attracted researchers to Europe
(most of them PhD or post-doctoral students), not as established principal investigators, but
rather as team members on ERC projects: about 17 percent of ERC team members come from
a non-ERA country (ERA includes the EU countries and Switzerland, Israel and Norway),
amounting to more than 9000 scientists so far. Of these non-ERA team members, the country
of origin for the largest proportion is China, with 18 percent, closely followed by the US with
16 percent. The ERC case thus shows that Chinese graduates can be attracted to the EU, at
least to scientific excellence hubs.
3.2 International collaboration in scienceInternational collaboration allows scientists from different countries to partner with leading
experts elsewhere. Scientists engaged in international collaboration tend to produce higher
quality research (OECD, 2015b; European Commission, 2016). In the context of its increasing
scientific heft, is China becoming a more important partner for the west for scientific cooper-
ation?
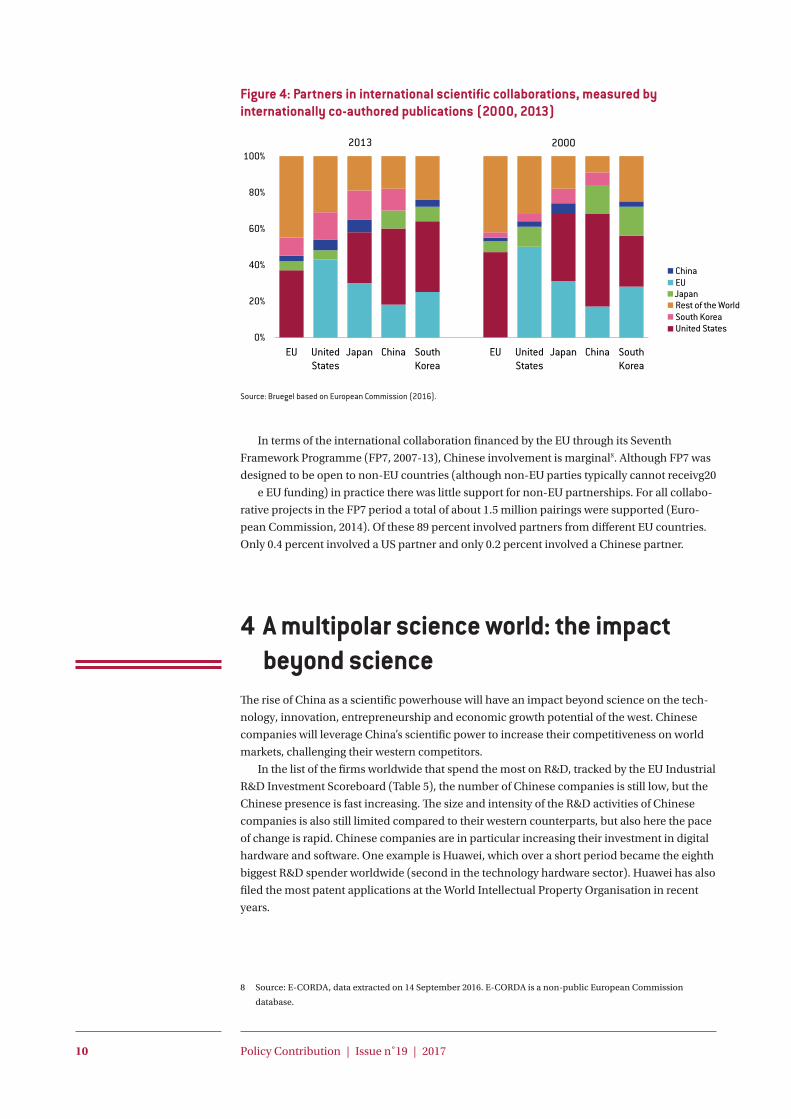
Of the world’s leading science economies, the EU is most inclined to collaborate inter-
nationally. But for the EU, international collaboration is first and foremost intra-European
collaboration. In most EU countries, at least 70 percent of papers that are internationally
co-authored involve researchers from other EU countries (with the UK having the lowest
share of intra-EU international collaboration, at ‘only’ 56 percent). China is the least inclined
to collaborate internationally. However in all countries/regions, the share of international
scientific collaboration has been increasing since 2000 (see European Commission, 2016).
The data on who collaborates with whom does not show major shifts in collaboration
patterns (Figure 4). Collaboration patterns are linked to student and researcher mobility
patterns and tend to change only gradually over time. China, although on the rise as a partner
for international scientific collaboration, is still relatively under-represented as a scientific
collaboration partner despite its growing scientific weight. The US has seen the greatest
increase in collaboration with China, while the increase has been more modest for the EU.
Reciprocally, the US was and is China’s major partner for scientific collaboration. The intense
flow of scientists between the US and China undoubtedly contributes to stronger US-China
collaborative networks. European countries are less in the Chinese focus for cooperation. The
EU’s collaboration with China, although on the rise, has not tracked the growth of China’s
scientific power.
10 Policy Contribution | Issue n˚19 | 2017
Figure 4: Partners in international scientific collaborations, measured by internationally co-authored publications (2000, 2013)
0%
20%
40%
60%
80%
100%
EU UnitedStates
Japan China SouthKorea
EU UnitedStates
Japan China SouthKorea
2013 2000
EU
United States
Japan
China
South KoreaRest of the World
Source: Bruegel based on European Commission (2016).
In terms of the international collaboration financed by the EU through its Seventh
Framework Programme (FP7, 2007-13), Chinese involvement is marginal8. Although FP7 was
designed to be open to non-EU countries (although non-EU parties typically cannot receivg20
e EU funding) in practice there was little support for non-EU partnerships. For all collabo-
rative projects in the FP7 period a total of about 1.5 million pairings were supported (Euro-
pean Commission, 2014). Of these 89 percent involved partners from different EU countries.
Only 0.4 percent involved a US partner and only 0.2 percent involved a Chinese partner.
4 A multipolar science world: the impact beyond science
The rise of China as a scientific powerhouse will have an impact beyond science on the tech-
nology, innovation, entrepreneurship and economic growth potential of the west. Chinese
companies will leverage China’s scientific power to increase their competitiveness on world
markets, challenging their western competitors.
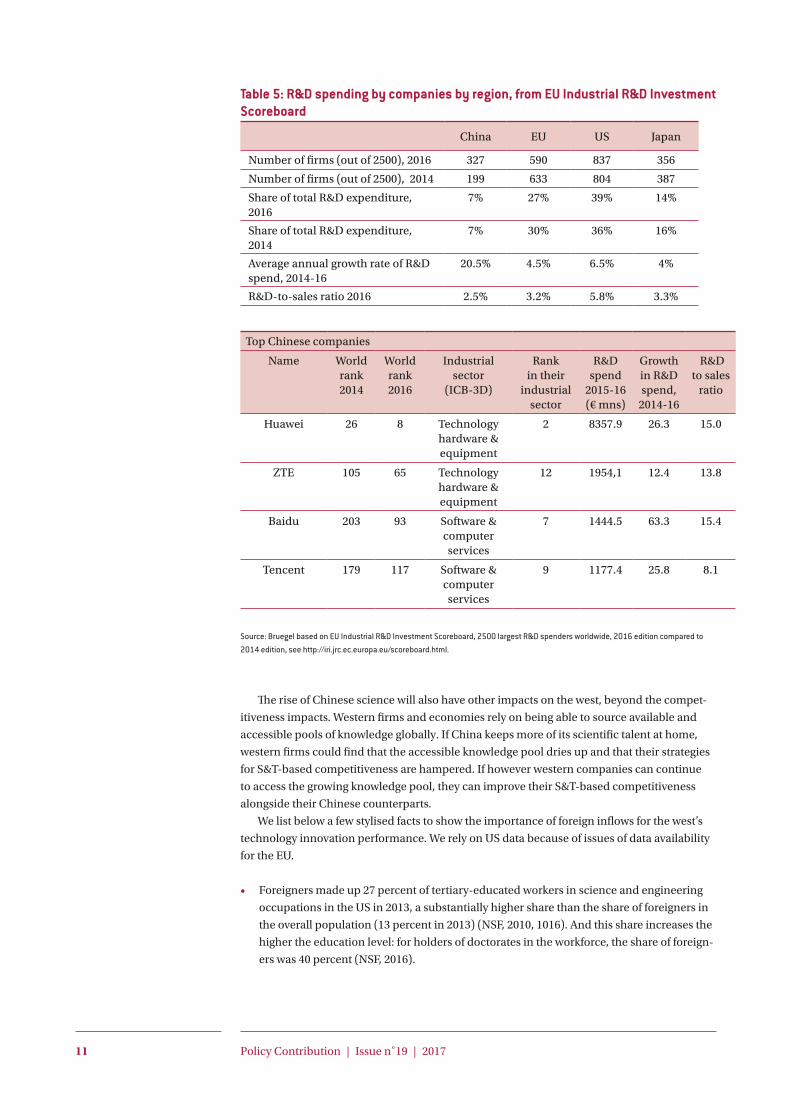
In the list of the firms worldwide that spend the most on R&D, tracked by the EU Industrial
R&D Investment Scoreboard (Table 5), the number of Chinese companies is still low, but the
Chinese presence is fast increasing. The size and intensity of the R&D activities of Chinese
companies is also still limited compared to their western counterparts, but also here the pace
of change is rapid. Chinese companies are in particular increasing their investment in digital
hardware and software. One example is Huawei, which over a short period became the eighth
biggest R&D spender worldwide (second in the technology hardware sector). Huawei has also
filed the most patent applications at the World Intellectual Property Organisation in recent
years.
8 Source: E-CORDA, data extracted on 14 September 2016. E-CORDA is a non-public European Commission
database.
11 Policy Contribution | Issue n˚19 | 2017
Table 5: R&D spending by companies by region, from EU Industrial R&D Investment Scoreboard
China EU US Japan
Number of firms (out of 2500), 2016 327 590 837 356
Number of firms (out of 2500), 2014 199 633 804 387
Share of total R&D expenditure, 2016
7% 27% 39% 14%
Share of total R&D expenditure, 2014
7% 30% 36% 16%
Average annual growth rate of R&D spend, 2014-16
20.5% 4.5% 6.5% 4%
R&D-to-sales ratio 2016 2.5% 3.2% 5.8% 3.3%
Top Chinese companies
Name World rank 2014
World rank 2016
Industrial sector
(ICB-3D)
Rank in their
industrial sector
R&D spend
2015-16 (€ mns)
Growth in R&D spend,
2014-16
R&D to sales
ratio
Huawei 26 8 Technology hardware & equipment
2 8357.9 26.3 15.0
ZTE 105 65 Technology hardware & equipment
12 1954,1 12.4 13.8
Baidu 203 93 Software & computer services
7 1444.5 63.3 15.4
Tencent 179 117 Software & computer services
9 1177.4 25.8 8.1
Source: Bruegel based on EU Industrial R&D Investment Scoreboard, 2500 largest R&D spenders worldwide, 2016 edition compared to 2014 edition, see http://iri.jrc.ec.europa.eu/scoreboard.html.
The rise of Chinese science will also have other impacts on the west, beyond the compet-
itiveness impacts. Western firms and economies rely on being able to source available and
accessible pools of knowledge globally. If China keeps more of its scientific talent at home,
western firms could find that the accessible knowledge pool dries up and that their strategies
for S&T-based competitiveness are hampered. If however western companies can continue
to access the growing knowledge pool, they can improve their S&T-based competitiveness
alongside their Chinese counterparts.
We list below a few stylised facts to show the importance of foreign inflows for the west’s
technology innovation performance. We rely on US data because of issues of data availability
for the EU.
• Foreigners made up 27 percent of tertiary-educated workers in science and engineering
occupations in the US in 2013, a substantially higher share than the share of foreigners in
the overall population (13 percent in 2013) (NSF, 2010, 1016). And this share increases the
higher the education level: for holders of doctorates in the workforce, the share of foreign-
ers was 40 percent (NSF, 2016).

12 Policy Contribution | Issue n˚19 | 2017
• In 2013, 57 percent of foreign-born individuals in the US workforce with a science and
engineering degree were from Asia. While the leading country of origin was India (20
percent), China was in second place with 8 percent, which is somewhat lower than in 2003
when it was 11 percent.
• Source countries for the 402,000 foreign-born holders of science and engineering doctor-
ates were somewhat more concentrated, with China providing a higher proportion (22
percent) than India (14 percent).
• One quarter of engineering and technology companies founded in the US between 1995
and 2005 had a least one key founder who was foreign-born. Over half of Silicon Valley
start-ups had one or more immigrants as key founders (Wadhwa et al, 2007). Of all im-
migrant-founded companies, 26 percent have Indian founders, with Chinese (including
Taiwanese) founders coming second (about 13 percent). In computers and communica-
tions, Chinese (including Taiwanese) immigrant start-ups in the US make up more than
one third of foreign start-ups. Chinese (mainland- and Taiwan-born) entrepreneurs are
heavily concentrated in California, with 49 percent of US companies with founders from
mainland China located there.
• Foreigners are also increasingly responsible for US patents. One quarter of US patent ap-
plications filed at the World Intellectual Property Organisation in 2006 were authored by a
non-US national, up from seven percent in 1998. The largest group of immigrant non-citi-
zen inventors was Chinese (mainland and Taiwan-born) (Wadhwa et al, 2007).
The data shows the importance for the west’s S&T system of being able to tap into global
talent pools, and the importance of China within the global talent pool.
The rise of China as a scientific powerhouse and as a producer of science and engineering
graduates also has implications for the west’s portfolio of partners for technology and innova-
tion collaboration. As for scientific collaboration, we can look at whether China’s increasing
S&T heft is making it a more important partner for western companies for RTI (research,
technology, innovation) collaboration.
Table 6 shows that US, EU and Chinese patents are substantially more likely to be
co-invented with international partners than those of Japan and South Korea9. However while
the share of internationally co-authored patents has been increasing for the US and the EU,
it has been declining in Asia generally, including in China. The rising number of Chinese
patents increasingly relies on domestic inventors, though China remains more open to
international collaboration than Japan or South Korea.
Table 6: Share of total patent applications involving foreign co-inventors 2000-122000 2012
US 10% 12%
EU 10% 11%
Japan 5% 2%
South Korea 4% 3%
China 9% 8%
Source: Bruegel based on European Commission (2016).
9 Although patents with internationally located co-inventors may only be the tip of the iceberg of all international
research and innovation collaborations, it is a convenient traceable source for spotting trends.
13 Policy Contribution | Issue n˚19 | 2017
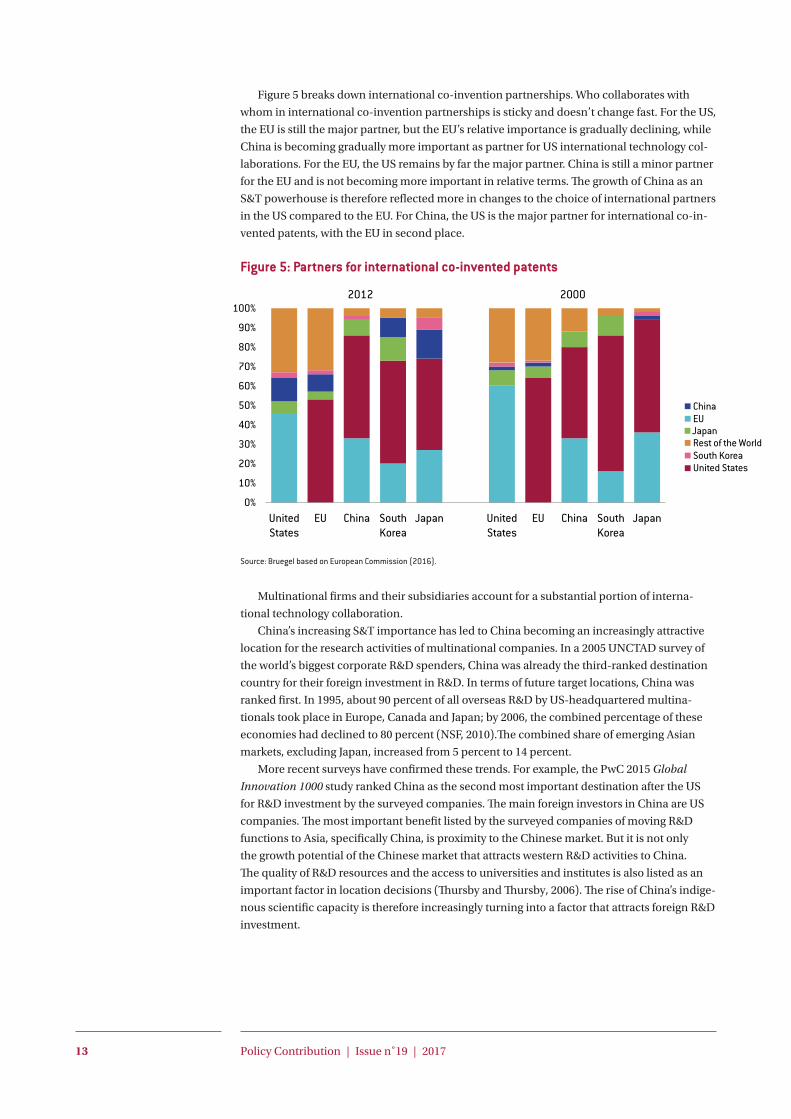
Figure 5 breaks down international co-invention partnerships. Who collaborates with
whom in international co-invention partnerships is sticky and doesn’t change fast. For the US,
the EU is still the major partner, but the EU’s relative importance is gradually declining, while
China is becoming gradually more important as partner for US international technology col-
laborations. For the EU, the US remains by far the major partner. China is still a minor partner
for the EU and is not becoming more important in relative terms. The growth of China as an
S&T powerhouse is therefore reflected more in changes to the choice of international partners
in the US compared to the EU. For China, the US is the major partner for international co-in-
vented patents, with the EU in second place.
Figure 5: Partners for international co-invented patents
Source: Bruegel based on European Commission (2016).
Multinational firms and their subsidiaries account for a substantial portion of interna-
tional technology collaboration.
China’s increasing S&T importance has led to China becoming an increasingly attractive
location for the research activities of multinational companies. In a 2005 UNCTAD survey of
the world’s biggest corporate R&D spenders, China was already the third-ranked destination
country for their foreign investment in R&D. In terms of future target locations, China was
ranked first. In 1995, about 90 percent of all overseas R&D by US-headquartered multina-
tionals took place in Europe, Canada and Japan; by 2006, the combined percentage of these
economies had declined to 80 percent (NSF, 2010).The combined share of emerging Asian
markets, excluding Japan, increased from 5 percent to 14 percent.
More recent surveys have confirmed these trends. For example, the PwC 2015 Global
Innovation 1000 study ranked China as the second most important destination after the US
for R&D investment by the surveyed companies. The main foreign investors in China are US
companies. The most important benefit listed by the surveyed companies of moving R&D
functions to Asia, specifically China, is proximity to the Chinese market. But it is not only
the growth potential of the Chinese market that attracts western R&D activities to China.
The quality of R&D resources and the access to universities and institutes is also listed as an
important factor in location decisions (Thursby and Thursby, 2006). The rise of China’s indige-
nous scientific capacity is therefore increasingly turning into a factor that attracts foreign R&D
investment.
EU
United States
Japan
China
South KoreaRest of the World
0%
10%
20%
30%
40%
50%
60%
70%
80%
90%
100%
UnitedStates
EU China SouthKorea
Japan UnitedStates
EU China SouthKorea
Japan
2012 2000

14 Policy Contribution | Issue n˚19 | 2017
5 The implications for the EU of a multipolar science world
China has firmly built investment in higher education and science into its economic devel-
opment policies, as it vies to build global competitiveness in knowledge-intensive sectors. It
has consequently risen rapidly as a scientific power, and its rise has created a more multipolar
global scientific landscape.
There will be many benefits from a more multipolar science world, but some will benefit
more than others. The open US science system has traditionally benefitted from foreign brains.
The US’s dominant position in science is based on its openness to the brightest talents of all
nationalities. Its top position in science continues to make the US attractive for the best talents,
who in turn contribute disproportionally to US scientific, technological and economic success.
Foreign talent is vital for the US’s science and engineering capacity, which is why the US
fears its S&T machine will become less powerful if the pool of mobile foreign talent dries up.
There is no clear evidence so far to justify this fear. For the moment, China’s increasing capac-
ity to produce science and engineering graduates does not seem to have disconnected the US
from the pool of potential Chinese candidates to recruit from.
With the continued high attractiveness of the US as destination for foreign talents and high
stay rates, this open model, at least for the moment, continues to bear fruit for the US. The
most important source country for the US – China – is rapidly developing its own scientific
capability and wants to bring its foreign-based scholars back home, but scientists tend to
return in the later stages of their careers, leaving a long enough period during which the US
can still benefit from the imported talents and during which networks can be built, which
persist when the Chinese talents return home.
China’s growth model for science, although aspiring to be indigenous, still involves send-
ing out its increasingly better locally-trained scholars to the best institutes in the world, and
reaping the benefits when they return, in the later stages of their careers after they have fully
developed their capabilities and built their networks. This has created a China-US connection
that is virtuous, mutually beneficially for both science systems and so far robust.
The EU is largely holding its own in scientific terms, based on the intensifying process of
EU integration, which stimulates collaboration among scientists from EU member states.
However, the process of EU integration is bumpy, and with the United Kingdom leaving the
union, faces a major challenge. Furthermore, the EU does not have the same deep openness
as the US to scientific talent from outside, particularly from China. The EU therefore misses
out on the large inflows of students and researchers from China and the longer-term networks
that are built out of these flows.
The globalisation of science has the potential to bring unprecedented scientific and
economic benefits to the world, addressing global health, environment and security chal-
lenges. But it will also undeniably provoke concerns about increased competition, and raises
a number of questions for the EU: how to leverage China’s science and innovation potential to
generate worldwide benefits? How to engage with China? What position to take when unfair
policies are deployed that would prevent the sharing of benefits?
When Freeman (2005) asked a top Harvard physicist, who had published important work
in cooperation with overseas scientists and engineers, “So, you are helping them catch up with
us?” the scientist replied, “No, they are helping us keep ahead of them”. Can Europe master this
game of engagement? For the EU, with a much less-developed scientific connection to China
than the US, the engagement game will require steps to be taken if the EU is not to lose out.
The EU must show a stronger commitment to participation in the globalisation of science,
and to ensuring subsequently that European economies benefit from it.
An integrated European area for science and technology, characterised by scientific and
technology excellence, is a necessary condition for this. Excellence will ensure that European
research institutes will be more attractive hubs for the best student talents from abroad and

15 Policy Contribution | Issue n˚19 | 2017
that they will become preferred partners for international S&T cooperation and networks with
the best researchers abroad. Excellence will also ensure that European research institutes and
firms will be better able to learn and absorb the new knowledge generated abroad into their
own research activities to produce frontier research.
European S&T policymakers should promote scientific collaboration not only within the
EU but also with non-EU countries, and should remove barriers that prevent such collabo-
ration. The EU should do more to attract the best foreign talent, wherever it is located in the
world, and should remove barriers that prevent such mobility. EU talent should be encour-
aged to be mobile outside the EU and go to the best universities and institutes, wherever
they are in the world. Connections with these European outflows must be maintained, and
incentives must be provided to encourage scholars to return home at optimal stages in their
careers. Similarly, connections with foreign scholars who return home after their research
stays in the EU should be supported.
None of this requires major new initiatives at the EU level, but rather a stronger commit-
ment to implementation of existing initiatives that are aimed at those parts of the world that
are at the scientific frontier. EU programmes that support extra-EU cooperation and mobil-
ity should be based on excellence in terms of destinations for, and sources of, researchers.
This is most notably the case for the Marie Curie Fellowships and the collaborative research
programmes under the EU’s Horizon 2020 framework initiative. The degree to which frontier
S&T countries, such as the US and China, become destinations for or sources of researchers
in these programmes should be monitored and if there are lags, barriers should be identified
and removed. Bilateral S&T agreements with frontier countries, most notably China and the
US, should be the first priority in the EU’s international S&T relations. In these S&T agree-
ments, the EU should ensure mutual openness of funding programmes for bilateral coopera-
tion, and support for bi-directional mobility programmes.
ReferencesEuropean Commission (2014) Seventh FP7 Monitoring Report Monitoring Report 2013, Directorate-
General for Research and Innovation
European Commission (2016) Science, Research and Innovation Performance of the EU, Directorate-
General for Research and Innovation
Freeman, R. (2005) ‘Does globalisation of the Scientific/Engineering workforce threaten US economic
leadership?’ NBER Working Paper 11457, National Bureau of Economic Research
Moguerou, P. (2006) ‘The brain drain of PhDs from Europe to the US, what we know and what we would
like to know’, EUI WP 2006/11, European University Institute
NSF (2010) Science and Engineering Indicators, National Science Foundation, Arlington VA
NSF (2016) Science and Engineering Indicators, National Science Foundation, Arlington VA
OECD (2015a) Education at a Glance 2015: OECD Indicators, OECD Publishing, Paris
OECD (2015b) OECD Science, Technology and Industry Scoreboard 2015: Innovation for growth and
society, OECD Publishing, Paris
Stephan, P. and S. Levin (2007) ‘Foreign scholars in US science: contributions and costs’ in Stephan, P.
and R. Ehrenberg (eds) Science and the University, The University of Wisconsin Press
Stephan, P.E. (2012) How economics shapes science, Harvard University Press, Cambridge MA
Thursby, J. and M. Thursby (2006) Here or There? A Survey of Factors in Multinational R&D Location –
Report to the Government-University-Industry Research Roundtable, The National Academies Press,
Washington DC
Veugelers, R. (2011) ‘A G2 for science?’ Policy Brief 2011/03, Bruegel
Veugelers, R (2013) ‘The world innovation landscape: Asia rising?’ Policy Contribution 2013/02, Bruegel
Veugelers, R. (2017) ‘Countering European Brain Drain’, Science, 356 (6339): 695-696
Wadhwa, V., A. Saxenian, B.A. Rissing and G. Gereffi (2007) ‘America’s new Immigrant entrepreneurs: Part
I’, Duke Science, Technology & Innovation Paper No. 23, Duke University School of Law