the challenge of integrating offshore wind power in the u ... library/research/wind power... · the...
TRANSCRIPT

PapersubmittedtoRenewableEnergy 2016-03-10
1
ThechallengeofintegratingoffshorewindpowerintheU.S.electricgrid.1
PartII:Simulationofelectricitymarketoperations.2
H.P.Simão1,W.B.Powell1,C.L.Archer2,W.Kempton23
1DepartmentofOperationsResearchandFinancialEngineering,PrincetonUniversity4
2CollegeofEarth,Ocean,andEnvironment,UniversityofDelaware5
Correspondingauthor:CristinaL.Archer,UniversityofDelaware,IntegratedScienceandEngineering6Laboratory(ISELab)#371,221AcademyStreet,Newark,DE19716,USA,[email protected],+1302831766408
Highlights:9
1. Smart-ISO,asimulatorofthePJMplanningprocess,isdeveloped,tested,andevaluated.10
2. Injectinglargeamountsofoffshorewindpower(36GW)inthecurrentelectricitygridisfeasible11withcurrentplanningprocessandcurrentwindforecasterrorssimplyviaadditionalreserves;12
3. Withperfectwindforecasts,atleasttwiceasmuchoffshorewindpowercanbeintegratedwith13lessthanhalfofthereservesthanwiththecurrentwindforecasterrors.14
Abstract15
Thepurposeofthistwo-partstudyistoanalyzelargepenetrationsofoffshorewindpowerintothegrid16ofalargeRegionalTransmissionOrganization(RTO),usingthecaseofthegridoperatedbyPJM17InterconnectioninthenortheasternU.S.PartIofthestudyintroducesthewindforecasterrormodel18andPartII,thispaper,describesSmart-ISO,asimulatorofPJM’splanningprocessforgenerator19scheduling,includingday-aheadandintermediate-termcommitmentstoenergygeneratorsandreal-20timeeconomicdispatch.UsingacarefullycalibratedmodelofthePJMgridandrealisticmodelsof21offshorewind(describedinPartI),itisshownthat,exceptinsummer,anunconstrainedtransmission22gridcanmeettheloadatfivebuild-outlevelsspanning7to70GWofcapacity,withtheadditionofat23most1to8GWofreserves.24
Inthesummer,thecombinationofhighloadandvariablewindsischallenging.Thesimulatedgridcan25handleupthroughbuild-outlevel3(36GWofoffshorewindcapacity),with8GWofreservesand26withoutanygenerationshortage.Forcomparison,whenSmart-ISOisrunwithperfectforecasts,allfive27build-outlevels,upto70GWofwind,canbeintegratedinallseasonswithatmost3GWofreserves.28Thisreinforcestheimportanceofaccuratewindforecasts.Atbuild-outlevel3,energyfromwindwould29satisfybetween11and20%ofthedemandforelectricityandsettlementpricescouldbereducedbyup30to24%,thoughinthesummerpeaktheycouldactuallyincreasebyupto6%.CO2emissionsarereduced31by19-40%,SO2emissionsby21-43%,andNOxemissionsby13-37%.32

PapersubmittedtoRenewableEnergy 2016-03-10
2
Thisstudyfindsthatintegratingupto36GWofoffshorewindisfeasibleinthePJMgridwithtoday’s33generationfleetandplanningpolicies,withtheadditionof8GWofreserves.Abovethat,PJMwould34requireadditionalinvestmentsinfast-rampinggasturbines,storageforsmoothingfast-rampingevents,35and/orotherstrategiessuchasdemandresponse.36
Keywords:unitcommitment,powerflow,economicdispatch,uncertainty,PJM.37
1 Introduction38
PJMInterconnectionisaregionaltransmissionorganization(RTO)thatcoordinatesthemovementof39wholesaleelectricityserving13statesandtheDistrictofColumbia,coveringfromthemid-Atlantic40regionouttoChicago(PJMInterconnection2014).Actingasaneutral,independentparty,PJMoperates41acompetitivewholesaleelectricitymarketandmanagesthehigh-voltageelectricitytransmissiongridto42ensurereliabilityformorethan61millionpeople.Figure1showsthegeographicalareacoveredbyPJM43andthehigh-voltagebackbone(345kVandhigher)ofitstransmissiongrid.44
45
Figure1:PJMhigh-voltagebackbone.46

PapersubmittedtoRenewableEnergy 2016-03-10
3
Attheendof2013,thetotalinstalledcapacitywithinthePJMmarketwasabout183Gigawatts(GW)47andthepeakloadduringtheyearwasover157GW(MonitoringAnalytics2014).Theyearlygeneration48inPJMbypercentageofeachfuelsourcebetween2010and2013isshowninTableI(Monitoring49Analytics2011,2012,2013,2014).50
TableI:PJMactualgenerationbyfuelsource(%)between2010and201351
FuelSource 2010 2011 2012 2013Coal 49.3 47.1 42.1 44.3Nuclear 34.6 34.5 34.6 34.8Gas 11.7 14.0 18.8 16.3Hydroelectric 2.0 1.9 1.6 1.8Wind 1.2 1.4 1.6 1.9Other 1.2 1.1 1.3 0.9
52
ThebasicfunctionsofPJMcomprisegridoperations(supply/demandbalanceandtransmission53monitoring),marketoperations(managingopenmarketsforenergy,capacityandancillaryservices)and54regionalplanning(15-yearlook-ahead)(PJMInterconnection2014).Theinterestinthispaperisto55analyzetheabilityoftheenergymarketandthetransmissiongridwithinthePJMareatointegratenon-56dispatchablegenerationinquantitiesmuchlargerthanthecurrentlevels.AsindicatedinTableI,in201357windpowercorrespondedtolessthan2%ofthetotalgeneration.TheMid-Atlanticoffshorewindpower58productionproposedandmodeledinPartIofthistwo-partpaper(Archeretal.2016)wouldbringthat59fractiontoasmuchas28%atcertaintimesoftheyear,thusraisingthequestionofhowtomanagethe60generationscheduleandthetransmissiongridcapacityundersuchascenario.61
Inordertoanswerthisquestion,thispaperintroducesSMART-ISO,asimulatorofthemarketoperations62ofPJM,includingthetransmissiongrid.DevelopedatPENSALabatPrincetonUniversity,SMART-ISOisa63detailedmodelofthePJMplanningprocessdesignedspecificallytomodelthevariabilityand64uncertaintyfromhighpenetrationsofrenewables.Itcapturesthetimingofinformationanddecisions,65steppingforwardin5-minuteincrementstocapturetheeffectoframpingconstraintsduringrapid66changesinwindenergy.67
ThehigherlevelsofwindpowerpenetrationinthePJMmarketanalyzedinthisstudyarenotlikelyto68becomerealityforatleastanothertwodecades.Thispapertriestoanswerquestionsabouthowto69managethesysteminthosefuturescenariosbyusingthecurrentstructureofthemarket,namely,the70currentpowersupplysources,transmissiongridandoperatingpolicies.Thoughitisexpectedthatthe71marketstructuremaychangesignificantlyinthattimeframe(e.g.,lesscoal-basedgeneration,more72distributedgeneration,reliefintransmissionconstraints,andimprovedforecastingperformance),73anticipatingthesechangesisbeyondthescopeofthispaper.Theresultsobtainedinthisstudyare74usefulinthattheyrevealsomeofthelimitingfactorsinthecurrentmarketandpointtothedirectionto75followinordertoovercometheselimitations.76
PapersubmittedtoRenewableEnergy 2016-03-10
4
2 TheSMART-ISOmodel77
SMART-ISOisasimulatorofthemarketoperationsofPJMthataimstostrikeabalancebetween78detailedrepresentationofthesystemandcomputationalperformance.Itcomprisesthreeoptimization79modelsembeddedwithinasimulationmodelthatcapturesthenesteddecision-makingprocess:80
1. Day-aheadunitcommitment(DA-UC)model.812. Intermediate-termunitcommitment(IT-UC)model.823. Real-timeeconomicdispatch.83
Accuratemodelingofthenestingofthesethreemodelsisacentral(andpowerful)toolusedbyRTOsto84adapttouncertainty.InSMART-ISOallthreeoptimizationmodelsincludeaDCapproximationofthe85powerflow.Inaddition,anACpowerflowmodelisrunafterboththeintermediate-termUCandthe86real-timeeconomicdispatchmodelsinordertoverifytheelectricalstabilityofthegrid.87
Thesimulatortakesasinputs:88
1. ThelistofgeneratorsavailableforschedulinginthePJMarea(includingallrelevantoperational89andeconomicparameters).90
2. Thetransmissiongrid(busesandlines),includingrelevanttransmissionparameters.913. Historical(and/orsimulated)timeseriesofloads(bothactiveandreactive)atthebuslevelover92
thesimulationhorizon.934. Rollingtimeseriesforecastsofnon-dispatchablegeneration(e.g.wind)overthesamehorizon.945. Historical(and/orsimulated)timeseriesofnon-dispatchablegeneration.95
Theforecastedtimeseriesareusedintheschedulingmodels(day-aheadandintermediate-termUC’s),96whereasthehistoricalorsimulatedtimeseriesareusedintheeconomicdispatchmodel.97
Thelistofgeneratorsavailableinthesimulatorincluded830units,whichcomprised97.8%ofthe98installedcapacityin2010.Thesegeneratorswerepartitionedintofourcategories:(1)must-run,which99includeallnuclear-fueledgeneratorsandthose(predominantlycoal-fueled)withnotificationpluswarm-100uptimesabove32hours;(2)slow,whichincludeallgeneratorswithnotificationpluswarm-uptimes101between2and32hours;(3)fast,whichincludethosewithnotificationpluswarm-uptimesbelow2102hours;and(4)other,whichincludehydro,pumpedstorage,andwind.Thegeneratorsinthecategories103must-runandotherareassumedtobealwayson.Thereforeonlytheslowandfastgeneratorsare104scheduledintheunitcommitmentmodels.105
PJM’stransmissiongridcomprisedover9,000busesand11,500branchesin2010.Thoughfeasible,106runningtheunitcommitmentandeconomicdispatchmodelswithafull-sizeintegratedgridhas107significantcomputationalcosts.Tostrikeabalancebetweengridrepresentationandcomputational108complexity,multipleaggregateversionsofthegridwerecreated,includingonlythebusesatorabovea109givenvoltage.SMART-ISOcanrunthedifferentmodelsatdifferentlevelsofaggregation,butitis110recommendedrunningtheunitcommitmentmodelsathigheraggregationlevel(s)thantheeconomic111dispatchmodel.TableIIdisplaysthelevelsofgridaggregationavailableinSMART-ISO,withtheir112respectivedimensionsintermsofthetotalnumberofbusesandbranches.Intherunsperformedinthis113

PapersubmittedtoRenewableEnergy 2016-03-10
5
study,the315-kVgridwasusedforunitcommitment(bothday-aheadandintermediate-term),andthe114220-kVgridforeconomicdispatch.115
TableII:GridaggregationlevelsavailableinSMART-ISO.Column“0”includesallbusesandall116branches.117
MinimumVoltage(kV) 0 69 72 118 220 315 500#ofBuses 9,154 5,881 4,829 3,950 1,360 354 131#ofBranches 11,840 7,750 6,260 5,210 1,715 454 159
SpecialcarewastakenwithinSMART-ISOtocloselymatchPJM’sleadtimesbetweenwhenadecisionis118made(e.g.whenaunitcommitmentmodelruns)andwhenitisimplemented.Notsurprisingly,lead119timeshighlighttheimportanceofthequalityoftheforecasts,especiallyfortheintermediate-termunit120commitmentmodelwhereevenhour-aheadprojectionscanbequitepoor.Asthisarticlewillshow,121short-termforecastingerrorsprovedtobethemajorfactorlimitingtheabsorptionofhighpenetrations122ofoffshorewind.123
TypicallySMART-ISOrunsforasimulationhorizonof8days,wherethefirstdayisdiscardedtoavoidany124initializationbias.Eachofthethreeoptimizationmodelsisrunsequentiallyovertheentiresimulation125horizon,withtheirdifferentplanninghorizonsandtimescalesnestedandsynchronized.Thesimulation126isrepeatedforasmanysamplepathsoftherandomrealizationsasdesired.Inthenextsubsections127somedetailsofeachoneoftheoptimizationmodelsandthepowerflowmodelsarebrieflydescribed,128aswellasthemainpolicytodealwithuncertaintyinunitcommitment.129
2.1 Day-aheadunitcommitmentmodel130
Theday-aheadUCmodelinSMART-ISOrunsonceevery24hours,atnoon,similarlytohowitactually131runsinPJM.Itsplanninghorizonspans40hoursinhourlytimesteps,startingfromnoononagivenday132until4amontheseconddayfollowing.Historicalloadsandlong-term(day-ahead)forecastsofnon-133dispatchablegenerationareusedinthismodel.Theplanninghorizonisfunctionallysub-dividedinto134fourblocksoftime,asdepictedinFigure2.135
136
Figure2:Planninghorizonofday-aheadUCmodel.137
BlocksAandBcorrespondtotheinitialperiodoftimewhennogeneratorsareturnedonoroffbecause138thosedecisionswouldhavebeenmadeinpreviousunitcommitments,eithertheday-aheadorthe139intermediate-term.DuringthoseblocksoftimetheUCmodelactsjustasaneconomicdispatchmodel;140thatis,itvariestheamountofenergyproducedbyeach(turned-on)dispatchablegenerator,inorderto141

PapersubmittedtoRenewableEnergy 2016-03-10
6
followtheforecastedloadandadjustforthenon-dispatchablegeneration(alsoforecasted).However,in142blockBgeneratorsmaybenotifiedthattheywillhavetogoonoroffstartingfromthebeginningof143blockC.InblocksCandDanysloworfastgeneratorcanbescheduledorunscheduled,butonlythe144notificationandon/offdecisionsinvolvingslowgeneratorsduringperiodsBandCwillbemadeeffective145(thatis,lockedin),whereasdecisionsinvolvingfastgeneratorsarefinalizedintheintermediate-term146model,describednext.BlockDisaddedtothetimehorizontominimizeend-of-horizoneffectsonthe147decisionsmadeattheendofblockC.148
2.2 Intermediate-termunitcommitmentmodel149
Theintermediate-termUCmodelinSMART-ISOrunstwiceeveryhour,at15minutesafterandbefore150thehour.Therearenoon/offdecisionsmadeforslowgeneratorsinthismodel(theywereallmadein151theappropriateday-aheadmodel);onlyfastgeneratorswillbeturnedonoroff.Short-termforecastsof152non-dispatchablegeneration(usuallydonethroughpersistence)areusedinthismodel.Itsplanning153horizoncomprises2hoursand15minutes,intimestepsof15minutes,andisillustratedinFigure3.154
155
Figure3:Planninghorizonoftheintermediate-termUCmodel.156
DuringblockAnogeneratorscanbeturnedonoroff;theyonlyfollowtheloadandadjusttonon-157dispatchablegeneration(givenbyshort-termforecasts).Fastgeneratorscanbescheduledor158unscheduledinblocksCandD,thoughonlythedecisionsmadeinblockCwillbelockedin.Our159implementationoftheintermediate-termschedulingprocessrepresentsanapproximationofPJM’sown160process(calledIT-SCED),whichinvolvesrunningtheprocessin15-minutecycles,withupdatesevery5161minutesincasethedatachange.Thereisavariablelead-time(30to40minutes)betweenwhenPJM162runsIT-SCEDandthetimeoffirstpotentialdispatchofagenerator(blockA).Aftercarefulreviewwith163PJM,itwasdecidedthattheapproximationusedinSMART-ISOreasonablymatchedtheirleadtimes,164strikingabalancebetweenmodelaccuracyandcomputationalcomplexity.Thecalibrationresults165reportedinalatersectionfurtherconfirmedthisassessment.166
2.3 Real-timeeconomicdispatchmodel167
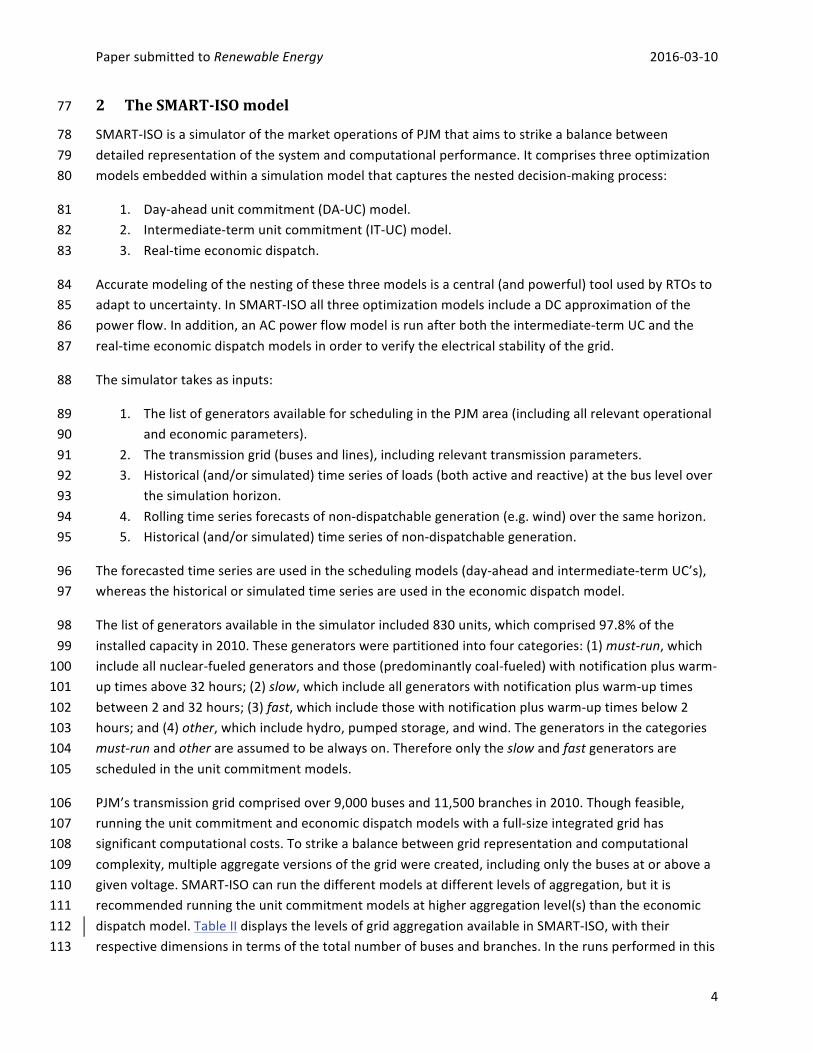
Thereal-timeeconomicdispatchmodelinSMART-ISOrunsevery5minutes,overaplanninghorizonof16815minutes,withtimestepsof5minutes,asillustratedinFigure4.PJMalsorunstheeconomicdispatch169every5minutes,butoveraplanninghorizonof5minutes(onlyonetimestep).170
PapersubmittedtoRenewableEnergy 2016-03-10
7
171
Figure4:Planninghorizonofthereal-timeeconomicdispatchmodel.172
Nogeneratorsareturnedonoroffinthismodel.Instead,generatorsareonlymodulatedtofollowthe173actual(orsimulated)loadandadjusttonon-dispatchablegeneration(alsoactualorsimulated).The174generationamountssimulatedinblockCarekept,whereastheonessimulatedinblockDarediscarded,175asblockDwasaddedtotheplanninghorizonofthismodelagaintomitigateend-of-horizonbiasesin176thecalculationsinblockC.177
2.4 Powerflowmodels178
ToincorporatetransmissiongridconstraintsintoSMART-ISO,unitcommitmentandeconomicdispatch179modelsthatincludepowerflowmodelingwereimplemented.TheDCapproximationwasusedtosolve180thepowerflowembeddedinthelinearoptimizationproblems.Thisisawidelyusedapproximationfor181thepowerflowintransmissiongrids,sinceitdoesnotrequireiterations(astheACpowerflowdoes)182andtheoptimizationproblemremainslinearandconsequentlylesscomplex(Stottetal.2009,Hedman183etal.2011,Overbyeetal.2004).TheDCapproximationpowerflowmodelconsidersonlyactivepower184andassumesthatthenominalvoltagesremainconstant.185
However,toverifythevoltagestabilityofthegrid,andpossiblycorrectforit,anACpowerflowmodel186thatrunsonceaftereveryintermediate-termUCandonceaftereveryeconomicdispatchmodelinthe187simulationwasalsoimplemented.IftheACpowerflowsolutionafteranintermediate-termUCmodel188showssignificantvoltagedeviationsfromthenominalvalues(where“significant”isdefinedintermsof189observedhistoricalpatterns),asinglefeedbackloopwillmakeartificialadjustmentstolocalbusloads,190andtheintermediate-termUCmodelwillbesolvedagain,aimingtochangetheallocationofpower191generationsoastolessenthevoltagedeviations.192
TheDCapproximationcanbetoorigid,indicatingthatpowerrequirements(whileholdingvoltages193constant)mightnotbemet,whiletheACmodelcanflexvoltagestomeetloads,frequentlyby194increasingcurrents.Highercurrentscanbetoleratedforshortperiodsoftime.Thegreaterflexibilityof195theACpowerflowprovedtobeimportantinthestudiesofnon-dispatchablesourcesthatrequired196adaptationtoshortbutsuddendropsinwind.197
Forthesamereason,theACpowerflowmodelissolvedagainaftereacheconomicdispatchmodelrun,198inordertoassesstheoverallstabilityandfeasibilityoftheoperationofthegrid.Loadgreaterthan199generationwithinPJMisreferredtoas“generationshortfall.”AnRTOwillhandlethisproblemwith200demandmanagement,orbycallinginterruptiblecustomerstoclosedown,orwithtransfersfrom201neighboringRTOs.Ifthereisathreattothestabilityofthelargersystem,theymightshedloadby202unannouncedcutoffs,anemergencyprocedure.WithoutstatinghowPJMwouldrespond,thispaper203

PapersubmittedtoRenewableEnergy 2016-03-10
8
simplycallssuchcases“generationshortfall.”IftheACpowerflowsolutiondoesnotconvergeor204significantvoltagedeviationsaredetected,theoperationofthegridisflaggedas“ACunstable”during205that5-minutetimeperiod.If,however,thereisgenerationshortfallinthesolutionoftheDC-based206economicdispatch(usuallyaninfeasiblesituation),buttheACpowerflowsolutionconvergesandis207voltage-stable,thentheDCgenerationshortfallisdismissed(thatis,theinfeasibilityisignored).Upto20810consecutiveminutesofdismissedDCgenerationshortfallwillbeallowed.Ifthesituationpersistsfor20915minutesorlonger,thenthedismissalisrevertedandthegenerationshortfallisflagged,regardlessof210theACpowerflowstability.211
2.5 Reserves212
RTOssuchasPJMuseavarietyofstrategiestomanagetheuncertaintiesthatariseinanyenergy213system,includingthehedgingofdecisionswiththesequenceofday-ahead,intermediate-term,andreal-214timeplanning,combinedwiththeuseofreservesthatmakeitpossibleforPJMtorespondtochanging215forecastsandreal-timeconditionsthatdeviatefromforecast.Theinterestintestingmuchhigher216penetrationsofwindrequiredthatthesestrategiesbeexploited,buttheexperimentsfocusedprimarily217onincreasingtheavailabilityofsynchronizedreservesthatcouldberamped(upordown)within10218minutes.219
ThebasemodelrepresentedPJM’sdefaultpolicyofprovidingenoughspinningreservetocover220unexpectedpowerimbalanceequivalenttoitslargestgenerator,thatis,1300MW.Additionalreserve221wasthenintroducedintheformoffastgeneratorsthatcouldrampupordown.Up-rampingwasused222tocoverunexpecteddropsinwind,whiledown-rampingwasusedtotakeadvantageofsuddensurges223inwind.Theserampingreserveswereexpressedandtunedassingleparameters,foreachseason,224reflectingthedifferencesinboththeaverageandmaximumloads,butalsothetypesofweather225encounteredineachseason.226
Notsurprisingly,reservesrepresentapowerfulstrategyforhandlinguncertainty,widelyusedbyRTOs.A227significantfindingofthisresearchwasthatthissimpleindustrypracticecouldbeextendedtohandle228dramaticallyhigherpenetrationsofwindthannowexist,asshownbelow.229
Thechallengeofplanningmarketoperationsunderuncertaintyhasattractedconsiderableattention230fromthealgorithmiccommunity,withspecialattentionbeinggiventoasolutionofthe“stochasticunit231commitmentproblem”(Takritietal.1996,Ryanetal.2013).Thisisaparticularalgorithmicstrategy232developedbythestochasticprogrammingcommunity(BirgeandLouveaux2011),whichreplacesa233deterministicforecast(usedbyallRTOs)withasetofscenariosthatapproximatewhatmighthappen.In234thispaper,itisdemonstratedthatthestandardreservepoliciesusedbyRTOsareveryeffectiveat235handlingtheuncertaintyevenfromveryhighlevelsofrenewables.236
3 CalibrationofSMART-ISO237
ThefirsttaskwastocalibrateSMART-ISOagainstabasecasewithnooffshorewindpower.Theyearof2382010waschosenasthebaseyearbecauseitwasthelatestyearforwhichacompletedatasetofthe239PJMnetworkandactualoperationswasavailableatthestartofthisproject.Fourweeksduringtheyear240
PapersubmittedtoRenewableEnergy 2016-03-10
9
werechosenforsimulation,oneineachseason.AprilandOctoberwerechosenasrepresentativeofthe241shoulder(lowestdemand)monthsinspringandfall,respectively.Januarywaschosenasrepresentative242ofthewinterdemand,andJulywaspickedasrepresentativeofthepeaksummerdemand.243
Tofocusonuncertaintyinwindforecasts,othersourcesofuncertaintywereeliminatedfromthe244simulationby(1)usingactual(historical)timeseriesofdemand(loads)ratherthanlong-termorshort-245termforecasts,(2)ignoringonshorewindandsolarproduction,(3)ignoringpotentialgeneratorand246transmissionfailures,and(4)ignoringvariationsduetoneighboringRTOs.Therefore,theonly247uncertaintypresentinthisstudycomesfromtheforecastedoffshorewindpower.Similarly,thesame248levelofsynchronizedreserveusedbyPJM,whichwas1300MW(thesizeoftheirlargestgenerator),was249modeled.Whilethisreservewouldcoverthelossofanyonegenerator,itisusedtorespondto250uncertaintyinwindforecastsaswell.Itwasalsofoundthatmodestreserveswereneededtodealwith251whatmightbecalled“modelnoise”–variationsinthesolutionarisingfrommodeltruncationandfrom252solvinglargeintegerprograms.InthissectionresultsonthecalibrationofSMART-ISOarepresented,253whereasinthenexttheresultsfromtheintegrationstudyarediscussed.254
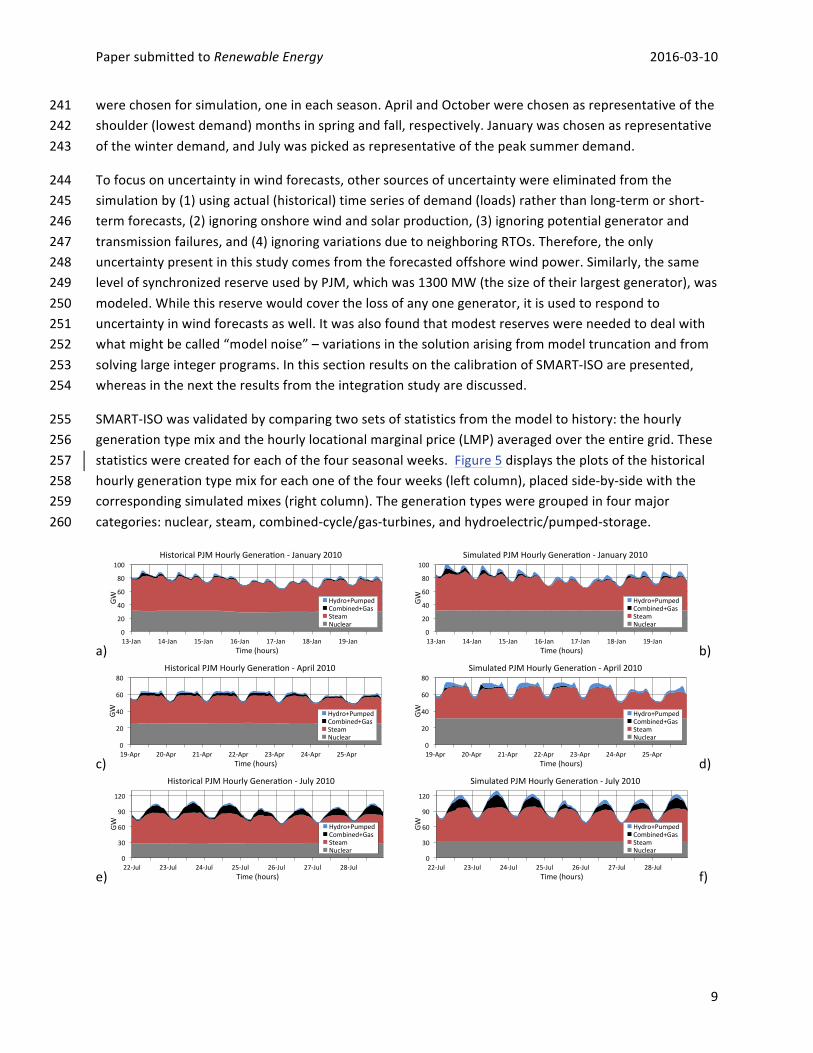
SMART-ISOwasvalidatedbycomparingtwosetsofstatisticsfromthemodeltohistory:thehourly255generationtypemixandthehourlylocationalmarginalprice(LMP)averagedovertheentiregrid.These256statisticswerecreatedforeachofthefourseasonalweeks.Figure5displaystheplotsofthehistorical257hourlygenerationtypemixforeachoneofthefourweeks(leftcolumn),placedside-by-sidewiththe258correspondingsimulatedmixes(rightcolumn).Thegenerationtypesweregroupedinfourmajor259categories:nuclear,steam,combined-cycle/gas-turbines,andhydroelectric/pumped-storage.260
a) b)
c) d)
e) f)
0"
20"
40"
60"
80"
100"
13)Jan" 14)Jan" 15)Jan" 16)Jan" 17)Jan" 18)Jan" 19)Jan"
GW"
Time"(hours)"
Historical"PJM"Hourly"GeneraDon")"January"2010"
Hydro+Pumped"Combined+Gas"Steam"Nuclear"
0"
20"
40"
60"
80"
100"
13)Jan" 14)Jan" 15)Jan" 16)Jan" 17)Jan" 18)Jan" 19)Jan"
GW"
Time"(hours)"
Simulated"PJM"Hourly"GeneraEon")"January"2010"
Hydro+Pumped"Combined+Gas"Steam"Nuclear"
0"
20"
40"
60"
80"
19)Apr" 20)Apr" 21)Apr" 22)Apr" 23)Apr" 24)Apr" 25)Apr"
GW"
Time"(hours)"
Historical"PJM"Hourly"GeneraEon")"April"2010"
Hydro+Pumped"Combined+Gas"Steam"Nuclear"
0"
20"
40"
60"
80"
19)Apr" 20)Apr" 21)Apr" 22)Apr" 23)Apr" 24)Apr" 25)Apr"
GW"
Time"(hours)"
Simulated"PJM"Hourly"GeneraFon")"April"2010"
Hydro+Pumped"Combined+Gas"Steam"Nuclear"
0"
30"
60"
90"
120"
22(Jul" 23(Jul" 24(Jul" 25(Jul" 26(Jul" 27(Jul" 28(Jul"
GW"
Time"(hours)"
Historical"PJM"Hourly"GeneraDon"("July"2010"
Hydro+Pumped"Combined+Gas"Steam"Nuclear"
0"
30"
60"
90"
120"
22(Jul" 23(Jul" 24(Jul" 25(Jul" 26(Jul" 27(Jul" 28(Jul"
GW"
Time"(hours)"
Simulated"PJM"Hourly"GeneraEon"("July"2010"
Hydro+Pumped"Combined+Gas"Steam"Nuclear"

PapersubmittedtoRenewableEnergy 2016-03-10
10
g) h)Figure5ComparisonofhistoricalversussimulatedPJMhourlygenerationmixesin2010.Thescaleof261thevaluesshownintheverticalaxis(generatedpower)variesfrommonthtomonth.262
Itshouldbenotedthatwhiledetailedactualgenerationandloaddataatthebuslevelwereavailable,it263wasnotpossibletomapallbusestoactualgenerators.Asaresult,theaccountingofthetotalhistorical264generationisbelowthetotalloadbyabout10%(thisexplainsthehigherlevelofgenerationdisplayedin265thesimulationplots).However,itisstillpossibletocomparethepatternsofthehourlygenerationmix266withineachmonth;theyshowagoodmatchbetweenhistoricalandsimulatedresults.Itisnoteworthy267alsothattheproportionofsimulatedgenerationfromcombined-cycleandgasturbinesinthelow-268demandmonths(AprilandOctober)islowerthantheactualhistoricalvalues,possiblyduetothefact269thatSMART-ISOdoesnottakeintoconsiderationlong-termcontractsthatmayexistbetweensomefast270generationsuppliersandPJM,butschedulesallfastgenerationonanhourlybasisandasneeded(note271thisissueisnotpresentinthehigher-demandmonthsofJanuaryandJuly).Whilethisintroducesa272modesterror,itisimportanttoavoidcapturinglong-termcontracts,becauseitcannotbeassumedthat273thesamecontractswillbeinplaceashighpenetrationsofwindenergyaremodeled.274
Moresignificant,however,aretheresultsshowninFigure6,wherethelocationalmarginalprices(LMPs275–in$/MWhr)producedbythesimulatorarecomparedwiththoseobservedintheactualoperationof276PJM.PleasenotethattheLMPsproducedbySMART-ISOincludetheenergyandthetransmissiongrid277congestioncosts,butnotthecostsduetotransmissionlinelossesortooccasionalcontingencies(a278failureofageneratororofatransmissionline,oroff-gridoutages).Thiswouldexplainwhyhistorical279pricesmightbespikierthansimulatedones.Ingeneral,however,thereisaremarkableagreementin280thepatternsbetweenthenetwork-averagedLMPsproducedbythesimulationandthoseobservedin281historyforthefourtimeperiodsinquestion(Figure6).282
a) b)
0"
20"
40"
60"
80"
14(Oct" 15(Oct" 16(Oct" 17(Oct" 18(Oct" 19(Oct" 20(Oct"
GW"
Time"(hours)"
Historical"PJM"Hourly"GeneraDon"("October"2010"
Hydro+Pumped"Combined+Gas"Steam"Nuclear"
0"
20"
40"
60"
80"
14(Oct" 15(Oct" 16(Oct" 17(Oct" 18(Oct" 19(Oct" 20(Oct"
GW"
Time"(hours)"
Simulated"PJM"Hourly"GeneraFon"("October"2010"
Hydro+Pumped"Combined+Gas"Steam"Nuclear"
0"
50"
100"
150"
200"
13'Jan" 14'Jan" 15'Jan" 16'Jan" 17'Jan" 18'Jan" 19'Jan"
$/MWhr"
Time"(hours)"
PJM"Average"Real'Eme"LMPs"'"January"2010"Simulated"Historical"
0"
50"
100"
150"
200"
19'Apr" 20'Apr" 21'Apr" 22'Apr" 23'Apr" 24'Apr" 25'Apr"
$/MWhr"
Time(hours)"
PJM"Average"Real'Bme"LMPs"'"April"2010"Simulated"Historical"

PapersubmittedtoRenewableEnergy 2016-03-10
11
c) d)Figure6ComparisonofhistoricalversussimulatedPJMaveragereal-timeLMPs.283
Onthebasisoftheseresults,SMART-ISOwasdeemedtocloselymatchthebehaviorofPJM,since284accuratemodelingofLMPsrequiresthatallthecomponentsofthesystemcapturereal-worldbehavior.285Itisfurthernotedthattheseresultswereachievedwithoutusinganytunableparameters.286
4 Mid-AtlanticOffshoreWindIntegration(MAOWIT)Study287
Thispaperaddressesfourquestionsconcerningtheintegrationoflargeamountsofnon-dispatchable288energy(inthiscase,offshorewind)intoagenerationandtransmissionmarket:289
1. Willtheexistinggenerationcapacitybeabletohandlethediscrepancybetweentheforecasts290usedinthecommitmentphaseandtheactualenergyobservedinreal-time?291
2. Willtheplanningprocessbeabletohandlethemuchhigherlevelofvariabilityanduncertainty292(evenifthereisenoughgenerationcapacity)?293
3. Whatreservelevelswillberequiredtohandletheuncertaintyintroducedwithhigh294penetrationsofwind?295
4. Willthetransmissiongridbeabletohandletheadditionalload?296
Inthisstudy,offshorewindpower,infiveincreasinglevelsofbuild-out,isassumedtobeinjectedinto297theeasternsideofthePJMgridthroughsixpointsofinterconnectiononthecoast,stretchingfrom298CentralNewJerseytoVirginia.Therefore,itisalmostcertainthatthetransmissiongridalongtheMid-299Atlanticcoastwillhitcapacitywhensignificantamountsofenergyfromoffshorewindareinjected.300
Toseparatetheissueofgridcapacityfromtheplanningandsupplyofenergywithafleetofgenerators,301thestudywasdividedintotwoparts:1)analysiswithahypotheticalgrid,referredtoasthe302unconstrainedgrid,thathasthesamephysicallinesasthecurrentPJMsystem,butthermalcapacities303andthuselectricpowercarryingcapacities,highenoughtohandleanypenetrationlevel(thisisnotthe304sameasignoringthegrid,whichthispaperdidnotdo);and2)analysiswithagridconstrainedby305currentthermalcapacities.Theresultsofthesetwopartsarereportedintheremainderofthissection.306Pleasenotethat,thoughimportant,thispaperdidnotaddressthequestionofhowmuchextragrid307capacitywouldbeneededtosupporttheinjectionoflargeamountsofoffshorewind,which,therefore,308remainedoutsideofitsscope.309
4.1 Unconstrainedgrid,noramp-upor-downreservesadded310
TheSMART-ISOsimulationswereperformedoverone-weekhorizonsineachofthefourseasonal311months,firstwithoutanyoffshorewind(the“current”situation,alsocalledbuild-outlevel0)andthen312
0"
50"
100"
150"
200"
22&Jul" 23&Jul" 24&Jul" 25&Jul" 26&Jul" 27&Jul" 28&Jul"
$/MWhr"
Time"(hours)"
PJM"Average"Real&Cme"LMPs"&"July"2010"Simulated"Historical"
0"
50"
100"
150"
200"
14'Oct" 15'Oct" 16'Oct" 17'Oct" 18'Oct" 19'Oct" 20'Oct"
$/MWhr"
Time"(hours)"
PJM"Average"Real'Fme"LMPs"'"October"2010"Simulated"Historical"

PapersubmittedtoRenewableEnergy 2016-03-10
12
witheachoneofthefivebuild-outlevelsofoffshorewind.Foreachlevelofbuild-outandeachmonth,313threedifferentweekswerepicked,eachexhibitingdifferentmeteorologicalconditions.Forexample,314differentweeksmightexhibitvariousstormsystemsthatintroduceavarietyoframpingevents315producedbytheWRFmeteorologicalsimulator.Themodelofforecasterrorswasthenusedtogenerate316sevensamplepathsofoffshorewindforeachweek,thustotaling21samplepathsforeachmonth,or84317samplepathsoverall(Archeretal.2016).Theresultspresentedhenceforthwerecompiledfrom318simulationsusingthesesamplepaths.319
TableIIIshowstheresultsofaddingincreasinglyhigherlevelsofoffshorewindintotheunconstrained320PJMgrid.Thepercentageofoffshorewindparticipationinthetotalgenerationatbuild-outlevel1321rangedfrom2.2%inthepeakloadmonthofJulyto4.3%inthewintermonthofJanuary,whereasat322build-outlevel5(thehighest)itrangedfrom16.7%to30%.Thepercentageofwindused,withrespect323towhatwasactuallyavailable,wasashighas94.8%,onaverageovertheseason,atbuild-outlevel1in324January,andaslowas56.4%atbuild-outlevel5inOctober.325
ThemostnoteworthyresultsinTableIII,though,aretheestimatesofthelikelihoodofgeneration326shortfallatsometimeduringonesimulatedweek,duetounexpecteddifferencesbetweenthe327forecastedandactualwindpowergeneration.Atbuild-outlevel1,inJanuaryandJuly,forinstance,328whentheloadsarehigher,theprobabilitiesthatthesystemmayoperatewithoutanygeneration329shortfallduringoneweekaremuchsmallerthanintheshouldermonthsofAprilandOctober.From330build-outlevel2andup,inanyseason,itispracticallycertainthatthePJMsystemascurrentlyoperated331(includingcurrentreserves)willfacegenerationshortfallatleastonceaweek.332
TherearedifferentwaysinwhichthePJMmarketoperationcanbemodifiedtotrytocopewiththe333uncertaintyinthewindpowerforecasts.Oneofthemwastested(theonethatisactuallyalreadyused334bytheRTOstodealwithuncertaintiesinthepowergeneration):theadditionoframp-upandramp-335downreservesfromdispatchable(fast)generation.Thelevelsoftheseadditionalreserveshadtobe336estimatedforeachbuild-outlevelandseasonoftheyear.Inadditiontotheseruns,experimentswere337alsoperformedassumingtheidealizedsituationofhavingaccesstoperfectforecasts,thatis,day-ahead338andintermediate-termwindforecaststhatareequaltotheactualobservedvalues.Theseexperiments339providedasenseofthevalueofbetterforecasting.Thelatterexperimentsarereferredtoastheperfect340forecastcases,whereastherunswiththeoriginalforecastsarereferredtoastheimperfectforecast341cases.342
TableIII:Performancemetricsofthesimulated,unconstrainedPJMgrid,withimperfectforecastsand343noadditionalreserves,afteraddingincreasinglyhigherlevelsofoffshorewindpower.344
Build-outLevel
InstalledCapacity(GW)
Month-Year
GenerationfromOffshore
Wind(%)
UsedWind(%)
LikelihoodThereWillBeGenerationShortfallatSomeTimeDuringOne
Week(%)
AveragePeakGenerationShortfall(GW),WhenThereIs
AnyShortfall
1 7.3
Jan-10 4.3 94.8 38.1 0.6Apr-10 4.0 78.3 9.5 0.3Jul-10 2.2 92.1 81.0 2.3Oct-10 4.0 78.2 9.5 0.6
2 25.3 Jan-10 14.5 93.4 100.0 3.1

PapersubmittedtoRenewableEnergy 2016-03-10
13
Apr-10 15.1 87.7 100.0 3.8Jul-10 7.1 86.9 100.0 6.4Oct-10 15.8 90.0 100.0 2.3
3 35.8
Jan-10 20.8 93.4 100.0 5.2Apr-10 20.4 83.9 100.0 4.3Jul-10 10.3 85.6 100.0 7.7Oct-10 20.8 83.9 100.0 3.2
4 48.9
Jan-10 25.6 84.2 100.0 5.4Apr-10 24.2 74.0 100.0 4.4Jul-10 14.1 80.5 100.0 9.8Oct-10 24.1 72.1 100.0 3.9
5 69.7
Jan-10 30.0 68.7 100.0 7.4Apr-10 29.9 62.9 100.0 5.4Jul-10 16.7 68.1 100.0 12.5Oct-10 27.5 56.4 100.0 3.1
345
4.2 Unconstrainedgrid,withramp-upand-downreservesadded346
Figure7showsthelevelsof10-minuteramp-upanddownreserves(synchronized)thatwereaddedto347thesysteminordertoguaranteethatitwouldoperatewithoutgenerationshortfall.Theselevelswere348estimated(or“tuned”)throughaseriesofsimulationrunswheretheamountofrequiredreserveswas349varieduntiltheapproximateminimumamount,foreachmonthandeachbuild-outlevel,wasfound350suchthatnogenerationshortfallwasobservedinanyofthe21simulationsamplepaths.Thesereserves351areinadditiontotheusualPJMsynchronizedreserve(orspinningreserve),whichiscurrentlysetat1.3352GW(thesizeofthelargestgeneratoroperatinginthesystem).EachplotinFigure7depictsthe353additionalreservelevel(inGW)requiredinthatmonth,foreachoneofthefiveoffshorewindbuild-out354levels,indicatedbytheirrespectiveinstalledcapacities(inGW).Notethatbuild-outlevel“0”355correspondstothecasewithnooffshorewindpower,andthusthezerolevelofadditionalreserves356required.357
a) b)
0"
4"
8"
12"
16"
0" 10" 20" 30" 40" 50" 60" 70"
GW"
Build2out"level"(GW)"
Ramping"Reserves"2"Comparing"Forecasts"January"2010"
Imperfect"Perfect"
0"
4"
8"
12"
16"
0" 10" 20" 30" 40" 50" 60" 70"
GW"
Build2out"level"(GW)"
Ramping"Reserves"2"Comparing"Forecasts"April"2010"
Imperfect"Perfect"

PapersubmittedtoRenewableEnergy 2016-03-10
14
c) d)Figure7Rampingreservesneededforarangeofbuild-outs,comparingthecasesofimperfectand358perfectwindforecasts.FortheJulycase(c),therightaxisisthereferenceforgenerationshortfall359probability.360
TableIVshowsallperformancemetricsofthesimulated,unconstrainedgrid,withadditionalramp-up361anddownreserves,fortheimperfectforecastcase.Withtheexceptionofthepeaksummerloadperiod,362itispossibletomitigatetheuncertaintyintheimperfectwindforecasts,forallbuild-outlevels,withthe363additionofsynchronizedreservesprovidedbyfastgenerators.Asexpected,thehigherthebuild-out364level,thelargertherequiredreserves.ForJuly,theyamountedtoover15GW(>20%ofwindgeneration365capacity).366
Forthesummerpeakmonth,itwasnotpossibletofindaleveloframp-upanddownreservesthatcould367completelyeliminategenerationshortfallforbuild-outlevels4and5,giventheavailablefleetofgas368turbines.Theconjectureisthatthecombinationofaloadincreaseinthemid-daypeakhourswithan369unexpected,steepwindpowerdecreaseatthesametimecreatesasituationwheretheexistingfast370generatorsmightsimplynothaveenoughcapacityorbefastenoughtoavoidgenerationshortfall.This371isillustratedinFigure8,wherethesimulatedwindpowerunexpectedlydropsbyabout25GWwithin40372minutes(bottomplot),atatimewhentheloadisstillincreasing(between1and2pm).Thiscreatesa373generationshortfallforabout35minutes,withapeakpowershortageofabout2.5GW(topplot),after374theadditionalreservesof13GWhavealreadybeenexhausted.375
TableIV:Performancemetricsofthesimulated,unconstrainedPJMgridwithimperfectforecastsafter376addingincreasinglyhigherlevelsofoffshorewindpowerandspecificramp-upandramp-down377reserves.378
Build-outLevel
InstalledCapacity(GW)
Month-Year
RampingReserves(GW)
GenerationfromOffshore
Wind(%)
UsedWind(%)
LikelihoodThereWillBeGenerationShortfallatSomeTimeDuringOne
Week(%)
AveragePeakGenerationShortfall(GW),WhenThereIs
AnyShortfall
1 7.3
Jan-10 1.2 4.3 95.0 0.0 0Apr-10 0.5 3.9 77.2 0.0 0Jul-10 2 2.3 92.5 0.0 0Oct-10 0.5 4.0 77.2 0.0 0
2 25.3Jan-10 4 14.0 90.1 0.0 0Apr-10 5 13.5 78.6 0.0 0Jul-10 5 7.4 86.0 0.0 0
0"
4"
8"
12"
16"
0" 10" 20" 30" 40" 50" 60" 70"
GW"
Build2out"level"(GW)"
Ramping"Reserves"2"Comparing"Forecasts"October"2010"
Imperfect"Perfect"

PapersubmittedtoRenewableEnergy 2016-03-10
15
Oct-10 3 15.1 85.6 0.0 0
3 35.8
Jan-10 5 20.0 90.3 0.0 0Apr-10 6 16.1 67.3 0.0 0Jul-10 8 10.8 86.2 0.0 0Oct-10 3.5 18.4 73.9 0.0 0
4 48.9
Jan-10 5.5 24.6 81.4 0.0 0Apr-10 4 21.0 62.5 0.0 0Jul-10 13 14.7 82.1 23.8 1.6Oct-10 3.5 20.5 61.2 0.0 0
5 69.7
Jan-10 8 27.8 63.8 0.0 0Apr-10 5.5 23.4 49.0 0.0 0Jul-10 15 17.4 69.6 19.1 1.0Oct-10 5 21.2 43.3 0.0 0
379
Figure7cshowsontheright-handverticalaxistheincreasingprobabilitythattherewillbeageneration380shortfallinoneweekofoperationinthepeaksummermonth.Thesameplotalsoshowstheaverage381peakgenerationshortfall,whenthereisanyshortfall.Forbuild-outlevel3inJulyweobservedno382generationshortfall.Thereforeonecansaythatthemaximumbuild-outlevelofoffshorewindthatthe383currentPJMmarketcantake–withoutanygenerationshortfall–andwithadditionalsynchronized384rampingreservesofupto8GW,is3,whichcorrespondstoaninstalledcapacityof35.8GW.385
Ontheotherhand,iftheunitcommitmentplanninghadaccesstoperfectwindforecasts,itwouldbe386possibletohandleallbuild-outlevelsofwind,includinginthesummer,withjustnominalamountsof387additionalsynchronizedreserves,asshownintheplotsofFigure7.Intherealworldtherewillobviously388neverexistperfectwindforecasts.However,theseresultssuggestthatafuturecombinationofforecast389improvementswithadditionalsynchronizedreserves(andcorrespondinginvestmentsinthegrid)could390potentiallyallowthePJMsystemtooperatewithoutgenerationshortfall,forlevelsofinstalledoffshore391capacityofuptoabout70GW(whichwouldprovideforabout30%ofthedemandforelectricityinthe392winter,forexample).Theseresultshighlighttheimportanceofconsideringuncertaintywhenmanaging393energyfromwind.394

PapersubmittedtoRenewableEnergy 2016-03-10
16
395
Figure8:Totalsimulatedpower,actualload,andwindduringa35-minutegenerationshortfallevent396causedbyanunexpected,sharpdecreaseinactualwindthatwasnotpredictedbyeithertheday-397aheadforecast(DA-Predicted)ortheshort-termforecast(IT-Predicted).398
Figure9showsplotswiththegenerationmixontheleft-handverticalaxisandusedwindasa399percentageofavailablewindontheright-handverticalaxis.Inthegenerationmix,thepercentagesof400energyproducedbysteamgenerators,combined-cycle/gas-turbinesandoffshorewindfarmsonlyare401displayed,sincethesearetheformsofgenerationthataremostlyaffectedbytheintroductionof402offshorewind.Theplotsontheleftcolumndepicttheresultsforthecaseofimperfectforecasts,403whereastheonesontherightcolumndepicttheonesforperfectforecasts.404
Themaindifferencebetweentheimperfectandperfectforecastcasesistheusageofcombined-405cycle/gas-turbines.Intheimperfectcase,thisusageprogressivelyincreaseswiththewindbuild-out406level,asfast(gas)generatorsareemployedmoreastheadditionalreserveneededtoguaranteethe407generationshortfall-freeoperationofthesystem.Inthecaseofperfectforecasts,though,theusageof408combined-cycle/gasgenerationremainsessentiallyflatwiththewindbuild-out,sinceslow(steam)409generationcanbeusedtobalancethe(perfectlyforecasted)variabilityofwind.410
Itisalsonotedthatwindutilizationtendstodecreaseathigherpenetrationlevels.Aswindincreases,a411largernumberofdispatchablegeneratorsrunningattheirminimumoperationallevelsisneeded,in412ordertoguaranteethatthesystemwillbefreeofgenerationshortfallswhenthewindpowervaries.As413aresult,lessoftheavailablewindendsupbeingused.Also,forthesamelevelofwindandforthe414shouldermonths(thatis,thetimesoftheyearwhenthedifferencebetweenlowestandhighest415demandwithinadayissmaller),perfectwindforecaststendtoproducehigherwindusagethan416imperfectforecasts.417
0"
20"
40"
60"
80"
100"
7:00" 8:00" 9:00" 10:00" 11:00" 12:00" 13:00" 14:00" 15:00"
GW"
Time"
Total"Power,"Wind,"and"Load"during"Load"Shedding"Event"BuildEout"4"E"25"Jul"2010"
Actual"Total"Load"Simulated"Total"Power"Available"Wind"ITEPredicted"Wind"DAEPredicted"Wind"

PapersubmittedtoRenewableEnergy 2016-03-10
17
a) b)
c) d)
e) f)
g) h)Figure9Generationmixandpercentageofwindusedforthecasesofimperfect(leftcolumn)and418perfect(rightcolumn)windforecasts.TherightaxisisthereferenceforUsedWind.419
0"
25"
50"
75"
100"
0"
15"
30"
45"
60"
0" 10" 20" 30" 40" 50" 60" 70"
Used"wind"as"%"of"available"wind"
Gene
ra:o
n"mix"as"%
"of"total"dem
and"
Build@out"level"(GW)"
Genera:on"Mix"@"Imperfect"Forecasts""January"2010"
Steam"Offshore"Wind"Combined"+"Gas"Used"Wind"
0"
25"
50"
75"
100"
0"
15"
30"
45"
60"
0" 10" 20" 30" 40" 50" 60" 70"
Used"wind"as"%"of"available"wind"
Gen
era:
on"m
ix"as"%"of"total"dem
and"
Build@out"level"(GW)"
Genera:on"Mix"@"Perfect"Forecasts""January"2010"
Steam"
Offshore"Wind"
Combined"+"Gas"
Used"Wind"
0"
25"
50"
75"
100"
0"
15"
30"
45"
60"
0" 10" 20" 30" 40" 50" 60" 70"
Used"wind"as"%"of"available"wind"
Gen
era:
on"m
ix"as"%"of"total"dem
and"
Build@out"level"(GW)"
Genera:on"Mix"@"Imperfect"Forecasts""April"2010"
Steam"
Offshore"Wind"
Combined"+"Gas"
Used"Wind"
0"
25"
50"
75"
100"
0"
15"
30"
45"
60"
0" 10" 20" 30" 40" 50" 60" 70"
Used"wind"as"%"of"available"wind"
Gen
era:
on"m
ix"as"%"of"total"dem
and"
Build@out"level"(GW)"
Genera:on"Mix"@"Perfect"Forecasts""April"2010"
Steam"
Offshore"Wind"
Combined"+"Gas"
Used"Wind"
0"
25"
50"
75"
100"
0"
15"
30"
45"
60"
0" 10" 20" 30" 40" 50" 60" 70"
Used"wind"as"%"of"available"wind"
Gene
ra:o
n"mix"as"%
"of"total"dem
and"
Build@out"level"(GW)"
Genera:on"Mix"@"Imperfect"Forecasts""July"2010"
Steam"Offshore"Wind"Combined"+"Gas"Used"Wind"
0"
25"
50"
75"
100"
0"
15"
30"
45"
60"
0" 10" 20" 30" 40" 50" 60" 70"
Used"wind"as"%"of"available"wind"
Gen
era:
on"m
ix"as"%"of"total"dem
and"
Build@out"level"(GW)"
Genera:on"Mix"@"Perfect"Forecasts""July"2010"
Steam"
Offshore"Wind"
Combined"+"Gas"
Used"Wind"
0"
25"
50"
75"
100"
0"
15"
30"
45"
60"
0" 10" 20" 30" 40" 50" 60" 70"
Used"wind"as"%"of"available"wind"
Gene
ra:o
n"mix"as"%
"of"total"dem
and"
Build@out"level"(GW)"
Genera:on"Mix"@"Imperfect"Forecasts""October"2010"
Steam"Offshore"Wind"Combined"+"Gas"Used"Wind"
0"
25"
50"
75"
100"
0"
15"
30"
45"
60"
0" 10" 20" 30" 40" 50" 60" 70"
Used"wind"as"%"of"available"wind"
Gene
ra:o
n"mix"as"%
"of"total"dem
and"
Build@out"level"(GW)"
Genera:on"Mix"@"Perfect"Forecasts""October"2010"
Steam"Offshore"Wind"Combined"+"Gas"Used"Wind"
PapersubmittedtoRenewableEnergy 2016-03-10
18
4.3 Impactonsettlementpricesandemissions420
Atleasttwoadditionalquestionsarisefromthetrendsobservedinthegenerationmixasthelevelsof421windpowerinthesystemincrease:(1)whatistheoverallimpactonthenetworkaveragesettlement422price(basedonLMPs),and(2)whatistheimpactontheemissionofairpollutants?423
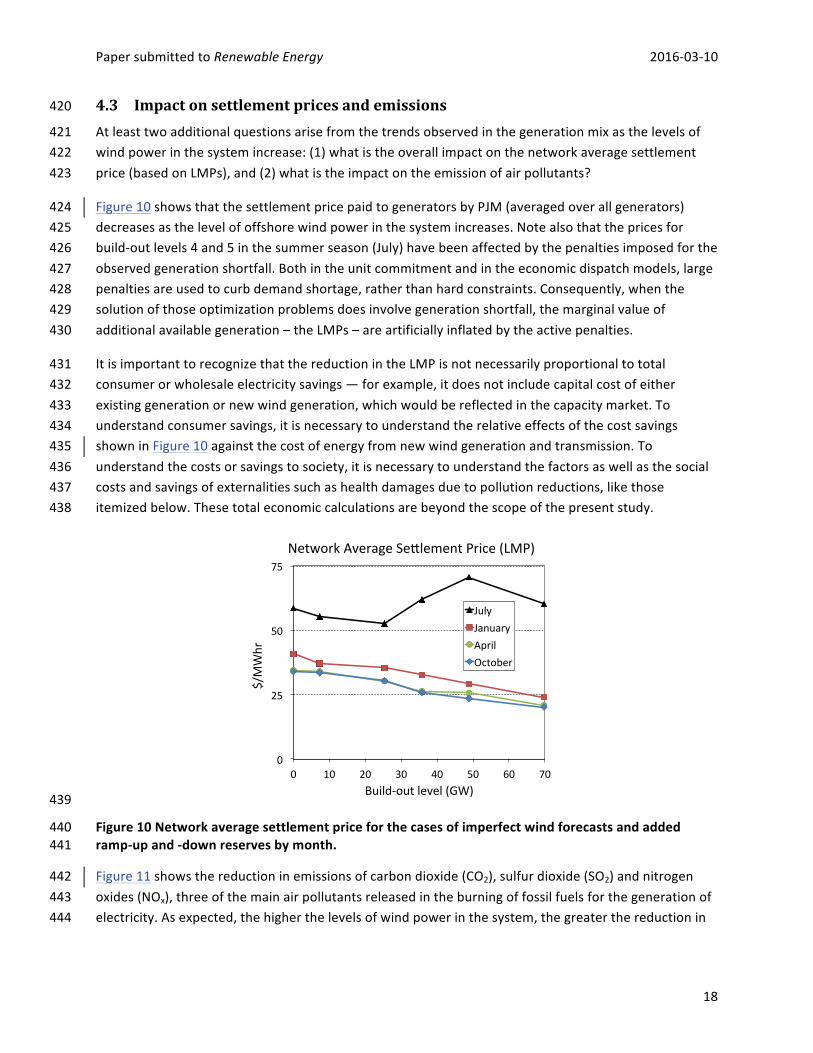
Figure10showsthatthesettlementpricepaidtogeneratorsbyPJM(averagedoverallgenerators)424decreasesasthelevelofoffshorewindpowerinthesystemincreases.Notealsothatthepricesfor425build-outlevels4and5inthesummerseason(July)havebeenaffectedbythepenaltiesimposedforthe426observedgenerationshortfall.Bothintheunitcommitmentandintheeconomicdispatchmodels,large427penaltiesareusedtocurbdemandshortage,ratherthanhardconstraints.Consequently,whenthe428solutionofthoseoptimizationproblemsdoesinvolvegenerationshortfall,themarginalvalueof429additionalavailablegeneration–theLMPs–areartificiallyinflatedbytheactivepenalties.430
ItisimportanttorecognizethatthereductionintheLMPisnotnecessarilyproportionaltototal431consumerorwholesaleelectricitysavings—forexample,itdoesnotincludecapitalcostofeither432existinggenerationornewwindgeneration,whichwouldbereflectedinthecapacitymarket.To433understandconsumersavings,itisnecessarytounderstandtherelativeeffectsofthecostsavings434showninFigure10againstthecostofenergyfromnewwindgenerationandtransmission.To435understandthecostsorsavingstosociety,itisnecessarytounderstandthefactorsaswellasthesocial436costsandsavingsofexternalitiessuchashealthdamagesduetopollutionreductions,likethose437itemizedbelow.Thesetotaleconomiccalculationsarebeyondthescopeofthepresentstudy.438
439
Figure10Networkaveragesettlementpriceforthecasesofimperfectwindforecastsandadded440ramp-upand-downreservesbymonth.441
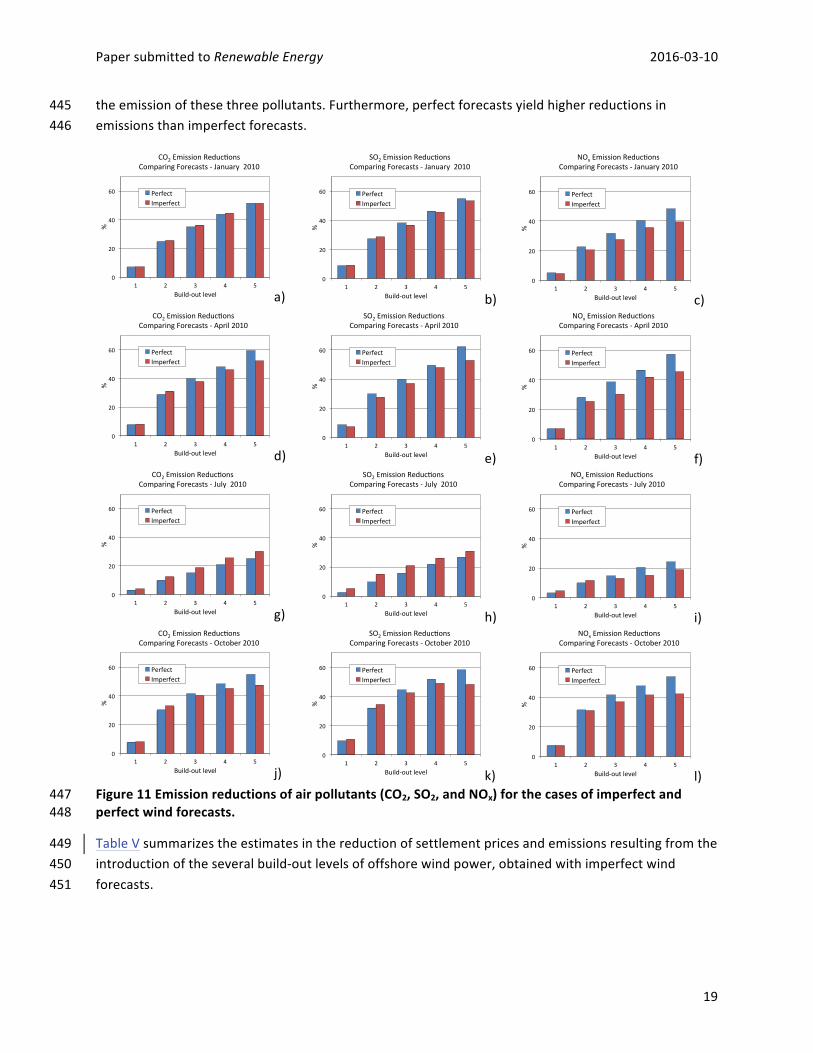
Figure11showsthereductioninemissionsofcarbondioxide(CO2),sulfurdioxide(SO2)andnitrogen442oxides(NOx),threeofthemainairpollutantsreleasedintheburningoffossilfuelsforthegenerationof443electricity.Asexpected,thehigherthelevelsofwindpowerinthesystem,thegreaterthereductionin444
0"
25"
50"
75"
0" 10" 20" 30" 40" 50" 60" 70"
$/MWhr"
Build5out"level"(GW)"
Network"Average"SeDlement"Price"(LMP)"
July"January"April"October"
PapersubmittedtoRenewableEnergy 2016-03-10
19
theemissionofthesethreepollutants.Furthermore,perfectforecastsyieldhigherreductionsin445emissionsthanimperfectforecasts.446
a) b) c)
d) e) f)
g) h) i)
j) k) l)Figure11Emissionreductionsofairpollutants(CO2,SO2,andNOx)forthecasesofimperfectand447perfectwindforecasts.448
TableVsummarizestheestimatesinthereductionofsettlementpricesandemissionsresultingfromthe449introductionoftheseveralbuild-outlevelsofoffshorewindpower,obtainedwithimperfectwind450forecasts.451
0"
20"
40"
60"
1" 2" 3" 4" 5"
%"
Build/out"level"
CO2"Emission"Reduc<ons""Comparing"Forecasts"/"January""2010"
Perfect"Imperfect"
0"
20"
40"
60"
1" 2" 3" 4" 5"
%"
Build/out"level"
SO2"Emission"Reduc<ons"Comparing"Forecasts"/"January""2010"
Perfect"Imperfect"
0"
20"
40"
60"
1" 2" 3" 4" 5"
%"
Build/out"level"
NOx"Emission"Reduc=ons""Comparing"Forecasts"/"January"2010"
Perfect"Imperfect"
0"
20"
40"
60"
1" 2" 3" 4" 5"
%"
Build/out"level"
CO2"Emission"Reduc<ons""Comparing"Forecasts"/"April"2010"
Perfect"Imperfect"
0"
20"
40"
60"
1" 2" 3" 4" 5"
%"
Build/out"level"
SO2"Emission"Reduc<ons"Comparing"Forecasts"/"April"2010"
Perfect"Imperfect"
0"
20"
40"
60"
1" 2" 3" 4" 5"
%"
Build/out"level"
NOx"Emission"Reduc=ons""Comparing"Forecasts"/"April"2010"
Perfect"Imperfect"
0"
20"
40"
60"
1" 2" 3" 4" 5"
%"
Build/out"level"
CO2"Emission"Reduc<ons""Comparing"Forecasts"/"July""2010"
Perfect"Imperfect"
0"
20"
40"
60"
1" 2" 3" 4" 5"
%"
Build/out"level"
SO2"Emission"Reduc<ons"Comparing"Forecasts"/"July""2010"
Perfect"Imperfect"
0"
20"
40"
60"
1" 2" 3" 4" 5"
%"
Build/out"level"
NOx"Emission"Reduc=ons""Comparing"Forecasts"/"July"2010"
Perfect"Imperfect"
0"
20"
40"
60"
1" 2" 3" 4" 5"
%"
Build/out"level"
CO2"Emission"Reduc<ons""Comparing"Forecasts"/"October"2010"
Perfect"Imperfect"
0"
20"
40"
60"
1" 2" 3" 4" 5"
%"
Build/out"level"
SO2"Emission"Reduc<ons"Comparing"Forecasts"/"October"2010"
Perfect"Imperfect"
0"
20"
40"
60"
1" 2" 3" 4" 5"
%"
Build/out"level"
NOx"Emission"Reduc=ons""Comparing"Forecasts"/"October"2010"
Perfect"Imperfect"

PapersubmittedtoRenewableEnergy 2016-03-10
20
TableV:Summaryofreductionsinsettlementpricesandemissionsforthecaseofimperfectwind452forecasts453
Build-outLevel
InstalledCapacity(GW)
Month-Year
GenerationfromOffshore
Wind(%)
NetworkAverageSettlementPriceReduction(%)
CO2EmissionReduction(%)
SO2EmissionReduction(%)
NOxEmissionReduction(%)
1 7.3
Jan-10 4 9 7 9 5Apr-10 4 2 8 7 7Jul-10 2 5 4 5 5Oct-10 4 1 8 11 8
2 25.3
Jan-10 14 13 26 29 21Apr-10 14 12 31 28 25Jul-10 8 10 13 15 12Oct-10 15 10 33 35 31
3 35.8
Jan-10 20 20 36 37 28Apr-10 16 24 38 37 30Jul-10 11 -6 19 21 13Oct-10 18 24 40 43 37
4 48.9
Jan-10 25 28 45 46 36Apr-10 21 26 46 48 42Jul-10 15 -20 26 26 15Oct-10 21 31 45 49 42
5 69.7
Jan-10 28 41 52 54 40Apr-10 23 39 52 53 46Jul-10 18 -3 30 31 19Oct-10 21 41 48 49 42
454
ItisnoteworthythattheaveragesettlementpricesforthemonthofJuly,forbuild-outlevels3and455aboveactuallyincreased,ratherthandecrease.Thisisprobablydue,atleastpartially,tothesignificantly456higherlevelsofusageofthemoreexpensivefastgenerationasreserves.Theadditionofgeneration457shortfallpenaltiesinbuild-outlevels4and5mayalsohavecontributedtofurtherinflatethesettlement458prices.459
Windbuild-outlevel3,correspondingtoaninstalledoffshorecapacityof35.8GW,isthehighest460capacityatwhichitisestimatedthecurrentPJMmarketcanoperatewithoutanygenerationshortfall,461withadditionalrampingreservesandanunconstrainedtransmissiongrid.Forthislevel,dependingon462theseasonoftheyear,thefollowingestimateswereobtained:463
• Energyfromwindwouldsatisfybetween11and20%ofthedemandforelectricity;464• Settlementpricescouldbereducedbyupto24%(thoughinthepeaksummerseasontheymay465
actuallyincreasebyupto6%);466• CO2emissionsarereducedbetween19and40%;467• SO2emissionsarereducedbetween21and43%;468• NOxemissionsarereducedbetween13and37%.469
4.4 Constrainedgrid,noramp-upor-downreservesadded470
TherewasalsointerestinevaluatingthecapacityofthePJMsystemtointegratethevariousbuild-out471levelsofoffshorewindpowerwiththetransmissiongridconstrainedbyitscurrentthermalcapacities.472

PapersubmittedtoRenewableEnergy 2016-03-10
21
Twoparticularscenariosofconnectionbetweentheoffshorewindfarmsandthesixonshorepointsof473interconnection(POI)weretested:474
• HVDCscenario-Theexistenceofahigh-voltageDC(HVDC)backbonelineunderthesea,along475thecontinentalshelfoftheMid-Atlanticcoast,wasenvisioned.Thefarmswouldbeconnected476tothisline,whichinturnwouldbeconnectedtothesixPOIs.Becausenewmulti-terminalHVDC477technologiesarefullyswitchable,thisscenarioimpliesthateachandeverywindfarmwouldbe478connectedtoeachandeveryPOI,andenergywouldthusbeinjectedinthePOIwhereneeded.479
• ACradialscenario-EachfarmwasenvisionedbeingconnectedbyanACradiallinetoonePOI480only,thenearestonegeographically.481
TheHVDCbackboneline,theACradiallinesandthePOIsthemselveswereassumedtohavethermal482capacitiessufficientlylargethattheydidnotconstraintransmission.483
TableVIshowsstatisticsfortherunswiththeconstrainedgridandtheHVDCbackboneconnection.484TheycanbedirectlycomparedtothosedisplayedinTableIIIfortheunconstrainedcase.Forbuild-out485level1,theamountsofwindpowerusedintheconstrainedgridcase,asapercentageofthetotal486amountavailableineachseason,arecomparabletothoseintheunconstrainedcase;andsoarethe487percentagesofdemandthataresatisfiedbyelectricitygeneratedfromoffshorewind.Thismeansthat488theinjectionoftheserelativelymodestamountsofoffshorewindpower(between2.4and4.0%oftotal489demand,dependingontheseason)donotexceedthetransmissiongridcapacities.Thegeneration490shortfallobservedatthislevelcanbeeasilytakencareofbytheadditionofsomesynchronizedramp-up491anddownreserves;theaveragepeakgenerationshortfall,whenthereisanyshortfall,depictedinTable492VI,offersgoodinitialestimatesofwhatthesereservesshouldbe.493
Movingtobuild-outlevels2andbeyond,offshorewindpowerbecomesseverelycurtailedbythe494currentgridcapacityconstraints,asindicatedbythepercentageofusedwind,whichdropstobetween49537.8and60.7%,asopposedtothe86.9to93.4%rangeobservedintheunconstrainedcase.Thisissue496canonlyberesolvedbyanupgradeintheonshoretransmissionlines,particularlyinthecoastalareas.497Therefore,installingoffshorewindcapacityof25.3GW(level2)ormore,withoutupgradingthePJM498transmissiongrid,wouldnotallowintegrationorefficientuseoftheselargeoffshorewindbuild-out499levels.500
Notealsothat,particularlyforbuild-outlevels2and3,thelikelihoodthattherewillbegeneration501shortfallissmallerthanwhatwasobservedfortheunconstrainedgridcase(TableIII).Thisisduetothe502factthatlessoffshorewindpowerisbeingusedintheconstrainedcase,asaresultofthewindpower503curtailmentinducedbythegridcapacityconstraints.504
Finally,Figure12showsplotswiththepercentageofusedwindobtainedusingtheHVDCbackboneand505theACradialconnectionstolinktheoffshorewindfarmswiththeonshorePJMgrid.ACradial506connectionswillcausesignificantlymorespillingofoffshorewindpower(about20%moreforbuild-out507level1)thananHVDCbackboneconnection.508
509

PapersubmittedtoRenewableEnergy 2016-03-10
22
TableVI:SameasinTableIIIbutfortheconstrainedPJMgridwithanHVDCbackboneconnection.510
Build-outLevel
InstalledCapacity(GW)
Month-Year
GenerationfromOffshore
Wind(%)
UsedWind(%)
LikelihoodThereWillBeGenerationShortfallatSomeTimeDuringOne
Week(%)
AveragePeakGenerationShortfall(GW),WhenThereIs
AnyShortfall
1 7.3
Jan-10 4.1 91.3 47.6 0.7Apr-10 4.0 79.1 9.5 0.4Jul-10 2.4 97.1 52.4 2.2Oct-10 4.2 81.2 0.0 0
2 25.3
Jan-10 6.8 43.7 47.6 1.0Apr-10 7.4 43.2 28.6 1.3Jul-10 5.0 60.7 100.0 3.3Oct-10 6.7 37.8 33.3 0.6
3 35.8
Jan-10 7.2 32.5 57.1 0.8Apr-10 8.0 32.6 38.1 1.0Jul-10 5.7 46.9 100.0 3.9Oct-10 7.2 28.7 52.4 0.9
511
a) b)
c) d)
Figure12PercentagesofusedwindwithHVDC-backboneversusAC-radialoffshoreconnections.512
0"
20"
40"
60"
80"
100"
0" 10" 20" 30" 40"
Used"wind"as"%"of"available"wind"
Build9out"level"(GW)"
Percent"of"Used"Wind"9"Comparing"Offshore"ConnecIons"9"January"2010"
HVDC"Backbone"
AC"Radial"
0"
20"
40"
60"
80"
100"
0" 10" 20" 30" 40"
Used"wind"as"%"of"available"wind"
Build9out"level"(GW)"
Percent"of"Used"Wind"9"Comparing"Offshore"ConnecIons"9"April"2010"
HVDC"Backbone"
AC"Radial"
0"
20"
40"
60"
80"
100"
0" 10" 20" 30" 40"
Used"wind"as"%"of"available"wind"
Build9out"level"(GW)"
Percent"of"Used"Wind"9"Comparing"Offshore"ConnecIons"9"July"2010"
HVDC"Backbone"
AC"Radial"
0"
20"
40"
60"
80"
100"
0" 10" 20" 30" 40"
Used"wind"as"%"of"available"wind"
Build9out"level"(GW)"
Percent"of"Used"Wind"9"Comparing"Offshore"ConnecIons"9"October"2010"
HVDC"Backbone"
AC"Radial"

PapersubmittedtoRenewableEnergy 2016-03-10
23
5 Conclusions513
ThispapershowedthatincreasingamountsofoffshorewindgenerationfromtheMid-Atlanticsection514oftheU.S.canbeintegratedintothePJMmarket,uptoacertainlevel,providedthatadditional515synchronizedreservesbesecuredandthatthetransmissionlinesbeupgraded(orashereinpresented,516thatthegridbeunconstrained).Furthermore,itisalsoshownthatimprovementsinthequalityofthe517windpowerforecastsusedforbothday-aheadandintermediate-termunitcommitmentplanninghave518thepotentialtoenabletheintegrationoflargeramountsofoffshorewindpower,withlessamountsof519requiredadditionalreserves.520
Constrainedbythecurrentcapacitiesoftheonshoretransmissiongrid,inthePJMmarket,itwasfound521that:522
1. Uptoabout7.3GWofinstalledoffshorewindcapacity(build-outlevel1)couldbeintegrated,523withrequiredadditionalsynchronizedramp-upanddownreservesbetween1and2GWinthe524peaksummerperiod.525
2. Windpowercurtailmentwouldrangefrom3to21%,onaverageoveraseason,dependingon526theseasonoftheyear.527
3. UsingACradialconnectionstolinktheoffshorefarmstotheonshoregrid,insteadofanHVDC528backboneconnection,wouldcauseanadditionalwindpowercurtailmentontheorderof20%.529
Assumingthattheonshoretransmissiongridwereappropriatelyupgradedbyincreasingthecapacities530ofsomelines,inthePJMmarketitwasfoundthat:531
1. Uptoabout35.8GWofinstalledoffshorewindcapacity(build-outlevel3)couldbeintegrated,532withrequiredadditionalreservesofabout8GWinthepeaksummerperiod(between3and6533GWintheotherperiods).Thesereservesrangefrom10toover20percentoftheinstalledwind534generationcapacityatbuild-outlevel3.535
2. Inthisscenario,offshorewindpowerwouldsatisfyabout11%oftheloadsinthesummerand536anaverageof18%intheotherseasonsoftheyear.537
3. Windcurtailmentwouldrangefrom10to33%,onaverageoveraperiod,dependingonthe538periodoftheyear.539
Intheidealizedcaseofhavingaccesstoperfectwindpowerforecasts(thatis,forecastsexactlyequalto540theobservedwindpower),thesystemwouldbeabletohandleupto69.7GWofinstalledoffshorewind541capacity(satisfying16%ofdemandinthesummer,andanaverageof30%intheotherseasons).It542shouldbealsonotedthatwindcurtailmentmightbereducedinthefuturethroughtheadditionofsolar543powerintothegenerationmixintheappropriateamount(Andresenetat.2014).544
Finally,evenwiththeadditionofsignificantamountsofsynchronizedramp-upanddownreserves,it545wasshownthatintegratingincreasingamountsofoffshorewindpowerwill,inmostcases,progressively546lowerthenetwork-averagedsettlementpriceofoperatingthePJMmarket,aswellasconsistently547decreasetheemissionsofthethreemostimportantairpollutantsassociatedwiththeburningoffossil548

PapersubmittedtoRenewableEnergy 2016-03-10
24
fuels.Morespecifically,intheaforementionedcaseofintegratingoffshorewindpoweratbuild-out549level3,withadditionalreservesofupto8GWandanunconstrainedonshoretransmissiongrid:550
• Settlementpricescouldbereducedbyupto24%;551• CO2emissions,between19and40%;552• SO2emissions,between21and43%;and553• NOxemissions,between13and37%.554
TheauthorsbelievethatSMART-ISOrepresents,asofthiswriting,anaccuratereproductionofPJM’s555dispatchplanningprocess,withcarefulattentiongiventothemodelingofthevariabilityanduncertainty556ofwind.Ofcourse,anymodel,orsetofsimulations,requiresassumptionsandapproximations.The557mostsignificantassumption,intheauthors’view,isthefocusonusingexistingplanningandforecasting558processes,aswellasbothexistinggenerationtechnologyandthecurrentfleetofgenerators.Thework559describedinthispaperoffersagoodplatformtoundertakestudiesthatcapturetheeffectsofchanges560tothisplanningprocessandofimprovedforecasting,inadditiontoinvestmentsinexistingandnew561technologies.562
6 Bibliography563
Andresen,G.B.,R.A.Rodriguez,S.Becker,andM.Greiner,2014:Thepotentialforarbitrageofwindand564solarsurpluspowerinDenmark.Energy,76,pp.49-58.565
Archer,C.,H.Simão,W.Kempton,W.Powell,andM.Dvorak,2016:Thechallengeofintegrating566offshorewindpowerintheU.S.electricgrid.PartI:Windforecasterror.SubmittedtoRenewable567Energy.568
Birge,J.R.,andF.Louveaux,2011:IntroductiontoStochasticProgramming(2nded.).Springer,New569York,485pp.570
Hedman,K.W.,R.P.O'Neill,E.B.Fischer,andS.S.Oren,2011:Smartflexiblejust-in-timetransmission571andflowgatebidding.IEEETransactionsonPowerSystems,26(1),pp.93-102.572
MonitoringAnalytics,2011:2010StateoftheMarketReportforPJM.Availableat:573http://www.monitoringanalytics.com/reports/PJM_State_of_the_Market/2010.shtml,retrievedJuly9,5742014.575
MonitoringAnalytics,2012:2011StateoftheMarketReportforPJM.Availableat:576http://www.monitoringanalytics.com/reports/PJM_State_of_the_Market/2011.shtml,retrievedJuly9,5772014578
MonitorAnalytics,2013:2012StateoftheMarketReportforPJM.Availableat579http://www.monitoringanalytics.com/reports/PJM_State_of_the_Market/2012.shtml,retrievedJuly9,5802014.581
PapersubmittedtoRenewableEnergy 2016-03-10
25
MonitorAnalytics,2014:2013StateoftheMarketReportforPJM.Availableat582http://www.monitoringanalytics.com/reports/PJM_State_of_the_Market/2013.shtml,retrievedJuly7,5832014.584
Overbye,T.J.,X.Cheng,&Y.Sun,2004:AcomparisonoftheACandDCpowerflowmodelsforLMP585calculations.Proceedingsofthe37thHawaiiInternationalConferenceonSystemsSciences.BigIsland,HI,586USA,IEEEComputerSocietyPress.587
PJMInterconnection,2014:PJM101-TheBasics.Availableat588http://pjm.com/Globals/Training/Courses/ol-pjm-101.aspx,retrievedJuly8,2014.589
PJMInterconnection,2014:WhoWeAre.Availableathttp://www.pjm.com/about-pjm/who-we-590are.aspx,RetrievedJuly7,2014.591
Ryan,S.,R.J.-B.Wets,D.L.Woodruff,C.Silva-Monroy,andJ.Watson,2013:Towardscalable,parallel592progressivehedgingforstochasticunitcommitment.PowerandEnergySocietyGeneralMeeting(PES),5931-5.594
Stott,B.,J.Jardim,andO.Alsac,2009:DCpowerflowrevisited.IEEETransactionsonPowerSystems,59524(3),1290-1300.596
Takriti,S.,J.Birge,andE.Long,1996:Astochasticmodelfortheunitcommitmentmodel.IEEE597TransactionsonPowerSystems,11(3),1497-1508.598
599