‘the challenges facing rural communities’ - oireachtas · ‘the challenges facing rural...
TRANSCRIPT
‘The challenges facing rural communities’
David Meredith, Teagasc
Address to Oireachtas Joint Committee on Arts, Heritage, Regional, Rural and Gaeltacht
Affairs, November 23rd 2016
Teagasc’s Role
Teagasc is the national body providing integrated research, advisory and training services to the
agriculture and food industry and rural communities. Teagasc has a long history of undertaking rural
policy research that has focused on both the farm and the broader rural economy. This perspective
is informed by the strengthening of the links between farm households and the off-farm economy
and the importance of these links in sustaining farm households:
37% of farms were economically viable: Family farm income is sufficient to cover
family labour (remunerated at the agricultural wage rate) and provide a 5% return
on non-land assets.
The Mideast and Southeast regions contain the greatest proportion of viable
farms in the country with 55% and 52% of farms viable in each region
respectively.
The border and west regions have the poorest viability ratings with just 18%
and 27% of farms viable in the respective regions.
29% of farms were economically sustainable: Farm is not economically viable (refer
to definition below) but farmer and/or spouse has an off-farm job.
34% of farms were economically vulnerable: Farm is not viable and neither farmer
nor spouse has an off-farm job
(Teagasc National Farm Survey, 2015)
The NFS analysis of farm viability concluded that the presence of off-farm employment improves the
economic situation of farm households in most regions and it was established that 50% of farm
households had an off-farm income in 2015, down from 59% in 2006. Off-farm employment is most
prevalent in the West where 46% farm holders worked off farm in 2015. It is least common in the
Southwest where 22% of farmers worked off farm. Regional variation in off-farm employment
reflects, amongst other issues, the variation in the viability of farm enterprises, e.g. there are many
small drystock farms in the north and west whilst there are a greater number of dairy and tillage
farms, which tend to be economically viable, in the south and east.
In light of the slow pace of change in farm structures that can improve farm viability and
profitability, there is a need amongst farm households for additional income which can be secured
either through development of additional on-farm enterprises or engagement in off-farm
employment. Whilst there are a growing number of farms with a diversified enterprise, this is not for

everyone. Research undertaken in 2011-2012 established that 63% of farmers were not interested in
the development of a diversified enterprise. It was found that respondents thought that they did not
have the requisite resources, skills or training to successfully develop a diversified enterprise. The
same research established that 58% expressed a preference for off-farm employment; this figure
was substantially higher amongst those with a dry stock enterprise which are concentrated in the
north, west and upland areas.
It is against this backdrop that Teagasc has maintained a rural development research programme
that currently consists of a number of research projects exploring issues of human capacity
development in rural areas, the factors supporting resilience amongst farm and non-farm
households and assessment of contemporary socio-economic trends affecting rural communities.
The latter work formed the basis of the research presented in the report of the CEDRA, the
development of the pilot Rural Economic Development Zone initiative and the Action Plan for Rural
Areas and is the basis of the evidence presented below. This focuses on using available Census of
Population data to provide:
1. An update on changes to the rural population and associated settlement patterns
2. An overview of population trends for the period 1996 – 2016 in different types of rural area
3. Identification of areas experiencing aggregate rural population decline
The statement concludes by considering the impacts and implications of three ‘drivers’ of rural
change and the challenges they present to some rural communities.
Population and Settlement
With the publication of preliminary results from the Census of Population 2016 it is opportune to use
these data to provide an assessment of the current status of the rural population and to provide an
assessment of changes over the past 20 years.
Results of the Census of Population 2016 estimate the national population to be 4,757,976
persons, an increase of 3.7% since 2006.
This result is remarkable in light of the annual average outward migration of 5,712 for the
period 2011 – 2016.
There is wide geographic variation in population change with some areas experiencing
population growth whilst others experienced population decline.
o The cities of Cork, Dublin, Galway, Limerick and Waterford experienced an increase
of 4.7% whilst the population of 40% of all Electoral Divisions (EDs) fell; most of
these EDs are located in rural areas.
Excluding the population living within the official boundaries of the cities, the rest of the
country recorded a population increase of 3.48% or 130,954.
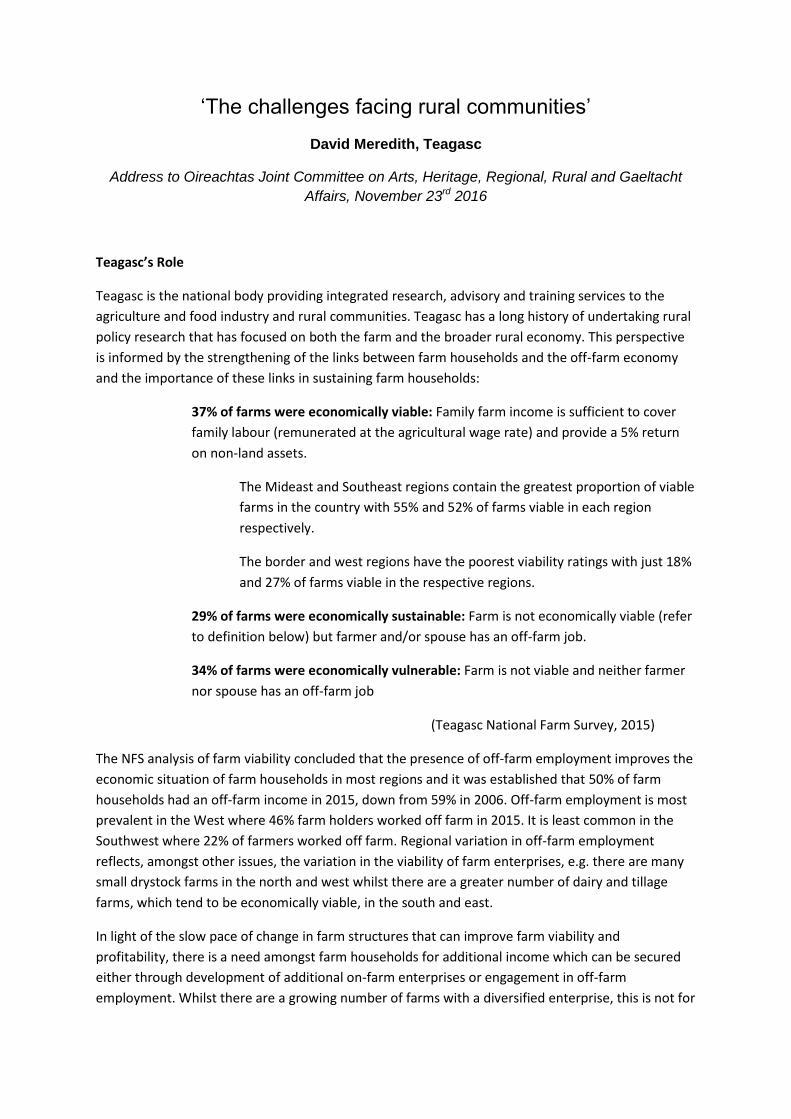
Mapping changes in the population at the scale of the ED indicates that EDs close to larger
towns and the cities recorded population growth whilst those distant from or inaccessible to
these places have, in general, witnessed population decline (Figure 1).
o This is in keeping with past trends.
o The significance of major roads on settlement patterns and, consequently,
population density is evident throughout the country.
o Exceptions to the urban centric pattern of higher population concentrations are,
generally found in coastal areas, e.g. along the Clare and Donegal coastlines.
Figure 1 Spatial distribution of the population (2016)
Assessing changes in rural settlement patterns and populations 1996 - 2016
In light of the variation in the distribution of the population it is necessary to distinguish between a
number of different types of rural area. This moves us beyond a simple and simplistic classification of
space in terms of being either rural or urban and into a more nuanced view of different types of rural
area. Whilst there are many ways of identifying different types of rural areas, see Copus et al.
(2008)1 a relatively simple approach is adopted here which assigns individual EDs to one of six
groups based on analysis of their population density2. This approach is taken as it allows individual
EDs to be classified and consequently facilitates more detailed assessment of the spatial variation of
population change3.
Table 1 Categories used to group Electoral Divisions by population density
Population Density (Persons per Km2)
Low density rural areas <13
Below average rural population II 13 - 21
Below average rural population I 22 - 29
Above average rural population density I 30 - 43
Above average rural population density II 44 - 73
High density rural areas 74 - 149
Urban EDs 150+
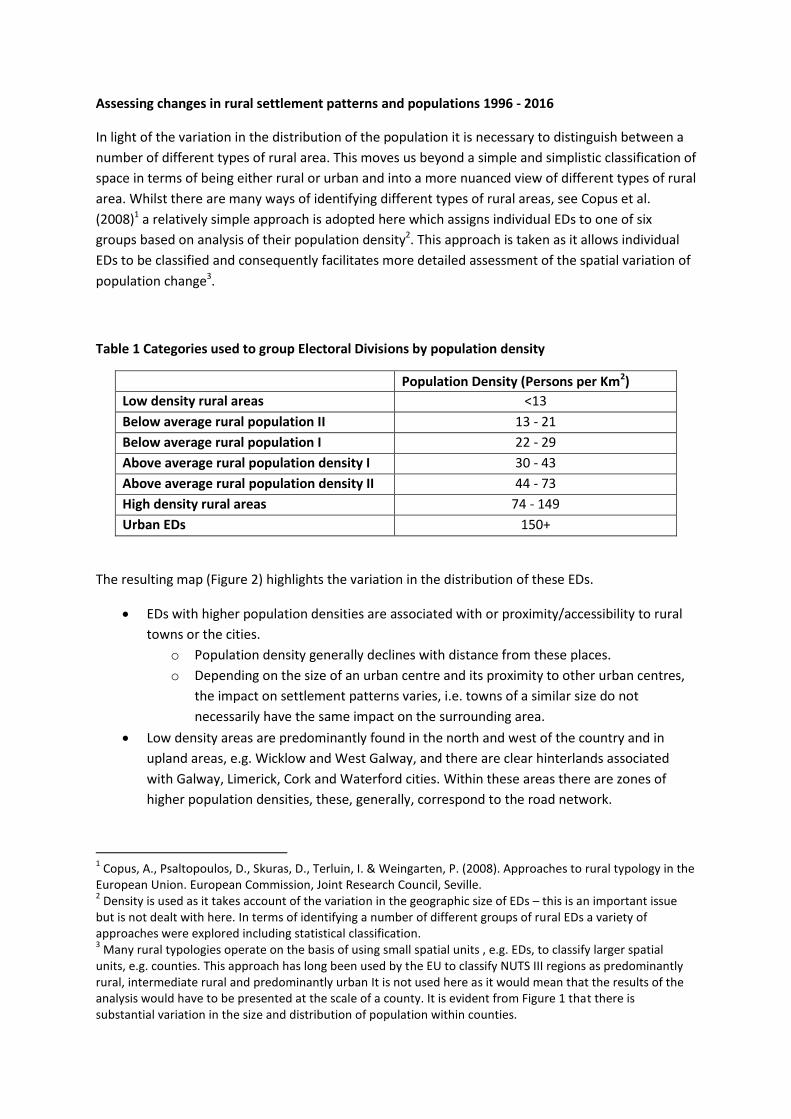
The resulting map (Figure 2) highlights the variation in the distribution of these EDs.
EDs with higher population densities are associated with or proximity/accessibility to rural
towns or the cities.
o Population density generally declines with distance from these places.
o Depending on the size of an urban centre and its proximity to other urban centres,
the impact on settlement patterns varies, i.e. towns of a similar size do not
necessarily have the same impact on the surrounding area.
Low density areas are predominantly found in the north and west of the country and in
upland areas, e.g. Wicklow and West Galway, and there are clear hinterlands associated
with Galway, Limerick, Cork and Waterford cities. Within these areas there are zones of
higher population densities, these, generally, correspond to the road network.
1 Copus, A., Psaltopoulos, D., Skuras, D., Terluin, I. & Weingarten, P. (2008). Approaches to rural typology in the
European Union. European Commission, Joint Research Council, Seville. 2 Density is used as it takes account of the variation in the geographic size of EDs – this is an important issue
but is not dealt with here. In terms of identifying a number of different groups of rural EDs a variety of approaches were explored including statistical classification. 3 Many rural typologies operate on the basis of using small spatial units , e.g. EDs, to classify larger spatial
units, e.g. counties. This approach has long been used by the EU to classify NUTS III regions as predominantly rural, intermediate rural and predominantly urban It is not used here as it would mean that the results of the analysis would have to be presented at the scale of a county. It is evident from Figure 1 that there is substantial variation in the size and distribution of population within counties.
The Dublin city hinterland appears to be geographically extensive extending from the
border with Northern Ireland to Wexford. It is important to note that this zone comprises
multiple towns each of which has its own hinterland but that these overlap each other to
varying degrees and within these hinterlands are substantial rural communities.
Figure 2 Assessment of rural population density
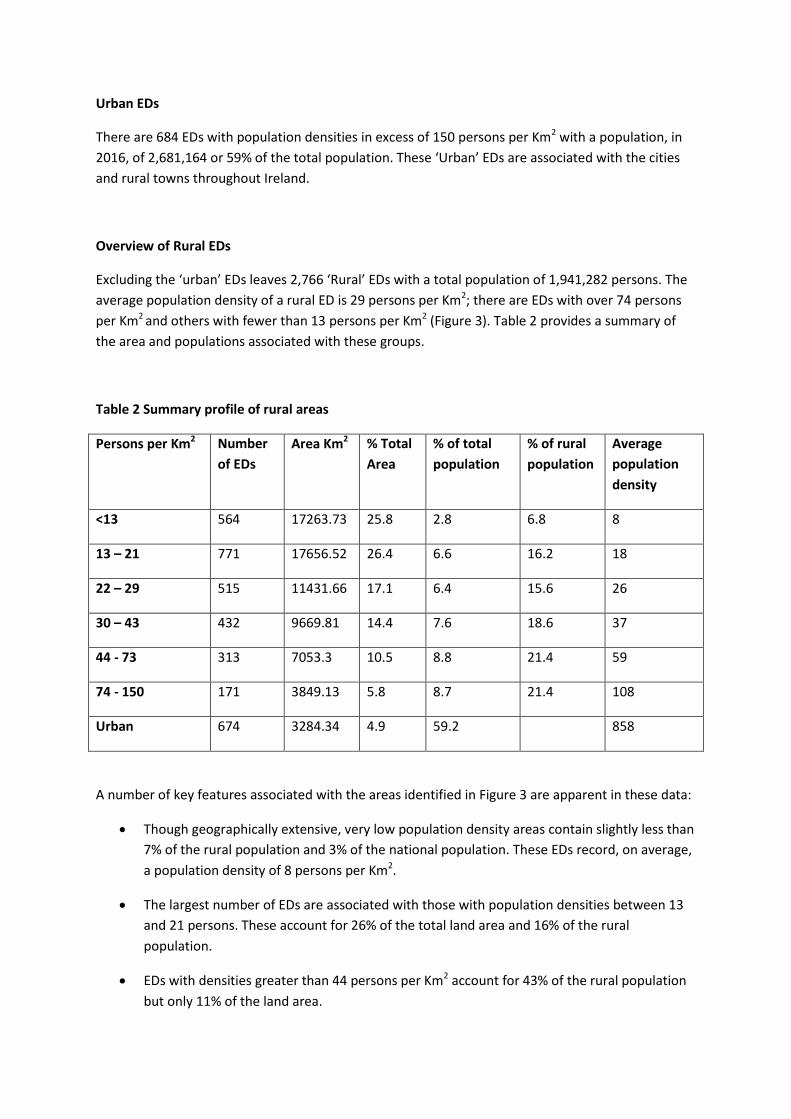
Urban EDs
There are 684 EDs with population densities in excess of 150 persons per Km2 with a population, in
2016, of 2,681,164 or 59% of the total population. These ‘Urban’ EDs are associated with the cities
and rural towns throughout Ireland.
Overview of Rural EDs
Excluding the ‘urban’ EDs leaves 2,766 ‘Rural’ EDs with a total population of 1,941,282 persons. The
average population density of a rural ED is 29 persons per Km2; there are EDs with over 74 persons
per Km2 and others with fewer than 13 persons per Km2 (Figure 3). Table 2 provides a summary of
the area and populations associated with these groups.
Table 2 Summary profile of rural areas
Persons per Km2 Number
of EDs
Area Km2 % Total
Area
% of total
population
% of rural
population
Average
population
density
<13 564 17263.73 25.8 2.8 6.8 8
13 – 21 771 17656.52 26.4 6.6 16.2 18
22 – 29 515 11431.66 17.1 6.4 15.6 26
30 – 43 432 9669.81 14.4 7.6 18.6 37
44 - 73 313 7053.3 10.5 8.8 21.4 59
74 - 150 171 3849.13 5.8 8.7 21.4 108
Urban 674 3284.34 4.9 59.2 858
A number of key features associated with the areas identified in Figure 3 are apparent in these data:
Though geographically extensive, very low population density areas contain slightly less than
7% of the rural population and 3% of the national population. These EDs record, on average,
a population density of 8 persons per Km2.
The largest number of EDs are associated with those with population densities between 13
and 21 persons. These account for 26% of the total land area and 16% of the rural
population.
EDs with densities greater than 44 persons per Km2 account for 43% of the rural population
but only 11% of the land area.

Assessment of Population Trends
Between 1996 and 2016 Ireland’s population grew by 1,131,863 persons; 61% of this growth
was concentrated within urban areas.
Excluding the population living within the official boundaries of the cities, the rest of the
country recorded a population increase of 3.48% or 130,954 between 2011 – 2016.
Population change is highly uneven, some areas have grown substantially whilst others
have lost population.
Higher density areas have grown faster than other areas. EDs with between 44 and 150
persons per Km2 experienced substantial population growth (Figure 4). As a
consequence, the share of the rural population living in these EDs has grown relative to
other areas (Figure 5).
o The growth of larger urban centres accounts for these development. Urban
growth and its impacts on surrounding areas is a consequence of interactions
between the location of jobs, the property market and the planning system.
With the exception of very low density areas, each group of EDs has experienced a
substantial increase in population (Figure 6).
EDs with a population density greater than 44 persons per Km2 have consistently
outperformed the rural population growth rate for each inter-censal period whilst those
with a density less than 29 persons per Km2 have consistently underperformed.
Figure 3 Population Trends 1986 – 2016
0
50,000
100,000
150,000
200,000
250,000
300,000
350,000
400,000
450,000
1991 1996 2002 2006 2011 2016
Nu
mb
er o
f P
ers
on
s <13
13 - 21
22 - 29
30 - 43
44 - 73
74 - 150
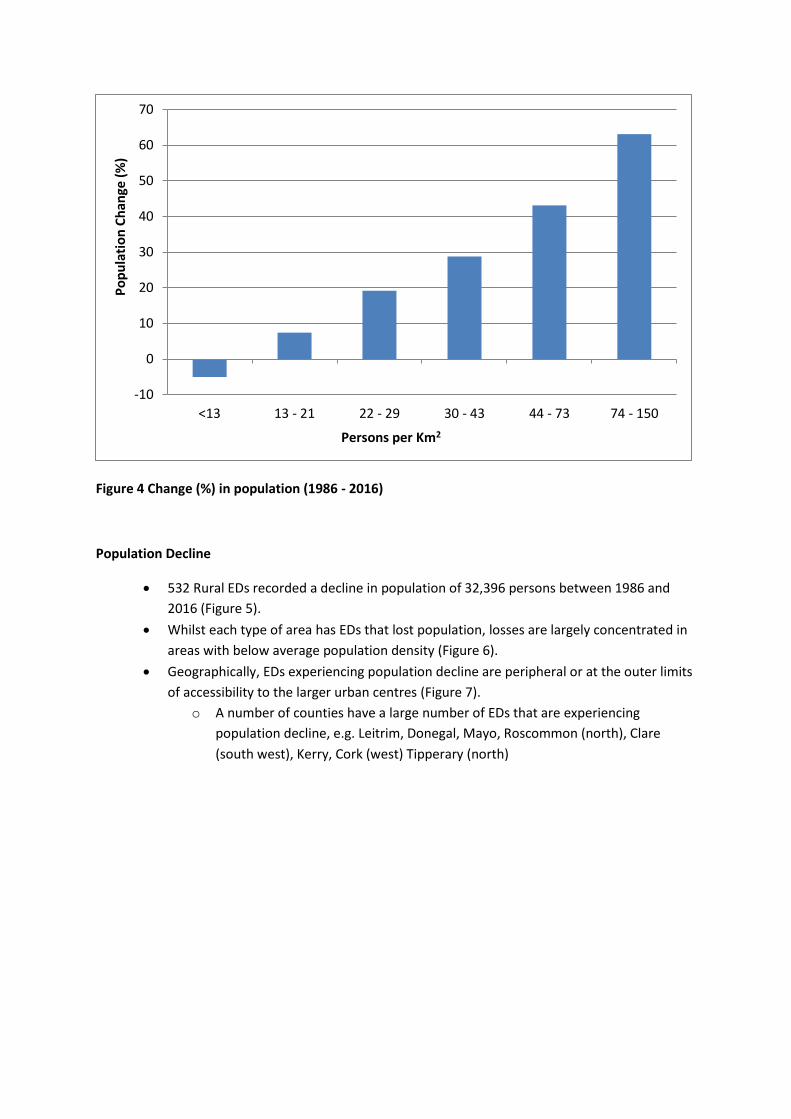
Figure 4 Change (%) in population (1986 - 2016)
Population Decline
532 Rural EDs recorded a decline in population of 32,396 persons between 1986 and
2016 (Figure 5).
Whilst each type of area has EDs that lost population, losses are largely concentrated in
areas with below average population density (Figure 6).
Geographically, EDs experiencing population decline are peripheral or at the outer limits
of accessibility to the larger urban centres (Figure 7).
o A number of counties have a large number of EDs that are experiencing
population decline, e.g. Leitrim, Donegal, Mayo, Roscommon (north), Clare
(south west), Kerry, Cork (west) Tipperary (north)
-10
0
10
20
30
40
50
60
70
<13 13 - 21 22 - 29 30 - 43 44 - 73 74 - 150
Po
pu
lati
on
Ch
ange
(%
)
Persons per Km2
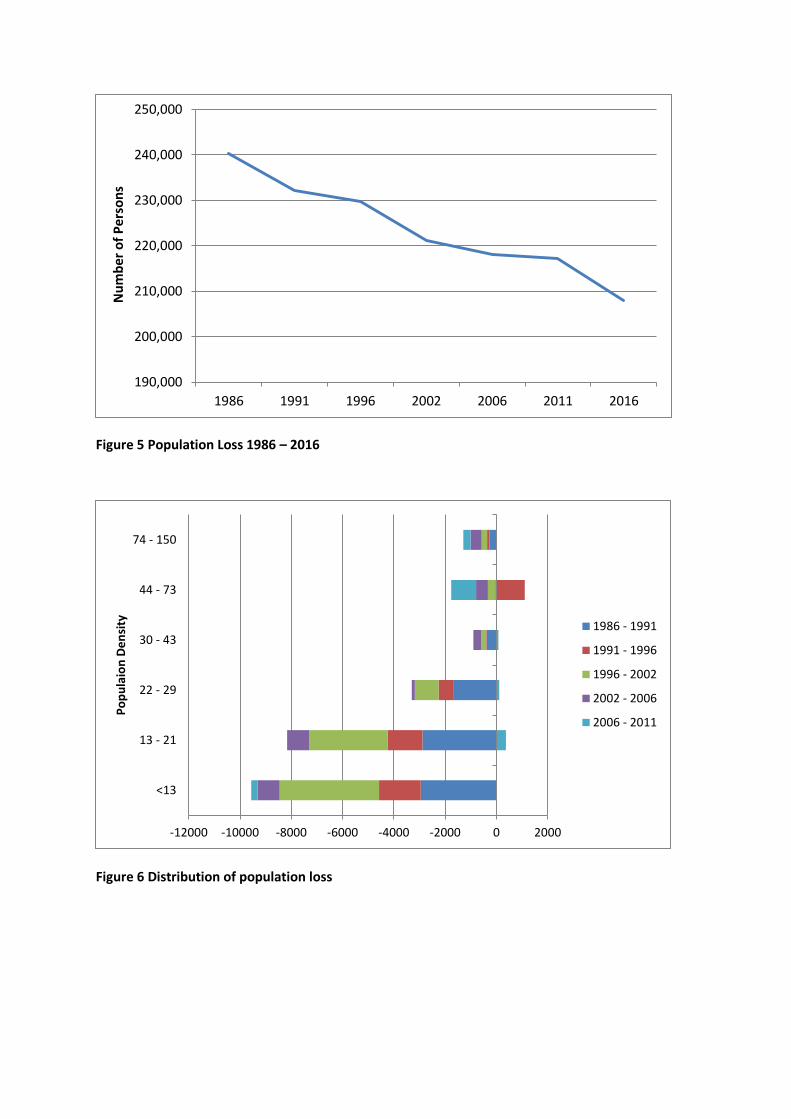
Figure 5 Population Loss 1986 – 2016
Figure 6 Distribution of population loss
190,000
200,000
210,000
220,000
230,000
240,000
250,000
1986 1991 1996 2002 2006 2011 2016
Nu
mb
er o
f P
ers
on
s
-12000 -10000 -8000 -6000 -4000 -2000 0 2000
<13
13 - 21
22 - 29
30 - 43
44 - 73
74 - 150
Po
pu
laio
n D
en
sity
1986 - 1991
1991 - 1996
1996 - 2002
2002 - 2006
2006 - 2011
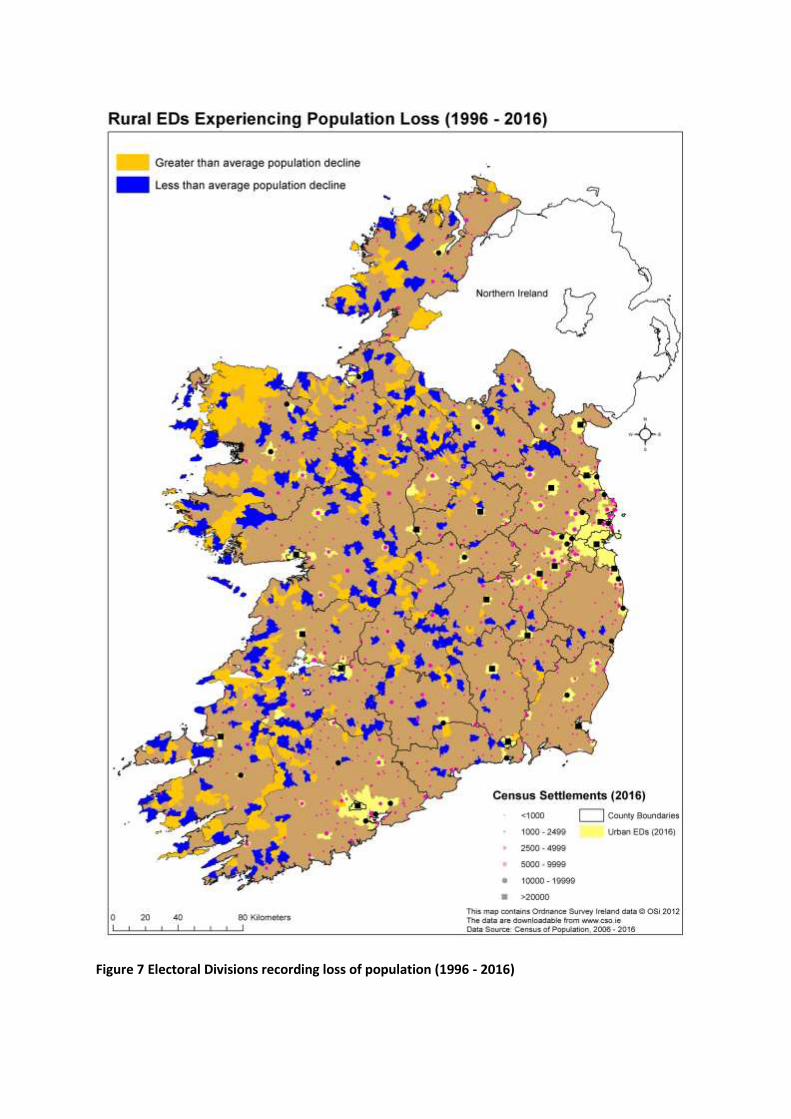
Figure 7 Electoral Divisions recording loss of population (1996 - 2016)
Understanding the wider context to contemporary rural population change in Ireland
Whilst the evolution of the economy has resulted in a number of changes including alteration of the
industrial structure of employment and shifts in the location of employment opportunities, these
processes have been accompanied by a number of social changes, i.e. the ‘massification’ of 3rd level
education, the feminisation of the workforce and the growth in the number of dual income
households. Each of these social developments have implications, which are outlined below, for the
development of rural areas and, consequently, the distribution of the rural population.
Massification of 3rd level education
The numbers progressing to 3rd level education in Ireland grew from roughly 22,000 to 165,000
between 1967 and 2013 (OLRS, 20134). Participation in higher education affects population
settlement patterns in two ways; firstly, the uneven spatial distribution of 3rd level institutions will,
for those students distant from such facilities, necessitate relocating where they live. This has the
effect of drawing young people out of rural areas. Secondly, on graduation, these individuals find
that their return to either their own community or some types of rural areas is limited due to the
absence of employment opportunities commensurate with their educational qualifications. Such
employment opportunities tend to be associated with growth sectors in the economy and these are
largely concentrated in or near urban centres. Whilst this pattern of rural – urban migration was
identified by Ni Laoire (2000) as particularly affecting women more recent research by Meredith and
Gilmartin (2014) established that younger men are increasingly migrating from rural areas. This is
thought to reflect the outcome of the recession, i.e. reduced employment opportunities for younger
males and greater engagement on the part of males with higher education.
Location of employment
The restructuring of the economy is driven by a range of global, national and local drivers of change
resulting in some industrial sectors declining, others stagnating and some growing. Whilst these
responses to change are experienced everywhere, the industrial composition of the rural economy,
with its high dependence on the primary sector, has exposed rural areas to the negative impacts of
these developments. Furthermore, mature industries such as those commonly found in rural areas,
4 OLRS. (2014) Higher education in Ireland: for economy and society? No.5. Oireachtas Library and Research
Service: Dublin.
generally do not create additional jobs as the adoption of technology enables them to maintain or
increase output without increasing the numbers employed.
Contemporary economic trends which see enterprises clustering together in order to take advantage
of agglomeration effects discourage some types of businesses locating in rural areas, e.g. financial
services and information technology. Research by Van Egeraat et al. (20125) highlighted the outcome
of this process in a regional analysis of employment opportunities; they identified an increasing level
of concentration of foreign firm employment in Dublin, Cork and Galway. In an update to this
research Van Egeraat and Kroes (20136) found that 78% of employment created by foreign firms
established in Ireland was located in Dublin and Cork whilst 71% of all jobs associated with new
foreign direct investment were concentrated in Co. Dublin. The conclusion to this research pointed
to the need to support the the indigenous sector as it offers the potential to counteract un-balanced
regional development.
Taken in combination, the decline or stagnation of employment in some sectors and the
concentration of new employment opportunities in larger towns and cities has resulted in relatively
fewer jobs located in rural areas. This is particularly true of those employment opportunities sought
by younger people or those with higher educational qualifications (Loxley, 20147). For some rural
areas that are distant from or less accessible to these the absence of jobs encourages out-migration
and discourages immigration of younger people; for others, particularly those rural areas close to
larger towns and cities, the concentration of employment in these places has resulted in substantial
population increases.
There are differences in the location of male and female employment opportunities; the jobs
typically engaged in by women are typically located in towns and cities. This contrasts with male
employment which is relatively more geographically dispersed between rural and urban areas. The
significance of these differences becomes evident when one considers the implications for dual
income households, the number of which has been growing in line with the feminisation of the
workforce.
5 Van Egeraat, C., Breathnach, P. and Curran, D. (2012) Gateways, hubs and regional specialisation in the NSS,
Administration, 60(3), 91-115. 6 van Egeraat, C. and Kroes, R. (2013) 70% of jobs created by new foreign firms in 2012 located in Dublin.
Ireland after NAMA blog https://irelandafternama.wordpress.com/2013/12/15/70-of-jobs-created-by-new-foreign-firms-in-2013-located-in-dublin/, Accessed 26-10-2016. 7 Loxley, A. (2014) “From Seaweed and Peat to Pills and Very Small Things: Knowledge Production and Higher
Education in the Irish Context” in Loxley, A., Seery, A. and Walsh, J. (eds) Higher Education in Ireland: Practices, Policies and Possibilities. Palgrave: Basingstoke (UK).
The dual income household
Female participation in the labour force increased from 32% to 54% between 1986 and 2011
reflecting the fact that the female labour force grew by 145% over the same period. This stands in
marked contrast to the male labour force; whilst it did grow by 33% (1986-2011) the participation
rate declined from 74% to 69%. The feminisation of the workforce has been described by Daly and
Clavero (2009, p.14) as “equivalent to something of a social revolution.” This process has a wide
variety of implications but chief amongst them is the residential choice of dual income households.
As noted above, employment opportunities for women are concentrated in towns and cities. Added
to this and for a variety of social, economic and cultural reasons women, on average, commute
shorter distances to work than their male counterparts. As a consequence, women in work tend to
live in or relatively close to towns and cities. This residential choice, for many, is taken in the context
of the household, i.e. it is not solely based on the travel-to-work needs of one member of a
household. Contemporary households need to be located in places where there is access to both
spouse’s workplaces. This is particularly true of households where the couple each have a 3rd level
qualification. These developments account for the fact that most people with a 3rd level qualification
live in or near a town or city and most dual income households live in the same places, i.e. they are
one and the same.
Concluding comments
The processes affecting rural populations are driven by underlying social developments. Parallel to
these are a set of economic developments that are, increasingly influenced by technological
developments. These are changing what is produced, where it is produced and who produces it and
giving rise to advanced interconnections between places. Whilst beneficial in terms of providing new
opportunities for development in rural areas they are also exposing these areas to powerful forces
of change over which the communities in these places have limited control. The capacity to respond
to these external development is, consequently, critical to determining their impact on rural
communities. In those places weakened by long run processes of population emigration this poses a
fundamental challenge. No less challenging is the process of accommodating and servicing the needs
of the growing populations in densely populated rural areas. These disparate challenges point to the
need for locally tailored responses to the challenges and opportunities presented by the processes
of rural socio-economic change.