the challenges of future iot waveforms
TRANSCRIPT

The challenges of future IoT
waveforms
CMT 2019
Michel Terré
Conservatoire National des Arts et Métiers
Paris, France
CNAM/CEDRIC/Laetitia

5G markets
eMBB
(Enhanced Mobile BroadBand)
URLLC
(Ultra Reliable Low Latency
Communications)
mMTC
(massive Machine Type
Communications)
Throughput > 10 Gbits/s
Battery Life > 10 years Latency < 1 ms
3GPP
release 13 (2016)
release 14 (2017)
release 15 (2018)
release 16 (2019)
release 17 (2020)

So many objectives
• Very High Throughput
• High Reliability and Low Latency
• Low Power Consumption
• Opportunistic Transmissions
• Unsynchronized Transmissions
• Idle Mode and Fast Wake Up
• Millimeter Waves
• Reconfigurable Antennas
• Indoor Localization
• Massive MIMO
• New Coding Scheme for short packets
• Non Orthogonal Multiple Access (NOMA)
• Pilot Free Synchronization
• Blind Channel Estimation
• …
5G waveform
• So many proposals !– CP-OFDM
– SC-OFDM
– f-OFDM
– BF-OFDM
– FMT
– WOLA
– UFMC
– GFDM
– FBMC-OQAM
– FFT-FBMC
- NB-IoT
- LTE-M
- LoRa
- SigFox
Overview
• A short review of mobile radio waveforms
• Short focus on WOLA, FBMC-OQAM and LoRa
• Some power amplification challenges
• Blind estimation

2G waveform
• GMSK (CPFSK ½ )
☺
– Constant Envelope
– Low side lobes
– Low cost technology
�
– Low spectral efficiency
(1bit/s/Hz)
P. Chevalier, F. Pipon, "New insights into optimal widely linear array receivers for the demodulation
of BPSK, MSK and GMSK signals corrupted by non circular interferences - Application to SAIC", IEEE
Trans. Signal Processing, Vol 54, N°3, pp. 870-883, March 2006.
900 900.5 901 901.5 902-100
-90
-80
-70
-60
-50
-40
-30
-20
-10
0
PS
D (
dB)
frequency (MHz)
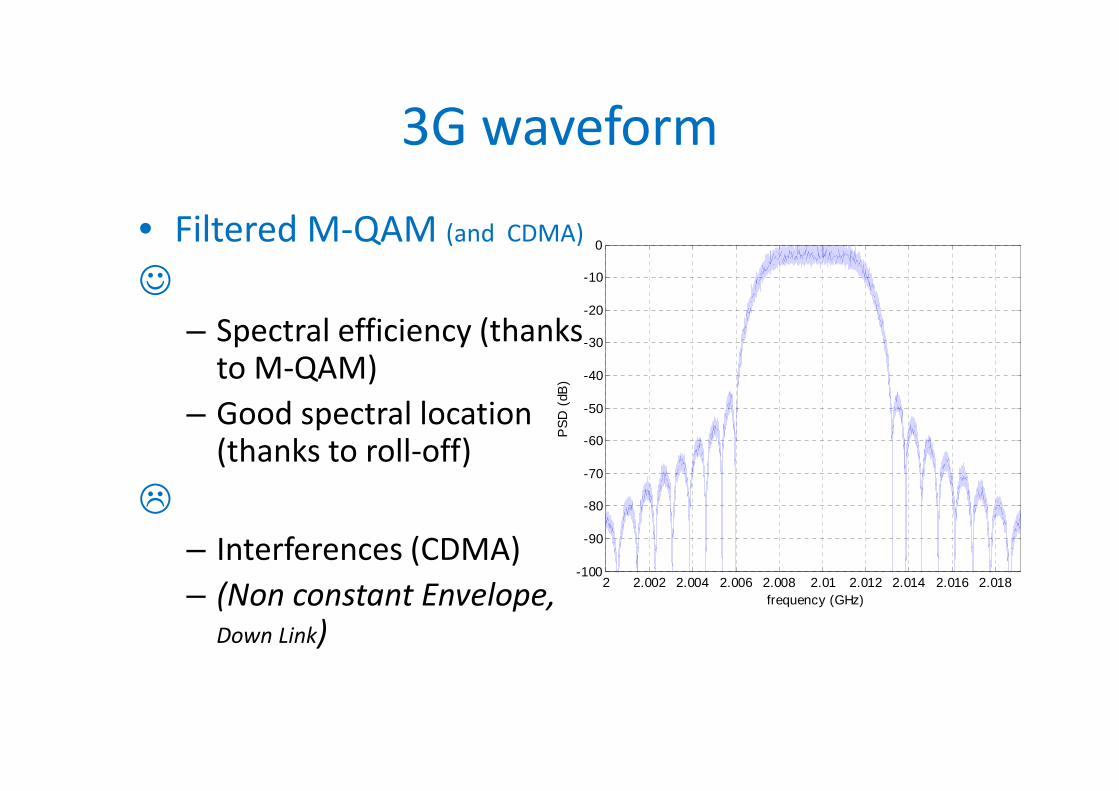
3G waveform
• Filtered M-QAM (and CDMA)
☺
– Spectral efficiency (thanks to M-QAM)
– Good spectral location (thanks to roll-off)
�
– Interferences (CDMA)
– (Non constant Envelope, Down Link)
2 2.002 2.004 2.006 2.008 2.01 2.012 2.014 2.016 2.018-100
-90
-80
-70
-60
-50
-40
-30
-20
-10
0
frequency (GHz)
PS
D (
dB)
2.4 2.402 2.404 2.406 2.408 2.41 2.412 2.414 2.416 2.418-100
-90
-80
-70
-60
-50
-40
-30
-20
-10
0
frequency (GHz)
PS
D (
dB)
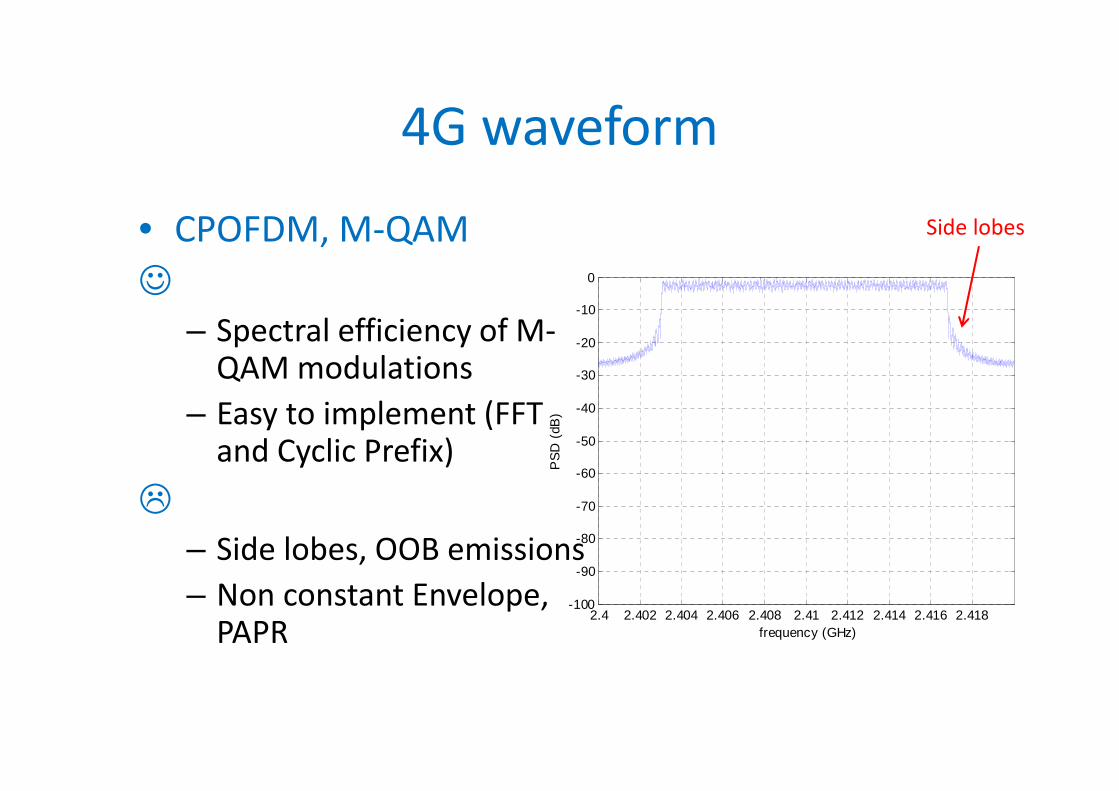
4G waveform
• CPOFDM, M-QAM
☺
– Spectral efficiency of M-QAM modulations
– Easy to implement (FFT and Cyclic Prefix)
�
– Side lobes, OOB emissions
– Non constant Envelope, PAPR
Side lobes

WOLA (Weighted OverLap and Add)

2.39 2.392 2.394 2.396 2.398 2.4 2.402 2.404 2.406 2.408 2.41
x 109
-100
-90
-80
-70
-60
-50
-40
-30
-20
-10
0
frequency (GHz)
PS
D (
dB)
WOLA
WOLA (Weighted OverLap and Add)
• WOLA OFDM, M-QAM
☺
– Reduced Side Lobes
– Spectral efficiency of
M-QAM modulations
– Easy to implement(FFT, Cyclic Prefix, Multiplication)
– Can be demodulated
by a CP-OFDM receiver
�
– Non constant Envelope,
PAPR
Reduced
Side lobes

WOLA (Weighted OverLap and Add)
Received with a CP-OFDM receiver
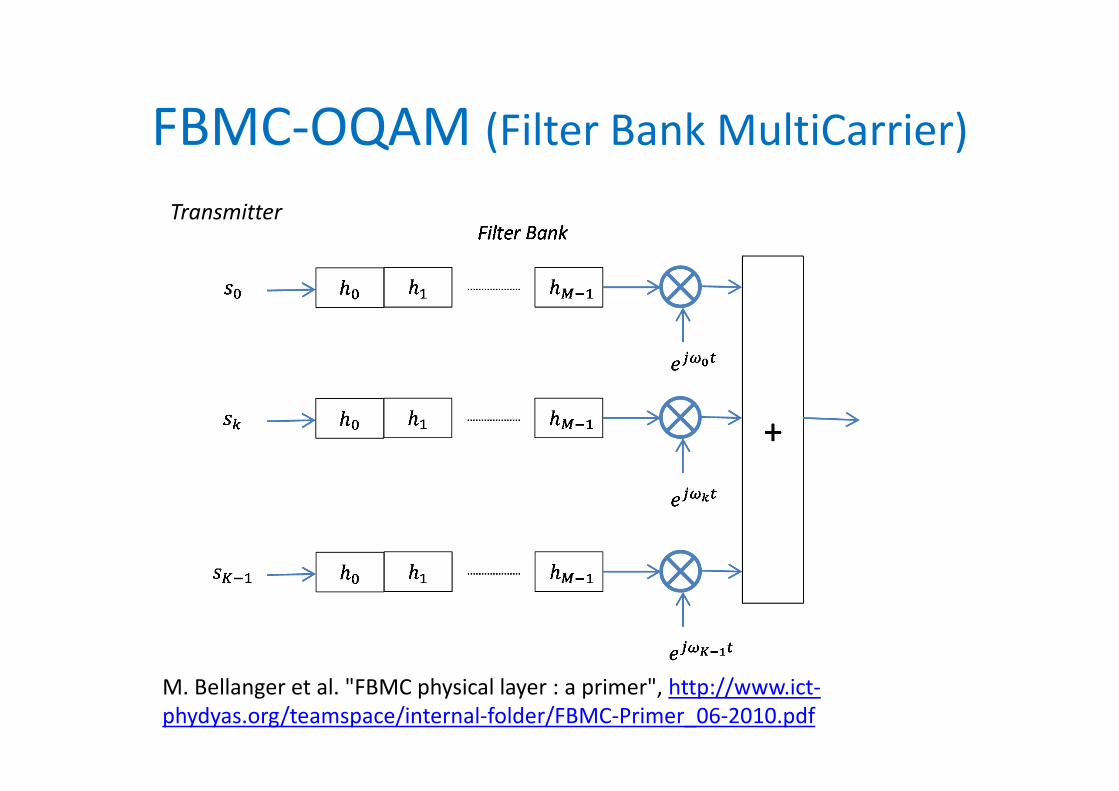
FBMC-OQAM (Filter Bank MultiCarrier)
Transmitter
M. Bellanger et al. "FBMC physical layer : a primer", http://www.ict-
phydyas.org/teamspace/internal-folder/FBMC-Primer_06-2010.pdf
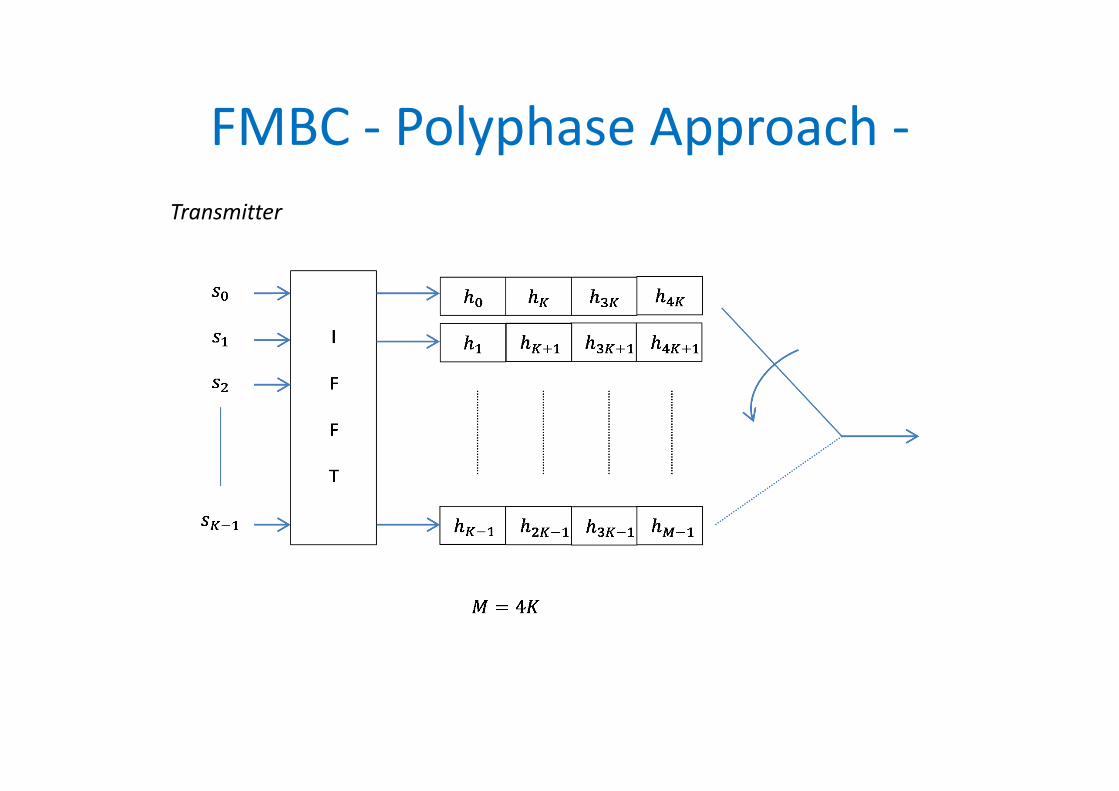
FMBC - Polyphase Approach -
Transmitter

FBMC – Polyphase Approach -
Receiver

FBMC-OQAM, Phydyas Filter
-2 -1.5 -1 -0.5 0 0.5 1 1.5 2-0.02
0
0.02
0.04
0.06
0.08
0.1
0.12
0.14
0.16
time
ampl
itude
Shape filter (Impulse response)
FBMC
OFDM
-4 -3 -2 -1 0 1 2 3 4
-60
-50
-40
-30
-20
-10
0
frequencypo
wer
(dB
)
Shape filter (Frequency response)
FBMC
OFDM
http://www.ict-phydyas.org/
�� = 0.971960� =
22
�� = 0,235147ℎ� = 1 − 2�����
��2� + 2����
��� − 2�����
3��2�

FBMC-OQAM (Filter Band MultiCarrier)

FBMC-OQAM (Receiver)
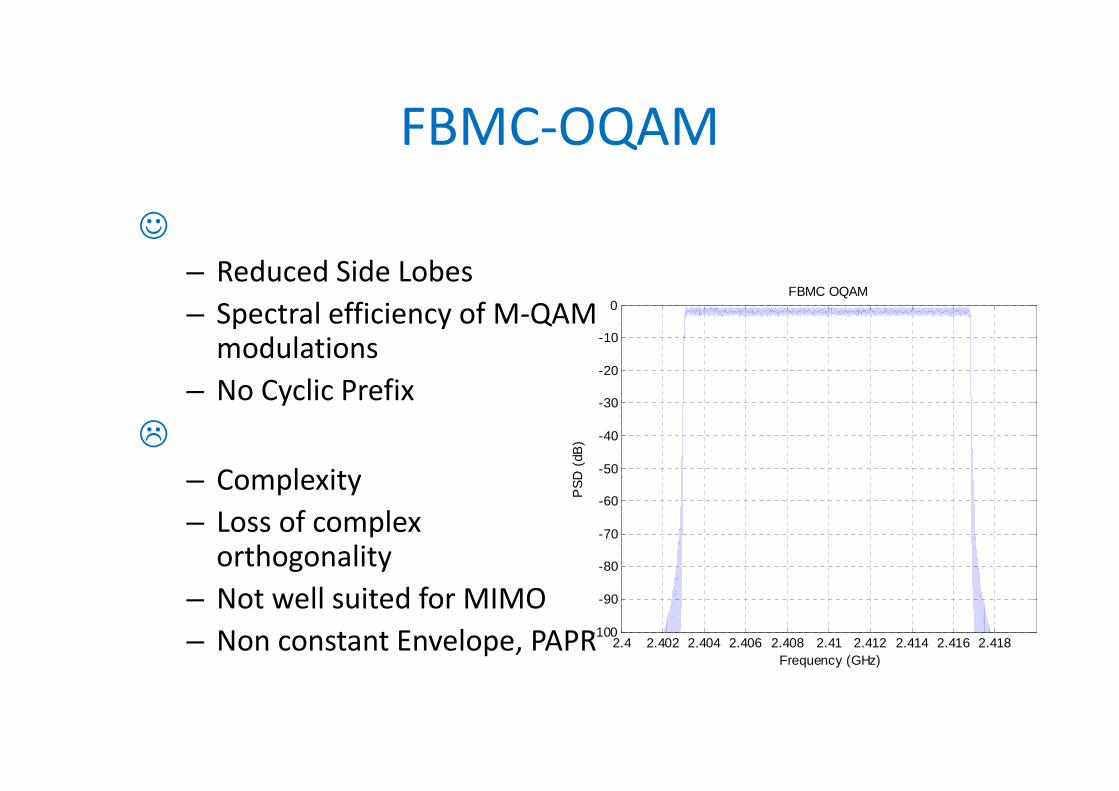
FBMC-OQAM
☺
– Reduced Side Lobes
– Spectral efficiency of M-QAM modulations
– No Cyclic Prefix
�
– Complexity
– Loss of complex orthogonality
– Not well suited for MIMO
– Non constant Envelope, PAPR 2.4 2.402 2.404 2.406 2.408 2.41 2.412 2.414 2.416 2.418-100
-90
-80
-70
-60
-50
-40
-30
-20
-10
0
Frequency (GHz)
PS
D (
dB)
FBMC OQAM
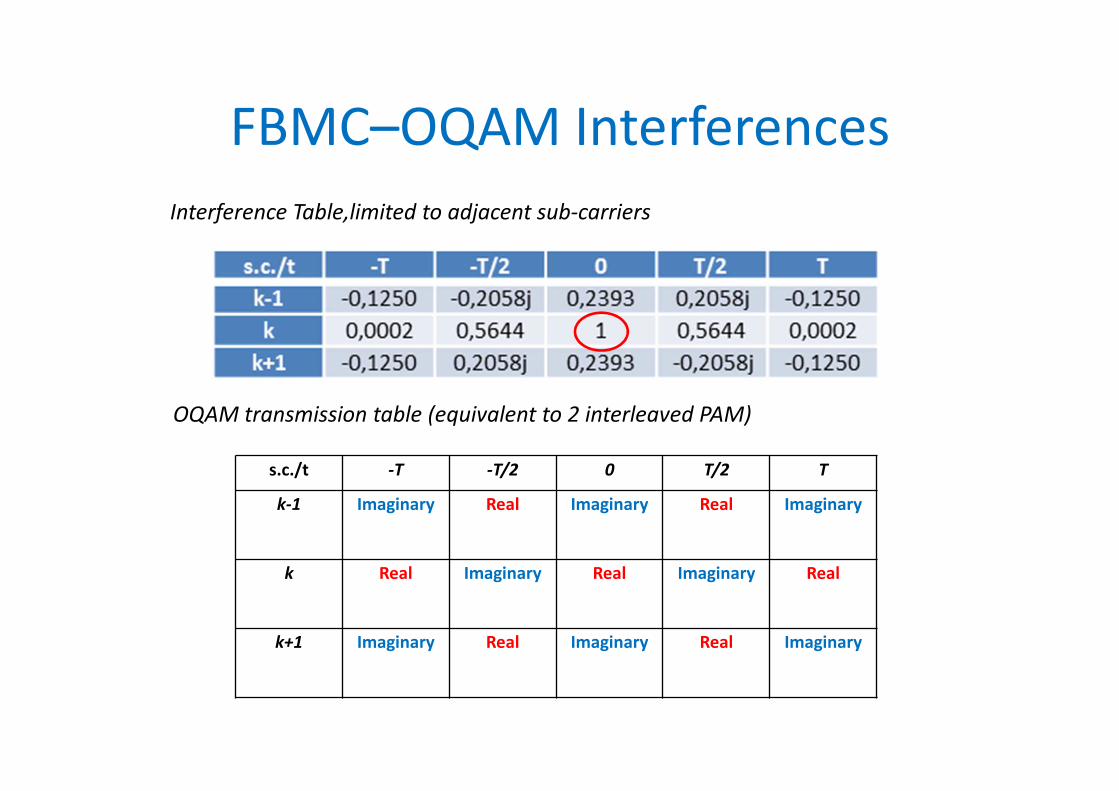
FBMC–OQAM Interferences
s.c./t -T -T/2 0 T/2 T
k-1 Imaginary Real Imaginary Real Imaginary
k Real Imaginary Real Imaginary Real
k+1 Imaginary Real Imaginary Real Imaginary
Interference Table,limited to adjacent sub-carriers
OQAM transmission table (equivalent to 2 interleaved PAM)

Received 16-OQAM Constellation
-8 -6 -4 -2 0 2 4 6 8-8
-6
-4
-2
0
2
4
6
8
real
imag
inar
y

Received 16-OQAM Constellation(with channel and noise)
-1.5 -1 -0.5 0 0.5 1 1.5-1.5
-1
-0.5
0
0.5
1
1.5
real
imag
inar
y
rotation to process to alignreceived samples on thesquare grid

MIMO Problem
H1s1=1
Channel 1, H1=1 interferences
H2s2=j
Channel 2, H2=j interferences
Ultra simple case
1+ja j+b
1+j + b+ja Interferences (high level)
Input signal
23
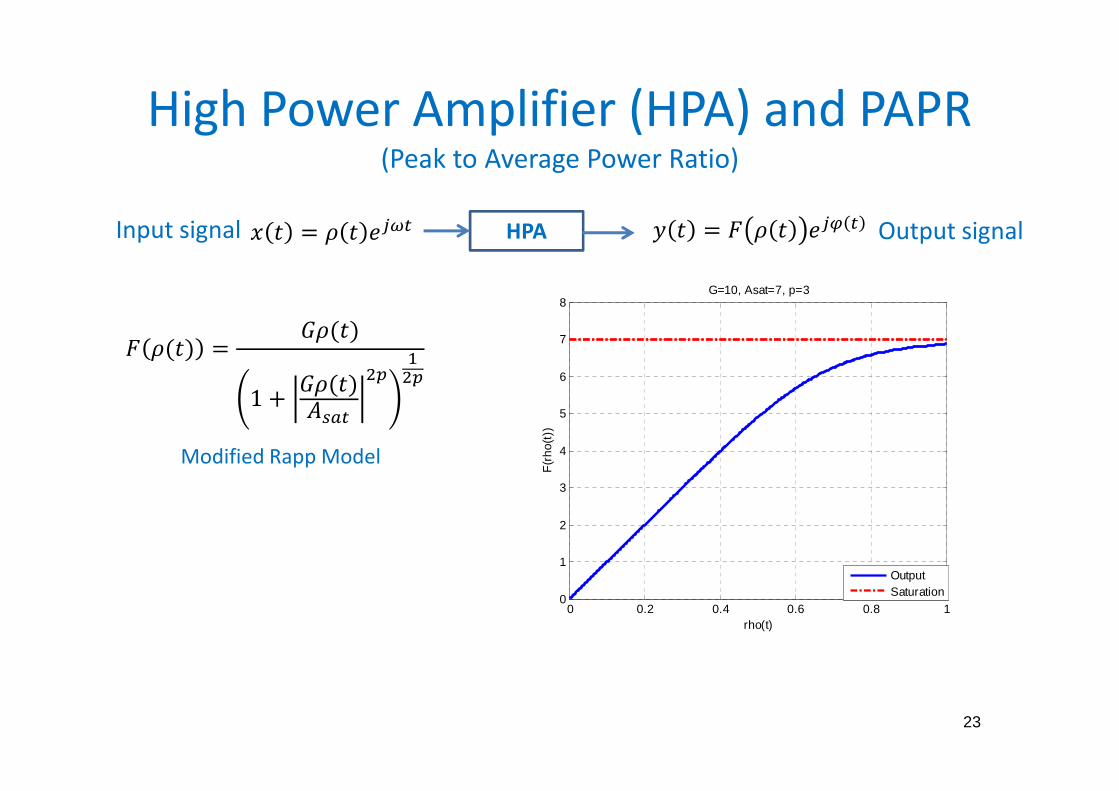
High Power Amplifier (HPA) and PAPR(Peak to Average Power Ratio)
� � = � � �� !
Modified Rapp Model
" �(�) = %�(�)
1 + %�(�)&'(!
) �)
* � = " � � ��+ !HPA Output signal
0 0.2 0.4 0.6 0.8 10
1
2
3
4
5
6
7
8
rho(t)
F(r
ho(t
))
G=10, Asat=7, p=3
OutputSaturation
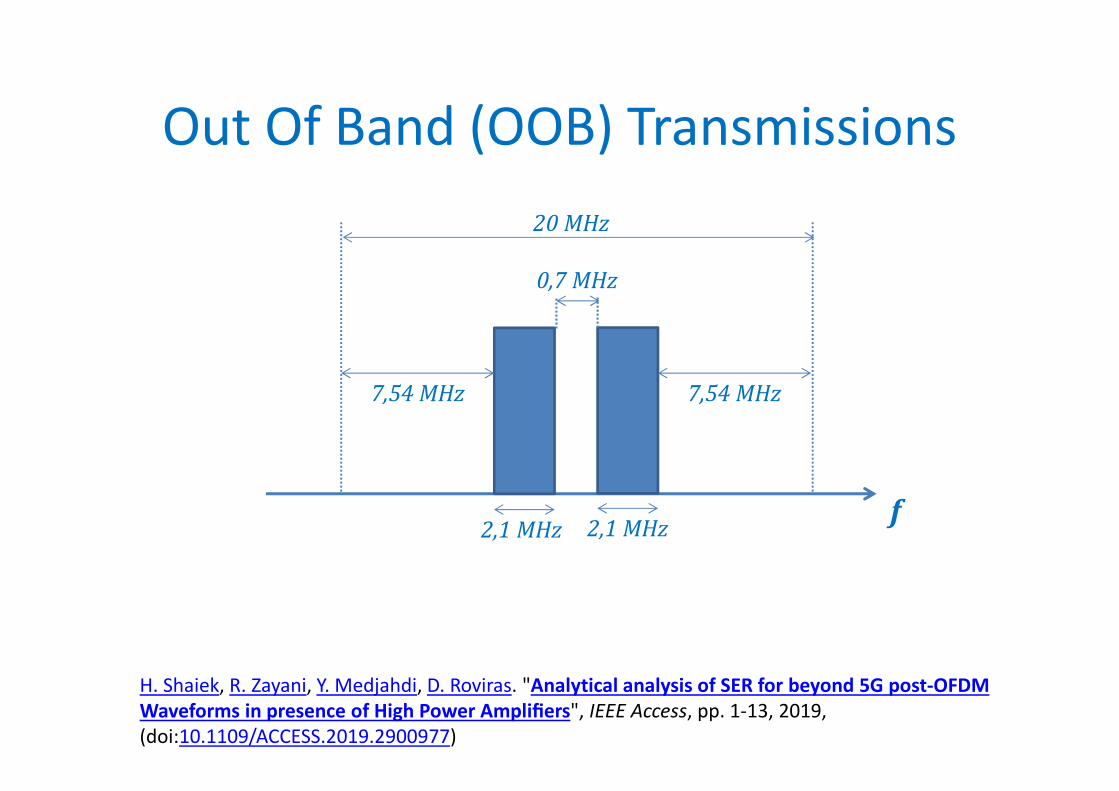
Out Of Band (OOB) Transmissions
f
20 MHz
7,54 MHz 7,54 MHz
0,7 MHz
2,1 MHz 2,1 MHz
H. Shaiek, R. Zayani, Y. Medjahdi, D. Roviras. "Analytical analysis of SER for beyond 5G post-OFDM
Waveforms in presence of High Power Amplifiers", IEEE Access, pp. 1-13, 2019,
(doi:10.1109/ACCESS.2019.2900977)

OOB CP-OFDM and HPA
2.39 2.392 2.394 2.396 2.398 2.4 2.402 2.404 2.406 2.408 2.41
x 109
-100
-90
-80
-70
-60
-50
-40
-30
-20
-10
0
Frequency (Hz)
PS
D (
dB)
OFDM
Rapp Model
Ideal Linear HPA

OOB WOLA and HPA
2.39 2.392 2.394 2.396 2.398 2.4 2.402 2.404 2.406 2.408 2.41
x 109
-100
-90
-80
-70
-60
-50
-40
-30
-20
-10
0
Frequency (GHz)
PS
D (
dB)
WOLA
Rapp Model
Ideal Linear HPA
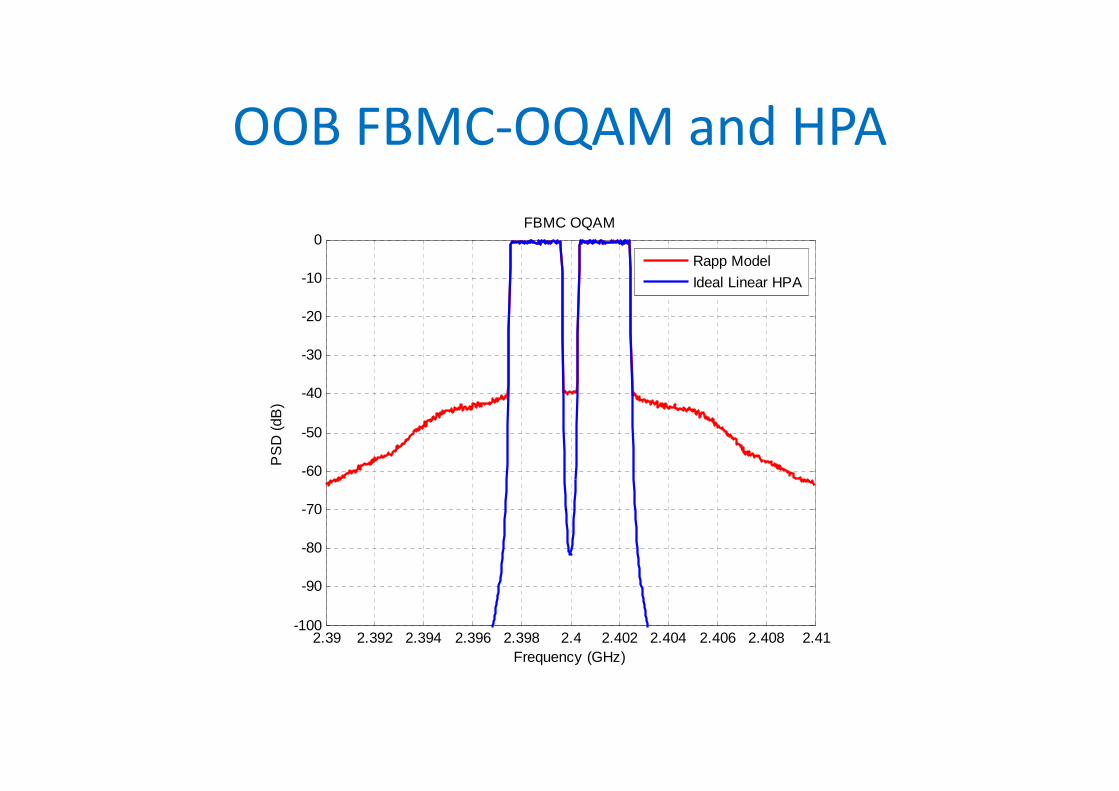
OOB FBMC-OQAM and HPA
2.39 2.392 2.394 2.396 2.398 2.4 2.402 2.404 2.406 2.408 2.41
x 109
-100
-90
-80
-70
-60
-50
-40
-30
-20
-10
0
Frequency (GHz)
PS
D (
dB)
FBMC OQAM
Rapp Model
Ideal Linear HPA
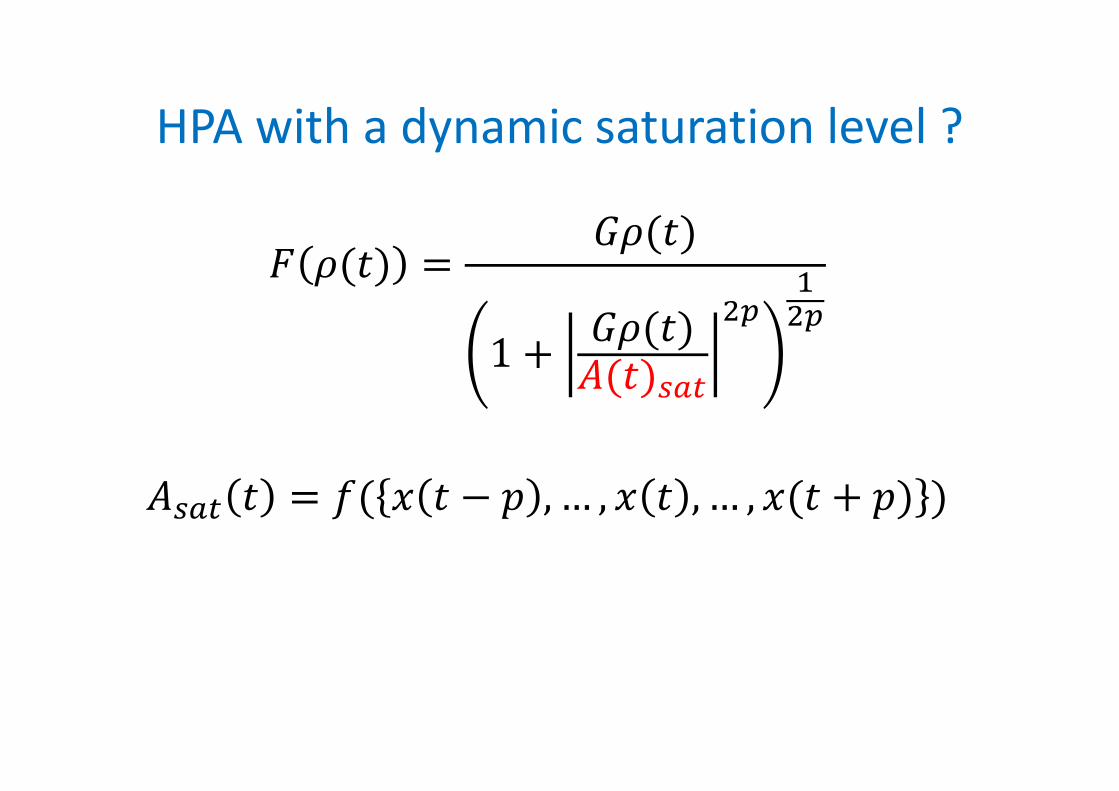
HPA with a dynamic saturation level ?
" �(�) = %�(�)
1 + %�(�)&(�)'(!
) �)
&'(! � = ,( � � − - ,… , � � , … , �(� + -) )

OOB FBMC-OQAM and dynamic
saturation level
2.39 2.392 2.394 2.396 2.398 2.4 2.402 2.404 2.406 2.408 2.41
x 109
-100
-90
-80
-70
-60
-50
-40
-30
-20
-10
0
Frequency (GHz)
PS
D (
dB)
Dynamic Asat
Rapp Model
Ideal Linear HPA

Dynamic saturation level evolution
2600 2800 3000 3200 3400 3600 3800 4000
0.135
0.14
0.145
0.15
0.155
0.16
0.165
time (microsec)
Dynamic AsatMean Dynamic AsatStatic Asat
0 0.5 1 1.5 2 2.5 3
x 104
0
0.05
0.1
0.15
0.2
0.25
0.3
0.35
0.4
time (microsec)
Dynamic AsatMean Dynamic AsatStatic Asat
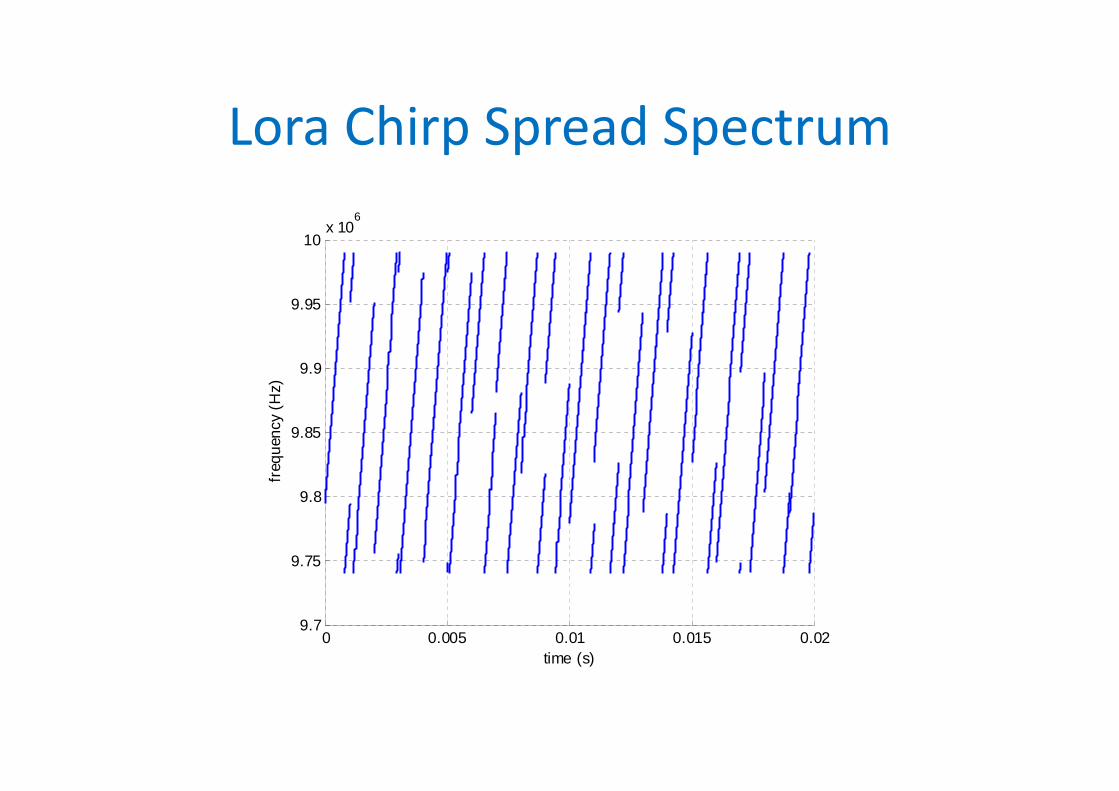
Lora Chirp Spread Spectrum
0 0.005 0.01 0.015 0.029.7
9.75
9.8
9.85
9.9
9.95
10x 10
6
freq
uenc
y (H
z)
time (s)

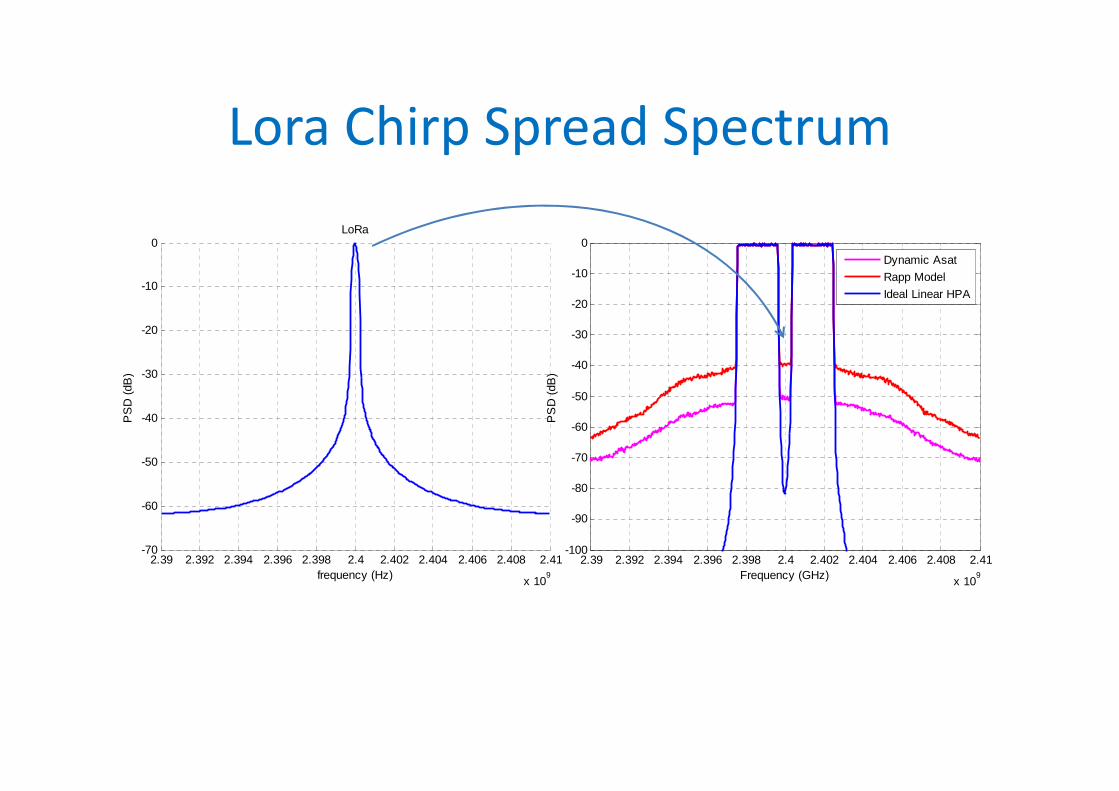
Lora Chirp Spread Spectrum
2.39 2.392 2.394 2.396 2.398 2.4 2.402 2.404 2.406 2.408 2.41
x 109
-70
-60
-50
-40
-30
-20
-10
0LoRa
frequency (Hz)
PS
D (
dB)
Lora Chirp Spread Spectrum
2.39 2.392 2.394 2.396 2.398 2.4 2.402 2.404 2.406 2.408 2.41
x 109
-70
-60
-50
-40
-30
-20
-10
0LoRa
frequency (Hz)
PS
D (
dB)
2.39 2.392 2.394 2.396 2.398 2.4 2.402 2.404 2.406 2.408 2.41
x 109
-100
-90
-80
-70
-60
-50
-40
-30
-20
-10
0
Frequency (GHz)
PS
D (
dB)
Dynamic Asat
Rapp Model
Ideal Linear HPA
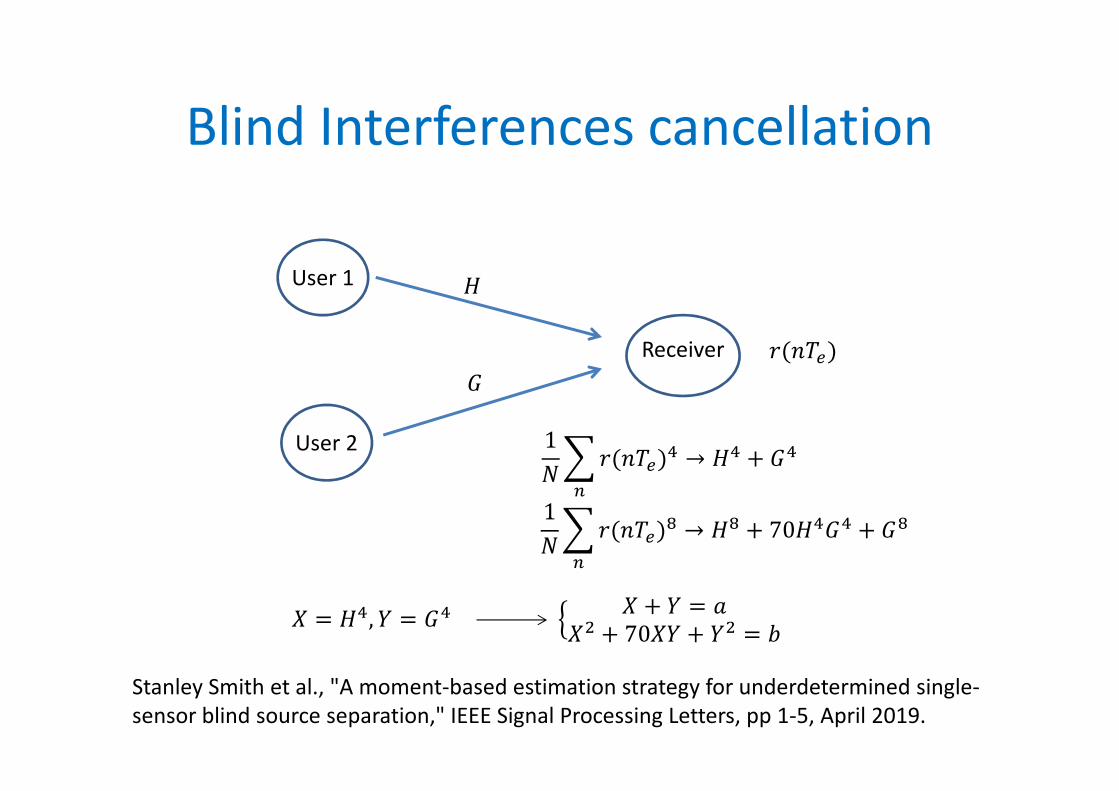
Blind Interferences cancellation
User 1
User 2
Receiver
H
G
1/01(234)5 → �5 + %5
7
1(234)
1/01(234)8 → �8 + 70�5%5 + %8
7
9 = �5, : = %5 ; 9 + : = <9 + 709: + : = =
Stanley Smith et al., "A moment-based estimation strategy for underdetermined single-
sensor blind source separation," IEEE Signal Processing Letters, pp 1-5, April 2019.

Conclusion
• Universal waveform for all 5G services ?
• Interference Mitigation for Massive IoT
Deployments
https://www.hindawi.com/journals/wcmc/si/375608/cfp/
Dead Line : December 1st

Thank you for your attention
[Source: ITU-R M.2083-0 IMT Vision]