the challenges of improving revenue-recognition standard ... - .pdf · the challenges of improving...
TRANSCRIPT
The Challenges of Improving Revenue-Recognition Standard for Multiple-Element Firms:
Evidence from the Software Industry (SOP 97-2)
Anup Srivastava†
Texas A&M University
Mays Business School
Texas A&M University
4353 TAMU
College Station, Texas 77843-4353
December 2007
Abstract
I investigate whether implementing SOP 97-2, the revenue-recognition standard for the
software industry, reduces earnings informativeness. This standard is particularly important for
two reasons: First, its provisions coincide with provisions of SAB 101, the current general
revenue-recognition standard. Second, the software industry provides a laboratory setting for
examining multiple-element firms, whose revenue-recognition challenges keep mounting as
more and more firms bundle multiple products and services. I find that implementing SOP 97-2
leads to additional revenue deferrals and a decline in earnings informativeness. However, the
market prices these deferrals as revenues, as if these amounts had not been deferred. Moreover,
the proforma earnings, which I calculate by undoing the revenue deferrals, more strongly
correspond with market returns than do the reported earnings. My findings indicate that the
accounting numbers calculated using the pre-SOP 97-2 revenue-recognition rules more strongly
correspond with market returns than do those calculated using SOP 97-2. My findings should
interest FASB in its project on developing a new revenue-recognition standard.
I thank my dissertation committee Ekkehart Boehmer, Mary Lea McAnally, Edward. P. Swanson
(Chair), and Senyo Y. Tse for their guidance and comments. I also thank Anwer Ahmed,
Michael Drake, Thomas Omer, James Myers, Linda Myers, Nate Sharp, Elizabeth Tebeaux,
Connie Weaver, and the workshop participants at Texas A&M University for helpful comments.
† E-mail: [email protected]. Tel. (979) 845-9401.
1
The Challenges of Improving Revenue-Recognition Standard for Multiple-Element Firms:
Evidence from the Software Industry (SOP 97-2)
I. INTRODUCTION
Revenue typically represents the largest and most value-relevant item in firms’ financial
statements (FASB 2002). However, as more and more firms adopt a ―relationship marketing‖
approach (Galbraith 2002, Ghosh and Balachander 2007) by bundling multiple products and
services, revenue-recognition challenges keep mounting (FASB 2002). Consider a software firm
that delivers its base software on the contract signing date and delivers integration services,
maintenance, and software upgrades at different times over the next 24 months. How does this
firm determine revenues at any time before the completion of this contract? Such a problem
challenges both financial statement preparers and standard setters (FASB 2002) and has figured
prominently in FASB’s deliberations on creating a new revenue-recognition standard
(FASB/IASB 2007).1
The challenges of creating revenue-recognition standards for firms that bundle multiple
products and services (the ―multiple-element‖ firms) differ from those of other firms in at least
one significant aspect – estimating revenues for partial deliveries of multiple-element firms
requires greater subjective assessments. Consider the above example. How does this firm
allocate aggregate contract value to individual elements that are not sold separately? And how
does it decide whether a delivered element provides functional value to a customer pending
delivery of another element? Estimating revenues based on the concept of completion of the
earnings process (SFAC No. 5) necessitates such assessments.
1 FASB’s advisory council has identified this agenda item as FASB’s highest priority project (FASAC 2006).
FASAC has also recommended a review of the software industry’s revenue-recognition rules.
2
Nevertheless, the current revenue-recognition standards impose strict objectivity and
verifiability conditions rather than rely on managers’ subjective assessments. The current
standards require that multiple-element firms should defer revenue recognition in its entirety
even when firms have 1) delivered some elements substantially, but not completely; 2) delivered
some elements completely, but cannot objectively apportion the contract value to these elements;
and 3) delivered some elements completely, but cannot establish their functionality pending
delivery of other elements. In this study, I examine whether such strict objectivity and
verifiability conditions reduce multiple-element firms’ earnings informativeness.2 On the one
hand, such conditions might improve the earnings informativeness of firms that had previously
exploited relatively obscure verifiability conditions to front-load revenue recognition. On the
other hand, this ―all or nothing‖ approach can force a firm to defer its entire revenues even when
it has partially or completely delivered elements of significant economic value. For example, the
current rules preclude Apple Inc. from recognizing any revenue on the day it sells an iPhone.
To investigate the effects of the multiple-element attribute of current standards, I examine
the effects of implementing SOP 97-2, rather than those of implementing SAB 101. Although
SEC enacted SAB 101 three years after AICPA enacted SOP 97-2 and the revenue-recognition
requirements of SAB 101 virtually coincide with those of SOP 97-2,3 I use the earlier standard
for three reasons: first, SAB 101 codified the multiple-element rules of SOP 97-2 and also
introduced delivery and earnings-completion requirements to those industries that were not
2 This question remains unexamined. The current standards (i.e., SOP 97-2 [AICPA 1996] for the software industry
and SAB 101[SEC 1999] for the other industries) affect firms’ revenue-recognition practices in two distinct ways:
(1) through the completion of product-delivery requirement and (2) through additional compliance requirements for
multiple-element contracts. Zhang (2005) examines the effects of the first aspect in isolation and Altamuro, Beatty,
and Weber (2005) examine the simultaneous effects of both aspects. However, the distinct effect of the second
aspect remains unexamined. 3 Both SOP 97-2 and SAB 101 build upon the concepts of earnings process completion and revenue realizability
(SFAC No. 5). Both require compliance with four necessary conditions before firms can recognize revenues: (1) a
formal arrangement, (2) completion of delivery, (3) determinable fees, and (4) revenue realizability.
3
formally covered by these rules earlier. Therefore, empirical effects of implementing SAB 101
could arise from reasons other than its multiple-element attribute (Moffeit and Eikner 2003). In
contrast, because SOP 91-1, which preceded SOP 97-2, already required software firms to
comply with delivery and earnings-completion based conditions, the empirical effects of
implementing SOP 97-2 would arise only from its multiple-element attribute (Carmichael 1998).
Second, software firms exemplify multiple-element firms. At a minimum, almost all
software firms provide future updates, upgrades, and extended maintenance support in addition
to base software. A significant number of software firms also provide additional services such as
customization, integration, and training.
Third, because SAB 101 applies rules originally designed for the software industry to
other industries, some might argue that the SEC misapplied SOP 97-2 rules (FASB 2002).
Specifically, AICPA created SOP 97-2 to prevent software firms from prematurely recognizing
revenues from multiple-element contracts (Carmichael 1998). Therefore, implementing SOP 97-
2 might improve software firms’ earnings informativeness; nevertheless, this premise remains
unexamined. While Altamuro et al. (2005) report a general decline in earnings informativeness
upon implementing SAB 101, their sample of SAB 101 affected firms is unlikely to include
software firms because SOP 97-2 preceded SAB 101.
I use three different research designs to examine my research question. First, I use a
before-and-after design to examine whether the market returns more strongly correspond with
pre-SOP 97-2 earnings or with SOP 97-2 implementation year’s earnings. I find that the market
returns more strongly correspond with former than with latter, which suggests that implementing
SOP 97-2 reduces earnings-returns association.
4
My second research design controls for the possibility that the above inter-temporal
decline in earnings-returns association occurs due to factors other than the SOP 97-2
implementation. I capitalize on balance sheet changes that result from implementing stringent
SOP 97-2 rules – the additional revenue deferrals, which I call SOP 97-2-created deferrals.
Under SOP 97-2 provisions, firms report these deferrals as unearned or deferred revenues (i.e., as
a current liability). However, under the prior regime, firms would not have deferred these
additional amounts and would have recognized them as revenues. Therefore, I examine: Does the
market price SOP 97-2-created deferrals as revenues (consistent with the prior regime) or as
current liabilities (consistent with SOP 97-2)? Unlike the before-and-after design, this design
enables me to directly compare the two accounting methods using only the implementation year
data. I find that the market prices the SOP 97-2-created deferrals as revenues and not as current
liabilities. This finding supports the notion that the market prices earnings as if the prior
accounting regime still prevails and SOP 97-2 had not been implemented.
I provide further evidence on the above notion by using a third research design. I examine
whether the proforma earnings (i.e., the earnings that would have been reported had SOP 97-2
not been implemented) are more informative than the reported earnings. I calculate proforma
revenues and earnings by adding back SOP 97-2-created deferrals. I find that the proforma
earnings more strongly relate with market returns than do the reported earnings.
I contribute to the literature by documenting that SOP 97-2 reduces earnings
informativeness of the software firms. My findings suggest that a standard that requires highly
objective and verifiable support for multiple-element firms’ revenue assessments reduces
earnings informativeness, perhaps because estimating revenues for such firms necessitates
subjective assessments. My findings also dispel the notion that implementing the current general
5
standard (i.e., SAB 101) in non-software industries reduces earnings informativess because the
SEC misapplied SOP 97-2 rules to such non-intended industries.
My findings might interest the FASB in its revenue-recognition standard project
(FASB/IASB 2007). Standard setters’ decisions often involve trade-offs between relevance and
reliability. AICPA created SOP 97-2 to improve multiple-element firms’ earnings reliability by
requiring such firms to defer revenues when they cannot objectively and verifiably determine the
extent of completion of the earnings process. My results suggest that a more timely recognition
of such deferred amounts might convey more useful information to financial statement users.
The rest of the paper proceeds as follows. Section II provides background information on
SOP 97-2, Section III develops the hypotheses, Section IV describes the sample, the research
design, and the results, and Section V presents some concluding remarks.
II. BACKGROUND INFORMATION ON SOP 97-2
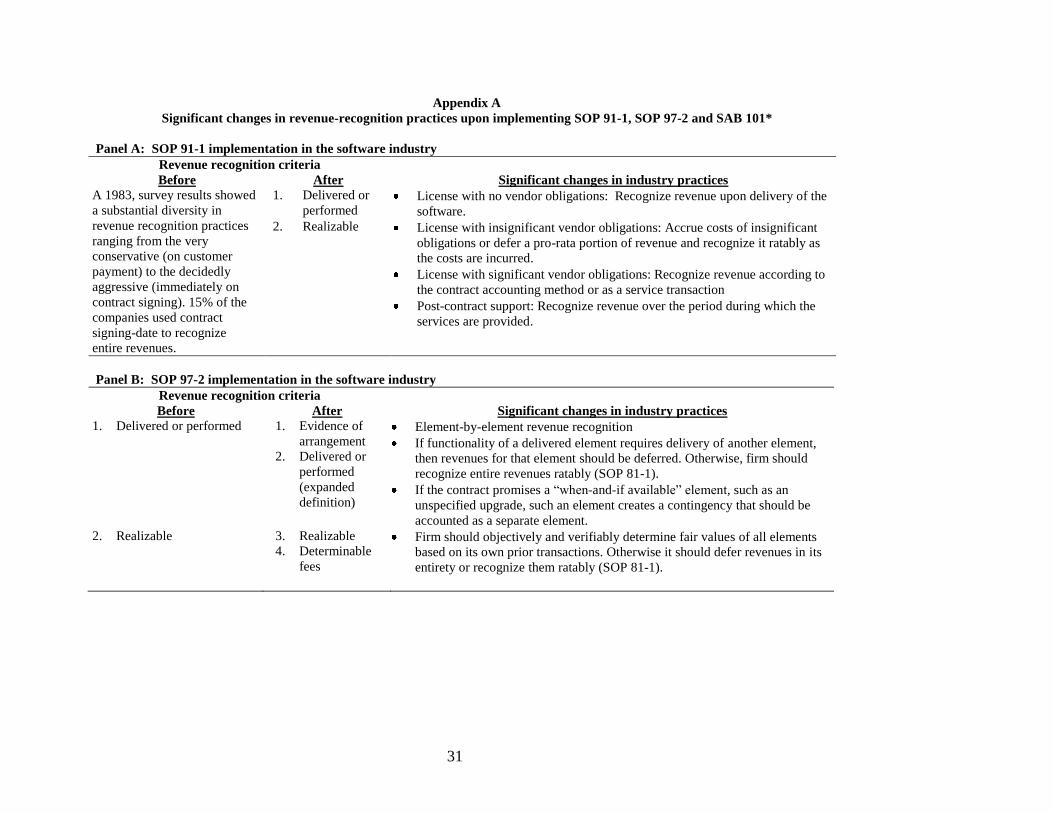
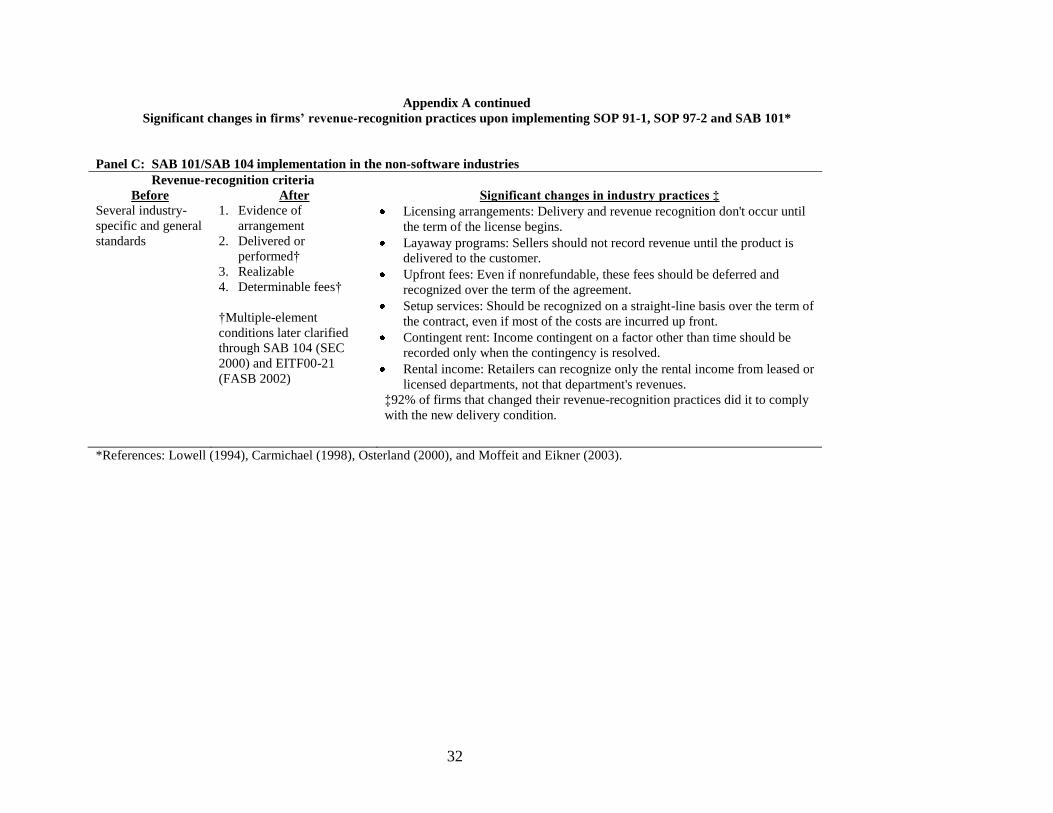
Appendix A describes the changes in firms’ revenue recognition practices due to the
implementation of SOP 91-1, SOP 97-2, and SAB 101. Each of these three revenue recognition
standards builds upon the concept of completion of the earnings process (SFAC No. 5).
However, only SOP 97-2 provides the ideal setting to examine the exclusive effects of the
multiple-element attribute of current standards, because: 1) SOP 91-1 did not include the current
multiple-element rules; and 2) most of the SAB 101 implementation effects arise from delivery-
based revenue-recognition requirements, rather than from its multiple-element rules. For
example, the most common changes from implementing SAB 101 include: 1) recognizing
revenues for FOB goods only after a firm transfers title of goods, 2) recognizing research fees
over the contracted period rather than upfront, and 3) recognizing revenues on layaways only
after the customer takes possession of the goods. Because of these changes, the pharmaceutical
6
industry is among the most SAB 101 affected industries (Moffeit and Eikner 2003; Altamuro et
al. 2005), even though pharmaceutical firms do not assume significant multiple-element
obligations.
In this section, I describe the circumstances that led to creation of SOP 97-2 and the
reasons for its likely effects. In the mid 1990s, when many software firms were growing rapidly
and reporting losses, investors began to rely on revenues rather than on earnings to value these
firms (e.g., Damodaran 2002; Bowen, Davis, and Rajgopal 2002). Stock prices frequently
reacted even if a firm met its earnings target, but missed its revenue-growth target (Ertimur and
Livnat 2003). Consequently, some software firms began to bend accounting rules to report
higher revenues. Notably, some software firms would recognize entire revenues from a multiple-
element contract even before they delivered all the contracted elements (Carmichael 1998). The
mid-1990s also witnessed numerous revenue-related accounting restatements (e.g., GAO 2003,
Palmrose, Scholz, and Wahlen 2004). The SEC initiated enforcement actions against firms that
recognized revenues prematurely (e.g., COSO 1999). As revenue recognition became the SEC’s
priority, it requested that AICPA create stringent revenue recognition rules for the software
industry.
SOP 91-1, which specified the then applicable revenue-recognition rules, did not provide
explicit guidance on when to recognize revenues for undelivered elements in a multiple-element
contract. Specifically, the SOP 91-1 rules did not provide clear guidance on: 1) how to estimate
―significance‖ of undelivered elements; and 2) how to account for software upgrades, which
firms provide on a ―when-and-if-available‖ basis. Since SOP 91-1 had become effective, most
software firms had begun bundling more products and services in the same revenue
arrangements by capitalizing on progress in internet and distributed computing technologies
7
(Choi 1999, Fuerderer et al. 1999). At a minimum, most software firms had begun providing
extended maintenance support through online updates and upgrades.
AICPA created SOP 97-2 to require software firms to defer recognizing a portion of
revenues corresponding to their undelivered elements (MacDonald 1996). In order to achieve
such revenue deferrals, AICPA added more elaborate and stringent conditions before firms could
recognize revenues from multiple-element contracts. For example, SOP 97-2 added a more
stringent interpretation of the delivery condition and introduced a new vendor specific objective
evidence (VSOE) requirement. The delivery condition requires that all other elements essential
for the functioning of the delivered element should also have been delivered. The VSOE
condition requires that a firm should first establish the fair value of each element based solely on
the firm’s own pricing records.4 Importantly, if a firm cannot establish fair value of just one
element, the firm might not be able to objectively apportion the aggregate contract value to any
other element. This might cause deferral of entire revenues from the contract (Carmichael 1998).
The importance of these conditions can be illustrated using the example of the software
firm described earlier. In order to recognize revenue for the base software on its delivery date,
the firm should 1) establish each element’s fair value based on the firm’s own prior transactions
and 2) ensure that the base software provides functional without additional services. If the firm
cannot meet either of these two conditions, it should defer recognizing revenues corresponding to
base software until (1) it meets both conditions; or (2) it delivers all other elements.5
4 The criteria used in practice to establish VSOE are stringent. A firm should provide evidence from at least 30 prior
randomly selected transactions and 85% of such transactions should have been priced within 15% of the median
price (Sondhi 2006). This requirement is excessively stringent for firms that customize products, have high
technological obsolescence rates, or use dynamic pricing. 5 Despite customers’ outcry, Apple Inc. recently asked its customers to pay a nominal fee of $ 1.99 to download a
software patch for the computers it had sold earlier. Otherwise, its auditors would question its policy of not deferring
a portion of revenues for an undelivered element. Earlier, Apple tried defending its accounting choice by claiming
that it could not estimate fair values of future patches at the time of the original sale. However, in such situations,
the current standard requires firms to defer entire revenues from the contract (Reily 2007).
8
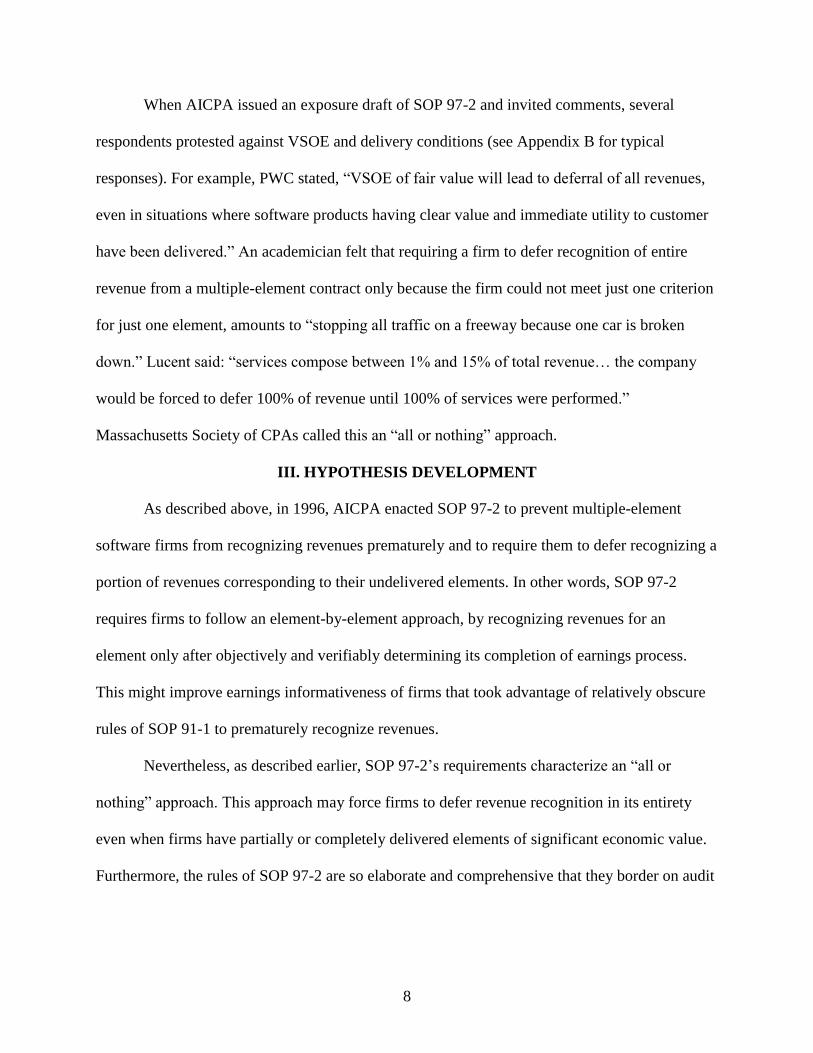
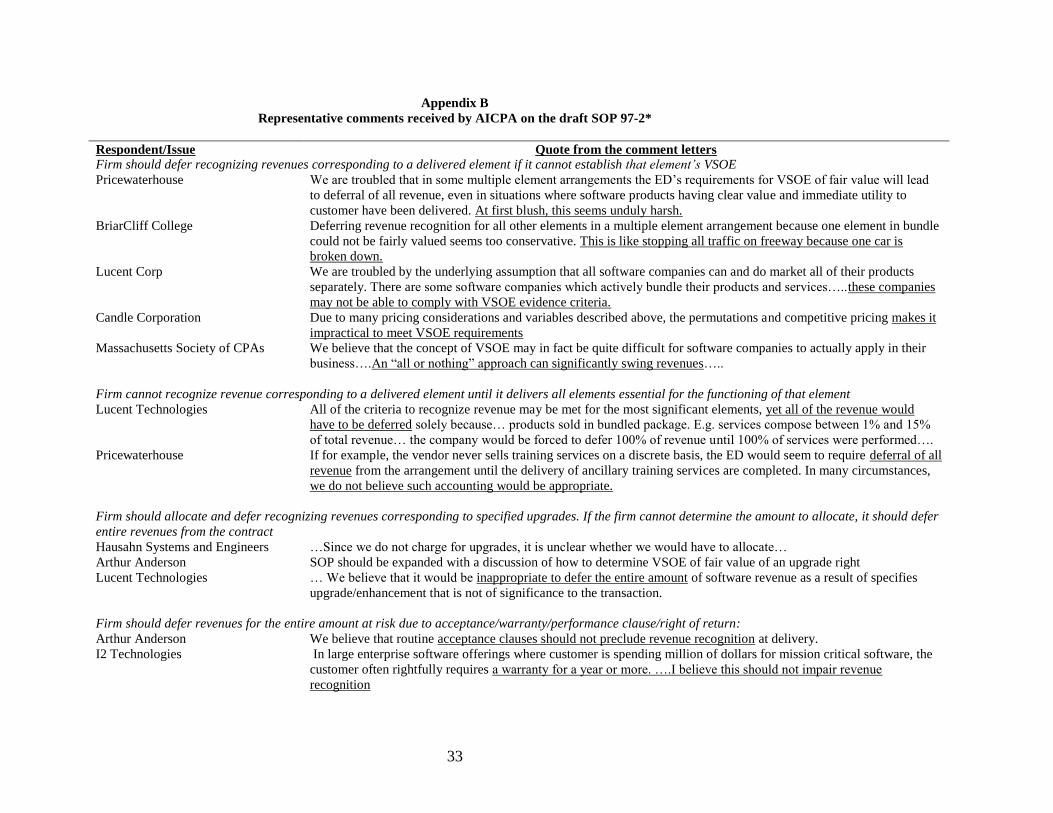
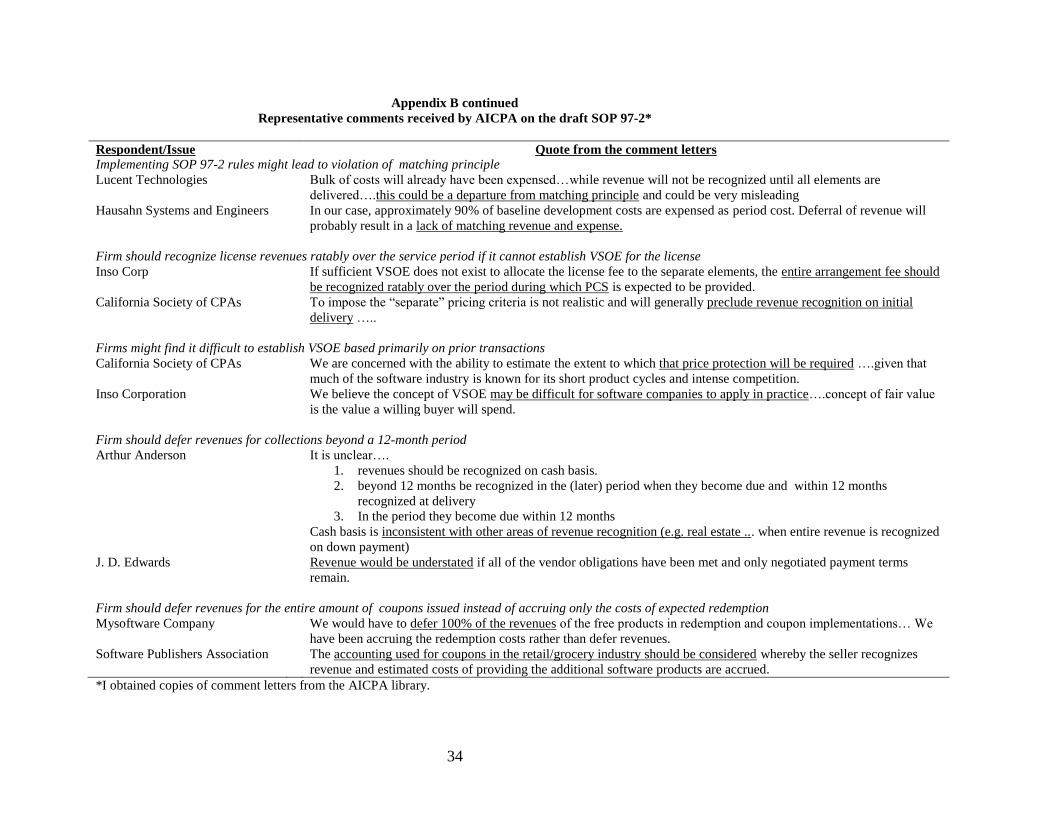
When AICPA issued an exposure draft of SOP 97-2 and invited comments, several
respondents protested against VSOE and delivery conditions (see Appendix B for typical
responses). For example, PWC stated, ―VSOE of fair value will lead to deferral of all revenues,
even in situations where software products having clear value and immediate utility to customer
have been delivered.‖ An academician felt that requiring a firm to defer recognition of entire
revenue from a multiple-element contract only because the firm could not meet just one criterion
for just one element, amounts to ―stopping all traffic on a freeway because one car is broken
down.‖ Lucent said: ―services compose between 1% and 15% of total revenue… the company
would be forced to defer 100% of revenue until 100% of services were performed.‖
Massachusetts Society of CPAs called this an ―all or nothing‖ approach.
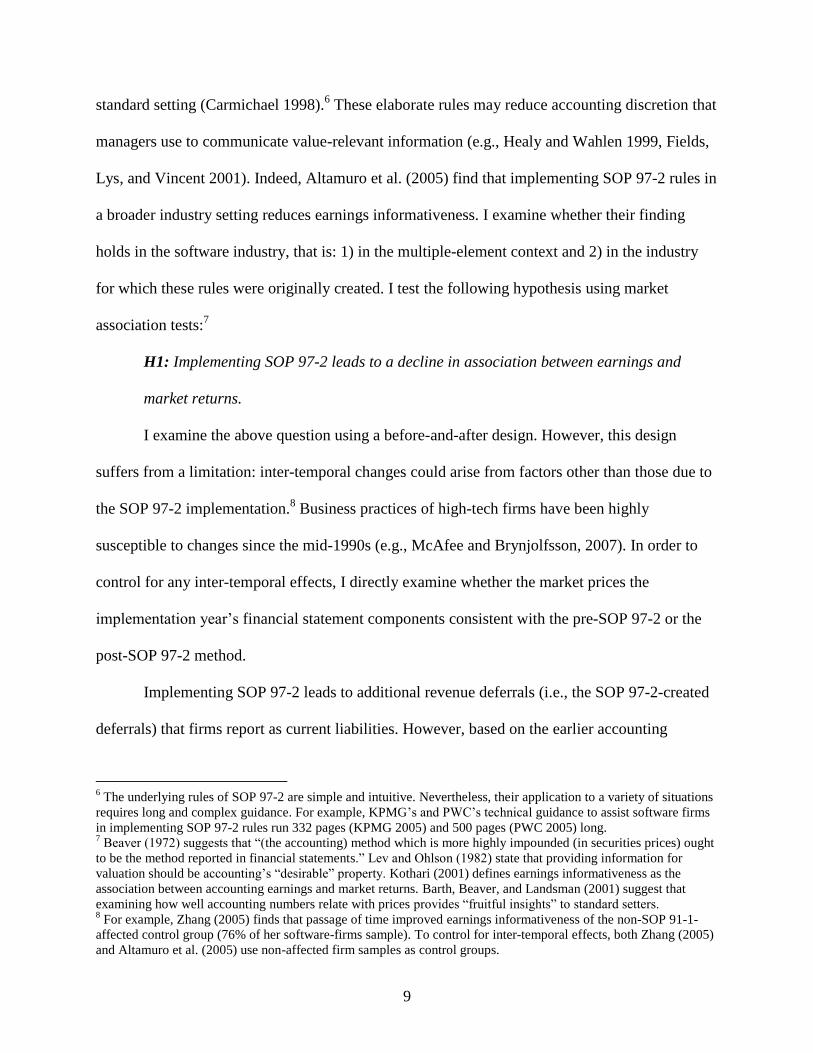
III. HYPOTHESIS DEVELOPMENT
As described above, in 1996, AICPA enacted SOP 97-2 to prevent multiple-element
software firms from recognizing revenues prematurely and to require them to defer recognizing a
portion of revenues corresponding to their undelivered elements. In other words, SOP 97-2
requires firms to follow an element-by-element approach, by recognizing revenues for an
element only after objectively and verifiably determining its completion of earnings process.
This might improve earnings informativeness of firms that took advantage of relatively obscure
rules of SOP 91-1 to prematurely recognize revenues.
Nevertheless, as described earlier, SOP 97-2’s requirements characterize an ―all or
nothing‖ approach. This approach may force firms to defer revenue recognition in its entirety
even when firms have partially or completely delivered elements of significant economic value.
Furthermore, the rules of SOP 97-2 are so elaborate and comprehensive that they border on audit
9
standard setting (Carmichael 1998).6 These elaborate rules may reduce accounting discretion that
managers use to communicate value-relevant information (e.g., Healy and Wahlen 1999, Fields,
Lys, and Vincent 2001). Indeed, Altamuro et al. (2005) find that implementing SOP 97-2 rules in
a broader industry setting reduces earnings informativeness. I examine whether their finding
holds in the software industry, that is: 1) in the multiple-element context and 2) in the industry
for which these rules were originally created. I test the following hypothesis using market
association tests:7
H1: Implementing SOP 97-2 leads to a decline in association between earnings and
market returns.
I examine the above question using a before-and-after design. However, this design
suffers from a limitation: inter-temporal changes could arise from factors other than those due to
the SOP 97-2 implementation.8 Business practices of high-tech firms have been highly
susceptible to changes since the mid-1990s (e.g., McAfee and Brynjolfsson, 2007). In order to
control for any inter-temporal effects, I directly examine whether the market prices the
implementation year’s financial statement components consistent with the pre-SOP 97-2 or the
post-SOP 97-2 method.
Implementing SOP 97-2 leads to additional revenue deferrals (i.e., the SOP 97-2-created
deferrals) that firms report as current liabilities. However, based on the earlier accounting
6 The underlying rules of SOP 97-2 are simple and intuitive. Nevertheless, their application to a variety of situations
requires long and complex guidance. For example, KPMG’s and PWC’s technical guidance to assist software firms
in implementing SOP 97-2 rules run 332 pages (KPMG 2005) and 500 pages (PWC 2005) long. 7 Beaver (1972) suggests that ―(the accounting) method which is more highly impounded (in securities prices) ought
to be the method reported in financial statements.‖ Lev and Ohlson (1982) state that providing information for
valuation should be accounting’s ―desirable‖ property. Kothari (2001) defines earnings informativeness as the
association between accounting earnings and market returns. Barth, Beaver, and Landsman (2001) suggest that
examining how well accounting numbers relate with prices provides ―fruitful insights‖ to standard setters. 8 For example, Zhang (2005) finds that passage of time improved earnings informativeness of the non-SOP 91-1-
affected control group (76% of her software-firms sample). To control for inter-temporal effects, both Zhang (2005)
and Altamuro et al. (2005) use non-affected firm samples as control groups.
10
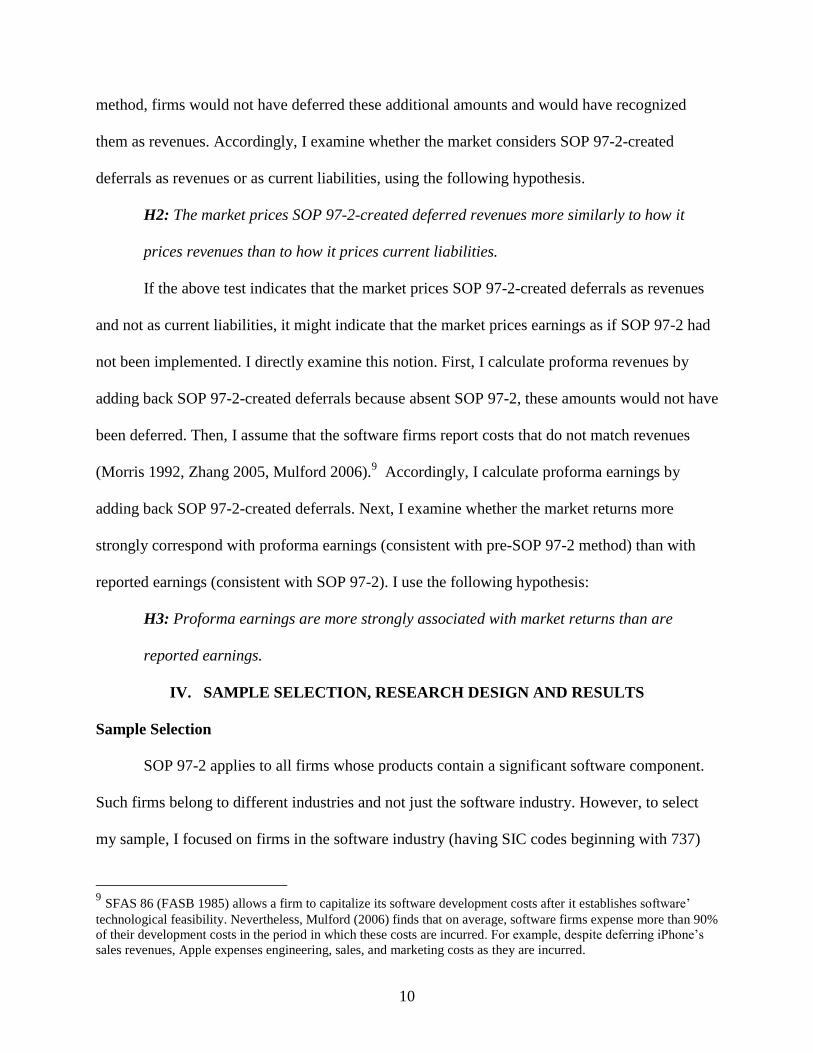
method, firms would not have deferred these additional amounts and would have recognized
them as revenues. Accordingly, I examine whether the market considers SOP 97-2-created
deferrals as revenues or as current liabilities, using the following hypothesis.
H2: The market prices SOP 97-2-created deferred revenues more similarly to how it
prices revenues than to how it prices current liabilities.
If the above test indicates that the market prices SOP 97-2-created deferrals as revenues
and not as current liabilities, it might indicate that the market prices earnings as if SOP 97-2 had
not been implemented. I directly examine this notion. First, I calculate proforma revenues by
adding back SOP 97-2-created deferrals because absent SOP 97-2, these amounts would not have
been deferred. Then, I assume that the software firms report costs that do not match revenues
(Morris 1992, Zhang 2005, Mulford 2006).9 Accordingly, I calculate proforma earnings by
adding back SOP 97-2-created deferrals. Next, I examine whether the market returns more
strongly correspond with proforma earnings (consistent with pre-SOP 97-2 method) than with
reported earnings (consistent with SOP 97-2). I use the following hypothesis:
H3: Proforma earnings are more strongly associated with market returns than are
reported earnings.
IV. SAMPLE SELECTION, RESEARCH DESIGN AND RESULTS
Sample Selection
SOP 97-2 applies to all firms whose products contain a significant software component.
Such firms belong to different industries and not just the software industry. However, to select
my sample, I focused on firms in the software industry (having SIC codes beginning with 737)
9 SFAS 86 (FASB 1985) allows a firm to capitalize its software development costs after it establishes software’
technological feasibility. Nevertheless, Mulford (2006) finds that on average, software firms expense more than 90%
of their development costs in the period in which these costs are incurred. For example, despite deferring iPhone’s
sales revenues, Apple expenses engineering, sales, and marketing costs as they are incurred.
11
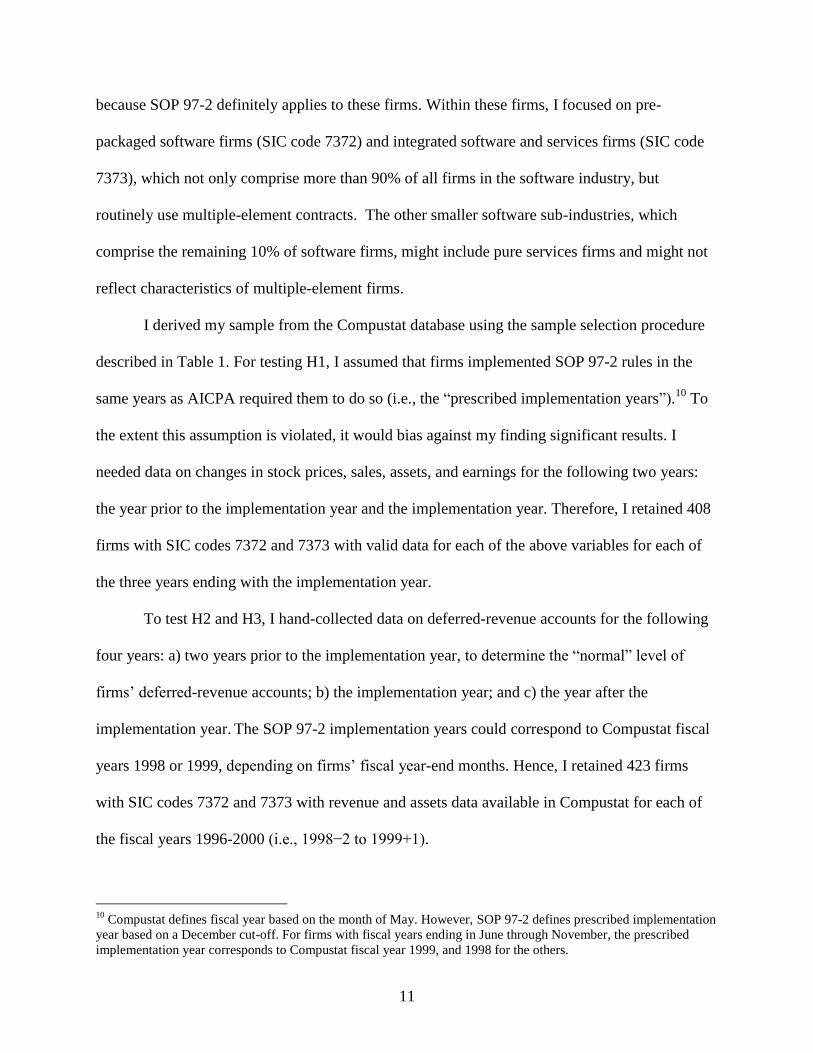
because SOP 97-2 definitely applies to these firms. Within these firms, I focused on pre-
packaged software firms (SIC code 7372) and integrated software and services firms (SIC code
7373), which not only comprise more than 90% of all firms in the software industry, but
routinely use multiple-element contracts. The other smaller software sub-industries, which
comprise the remaining 10% of software firms, might include pure services firms and might not
reflect characteristics of multiple-element firms.
I derived my sample from the Compustat database using the sample selection procedure
described in Table 1. For testing H1, I assumed that firms implemented SOP 97-2 rules in the
same years as AICPA required them to do so (i.e., the ―prescribed implementation years‖).10
To
the extent this assumption is violated, it would bias against my finding significant results. I
needed data on changes in stock prices, sales, assets, and earnings for the following two years:
the year prior to the implementation year and the implementation year. Therefore, I retained 408
firms with SIC codes 7372 and 7373 with valid data for each of the above variables for each of
the three years ending with the implementation year.
To test H2 and H3, I hand-collected data on deferred-revenue accounts for the following
four years: a) two years prior to the implementation year, to determine the ―normal‖ level of
firms’ deferred-revenue accounts; b) the implementation year; and c) the year after the
implementation year. The SOP 97-2 implementation years could correspond to Compustat fiscal
years 1998 or 1999, depending on firms’ fiscal year-end months. Hence, I retained 423 firms
with SIC codes 7372 and 7373 with revenue and assets data available in Compustat for each of
the fiscal years 1996-2000 (i.e., 1998−2 to 1999+1).
10
Compustat defines fiscal year based on the month of May. However, SOP 97-2 defines prescribed implementation
year based on a December cut-off. For firms with fiscal years ending in June through November, the prescribed
implementation year corresponds to Compustat fiscal year 1999, and 1998 for the others.
12
For these 423 firms, I gathered data from the firms’ 10-K filings. I obtained data on
deferred-revenue accounts from the liability section of balance sheets or from footnotes that
provide details on smaller liabilities. I looked for words such as ―deferred revenue,‖ ―unearned
income,‖ ―customer advances,‖ and ―billings in excess of revenue.‖ I further dropped 137 firms
that did not provide details on deferred-revenue accounts. This filter left me with 286 firms.
Next, I examined the ―revenue recognition‖ section in the ―significant accounting
policies‖ footnotes and also performed a keyword search for SOP 97-2, to determine the fiscal
years in which firms first implemented the SOP 97-2 rules.11
I could not determine
implementation years for 35 firms, which left me with 251 firms that constitute my sample for
testing H2 and H3.
Normal and SOP 97-2-created Deferred Revenue
I partitioned the implementation year’s deferred-revenue accounts into normal deferred
revenue and SOP 97-2-created deferred revenue components. Deferred-revenue account refers to
those cash receipts from customers, which pending conversion to revenues, are reported as
liabilities. I assumed that (1) implementing SOP 97-2 did not affect firms’ cash operating cycles
and (2) firms had incentives to recognize revenues early. Therefore, any increase in the deferred-
revenue account in the SOP 97-2 implementation year would likely reflect additional revenue-
recognition restrictions. I calculated each firm’s deferred revenue to sales ratios for the two years
prior to the implementation year. I called their average the normal ratio. Then, I multiplied each
firm’s normal ratio with its reported revenue in the implementation year. I called this product the
normal deferred revenue. This component represents the deferred-revenue account if SOP 97-2
had not been implemented. Then, I subtracted the normal deferred revenue from the reported
11
To ascertain the SOP 97-2 implementation year, I looked for explicit disclosures in firms’ 10-K filings. If a firm
didn’t explicitly disclose its implementation year, I examined changes in its revenue-recognition policy.
13
deferred-revenue account, and called the residual the SOP 97-2-created deferred revenue. Hence,
I used firms’ own prior operating ratios to partition the deferred-revenue account into normal
deferred revenue and SOP 97-2-created deferred revenue components.
Descriptive statistics
Tables 1 and 2 present the descriptive statistics of 408 firms (for testing H1) and 251
firms (for testing H2 and H3) in the implementation year. I discuss the descriptive statistics of
251 firms; those of the 408 firms are similar. Table 1 Panel B shows that the sample of 251 firms
is comprised of 187 prepackaged software firms (75%) and 64 systems integrators (25%). Table
1 Panel C shows that only 4 firms (2%) implemented SOP 97-2 earlier than the prescribed year;
219 (87%) implemented in the prescribed year; and the remaining 28 (11%) implemented later
than the prescribed year (many firms restated their accounts due to late implementation). Table 1
Panel D shows that 72% of the sample firms implemented SOP 97-2 in 1998, 23% in 1999, and
the remaining 5% in 1997 and 2000. Table 2 Panel B shows that the sample firms had average
assets of $ 337 million (median $50 million). However, they had much higher average market
value of $ 1,966 million (median $ 85 million), which suggests that investors had high growth
expectations from these firms. Note the high coefficient of variation (ratio of standard deviation
to mean) that reaches 800% for some variables. This shows large variation in the sample firms’
characteristics. The average age of the firms was 12 years (median 11 years). However, firms’
revenues grew at an average rate of 46% (median 18%). The average ROA was negative and
more than half of the sample firms incurred losses. The average SOP 97-2-created deferred
revenue to assets (revenue) ratio was 1.66% (2.31%).
14
Univariate tests on deferred-revenue accounts
I first confirmed that implementing SOP 97-2 significantly increased software firms’
deferred revenues and that this increase did not reflect a time trend. I used revenue (Compustat
DATA 12) to deflate the deferred revenues because if the cash operating cycle remains
unchanged, the deferred revenues should increase proportionately with revenues. Nevertheless, I
also used alternate deflators of assets (DATA 6) and market value (common shares outstanding
[DATA25] × closing price [DATA199]).
Table 3 Panel A shows that upon implementing SOP 97-2 rules, the deferred revenue to
revenue ratio increased for approximately two-thirds of the sample firms. In value terms, this
ratio increased by an average of 2.3% (calculated as Ratiot – Ratiot-1). This change, on average,
represents a 42% increase over the prior year’s ratio (calculated as (Ratiot – Ratiot-1)/Ratiot-1).
All these increases are statistically significant. I obtained similar results using alternate deflators
of assets and market value. I also estimated changes in the year before and the year after the SOP
97-2 implementation and found that they are not significant. Therefore, I conclude that the
increases in the deferred-revenue accounts in the implementation year do not reflect a time trend.
Systems integrators (e.g., IBM) are more likely to defer additional revenues upon SOP
97-2 implementation than the prepackaged software firms (e.g., Microsoft). Systems integrators
provide multiple additional services, such as customization, integration, training, and
maintenance, along with their base software. Their base software typically doesn’t function
without customization and integration services. Therefore, they face a greater difficulty in
meeting the delivery condition in the early phases of a project. Moreover, because they
customize their software to buyers’ specifications, they lack a history of substantially similar
prior transactions. Accordingly, they face a greater difficulty in establishing VSOE.
15
Table 3 Panel B shows that implementing SOP 97-2 rules increased deferred-revenue to
revenue ratios of both prepackaged software firms and systems integrators. For prepackaged
software firms, this ratio increased by 2.1% from the earlier level of 12.1%. This change, on
average, represents a 36% increase over the pre-implementation year ratio. For systems
integrators, this ratio increased by 3.0% from the earlier level of 7.0%. This change, on average,
represents a 61% increase over the pre-implementation year ratio. This percent increase for the
systems integrators exceeds the percent increase for the pre-packaged software firms, which
suggests that the greater the difficulty in estimating the earnings completion process, the greater
the increase in deferred-revenue accounts upon SOP 97-2 implementation.
Discussion - univariate tests on deferred-revenue accounts
The magnitude of increase in deferred-revenue accounts is not as dramatic as some
respondents expected. The average increase in deferred-revenue accounts amounts to 2.3% of
revenues. This magnitude does not support some respondents’ expectation of large revenue
deferrals (e.g., read PWC’s and Lucent’s comments in Appendix B). One possible reason for this
less consequential effect could be that instead of deferring entire revenues, firms started using
construction accounting rules (SOP 81-1 [AICPA 1981]) more often. These rules allow firms to
recognize revenues ratably proportional to passage of time or to provision of ancillary services.
For example, Apple Inc. uses this method to reconize its iPhone sales revenues ratably over the
service period. Therefore, the difference between the pre-SOP 97-2 method and the post-SOP
97-2 method could reflect: (i) the difference between SOP 91-1 and SOP 97-2 rules; and (ii) a
greater use of construction accounting.
Nonetheless, recognizing revenues ratably based on construction accounting does not
reflect the discrete value-delivery attribute of the software industry. For example, a software firm
16
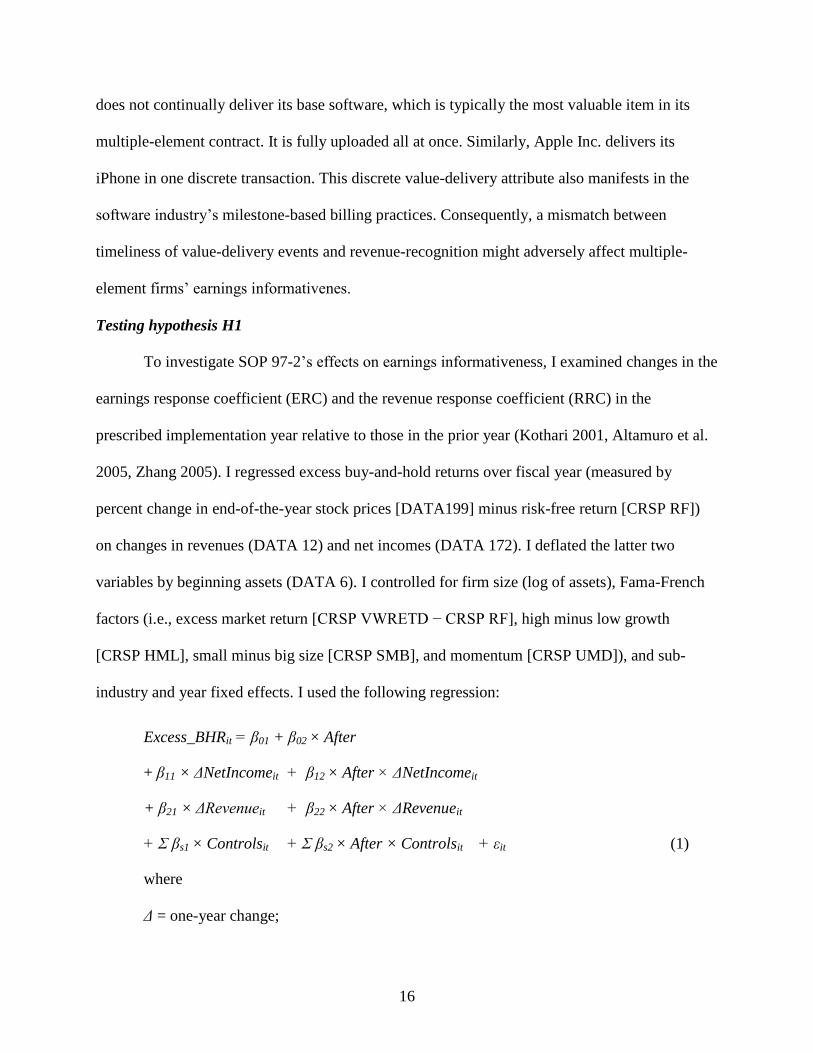
does not continually deliver its base software, which is typically the most valuable item in its
multiple-element contract. It is fully uploaded all at once. Similarly, Apple Inc. delivers its
iPhone in one discrete transaction. This discrete value-delivery attribute also manifests in the
software industry’s milestone-based billing practices. Consequently, a mismatch between
timeliness of value-delivery events and revenue-recognition might adversely affect multiple-
element firms’ earnings informativenes.
Testing hypothesis H1
To investigate SOP 97-2’s effects on earnings informativeness, I examined changes in the
earnings response coefficient (ERC) and the revenue response coefficient (RRC) in the
prescribed implementation year relative to those in the prior year (Kothari 2001, Altamuro et al.
2005, Zhang 2005). I regressed excess buy-and-hold returns over fiscal year (measured by
percent change in end-of-the-year stock prices [DATA199] minus risk-free return [CRSP RF])
on changes in revenues (DATA 12) and net incomes (DATA 172). I deflated the latter two
variables by beginning assets (DATA 6). I controlled for firm size (log of assets), Fama-French
factors (i.e., excess market return [CRSP VWRETD − CRSP RF], high minus low growth
[CRSP HML], small minus big size [CRSP SMB], and momentum [CRSP UMD]), and sub-
industry and year fixed effects. I used the following regression:
Excess_BHRit = β01 + β02 × After
+ β11 × ΔNetIncomeit + β12 × After × ΔNetIncomeit
+ β21 × ΔRevenueit + β22 × After × ΔRevenueit
+ Σ βs1 × Controlsit + Σ βs2 × After × Controlsit + εit (1)
where
Δ = one-year change;
17
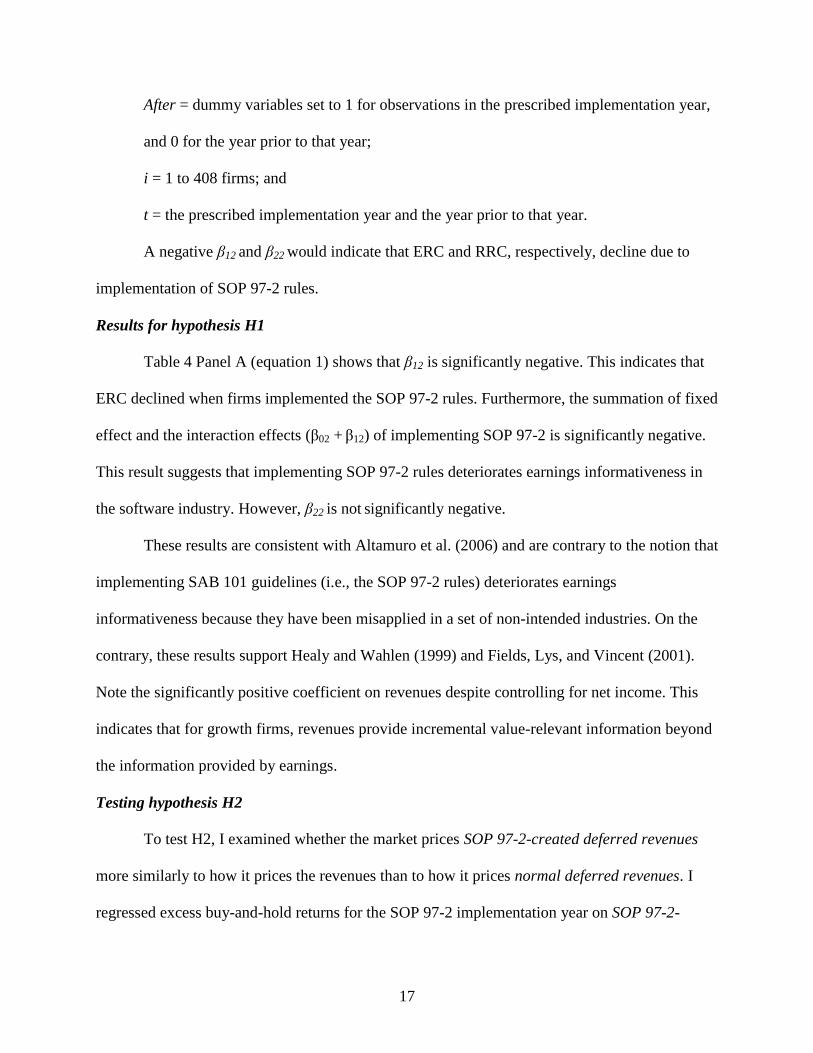
After = dummy variables set to 1 for observations in the prescribed implementation year,
and 0 for the year prior to that year;
i = 1 to 408 firms; and
t = the prescribed implementation year and the year prior to that year.
A negative β12 and β22 would indicate that ERC and RRC, respectively, decline due to
implementation of SOP 97-2 rules.
Results for hypothesis H1
Table 4 Panel A (equation 1) shows that β12 is significantly negative. This indicates that
ERC declined when firms implemented the SOP 97-2 rules. Furthermore, the summation of fixed
effect and the interaction effects (β02 + β12) of implementing SOP 97-2 is significantly negative.
This result suggests that implementing SOP 97-2 rules deteriorates earnings informativeness in
the software industry. However, β22 is not significantly negative.
These results are consistent with Altamuro et al. (2006) and are contrary to the notion that
implementing SAB 101 guidelines (i.e., the SOP 97-2 rules) deteriorates earnings
informativeness because they have been misapplied in a set of non-intended industries. On the
contrary, these results support Healy and Wahlen (1999) and Fields, Lys, and Vincent (2001).
Note the significantly positive coefficient on revenues despite controlling for net income. This
indicates that for growth firms, revenues provide incremental value-relevant information beyond
the information provided by earnings.
Testing hypothesis H2
To test H2, I examined whether the market prices SOP 97-2-created deferred revenues
more similarly to how it prices the revenues than to how it prices normal deferred revenues. I
regressed excess buy-and-hold returns for the SOP 97-2 implementation year on SOP 97-2-
18
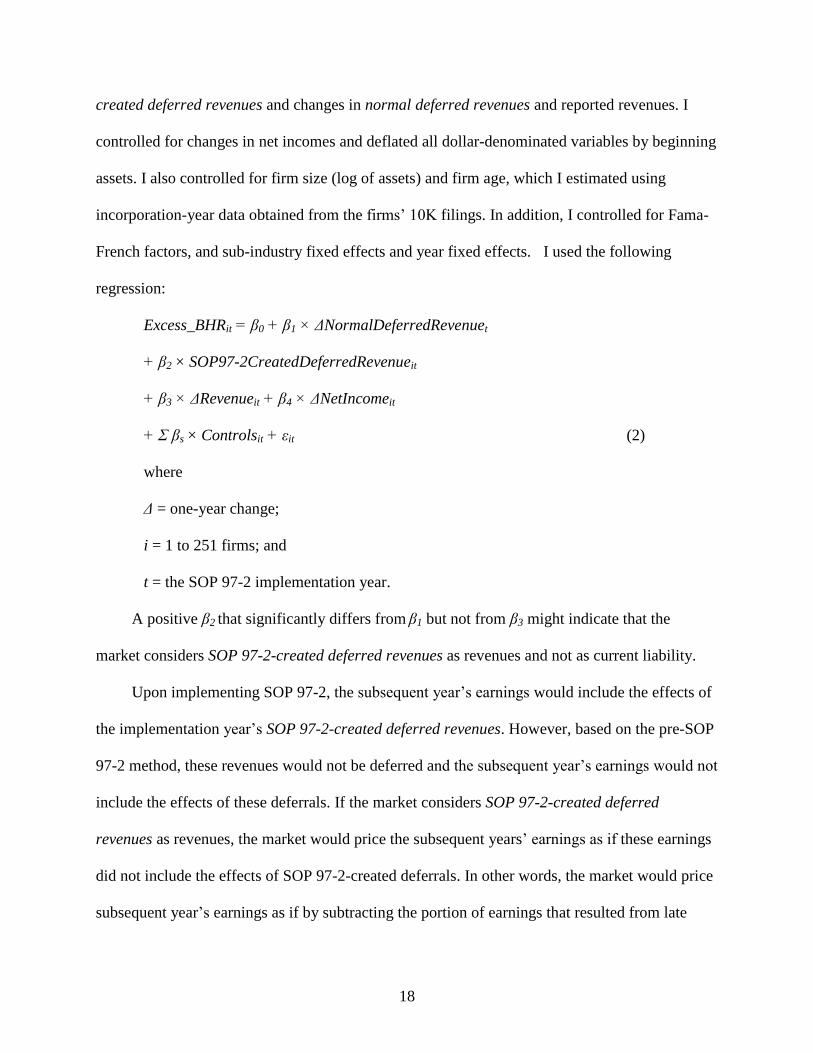
created deferred revenues and changes in normal deferred revenues and reported revenues. I
controlled for changes in net incomes and deflated all dollar-denominated variables by beginning
assets. I also controlled for firm size (log of assets) and firm age, which I estimated using
incorporation-year data obtained from the firms’ 10K filings. In addition, I controlled for Fama-
French factors, and sub-industry fixed effects and year fixed effects. I used the following
regression:
Excess_BHRit = β0 + β1 × ΔNormalDeferredRevenuet
+ β2 × SOP97-2CreatedDeferredRevenueit
+ β3 × ΔRevenueit + β4 × ΔNetIncomeit
+ Σ βs × Controlsit + εit (2)
where
Δ = one-year change;
i = 1 to 251 firms; and
t = the SOP 97-2 implementation year.
A positive β2 that significantly differs from β1 but not from β3 might indicate that the
market considers SOP 97-2-created deferred revenues as revenues and not as current liability.
Upon implementing SOP 97-2, the subsequent year’s earnings would include the effects of
the implementation year’s SOP 97-2-created deferred revenues. However, based on the pre-SOP
97-2 method, these revenues would not be deferred and the subsequent year’s earnings would not
include the effects of these deferrals. If the market considers SOP 97-2-created deferred
revenues as revenues, the market would price the subsequent years’ earnings as if these earnings
did not include the effects of SOP 97-2-created deferrals. In other words, the market would price
subsequent year’s earnings as if by subtracting the portion of earnings that resulted from late
19
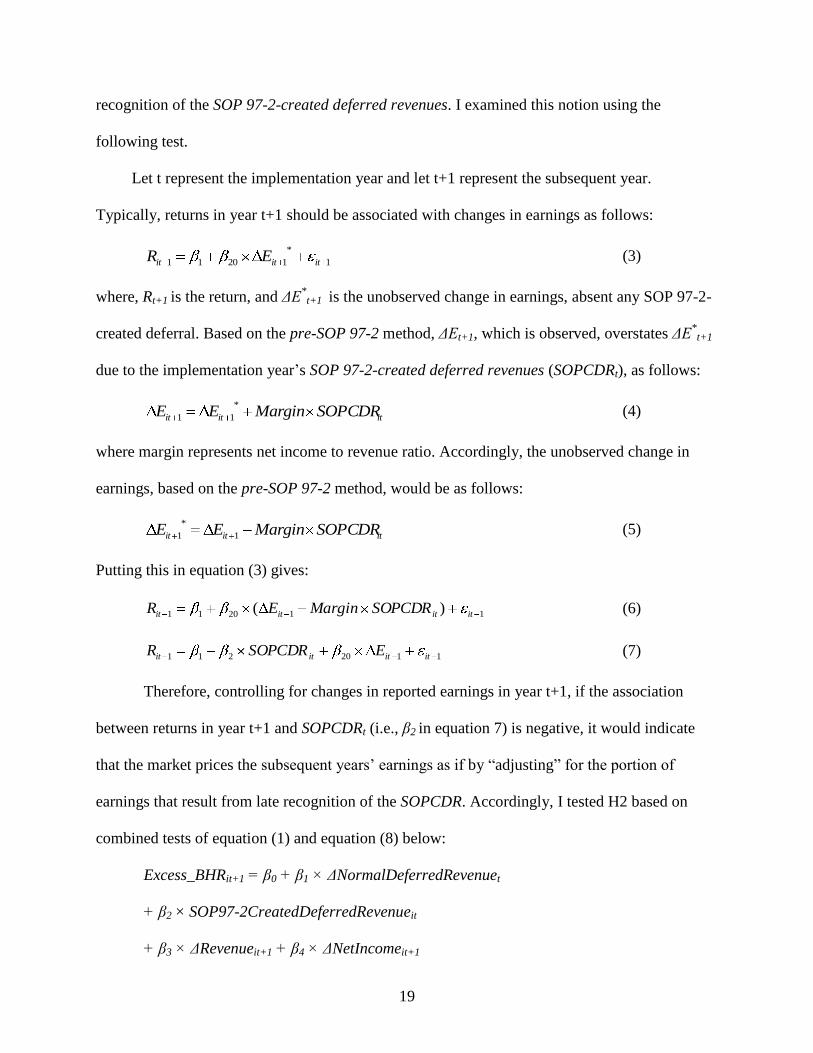
recognition of the SOP 97-2-created deferred revenues. I examined this notion using the
following test.
Let t represent the implementation year and let t+1 represent the subsequent year.
Typically, returns in year t+1 should be associated with changes in earnings as follows:
1
*
12011 ititit ER (3)
where, Rt+1 is the return, and ΔE*
t+1 is the unobserved change in earnings, absent any SOP 97-2-
created deferral. Based on the pre-SOP 97-2 method, ΔEt+1, which is observed, overstates ΔE*
t+1
due to the implementation year’s SOP 97-2-created deferred revenues (SOPCDRt), as follows:
ititit SOPCDRMarginEE*
11 (4)
where margin represents net income to revenue ratio. Accordingly, the unobserved change in
earnings, based on the pre-SOP 97-2 method, would be as follows:
ititit SOPCDRMarginEE 1
*
1 (5)
Putting this in equation (3) gives:
112011 )( itititit SOPCDRMarginER (6)
1120211 itititit ESOPCDRR (7)
Therefore, controlling for changes in reported earnings in year t+1, if the association
between returns in year t+1 and SOPCDRt (i.e., β2 in equation 7) is negative, it would indicate
that the market prices the subsequent years’ earnings as if by ―adjusting‖ for the portion of
earnings that result from late recognition of the SOPCDR. Accordingly, I tested H2 based on
combined tests of equation (1) and equation (8) below:
Excess_BHRit+1 = β0 + β1 × ΔNormalDeferredRevenuet
+ β2 × SOP97-2CreatedDeferredRevenueit
+ β3 × ΔRevenueit+1 + β4 × ΔNetIncomeit+1
20
+ Σ βs × Controlsit+1 + εit+1 (8)
where
Δ = one-year change;
i = 1 to 251 firms;
t = the SOP 97-2 implementation year; and
t+1 = the year subsequent to the SOP 97-2 implementation year.
Results for hypothesis H2
The first column of Table 5 Panel A (equation 2) shows that the contemporaneous returns
are not significantly associated with increases in deferred-revenue accounts. This could be
because, on one hand, increases in deferred-revenue accounts signal future revenues; on the
other, they represent increases in current liabilities. However, the results in the second column
show that disaggregating the deferred-revenue account into SOP 97-2-created deferred revenues
and normal deferred revenues results in a positive coefficient on SOP 97-2-created deferred
revenues. Importantly, this coefficient significantly differs from the coefficient on normal
deferred revenues, but not from the coefficient on reported revenues. This result suggests that the
market considers SOP 97-2-created deferred revenues as revenues and not as normal deferred
revenues.
The first two columns of Table 5 Panel B (equation 8) show that the subsequent year’s
returns are unrelated to the implementation year’s aggregate deferred revenues as well as to its
components (normal deferred revenue and SOP 97-2-created deferred revenues). However, the
third column shows that controlling for the subsequent year’s reported revenues and net income,
the coefficient on implementation year’s SOP 97-2-created deferred revenues becomes negative.
This negative sign suggests that the market prices the subsequent-year earnings as if by
21
subtracting the portion of earnings that results from prior year’s SOP 97-2-created deferred
revenues. Therefore, both the implementation and the subsequent years’ results support the
premise that the pre-SOP 97-2 accounting method more strongly corresponds with market
returns.
I also regressed the market value at the end of the implementation year on disaggregated
balance sheet items. I deflated all dollar-denominated variables by the number of outstanding
shares. Untabulated results show that the coefficients on assets and liabilities are predictably
positive and negative, respectively. Moreover, the coefficient on normal deferred revenue is
predictably negative and does not differ significantly from that on current liabilities. On the
contrary, the coefficient on SOP 97-2-created deferred revenues is positive and significantly
differs from that on current liabilities. Therefore, I obtained similar results using the balance-
sheet items as those obtained using the income-statement items.
Testing hypothesis H3
To test H3, I examined whether a regression specification using proforma earnings more
strongly corresponds with market returns than does the specification using reported earnings. I
calculate proforma revenues and proforma earnings by adding back SOP 97-2-created deferred
revenues. I used the following regression:
Excess_BHRit = β0 + β1 × ΔNormalDeferredRevenuet
+ β2 × ΔProformaRevenueit
+ β4 × ΔProformaNetIncomeit
+ Σ βs × Controlsit + εit (9)
where
Δ = one-year change;
22
ΔProformaRevenue = ΔRevenue + SOP 97-2-created deferred revenues;
ΔProformaNetIncome = ΔNetIncome + SOP 97-2-created deferred revenues;
i = 1 to 251 firms;
t = the SOP 97-2 implementation year.
I used the same control factors as described in equation 2. I examined whether adjusted
R-square of equation 9 exceeds that of equation 2.
Results for hypothesis H3
The third column of Table 5 Panel A shows that using proforma accounting numbers
results in a better specified model. Vuong test shows that the adjusted R-square of specification
using the proforma numbers exceeds that of specification using the reported numbers. This
suggests that if SOP 97-2 had not been implemented, the accounting numbers would more
strongly correspond with market returns than do the reported numbers.
The results of the three hypotheses, using three different research designs, suggest that
the numbers calculated using pre-SOP 97-2 revenue-recognition rules more strongly correspond
with market returns than do those using SOP 97-2.12
Therefore, my study complements Altamuro
et al. (2005) by documenting that implementing SOP 97-2 reduces earnings informativeness in
the software industry, the industry for which these rules were originally created. More
importantly, my results suggest that implementing the current revenue-recognition standard
reduces earnings informativeness of multiple-element firms.
Supplementary question 1: Naïve reaction
Did implementing SOP 97-2 cause any adverse capital market consequences? Some
market participants feared that reporting lower earnings (upon implementing SOP 97-2) could
12
Alternatively, these results could indicate that investors prefer to compare financial statements, which are prepared
using the same accounting rules (Sunder 1973). This explanation however, is less likely because I measure returns
before earnings are announced.
23
adversely affect firms’ financial position and fund-raising abilities.13
Effectively, they feared
that prices might not accurately reflect the mechanical earnings-decreasing effects of SOP 97-2 -
created deferrals. Prior studies (e.g., Lev and Ohlson 1982, Hirshleifer and Teoh 2003)
concluded that the naïve reaction or functional fixation hypothesis cannot be entirely dismissed.
The difference between reported earnings and earnings based on the pre-SOP 97-2
method would arise primarily because of SOP 97-2-created deferrals. The above market
participants’ concerns would be valid if the market prices earnings as they are reported and
correspondingly, prices SOP 97-2-created deferrals as current liabilities. However, my results
suggest that the market prices the SOP 97-2-created deferrals as revenues and not as current
liabilities. Therefore, I do not find statistical support for the notion that reporting lower earnings
upon implementing SOP 97-2 leads to adverse capital market consequences.
Supplementary question 2: Aggressive revenue-recognition before SOP 97-2 was enacted
Were the software firms systematically recognizing revenues prematurely before AICPA
enacted SOP 97-2? AICPA formulated stringent revenue-recognition rules based on this premise
(Carmichael 1998). Accordingly, implementing SOP 97-2 rules would ―correct‖ those software
firms’ revenue-recognition timeliness that had been recognizing revenues prematurely. Such
―correction‖ would result in additional revenue deferrals; the higher the correction, the greater
the additional revenue deferrals. In other words, reporting increases in deferred-revenues
accounts might signal firms’ prior aggressive revenue-recognition practices. Prior studies have
documented that stock prices decline when firms reveal use of aggressive accounting practices.14
13
For example, Haushahn Systems in its response letter states, ―…would have a substantial negative impact on our
financial position.‖ Ascential Software Corp. states in its 1998 10-K filing, ―…will have a material adverse affect on
the Company's revenues, gross margins and operating results. As a result, future capital raising efforts may also be
adversely affected.‖ 14
For example, when firms announce: (1) SEC’s AAER investigations (Feroz, Park, and Pastena 1991); and (2)
accounting restatements (Palmrose, Richardson, and Scholz 2004).
24
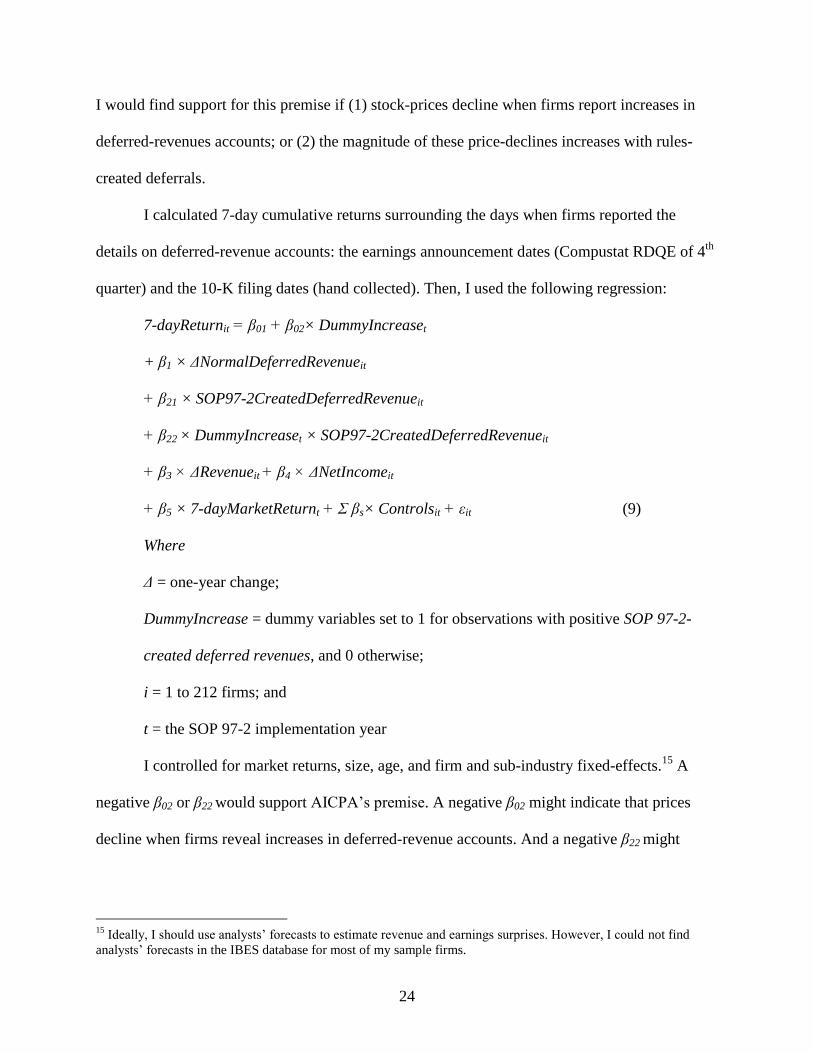
I would find support for this premise if (1) stock-prices decline when firms report increases in
deferred-revenues accounts; or (2) the magnitude of these price-declines increases with rules-
created deferrals.
I calculated 7-day cumulative returns surrounding the days when firms reported the
details on deferred-revenue accounts: the earnings announcement dates (Compustat RDQE of 4th
quarter) and the 10-K filing dates (hand collected). Then, I used the following regression:
7-dayReturnit = β01 + β02× DummyIncreaset
+ β1 × ΔNormalDeferredRevenueit
+ β21 × SOP97-2CreatedDeferredRevenueit
+ β22 × DummyIncreaset × SOP97-2CreatedDeferredRevenueit
+ β3 × ΔRevenueit + β4 × ΔNetIncomeit
+ β5 × 7-dayMarketReturnt + Σ βs× Controlsit + εit (9)
Where
Δ = one-year change;
DummyIncrease = dummy variables set to 1 for observations with positive SOP 97-2-
created deferred revenues, and 0 otherwise;
i = 1 to 212 firms; and
t = the SOP 97-2 implementation year
I controlled for market returns, size, age, and firm and sub-industry fixed-effects.15
A
negative β02 or β22 would support AICPA’s premise. A negative β02 might indicate that prices
decline when firms reveal increases in deferred-revenue accounts. And a negative β22 might
15
Ideally, I should use analysts’ forecasts to estimate revenue and earnings surprises. However, I could not find
analysts’ forecasts in the IBES database for most of my sample firms.
25
indicate that these price-declines increase with magnitude of increases in deferred-revenue
accounts.
The results, presented in Table 6, show that neither β02 nor β22 is significantly negative.
Therefore, I do not find statistical support for the premise that firms systematically recognized
revenues prematurely before AICPA enacted SOP 97-2.
Supplementary tests 3: Firm disclosures
How did investors obtain information to distinguish SOP 97-2-created deferred revenues
from normal deferred revenues? I examined one possible source of investor information – firms’
narrative disclosures in their 10-K filings. SEC rules require firms to discuss the effects of
implementing a new accounting rule, such as SOP 97-2, both before and after its
implementation: (1) before its implementation, SAB 74 (SEC 1987) requires firms to discuss the
likely changes; and (2) after its implementation, MD&A rules (SEC 1989) require firms to
discuss the material changes in line-items, especially if these changes relate to revenue items.
Moreover, academic research predicts that firms will increase their narrative disclosures when
accounting rules reduce firms’ accounting discretion (Dye 1985, Kasznik 1996).
Table 7 Panel A presents a sample of the before disclosures. In their 10-K filings, most
firms described that they planned to implement SOP 97-2 in their next fiscal year. However, they
did not provide many details about forthcoming accounting changes. Most firms stated that they
did not expect significant changes from implementing the SOP 97-2 rules. Table 7 Panel B
presents a sample of the after disclosures. Similar to the before disclosures, most firms did not
provide many details on SOP 97-2 effects. Firms typically stated: ―No material effect to the
company’s operation or financial position taken as a whole,‖ (e.g., Nyfix Inc.). Very few firms
quantified the effects of implementing SOP 97-2 rules. Therefore, I conjecture that the market
26
relied on non-financial sources to distinguish between the two deferred-revenue components.
How the market prices these two components differently remains a topic for future research.
V. CONCLUSIONS
Revenue is among the largest and most value-relevant items in firms’ financial
statements. However, it is not easy to determine revenues for firms that use the ―customer-
centric‖ and ―relationship marketing‖ approach (i.e., those firms that bundle multiple products
and services and deliver them over extended periods). As more and more firms adopt a
relationship-marketing approach, the complexity of revenue-recognition issues increases.
The dilemma for standard setters remains: What is the optimum level of objectivity and
verifiability requirements that would enhance the two important ―qualitative characteristics‖ of
financial statements: relevance and reliability (FASB 2005)? Standard setters’ rules-making
processes often involve trade-offs between these two characteristics. On the one hand, if standard
setters make rules too conservative, by requiring firms to comply with highly objective and
verifiable conditions, revenues may not reflect economic performance in a timely manner
(affects relevance). On the other hand, if standard setters make the rules too lax, firms can use
this freedom to recognize revenues prematurely (affects reliability).
Standard setters would have faced a similar dilemma when they formulated SOP 97-2. In
response to software firms’ perceived premature revenue-recognition practices, AICPA increased
objectivity and verifiability requirements before firms could recognize revenues from multiple-
element contracts. However, estimating whether a multiple-element firm has ―earned‖ revenues
routinely involves subjective estimates. For example: 1) in allocating aggregate contract value to
various elements that are not sold separately and 2) in deciding whether an element provides
functional value pending delivery of another element. Nevertheless, SOP 97-2 requires a firm to
27
defer recognizing entire revenues when it cannot objectively and verifiably determine the extent
of earned revenues from a multiple-element contract.
I find that implementing SOP 97-2 increases revenue deferrals and reduces software
firms’ earnings informativeness. In other words, imposing highly objective and verifiable
conditions before firms can recognize revenues from multiple-element contracts leads to deferral
of revenues, which managers would have otherwise recognized using subjective estimates. My
finding suggests that recognizing such deferred amounts in a timely manner conveys more useful
information to financial statement users.
My findings should be useful to FASB in its current deliberations (FASB/IASB 2007).
FASB is evaluating alternative revenue-recognition approaches, which include: (1) the
measurement model (i.e., the fair-value approach) and (2) the allocation model (i.e., the
customer-consideration approach). The latter model is constructively similar to the earnings-
completion model. My study suggests that imposing highly objective conditions for multiple-
element revenue recognition could lead to economic effects similar to those from SOP 97-2
implementation.
Admittedly, I have examined only one criterion – how accounting numbers correspond
with securities prices – among several that guide the standard setters’ decisions. Holthausen and
Watts (2001) conclude that evaluating accounting rules using only the relevance criterion does
not adequately describe the rules-setting process. Nevertheless, Barth et al. (2001) argue that
share prices reflect accounting numbers, only if the relevant information is measured and
reflected reliably in the accounting numbers.
28
References
Aboody, D., M. E. Barth and R. Kasznik. (2004). SFAS 123 stock-based compensation expense
and equity market values. The Accounting Review 79: 251-275.
American Institute of Certified Public Accountants (AICPA). 1981 Accounting for Performance
of Construction Type and Certain Production Type Contracts. Statement of Position (SOP)
81-1.
American Institute of Certified Public Accountants (AICPA). 1991. Software Revenue
Recognition. Statement of Position (SOP) 91-1.
American Institute of Certified Public Accountants (AICPA). 1997. Software revenue
Recognition. Statement of Position (SOP) 97-2.
Altamuro, J., A. L. Beatty, and J. P. Weber. 2005. The effects of accelerated revenue recognition
on earnings management and earnings informativeness: Evidence from SEC staff accounting
bulletin No. 101. The Accounting Review 40(2): 373-401.
Ball, R. J. 1972. Changes in accounting techniques and stock prices. Empirical research in
Accounting: Selected Studies. Journal of Accounting Research 10: 159-78.
Barth, M. E., W. H. Beaver, and W. R. Landsman. 2001. The relevance of the value relevance
literature for financial accounting standard setting: another view. Journal of Accounting and
Economics 31: 77–104.
Beaver, W. H. 1972. The behavior of security prices and its implications for accounting research
(methods). Committee Reports. Supplement to The Accounting Review: 407-437.
Bowen, R. M., A. K. Davis, and S. Rajgopal. 2002. Determinants of revenue-reporting practices
for internet firms. Contemporary Accounting Research 19(4): 523-562.
Carmichael, D. R. 1998. Software revenue recognition under SOP 97-2. CPA Journal 68(7):
44-51
Choi, S. Y., and A. B. Whinston. 1999. The future of e-commerce: integrate and customize.
Computer 32(1): 133-134.
Committee of Sponsoring Organizations of the Treadway Commission (COSO). 1999.
Fraudulent financial reporting: 1987-1997 - An analysis of U.S. public companies.
Damodaran, A. 2002. Investment valuation: Tools and techniques for determining the value of
any asset, Second Edition. Wiley.
Davis, K. A. 2002. The value relevance of revenue for internet firms: Does reporting grossed-up
or barter revenue make a difference? Journal of Accounting Research 40 (2): 445–477.
Dye, R. 1985. Strategic accounting choice and the effects of alternative financial reporting
requirements. Journal of Accounting Research 23(2): 544-574.
Ertimur, Y. and J. Livnat. 2003. Differential market reactions to revenue and expense surprises.
Review of Accounting Studies 8: 185-211.
Feroz, E.H., K. Park; and V.S. Pastena. 1991. The financial and market effects of the SEC's
accounting and auditing enforcement releases. Journal of Accounting Research 29:107-148.

29
Financial Accounting Standards Advisory Council (FASAC). 2006. Results of the Annual
Survey on the Priorities of the FASB (October 2006).
Financial Accounting Standards Board (FASB). 1984. Concepts Statement No. 5. Recognition
and Measurement in Financial Statements of Business Enterprises (December 1984).
Financial Accounting Standards Board (FASB). 1985a. Financial Accounting Standards No. 86.
Accounting for the Costs of Computer Software to Be Sold, Leased, or Otherwise Marketed.
(August 1985).
Financial Accounting Standards Board (FASB). 2000. EITF00-21. Revenue Arrangements with
Multiple Deliverables (July 2000).
Financial Accounting Standards Board (FASB). 2002. Minutes of the May 15, 2002 board
meeting—Proposal for a New Agenda Project on Issues Related to the Recognition.
Financial Accounting Standards Board. 2005. Relevance and Reliability. The FASB Report
(February 28, 2005).
Financial Accounting Standards Board/ International Accounting Standards Board
(FASB/IASB). 2007. Minutes of the October 22, 2007 FASB-IASB joint board meeting.
Fields, T., T. Lys, and L.Vincent. 2001, Empirical research on accounting choice. Journal of
Accounting & Economics 31, 255-307.
Fuerderer, R., A. Herrmann, and G, Wuebker. 1999. Optimal bundling: Marketing strategies for
improving economic performance. Springer; 1 edition
Galbraith, J. R. 2002. Organizing to deliver solutions. Organizational Dynamics 31(2): 194-206.
General Accounting Office (GAO). 2003. Financial Statement Restatements Database. Report
03-395R. Washington D.C., Government Printing Office.
Ghosh, B. and S. Balachander. 2007. Competitive bundling and counter-bundling with generalist
and specialist firms. Management Science 53(1): 159-168.
Healy, P. M. and J. M. Wahlen. 1999. A review of the earnings management literature and its
implications for standard setting. Accounting Horizons (December): 365-383.
Hirshleifer, D., and Teoh, S. H. 2003. Limited attention, information disclosure, and financial
reporting. Journal of Accounting and Economics 36(1-3):337-386
Kasznik, R. 1996. Financial reporting discretion and corporate voluntary disclosure: Evidence
from the software industry. Working paper, Stanford University.
Kothari, S. P. 2001. Capital market research in accounting. Journal of Accounting and
Economics 31(1): 233-253
KPMG. 2005. Software Revenue Recognition. An Analysis of SOP 97-2 and Related Guidance.
Second Edition.
Lev, B., and J. A. Ohlson. 1982. Market-based empirical research in accounting: A review,
interpretation, and extension. Journal of Accounting Research 20 (supplement): 249-322
Lowell, M. J. 1994. Software revenue recognition. The CPA Journal Online (August)
30
MacDonald, E. 1996. Accounting group considers forcing software companies to defer revenue.
Wall Street Journal (November 11).
McAfee, A., and E. Brynjolfsson. 2007. Dog Eat Dog. The Wall Street Journal (April 28): R.10.
Moffeit, K. S., and A. E. Eikner. 2003. Implementation of SAB 10. CPA Journal Online
(January).
Morris, J., 1992. Software Industry Accounting. John Wiley & Sons Inc; 1 edition (November
23, 1992), New York.
Mulford, C. W. 2006. Capitalization of software development costs – A survey of accounting
practices in the software industry. A monograph from Georgia Tech. College of
Management.
Osterland, A. 2000. Hard Lessons. CFO Magazine (September).
Palmrose, Z. V., Richardson, V. J., Scholz, S. W., 2004. Determinants of market reactions to
restatement announcements. Journal of Accounting and Economics 37, 59-89.
Palmrose, Z. V., Scholz. S., and Wahlen, J. M. 2004. The circumstances and legal consequences
of non-GAAP reporting: Evidence from restatements. Contemporary Accounting Research
21(1):139-190.
PricewaterhouseCoopers (PWC). 2005. Software Revenue Recognition. A user-friendly guide
for navigating through the many complexities. Fourth Edition.
Public Company Accounting Oversight Board. 2007. Report on the PCAOB'S 2004, 2005, and
2006 Inspections of Domestic Triennially Inspected Firms.
Reily, D. 2007. Apple Gets a Bruise by Blaming a $ 1.99 Fee on Accounting Rules. The Wall
Street Journal Eastern edition (Jan 20): B.3.
Securities and Exchange Commission (SEC). 1987. Staff Accounting Bulletin No. 74 (SAB 74),
Disclosure of the Impact that Recently Issued Accounting Standards will have on the
Financial Statements of the Registrant when Adopted in a Future Period.
Securities and Exchange Commission (SEC). 1989. SEC Interpretation: Management's
Discussion and Analysis of Financial Condition and Results of Operations; Certain
Investment Company Disclosures (May 18).
Securities and Exchange Commission (SEC). 1999. Staff Accounting Bulletin No. 101 (SAB
101), Revenue Recognition in Financial Statements (December 3).
Securities and Exchange Commission (SEC). 2003. Staff Accounting Bulletin No. 104 (SAB
104), Revenue Recognition, Corrected Copy (December 17).
Sondhi, A. C. 2006. SOP 97-2: Current issues in VSOE accounting. Presentation to CFOs
available at CFO.com
Sunder, S. 1973. Relationship between accounting changes and stock prices: Problems of
measurement and some empirical evidence. Journal of Accounting Research 11: 1-45.
Zhang, Y. 2005. Revenue recognition timing and attributes of reported revenue: The case of
software industry's implementation of SOP 91-1. Journal of Accounting and Economics.
39(3): 535-561.
31
Appendix A
Significant changes in revenue-recognition practices upon implementing SOP 91-1, SOP 97-2 and SAB 101*
Panel A: SOP 91-1 implementation in the software industry
Revenue recognition criteria
Before After Significant changes in industry practices
A 1983, survey results showed
a substantial diversity in
revenue recognition practices
ranging from the very
conservative (on customer
payment) to the decidedly
aggressive (immediately on
contract signing). 15% of the
companies used contract
signing-date to recognize
entire revenues.
1. Delivered or
performed License with no vendor obligations: Recognize revenue upon delivery of the
software.
License with insignificant vendor obligations: Accrue costs of insignificant
obligations or defer a pro-rata portion of revenue and recognize it ratably as
the costs are incurred.
License with significant vendor obligations: Recognize revenue according to
the contract accounting method or as a service transaction
Post-contract support: Recognize revenue over the period during which the
services are provided.
2. Realizable
Panel B: SOP 97-2 implementation in the software industry
Revenue recognition criteria
Before After Significant changes in industry practices
1. Delivered or performed 1. Evidence of
arrangement
2. Delivered or
performed
(expanded
definition)
Element-by-element revenue recognition
If functionality of a delivered element requires delivery of another element,
then revenues for that element should be deferred. Otherwise, firm should
recognize entire revenues ratably (SOP 81-1).
If the contract promises a ―when-and-if available‖ element, such as an
unspecified upgrade, such an element creates a contingency that should be
accounted as a separate element.
2. Realizable
3. Realizable
4. Determinable
fees
Firm should objectively and verifiably determine fair values of all elements
based on its own prior transactions. Otherwise it should defer revenues in its
entirety or recognize them ratably (SOP 81-1).
32
Appendix A continued
Significant changes in firms’ revenue-recognition practices upon implementing SOP 91-1, SOP 97-2 and SAB 101*
Panel C: SAB 101/SAB 104 implementation in the non-software industries
Revenue-recognition criteria
Before After Significant changes in industry practices ‡
Several industry-
specific and general
standards
1. Evidence of
arrangement
2. Delivered or
performed†
3. Realizable
4. Determinable fees†
†Multiple-element
conditions later clarified
through SAB 104 (SEC
2000) and EITF00-21
(FASB 2002)
Licensing arrangements: Delivery and revenue recognition don't occur until
the term of the license begins.
Layaway programs: Sellers should not record revenue until the product is
delivered to the customer.
Upfront fees: Even if nonrefundable, these fees should be deferred and
recognized over the term of the agreement.
Setup services: Should be recognized on a straight-line basis over the term of
the contract, even if most of the costs are incurred up front.
Contingent rent: Income contingent on a factor other than time should be
recorded only when the contingency is resolved.
Rental income: Retailers can recognize only the rental income from leased or
licensed departments, not that department's revenues.
‡92% of firms that changed their revenue-recognition practices did it to comply
with the new delivery condition.
*References: Lowell (1994), Carmichael (1998), Osterland (2000), and Moffeit and Eikner (2003).
33
Appendix B
Representative comments received by AICPA on the draft SOP 97-2*
Respondent/Issue Quote from the comment letters
Firm should defer recognizing revenues corresponding to a delivered element if it cannot establish that element’s VSOE
Pricewaterhouse We are troubled that in some multiple element arrangements the ED’s requirements for VSOE of fair value will lead
to deferral of all revenue, even in situations where software products having clear value and immediate utility to
customer have been delivered. At first blush, this seems unduly harsh.
BriarCliff College Deferring revenue recognition for all other elements in a multiple element arrangement because one element in bundle
could not be fairly valued seems too conservative. This is like stopping all traffic on freeway because one car is
broken down.
Lucent Corp We are troubled by the underlying assumption that all software companies can and do market all of their products
separately. There are some software companies which actively bundle their products and services…..these companies
may not be able to comply with VSOE evidence criteria.
Candle Corporation Due to many pricing considerations and variables described above, the permutations and competitive pricing makes it
impractical to meet VSOE requirements
Massachusetts Society of CPAs We believe that the concept of VSOE may in fact be quite difficult for software companies to actually apply in their
business….An ―all or nothing‖ approach can significantly swing revenues…..
Firm cannot recognize revenue corresponding to a delivered element until it delivers all elements essential for the functioning of that element
Lucent Technologies All of the criteria to recognize revenue may be met for the most significant elements, yet all of the revenue would
have to be deferred solely because… products sold in bundled package. E.g. services compose between 1% and 15%
of total revenue… the company would be forced to defer 100% of revenue until 100% of services were performed….
Pricewaterhouse If for example, the vendor never sells training services on a discrete basis, the ED would seem to require deferral of all
revenue from the arrangement until the delivery of ancillary training services are completed. In many circumstances,
we do not believe such accounting would be appropriate.
Firm should allocate and defer recognizing revenues corresponding to specified upgrades. If the firm cannot determine the amount to allocate, it should defer
entire revenues from the contract
Hausahn Systems and Engineers …Since we do not charge for upgrades, it is unclear whether we would have to allocate…
Arthur Anderson SOP should be expanded with a discussion of how to determine VSOE of fair value of an upgrade right
Lucent Technologies … We believe that it would be inappropriate to defer the entire amount of software revenue as a result of specifies
upgrade/enhancement that is not of significance to the transaction.
Firm should defer revenues for the entire amount at risk due to acceptance/warranty/performance clause/right of return:
Arthur Anderson We believe that routine acceptance clauses should not preclude revenue recognition at delivery.
I2 Technologies In large enterprise software offerings where customer is spending million of dollars for mission critical software, the
customer often rightfully requires a warranty for a year or more. ….I believe this should not impair revenue
recognition
34
Appendix B continued
Representative comments received by AICPA on the draft SOP 97-2*
Respondent/Issue Quote from the comment letters
Implementing SOP 97-2 rules might lead to violation of matching principle
Lucent Technologies Bulk of costs will already have been expensed…while revenue will not be recognized until all elements are
delivered….this could be a departure from matching principle and could be very misleading
Hausahn Systems and Engineers In our case, approximately 90% of baseline development costs are expensed as period cost. Deferral of revenue will
probably result in a lack of matching revenue and expense.
Firm should recognize license revenues ratably over the service period if it cannot establish VSOE for the license
Inso Corp If sufficient VSOE does not exist to allocate the license fee to the separate elements, the entire arrangement fee should
be recognized ratably over the period during which PCS is expected to be provided.
California Society of CPAs To impose the ―separate‖ pricing criteria is not realistic and will generally preclude revenue recognition on initial
delivery …..
Firms might find it difficult to establish VSOE based primarily on prior transactions
California Society of CPAs We are concerned with the ability to estimate the extent to which that price protection will be required ….given that
much of the software industry is known for its short product cycles and intense competition.
Inso Corporation We believe the concept of VSOE may be difficult for software companies to apply in practice….concept of fair value
is the value a willing buyer will spend.
Firm should defer revenues for collections beyond a 12-month period
Arthur Anderson It is unclear….
1. revenues should be recognized on cash basis.
2. beyond 12 months be recognized in the (later) period when they become due and within 12 months
recognized at delivery
3. In the period they become due within 12 months
Cash basis is inconsistent with other areas of revenue recognition (e.g. real estate ... when entire revenue is recognized
on down payment)
J. D. Edwards Revenue would be understated if all of the vendor obligations have been met and only negotiated payment terms
remain.
Firm should defer revenues for the entire amount of coupons issued instead of accruing only the costs of expected redemption
Mysoftware Company We would have to defer 100% of the revenues of the free products in redemption and coupon implementations… We
have been accruing the redemption costs rather than defer revenues.
Software Publishers Association The accounting used for coupons in the retail/grocery industry should be considered whereby the seller recognizes
revenue and estimated costs of providing the additional software products are accrued.
*I obtained copies of comment letters from the AICPA library.
35
Appendix C
Definitions of variables
Assets = Compustat DATA6
Revenue = Compustat DATA12
Net income = Compustat DATA172
Market value = Common shares outstanding (Compustat DATA25) × fiscal year end closing price
(Compustat DATA199).
Age (in years) = Fiscal year – year of incorporation. I obtained incorporation date from the 10-K
filings.
Implementation year = Fiscal year in which firm starts applying the SOP 97-2 revenue-recognition rules.
I obtained this information from firm’s 10-K filings by studying the ―revenue
recognition‖ section in the ―significant accounting policies‖ footnote.
Prescribed implementation year = Firms’ fiscal years beginning after December 15, 1997. For firms with fiscal year
ending June to November, the prescribed year was fiscal year (Compustat
YEARA) 1999. For all other firms, the prescribed year was fiscal year 1998.
After = Dummy variables set to 1 for observations in the prescribed implementation year,
and 0 for the year prior to that year.
Return on assets = Net income (Compustat DATA172) / Total assets (DATA6).
Return on equity = [Share price (Compustat DATA199) – Lag(Share price)]/Lag(share price).
Revenue to assets ratio = Revenue (Compustat DATA12) / Total Assets (DATA6).
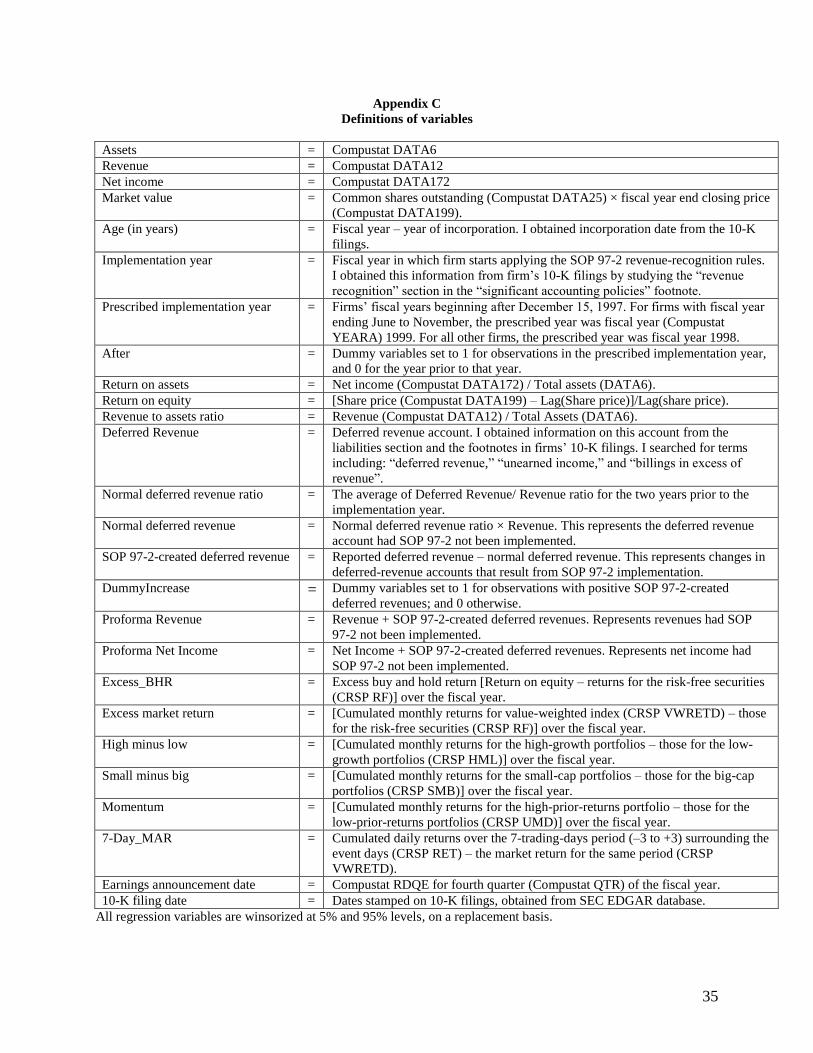
Deferred Revenue = Deferred revenue account. I obtained information on this account from the
liabilities section and the footnotes in firms’ 10-K filings. I searched for terms
including: ―deferred revenue,‖ ―unearned income,‖ and ―billings in excess of
revenue‖.
Normal deferred revenue ratio = The average of Deferred Revenue/ Revenue ratio for the two years prior to the
implementation year.
Normal deferred revenue = Normal deferred revenue ratio × Revenue. This represents the deferred revenue
account had SOP 97-2 not been implemented.
SOP 97-2-created deferred revenue = Reported deferred revenue – normal deferred revenue. This represents changes in
deferred-revenue accounts that result from SOP 97-2 implementation.
DummyIncrease = Dummy variables set to 1 for observations with positive SOP 97-2-created
deferred revenues; and 0 otherwise.
Proforma Revenue = Revenue + SOP 97-2-created deferred revenues. Represents revenues had SOP
97-2 not been implemented.
Proforma Net Income = Net Income + SOP 97-2-created deferred revenues. Represents net income had
SOP 97-2 not been implemented.
Excess_BHR = Excess buy and hold return [Return on equity – returns for the risk-free securities
(CRSP RF)] over the fiscal year.
Excess market return = [Cumulated monthly returns for value-weighted index (CRSP VWRETD) – those
for the risk-free securities (CRSP RF)] over the fiscal year.
High minus low = [Cumulated monthly returns for the high-growth portfolios – those for the low-
growth portfolios (CRSP HML)] over the fiscal year.
Small minus big = [Cumulated monthly returns for the small-cap portfolios – those for the big-cap
portfolios (CRSP SMB)] over the fiscal year.
Momentum = [Cumulated monthly returns for the high-prior-returns portfolio – those for the
low-prior-returns portfolios (CRSP UMD)] over the fiscal year.
7-Day_MAR = Cumulated daily returns over the 7-trading-days period (–3 to +3) surrounding the
event days (CRSP RET) – the market return for the same period (CRSP
VWRETD).
Earnings announcement date = Compustat RDQE for fourth quarter (Compustat QTR) of the fiscal year.
10-K filing date = Dates stamped on 10-K filings, obtained from SEC EDGAR database.
All regression variables are winsorized at 5% and 95% levels, on a replacement basis.
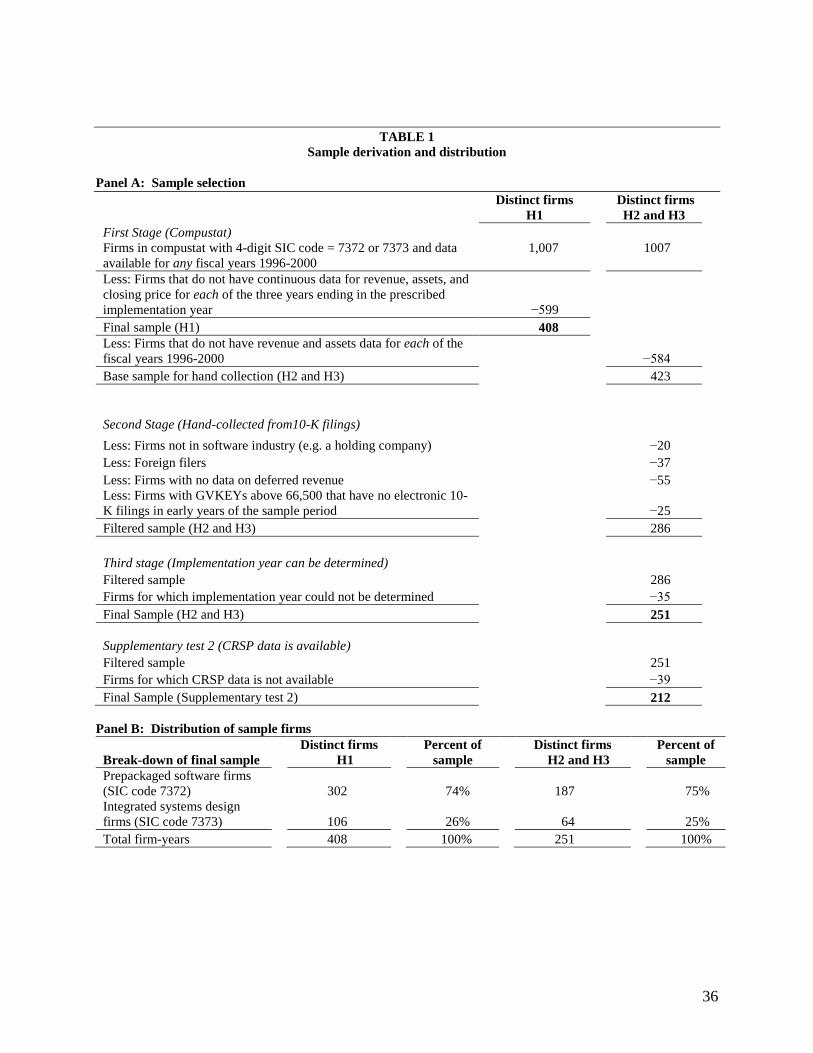
36
TABLE 1
Sample derivation and distribution
Panel A: Sample selection
Distinct firms
H1
Distinct firms
H2 and H3
First Stage (Compustat)
Firms in compustat with 4-digit SIC code = 7372 or 7373 and data
available for any fiscal years 1996-2000
1,007 1007
Less: Firms that do not have continuous data for revenue, assets, and
closing price for each of the three years ending in the prescribed
implementation year −599
Final sample (H1) 408
Less: Firms that do not have revenue and assets data for each of the
fiscal years 1996-2000
−584
Base sample for hand collection (H2 and H3) 423
Second Stage (Hand-collected from10-K filings)
−20 Less: Firms not in software industry (e.g. a holding company)
Less: Foreign filers −37
Less: Firms with no data on deferred revenue −55
Less: Firms with GVKEYs above 66,500 that have no electronic 10-
K filings in early years of the sample period
−25
Filtered sample (H2 and H3) 286
Third stage (Implementation year can be determined)
Filtered sample 286
Firms for which implementation year could not be determined −35
Final Sample (H2 and H3) 251
Supplementary test 2 (CRSP data is available)
Filtered sample 251
Firms for which CRSP data is not available −39
Final Sample (Supplementary test 2) 212
Panel B: Distribution of sample firms
Break-down of final sample
Distinct firms
H1
Percent of
sample
Distinct firms
H2 and H3
Percent of
sample
Prepackaged software firms
(SIC code 7372)
302
74%
187
75%
Integrated systems design
firms (SIC code 7373)
106
26%
64
25%
Total firm-years 408 100% 251 100%
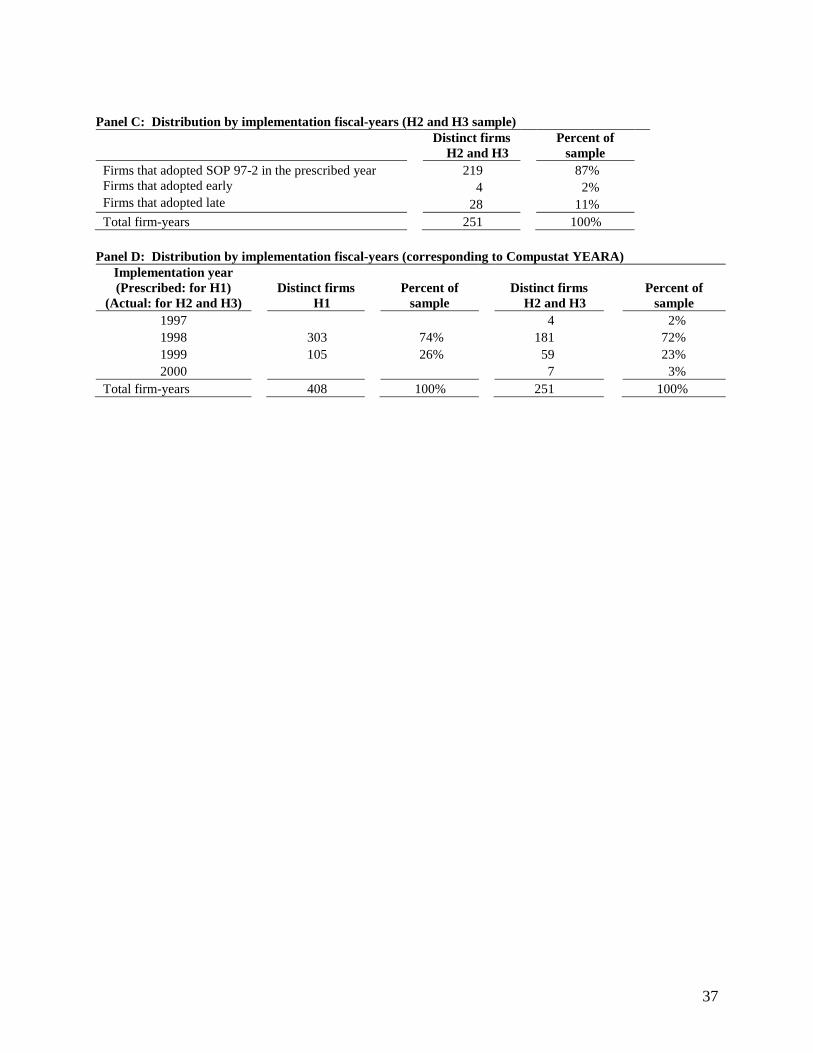
37
Panel C: Distribution by implementation fiscal-years (H2 and H3 sample)
Distinct firms
H2 and H3
Percent of
sample
Firms that adopted SOP 97-2 in the prescribed year 219 87%
Firms that adopted early 4 2%
Firms that adopted late 28 11%
Total firm-years 251 100%
Panel D: Distribution by implementation fiscal-years (corresponding to Compustat YEARA)
Implementation year
(Prescribed: for H1)
(Actual: for H2 and H3)
Distinct firms
H1
Percent of
sample
Distinct firms
H2 and H3
Percent of
sample
1997 4 2%
1998 303 74% 181 72%
1999 105 26% 59 23%
2000 7 3%
Total firm-years 408 100% 251 100%
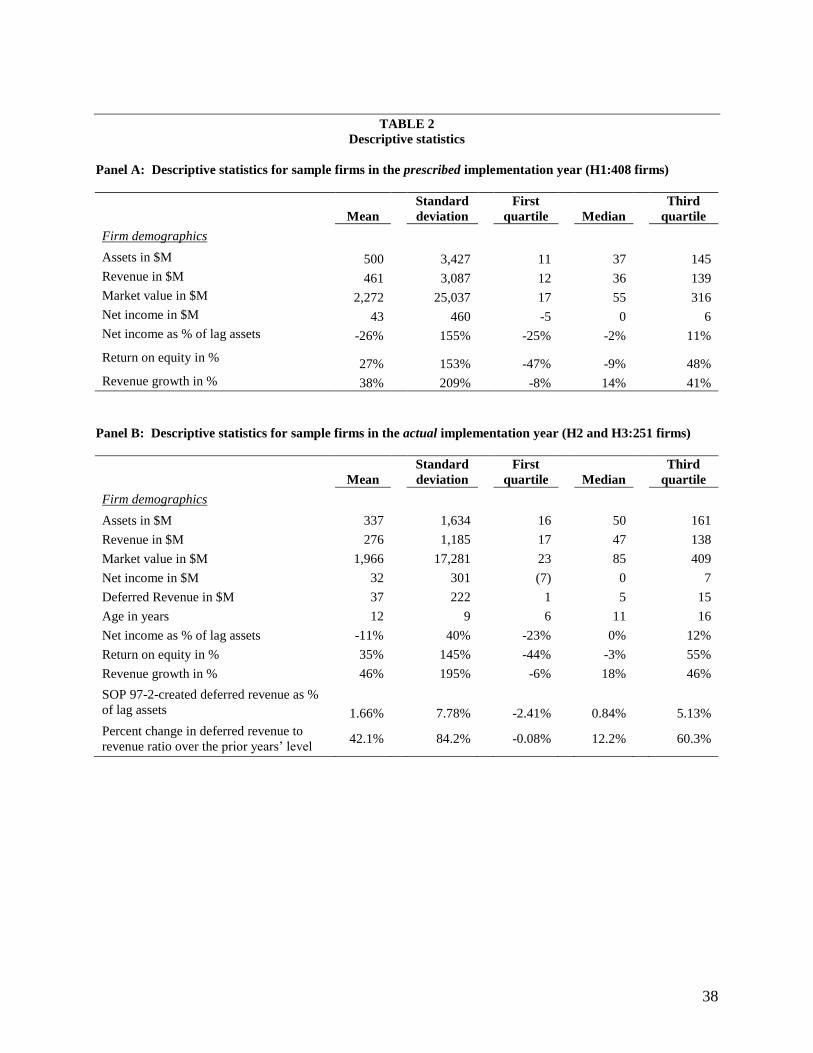
38
TABLE 2
Descriptive statistics
Panel A: Descriptive statistics for sample firms in the prescribed implementation year (H1:408 firms)
Mean
Standard
deviation
First
quartile Median
Third
quartile
Firm demographics
Assets in $M 500 3,427 11 37 145
Revenue in $M 461 3,087 12 36 139
Market value in $M 2,272 25,037 17 55 316
Net income in $M 43 460 -5 0 6
Net income as % of lag assets -26% 155% -25% -2% 11%
Return on equity in % 27%
153%
-47%
-9%
48%
Revenue growth in % 38% 209% -8% 14% 41%
Panel B: Descriptive statistics for sample firms in the actual implementation year (H2 and H3:251 firms)
Mean
Standard
deviation
First
quartile Median
Third
quartile
Firm demographics
Assets in $M 337 1,634 16 50 161
Revenue in $M 276 1,185 17 47 138
Market value in $M 1,966 17,281 23 85 409
Net income in $M 32 301 (7) 0 7
Deferred Revenue in $M 37 222 1 5 15
Age in years 12 9 6 11 16
Net income as % of lag assets -11% 40% -23% 0% 12%
Return on equity in % 35% 145% -44% -3% 55%
Revenue growth in % 46% 195% -6% 18% 46%
SOP 97-2-created deferred revenue as %
of lag assets 1.66% 7.78% -2.41% 0.84% 5.13%
Percent change in deferred revenue to
revenue ratio over the prior years’ level 42.1% 84.2% -0.08% 12.2% 60.3%
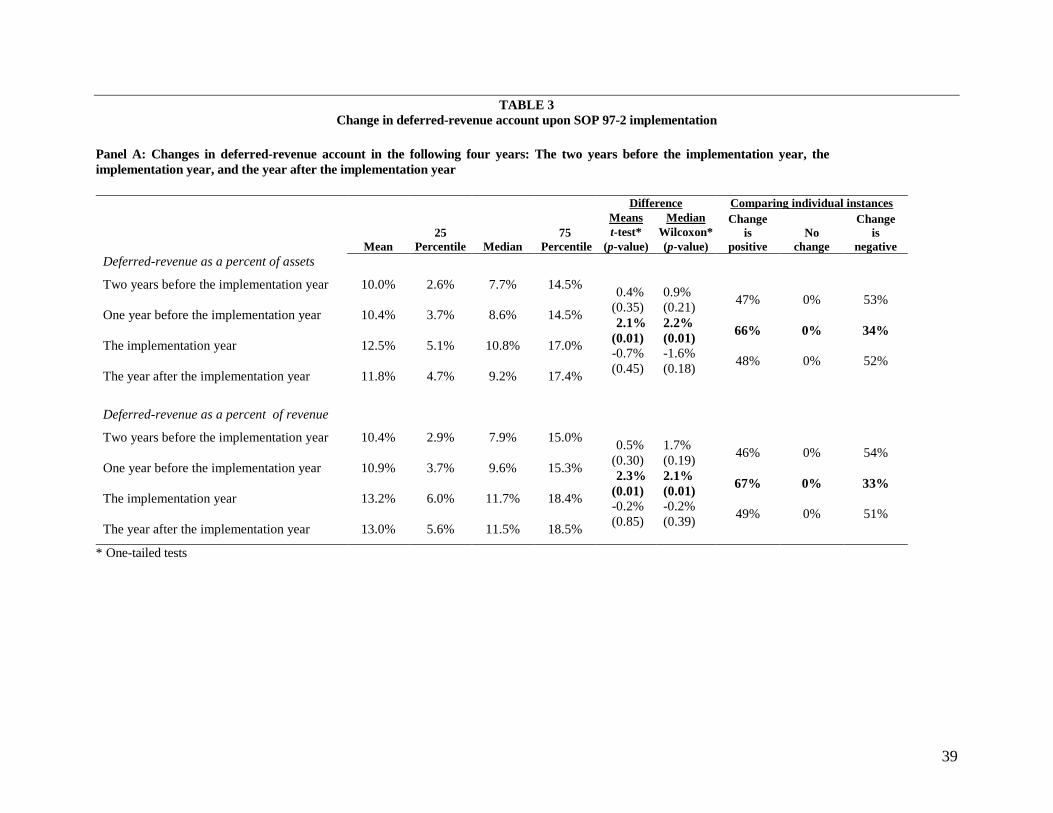
39
TABLE 3
Change in deferred-revenue account upon SOP 97-2 implementation
Panel A: Changes in deferred-revenue account in the following four years: The two years before the implementation year, the
implementation year, and the year after the implementation year
Mean
25
Percentile Median
75
Percentile
Difference Comparing individual instances
Means Median Change
is
positive
No
change
Change
is
negative
t-test* Wilcoxon*
(p-value) (p-value)
Deferred-revenue as a percent of assets
Two years before the implementation year 10.0% 2.6% 7.7% 14.5%
0.4% 0.9% 47% 0% 53%
One year before the implementation year 10.4% 3.7% 8.6% 14.5% (0.35) (0.21)
2.1% 2.2% 66% 0% 34%
The implementation year 12.5% 5.1% 10.8% 17.0% (0.01) (0.01)
-0.7% -1.6% 48% 0% 52%
The year after the implementation year 11.8% 4.7% 9.2% 17.4% (0.45) (0.18)
Deferred-revenue as a percent of revenue
Two years before the implementation year 10.4% 2.9% 7.9% 15.0%
0.5% 1.7% 46% 0% 54%
One year before the implementation year 10.9% 3.7% 9.6% 15.3% (0.30) (0.19)
2.3% 2.1% 67% 0% 33%
The implementation year 13.2% 6.0% 11.7% 18.4% (0.01) (0.01)
-0.2% -0.2% 49% 0% 51%
The year after the implementation year 13.0% 5.6% 11.5% 18.5% (0.85) (0.39)
* One-tailed tests
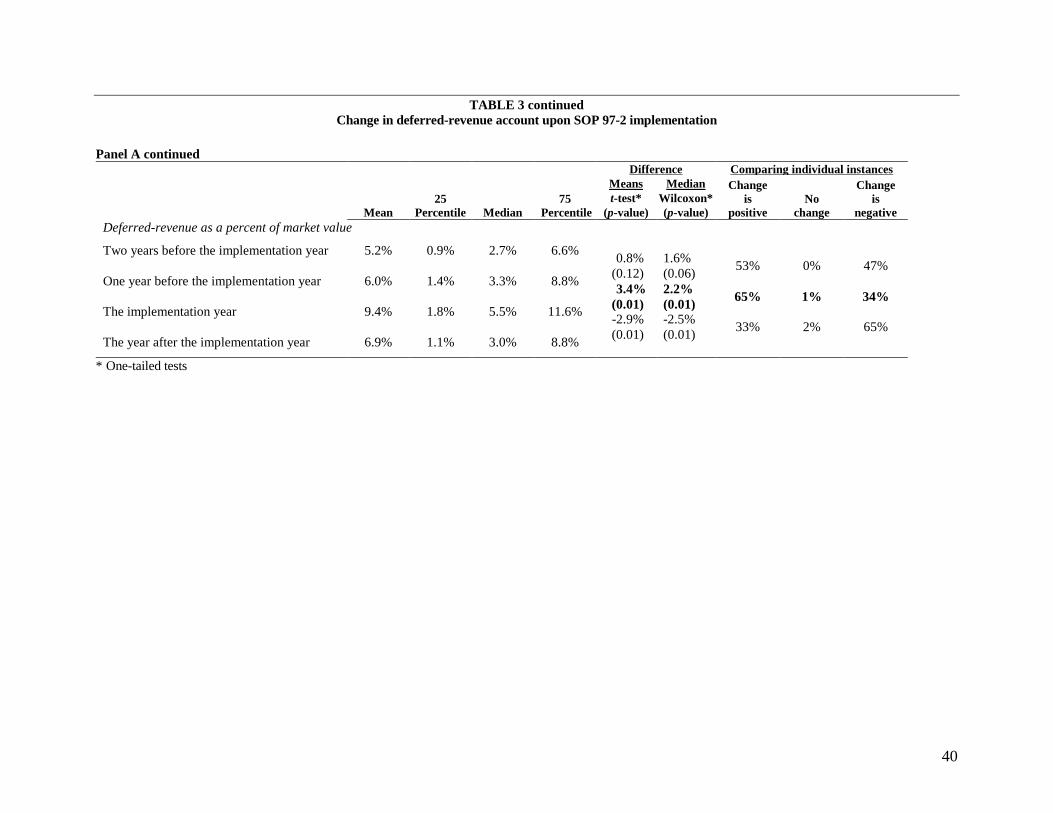
40
TABLE 3 continued
Change in deferred-revenue account upon SOP 97-2 implementation
Panel A continued
Mean
25
Percentile Median
75
Percentile
Difference Comparing individual instances
Means Median Change
is
positive
No
change
Change
is
negative
t-test* Wilcoxon*
(p-value) (p-value)
Deferred-revenue as a percent of market value
Two years before the implementation year 5.2% 0.9% 2.7% 6.6%
0.8% 1.6% 53% 0% 47%
One year before the implementation year 6.0% 1.4% 3.3% 8.8% (0.12) (0.06)
3.4% 2.2% 65% 1% 34%
The implementation year 9.4% 1.8% 5.5% 11.6% (0.01) (0.01)
-2.9% -2.5% 33% 2% 65%
The year after the implementation year 6.9% 1.1% 3.0% 8.8% (0.01) (0.01)
* One-tailed tests
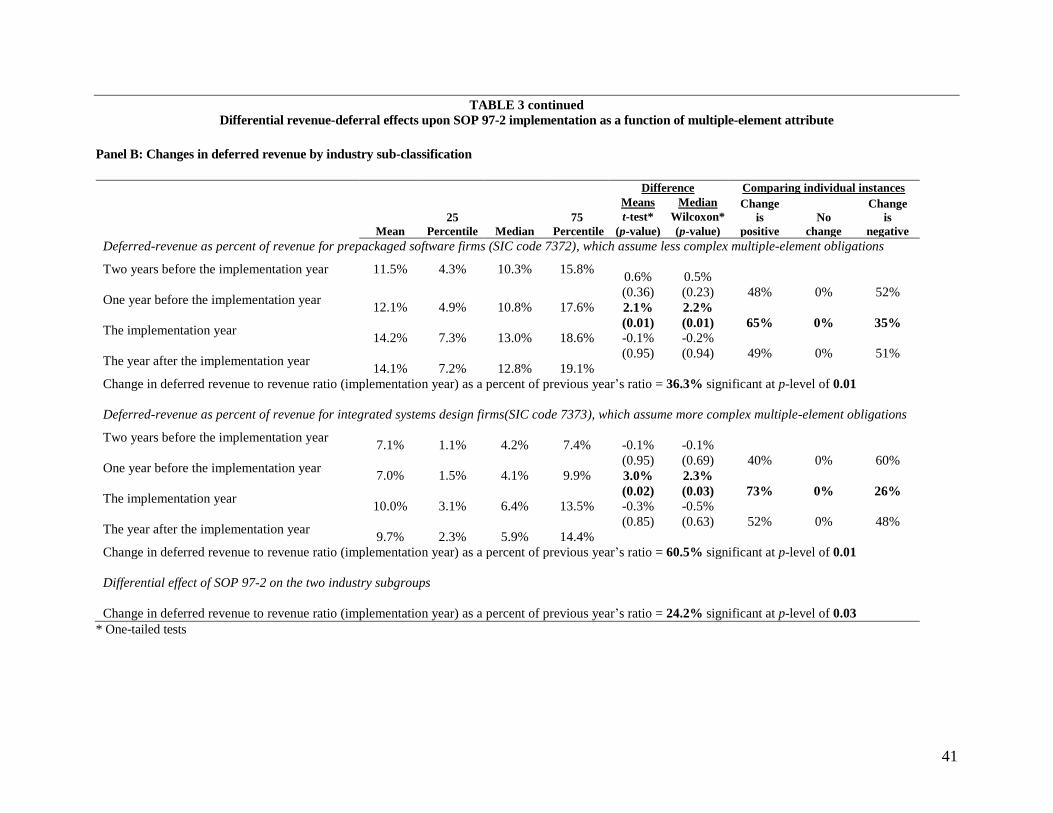
41
TABLE 3 continued
Differential revenue-deferral effects upon SOP 97-2 implementation as a function of multiple-element attribute
Panel B: Changes in deferred revenue by industry sub-classification
Mean
25
Percentile Median
75
Percentile
Difference Comparing individual instances
Means Median Change
is
positive
No
change
Change
is
negative
t-test* Wilcoxon*
(p-value) (p-value)
Deferred-revenue as percent of revenue for prepackaged software firms (SIC code 7372), which assume less complex multiple-element obligations
Two years before the implementation year 11.5% 4.3% 10.3% 15.8%
0.6% 0.5%
48%
0%
52% One year before the implementation year
12.1%
4.9%
10.8%
17.6%
(0.36) (0.23)
2.1% 2.2%
65%
0%
35% The implementation year
14.2%
7.3%
13.0%
18.6% (0.01) (0.01)
-0.1% -0.2%
49%
0%
51% The year after the implementation year
14.1%
7.2%
12.8%
19.1%
(0.95) (0.94)
Change in deferred revenue to revenue ratio (implementation year) as a percent of previous year’s ratio = 36.3% significant at p-level of 0.01
Deferred-revenue as percent of revenue for integrated systems design firms(SIC code 7373), which assume more complex multiple-element obligations
Two years before the implementation year
7.1%
1.1%
4.2%
7.4%
-0.1% -0.1%
40%
0%
60% One year before the implementation year
7.0%
1.5%
4.1%
9.9%
(0.95) (0.69)
3.0% 2.3%
73%
0%
26% The implementation year
10.0%
3.1%
6.4%
13.5% (0.02) (0.03)
-0.3% -0.5%
52%
0%
48% The year after the implementation year
9.7%
2.3%
5.9%
14.4%
(0.85) (0.63)
Change in deferred revenue to revenue ratio (implementation year) as a percent of previous year’s ratio = 60.5% significant at p-level of 0.01
Differential effect of SOP 97-2 on the two industry subgroups
Change in deferred revenue to revenue ratio (implementation year) as a percent of previous year’s ratio = 24.2% significant at p-level of 0.03
* One-tailed tests
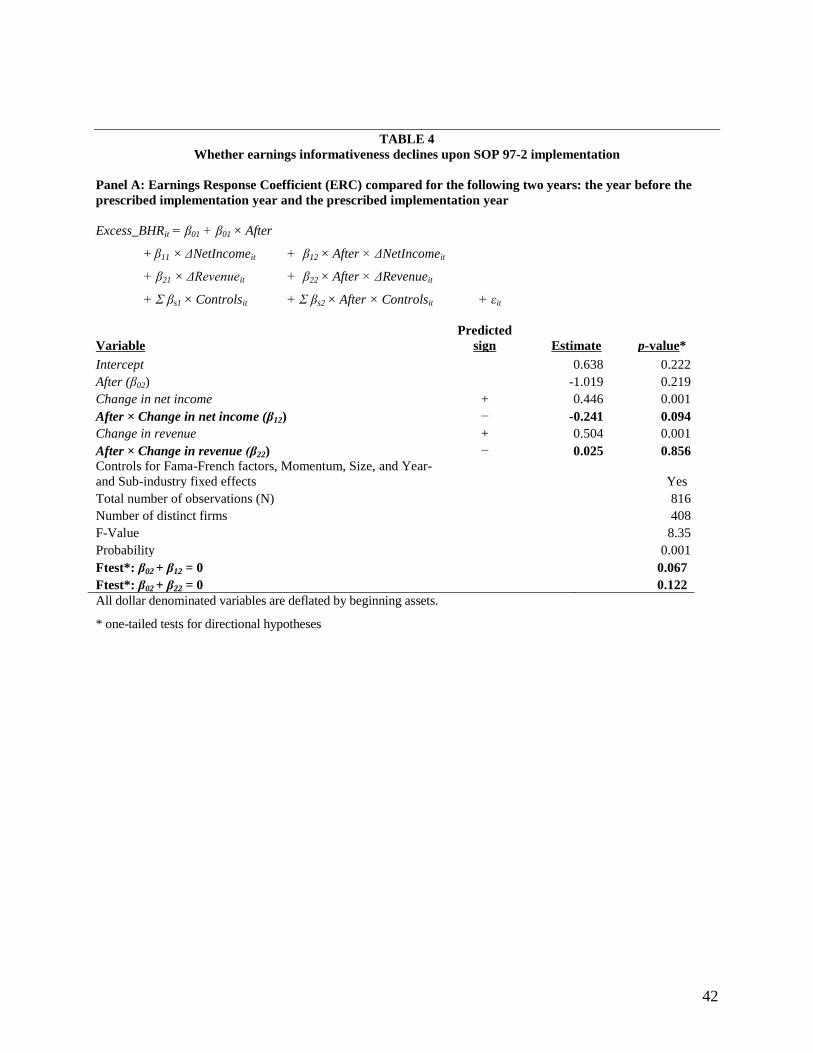
42
TABLE 4
Whether earnings informativeness declines upon SOP 97-2 implementation
Panel A: Earnings Response Coefficient (ERC) compared for the following two years: the year before the
prescribed implementation year and the prescribed implementation year
Excess_BHRit = β01 + β01 × After
+ β11 × ΔNetIncomeit + β12 × After × ΔNetIncomeit
+ β21 × ΔRevenueit + β22 × After × ΔRevenueit
+ Σ βs1 × Controlsit + Σ βs2 × After × Controlsit + εit
Variable
Predicted
sign
Estimate
p-value*
Intercept 0.638 0.222
After (β02) -1.019 0.219
Change in net income + 0.446 0.001
After × Change in net income (β12) − -0.241 0.094
Change in revenue + 0.504 0.001
After × Change in revenue (β22) − 0.025 0.856
Controls for Fama-French factors, Momentum, Size, and Year-
and Sub-industry fixed effects Yes
Total number of observations (N) 816
Number of distinct firms 408
F-Value 8.35
Probability 0.001
Ftest*: β02 + β12 = 0 0.067
Ftest*: β02 + β22 = 0 0.122
All dollar denominated variables are deflated by beginning assets.
* one-tailed tests for directional hypotheses
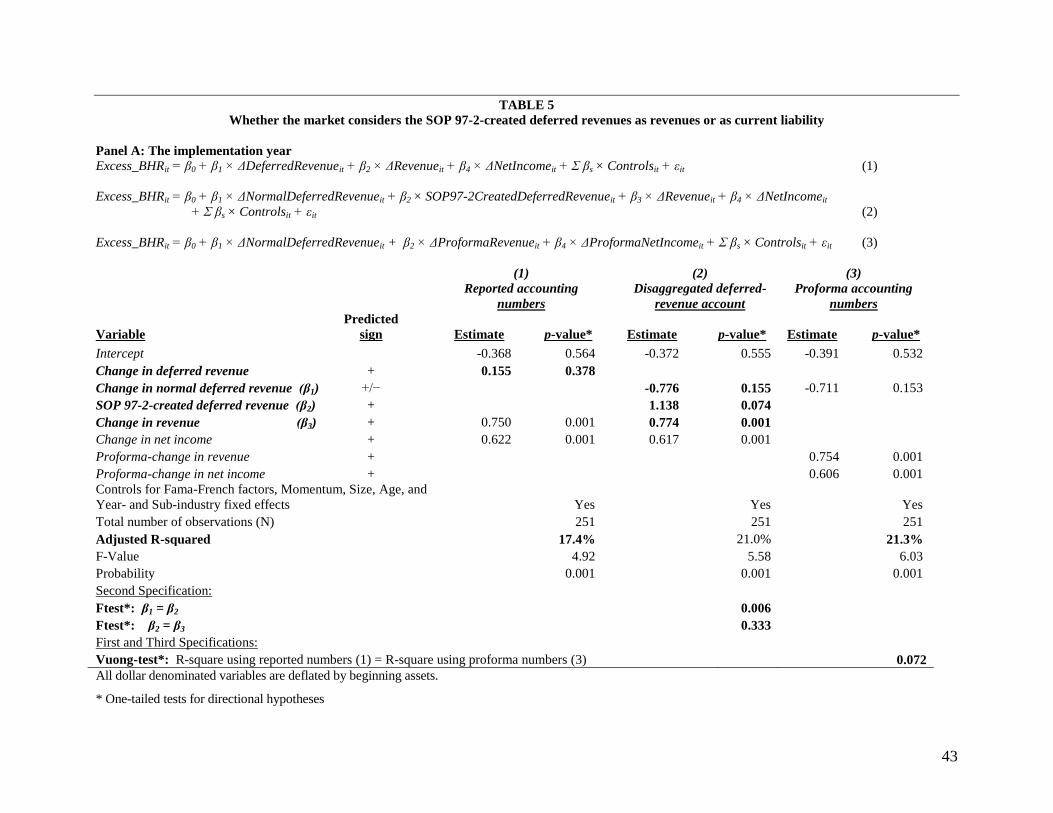
43
TABLE 5
Whether the market considers the SOP 97-2-created deferred revenues as revenues or as current liability
Panel A: The implementation year
Excess_BHRit = β0 + β1 × ΔDeferredRevenueit + β2 × ΔRevenueit + β4 × ΔNetIncomeit + Σ βs × Controlsit + εit (1)
Excess_BHRit = β0 + β1 × ΔNormalDeferredRevenueit + β2 × SOP97-2CreatedDeferredRevenueit + β3 × ΔRevenueit + β4 × ΔNetIncomeit
+ Σ βs × Controlsit + εit (2)
Excess_BHRit = β0 + β1 × ΔNormalDeferredRevenueit + β2 × ΔProformaRevenueit + β4 × ΔProformaNetIncomeit + Σ βs × Controlsit + εit (3)
(1)
Reported accounting
numbers
(2)
Disaggregated deferred-
revenue account
(3)
Proforma accounting
numbers
Variable
Predicted
sign
Estimate
p-value*
Estimate
p-value* Estimate
p-value*
Intercept -0.368 0.564 -0.372 0.555 -0.391 0.532
Change in deferred revenue + 0.155 0.378
Change in normal deferred revenue (β1) +/− -0.776 0.155 -0.711 0.153
SOP 97-2-created deferred revenue (β2) + 1.138 0.074
Change in revenue (β3) + 0.750 0.001 0.774 0.001
Change in net income + 0.622 0.001 0.617 0.001
Proforma-change in revenue + 0.754 0.001
Proforma-change in net income + 0.606 0.001
Controls for Fama-French factors, Momentum, Size, Age, and
Year- and Sub-industry fixed effects Yes
Yes
Yes
Total number of observations (N) 251 251 251
Adjusted R-squared 17.4% 21.0% 21.3%
F-Value 4.92 5.58 6.03
Probability 0.001 0.001 0.001
Second Specification:
Ftest*: β1 = β2 0.006
Ftest*: β2 = β3 0.333
First and Third Specifications:
Vuong-test*: R-square using reported numbers (1) = R-square using proforma numbers (3) 0.072
All dollar denominated variables are deflated by beginning assets.
* One-tailed tests for directional hypotheses
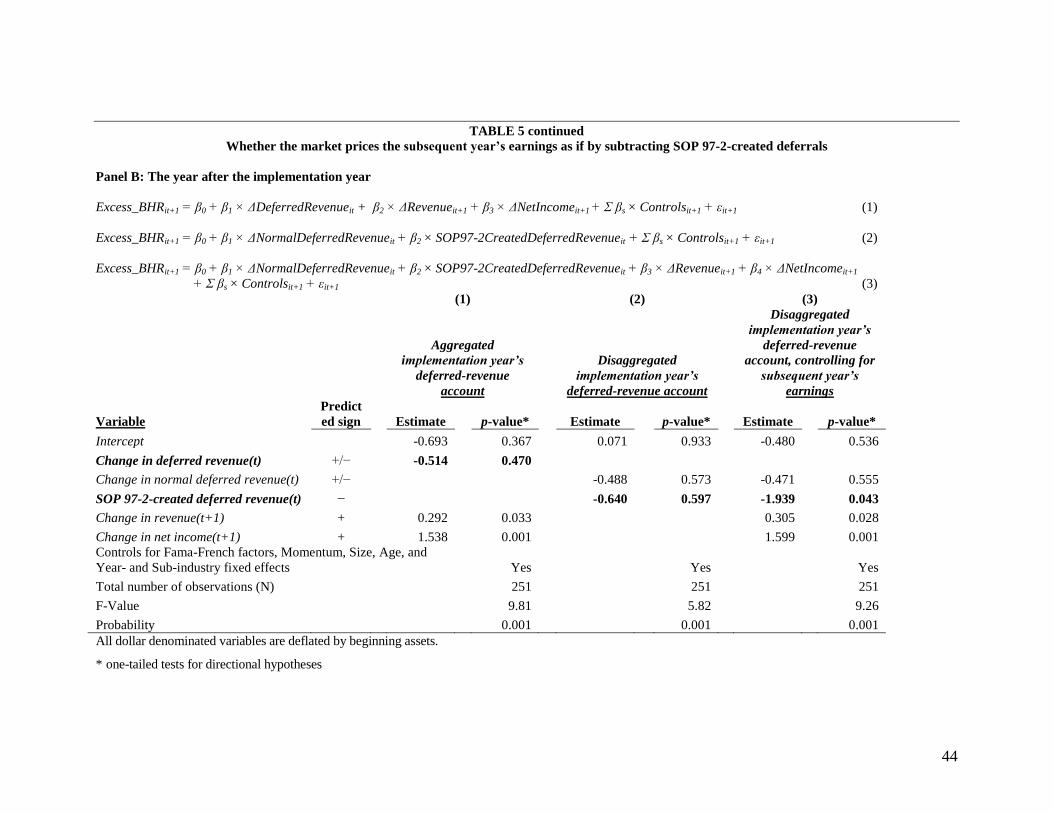
44
TABLE 5 continued
Whether the market prices the subsequent year’s earnings as if by subtracting SOP 97-2-created deferrals
Panel B: The year after the implementation year
Excess_BHRit+1 = β0 + β1 × ΔDeferredRevenueit + β2 × ΔRevenueit+1 + β3 × ΔNetIncomeit+1 + Σ βs × Controlsit+1 + εit+1 (1)
Excess_BHRit+1 = β0 + β1 × ΔNormalDeferredRevenueit + β2 × SOP97-2CreatedDeferredRevenueit + Σ βs × Controlsit+1 + εit+1 (2)
Excess_BHRit+1 = β0 + β1 × ΔNormalDeferredRevenueit + β2 × SOP97-2CreatedDeferredRevenueit + β3 × ΔRevenueit+1 + β4 × ΔNetIncomeit+1
+ Σ βs × Controlsit+1 + εit+1 (3)
(1)
Aggregated
implementation year’s
deferred-revenue
account
(2)
Disaggregated
implementation year’s
deferred-revenue account
(3)
Disaggregated
implementation year’s
deferred-revenue
account, controlling for
subsequent year’s
earnings
Variable
Predict
ed sign
Estimate
p-value*
Estimate
p-value*
Estimate
p-value*
Intercept -0.693 0.367 0.071 0.933 -0.480 0.536
Change in deferred revenue(t) +/− -0.514 0.470
Change in normal deferred revenue(t) +/− -0.488 0.573 -0.471 0.555
SOP 97-2-created deferred revenue(t) − -0.640 0.597 -1.939 0.043
Change in revenue(t+1) + 0.292 0.033 0.305 0.028
Change in net income(t+1) + 1.538 0.001 1.599 0.001
Controls for Fama-French factors, Momentum, Size, Age, and
Year- and Sub-industry fixed effects
Yes
Yes
Yes
Total number of observations (N) 251 251 251
F-Value 9.81 5.82 9.26
Probability 0.001 0.001 0.001
All dollar denominated variables are deflated by beginning assets.
* one-tailed tests for directional hypotheses
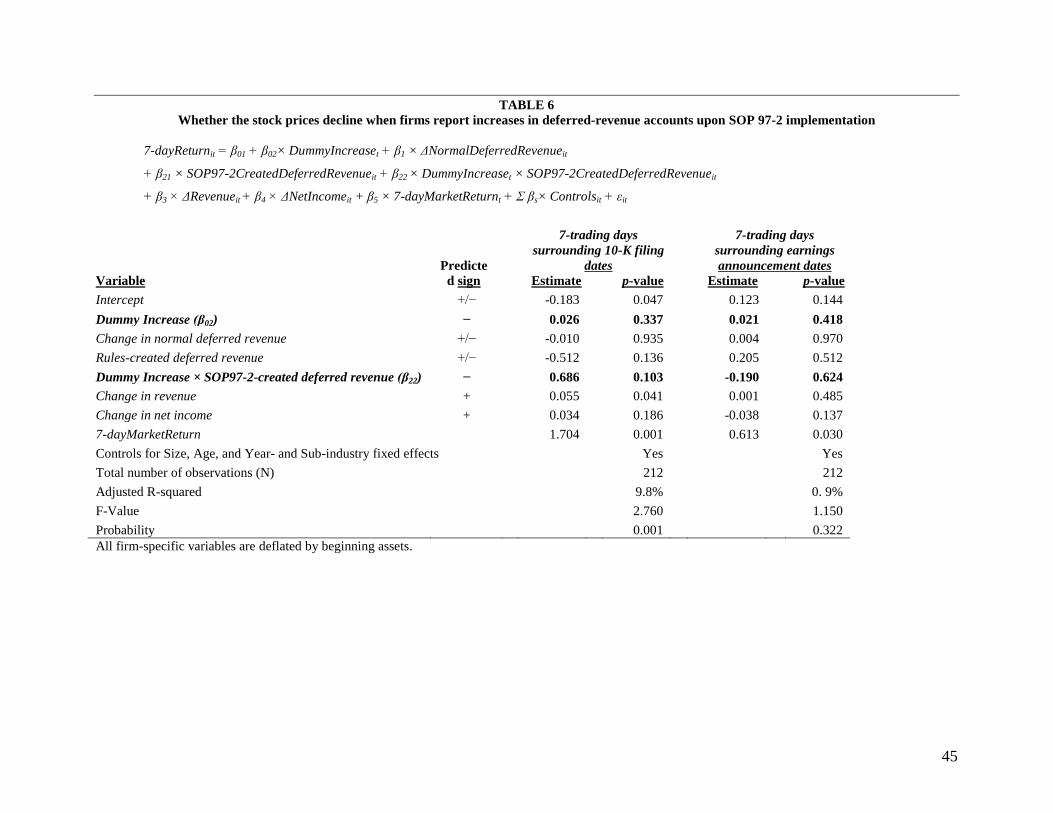
45
TABLE 6 Whether the stock prices decline when firms report increases in deferred-revenue accounts upon SOP 97-2 implementation
7-dayReturnit = β01 + β02× DummyIncreaset + β1 × ΔNormalDeferredRevenueit
+ β21 × SOP97-2CreatedDeferredRevenueit + β22 × DummyIncreaset × SOP97-2CreatedDeferredRevenueit
+ β3 × ΔRevenueit + β4 × ΔNetIncomeit + β5 × 7-dayMarketReturnt + Σ βs× Controlsit + εit
Predicte
d sign
7-trading days
surrounding 10-K filing
dates
7-trading days
surrounding earnings
announcement dates
Variable Estimate p-value Estimate p-value
Intercept +/− -0.183 0.047 0.123 0.144
Dummy Increase (β02) − 0.026 0.337 0.021 0.418
Change in normal deferred revenue +/− -0.010 0.935 0.004 0.970
Rules-created deferred revenue +/− -0.512 0.136 0.205 0.512
Dummy Increase × SOP97-2-created deferred revenue (β22) − 0.686 0.103 -0.190 0.624
Change in revenue + 0.055 0.041 0.001 0.485
Change in net income + 0.034 0.186 -0.038 0.137
7-dayMarketReturn 1.704 0.001 0.613 0.030
Controls for Size, Age, and Year- and Sub-industry fixed effects Yes Yes
Total number of observations (N) 212 212
Adjusted R-squared 9.8% 0. 9%
F-Value 2.760 1.150
Probability 0.001 0.322
All firm-specific variables are deflated by beginning assets.
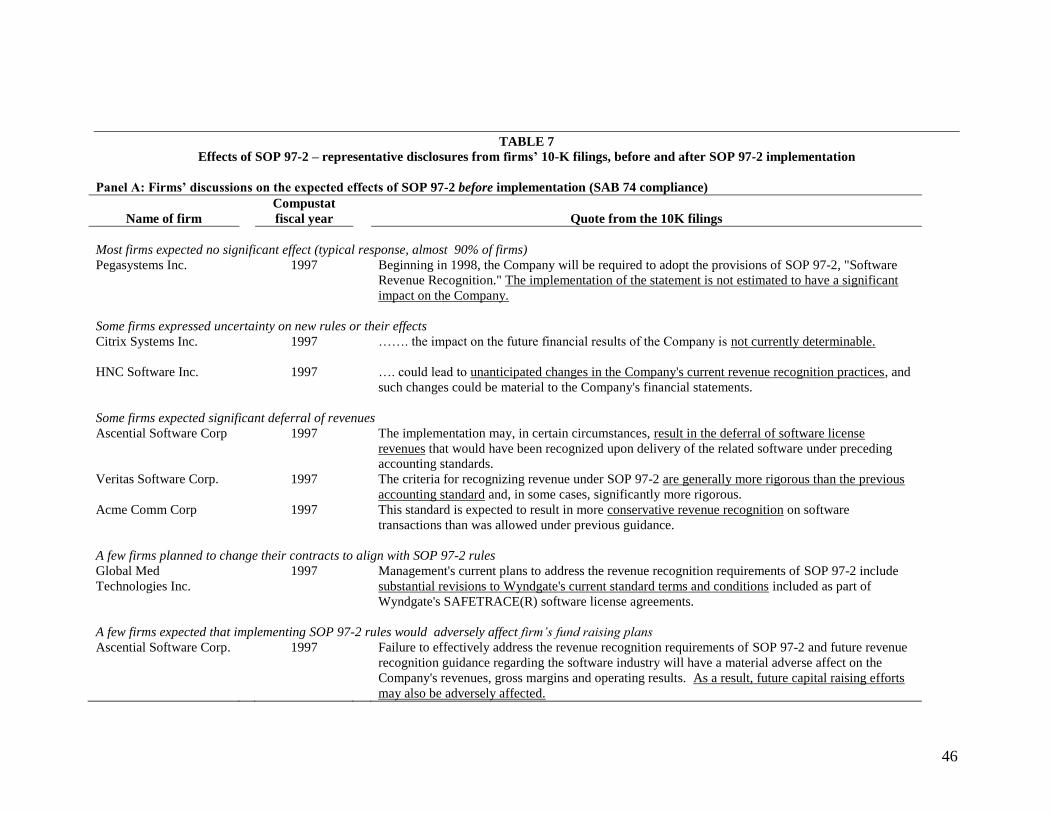
46
TABLE 7
Effects of SOP 97-2 – representative disclosures from firms’ 10-K filings, before and after SOP 97-2 implementation
Panel A: Firms’ discussions on the expected effects of SOP 97-2 before implementation (SAB 74 compliance)
Name of firm
Compustat
fiscal year
Quote from the 10K filings
Most firms expected no significant effect (typical response, almost 90% of firms)
Pegasystems Inc. 1997 Beginning in 1998, the Company will be required to adopt the provisions of SOP 97-2, "Software
Revenue Recognition." The implementation of the statement is not estimated to have a significant
impact on the Company.
Some firms expressed uncertainty on new rules or their effects
Citrix Systems Inc. 1997 ……. the impact on the future financial results of the Company is not currently determinable.
HNC Software Inc. 1997 …. could lead to unanticipated changes in the Company's current revenue recognition practices, and
such changes could be material to the Company's financial statements.
Some firms expected significant deferral of revenues
Ascential Software Corp 1997 The implementation may, in certain circumstances, result in the deferral of software license
revenues that would have been recognized upon delivery of the related software under preceding
accounting standards.
Veritas Software Corp. 1997 The criteria for recognizing revenue under SOP 97-2 are generally more rigorous than the previous
accounting standard and, in some cases, significantly more rigorous.
Acme Comm Corp 1997 This standard is expected to result in more conservative revenue recognition on software
transactions than was allowed under previous guidance.
A few firms planned to change their contracts to align with SOP 97-2 rules
Global Med
Technologies Inc.
1997 Management's current plans to address the revenue recognition requirements of SOP 97-2 include
substantial revisions to Wyndgate's current standard terms and conditions included as part of
Wyndgate's SAFETRACE(R) software license agreements.
A few firms expected that implementing SOP 97-2 rules would adversely affect firm’s fund raising plans
Ascential Software Corp. 1997 Failure to effectively address the revenue recognition requirements of SOP 97-2 and future revenue
recognition guidance regarding the software industry will have a material adverse affect on the
Company's revenues, gross margins and operating results. As a result, future capital raising efforts
may also be adversely affected.
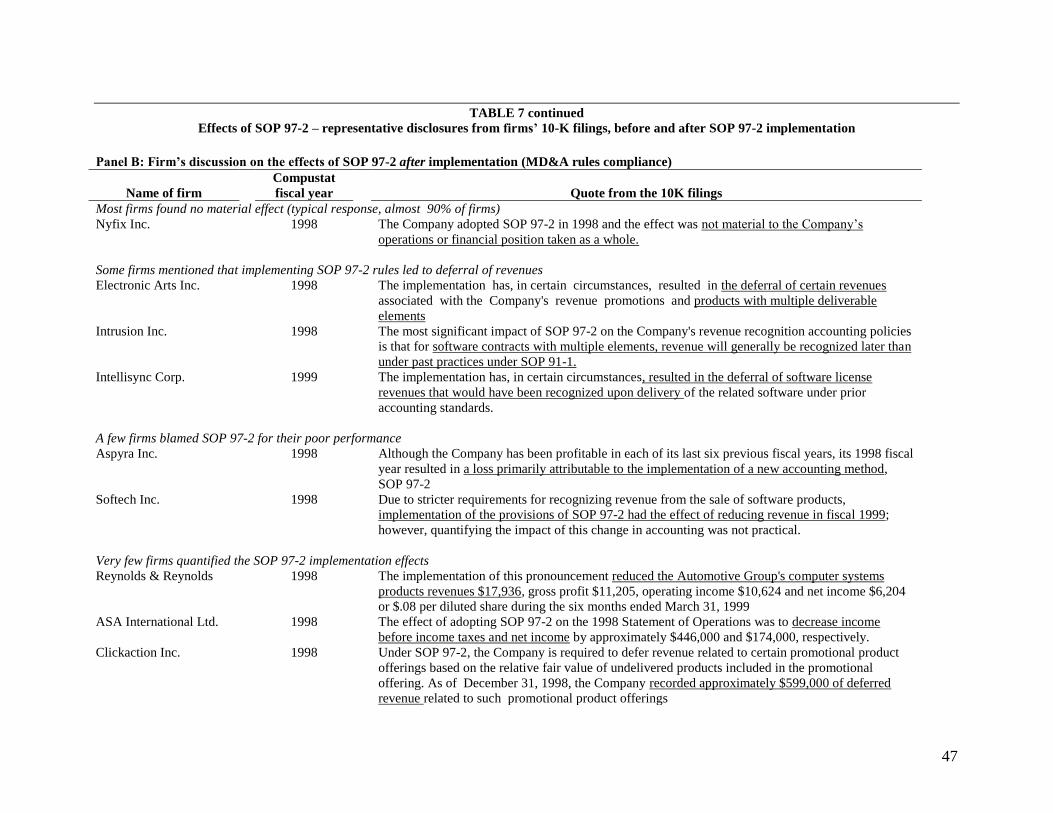
47
TABLE 7 continued
Effects of SOP 97-2 – representative disclosures from firms’ 10-K filings, before and after SOP 97-2 implementation
Panel B: Firm’s discussion on the effects of SOP 97-2 after implementation (MD&A rules compliance)
Name of firm
Compustat
fiscal year
Quote from the 10K filings
Most firms found no material effect (typical response, almost 90% of firms)
Nyfix Inc. 1998 The Company adopted SOP 97-2 in 1998 and the effect was not material to the Company’s
operations or financial position taken as a whole.
Some firms mentioned that implementing SOP 97-2 rules led to deferral of revenues
Electronic Arts Inc. 1998 The implementation has, in certain circumstances, resulted in the deferral of certain revenues
associated with the Company's revenue promotions and products with multiple deliverable
elements
Intrusion Inc. 1998 The most significant impact of SOP 97-2 on the Company's revenue recognition accounting policies
is that for software contracts with multiple elements, revenue will generally be recognized later than
under past practices under SOP 91-1.
Intellisync Corp. 1999 The implementation has, in certain circumstances, resulted in the deferral of software license
revenues that would have been recognized upon delivery of the related software under prior
accounting standards.
A few firms blamed SOP 97-2 for their poor performance
Aspyra Inc. 1998 Although the Company has been profitable in each of its last six previous fiscal years, its 1998 fiscal
year resulted in a loss primarily attributable to the implementation of a new accounting method,
SOP 97-2
Softech Inc. 1998 Due to stricter requirements for recognizing revenue from the sale of software products,
implementation of the provisions of SOP 97-2 had the effect of reducing revenue in fiscal 1999;
however, quantifying the impact of this change in accounting was not practical.
Very few firms quantified the SOP 97-2 implementation effects
Reynolds & Reynolds 1998 The implementation of this pronouncement reduced the Automotive Group's computer systems
products revenues $17,936, gross profit $11,205, operating income $10,624 and net income $6,204
or $.08 per diluted share during the six months ended March 31, 1999
ASA International Ltd. 1998 The effect of adopting SOP 97-2 on the 1998 Statement of Operations was to decrease income
before income taxes and net income by approximately $446,000 and $174,000, respectively.
Clickaction Inc. 1998 Under SOP 97-2, the Company is required to defer revenue related to certain promotional product
offerings based on the relative fair value of undelivered products included in the promotional
offering. As of December 31, 1998, the Company recorded approximately $599,000 of deferred
revenue related to such promotional product offerings
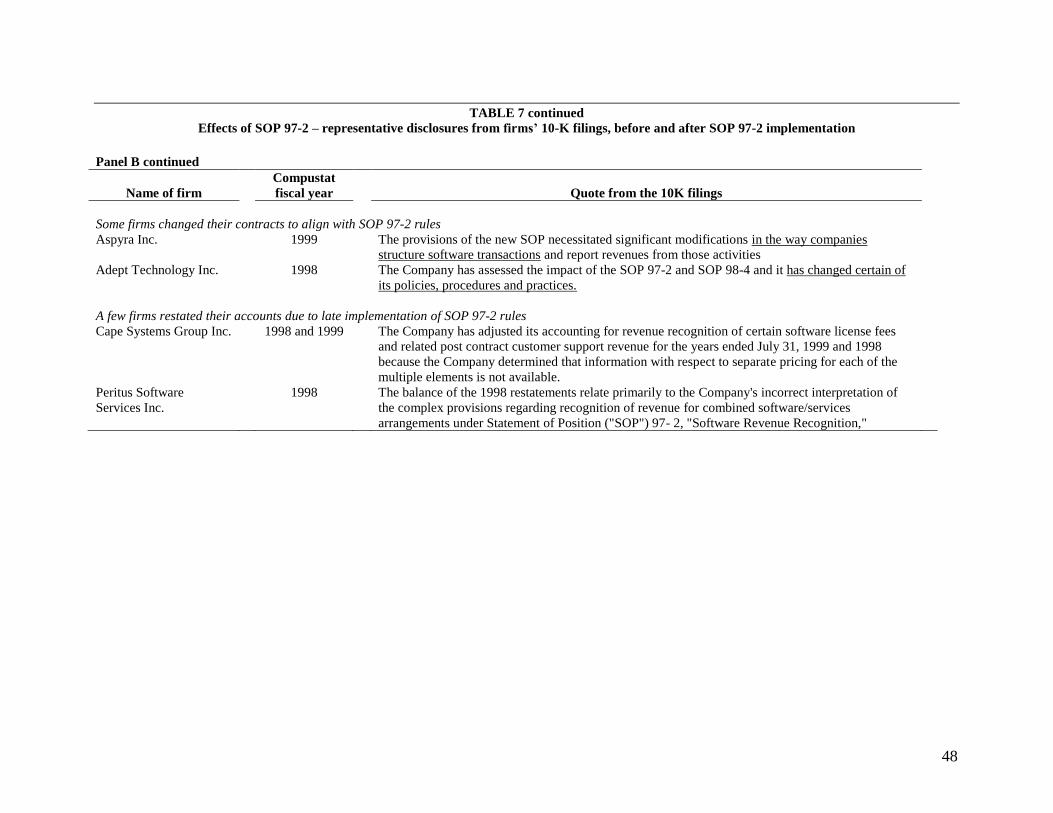
48
TABLE 7 continued
Effects of SOP 97-2 – representative disclosures from firms’ 10-K filings, before and after SOP 97-2 implementation
Panel B continued
Name of firm
Compustat
fiscal year
Quote from the 10K filings
Some firms changed their contracts to align with SOP 97-2 rules
Aspyra Inc. 1999 The provisions of the new SOP necessitated significant modifications in the way companies
structure software transactions and report revenues from those activities
Adept Technology Inc. 1998 The Company has assessed the impact of the SOP 97-2 and SOP 98-4 and it has changed certain of
its policies, procedures and practices.
A few firms restated their accounts due to late implementation of SOP 97-2 rules
Cape Systems Group Inc. 1998 and 1999 The Company has adjusted its accounting for revenue recognition of certain software license fees
and related post contract customer support revenue for the years ended July 31, 1999 and 1998
because the Company determined that information with respect to separate pricing for each of the
multiple elements is not available.
Peritus Software
Services Inc.
1998 The balance of the 1998 restatements relate primarily to the Company's incorrect interpretation of
the complex provisions regarding recognition of revenue for combined software/services
arrangements under Statement of Position ("SOP") 97- 2, "Software Revenue Recognition,"