the changing shape of the consumer market for advice ... · the changing shape of the consumer...
TRANSCRIPT
The changing shape of the consumer market for advice: Interim consumer research to inform the Financial Advice Market Review (FAMR)
August 2018
2
Table of contents
TABLE OF CONTENTS 2
LIST OF TABLES AND FIGURES 4
EXECUTIVE SUMMARY 6
Background 6 Research Objectives 7 Key findings: Shape of the consumer market for advice 9 Key findings: Drivers for seeking advice 11
Key findings: Affordability and accessibility of advice 12 Key findings: Quality of advice 13 Key findings: Use and importance of information and guidance 14
1. OBJECTIVES AND METHODOLOGY 16
1.1 Background 16 1.2 Research objectives 17 1.3 Research Methodology 18
2. SIZE OF THE ADVISED AND NOT ADVISED UK ADULT POPULATION 25
2.1 Number of UK adults who have had advice in the last 12 months 25
3. EXPERIENCES OF PEOPLE WHO HAVE HAD REGULATED FINANCIAL ADVICE IN
THE LAST 12 MONTHS 27
3.1 Type of advice received 28 3.2 Drivers for seeking advice and the nature of the advice received in the most recent
session 30 3.3 Actions taken over the last 12 months with and without advice 32 3.4 Nature of the relationship with the adviser 33
4. SPOTLIGHT ON ADULTS MOVING IN AND OUT OF GROUP 1 37
4.1 Number of UK adults who have moved in and out of Group 1 37 4.2 Reasons given for moving in and out of Group 1 38
5. EXPERIENCES OF PEOPLE WHO HAVE NOT HAD REGULATED FINANCIAL
ADVICE IN THE LAST 12 MONTHS 42
3
5.1 UK adult population by whether or not they had regulated financial advice in the last 12
months and make-up of the not advised population 43 5.2 Historic advice experiences of the not advised population 48 5.3 Reasons for not using regulated financial advice in the last 12 months 50 5.4 Actions taken without advice over the last 12 months 56
5.5 Potential for advice in the future 61
6. AWARENESS AND USE OF AUTOMATED ONLINE PENSION OR INVESTMENT
SERVICES 68
6.1 Awareness of automated online investment or pension providers 69 6.2 Use of automated online investment or pension providers in the last 12 months 70
7. INFORMATION AND GUIDANCE 74
7.1 Sources of information or guidance used 74
7.2 Reasons for using information or guidance 81 7.3 Actions taken as a result of information or guidance received 82 7.4 Satisfaction with the information or guidance received 85 7.3 Reasons for not using information or guidance 86
8. METHODOLOGICAL APPENDIX 88
8.1 FAMR 2018 Survey 88 8.2 2018 Qualitative Research 94
8.3 Financial Lives Survey 2017 95 8.4 Reporting conventions 96
ABBREVIATIONS 98
GLOSSARY 99
THE TEAM AND THE AUTHORS 102
ACKNOWLEDGEMENTS 103
4
List of tables and figures
Figure 1 Number of UK adults that have had regulated financial advice in the last 12 months (Group
1), compared to those that have not had advice in the same period (Groups 2, 3, and 4) 9
Figure 2 Proportion and number of UK adults who have had regulated financial advice in both 2017
and 2018, 2017 only, and 2018 only 10
Figure 1.1 Three sources of consumer data referenced in this report 19
Figure 1.2 Graphic representation of the FAMR 2018 Survey questions used to assign respondents to
Groups 22
Figure 2.1 Number of UK adults that have had regulated financial advice in the last 12 months (Group
1), compared to those that have not had advice in the same period (Groups 2, 3, and 4) 25
Figure 3.1 Sources of regulated financial advice for any advice session in the last 12 months (All UK
adults who have had regulated financial advice in the last 12 months) 28
Figure 3.2 Payment made for regulated financial advice for the most recent advice session (All UK
adults who have had regulated financial advice in the last 12 months) 29
Figure 3.3 Drivers for seeking advice for the most recent advice session (All UK adults who have had
regulated financial advice in the last 12 months) 30
Figure 3.4 Nature of advice needed in the most recent advice session (All UK adults who have had
regulated financial advice in the last 12 months) 31
Figure 3.5 Future advice needs (All UK adults who have had regulated financial advice in the last 12
months) 32
Figure 3.6 Actions taken with and without advice (All UK adults who have had regulated financial
advice in the last 12 months) 33
Figure 3.7 Level of trust in adviser/ firm (All UK adults who have had regulated financial advice in the
last 12 months) 35
Figure 3.8 Satisfaction with most recent regulated financial advice received (All UK adults who have
had regulated financial advice in the last 12 months) 36
Figure 4.1 Proportion and number of UK adults who have had regulated financial advice in both 2017
and 2018, 2017 only, and 2018 only 38
Figure 5.1 Number of UK adults that have had regulated financial advice in the last 12 months (Group
1), compared to those that have not had advice in the same period (Groups 2, 3/4) 43
Figure 5.2 Historic advice experiences (All UK adults who have not had advice in the last 12 months)
48
5
Figure 5.3 Historic advice experiences (All UK adults who have not had advice in the last 12 months)
49
Table 5.1 Reasons for not taking regulated financial advice in the last 12 months (All UK adults that
have not had advice, but might need it) 51
Figure 5.4 Actions taken in the last 12 months (All UK adults who have not had advice in the last 12
months) 57
Table 5.2 Actions taken in the last 12 months (All UK adults who have not had advice in the last 12
months) 58
Figure 5.5 Future advice needs (All UK adults who have not had advice in the last 12 months) 61
Table 5.3 Future advice needs (All UK adults who have not had advice in the last 12 months) 62
Figure 6.1 Awareness of any provider of automated online investment or pension services (All UK
adults) 69
Figure 6.2 Use of providers of automated online investment or pension services in the last 12 months
(All UK adults) 71
Figure 7.1 Sources of information and guidance used in the last 12 months by use of regulated financial
advice (All UK adults) 75
Figure 7.2 Use of information or guidance in the last 12 months (All UK adults who have had regulated
financial advice in the last 12 months) 76
Figure 7.3 Sources of information or guidance used in the last 12 months (All UK adults who have had
regulated financial advice in the last 12 months) 77
Figure 7.4 Use of information or guidance in the last 12 months (All UK adults who have not had advice
in the last 12 months) 78
Figure 7.5 Sources of information or guidance used in the last 12 months (All UK adults who have not
had regulated financial advice in the last 12 months) 79
Table 7.1 Reasons for using information or guidance in the last 12 months (All UK adults who used
information or guidance in the last 12 months) 82
Figure 7.6 Actions taken directly as a result of information or guidance used in the last 12 months (All
UK adults who have used information or guidance in the last 12 months) 83
Table 7.2 Helpfulness of information or guidance received by information or guidance source (All UK
adults who have used information or guidance in the last 12 months) 86
Figure 7.7 Use of information or guidance in the last 12 months (All UK adults who have not had advice
in the last 12 months) 87
6
Executive summary
Background
The Financial Advice Market Review (FAMR) was launched in August 2015 in light of concerns that the
market for financial advice in the UK was not working well for all consumers. The aim of the Review
was to explore ways in which Government, industry and regulators can take individual and collective
steps to stimulate the development of a market which delivers affordable and accessible financial
advice and guidance to everyone, at all stages of their lives.
Since 2016 the FCA and HMT have implemented the range of measures that FAMR recommended in its
final report. Many of these have been aimed at reducing costs for firms and supporting them in
developing lower-cost options for consumers.
FAMR considered that progress in achieving this vision should be judged against a number of success
factors:
• Good availability of affordable, high quality advice and guidance, which consumers at all
stages of their lives are able to access to help them with their particular needs
• There is greater innovation in the interests of consumers, encouraged by a flexible and
well-understood regulatory framework for advice
• A range of channels exist, through which consumers are able to access advice and
guidance, including in the workplace; and there is appropriate flexibility in the way
consumers are able to pay for advice
• Consumers engage with their own financial affairs and so seek out the advice and guidance
they need
The FCA and HMT are committed to monitoring the impact these measures are having over time. They
published baseline measures in June 2017,1 including an annex of detailed consumer research findings
from the Financial Lives Survey 2017.2
This report outlines findings from a new short survey (FAMR 2018 Survey) and qualitative research
with consumers. Results of this research will be used to indicate if there have been any changes in
the behaviour of UK adults in relation to taking regulated advice and guidance, and their perceptions
of this market since 2017. These interim findings are being published ahead of a full review of FAMR
measures in 2019.
1 https://www.fca.org.uk/publication/research/famr-baseline-report.pdf. 2 https://www.fca.org.uk/publication/research/famr-quantitative-research.pdf.
7
It is important to note that whilst all of the FAMR measures were in place when this research was
conducted, it is likely to take some time for any effects to be seen. It may also be difficult to dis-
entangle the impacts directly resulting from the measures taken from general shifts in consumer
behaviour or changes driven by factors which are external to the advice market, such as stock market
levels and changes in government policy. Nevertheless, this research provides a useful indication of
how the market for advice is developing.
Research Objectives
The objective of this consumer research was to understand the support UK adults are currently getting
with their financial decisions and how this may have changed since the baseline measures collected
in 2017. In particular:
• The number of UK adults who have received regulated financial advice related to
investments, saving into a pension or retirement planning in the last 12 months, compared
to those who have not. Including the experience of those who have had regulated advice
in 2017 and not 2018 and vice versa, and the reasons for this
• Any changes in the experiences of adults who have had advice, including the drivers for
seeking advice, types of advice received, actions taken as a result of the advice received,
and nature of the relationship with the adviser
• The experiences of people who have not had advice and the reasons why they did not
make use of any advice service
• Any changes in the awareness and use of automated online investment or pension
providers
• The number of UK adults using information and guidance related to investments, saving
into a pension or retirement planning in the last 12 months. The information and guidance
sources used and the helpfulness of these
Methodology
The information contained in this report is drawn from three different sources:
1. FAMR 2018 Survey: A short re-contact survey of adults who took part in the Financial Lives
Survey 2017 and agreed to take part in further research. This survey was conducted in March
2018 and included interviews with 826 adults aged 18 and over. This research is the main
evidence source used in this report.
2. 2018 Qualitative Research: Qualitative research, based on 34 in-depth telephone
conversations with adults who took part in the Financial Lives Survey 2017 and agreed to take
part in further research. Interviews took place between March 2018 and June 2018 and lasted
around 30 minutes.
8
3. The FCA’s Financial Lives Survey 2017: A large-scale tracking survey of consumers’
behaviour and experiences when engaging with financial services firms and buying financial
products. The 2017 survey was conducted between December 2016 and April 2017 and
included interviews with nearly 13,000 adults across the UK. The results of this survey
informed the FAMR baseline in 2017 and are compared to the FAMR 2018 survey results in this
report.
Further details on the methodology are provided in the Methodological Appendix, chapter 8.
FAMR Groups
In this report the UK adult population has been divided into four groups:
• Group 1: Those who have had regulated financial advice in the last 12 months related to
investments, saving into a pension or retirement planning
• Group 2: Those who have not had regulated financial advice in the last 12 months, but
whose circumstances suggest there might be a need for financial advice: these are people
who have at least £10,000 in savings and/ or investments
• Group 3: Those who have not had regulated financial advice in the last 12 months, and
whose circumstances suggest that a need for financial advice is less likely
• Group 4: Those who have not had regulated financial advice in the last 12 months, but
who cannot be allocated to Group 2 or 3 because insufficient information was provided
about their financial situation
Limitations
All surveys have limitations to their design. A key challenge for the FAMR 2018 Survey was that to
track movements of individuals between the four FAMR groups over time we needed to re-contact
respondents who had taken part in the original Financial Lives Survey 2017 and agreed to participate
in further research. Only 4,120 (32%) respondents had given their permission to re-contact and the
FAMR 2018 Survey achieved 826 interviews in total.
The profile of the achieved sample (unweighted) was not representative of the UK adults aged 18+
(weighted) who had participated in the 2017 survey. To correct for this, the results were weighted
(using the Financial Lives Survey 2017 as a target), giving an effective sample size of 409. Despite this
weighting, some bias in the sample may still exist. As a result of this, and a low effective sample size,
the findings presented in this report give an indicative view as to the impact of FAMR measures but
should be interpreted with a degree of caution.
The full Financial Lives Survey will be conducted again in 2019 which will provide a more robust
assessment of the impact of FAMR measures, to be published in 2020.
9
For further information on weighting and other methodological considerations, please see the
Methodological Appendix, chapter 8 and Section 1.3.4.
Key findings: Shape of the consumer market for advice
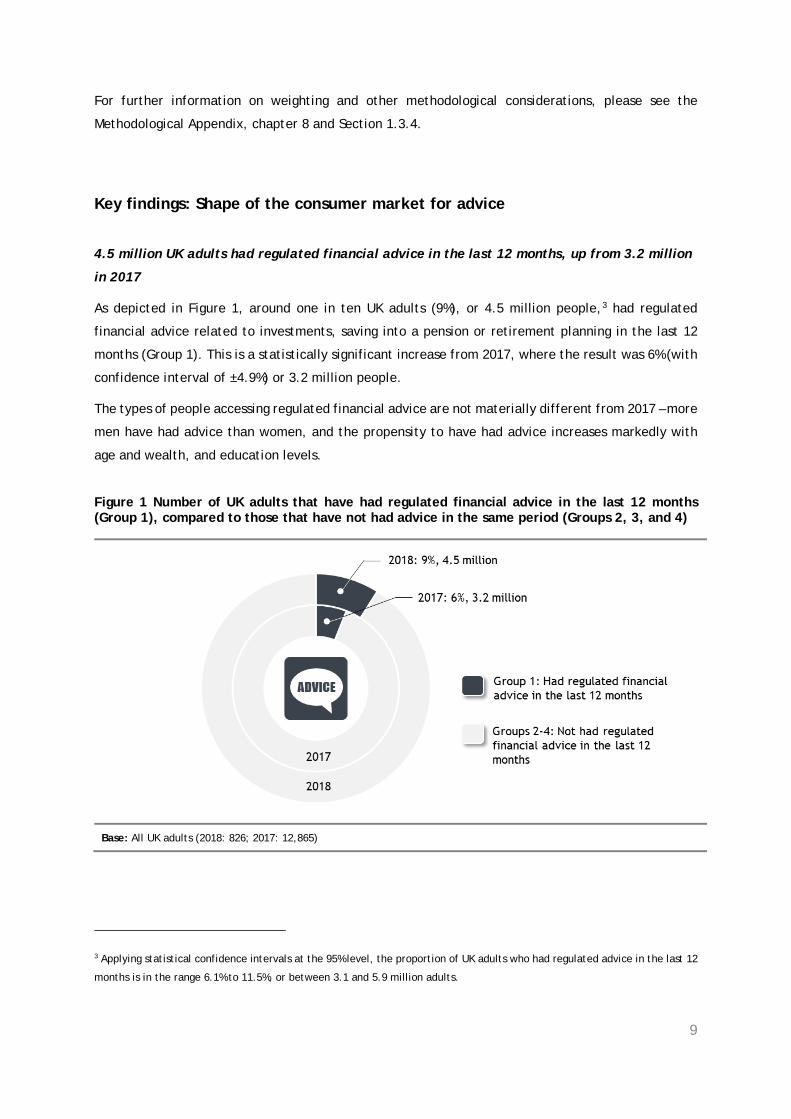
4.5 million UK adults had regulated financial advice in the last 12 months, up from 3.2 million
in 2017
As depicted in Figure 1, around one in ten UK adults (9%), or 4.5 million people,3 had regulated
financial advice related to investments, saving into a pension or retirement planning in the last 12
months (Group 1). This is a statistically significant increase from 2017, where the result was 6% (with
confidence interval of ±4.9%) or 3.2 million people.
The types of people accessing regulated financial advice are not materially different from 2017 – more
men have had advice than women, and the propensity to have had advice increases markedly with
age and wealth, and education levels.
Figure 1 Number of UK adults that have had regulated financial advice in the last 12 months (Group 1), compared to those that have not had advice in the same period (Groups 2, 3, and 4)
Base: All UK adults (2018: 826; 2017: 12,865)
3 Applying statistical confidence intervals at the 95% level, the proportion of UK adults who had regulated advice in the last 12
months is in the range 6.1% to 11.5%, or between 3.1 and 5.9 million adults.
10
Nine in ten (91%) UK adults aged 18 or over, or 46.5 million people, have not had regulated financial
advice in the last 12 months. Of these, two-fifths (39%), or 18.2 million people, have £10,000 or more
in savings and/ or investments and, therefore, might have a need for advice (Group 2). This group
equates to 36% of the UK population as a whole.
Looking at the demographic profiles of these people, we see that more men than women are in Group
2, the propensity to be in Group 2 increases with age, and retirees are more likely to be in Group 2
than people in work.
There has been significant movement in and out of Group 1
All respondents in the FAMR 2018 Survey were sourced from the Financial Lives Survey 2017. The key
benefit of this approach is that it allows us to track movements in peoples’ circumstances over time.
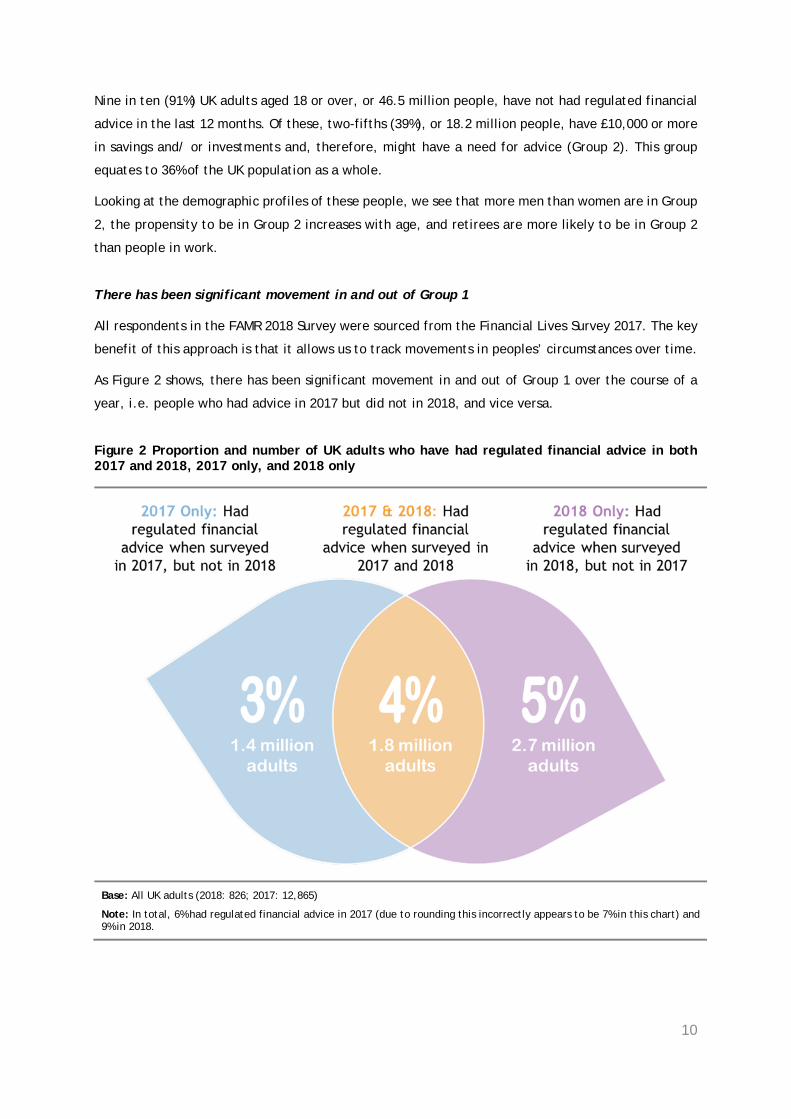
As Figure 2 shows, there has been significant movement in and out of Group 1 over the course of a
year, i.e. people who had advice in 2017 but did not in 2018, and vice versa.
Figure 2 Proportion and number of UK adults who have had regulated financial advice in both 2017 and 2018, 2017 only, and 2018 only
Base: All UK adults (2018: 826; 2017: 12,865)
Note: In total, 6% had regulated financial advice in 2017 (due to rounding this incorrectly appears to be 7% in this chart) and 9% in 2018.
11
Key findings: Drivers for seeking advice
Fewer Group 1 adults with an ‘advice habit’ in 2018
When asked what prompted them to seek advice for their most recent advice session, 47% of
respondents in Group 1 said that either they take advice regularly (41%) and/ or have sought advice
before (19%). This is significantly lower than the 65% with an ‘advice habit’ in 2017.
Although many advisers’ business models are built around an annual review process, only 55% of adults
who have had regulated financial advice in the last 12 months felt that they would actually need
regulated financial advice at least every year going forwards. One-quarter (26%) think they will need
advice every couple of years and 7% less regularly than every couple of years. 8% say they won’t need
regulated financial advice again.
Many Group 2 adults did not think they had an advice need in 2018
The reasons given by Group 2 adults for not having had regulated financial advice in the last 12 months
are not significantly different from the 2017 responses.
By far the most popular response given was, once again, that they did not have an advice need. Half
(50%) felt they had no need to use an adviser during this time. Indeed, over half (55%) of not advised
adults undertook no financial actions whatsoever in 2018; 42% for Group 2 and 63% for Group 3/4.
Furthermore, almost two-fifths (37%) felt able to decide what to do with their money on their own,
significantly higher than in 2017 (28%). As highlighted in our qualitative research, this reflects their
propensity for keeping the majority of their money in simple, cash-based savings products, about
which they feel knowledgeable and confident.
Those in Group 2 in our qualitative research who did have large investment portfolios tended to be
‘hobbyist investors’. They typically held their portfolios on platforms such as Hargreaves Lansdown or
Fidelity and would often use the information on these sites or from specialist magazines such as
Investor’s Chronicle or the FT to help them with their decision-making.
Not advised adults were asked whether they will use regulated financial advice in the future; one in
eight (13%) said they definitely would, and a further two in five (40%) said that they might. That said,
many clarified their answer by saying that their financial circumstances would need to change quite
significantly before they would realistically do so.
12
Key findings: Affordability and accessibility of advice
Relatively few adults in Group 2 said that they face issues accessing financial advice
Less than 1% of Group 2 adults gave not being able to find an adviser to help them as a reason for not
using regulated financial advice, 2% did not know how to find a suitable adviser, and only 5% said they
had doubts about whether they could find an adviser suitable for them.
Aligned with the 2017 findings, just one in seven (15%) mentioned affordability as the key barrier to
accessing regulated financial advice. From our in-depth conversations we learned that, while the
absolute cost of advice plays a part in that barrier, Group 2 adults are more concerned about whether
they are getting value for money for the price they pay and whether the adviser is acting in their best
interests.
Low-cost automated online advice has the potential to expand the market for advice
The market is starting to look at the feasibility of lower-cost solutions to the traditional face-to-face
model, in particular automated online advice. It is difficult to predict what impact these automated
online advice services will have in the future. It is possible that such services will simply be a
substitute for existing regulated financial advice (i.e. those currently receiving such advice simply
switch to automated online advice for some or all of their advice needs). It is also possible that
automated online advice expands the total number of people accessing regulated financial advice,
perhaps by making these services more accessible, or by having lower prices which make such services
more attractive.
Early indications suggest that automated online advice services could do both. Three in eight (38%)
UK adults have heard of at least one of the automated online investment and pension services included
in the FAMR 2018 Survey. This is a significant increase from the one in ten (10%) who had heard of at
least one automated service in the Financial Lives Survey 2017. Much of this increase is due to a three-
fold increase in awareness levels of one automated advice provider and to a large proportion of people
saying they are aware of a provider that is a well-known household high street banking brand who
was not included in the 2017 survey because they were not in the automated advice market at that
time.
3% of UK adults say they have used any provider of automated online investment and pension services
in the last 12 months. This is not a significant difference to the 1% reported in 2017.
For those adults in our qualitative research who had heard of any provider of automated online
investment or pension services but not used one, a variety of reasons were given for this, including a
reluctance to make equity-based investments in general, a lack of comfort conducting financial
transactions online and a reticence to invest with anyone who is not a recognised established brand.
13
Key findings: Quality of advice
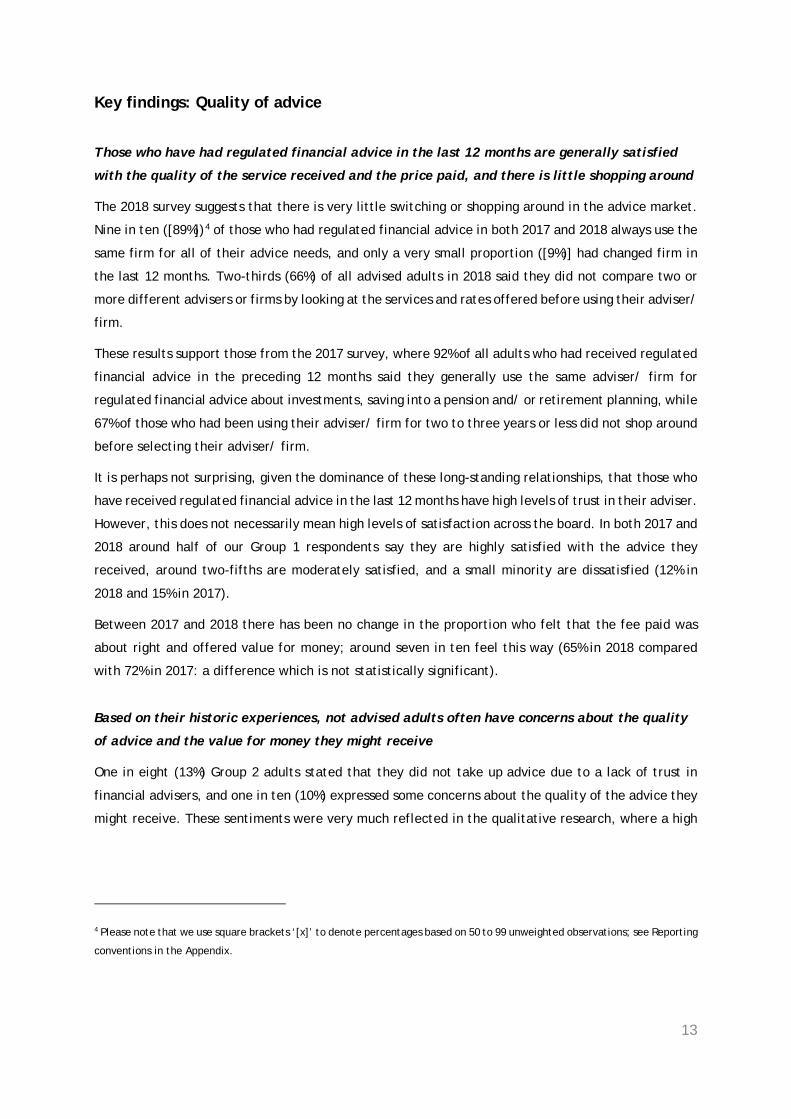
Those who have had regulated financial advice in the last 12 months are generally satisfied
with the quality of the service received and the price paid, and there is little shopping around
The 2018 survey suggests that there is very little switching or shopping around in the advice market.
Nine in ten ([89%])4 of those who had regulated financial advice in both 2017 and 2018 always use the
same firm for all of their advice needs, and only a very small proportion ([9%)] had changed firm in
the last 12 months. Two-thirds (66%) of all advised adults in 2018 said they did not compare two or
more different advisers or firms by looking at the services and rates offered before using their adviser/
firm.
These results support those from the 2017 survey, where 92% of all adults who had received regulated
financial advice in the preceding 12 months said they generally use the same adviser/ firm for
regulated financial advice about investments, saving into a pension and/ or retirement planning, while
67% of those who had been using their adviser/ firm for two to three years or less did not shop around
before selecting their adviser/ firm.
It is perhaps not surprising, given the dominance of these long-standing relationships, that those who
have received regulated financial advice in the last 12 months have high levels of trust in their adviser.
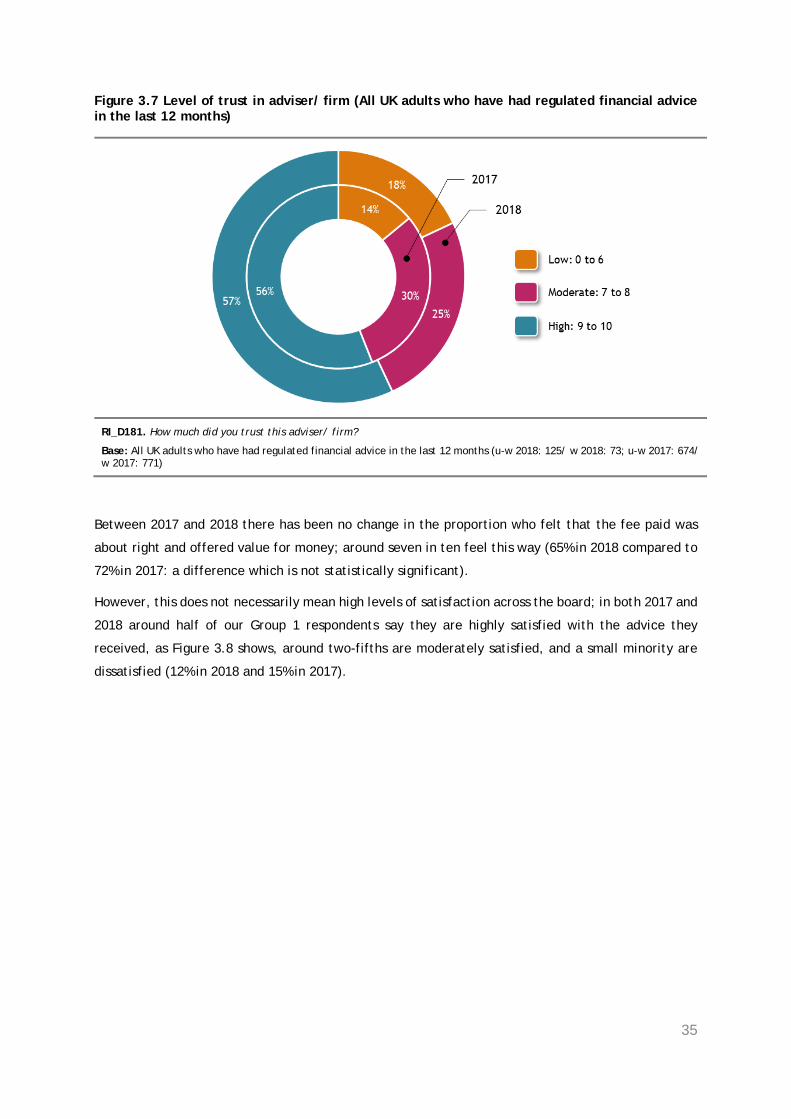
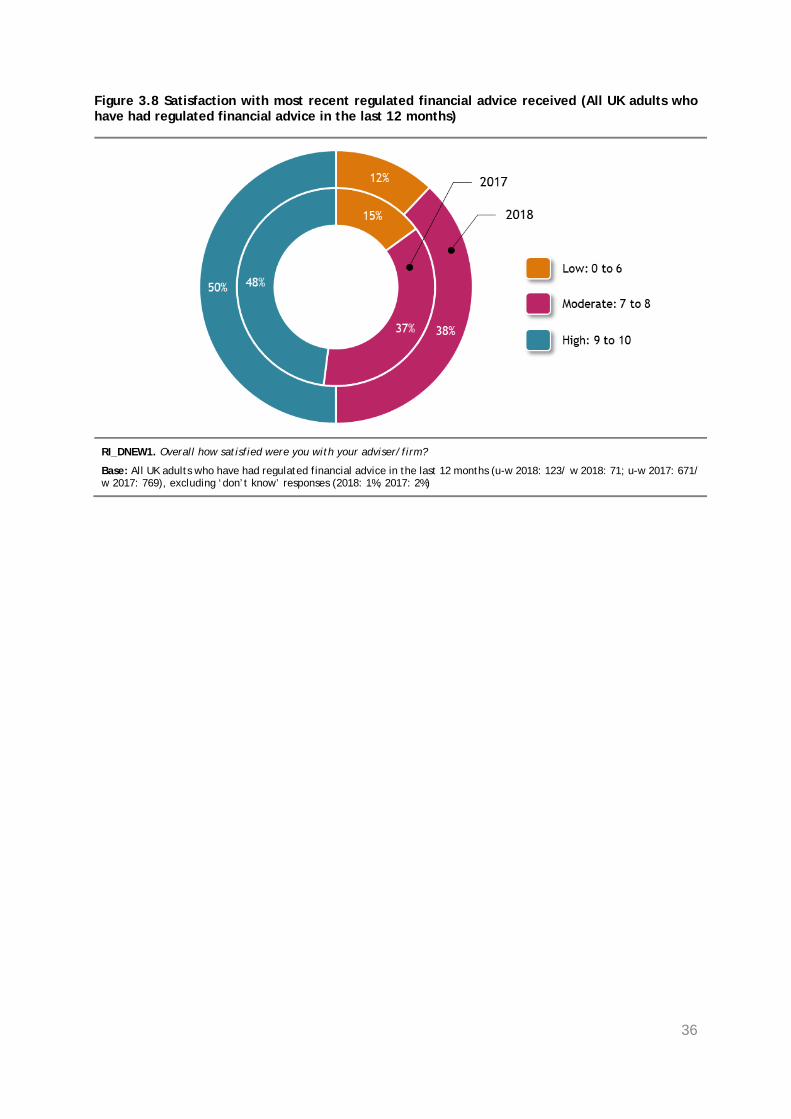
However, this does not necessarily mean high levels of satisfaction across the board. In both 2017 and
2018 around half of our Group 1 respondents say they are highly satisfied with the advice they
received, around two-fifths are moderately satisfied, and a small minority are dissatisfied (12% in
2018 and 15% in 2017).
Between 2017 and 2018 there has been no change in the proportion who felt that the fee paid was
about right and offered value for money; around seven in ten feel this way (65% in 2018 compared
with 72% in 2017: a difference which is not statistically significant).
Based on their historic experiences, not advised adults often have concerns about the quality
of advice and the value for money they might receive
One in eight (13%) Group 2 adults stated that they did not take up advice due to a lack of trust in
financial advisers, and one in ten (10%) expressed some concerns about the quality of the advice they
might receive. These sentiments were very much reflected in the qualitative research, where a high
4 Please note that we use square brackets ‘[x]’ to denote percentages based on 50 to 99 unweighted observations; see Reporting
conventions in the Appendix.
14
proportion of the older Group 2 adults we spoke to could recall having ‘advice’ in the past, usually
many years ago when advisers received commission.
For those not advised adults who do not think they will use regulated financial advice in the future,
one in six said this is due to a bad experience in the past or a lack of trust, and one in ten are put off
by the fees charged for advice.
Key findings: Use and importance of information and guidance
Information and guidance plays an important role helping people with their financial lives
Two-thirds (66%) of adults who received regulated financial advice in the last 12 months also used at
least one type of information or guidance related to investments, saving into a pension or retirement
planning. This is a significant increase on the 45% reported in 2017.
Almost half (48%) of the not advised population used some form of information or guidance in the last
12 months to help them with decisions related investments, saving into a pension or retirement
planning. This is significantly higher than the one-quarter (24%) who said they had used some form of
information or guidance in 2017.
The most used types of information or guidance in the last 12 months were private sector money
advice websites (24%), websites or other literature from banks, building societies, or other insurance/
investments or pension providers (22%), and media/ newspapers or their websites (16%).
Just 3% of all adults used Pension Wise in the last 12 months, 4% used TPAS and 15% used other
government/ consumer websites such as Money Advice Service, Citizens Advice, or GOV.UK.
These figures may be under-estimates. Our depth discussions revealed that adults tend to under-
report the information sources they are using. Most commonly, our respondents ‘forgot’ to report the
information they were getting from media and news, and information they were receiving from their
own providers. They also found it difficult to recall for sure whether they had specifically asked for
any financial help from friends or family in the last 12 months; this was often a topic covered in
general conversation rather than a for a specific advice event.
Almost half (46%) said they took no action directly as a result of the information or guidance they
received. This is perhaps not that surprising as people using guidance may be at quite an early stage
in the decision-making process and are simply seeking to educate themselves and understand their
options.
Adults who are not using information or guidance say they had not needed to do so
Of adults who have not used any of the sources of information or guidance related to investments,
saving into a pension or retirement planning in the last 12 months, just over half (54%) said that they
have never used these sources before, while 46% have used them before, but not in the last 12 months.

15
When ask why they had not used any of these sources in the last 12 months, 42% said that they had
no need, 16% have never tried before, 12% said they could make decisions on their own (without
guidance) and 12% did not think about it. It is important to recognise that the reasons given were not
because they are unable to find information or guidance to help them, nor is it because they do not
trust any information or guidance they might get.

16
1. Objectives and Methodology
1.1 Background
The Financial Advice Market Review (FAMR) was launched in August 2015 in light of concerns that the
market for financial advice in the UK was not working well for consumers. The aim of the Review was
to explore ways in which Government, industry and regulators could take individual and collective
steps to stimulate the development of a market which delivers affordable and accessible financial
advice and guidance to everyone, at all stages of their lives.
Since 2016, the FCA and HMT have implemented the range of measures that FAMR recommended in
its final report. Many of these have been aimed at reducing costs for firms and supporting them in
developing lower-cost options for consumers, including:
• Setting up the FCA’s Advice Unit, which provides regulatory feedback and support to firms
developing automated advice and guidance models
• Amending the regulatory definition of ‘advice’ and giving guidance to support firms
wanting to develop new services, such as those for consumers wanting advice on specific
needs only, or just help in making their own decisions
• Giving advisers more time to complete their training
• Working to reduce the time advisers spend on suitability reports
Other measures have been aimed at improving access and increasing consumer engagement, for
example:
• Reminding firms about the flexibility in the adviser charging rules
• Clarifying the charging rules for vertically integrated firms
• Providing support for employers and trustees giving help with financial wellbeing in the
workplace
• Making tax changes to help consumers pay for advice about their pensions
• Developing a Pensions Dashboard where consumers will be able to review their retirement
provision
FAMR considered that progress in achieving this vision should be judged against a number of success
factors:
• Good availability of affordable, high quality advice and guidance, which consumers at all
stages of their lives are able to access to help them with their particular needs
• There is greater innovation in the interests of consumers, encouraged by a flexible and
well-understood regulatory framework for advice
17
• A range of channels exist, through which consumers are able to access advice and
guidance, including in the workplace; and there is appropriate flexibility in the way
consumers are able to pay for advice
• Consumers engage with their own financial affairs and so seek out the advice and guidance
they need
The FCA and HMT are committed to monitoring the impact these measures are having over time. They
published baseline measures in June 2017,5 including an annex of detailed consumer research findings
from the Financial Lives Survey 2017.6
This report outlines findings from a new short survey (FAMR 2018 Survey) and qualitative research
with consumers. Results of this research will be used to indicate if there have been any changes in
the behaviour of UK adults in relation to taking regulated advice and guidance, and their perceptions
of this market since 2017. These interim findings are being published ahead of a full review of FAMR
measures in 2019.
It is important to note that whilst all of the FAMR measures were in place when this research was
conducted, it is likely to take some time for any effects to be seen. It may also be difficult to dis-
entangle the impacts directly resulting from the measures taken from general shifts in consumer
behaviour or changes driven by factors which are external to the advice market, such as stock market
levels and changes in government policy. Nevertheless, this research provides a useful indication of
how the market for advice is developing.
1.2 Research objectives
The objective of this consumer research was to understand the support UK adults are currently getting
with their financial decisions and how this may have changed since the baseline measures collected
in 2017. In particular:
• The number of UK adults who have received regulated financial advice related to
investments, saving into a pension or retirement planning in the last 12 months, compared
to those who have not. Including the experience of those who have had regulated advice
in 2017 and not 2018 and vice versa, and the reasons for this
5 https://www.fca.org.uk/publication/research/famr-baseline-report.pdf
6 https://www.fca.org.uk/publication/research/famr-quantitative-research.pdf
18
• Any changes in the experiences of adults who have had advice, including the drivers for
seeking advice, types of advice received, actions taken as a result of the advice received,
and nature of the relationship with the adviser
• The experiences of people who have not had advice and the reasons why they did not
make use of any advice service
• Any changes in the awareness and use of automated online investment or pension
providers
• The number of UK adults using information and guidance related to investments, saving
into a pension or retirement planning in the last 12 months. The information and guidance
sources used and the helpfulness of these
1.3 Research Methodology
The information contained in this report is drawn from three different sources:
1. FAMR 2018 Survey: A re-contact survey of adults who took part in the Financial Lives Survey
2017 and agreed to take part in further research. This survey was conducted in March 2018
and included interviews with 826 adults aged 18 and over. 555 of these interviews were
conducted online, while 271 were conducted by telephone. This research is the main evidence
source used in this report. We refer to these results (in figures, tables and text) using the
shorthand ‘the 2018 results’, or simply ‘2018’.
2. 2018 Qualitative Research: Qualitative research, based on 34 in-depth telephone discussions
with adults who took part in the Financial Lives Survey 2017 and agreed to take part in further
research. Interviews took place between March 2018 and June 2018 and lasted around 30
minutes. There were two distinct audiences for the qualitative research:
• 25 interviews with adults who have not had regulated financial advice related to pensions,
investments or retirement planning in the last 12 months, but might have a need for
advice. Some qualified for the 2018 research based on having more than £10,000 in
investible assets and some by having more than £10,000 in DC pension assets and planning
on retiring or accessing their DC pension within the next two years when they took part
in the Financial Lives Survey 2017
• 9 interviews with adults who had regulated financial advice in 2017 but not in 2018 or did
not have regulated financial advice in 2017 but did in 2018, based on their answers to the
Financial Lives Survey 2017 and the FAMR 2018 Survey
3. The FCA’s Financial Lives Survey 2017: A large-scale, tracking survey of consumers’
behaviour and experiences when engaging with financial services firms and buying financial
products. The 2017 survey was conducted between December 2016 and April 2017 and
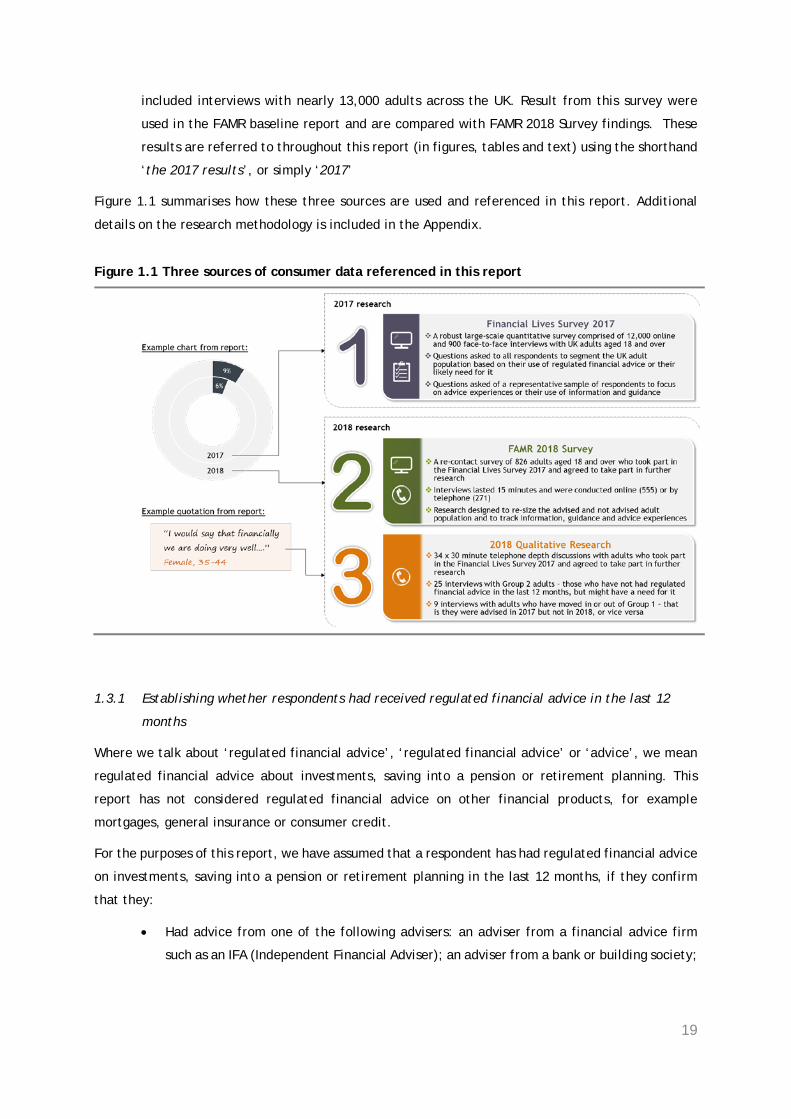
19
included interviews with nearly 13,000 adults across the UK. Result from this survey were
used in the FAMR baseline report and are compared with FAMR 2018 Survey findings. These
results are referred to throughout this report (in figures, tables and text) using the shorthand
‘the 2017 results’, or simply ‘2017’
Figure 1.1 summarises how these three sources are used and referenced in this report. Additional
details on the research methodology is included in the Appendix.
Figure 1.1 Three sources of consumer data referenced in this report
1.3.1 Establishing whether respondents had received regulated financial advice in the last 12
months
Where we talk about ‘regulated financial advice’, ‘regulated financial advice’ or ‘advice’, we mean
regulated financial advice about investments, saving into a pension or retirement planning. This
report has not considered regulated financial advice on other financial products, for example
mortgages, general insurance or consumer credit.
For the purposes of this report, we have assumed that a respondent has had regulated financial advice
on investments, saving into a pension or retirement planning in the last 12 months, if they confirm
that they:
• Had advice from one of the following advisers: an adviser from a financial advice firm
such as an IFA (Independent Financial Adviser); an adviser from a bank or building society;
20
an adviser from an insurance company, investment company or pension provider; or
automated online advice
• And they paid for the advice, or would have paid for the advice if they had taken out the
product7
We were keen to differentiate between those who had received regulated financial advice and those
who had received support which they perceived to be ‘advice’, but which falls outside the regulatory
perimeter. We chose to use the fact that advice is paid for as an indicator that the advice falls within
the regulatory perimeter. There is no regulatory requirement that firms charge for advice in every
case; nonetheless, we believe that payment remains a strong indicator that regulated financial advice
has been received.
If a respondent tells us ‘No, the advice was free, whether or not I took out a product’, we do not
count this as having received regulated financial advice.8 There could be valid reasons for why no
payment is made. Often this is the case for a short, introductory conversation at the beginning of any
relationship. For the purposes of this research, we have assumed, however, that the respondent may
be mistaken, either through not having seen a professional financial adviser or not having been given
advice.
We also provided the following clarifications of what is meant by ‘investments’, ‘a pension’ and
‘retirement planning’:
• By ‘investments’ we mean retail investment products including stocks and shares ISA,
insurance bonds, investment funds and endowments, shares and equities, corporate
bonds, gilts or government bonds, crowdfunding and peer-to-peer lending, and structured
investments/ deposits. Please do not include investment in property or in collectables
like wine, art or jewellery
• By ‘pension’ we mean a pension arranged through an employer or one you have arranged
yourself. Please do not think about State pensions.
• By ‘retirement planning’ we mean the choices you need to make when starting to take
money from your pension savings to fund your retirement. This could include buying an
annuity or entering into income drawdown or taking cash from your pension pot
7 The respondent is also told: Before 1 January 2013, payment may instead have taken the form of a commission from the product provider to the adviser.
8 See Figure 1.2: Graphic representation of the FAMR 2018 Survey questions used to assign respondents to Groups.
21
1.3.2 Segmenting the UK adult population into four Groups based on their use of regulated
financial advice or their likely need for it
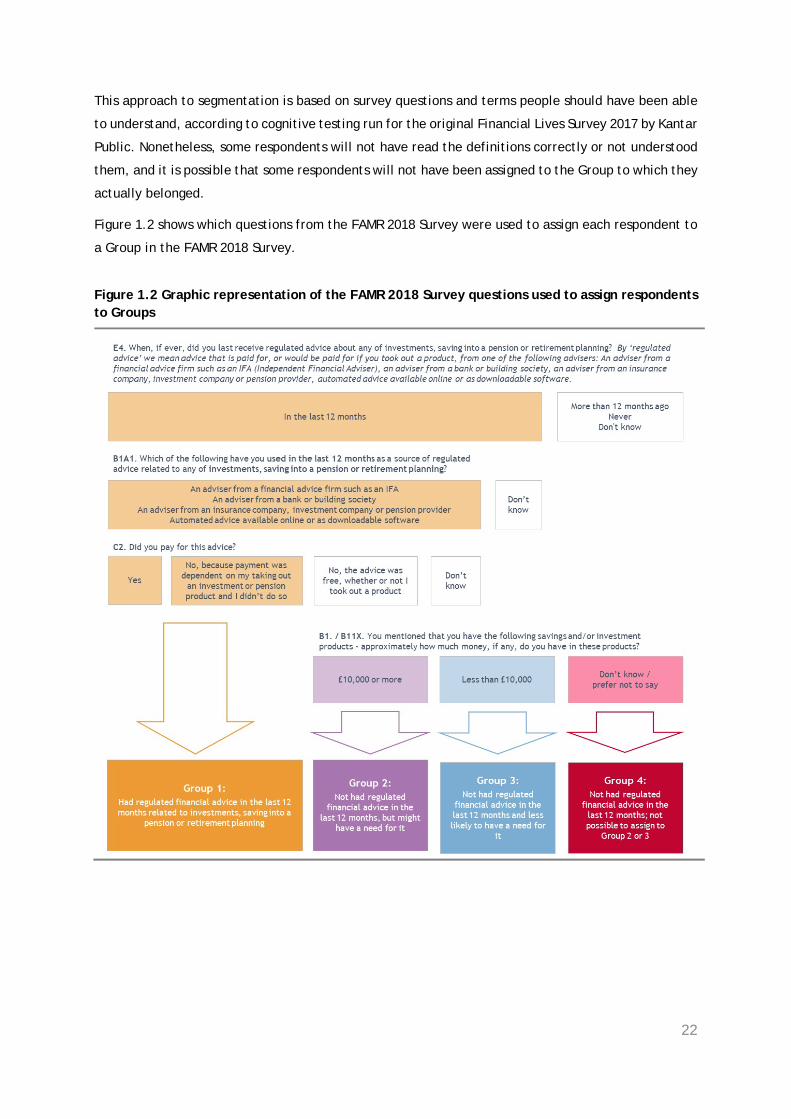
The UK adult population has been divided into four Groups:9
• Group 1: Those who have had regulated financial advice in the last 12 months related to
investments, saving into a pension or retirement planning
• Group 2: Those who have not had regulated financial advice in the last 12 months, but
whose circumstances suggest there might be a need for financial advice: these are people
who have at least £10,000 in savings and/ or investments
• Group 3: Those who have not had regulated financial advice in the last 12 months, and
whose circumstances suggest that a need for financial advice is less likely: these are
people who have less than £10,000 in savings and/ or investments, and do not have
£10,000 or more in a DC pension and a plan to retire or to access a DC pension in the next
2 years
• Group 4: Those who have not had regulated financial advice in the last 12 months, but
who cannot be allocated to Group 2 or 3 because insufficient information was provided
about their financial situation
In this report, we present the results from Groups 3 and 4 combined for weighting purposes.10
Activities over the intervening 12 months mean that movement between the Groups is possible – for
example someone taking regulated financial advice in 2018 could move from Group 2 or 3 or 4 into
Group 1; someone taking their savings or investments out could move from Group 2 to Group 3 or 4;
someone ceasing their relationship with their financial adviser could move from Group 1 to Group 2,
3 or 4. Throughout this report we clearly identify such cases.
As we make frequent reference to these Groups throughout this report, it is useful to note:
• Group 1 constitutes the ‘advised’ (in the last 12 months) compared to the combination of
Groups 2, 3 and 4 who together make up the total of those ‘not advised’ (in the last 12
months)
• Any respondent who told us that they received in the last 12 months advice that was ‘free’
and no advice that was ‘paid for’ will, dependent on the financial resources they have
disclosed, be included in Group 2, Group 3 or Group 4
9 Please note that we made changes to the FAMR 2018 Survey questionnaire that had an impact on Group Allocation. please
see section 1.3.3 and the Appendix for further information.
10 See the Appendix for further detail as to why Groups 2 and 4 are combined.
22
This approach to segmentation is based on survey questions and terms people should have been able
to understand, according to cognitive testing run for the original Financial Lives Survey 2017 by Kantar
Public. Nonetheless, some respondents will not have read the definitions correctly or not understood
them, and it is possible that some respondents will not have been assigned to the Group to which they
actually belonged.
Figure 1.2 shows which questions from the FAMR 2018 Survey were used to assign each respondent to
a Group in the FAMR 2018 Survey.
Figure 1.2 Graphic representation of the FAMR 2018 Survey questions used to assign respondents to Groups
23
1.3.3 Questionnaire and Group allocation changes compared to 2017
Where possible, identical question wording was used in the FAMR 2018 Survey to that used for the
Financial Lives Survey 2017 to allow for comparison between the two sets of results. There were,
however, some changes made to the questionnaire for the FAMR 2018 Survey. This includes the
addition of new questions and the addition of new response codes to some of the original 2017
questions. In such cases comparison to results from the Financial Lives Survey 2017 is not always
possible. Where comparisons cannot be made we make this clear in the description below each chart
presented in this report.
Another change made to the FAMR Survey 2018 questionnaire was to simplify how we allocate
respondents to the four Groups for the purposes of this shorter survey. Here we ask the amount of
money respondents have in any savings and investments as a single question, rather than having
separate questions for savings and for investments, as was the case in the Financial Lives Survey 2017.
For those who select ‘do not know’ or ‘prefer not to say’, we then ask question B11X which determines
if their savings and investments combined are less than £10,000, about £10, 000 or more than £10,000.
This was a simplification of a similar question (B11) used in the original Financial Lives Survey 2017.
We believe these changes can account for the reduction in the number of respondents allocated into
Group 4 (those who have not had regulated advice in the last 12 months, but who cannot be allocated
to Group 2 or 3 because insufficient detail was provided about their financial situation), and
consequently the increase in the number we were able to allocate to Groups 2 and 3 because relevant
information was supplied. As a result, the most reliable year-on-year comparisons when comparing
the size of each of the Groups are between Groups 1 (advised) and the combined Groups 2/3/4 (non-
advised).
A further simplification of the Group allocation that has a negligible impact on results was made for
those people qualifying for Group 2. In the Financial Lives Survey 2017 a small number of respondents
(35) were allocated to Group 2 solely on the basis of the size of their defined contribution pension
pot. As the vast majority of respondents with a qualifying pension pot also exceed the qualifying level
of investible assets, the marginal gain in accuracy of allocating people to Group 2 solely on the basis
of defined contribution pension pot was not considered worth the additional questioning required to
establish its size.
1.3.4 Limitations
All surveys have limitations to their design. A key challenge for the FAMR 2018 Survey was that to
track movements of individuals between the four FAMR Groups over time we needed to re-contact
respondents who had taken part in the original Financial Lives Survey 2017 and agreed to participate
in further research. Only 4,120 (32%) respondents had given their permission to re-contact and the
FAMR 2018 Survey achieved 826 interviews in total.
24
The profile of the achieved sample (unweighted) was not representative of the UK adults age 18+
(weighted) who had participated in the 2017 survey. To correct for this the results were weighted
(using the Financial Lives Survey 2017 as a target) giving an effective sample size of 409. Despite this
weighting, some bias in the sample may still exist. As a result of this, and a low effective sample size,
the findings presented in this report give an indicative view as to the impact of FAMR measures but
should be interpreted with a degree of caution. The full Financial Lives Survey will be conducted
again in 2019 which will provide a more robust measure of the impact of FAMR measures, to be
published in 2020.
Further key methodological considerations are outlined below and discussed in detail in the
Methodological Appendix, chapter 8:
• Questionnaire changes meant that allocation to Groups 2, 3 and 4 was simplified in the FAMR 2018
Survey compared to the Financial Lives Survey 2017. As a result, the most reliable year-on-year
comparisons when comparing the size of each of the Groups are between Groups 1 (advised) and
the combined Groups 2/3/4 (non-advised)
• The data collection method has changed from a mix of face to face and online interviews to a mix
of telephone and online, which may have an unobservable impact on results when comparing
FAMR 2018 Survey results to those from the Financial Lives Survey 2017
• The advantage of re-interviewing respondents which allows assessment of changes in individual
behaviour, also potentially introduces an unmeasurable conditioning effect which may increase
participants’ awareness and likelihood to act
• We have tested all of the survey results to a confidence interval (CI) of 95%. Where we pick out
results in the report text, they are always statistically significant to a CI of 95%, unless we
explicitly say they are not.
25
2. Size of the advised and not advised UK adult population
In this chapter we provide an overview of the size of the regulated financial advice market and how
this has changed since 2017. Chapters 3 and 5 provide more detail at the advised and not advised
populations.
2.1 Number of UK adults who have had advice in the last 12 months
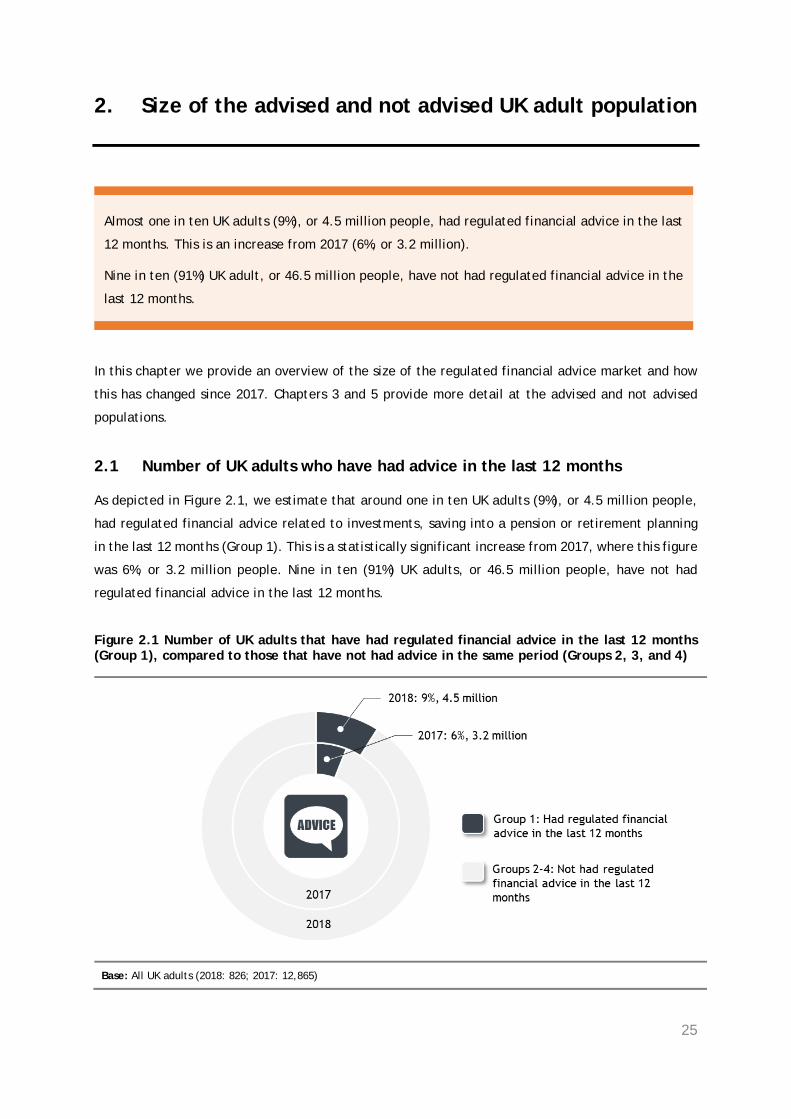
As depicted in Figure 2.1, we estimate that around one in ten UK adults (9%), or 4.5 million people,
had regulated financial advice related to investments, saving into a pension or retirement planning
in the last 12 months (Group 1). This is a statistically significant increase from 2017, where this figure
was 6%, or 3.2 million people. Nine in ten (91%) UK adults, or 46.5 million people, have not had
regulated financial advice in the last 12 months.
Figure 2.1 Number of UK adults that have had regulated financial advice in the last 12 months (Group 1), compared to those that have not had advice in the same period (Groups 2, 3, and 4)
Base: All UK adults (2018: 826; 2017: 12,865)
Almost one in ten UK adults (9%), or 4.5 million people, had regulated financial advice in the last
12 months. This is an increase from 2017 (6%, or 3.2 million).
Nine in ten (91%) UK adult, or 46.5 million people, have not had regulated financial advice in the
last 12 months.
26
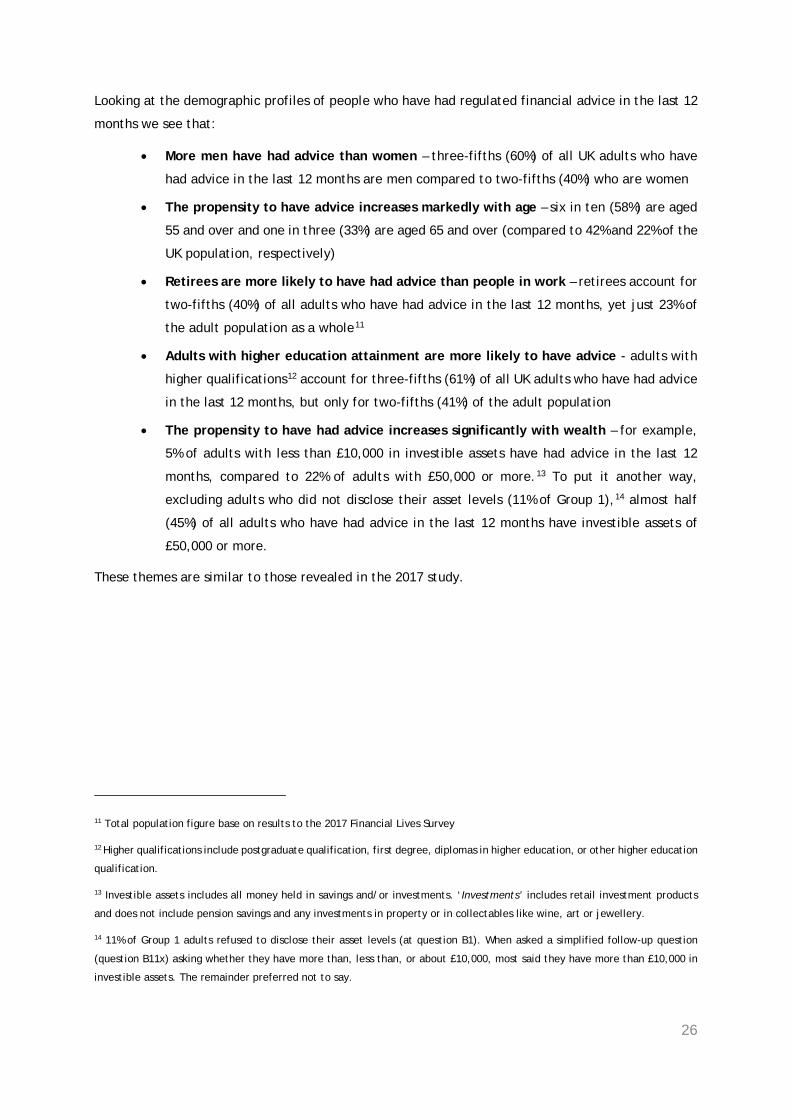
Looking at the demographic profiles of people who have had regulated financial advice in the last 12
months we see that:
• More men have had advice than women – three-fifths (60%) of all UK adults who have
had advice in the last 12 months are men compared to two-fifths (40%) who are women
• The propensity to have advice increases markedly with age – six in ten (58%) are aged
55 and over and one in three (33%) are aged 65 and over (compared to 42% and 22% of the
UK population, respectively)
• Retirees are more likely to have had advice than people in work – retirees account for
two-fifths (40%) of all adults who have had advice in the last 12 months, yet just 23% of
the adult population as a whole11
• Adults with higher education attainment are more likely to have advice - adults with
higher qualifications12 account for three-fifths (61%) of all UK adults who have had advice
in the last 12 months, but only for two-fifths (41%) of the adult population
• The propensity to have had advice increases significantly with wealth – for example,
5% of adults with less than £10,000 in investible assets have had advice in the last 12
months, compared to 22% of adults with £50,000 or more.13 To put it another way,
excluding adults who did not disclose their asset levels (11% of Group 1),14 almost half
(45%) of all adults who have had advice in the last 12 months have investible assets of
£50,000 or more.
These themes are similar to those revealed in the 2017 study.
11 Total population figure base on results to the 2017 Financial Lives Survey
12 Higher qualifications include postgraduate qualification, first degree, diplomas in higher education, or other higher education
qualification.
13 Investible assets includes all money held in savings and/or investments. ‘Investments’ includes retail investment products
and does not include pension savings and any investments in property or in collectables like wine, art or jewellery.
14 11% of Group 1 adults refused to disclose their asset levels (at question B1). When asked a simplified follow-up question
(question B11x) asking whether they have more than, less than, or about £10,000, most said they have more than £10,000 in
investible assets. The remainder preferred not to say.
27
3. Experiences of people who have had regulated
financial advice in the last 12 months
In this chapter we look at Group 1 in more detail – those adults who have had regulated financial
advice in the last 12 months: a Group containing 4.5 million adults.
We start by exploring the type of adviser used in the last 12 months (or advisers if they had multiple
advice sessions in this period). We then look at how adults say they paid for the advice their received,
what prompted them to seek advice, and the nature of the advice needed. We examine the actions
taken with and without advice, before looking at levels of trust and levels of satisfaction with the
advice received.
While some people may have had multiple advice sessions within the last 12 months, the focus of this
chapter is generally on their sole or most recent session.
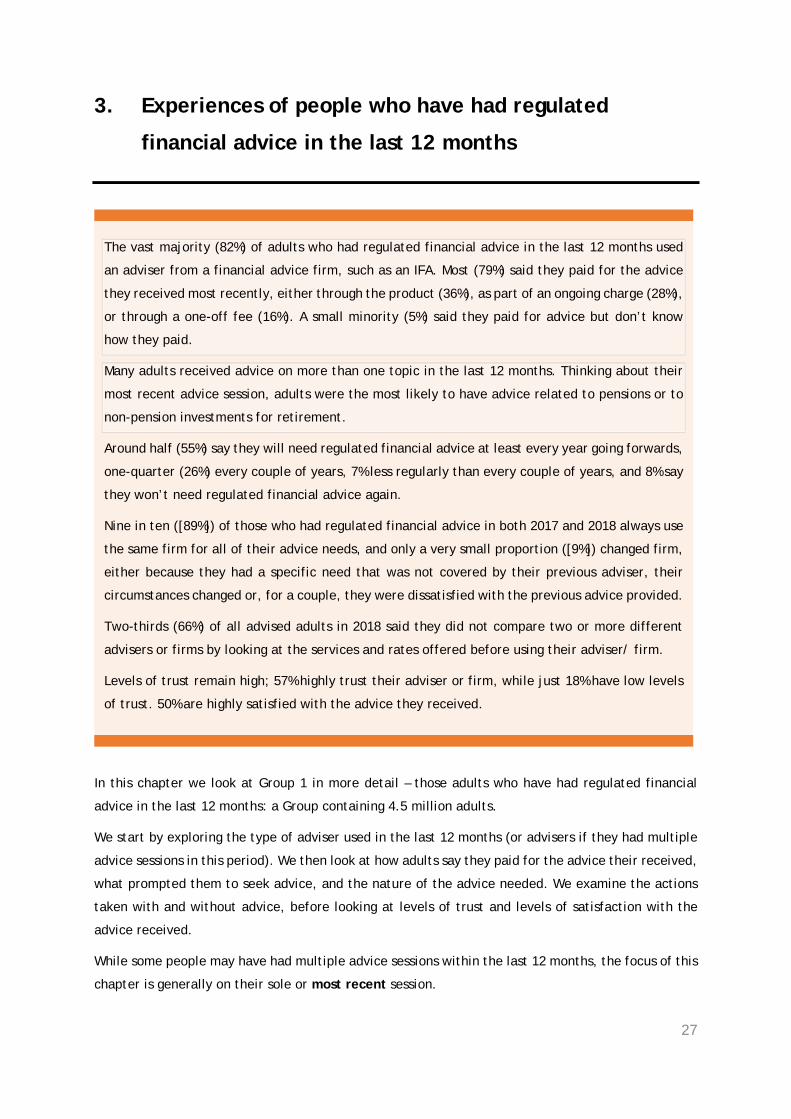
The vast majority (82%) of adults who had regulated financial advice in the last 12 months used
an adviser from a financial advice firm, such as an IFA. Most (79%) said they paid for the advice
they received most recently, either through the product (36%), as part of an ongoing charge (28%),
or through a one-off fee (16%). A small minority (5%) said they paid for advice but don’t know
how they paid.
Many adults received advice on more than one topic in the last 12 months. Thinking about their
most recent advice session, adults were the most likely to have advice related to pensions or to
non-pension investments for retirement.
Around half (55%) say they will need regulated financial advice at least every year going forwards,
one-quarter (26%) every couple of years, 7% less regularly than every couple of years, and 8% say
they won’t need regulated financial advice again.
Nine in ten ([89%]) of those who had regulated financial advice in both 2017 and 2018 always use
the same firm for all of their advice needs, and only a very small proportion ([9%]) changed firm,
either because they had a specific need that was not covered by their previous adviser, their
circumstances changed or, for a couple, they were dissatisfied with the previous advice provided.
Two-thirds (66%) of all advised adults in 2018 said they did not compare two or more different
advisers or firms by looking at the services and rates offered before using their adviser/ firm.
Levels of trust remain high; 57% highly trust their adviser or firm, while just 18% have low levels
of trust. 50% are highly satisfied with the advice they received.
28
3.1 Type of advice received
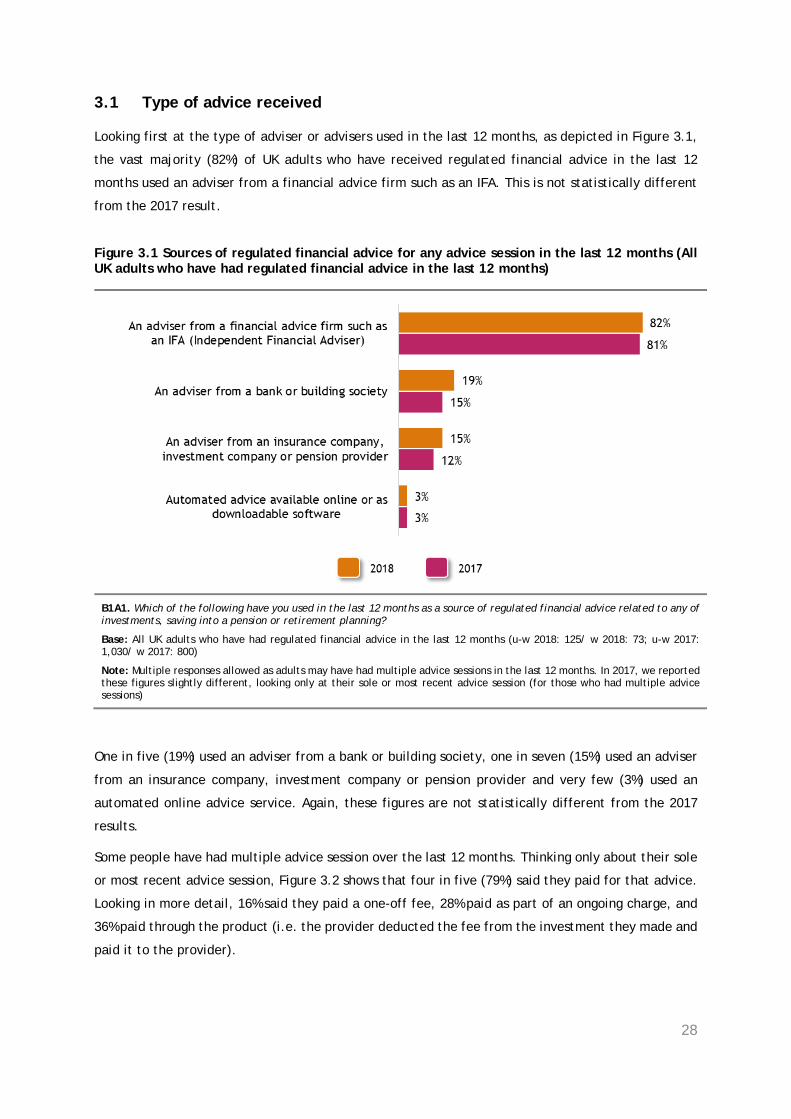
Looking first at the type of adviser or advisers used in the last 12 months, as depicted in Figure 3.1,
the vast majority (82%) of UK adults who have received regulated financial advice in the last 12
months used an adviser from a financial advice firm such as an IFA. This is not statistically different
from the 2017 result.
Figure 3.1 Sources of regulated financial advice for any advice session in the last 12 months (All UK adults who have had regulated financial advice in the last 12 months)
B1A1. Which of the following have you used in the last 12 months as a source of regulated financial advice related to any of investments, saving into a pension or retirement planning?
Base: All UK adults who have had regulated financial advice in the last 12 months (u-w 2018: 125/ w 2018: 73; u-w 2017: 1,030/ w 2017: 800)
Note: Multiple responses allowed as adults may have had multiple advice sessions in the last 12 months. In 2017, we reported these figures slightly different, looking only at their sole or most recent advice session (for those who had multiple advice sessions)
One in five (19%) used an adviser from a bank or building society, one in seven (15%) used an adviser
from an insurance company, investment company or pension provider and very few (3%) used an
automated online advice service. Again, these figures are not statistically different from the 2017
results.
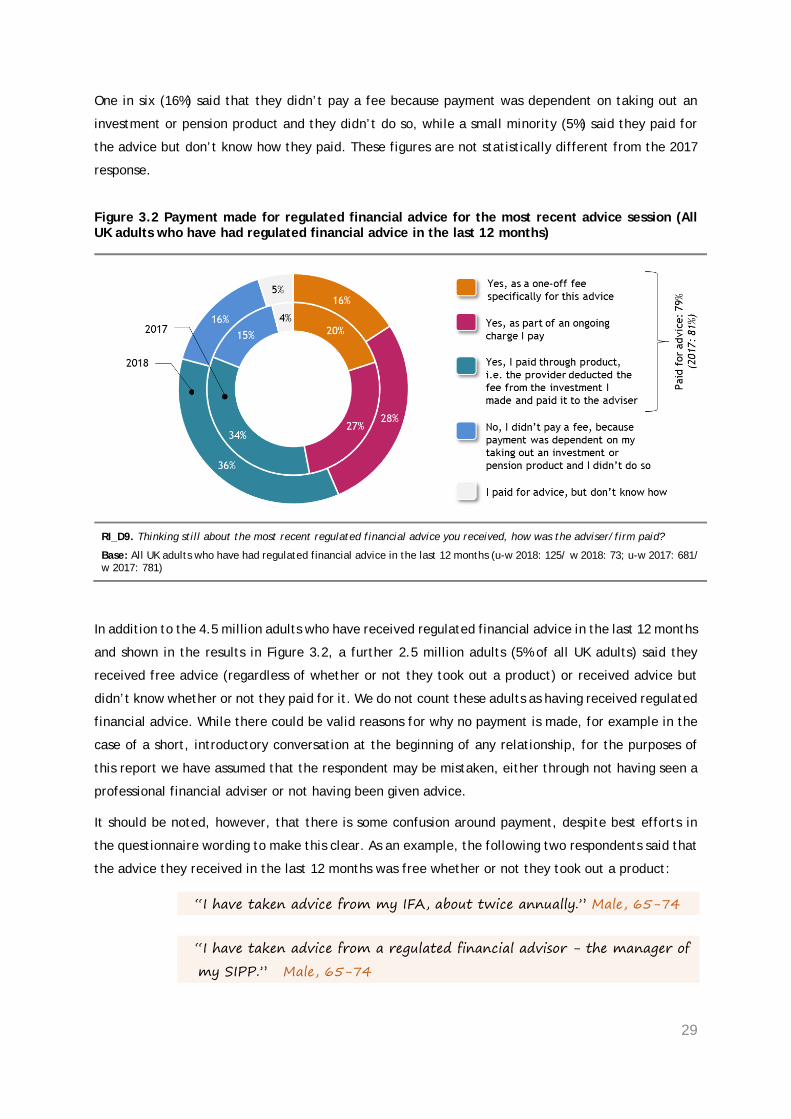
Some people have had multiple advice session over the last 12 months. Thinking only about their sole
or most recent advice session, Figure 3.2 shows that four in five (79%) said they paid for that advice.
Looking in more detail, 16% said they paid a one-off fee, 28% paid as part of an ongoing charge, and
36% paid through the product (i.e. the provider deducted the fee from the investment they made and
paid it to the provider).
29
One in six (16%) said that they didn’t pay a fee because payment was dependent on taking out an
investment or pension product and they didn’t do so, while a small minority (5%) said they paid for
the advice but don’t know how they paid. These figures are not statistically different from the 2017
response.
Figure 3.2 Payment made for regulated financial advice for the most recent advice session (All UK adults who have had regulated financial advice in the last 12 months)
RI_D9. Thinking still about the most recent regulated financial advice you received, how was the adviser/firm paid?
Base: All UK adults who have had regulated financial advice in the last 12 months (u-w 2018: 125/ w 2018: 73; u-w 2017: 681/ w 2017: 781)
In addition to the 4.5 million adults who have received regulated financial advice in the last 12 months
and shown in the results in Figure 3.2, a further 2.5 million adults (5% of all UK adults) said they
received free advice (regardless of whether or not they took out a product) or received advice but
didn’t know whether or not they paid for it. We do not count these adults as having received regulated
financial advice. While there could be valid reasons for why no payment is made, for example in the
case of a short, introductory conversation at the beginning of any relationship, for the purposes of
this report we have assumed that the respondent may be mistaken, either through not having seen a
professional financial adviser or not having been given advice.
It should be noted, however, that there is some confusion around payment, despite best efforts in
the questionnaire wording to make this clear. As an example, the following two respondents said that
the advice they received in the last 12 months was free whether or not they took out a product:
“I have taken advice from my IFA, about twice annually.” Male, 65-74
“I have taken advice from a regulated financial advisor - the manager of
my SIPP.” Male, 65-74
30
3.2 Drivers for seeking advice and the nature of the advice received in the
most recent session
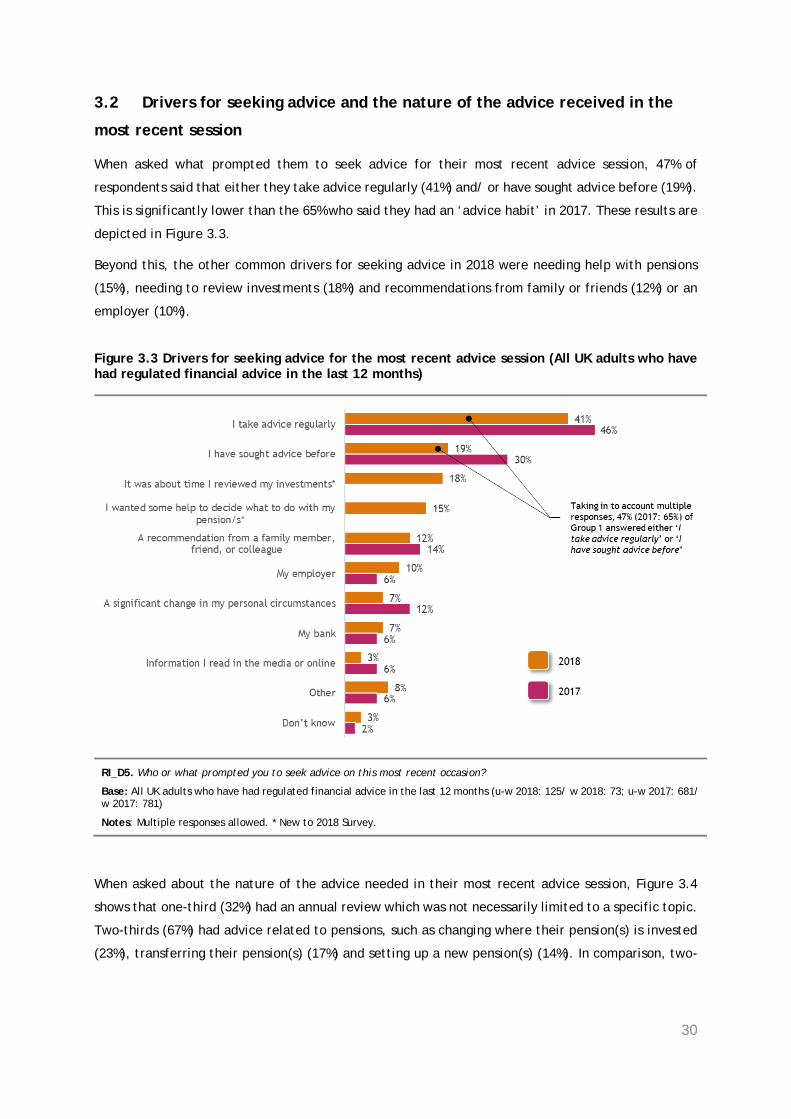
When asked what prompted them to seek advice for their most recent advice session, 47% of
respondents said that either they take advice regularly (41%) and/ or have sought advice before (19%).
This is significantly lower than the 65% who said they had an ‘advice habit’ in 2017. These results are
depicted in Figure 3.3.
Beyond this, the other common drivers for seeking advice in 2018 were needing help with pensions
(15%), needing to review investments (18%) and recommendations from family or friends (12%) or an
employer (10%).
Figure 3.3 Drivers for seeking advice for the most recent advice session (All UK adults who have had regulated financial advice in the last 12 months)
RI_D5. Who or what prompted you to seek advice on this most recent occasion?
Base: All UK adults who have had regulated financial advice in the last 12 months (u-w 2018: 125/ w 2018: 73; u-w 2017: 681/ w 2017: 781)
Notes: Multiple responses allowed. * New to 2018 Survey.
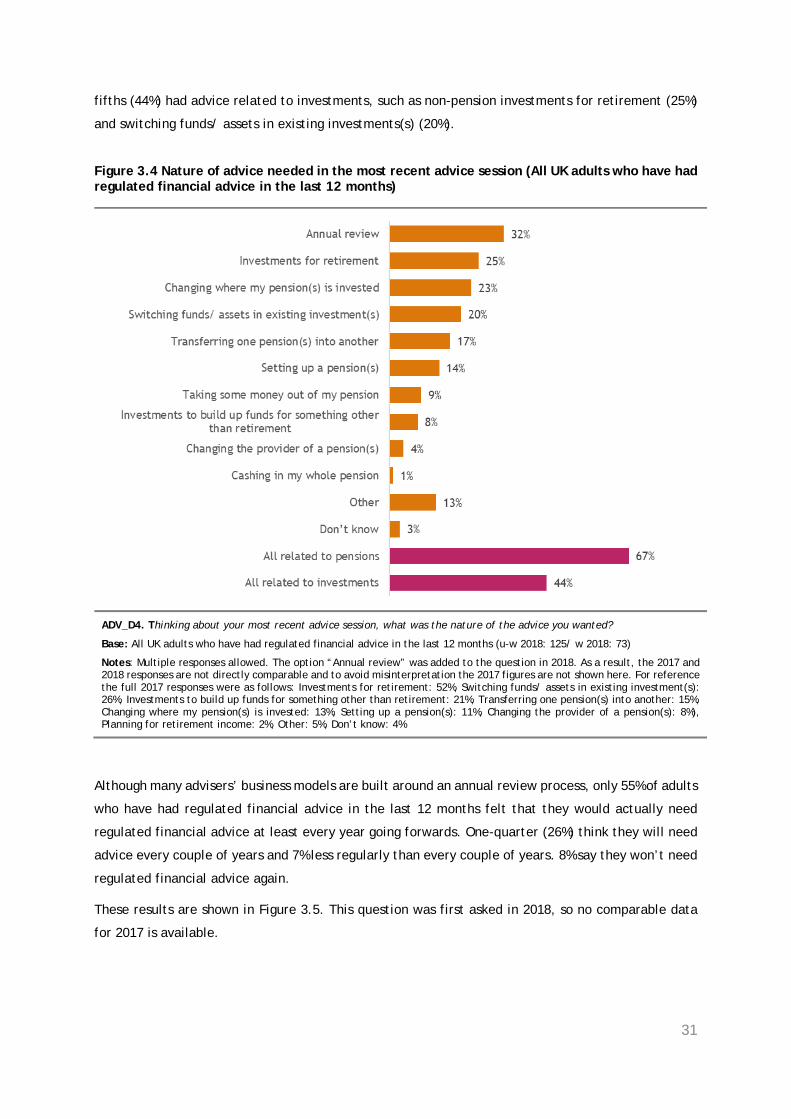
When asked about the nature of the advice needed in their most recent advice session, Figure 3.4
shows that one-third (32%) had an annual review which was not necessarily limited to a specific topic.
Two-thirds (67%) had advice related to pensions, such as changing where their pension(s) is invested
(23%), transferring their pension(s) (17%) and setting up a new pension(s) (14%). In comparison, two-
31
fifths (44%) had advice related to investments, such as non-pension investments for retirement (25%)
and switching funds/ assets in existing investments(s) (20%).
Figure 3.4 Nature of advice needed in the most recent advice session (All UK adults who have had regulated financial advice in the last 12 months)
ADV_D4. Thinking about your most recent advice session, what was the nature of the advice you wanted?
Base: All UK adults who have had regulated financial advice in the last 12 months (u-w 2018: 125/ w 2018: 73)
Notes: Multiple responses allowed. The option “Annual review” was added to the question in 2018. As a result, the 2017 and 2018 responses are not directly comparable and to avoid misinterpretation the 2017 figures are not shown here. For reference the full 2017 responses were as follows: Investments for retirement: 52%, Switching funds/ assets in existing investment(s): 26%, Investments to build up funds for something other than retirement: 21%, Transferring one pension(s) into another: 15%, Changing where my pension(s) is invested: 13%, Setting up a pension(s): 11%, Changing the provider of a pension(s): 8%), Planning for retirement income: 2%, Other: 5%, Don’t know: 4%
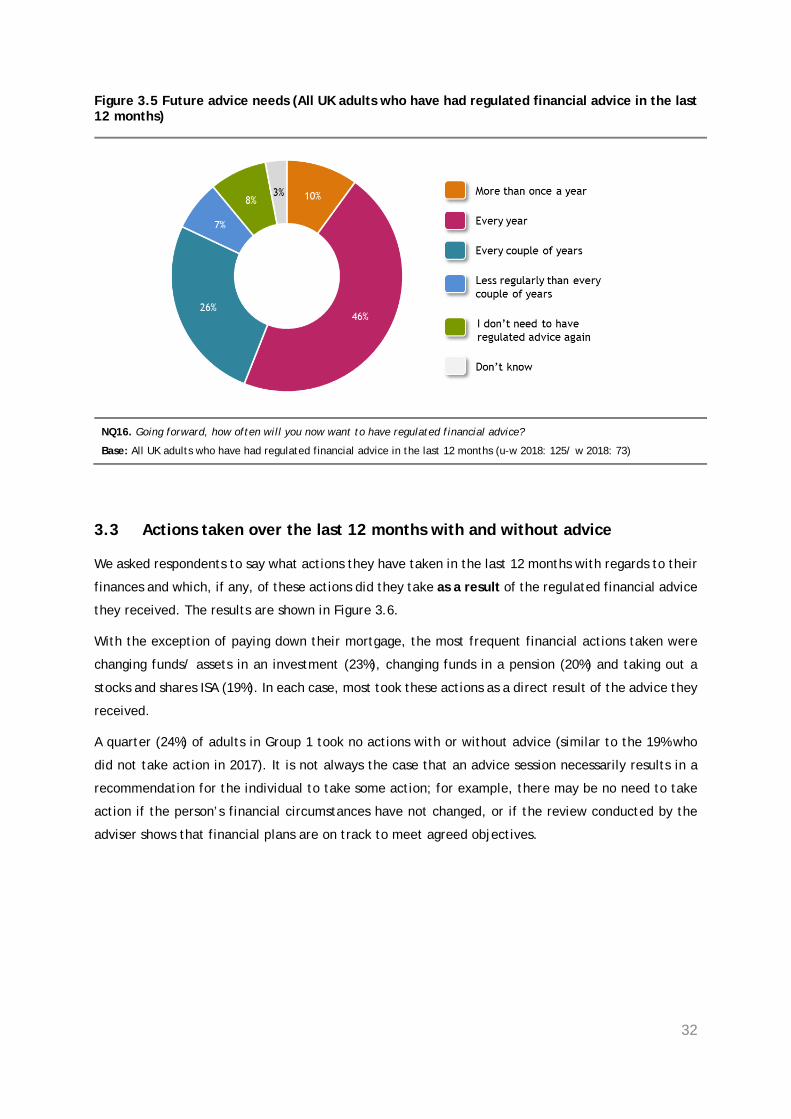
Although many advisers’ business models are built around an annual review process, only 55% of adults
who have had regulated financial advice in the last 12 months felt that they would actually need
regulated financial advice at least every year going forwards. One-quarter (26%) think they will need
advice every couple of years and 7% less regularly than every couple of years. 8% say they won’t need
regulated financial advice again.
These results are shown in Figure 3.5. This question was first asked in 2018, so no comparable data
for 2017 is available.
32
Figure 3.5 Future advice needs (All UK adults who have had regulated financial advice in the last 12 months)
NQ16. Going forward, how often will you now want to have regulated financial advice?
Base: All UK adults who have had regulated financial advice in the last 12 months (u-w 2018: 125/ w 2018: 73)
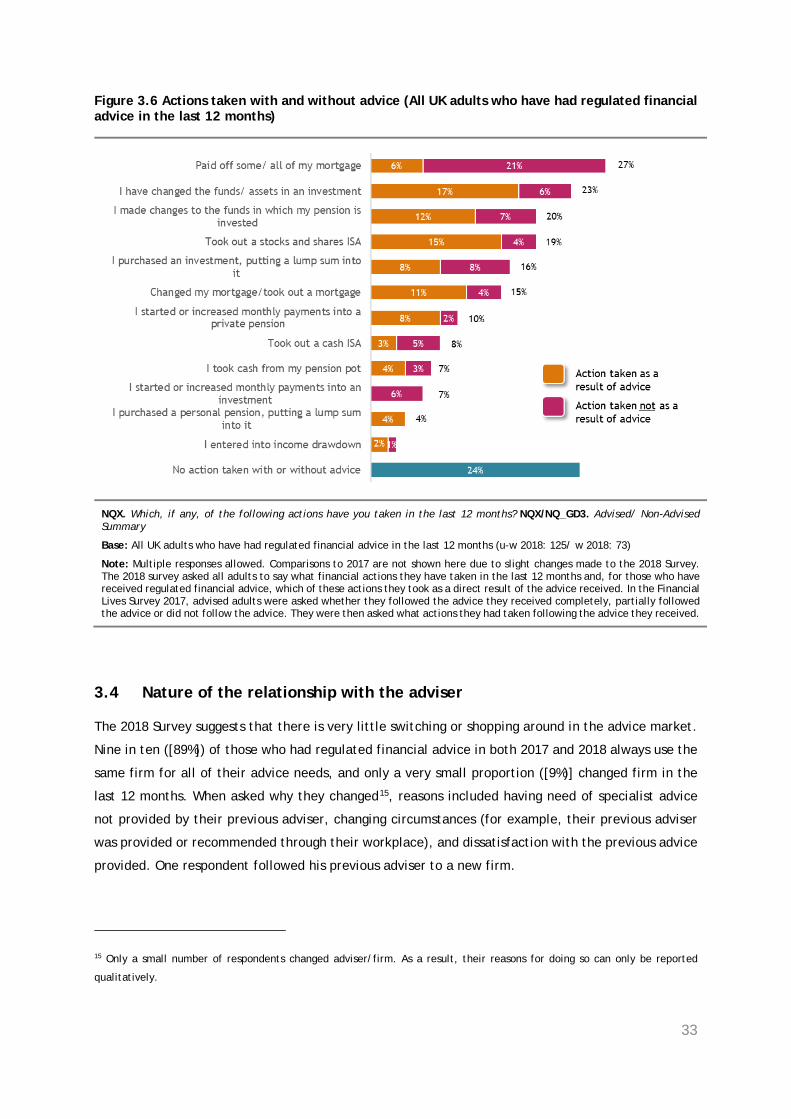
3.3 Actions taken over the last 12 months with and without advice
We asked respondents to say what actions they have taken in the last 12 months with regards to their
finances and which, if any, of these actions did they take as a result of the regulated financial advice
they received. The results are shown in Figure 3.6.
With the exception of paying down their mortgage, the most frequent financial actions taken were
changing funds/ assets in an investment (23%), changing funds in a pension (20%) and taking out a
stocks and shares ISA (19%). In each case, most took these actions as a direct result of the advice they
received.
A quarter (24%) of adults in Group 1 took no actions with or without advice (similar to the 19% who
did not take action in 2017). It is not always the case that an advice session necessarily results in a
recommendation for the individual to take some action; for example, there may be no need to take
action if the person’s financial circumstances have not changed, or if the review conducted by the
adviser shows that financial plans are on track to meet agreed objectives.
33
Figure 3.6 Actions taken with and without advice (All UK adults who have had regulated financial advice in the last 12 months)
NQX. Which, if any, of the following actions have you taken in the last 12 months? NQX/NQ_GD3. Advised/ Non-Advised Summary
Base: All UK adults who have had regulated financial advice in the last 12 months (u-w 2018: 125/ w 2018: 73)
Note: Multiple responses allowed. Comparisons to 2017 are not shown here due to slight changes made to the 2018 Survey. The 2018 survey asked all adults to say what financial actions they have taken in the last 12 months and, for those who have received regulated financial advice, which of these actions they took as a direct result of the advice received. In the Financial Lives Survey 2017, advised adults were asked whether they followed the advice they received completely, partially followed the advice or did not follow the advice. They were then asked what actions they had taken following the advice they received.
3.4 Nature of the relationship with the adviser
The 2018 Survey suggests that there is very little switching or shopping around in the advice market.
Nine in ten ([89%]) of those who had regulated financial advice in both 2017 and 2018 always use the
same firm for all of their advice needs, and only a very small proportion ([9%)] changed firm in the
last 12 months. When asked why they changed15, reasons included having need of specialist advice
not provided by their previous adviser, changing circumstances (for example, their previous adviser
was provided or recommended through their workplace), and dissatisfaction with the previous advice
provided. One respondent followed his previous adviser to a new firm.
15 Only a small number of respondents changed adviser/firm. As a result, their reasons for doing so can only be reported
qualitatively.
34
“Specialist advice required for a Final Salary pension transfer.”
Male, 55-64
“Pensions advice is provided through work free of charge. I don't use the
same firm to give me investment advice. I rely on family recommendations
and people that are known to my family.” Female, 45-54
“[My] initial provider gave me advice that was completely incorrect - I
pointed this out to them. No apology, no corrective action taken. Surprised
they are allowed to give advice...” Male, 55-64
“[My] adviser moved from previous company to set up own, so I decided to
move with him.” Male, 55-64
Two-thirds (66%) of all advised adults in 2018 said they did not compare two or more different advisers
or firms by looking at the services and rates offered before using their adviser/ firm.
These results support those from the 2017 survey, where 67% of those who had been using their
adviser/ firm 3 years or less, did not shop around before selecting their adviser/ firm and 92% of all
adults who had received regulated financial advice in the preceding 12 months said they generally
use the same adviser/ firm for regulated financial advice about investments, saving into a pension
and/ or retirement planning.
It is perhaps not surprising, given the dominance of these long-standing relationships, that those who
have received regulated financial advice in the last 12 months have high levels of trust in their adviser.
Furthermore, as Figure 3.7 reveals, trust levels have changed little since 2017.
35
Figure 3.7 Level of trust in adviser/ firm (All UK adults who have had regulated financial advice in the last 12 months)
RI_D181. How much did you trust this adviser/ firm?
Base: All UK adults who have had regulated financial advice in the last 12 months (u-w 2018: 125/ w 2018: 73; u-w 2017: 674/ w 2017: 771)
Between 2017 and 2018 there has been no change in the proportion who felt that the fee paid was
about right and offered value for money; around seven in ten feel this way (65% in 2018 compared to
72% in 2017: a difference which is not statistically significant).
However, this does not necessarily mean high levels of satisfaction across the board; in both 2017 and
2018 around half of our Group 1 respondents say they are highly satisfied with the advice they
received, as Figure 3.8 shows, around two-fifths are moderately satisfied, and a small minority are
dissatisfied (12% in 2018 and 15% in 2017).
36
Figure 3.8 Satisfaction with most recent regulated financial advice received (All UK adults who have had regulated financial advice in the last 12 months)
RI_DNEW1. Overall how satisfied were you with your adviser/firm?
Base: All UK adults who have had regulated financial advice in the last 12 months (u-w 2018: 123/ w 2018: 71; u-w 2017: 671/ w 2017: 769), excluding ‘don’t know’ responses (2018: 1%, 2017: 2%)
37
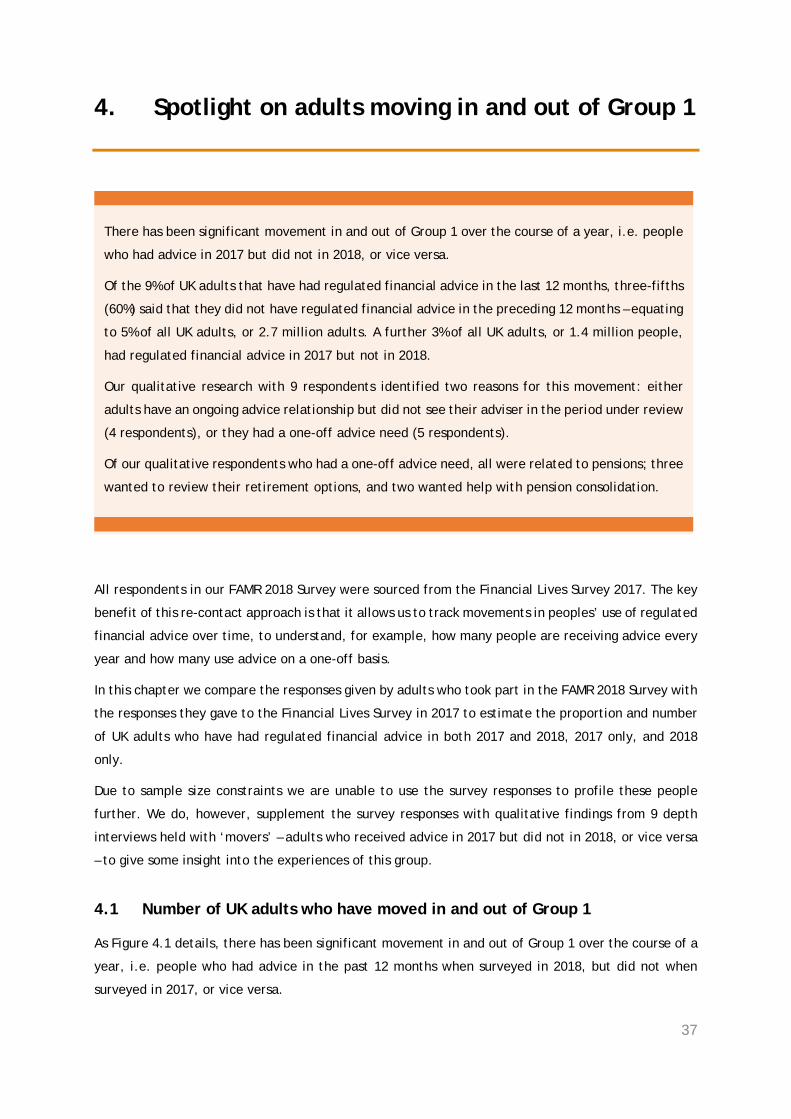
4. Spotlight on adults moving in and out of Group 1
All respondents in our FAMR 2018 Survey were sourced from the Financial Lives Survey 2017. The key
benefit of this re-contact approach is that it allows us to track movements in peoples’ use of regulated
financial advice over time, to understand, for example, how many people are receiving advice every
year and how many use advice on a one-off basis.
In this chapter we compare the responses given by adults who took part in the FAMR 2018 Survey with
the responses they gave to the Financial Lives Survey in 2017 to estimate the proportion and number
of UK adults who have had regulated financial advice in both 2017 and 2018, 2017 only, and 2018
only.
Due to sample size constraints we are unable to use the survey responses to profile these people
further. We do, however, supplement the survey responses with qualitative findings from 9 depth
interviews held with ‘movers’ – adults who received advice in 2017 but did not in 2018, or vice versa
– to give some insight into the experiences of this group.
4.1 Number of UK adults who have moved in and out of Group 1
As Figure 4.1 details, there has been significant movement in and out of Group 1 over the course of a
year, i.e. people who had advice in the past 12 months when surveyed in 2018, but did not when
surveyed in 2017, or vice versa.
There has been significant movement in and out of Group 1 over the course of a year, i.e. people
who had advice in 2017 but did not in 2018, or vice versa.
Of the 9% of UK adults that have had regulated financial advice in the last 12 months, three-fifths
(60%) said that they did not have regulated financial advice in the preceding 12 months – equating
to 5% of all UK adults, or 2.7 million adults. A further 3% of all UK adults, or 1.4 million people,
had regulated financial advice in 2017 but not in 2018.
Our qualitative research with 9 respondents identified two reasons for this movement: either
adults have an ongoing advice relationship but did not see their adviser in the period under review
(4 respondents), or they had a one-off advice need (5 respondents).
Of our qualitative respondents who had a one-off advice need, all were related to pensions; three
wanted to review their retirement options, and two wanted help with pension consolidation.
38
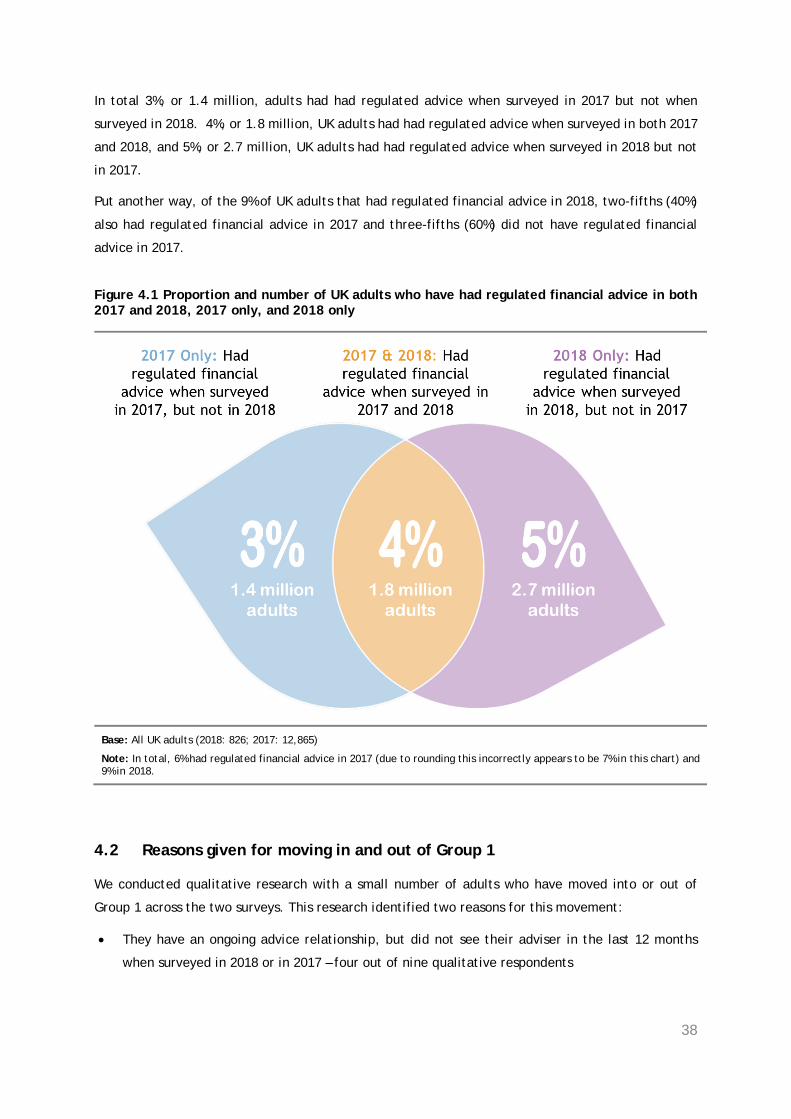
In total 3%, or 1.4 million, adults had had regulated advice when surveyed in 2017 but not when
surveyed in 2018. 4%, or 1.8 million, UK adults had had regulated advice when surveyed in both 2017
and 2018, and 5%, or 2.7 million, UK adults had had regulated advice when surveyed in 2018 but not
in 2017.
Put another way, of the 9% of UK adults that had regulated financial advice in 2018, two-fifths (40%)
also had regulated financial advice in 2017 and three-fifths (60%) did not have regulated financial
advice in 2017.
Figure 4.1 Proportion and number of UK adults who have had regulated financial advice in both 2017 and 2018, 2017 only, and 2018 only
Base: All UK adults (2018: 826; 2017: 12,865)
Note: In total, 6% had regulated financial advice in 2017 (due to rounding this incorrectly appears to be 7% in this chart) and 9% in 2018.
4.2 Reasons given for moving in and out of Group 1
We conducted qualitative research with a small number of adults who have moved into or out of
Group 1 across the two surveys. This research identified two reasons for this movement:
• They have an ongoing advice relationship, but did not see their adviser in the last 12 months
when surveyed in 2018 or in 2017 – four out of nine qualitative respondents
39
• They had a one-off advice need – five out of nine qualitative respondents
Looking first at our qualitative respondents who said they have an ongoing advice relationship, all
four said they only see their adviser every couple of years and said that they had not received
regulated financial advice in the last 12 months because they had not physically met with their adviser
in that period.
Three were aware that they pay an ongoing charge, while one was not sure but thought he paid a fee
every time he physically met his adviser. All four had been with the same adviser for many years and
none felt that they needed to see their adviser annually. None questioned whether or not they were
receiving value for money and none had considered switching adviser or reviewing their relationship.
“I am a bit lazy looking after my money and do everything around
investments and pensions through my financial advisor. I would see her
every couple of years or have a chat on the phone. I had a chat with her
yesterday because I am buying this house at the moment, so I might need
to cash some of my investment bonds to raise the money… So just at the
moment I am talking to her quite frequently. It can go a year and she
will email me and say, how are you doing? Usually we might have a
conversation every year and once every three years I will go over and
have a meeting with her. No more than that, and that’s because I am
not flitting things about. I shall continue using her going forward, because
I like her. Simple as that really.” Male, 65-74, Mover into Group 1
“I’ve got a financial advisor, which I have probably had for a good 15
years… I went for a review about where we were at and it was a good
two, maybe two and a half years ago and in the last year we didn’t
review. I don’t go in for a review every year. I read up on whatever they
send me, but I don’t make any big calls.” Male, 55-64, Mover out of
Group 1
“I use my IFA mainly for tax policy, retirement and inheritance tax
planning. The last time I used them I think they moved one of my
pension funds. I can’t remember. I just took their advice. They can be
quite complicated areas. They are an IFA that I acquired many years ago
through a mortgage purchase - I think back in 2006. It’s an ongoing
relationship, but very light touch. So, I have had a few conversations but
not many. I am not particularly in a place where I have to make a lot of
financial decisions at the moment to be honest.” Male, 45-54, Mover
into Group 1
40
Five of our qualitative respondents said they had a one-off advice need and did not need regulated
financial advice every year, hence why they had received regulated advice in 2017 and not 2018 or
vice versa. All were related to pensions; three respondents wanted to review their retirement options,
and two wanted help with pension consolidation. This finding perhaps comes as no surprise, as
pensions are consistently an area that many people, even the most financially sophisticated, say they
have great difficulty with.
“When you look at pensions especially… it’s a minefield around what could
I move, what should I move? What would be the right advice to move?
And I don’t want to make those kinds of decisions on my own.”
Male, 45-54, Mover out of Group 1
Of the three who had a one-off regulated advice session to review their retirement options, two had
an initial consultation that was free of charge and did not take any further advice. Both felt
comfortable enough to make their own decisions after this initial consultation and one did not want
to incur a change for the advice.
“This was the initial free consultation. Further consultations, if I would
have wanted them, to look at specific products, I would have had to pay
for. The initial consultation was enough for me to feel happy to make a
decision on my pensions… I was very satisfied. He clarified a lot of the
questions I had, because trying to understand what various products
were and the different approaches… because you get bombarded in your
later years of life with various publications and if you make enquiries
around those you get bombarded with emails and all manner of products
and advice books and leaflets. So, it’s quite a jungle. And he clarified a
pretty terrifying situation pretty well for me.” Male, 55-64, Mover out
of Group 1
One respondent only sought advice as this was a regulatory requirement for him to be able to access
his DB pension money. If he had been able to do this on an execution-only basis he would have been
happy to do so, as he had already firmly made his mind up that is was the option for him before
seeking the advice.
“I was a member of a DB final salary scheme and because of pension
freedoms I got the option to transfer to a SIPP and then take the
drawdown. That’s what I ended up doing. For me it was the sensible
option given my circumstances. The advice around that was 2 years ago.
I had to seek advice, as it’s a condition if you transfer a DB pension, it
41
certainly was within our scheme. The ironic thing about it is that you
merely have to seek advice you don’t have to follow it. I didn’t pay for
the IFA that I saw. That was just the initial free session that he offered.
And I don’t think he really wanted me as a client. I haven’t taken any
advice since. It didn’t change my course of action, it merely reinforced
my understanding and beliefs of what I should be doing.” Male, 55-64,
Mover out of Group 1
Two respondents had taken regulated financial advice to consolidate several pensions into one. Once
this task had been completed, they did not feel that they had sufficiently complex financial
circumstances to warrant an ongoing advice relationship.
“I had money in existing pensions and it was a minefield around what
could I move, what should I move? What would be the right advice to
move? And I don’t want to make those kinds of decisions on my own.
The advisor was independent, but a friend of the MD of the company.
The payment was worked out in the way that we took it out of the
investment from the actual pensions that we transferred. It was a one-
off payment. At this moment I can’t see this turning into an ongoing
relationship. But I don’t have any traditional investments at the moment
other than pensions that I need to keep an eye on.” Male, 45-54,
Mover out of Group 1
Whilst only a small flavour of what is going on, these qualitative interviews nevertheless suggest that
an individual’s need for advice appears to be quite fluid and may vary considerably from one year to
the next.
42
5. Experiences of people who have not had regulated
financial advice in the last 12 months
In this chapter we look in more detail at the 46.5 million adults in the UK who are ‘not advised,’ that
is people who have not had regulated financial advice in the last 12 months in relation to investments,
saving into a pension or retirement planning.
We start by revisiting the size of the advised and not advised adult population, segmenting the not
advised population between Group 2 – those might have a need for regulated financial advice because
they have £10,000 or more in investible assets, and Groups 3/4 – those who are less likely to have a
Of the 46.5 million adults who have not had regulated financial advice in the last 12 months, at
least two-fifths (39%), or 18.2 million people, have £10,000 or more in savings and/ or investments
and, therefore, might have a need for advice (Group 2).
Around half (47%) of the not advised population think that they have had regulated financial
advice related to investments, saving into a pension or retirement planning in the past. However,
this is a self-reported figure and is likely to over-estimate the true number that have received
advice.
Exploring the reasons Group 2 gave for not taking financial advice in the last 12 months, half (50%)
felt they had no need to use an adviser during this time, while almost two-fifths (37%) felt able
to decide what to do with their money on their own. Affordability is an issue for one in seven
(15%), while one in eight (13%) stated that they did not take up advice due to a lack of trust in
financial advisers, and one in ten (10%) expressed some concerns about the quality of the advice
they might receive.
Not advised adults were asked whether they will use regulated financial advice in the future; one
in eight (13%) said they definitely would and a further two in five (40%) said that they might. That
said, many clarified their answer by saying that their financial circumstances would need to
change quite significantly before they realistically did so.
For those who do not think they will use regulated financial advice in the future, one in six said
this is due to a bad experience in the past or a lack of trust and one in ten are put off by the fees
charged for advice. The remainder said they have no need for advice or are confident in their
ability to make decisions on their own without advice.
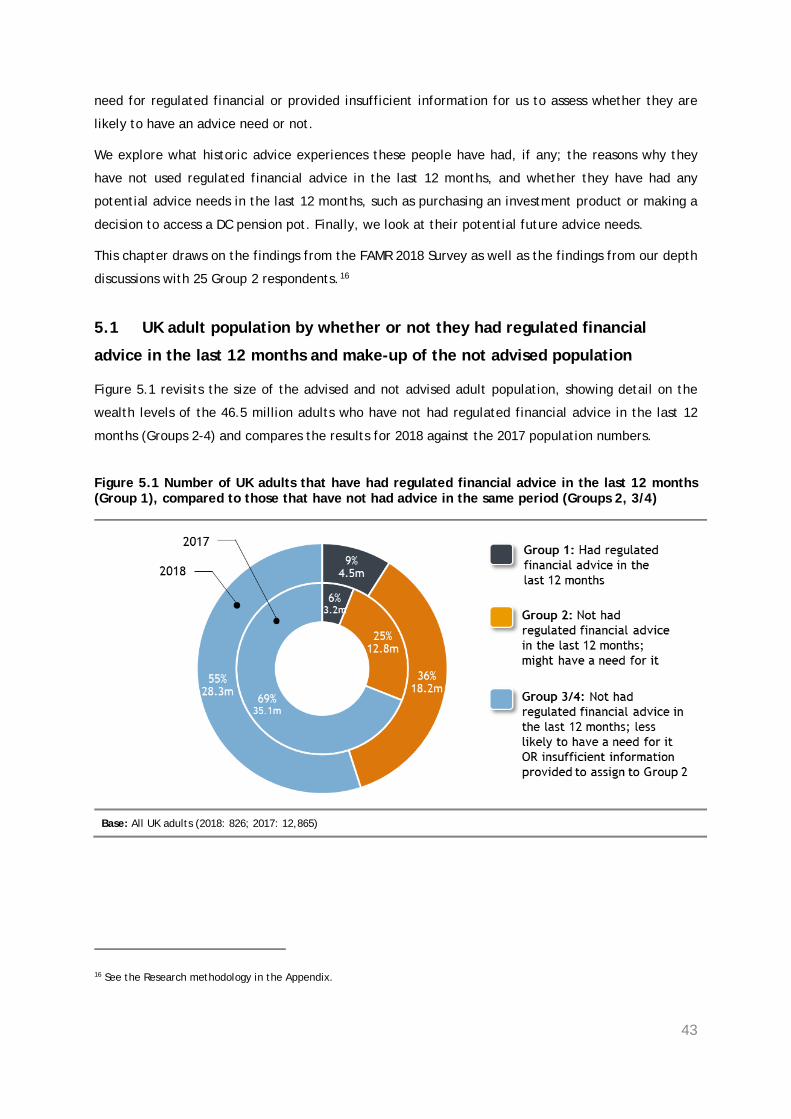
43
need for regulated financial or provided insufficient information for us to assess whether they are
likely to have an advice need or not.
We explore what historic advice experiences these people have had, if any; the reasons why they
have not used regulated financial advice in the last 12 months, and whether they have had any
potential advice needs in the last 12 months, such as purchasing an investment product or making a
decision to access a DC pension pot. Finally, we look at their potential future advice needs.
This chapter draws on the findings from the FAMR 2018 Survey as well as the findings from our depth
discussions with 25 Group 2 respondents.16
5.1 UK adult population by whether or not they had regulated financial
advice in the last 12 months and make-up of the not advised population
Figure 5.1 revisits the size of the advised and not advised adult population, showing detail on the
wealth levels of the 46.5 million adults who have not had regulated financial advice in the last 12
months (Groups 2-4) and compares the results for 2018 against the 2017 population numbers.
Figure 5.1 Number of UK adults that have had regulated financial advice in the last 12 months (Group 1), compared to those that have not had advice in the same period (Groups 2, 3/4)
Base: All UK adults (2018: 826; 2017: 12,865)
16 See the Research methodology in the Appendix.
44
Of the 46.5 million adults who have not had regulated financial advice in the last 12 months, at least
two-fifths (39%), or 18.2 million people, have £10,000 or more in savings and/ or investments and,
therefore, might have a need for advice (Group 2). This Group equates to 36% of the UK population
as a whole.
Three-fifths (61%) of the not advised population (28.3 million adults) have less than £10,000 in savings
and/ or investments and are, therefore, less likely to have a need for regulated financial advice
(Group 3) or provided insufficient information about their financial situation for us to assess whether
they are likely to have a need for advice or not (Group 4). These two Groups together equate to 55%
of the UK population.
As Figure 5.1 also shows, these figures are quite different from the figures we published in the FAMR
2017 baseline report, partly due to improvements we made in the questionnaire17 to encourage a
higher response rate to survey questions asking adults about their levels of savings and investments
and partly due to research and design effects in this year’s survey. For comparison, in 2017, 25% of
all UK adults were in Group 2 and 69% were in Groups 3 or 4.
5.1.1 Spotlight on Group 2: adults who have not had advice, but might have a need for it
Looking at the demographic profiles of people who have not had regulated financial advice in the last
12 months, but might have a need for advice because they have more than £10,000 in investible assets
(Group 2) we see that:
• More men than women are in Group 2 – almost three-fifths (56%) are men compared to
over two-fifths (44%) who are women
• The propensity to be in Group 2 increases with age – only one-quarter (27%) are aged
18-44, while three-fifths (59%) are aged 55 and over and around one-third (35%) are aged
65 and over (compared to 45%, 42% and 22% of the UK population as a whole, respectively)
• Retirees are more likely to be in Group 2 than people in work – retirees account for
over two-fifths (44%) of all adults in Group 2, yet just 23% of the adult population as a
whole18
17 See section 1.3.3
18 Total population figure base on results to the Financial Lives Survey 2017

45
Many of the Group 2 adults we spoke to in our qualitative research described themselves as
comfortably off.19
“I would say that financially we are doing very well. To be honest, I think
that the age in which we were born helped. We bought our first house in
1999, when the house prices were fairly cheap and we don’t have a
mortgage anymore. We have a good amount of savings and good
pensions, so we're doing very well.” Female, 35-44
“Financially, we're generally OK. Because of my age we had to take a
short-term mortgage, so our payments are quite high and we also over-
pay by £250 per month to try and reduce the term and that will take
about three years off it. In addition to paying our bills and everything
else, we don’t really have any debts. We have just had some major work
done on the garden and still managed to save a little bit each month.”
Male, 55-64
“I think we are comfortable. We lost our parents quite early on and we
always had the decision that we wouldn’t work as long as they did and
make sure that we would have some sort of retirement. So, for the last
20 or so years we have been saving to retire early.” Female, 55-64
“I would say that we probably reflect the classic baby boomer age group. I
am not saying that we're wealthy, but we're comfortably off. My wife
and I both have a State Pension and both also have an occupational
pension as well, and those are final salary schemes from the local
authority that came with lump sums.” Male, 65-74
“I worked over 50 years as a civil engineer in the construction industry
and I have had certain savings throughout my life, predominantly in
ISAs. Over the last 10 years I suddenly decided I hadn’t got much in my
pensions, so I put quite a lot into my pensions.”
Male, 65-74
19 Note that we set quotas for the qualitative research to ensure representation across different levels of investible assets,
ensuring a mix of those with £10,000-£29,999, £30,000-£49,999 and £50,000 or more. This means that the qualitative research
is not necessarily representative of the Group 2 as a whole. See the Research Methodology in the Appendix.
46
Savings products are far more widely held than investment products; almost all (96%) of Group 2
adults had some form of savings account, while around half (54%) have an investment product.20 The
most popular savings or investment products held by Group 2 adults are savings accounts with a bank
or building society or with NS&I (82%), any kind of ISA account (75%), direct holdings of shares/
equities (44%) and premium bonds (43%).
This preference for cash-based savings was mirrored in our qualitative research with Group 2 adults,
where most had the majority of their money in cash, despite current poor returns.
This is due to a combination of factors. First, some Group 2 adults we spoke to felt that that their
levels of savings are not sufficient to be able to take risks.
“I just don’t have a great deal of money to get involved in some of the
other things that are out there.” Male, 55-64
“I probably only have around £20,000 available, and that's not a lot of
money. It's decent, but very quickly gone, and I think that if you have
double or triple then you can maybe take a bit more of a hit.”
Male, 35-44
Jam-jarring for specific purposes or an emergency means some are not willing to risk any falls in the
value of their savings.
“I haven’t looked at moving into equity. It is my rainy-day money, so I
don’t want to take any risk at all.” Female, 55-64
“We want to be able to access our money, so that we can get to our
emergency fund if there is a real need.” Male, 35-44
20 Savings product includes savings accounts, NS&I bonds, credit union saving accounts or any type of ISA account. Investment
product Include shares and equities, investment funds or endowments, insurance bonds, corporate bonds or gilts/ government
bonds, structured deposits/ investments, and crowdfunding/ peer-to-peer lending. It does not include stocks and shares ISAs.
The 2017 and 2018 survey results are not comparable due to changes made to simplify the FAMR 2018 Survey. Specifically, the
2018 survey asked respondents to simply say whether or not they have an ISA account, whereas the 2017 Financial Lives Survey
asked a series of questions to check whether this was a cash ISA or stocks and shares ISA. Those with a stocks and shares ISA
are included in the 59% of Group 2 people who hold an investment product in 2017, but in the 96% of Group 2 people who hold
any savings account in 2018.
47
“Because we are interested in purchasing a house in the near future,
that's why we're keeping it ready in cash, that's available right now.”
Male, 35-44
Bad historic experiences with equity-based investments through endowments, equity ISAs or direct
investments have many Group 2 adults wary of investing this way again. They are typically the type
of people who will buy high and sell when the market starts to fall.
“I think I lost my taste for it back in 2008-09, when I saw the value
drop down so much and realised that that's the downside of stocks and
shares. It grows exponentially and then drops overnight.” Male, 35-44
“I have invested in those stocks and shares ISAs in the past and watched
them fall and took my money out quick.” Female, 35-44
Some of the older Group 2 adults we spoke to were more interested in capital protection than any
further investment risk, given they are moving into the stage in life where they are starting to
decumulate their savings.
“I think you get to a certain point in your life, where investment return
isn’t actually so important. What's important at the moment for me is to
have access to my money.” Female, 55-64
Many of the Group 2 adults in the qualitative research felt that making investment decisions lay
outside of their comfort zone. This held true even amongst those who have built up more than £50,000
of investible assets and who are perhaps in a better position to be able to take some investment risk.
“I think the type of decision that is outside of my comfort zone is
investing in areas that are going to give me a fairly good return,
balanced, let's say with a middling risk. And I think that I would need
financial advice to manage my level of knowledge there. Things like ISAs
and that sort of everyday thing I manage that quite confidently, it’s the
markets and investment side that I am probably less comfortable with.”
Male, 65-74
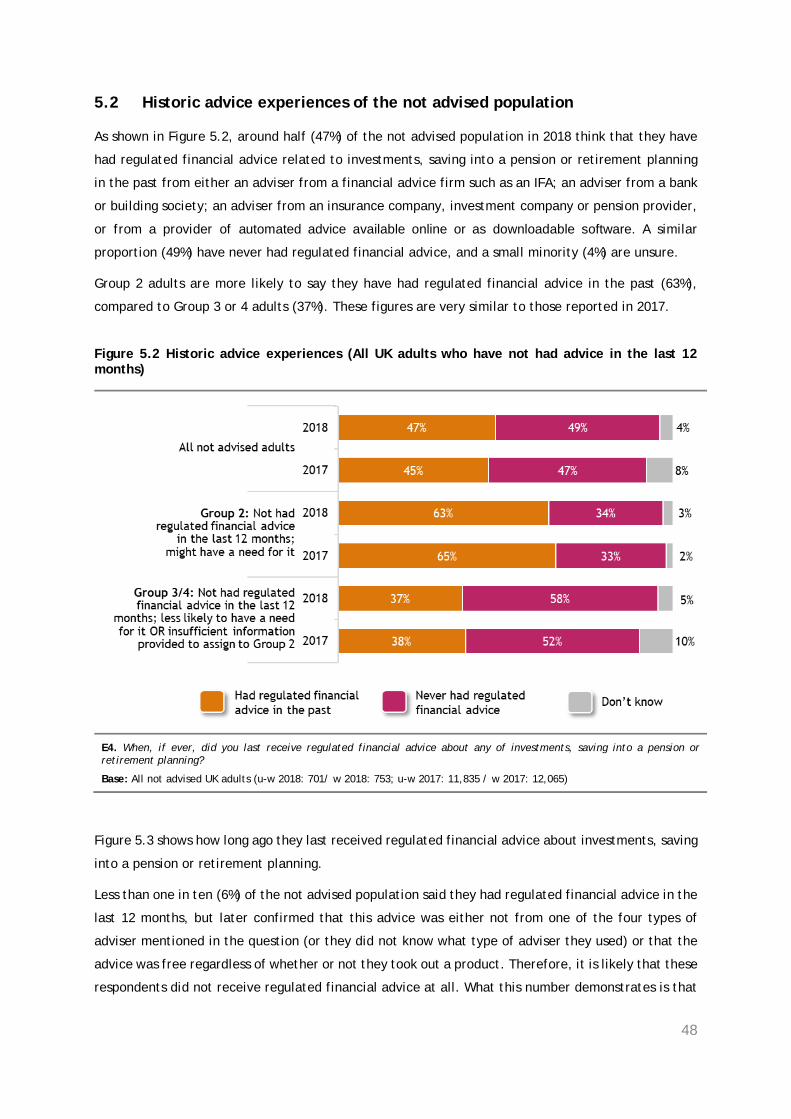
48
5.2 Historic advice experiences of the not advised population
As shown in Figure 5.2, around half (47%) of the not advised population in 2018 think that they have
had regulated financial advice related to investments, saving into a pension or retirement planning
in the past from either an adviser from a financial advice firm such as an IFA; an adviser from a bank
or building society; an adviser from an insurance company, investment company or pension provider,
or from a provider of automated advice available online or as downloadable software. A similar
proportion (49%) have never had regulated financial advice, and a small minority (4%) are unsure.
Group 2 adults are more likely to say they have had regulated financial advice in the past (63%),
compared to Group 3 or 4 adults (37%). These figures are very similar to those reported in 2017.
Figure 5.2 Historic advice experiences (All UK adults who have not had advice in the last 12 months)
E4. When, if ever, did you last receive regulated financial advice about any of investments, saving into a pension or retirement planning?
Base: All not advised UK adults (u-w 2018: 701/ w 2018: 753; u-w 2017: 11,835 / w 2017: 12,065)
Figure 5.3 shows how long ago they last received regulated financial advice about investments, saving
into a pension or retirement planning.
Less than one in ten (6%) of the not advised population said they had regulated financial advice in the
last 12 months, but later confirmed that this advice was either not from one of the four types of
adviser mentioned in the question (or they did not know what type of adviser they used) or that the
advice was free regardless of whether or not they took out a product. Therefore, it is likely that these
respondents did not receive regulated financial advice at all. What this number demonstrates is that
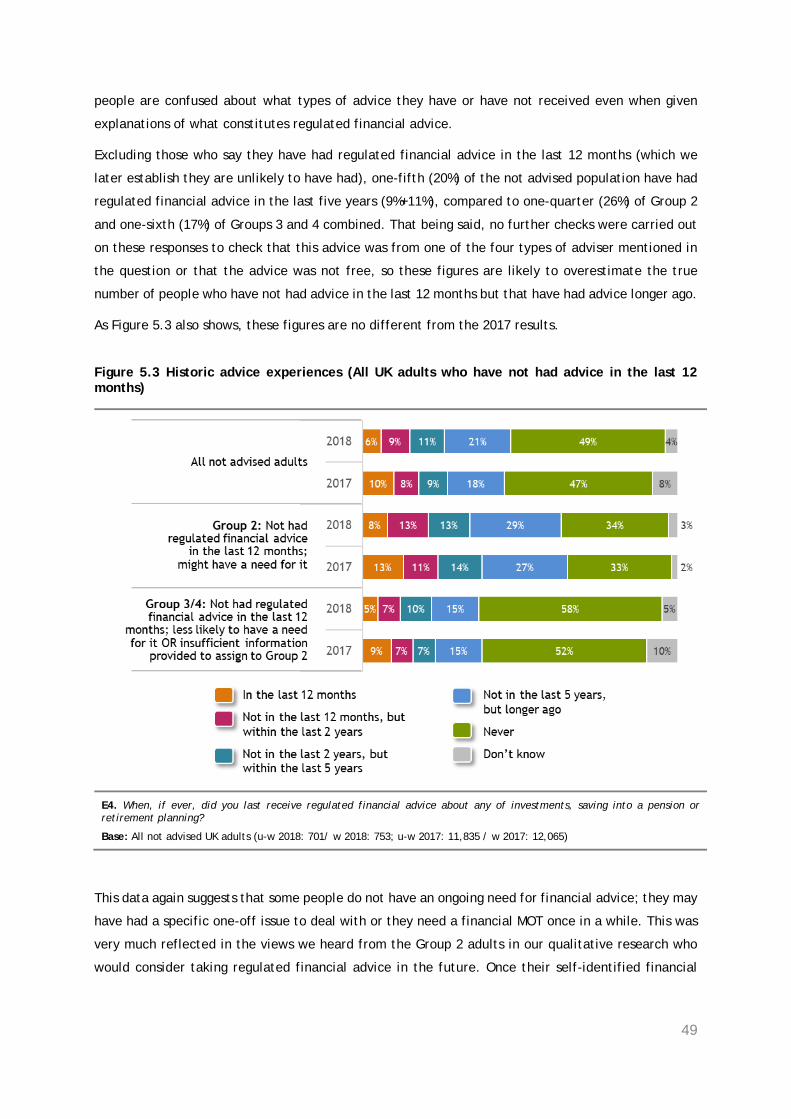
49
people are confused about what types of advice they have or have not received even when given
explanations of what constitutes regulated financial advice.
Excluding those who say they have had regulated financial advice in the last 12 months (which we
later establish they are unlikely to have had), one-fifth (20%) of the not advised population have had
regulated financial advice in the last five years (9%+11%), compared to one-quarter (26%) of Group 2
and one-sixth (17%) of Groups 3 and 4 combined. That being said, no further checks were carried out
on these responses to check that this advice was from one of the four types of adviser mentioned in
the question or that the advice was not free, so these figures are likely to overestimate the true
number of people who have not had advice in the last 12 months but that have had advice longer ago.
As Figure 5.3 also shows, these figures are no different from the 2017 results.
Figure 5.3 Historic advice experiences (All UK adults who have not had advice in the last 12 months)
E4. When, if ever, did you last receive regulated financial advice about any of investments, saving into a pension or retirement planning?
Base: All not advised UK adults (u-w 2018: 701/ w 2018: 753; u-w 2017: 11,835 / w 2017: 12,065)
This data again suggests that some people do not have an ongoing need for financial advice; they may
have had a specific one-off issue to deal with or they need a financial MOT once in a while. This was
very much reflected in the views we heard from the Group 2 adults in our qualitative research who
would consider taking regulated financial advice in the future. Once their self-identified financial
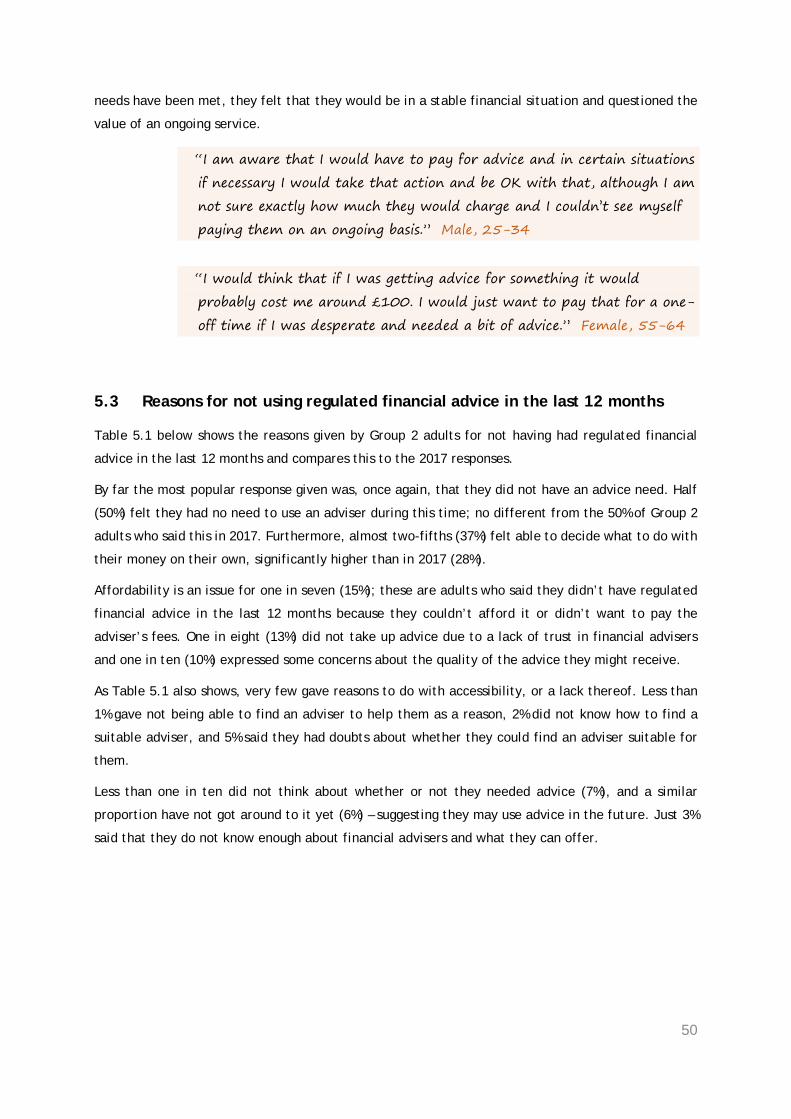
50
needs have been met, they felt that they would be in a stable financial situation and questioned the
value of an ongoing service.
“I am aware that I would have to pay for advice and in certain situations
if necessary I would take that action and be OK with that, although I am
not sure exactly how much they would charge and I couldn’t see myself
paying them on an ongoing basis.” Male, 25-34
“I would think that if I was getting advice for something it would
probably cost me around £100. I would just want to pay that for a one-
off time if I was desperate and needed a bit of advice.” Female, 55-64
5.3 Reasons for not using regulated financial advice in the last 12 months
Table 5.1 below shows the reasons given by Group 2 adults for not having had regulated financial
advice in the last 12 months and compares this to the 2017 responses.
By far the most popular response given was, once again, that they did not have an advice need. Half
(50%) felt they had no need to use an adviser during this time; no different from the 50% of Group 2
adults who said this in 2017. Furthermore, almost two-fifths (37%) felt able to decide what to do with
their money on their own, significantly higher than in 2017 (28%).
Affordability is an issue for one in seven (15%); these are adults who said they didn’t have regulated
financial advice in the last 12 months because they couldn’t afford it or didn’t want to pay the
adviser’s fees. One in eight (13%) did not take up advice due to a lack of trust in financial advisers
and one in ten (10%) expressed some concerns about the quality of the advice they might receive.
As Table 5.1 also shows, very few gave reasons to do with accessibility, or a lack thereof. Less than
1% gave not being able to find an adviser to help them as a reason, 2% did not know how to find a
suitable adviser, and 5% said they had doubts about whether they could find an adviser suitable for
them.
Less than one in ten did not think about whether or not they needed advice (7%), and a similar
proportion have not got around to it yet (6%) – suggesting they may use advice in the future. Just 3%
said that they do not know enough about financial advisers and what they can offer.
51
Table 5.1 Reasons for not taking regulated financial advice in the last 12 months (All UK adults that have not had advice, but might need it)
Group 2 All UK adults who have not had advice, but might have a need for it (column percentages)
2017 2018 I had no need for using an adviser over the last 12 months 50 50
I decided I could make any decisions on my own 28 37 I couldn't afford/ didn't want to pay the adviser's fees 9 15 I do not trust financial advisers 9 13 I have little confidence in the quality of financial advice 11 10 I took advice from someone else 7 9 I didn't think about it 13 7 Not got around to it yet 10 6 I am not confident about finding the right adviser for me 7 5 I didn't know enough about financial advisers and what they can offer
5 3
I didn't know how to find a suitable adviser 5 2 I couldn't find a suitable adviser 1 1 I couldn't find an adviser willing or able to offer me advice 1 0 There was no flexibility from advisers in how I would have to pay their fees
0 0
Other 1 1 Don’t know 3 2
ADV_E2. Which of the following reasons describe why you have not used a regulated financial adviser over the last 12 months?
Base: All UK adults who have not had advice, but might have a need for it (u-w 2018: 399/ w 2018: 295; u-w 2017: 1,214/ w 2017: 2,941)
Note: Multiple answers allowed.
We explored the reasons why Group 2 adults have not had advice further in the qualitative research.
Many of the Group 2 adults in our qualitative research were happy to hold the majority of their savings
in cash rather than equity-based investments. Most said that they had a good baseline of basic
knowledge of savings products built over a number of years and felt confident making decisions
themselves as these products are simple to understand, with relatively few variables to consider –
interest rates, any lock-in periods and penalties and whether the provider was a well-known brand.
Respondents said there were a plethora of sources available to research these types of things,
including financial pages in the press, online comparison sites and direct mailings from their existing
provider. Similarly, they did not feel that there was a need to pay for regulated financial advice for
something they felt very capable of doing on their own.
52
“I don’t know, I am not sure if we would need it [regulated financial
advice]. Perhaps if we were really interested in making an investment
and if it was something really important or crucial then we might
consider going to a professional and consider paying for advice.”
Male, 35-44
“Savings products are easy. I do look around before I sign up to anything
and I would say I am fairly confident in that regard. I am not very
confident with stocks and shares. I have had my hands burned a couple
of times with that. Happy to shop around and look at interest rates, not
so much for other investments.” Female, 65-74
Although they would be much less confident making decisions on equity-based in investments, this
was not the key reason given for not seeking regulated financial advice on these products.
Fundamentally, they were more concerned about the risk of losing money or access to their savings
and, as such, felt that these products were just not suitable for them.
“To me this would the same as 888casino. With my personality, if I did
put some money there, I wouldn’t leave it alone, I would be checking it
every 30 minutes to see if it has gone up or down. I just think it's the
wrong product for me.” Male, 55-64
“I feel very happy and knowledgeable about making decisions that you
have to make on a regular basis for your own finances, but a lot less
comfortable with investments, partly because of the risk involved because
it's not guaranteed and that's why I avoid them.” Female, 35-44
That said, a handful of the Group 2 adults in our qualitative research had large investment portfolios
that they felt confident managing themselves without regulated financial advice. They tended to be
‘hobbyist investors’ and used a very different information set from the rest of our respondents; for
example, specialist magazines such as Investors Chronicle, the FT and Telegraph, online share sites,
and peer networks. They typically held their portfolios on platforms such as Hargreaves Lansdown or
Fidelity and would often use the information on these sites to help them with their decision making.

53
“I am reasonably financially aware. Years ago, I did an MBA and have
done some finance work in the past. I feel reasonably comfortable making
decisions about how it should be invested, as I talk to people about that
sort of thing. I have a portfolio manager for the funds we have bought
with the money we put to one side from the sale of the business, so I talk
to him. I also read the FT and the Economist most weeks and I kind of
look at what’s going on with my portfolio and talk to a variety of
different sources. But not an IFA because, to be honest, I am a little
skeptical about financial advisers.” Male, 65-74
“I read the FT every day, as that's kind of my job, and keep an eye on
the news and have discussions with colleagues and friends and that will
maybe prompt a review on whether our investments should be in this
industry or this country, or not. We try and keep a consistent portfolio
and only change that when we need to, again, as it's just so time
consuming.” Female, 45-54
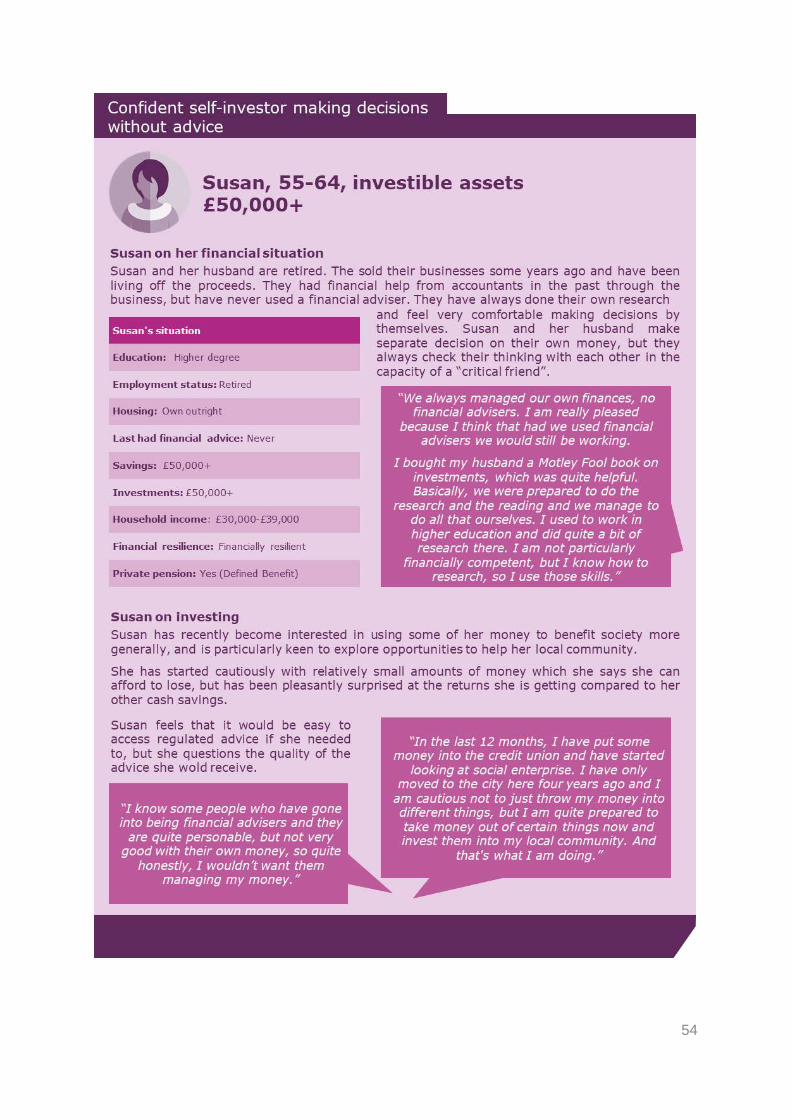
54
55
Our qualitative research also highlighted that bad historic experiences may be putting off some adults
from taking regulated financial advice, both now and in the future. A high proportion of the older
Group 2 adults we spoke to could recall having ‘advice’ in the past; usually many years ago when
advisers received commission. Based on these historic experiences, a number raised questions about
the quality of advice and the value for money.
“I had one and he nearly lost me a lot of money. That was a long, long
time ago. He invested about £7,000 and I nearly lost the lot, because it
was going down and down and no one told me about it. That has put me
off IFAs. I wasn’t aware of any changes to their qualifications or
commission, but would I trust one of them fully; no!” Female, 55-64
“I have had two experiences with financial advisers and both of them
knew less than I did. We haven’t had the best of experiences and will rely
on ourselves.” Female, 45-54
“I went to see someone about the endowment policies and it was when
the scandal was coming out about them being mis-sold. It put me off a
bit.” Female, 45-54
“Our solicitors had an in-house financial adviser and like fools we went
with him and everything, bar one thing, lost money. But he was still
getting his commission. So, we had our fingers badly burned.”
Female, 65-74
“We have paid before for financial advice and we have tried three
different people and we have been extremely disappointed with the
advice we have received. We felt that we were completely overcharged
and ripped off, which is why I have put so much time and effort into
educating myself this time, so that I could make decisions without having
to pay someone.” Female, 55-64
A few Group 2 adults said they have chosen not to use regulated financial advice as they did not want
to incur any additional charges.
“A lesson I learned when I was very young was that the value of the
advice you've been given has got to be worth more than the monetary
gain that you make, and I find it very hard to find people who will do
that.” Male, 55-64
56
“Believe it or not I work for an IFA, I am his PA… I want a more
transactional model. It would just eat into my pot paying a 1% fee to
someone for advice that I don’t want or need at the moment. Whereas I
appreciate that some people would appreciate this sort of relationship, I
would just see it as throwing money away really and I am a bit too
cautious for that.” Female, 45-54
5.4 Actions taken without advice over the last 12 months
We asked adults who have not had regulated financial advice in the last 12 months to say what actions
they have taken in this period with regards to their finances.
As Figure 5.4 shows, over half (55%) undertook no actions whatsoever: 42% for Group 2 and 63% for
Group 3/4. With the exception of paying down their mortgage, the most frequent financial actions
taken were purchasing an investment with a lump sum (9%), taking out a cash ISA (8%), and starting
or increasing monthly payments into an investment (8%).
Relatively few adults who had not been advised undertook actions related to a pension; 7% started or
increased monthly payments in to a private pension, 5% said they made changes to the funds in which
their pension is invested, and 1% took out a new personal pension.
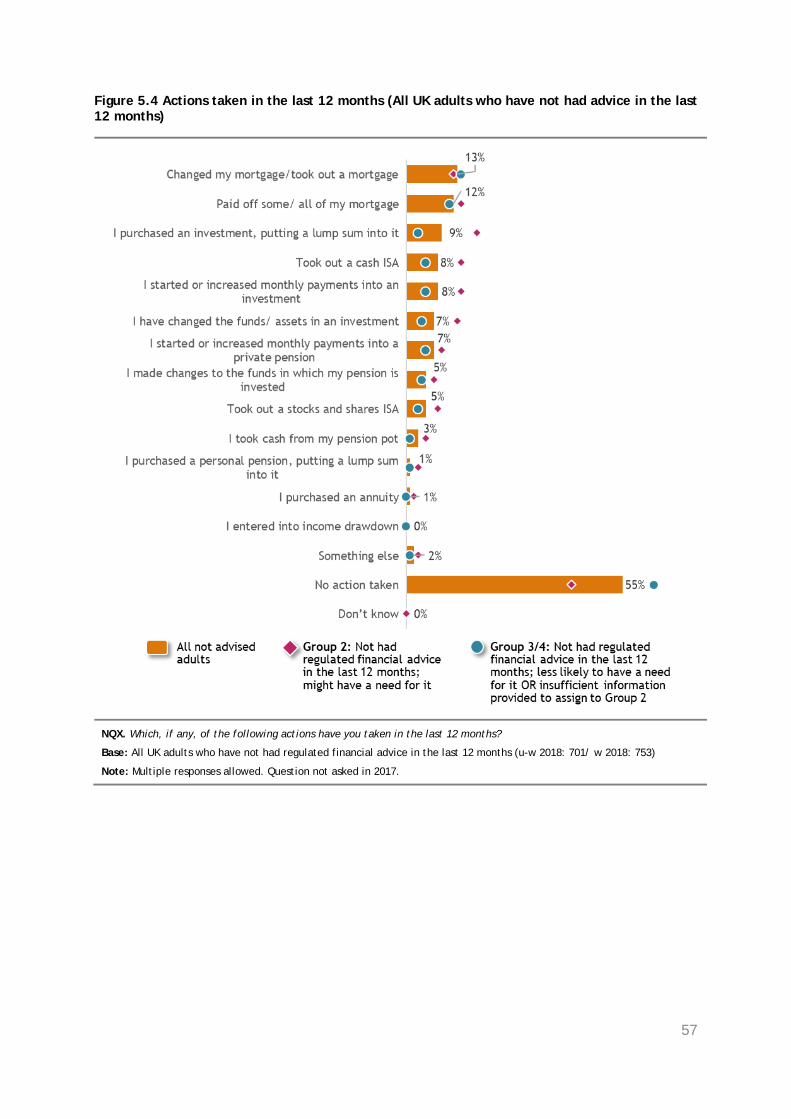
57
Figure 5.4 Actions taken in the last 12 months (All UK adults who have not had advice in the last 12 months)
NQX. Which, if any, of the following actions have you taken in the last 12 months?
Base: All UK adults who have not had regulated financial advice in the last 12 months (u-w 2018: 701/ w 2018: 753)
Note: Multiple responses allowed. Question not asked in 2017.
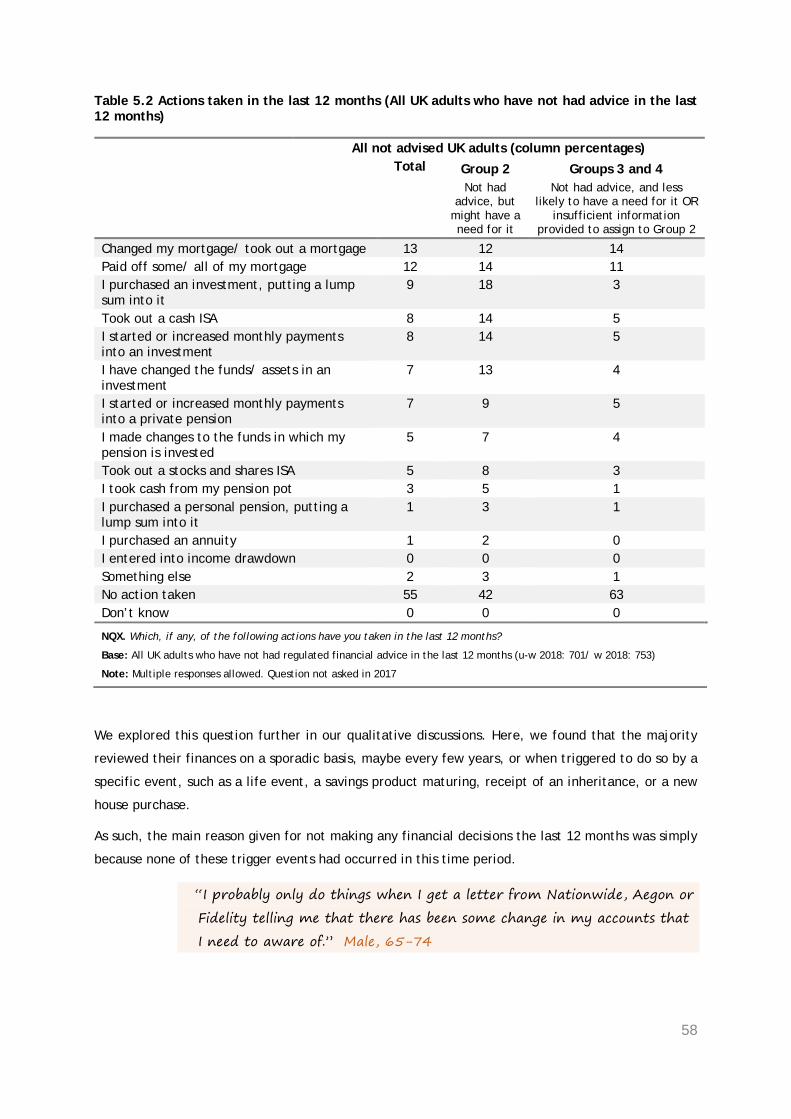
58
Table 5.2 Actions taken in the last 12 months (All UK adults who have not had advice in the last 12 months)
All not advised UK adults (column percentages) Total Group 2
Not had advice, but
might have a need for it
Groups 3 and 4 Not had advice, and less
likely to have a need for it OR insufficient information
provided to assign to Group 2
Changed my mortgage/ took out a mortgage 13 12 14 Paid off some/ all of my mortgage 12 14 11 I purchased an investment, putting a lump sum into it
9 18 3
Took out a cash ISA 8 14 5 I started or increased monthly payments into an investment
8 14 5
I have changed the funds/ assets in an investment
7 13 4
I started or increased monthly payments into a private pension
7 9 5
I made changes to the funds in which my pension is invested
5 7 4
Took out a stocks and shares ISA 5 8 3 I took cash from my pension pot 3 5 1 I purchased a personal pension, putting a lump sum into it
1 3 1
I purchased an annuity 1 2 0 I entered into income drawdown 0 0 0 Something else 2 3 1 No action taken 55 42 63 Don’t know 0 0 0
NQX. Which, if any, of the following actions have you taken in the last 12 months?
Base: All UK adults who have not had regulated financial advice in the last 12 months (u-w 2018: 701/ w 2018: 753)
Note: Multiple responses allowed. Question not asked in 2017
We explored this question further in our qualitative discussions. Here, we found that the majority
reviewed their finances on a sporadic basis, maybe every few years, or when triggered to do so by a
specific event, such as a life event, a savings product maturing, receipt of an inheritance, or a new
house purchase.
As such, the main reason given for not making any financial decisions the last 12 months was simply
because none of these trigger events had occurred in this time period.
“I probably only do things when I get a letter from Nationwide, Aegon or
Fidelity telling me that there has been some change in my accounts that
I need to aware of.” Male, 65-74

59
“It will be when something is about to come to an end, you know, if I
have an account with a fixed rate that is coming to an end, then I will
look around and see what's out there. That could be on a yearly basis or
every three years or something like that.” Female, 35-44
Those who had made a financial decision in the last 12 months often shared the same drivers and
motivations as those that did not – it just so happened that a trigger event had occurred for them in
the time period specified.
“It matured and I had to do something with it and I was just looking for
a half decent savings rate, but there aren’t any decent savings rates out
there at the moment, so I just switched it around from one account into
another. I have quite a few accounts in my or my husband’s name,
normally, I just do them for 2 years and then when it matures I take the
interest out and start again.” Female, 65-74
Only the most financially sophisticated not advised respondents reviewed their own finances on a
regular basis, typically timing their reviews to maximise their annual tax allowances. This group were
likely to switch funds depending on the current investment and economic climate.
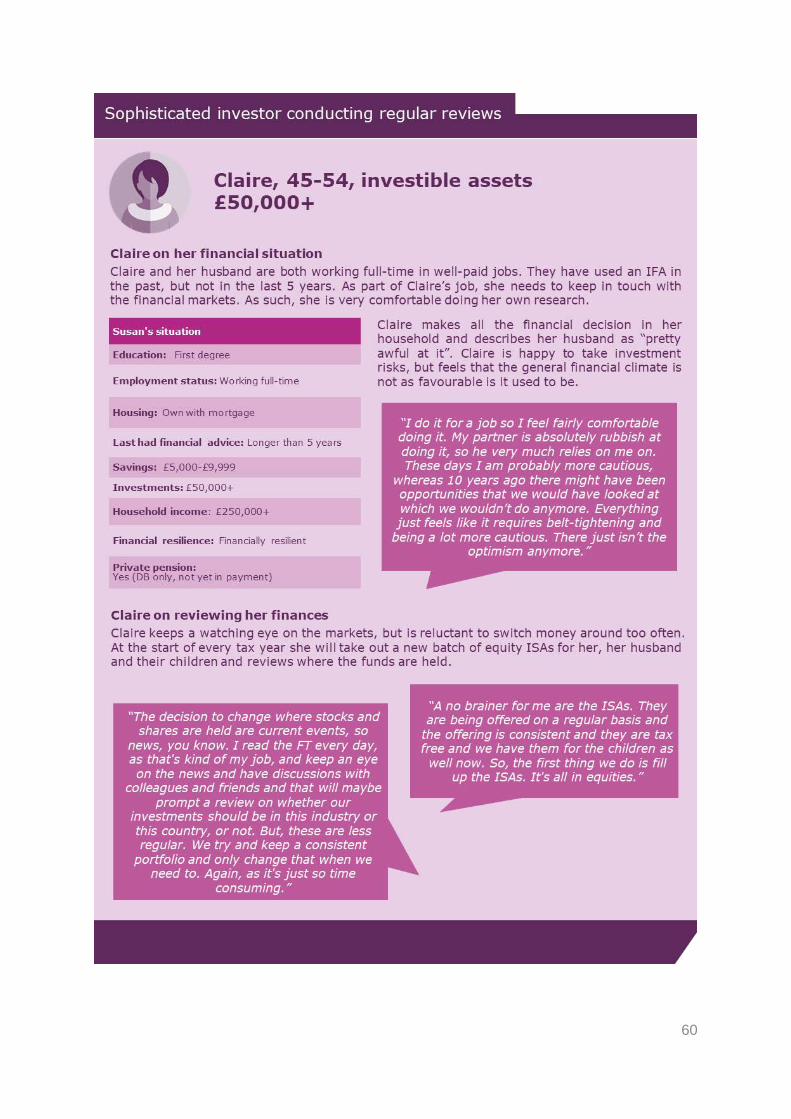
60
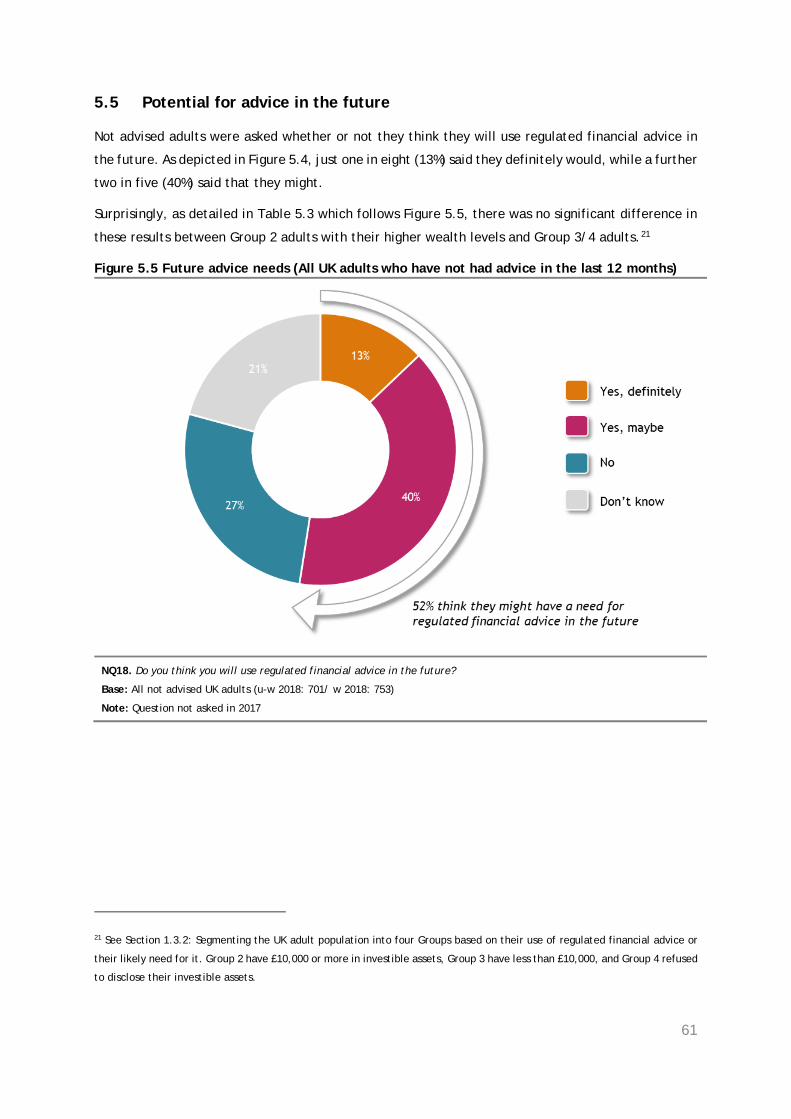
61
5.5 Potential for advice in the future
Not advised adults were asked whether or not they think they will use regulated financial advice in
the future. As depicted in Figure 5.4, just one in eight (13%) said they definitely would, while a further
two in five (40%) said that they might.
Surprisingly, as detailed in Table 5.3 which follows Figure 5.5, there was no significant difference in
these results between Group 2 adults with their higher wealth levels and Group 3/4 adults.21
Figure 5.5 Future advice needs (All UK adults who have not had advice in the last 12 months)
NQ18. Do you think you will use regulated financial advice in the future?
Base: All not advised UK adults (u-w 2018: 701/ w 2018: 753)
Note: Question not asked in 2017
21 See Section 1.3.2: Segmenting the UK adult population into four Groups based on their use of regulated financial advice or
their likely need for it. Group 2 have £10,000 or more in investible assets, Group 3 have less than £10,000, and Group 4 refused
to disclose their investible assets.
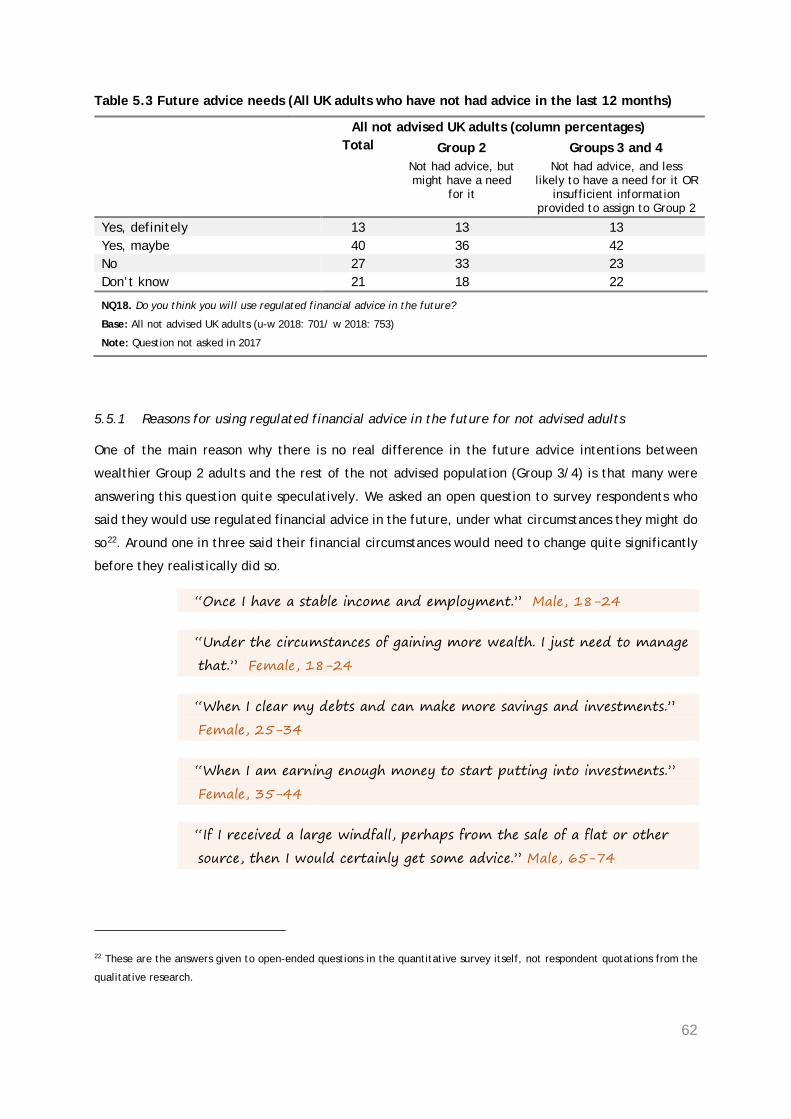
62
Table 5.3 Future advice needs (All UK adults who have not had advice in the last 12 months)
All not advised UK adults (column percentages) Total Group 2
Not had advice, but might have a need
for it
Groups 3 and 4 Not had advice, and less
likely to have a need for it OR insufficient information
provided to assign to Group 2
Yes, definitely 13 13 13 Yes, maybe 40 36 42 No 27 33 23 Don’t know 21 18 22
NQ18. Do you think you will use regulated financial advice in the future?
Base: All not advised UK adults (u-w 2018: 701/ w 2018: 753)
Note: Question not asked in 2017
5.5.1 Reasons for using regulated financial advice in the future for not advised adults
One of the main reason why there is no real difference in the future advice intentions between
wealthier Group 2 adults and the rest of the not advised population (Group 3/4) is that many were
answering this question quite speculatively. We asked an open question to survey respondents who
said they would use regulated financial advice in the future, under what circumstances they might do
so22. Around one in three said their financial circumstances would need to change quite significantly
before they realistically did so.
“Once I have a stable income and employment.” Male, 18-24
“Under the circumstances of gaining more wealth. I just need to manage
that.” Female, 18-24
“When I clear my debts and can make more savings and investments.”
Female, 25-34
“When I am earning enough money to start putting into investments.”
Female, 35-44
“If I received a large windfall, perhaps from the sale of a flat or other
source, then I would certainly get some advice.” Male, 65-74
22 These are the answers given to open-ended questions in the quantitative survey itself, not respondent quotations from the
qualitative research.
63
Some of the younger Group 2 adults we spoke to in the qualitative research were also open to advice
in the future but would want to do some initial research themselves, saying that any future advice
interaction will have to meet a relatively high bar to be seen to be offering value for money, over
and above what they can do themselves.
“I would be interested in that and when it comes to that sort of level of
advice I wouldn’t expect that to be free. For the short term there are so
many resources online that you can google and read that are probably,
in my opinion, as good as an IFA. I think the value would be in the
relationship for the long-term investments that they would have a lot
more experience with – I may be wrong about that, but that's my
opinion of their services.” Male, 25-34
A few not advised adults gave answers suggesting they do not fully understand what regulated
financial advice entails.
“If I need to borrow some money.” Female, 45-54
“[I] will look out for them now I am aware of them. Never had heard of
any of those before today.” Male, 25-34
Around one in ten who responded to open survey questions said they would want advice related to
mortgages or lifetime mortgages/ equity release.
“If I changed mortgage provider or if I bought another property.”
Male, 35-44
“Equity release.” Female, 65-74
“If I change my mortgage.” Male 45-54
For the remainder, there was a broadly even split of those saying they would use regulated financial
advice related to pension, investments or retirement planning. Many said they would consider doing
so only if they needed to make a significant change to their pension or investments or a big decision
tied in to a future milestone, such as retirement.
“When I get closer to retirement age and I try to work out what to do
with my pension.” Female, 35-44
64
“When there is a big decision to be made I will take regulated advice in
regards to my pension. I have to decide which is the best in terms of tax
advantage etc, whether to take a lump sum or not or whether to
crystalize the funds or not. There are lots of decisions to make when I
come to that point so at that point I will find a financial adviser.”
Male, 65-74
“If I need to make a big change to a pension, when I've moved out the
civil service or when making other major investments.” Male, 35-44
“Consolidating dormant pension plans from previous employments,
annuity vs drawdown pension, early retirement options, 2nd property.”
Male, 45-54
“If I feel I need to make significant changes in my investments.”
Male, 45-54
This anxiety around pension planning also emerged in the qualitative research with Group 2 adults.
Interestingly, for even the most financially confident and savvy adults in the research pension
decisions were consistently felt to be outside of their comfort zone. Some were concerned about their
ability to make ongoing investment decisions, others focused on the changing rules and how they
would access their money under the new pension freedoms.
“I would say I am confident and savvy consumer with the exception of
pensions! I think I just don’t get them. I am in the final salary which I
understand, but when you are looking at doing AVCs to top up and you
have to decide where you are going to put the money in what kind of
fund, it is all that side I don’t really understand, the investing side of
things.” Female, 45-54
“I feel less knowledgeable now on pension matters because the
Government keeps on changing the rules and that is so frustrating and
difficult to keep up. The other areas I am fairly confident with, it’s just
that the pensions stuff I feel is poorly communicated. I would like to
retire within the next seven to eight years and we're very fortunate that
our company is offering some preparatory courses and things and I have
been attending those and I guess it's just raises my awareness, because
pensions are more on my radar.” Female 45-54
65
However, despite their lack of confidence in their ability to make pension decisions, Group 2 adults
who were still very much in the accumulation phase had not considered whether they needed any
regulated financial advice. For them, the pension was simply ticking over year after year with very
little active thought. They were typically invested a default fund and generally paid little attention
to whether they would have enough saved for retirement. If anything, they felt that better
communications from their providers, rather than regulated financial advice, would be the key thing
to help them understand their pensions a bit better.
Beyond pension planning a few, mainly older, adults talked about wanting advice in the future for
inheritance issues and tax planning.
“Possibly IHT planning or maximising income from investments.”
Female, 65-74
“I shall need advice on succession planning, but I have not got very far
with it as I am not sure what my immediate family want. I need to
know the end objective before I can plan the route. It is a chicken and
egg situation at the present.” Male, 65-74
5.5.2 Reasons for not using regulated financial advice in the future for not advised adults
Not advised adults who said they will use not use regulated finance advice in the future, were asked
why this as the case. The reasons for not using advice in the future were very similar to those given
for not using regulated financial advice in the last 12 months.
Around half of Group 3/4 adults who felt this way and around two in five Group 2 adults who felt this
way said in the open survey questions they had no need for advice, either because they do not have
enough money to invest, or because they are comfortable with their finances and see no benefit in
reviewing them.
“I just don't think I have enough cash to invest too much, only small
amounts.” Male, 25-34
“I have reached an age where most of my future planning is in place.”
Male, 65-74
“We have no need to as we keep our finances simple - i.e. in the bank.”
Female, 65-74
66
“The only possible scenario in which I might seek advice is when I take
my private pensions at age 60 or thereabouts but I will certainly not be
seeking advice about where to invest in each financial year between now
and then.” Male, 45-54
Around three in ten Group 2 adults and one in ten Group 3/4 adults said the reason why they will not
use regulated financial advice in the future is because they are confident in their own abilities to
make financial decisions, but again they are referring to making decisions on where to put their money
in cash-based savings.
“I am capable of making decisions by doing my own research.”
Female, 45-54
“Happy to find information myself.” Female, 45-54
“I am confident in my ability to make well-informed choices, and as I
am risk-averse, I stick to mainstream financial institutions, and keep my
affairs simple.” Male, 65-74
Around one in six not advised adults said in the open survey question that the reason why they will
not use regulated financial advice in the future is due to a bad experience in the past, or a general
sense that financial advisers cannot be trusted, and around one in ten said they are put off by the
fees charged for advice. Often these respondents were not aware of the changes that have taken
place in the advice market, and made no distinction between independent and tied advice. As a side
note, most of the adults voicing these opinions were male and aged 55 or over.
“I did not want to pay fees. It is not financially viable to do so.”
Male, 65-74
“I consider it expensive as they appear to be on commission and unlikely
to understand my personal situation, rather to give generic advice based
on my superficial circumstances. I am more likely to get advice from
informal contacts, family and friends, plus chat on the internet.”
Female, 35-44
“The advice I've had in the past was basic, so I self-taught myself and I
now make my own decisions, I have read about how untrustworthy they
are and I now do not trust them.” Male, 55-64

67
“The system is not fit for purpose. IFAs do not add any value. IFAs should
be paid upfront by the client, and not allowed to be paid commission by
product providers. clients should be able to sue their advisors if they lose
money (which would reduce the number of useless IFAs!).” Male, 55-64
“I don't trust their "independence" and have attended such meetings with
my parents helping them deal with their affairs and was unimpressed
with advisors.” Male, 45-54
“Anyone giving regulated financial advice will be after a piece of my
money and are probably not impartial.” Male, 65-74
“Always been mis- or badly advised. My wife and I find we can our own
investing better ourselves.” Male, 65-74
68
6. Awareness and use of automated online pension or
investment services
In this chapter we look specifically at an emerging channel for advice. The market for automated
online advice is still in its infancy, but the number of players active in the market and services
available to consumers has increased dramatically in the last few years, and this innovation is
expected to continue apace.
We are aware that automated online advice is a difficult area to define to consumers, given the
similarities with other online services. To overcome this limitation, results in this chapter have been
derived using responses to questions which specifically ask everyone about their awareness and use
of a number of named automated advice providers currently active in the market.23
Nonetheless, there are still some issues with this approach, and all numbers in this chapter should be
treated with caution.
23 Please note that this is different from the approach taken to establishing the incidence of the use of regulated financial advice in the last 12 months, where we use a specific definition of automated online advice, namely: Regulated financial advice available online or as downloadable software. It is similar to advice from a traditional financial adviser, because it is personalised: consumers input financial information and objectives, and this information is used to generate suitable investment and/ or retirement planning recommendations. It does not include simple online tools and calculators. We also do not establish if use of the service involved payment, whereas, as we explain in Section 1.3.1, we have assumed that regulated financial advice was advice that was paid for. Consequently, the 3% of adults using a provider of automated online investment and pension services in the last 12 months includes people in Groups 2, 3, and 4, as well as Group 1.
Three in eight (38%) UK adults have heard of at least one of the automated online investment and
pension services included in the FAMR 2018 Survey. This is a significant increase from the one in
ten (10%) who had heard of at least one automated service in the Financial Lives Survey 2017. It
should be noted, however, that some of this increase may be due to the re-contact nature of the
Survey (i.e. respondents may now be aware because we named these providers in the Financial
Lives Survey 2017.
3% of UK adults say they have used any provider of automated online investment and pension
services in the last 12 months. This is not a significant difference to the 1% reported in 2017.
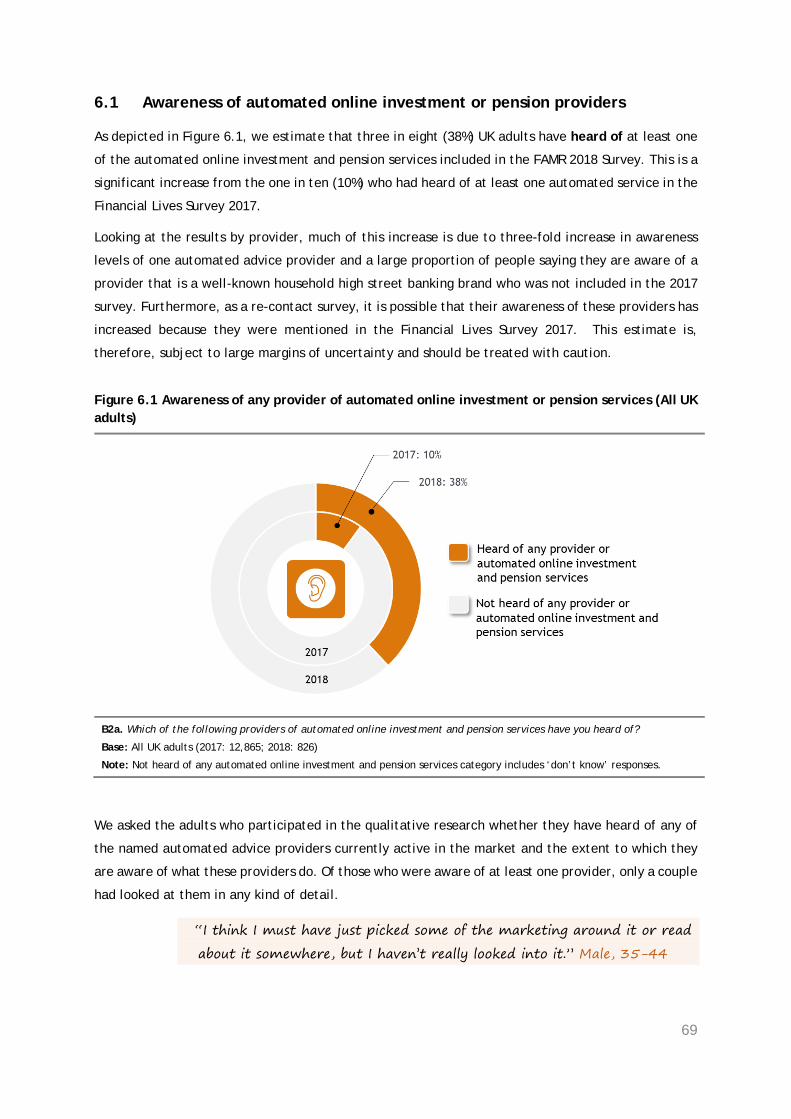
69
6.1 Awareness of automated online investment or pension providers
As depicted in Figure 6.1, we estimate that three in eight (38%) UK adults have heard of at least one
of the automated online investment and pension services included in the FAMR 2018 Survey. This is a
significant increase from the one in ten (10%) who had heard of at least one automated service in the
Financial Lives Survey 2017.
Looking at the results by provider, much of this increase is due to three-fold increase in awareness
levels of one automated advice provider and a large proportion of people saying they are aware of a
provider that is a well-known household high street banking brand who was not included in the 2017
survey. Furthermore, as a re-contact survey, it is possible that their awareness of these providers has
increased because they were mentioned in the Financial Lives Survey 2017. This estimate is,
therefore, subject to large margins of uncertainty and should be treated with caution.
Figure 6.1 Awareness of any provider of automated online investment or pension services (All UK adults)
B2a. Which of the following providers of automated online investment and pension services have you heard of?
Base: All UK adults (2017: 12,865; 2018: 826)
Note: Not heard of any automated online investment and pension services category includes ‘don’t know’ responses.
We asked the adults who participated in the qualitative research whether they have heard of any of
the named automated advice providers currently active in the market and the extent to which they
are aware of what these providers do. Of those who were aware of at least one provider, only a couple
had looked at them in any kind of detail.
“I think I must have just picked some of the marketing around it or read
about it somewhere, but I haven’t really looked into it.” Male, 35-44
70
“This is the so-called “robo advice”, right? I am aware of that, yes. I
think I know of that through emails that I get sent or articles that I may
have read and maybe through comparison sites that I have looked at as
well. There are proper comparison sites out there now that properly
compare these platforms. I haven’t looked into them in any depth.”
Male, 55-64
“[Automated online advice provider], I have had conversations about
them, but to be honest I don’t know a lot about it. I haven’t looked into
it, but just the online part is already attractive… it just depends on what
information is available on there and how I can track it.” Female, 45-54
“I don’t know how I came across [automated online advice provider], but
I have heard of it. I haven’t a clue what they do. I think I heard it on the
radio.” Male, 65-74
“I have heard of [automated online advice provider] but I can’t say I
know too much about them. They seem almost like pensions really, where
you just choose a fund and a risk and things and then go with it and it's
all done for you. I haven’t looked too closely at it.” Male, 25-34
“Yes, funnily enough someone mentioned [automated online advice
provider] to me and I went online to look at it… I gave it a glancing look
and wasn’t that interested and thought I'd stick with what I’ve got.”
Male, 65-74
6.2 Use of automated online investment or pension providers in the last 12
months
People were asked to say whether they had used an automated online investment or pension service
from any of the providers listed. Figure 6.2 suggests that 3% of UK adults have used any provider of
automated online investment and pension services in the last 12 months, similar to the 1% reported
in 2017. These figures may be an overestimation and should be treated with caution given that some
of these ‘automated advice users’ said earlier that they either have not received regulated financial
advice related to investments, saving into a pension or retirement planning in the last 12 months or
said that they did not pay for the advice they received.
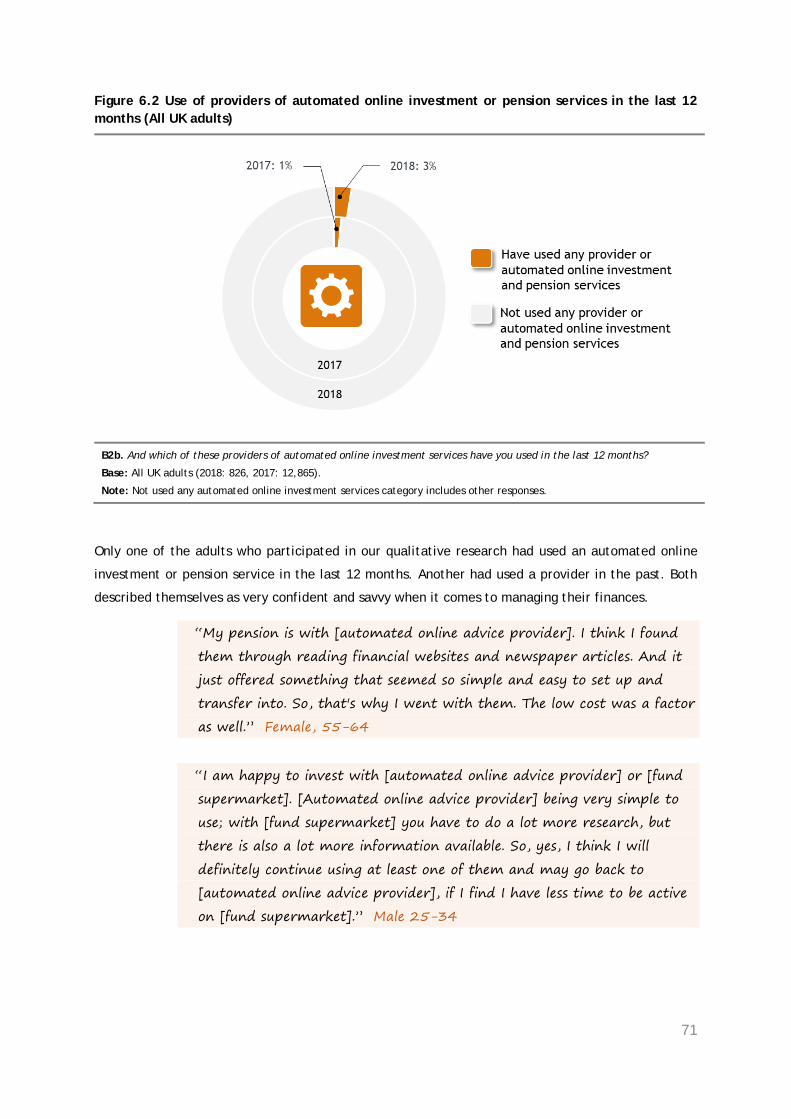
71
Figure 6.2 Use of providers of automated online investment or pension services in the last 12 months (All UK adults)
B2b. And which of these providers of automated online investment services have you used in the last 12 months?
Base: All UK adults (2018: 826, 2017: 12,865).
Note: Not used any automated online investment services category includes other responses.
Only one of the adults who participated in our qualitative research had used an automated online
investment or pension service in the last 12 months. Another had used a provider in the past. Both
described themselves as very confident and savvy when it comes to managing their finances.
“My pension is with [automated online advice provider]. I think I found
them through reading financial websites and newspaper articles. And it
just offered something that seemed so simple and easy to set up and
transfer into. So, that's why I went with them. The low cost was a factor
as well.” Female, 55-64
“I am happy to invest with [automated online advice provider] or [fund
supermarket]. [Automated online advice provider] being very simple to
use; with [fund supermarket] you have to do a lot more research, but
there is also a lot more information available. So, yes, I think I will
definitely continue using at least one of them and may go back to
[automated online advice provider], if I find I have less time to be active
on [fund supermarket].” Male 25-34

72
For those adults in our qualitative research who had heard of automated online investment or pension
service but not used one, a variety of reasons were given for this, including a reluctance to make
equity-based investments in general, a lack of comfort conducting financial transactions online, a
reticence to invest with anyone who is not a recognised established brand, and, for those who were
already advised, satisfaction with their existing adviser.
“I wouldn’t like to do investing online. Mainly because I wouldn’t know
who the provider was. It wouldn’t matter to me what it said on there.
Even paying off the mortgage online was hard enough from [high street
bank]. We still didn’t want to press the button on that £70,000 and we
were very scared about that.” Female, 55-64
“Honestly, I haven’t looked at that, even if they offered a better deal,
the peace of mind you get when you're going through the bank. I know
that they wouldn’t be quite as competitive, but there is a level of
confidence that you have in your own bank, so I wouldn’t really go with
that. Because there is that fear in the back of your head that, for
example, [automated online advice provider] could be here today and in
three years’ time you hear it's gone into administration.” Male 25-34
“It’s something we have come across when we were looking through
things. To be honest with you, I wouldn’t say that I fully understand how
they actually work. So, it’s not something I would necessarily trust,
because I don’t fully understand how it works.” Male, 35-44
“I am aware of it, but I haven’t used it… It’s just the time element and at
a certain point I would be willing to save some of my time and pay for
someone else to be aware of these things… It’s probably a generational
thing in a way, but you know, I am comfortable to use online tools,
that’s not the issue, I do all my banking online, I run my life basically
online like a lot of people do. More than anything I think it’s about sitting
in front of my screen at the end of the day and doing yet another thing
that is screen based, I would probably rather pass that off to someone
else. Also, because that gives you the opportunity to discuss ideas, more
than anything really. I can afford to pay for advice from an IFA and it’s
more a question of whether I want save time and pay for advice, and
pay for expertise as well, let’s be honest.” Male, 45-54

73
A couple of more financially confident adults in our qualitative research who are comfortable making
equity-based investments and transacting online said that they have not considered automated online
investment advice because they prefer active management.
“I have certainly heard of services like [automated online advice provider]
and am aware that they exist and that they cost a lot less compared to
a portfolio manager. I’m paying mine, I think, 0.8% and I know you can
do it much more cheaply elsewhere, but at this stage I would rather have
the portfolio manager do it. We were happy to follow him, because he
provided a good service and good returns. If that should ever change
then we would think about other things, but I would still hope that an
expert who is concentrating on my money rather than someone dealing
with a wide range of clients would provide the best kind of service… so
far we have beaten those kinds of tracker funds with him, so for now our
decision stands.” Male, 55-64
74
7. Information and guidance
In this chapter we examine what types of information or guidance adults have used in the last 12
months related to investments, saving into a pension or retirement planning, the reasons for using (or
not using) information or guidance and their satisfaction with the sources of information or guidance
used. In doing so, we draw on the findings from the FAMR 2018 Survey, the Financial Lives Survey
2017 as well as our qualitative discussions with adults.
7.1 Sources of information or guidance used
As shown in Figure 7.1, half (50%) of all UK adults used at least one type of information or guidance
related to investments, saving into a pension or retirement planning in the last 12 months, and this
number increases to two-thirds (66%) for those that received regulated financial advice in the last 12
months as well.
The most used types of information or guidance in the last 12 months were private sector money
advice websites (24%), websites or other literature from banks, building societies, or other insurance/
investments or pension providers (22%), and media/ newspapers or their websites (16%).
Half (50%) of all adults have used at least one type of information or guidance related to
investments, saving into a pension or retirement planning in the last 12 months.
The most used sources were private sector money advice websites (24%), websites or other
literature from banks, building societies, or other insurance/ investments or pension providers
(22%), and media/ newspapers or their websites (16%).
Many people were mainly using information or guidance in relation to investments, with one-tenth
purchasing an investment with a lump sum as a result of the guidance they received (11%),
changing the funds or assets in an investment (11%), or starting or increasing monthly payments
into an investment (9%).
The vast majority, over 80%, found each of the information or guidance sources they used to be
helpful. Information or guidance from friends and family and private sector money advice
websites was said to be the most helpful among users of these.
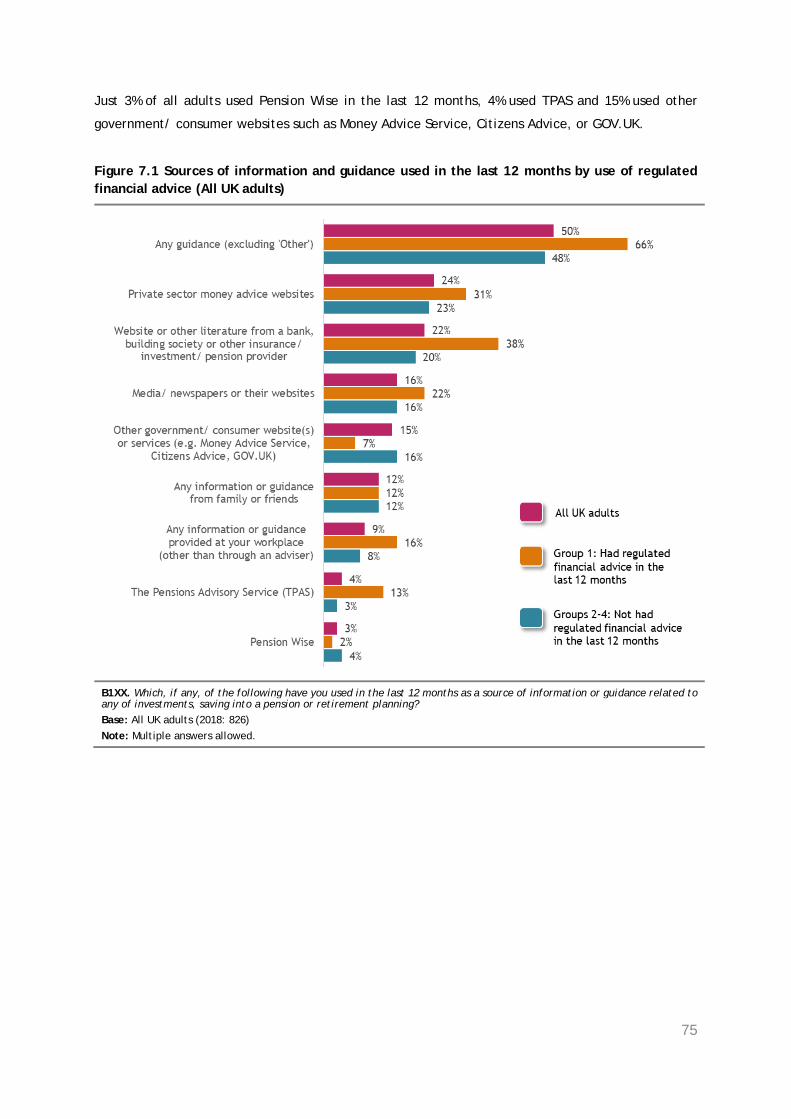
75
Just 3% of all adults used Pension Wise in the last 12 months, 4% used TPAS and 15% used other
government/ consumer websites such as Money Advice Service, Citizens Advice, or GOV.UK.
Figure 7.1 Sources of information and guidance used in the last 12 months by use of regulated financial advice (All UK adults)
B1XX. Which, if any, of the following have you used in the last 12 months as a source of information or guidance related to any of investments, saving into a pension or retirement planning? Base: All UK adults (2018: 826) Note: Multiple answers allowed.
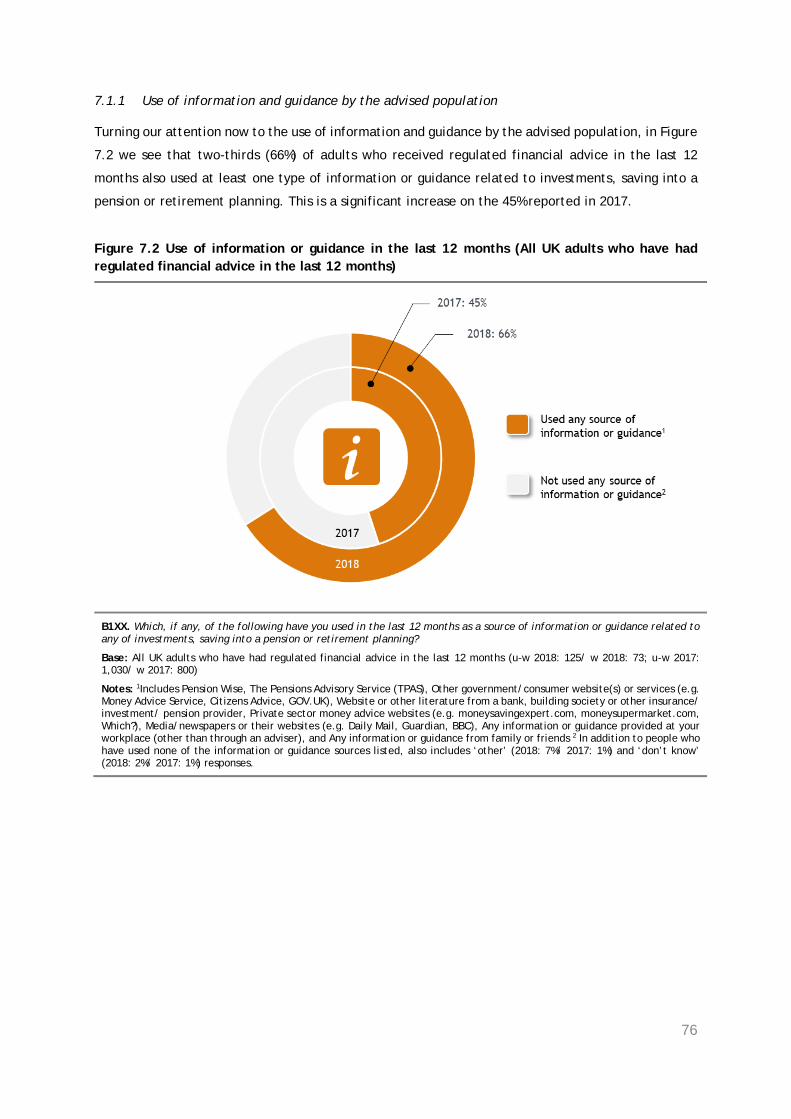
76
7.1.1 Use of information and guidance by the advised population
Turning our attention now to the use of information and guidance by the advised population, in Figure
7.2 we see that two-thirds (66%) of adults who received regulated financial advice in the last 12
months also used at least one type of information or guidance related to investments, saving into a
pension or retirement planning. This is a significant increase on the 45% reported in 2017.
Figure 7.2 Use of information or guidance in the last 12 months (All UK adults who have had regulated financial advice in the last 12 months)
B1XX. Which, if any, of the following have you used in the last 12 months as a source of information or guidance related to any of investments, saving into a pension or retirement planning?
Base: All UK adults who have had regulated financial advice in the last 12 months (u-w 2018: 125/ w 2018: 73; u-w 2017: 1,030/ w 2017: 800)
Notes: 1Includes Pension Wise, The Pensions Advisory Service (TPAS), Other government/consumer website(s) or services (e.g. Money Advice Service, Citizens Advice, GOV.UK), Website or other literature from a bank, building society or other insurance/ investment/ pension provider, Private sector money advice websites (e.g. moneysavingexpert.com, moneysupermarket.com, Which?), Media/newspapers or their websites (e.g. Daily Mail, Guardian, BBC), Any information or guidance provided at your workplace (other than through an adviser), and Any information or guidance from family or friends 2 In addition to people who have used none of the information or guidance sources listed, also includes ‘other’ (2018: 7%/ 2017: 1%) and ‘don’t know’ (2018: 2%/ 2017: 1%) responses.
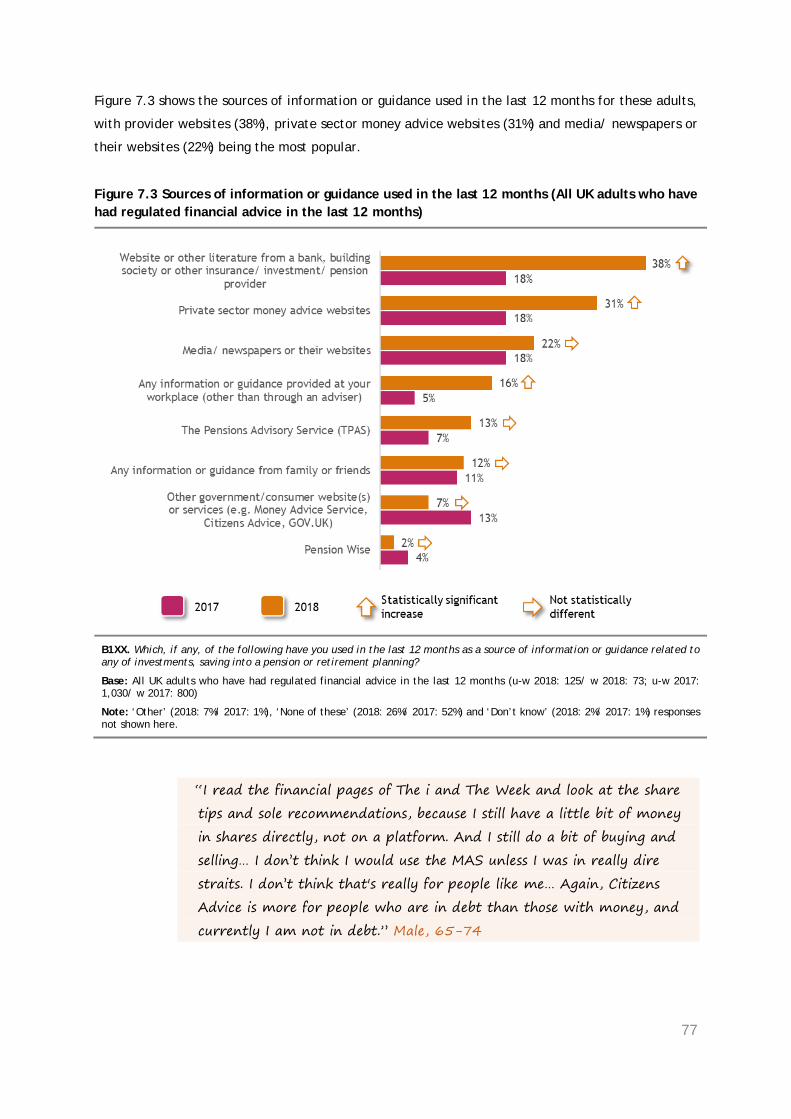
77
Figure 7.3 shows the sources of information or guidance used in the last 12 months for these adults,
with provider websites (38%), private sector money advice websites (31%) and media/ newspapers or
their websites (22%) being the most popular.
Figure 7.3 Sources of information or guidance used in the last 12 months (All UK adults who have had regulated financial advice in the last 12 months)
B1XX. Which, if any, of the following have you used in the last 12 months as a source of information or guidance related to any of investments, saving into a pension or retirement planning?
Base: All UK adults who have had regulated financial advice in the last 12 months (u-w 2018: 125/ w 2018: 73; u-w 2017: 1,030/ w 2017: 800)
Note: ‘Other’ (2018: 7%/ 2017: 1%), ‘None of these’ (2018: 26%/ 2017: 52%) and ‘Don’t know’ (2018: 2%/ 2017: 1%) responses not shown here.
“I read the financial pages of The i and The Week and look at the share
tips and sole recommendations, because I still have a little bit of money
in shares directly, not on a platform. And I still do a bit of buying and
selling… I don’t think I would use the MAS unless I was in really dire
straits. I don’t think that's really for people like me… Again, Citizens
Advice is more for people who are in debt than those with money, and
currently I am not in debt.” Male, 65-74
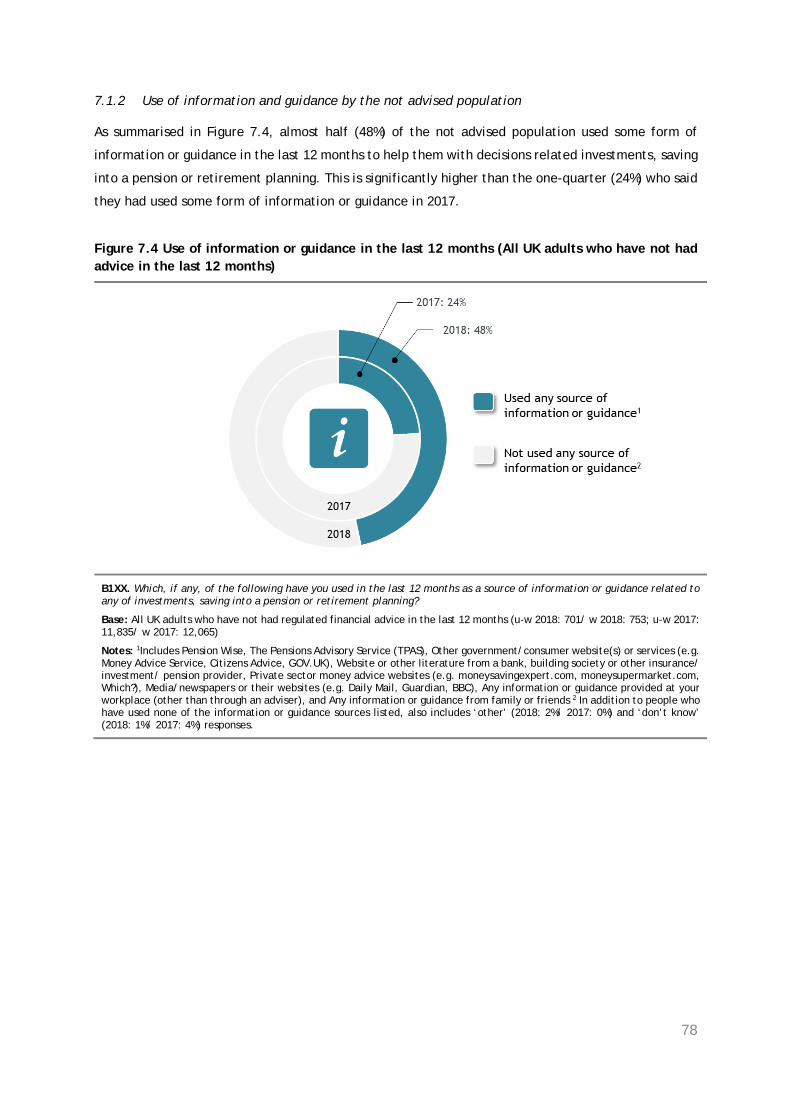
78
7.1.2 Use of information and guidance by the not advised population
As summarised in Figure 7.4, almost half (48%) of the not advised population used some form of
information or guidance in the last 12 months to help them with decisions related investments, saving
into a pension or retirement planning. This is significantly higher than the one-quarter (24%) who said
they had used some form of information or guidance in 2017.
Figure 7.4 Use of information or guidance in the last 12 months (All UK adults who have not had advice in the last 12 months)
B1XX. Which, if any, of the following have you used in the last 12 months as a source of information or guidance related to any of investments, saving into a pension or retirement planning?
Base: All UK adults who have not had regulated financial advice in the last 12 months (u-w 2018: 701/ w 2018: 753; u-w 2017: 11,835/ w 2017: 12,065)
Notes: 1Includes Pension Wise, The Pensions Advisory Service (TPAS), Other government/consumer website(s) or services (e.g. Money Advice Service, Citizens Advice, GOV.UK), Website or other literature from a bank, building society or other insurance/ investment/ pension provider, Private sector money advice websites (e.g. moneysavingexpert.com, moneysupermarket.com, Which?), Media/newspapers or their websites (e.g. Daily Mail, Guardian, BBC), Any information or guidance provided at your workplace (other than through an adviser), and Any information or guidance from family or friends 2 In addition to people who have used none of the information or guidance sources listed, also includes ‘other’ (2018: 2%/ 2017: 0%) and ‘don’t know’ (2018: 1%/ 2017: 4%) responses.
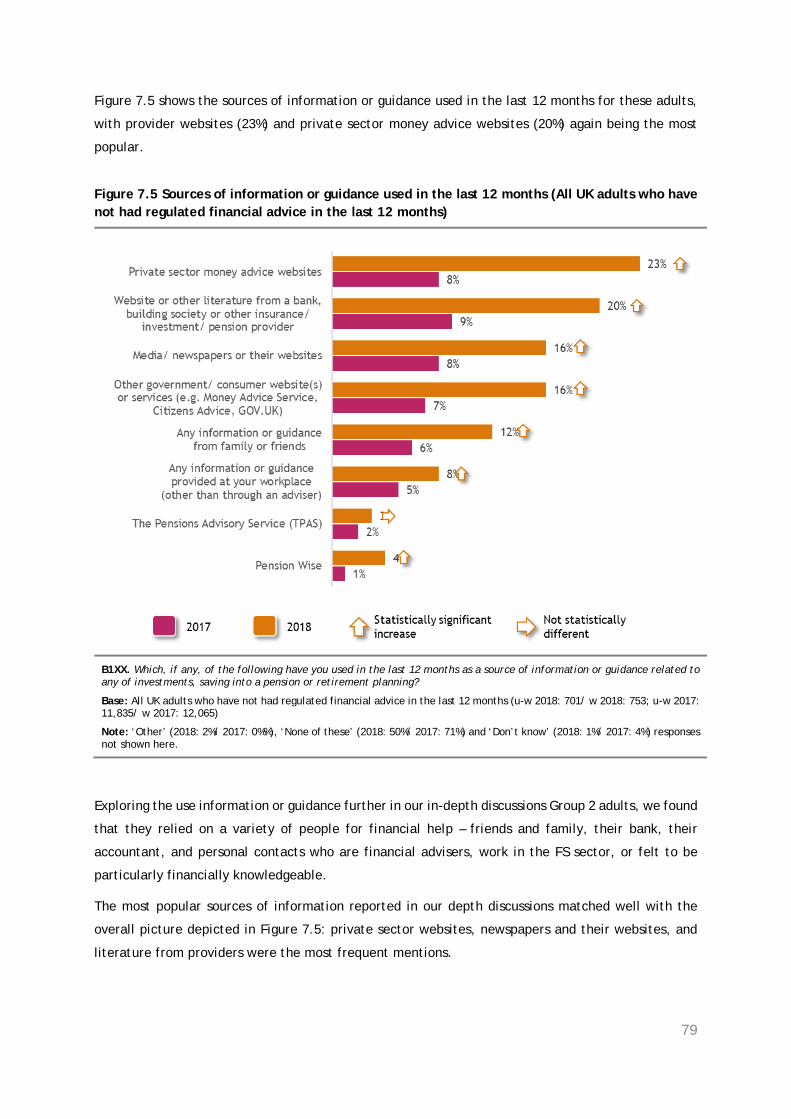
79
Figure 7.5 shows the sources of information or guidance used in the last 12 months for these adults,
with provider websites (23%) and private sector money advice websites (20%) again being the most
popular.
Figure 7.5 Sources of information or guidance used in the last 12 months (All UK adults who have not had regulated financial advice in the last 12 months)
B1XX. Which, if any, of the following have you used in the last 12 months as a source of information or guidance related to any of investments, saving into a pension or retirement planning?
Base: All UK adults who have not had regulated financial advice in the last 12 months (u-w 2018: 701/ w 2018: 753; u-w 2017: 11,835/ w 2017: 12,065)
Note: ‘Other’ (2018: 2%/ 2017: 0%%), ‘None of these’ (2018: 50%/ 2017: 71%) and ‘Don’t know’ (2018: 1%/ 2017: 4%) responses not shown here.
Exploring the use information or guidance further in our in-depth discussions Group 2 adults, we found
that they relied on a variety of people for financial help – friends and family, their bank, their
accountant, and personal contacts who are financial advisers, work in the FS sector, or felt to be
particularly financially knowledgeable.
The most popular sources of information reported in our depth discussions matched well with the
overall picture depicted in Figure 7.5: private sector websites, newspapers and their websites, and
literature from providers were the most frequent mentions.
80
“I get email marketing now and again and I will have a look at that. And
then usually have a look around on the web. I watch the odd money
show on the TV. But generally, a bit of googling on the web to have a
look.” Male, 55-64
“I would usually just go to our bank for information that would be the
first port of call - the bank that we have our money with now. Just to
see what they could offer, and if we were not satisfied the next step
would be some online research. If we were happy with what the bank
offered us, most probably we wouldn’t shop around.” Male, 35-44
“I read the financial pages in newspapers, probably that's my main source
of information. I do also subscribe and get emails from money.com and
moneysavingsexpert.com.” Male, 65-74
However, our depth discussions also revealed that, unprompted, adults tend to under-report the
information sources they are using. Most commonly, our respondents ‘forgot’ to report the
information they were getting from media and news, and information they were receiving from their
own providers. They also found it difficult to recall for sure whether they had specifically asked for
any financial help from friends or family in the last 12 months; this was often a topic covered in
general conversation rather than a discrete advice event.
“It’s not necessarily advice, but I may just get into a chat with colleagues
at work and someone might mention what they have done and that may
prompt me to look into it a bit more. I don’t have anyone that I speak to
about this thing regularly. it's mainly small talk at work.” Male, 25-34
“My father works for a financial institute and my brother works in
finance as well, and they are good at giving me advice. The lingo,
breakdowns, or anything I am not that comfortable with, I can just go to
them and ask them.” Male, 25-34
A couple of adults who took part in the qualitative research also had an ongoing relationship with an
adviser at their bank which they did not pay for. Meetings generally looked at product holdings they
had with the bank to see if there was a better product available. None had one of these meetings in
the last 12 months.
81
“I think once every couple of years we get called into the bank and then
the bank manager will actually discuss with us the different options
within their institution, like telling us that we could get a far better rate
for our money compared to an account at is currently sitting in.”
Male, 35-44
When prompted, those who took part in the qualitative research were aware of the Money Advice
Service (MAS) but did not think that it had anything to offer them with regards to their savings or
investments. None could recall using MAS in the last 12 months.
“MAS have appeared in searches once or twice, but it's not one of my go
to pages and I can’t think of any examples of why I would visit their
website off the top of my head unfortunately.” Male, 25-34
“I have gone on the MAS website occasionally. Generally, it's about
pension stuff that I look on there for. Never dealt with them directly,
just looked online.” Female, 55-64
We also found that many associated the Citizens’ Advice Bureau (CAB) with benefit claimants and
people in debt and therefore would not see this a source of help for them.
“I would consider the Citizens Advice Bureau if I had a problem, if I was
in debt, but wouldn’t go otherwise.” Female, 65-74
7.2 Reasons for using information or guidance
Table 7.1 explores the reasons why people sought information or guidance from the different sources
included in the survey. The main reason for seeking information or guidance from provider websites,
media/ newspapers or private sector money advices websites in the last 12 months was for help with
investments, while Pension Wise, TPAS24 and other government websites such as Money Advice
Service, Citizens Advice and GOV.UK were more likely to be used for help with retirement planning.
24 Pension Wise and TPAS results not reported in Table 7.1 due to small number of unweighted observations. These findings
should, therefore, be treated with caution and are indicative only.
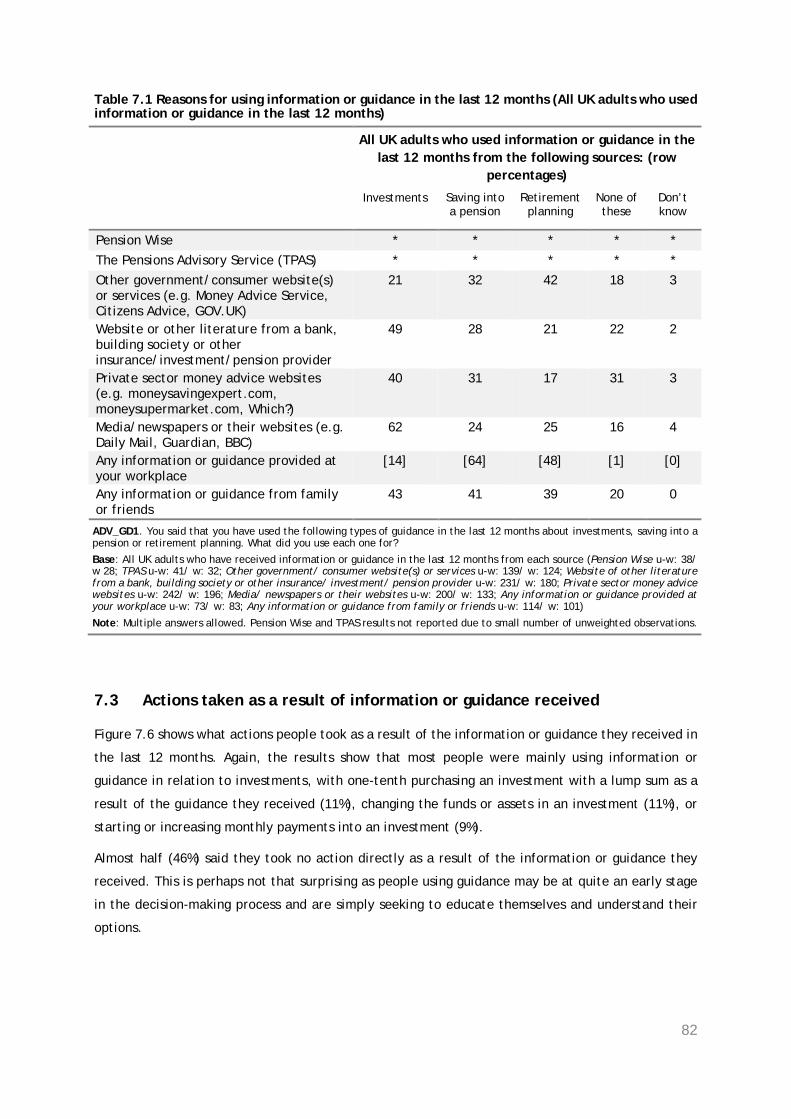
82
Table 7.1 Reasons for using information or guidance in the last 12 months (All UK adults who used information or guidance in the last 12 months)
All UK adults who used information or guidance in the last 12 months from the following sources: (row
percentages)
Investments Saving into a pension
Retirement planning
None of these
Don’t know
Pension Wise * * * * * The Pensions Advisory Service (TPAS) * * * * * Other government/consumer website(s) or services (e.g. Money Advice Service, Citizens Advice, GOV.UK)
21 32 42 18 3
Website or other literature from a bank, building society or other insurance/investment/pension provider
49 28 21 22 2
Private sector money advice websites (e.g. moneysavingexpert.com, moneysupermarket.com, Which?)
40 31 17 31 3
Media/newspapers or their websites (e.g. Daily Mail, Guardian, BBC)
62 24 25 16 4
Any information or guidance provided at your workplace
[14] [64] [48] [1] [0]
Any information or guidance from family or friends
43 41 39 20 0
ADV_GD1. You said that you have used the following types of guidance in the last 12 months about investments, saving into a pension or retirement planning. What did you use each one for? Base: All UK adults who have received information or guidance in the last 12 months from each source (Pension Wise u-w: 38/ w 28; TPAS u-w: 41/ w: 32; Other government/ consumer website(s) or services u-w: 139/ w: 124; Website of other literature from a bank, building society or other insurance/ investment/ pension provider u-w: 231/ w: 180; Private sector money advice websites u-w: 242/ w: 196; Media/ newspapers or their websites u-w: 200/ w: 133; Any information or guidance provided at your workplace u-w: 73/ w: 83; Any information or guidance from family or friends u-w: 114/ w: 101) Note: Multiple answers allowed. Pension Wise and TPAS results not reported due to small number of unweighted observations.
7.3 Actions taken as a result of information or guidance received
Figure 7.6 shows what actions people took as a result of the information or guidance they received in
the last 12 months. Again, the results show that most people were mainly using information or
guidance in relation to investments, with one-tenth purchasing an investment with a lump sum as a
result of the guidance they received (11%), changing the funds or assets in an investment (11%), or
starting or increasing monthly payments into an investment (9%).
Almost half (46%) said they took no action directly as a result of the information or guidance they
received. This is perhaps not that surprising as people using guidance may be at quite an early stage
in the decision-making process and are simply seeking to educate themselves and understand their
options.
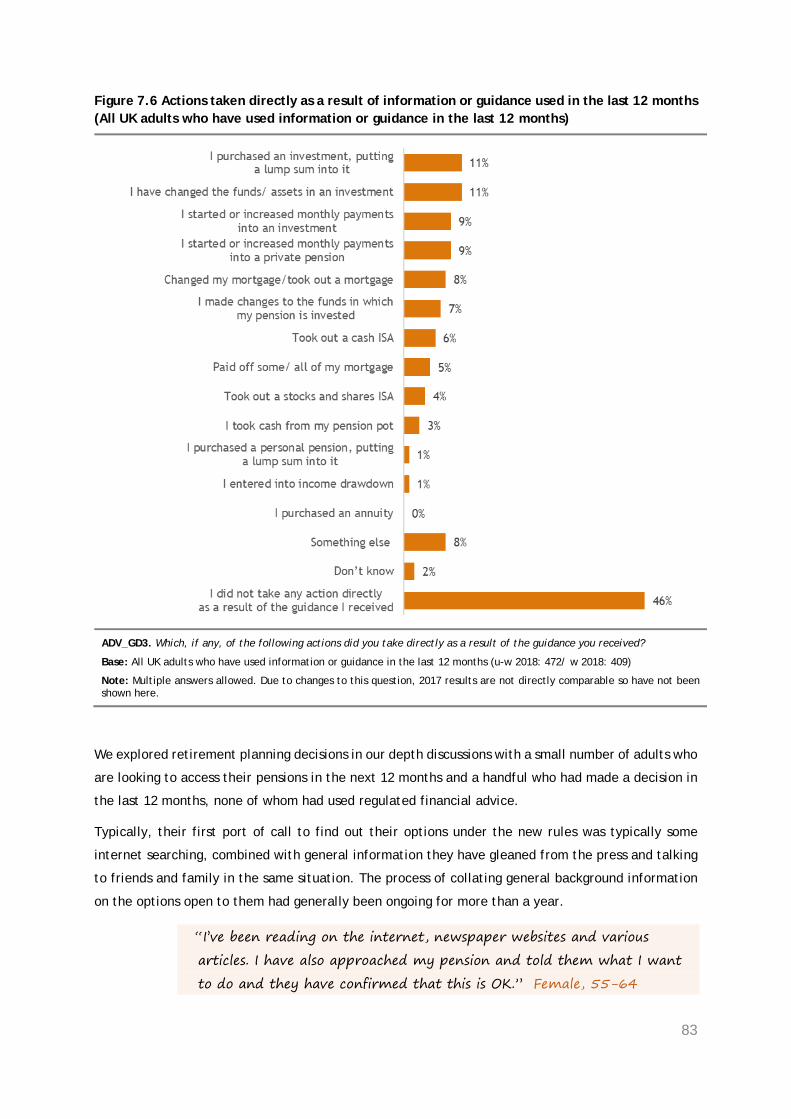
83
Figure 7.6 Actions taken directly as a result of information or guidance used in the last 12 months (All UK adults who have used information or guidance in the last 12 months)
ADV_GD3. Which, if any, of the following actions did you take directly as a result of the guidance you received?
Base: All UK adults who have used information or guidance in the last 12 months (u-w 2018: 472/ w 2018: 409)
Note: Multiple answers allowed. Due to changes to this question, 2017 results are not directly comparable so have not been shown here.
We explored retirement planning decisions in our depth discussions with a small number of adults who
are looking to access their pensions in the next 12 months and a handful who had made a decision in
the last 12 months, none of whom had used regulated financial advice.
Typically, their first port of call to find out their options under the new rules was typically some
internet searching, combined with general information they have gleaned from the press and talking
to friends and family in the same situation. The process of collating general background information
on the options open to them had generally been ongoing for more than a year.
“I’ve been reading on the internet, newspaper websites and various
articles. I have also approached my pension and told them what I want
to do and they have confirmed that this is OK.” Female, 55-64
84
A couple could recall receiving some leaflet from the Government which, on prompting, they recalled
as Pension Wise booklets. A couple had also been to the Pension Wise website but had not found it
particularly useful as they were already familiar with their options. None of the adults we spoke to
had had a face-to-face or telephone discussion with Pension Wise.
“I have read the Government leaflets that have come out. They were
quite informative. I believe they were posted to me. They gave me all the
options, how many options you had and guided you through them
really.” Female, 55-64
“I don’t think Pension Wise could have told me anything I didn’t already
know. In the end, they just explain the options you have to you and
that’s it. They don’t give advice and I know my options.” Female, 45-54
A couple had been to their providers’ websites and were disappointed with the experience as they
felt it contained basic information which was not specific to their personal circumstances. They
expressed some wariness about the impartiality of the information sent.
“When I first spoke to them they sent me quite a few bits and pieces. I
found that helpful. It wasn’t quite as useful as the information I had
received from Pension Wise because providers’ bias their stuff in that they
want you to stay with them.” Female, 55-64
Unprompted, none mentioned the ability to access their pension fund before retirement to pay
towards advice.
Only three of respondents who were making pension decisions worked for large corporates, the rest
were self-employed or owned their own business, so were not able to benefit guidance or advice
offered through the workplace. Two reported that they believed their employer and/or union offered
services to help with retirement planning which they would take up in due course - but as they worked
for a financial services organisation and a higher education institution they are perhaps not reflective
of the workplace experiences of the wider decision-making population.
Some who had actually made a pension decision in the last 12 months supplemented this background
reading with some specific online searching, typically using comparison sites and best buy tables in
the financial pages of the press to compare and contrast products. Despite any initial concerns, all of
those who had now made a pension decision felt confident do so based on the information and
guidance they have received. They had not looked into receiving regulated financial advice, partly
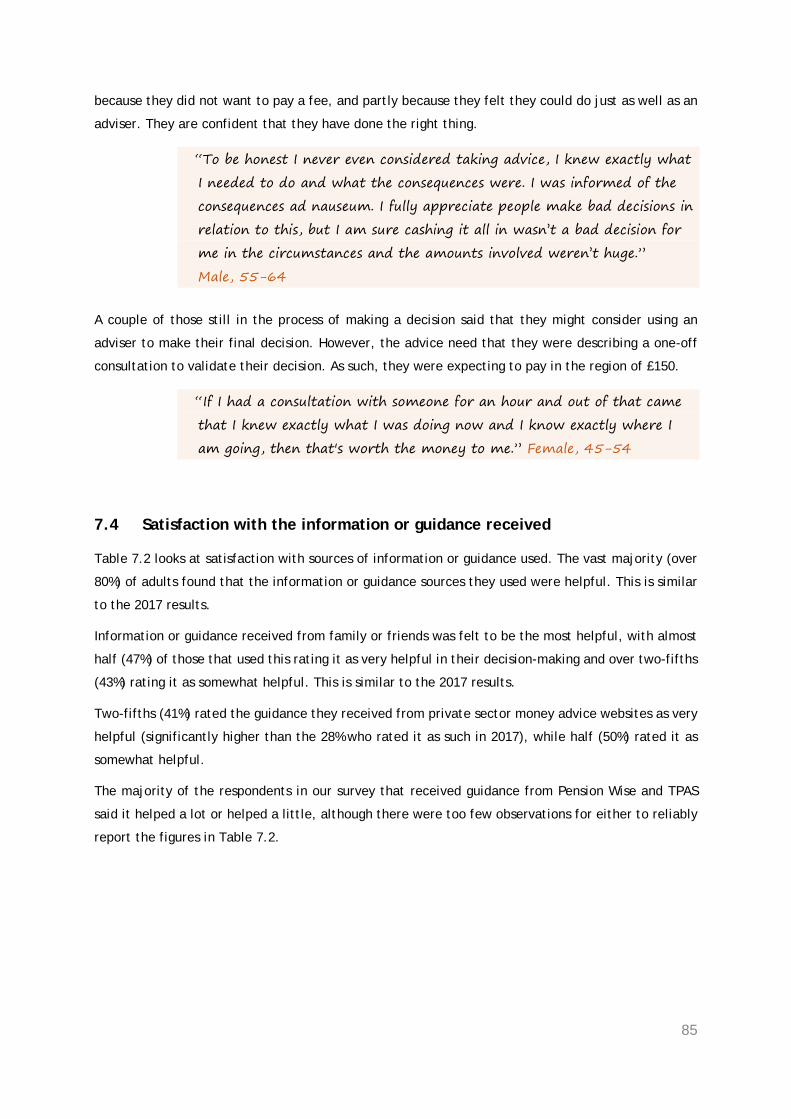
85
because they did not want to pay a fee, and partly because they felt they could do just as well as an
adviser. They are confident that they have done the right thing.
“To be honest I never even considered taking advice, I knew exactly what
I needed to do and what the consequences were. I was informed of the
consequences ad nauseum. I fully appreciate people make bad decisions in
relation to this, but I am sure cashing it all in wasn’t a bad decision for
me in the circumstances and the amounts involved weren’t huge.”
Male, 55-64
A couple of those still in the process of making a decision said that they might consider using an
adviser to make their final decision. However, the advice need that they were describing a one-off
consultation to validate their decision. As such, they were expecting to pay in the region of £150.
“If I had a consultation with someone for an hour and out of that came
that I knew exactly what I was doing now and I know exactly where I
am going, then that's worth the money to me.” Female, 45-54
7.4 Satisfaction with the information or guidance received
Table 7.2 looks at satisfaction with sources of information or guidance used. The vast majority (over
80%) of adults found that the information or guidance sources they used were helpful. This is similar
to the 2017 results.
Information or guidance received from family or friends was felt to be the most helpful, with almost
half (47%) of those that used this rating it as very helpful in their decision-making and over two-fifths
(43%) rating it as somewhat helpful. This is similar to the 2017 results.
Two-fifths (41%) rated the guidance they received from private sector money advice websites as very
helpful (significantly higher than the 28% who rated it as such in 2017), while half (50%) rated it as
somewhat helpful.
The majority of the respondents in our survey that received guidance from Pension Wise and TPAS
said it helped a lot or helped a little, although there were too few observations for either to reliably
report the figures in Table 7.2.
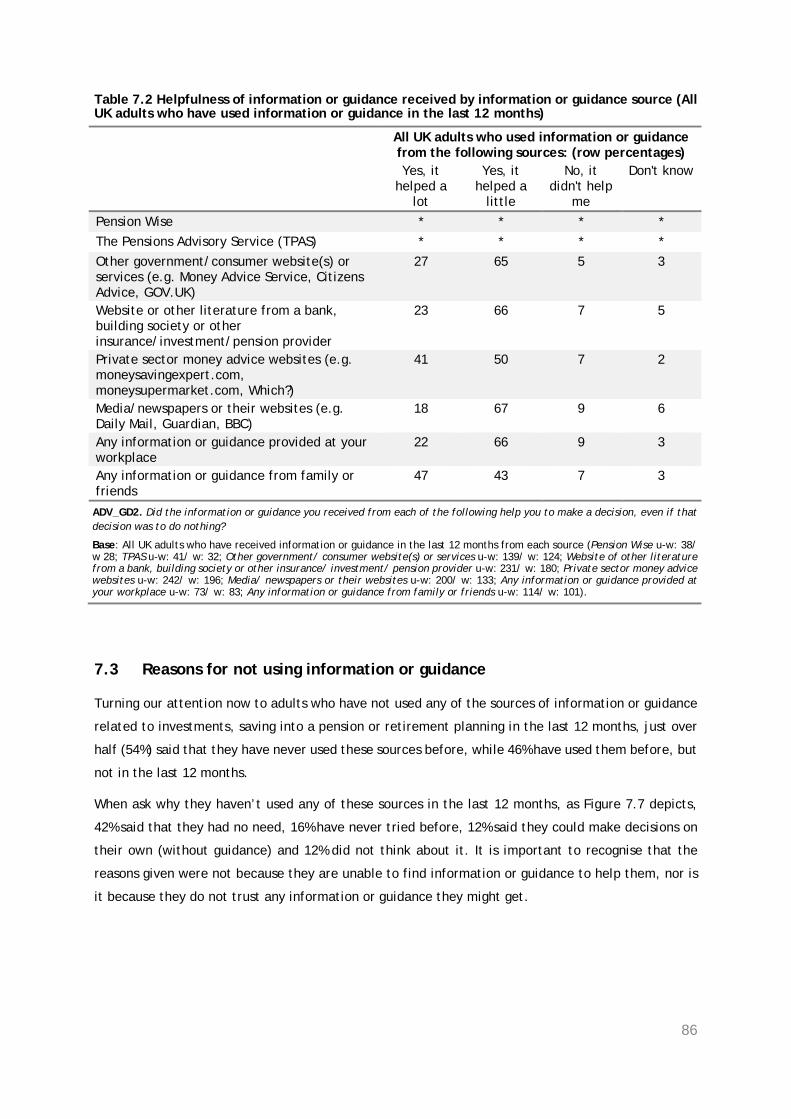
86
Table 7.2 Helpfulness of information or guidance received by information or guidance source (All UK adults who have used information or guidance in the last 12 months)
All UK adults who used information or guidance from the following sources: (row percentages)
Yes, it helped a
lot
Yes, it helped a
little
No, it didn't help
me
Don't know
Pension Wise * * * * The Pensions Advisory Service (TPAS) * * * * Other government/consumer website(s) or services (e.g. Money Advice Service, Citizens Advice, GOV.UK)
27 65 5 3
Website or other literature from a bank, building society or other insurance/investment/pension provider
23 66 7 5
Private sector money advice websites (e.g. moneysavingexpert.com, moneysupermarket.com, Which?)
41 50 7 2
Media/newspapers or their websites (e.g. Daily Mail, Guardian, BBC)
18 67 9 6
Any information or guidance provided at your workplace
22 66 9 3
Any information or guidance from family or friends
47 43 7 3
ADV_GD2. Did the information or guidance you received from each of the following help you to make a decision, even if that decision was to do nothing?
Base: All UK adults who have received information or guidance in the last 12 months from each source (Pension Wise u-w: 38/ w 28; TPAS u-w: 41/ w: 32; Other government/ consumer website(s) or services u-w: 139/ w: 124; Website of other literature from a bank, building society or other insurance/ investment/ pension provider u-w: 231/ w: 180; Private sector money advice websites u-w: 242/ w: 196; Media/ newspapers or their websites u-w: 200/ w: 133; Any information or guidance provided at your workplace u-w: 73/ w: 83; Any information or guidance from family or friends u-w: 114/ w: 101).
7.3 Reasons for not using information or guidance
Turning our attention now to adults who have not used any of the sources of information or guidance
related to investments, saving into a pension or retirement planning in the last 12 months, just over
half (54%) said that they have never used these sources before, while 46% have used them before, but
not in the last 12 months.
When ask why they haven’t used any of these sources in the last 12 months, as Figure 7.7 depicts,
42% said that they had no need, 16% have never tried before, 12% said they could make decisions on
their own (without guidance) and 12% did not think about it. It is important to recognise that the
reasons given were not because they are unable to find information or guidance to help them, nor is
it because they do not trust any information or guidance they might get.
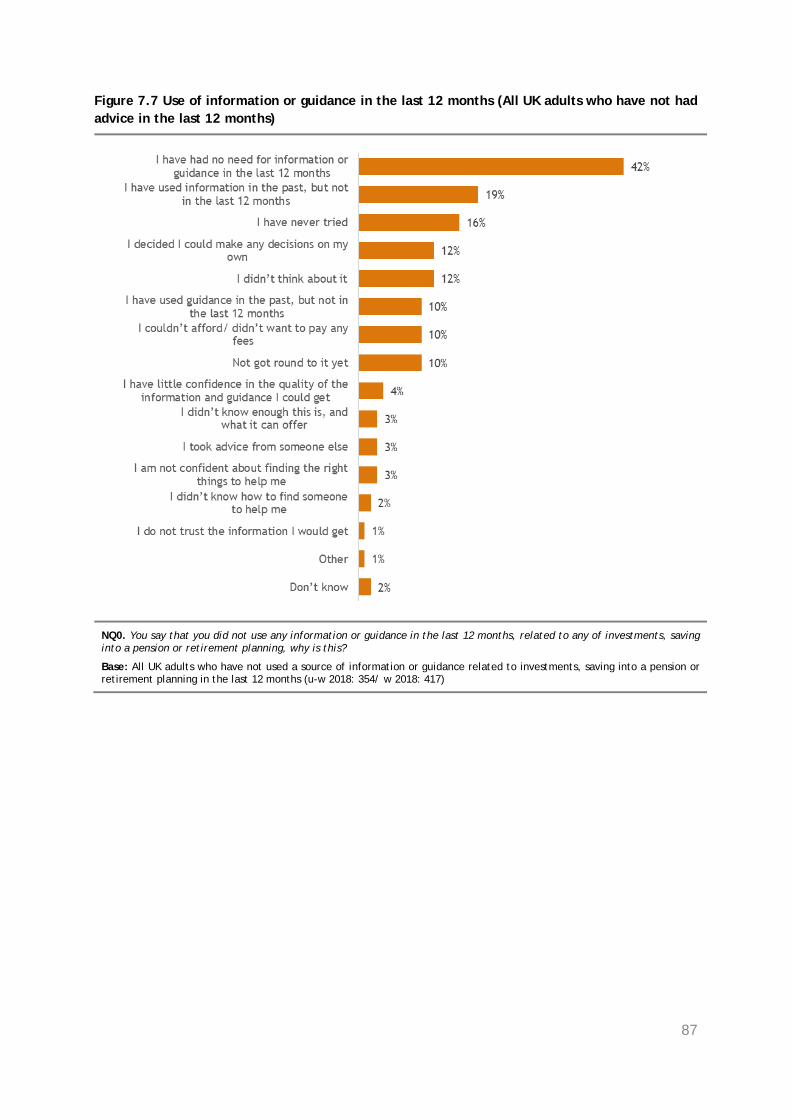
87
Figure 7.7 Use of information or guidance in the last 12 months (All UK adults who have not had advice in the last 12 months)
NQ0. You say that you did not use any information or guidance in the last 12 months, related to any of investments, saving into a pension or retirement planning, why is this?
Base: All UK adults who have not used a source of information or guidance related to investments, saving into a pension or retirement planning in the last 12 months (u-w 2018: 354/ w 2018: 417)
88
8. Methodological Appendix
In this appendix, we describe:
• The research methodology, including more details on the survey design and data
collection, how the data were weighted, and the research challenges and limitations that
should be considered when reading this report
• Some important reporting conventions
The information contained in this report is drawn from three sources:
1. FAMR 2018 Survey
2. FAMR Qualitative Research 2018
3. Financial Lives Survey 2017
8.1 FAMR 2018 Survey
The FAMR 2018 Survey is a re-contact survey of adults who took part in the Financial Lives Survey
2017 and agreed to take part in further research. This survey was conducted in March 2018 and
included interviews with 826 adults aged 18 and over. 555 of these interviews were conducted online,
while 271 were conducted by telephone. This research is the main evidence source used in this report
and its findings are compared to results from the Financial Lives Survey 2017.
8.1.1 Sample size and representativeness
In designing the FAMR 2018 Survey a main objective was to ascertain movements between the four
FAMR Groups, a goal that can only be achieved fully through tracking the same respondents over time.
For example, we wanted to know not only what percentage of UK adults had been in Group 1 and how
that percentage has changed, but what percentages of those in the original Group 1 (in 2017) were
now (in 2018) in Group 1, what percentage were now in Group 2, and so on.
This objective for the FAMR 2018 Survey meant that we needed to treat the achieved sample from
Financial Lives Survey 2017 as if it were a panel of respondents to re-interview. A limitation on doing
so was that only 4,120 (32%) of the 12,865 Financial Lives Survey 2017 respondents had given their
permission to be re-contacted, resulting in nearly two-thirds of our starting sample source effectively
being early refusals. From the 4,120 respondents who agreed to be re-contacted, the FAMR Survey
2018 achieved 826 interviews (i.e. a 6.4% base response rate from the 12,865 who were eligible).
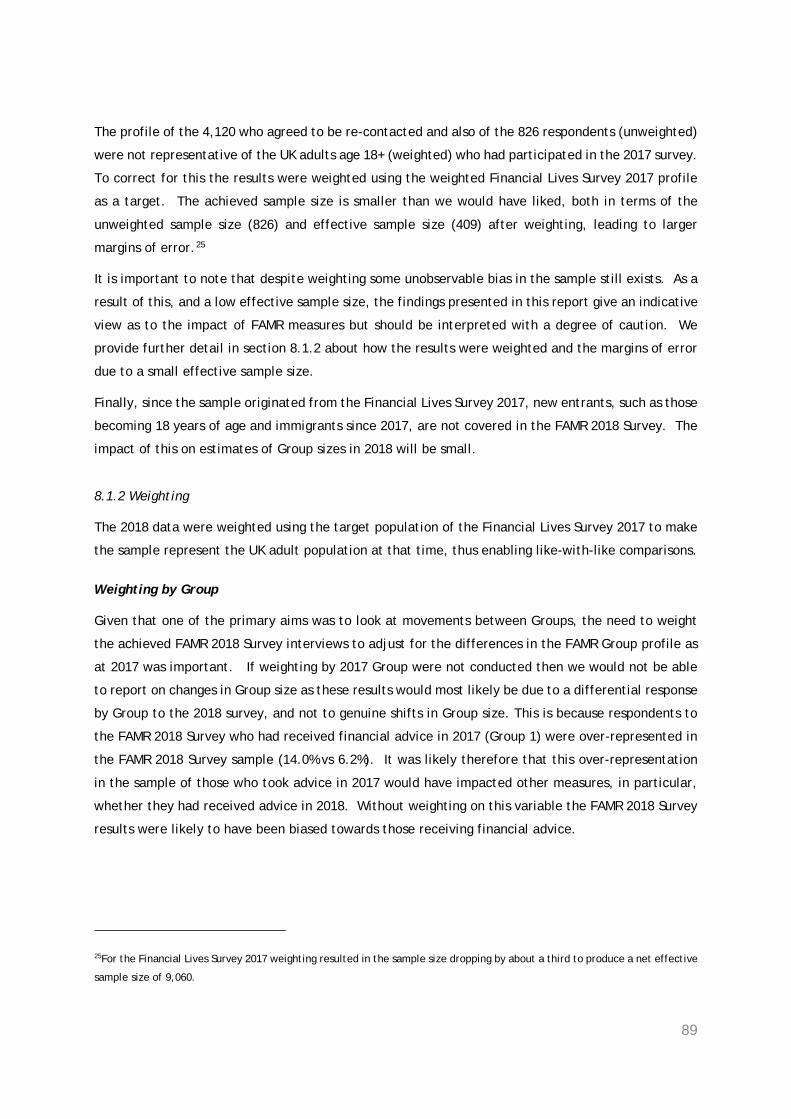
89
The profile of the 4,120 who agreed to be re-contacted and also of the 826 respondents (unweighted)
were not representative of the UK adults age 18+ (weighted) who had participated in the 2017 survey.
To correct for this the results were weighted using the weighted Financial Lives Survey 2017 profile
as a target. The achieved sample size is smaller than we would have liked, both in terms of the
unweighted sample size (826) and effective sample size (409) after weighting, leading to larger
margins of error.25
It is important to note that despite weighting some unobservable bias in the sample still exists. As a
result of this, and a low effective sample size, the findings presented in this report give an indicative
view as to the impact of FAMR measures but should be interpreted with a degree of caution. We
provide further detail in section 8.1.2 about how the results were weighted and the margins of error
due to a small effective sample size.
Finally, since the sample originated from the Financial Lives Survey 2017, new entrants, such as those
becoming 18 years of age and immigrants since 2017, are not covered in the FAMR 2018 Survey. The
impact of this on estimates of Group sizes in 2018 will be small.
8.1.2 Weighting
The 2018 data were weighted using the target population of the Financial Lives Survey 2017 to make
the sample represent the UK adult population at that time, thus enabling like-with-like comparisons.
Weighting by Group
Given that one of the primary aims was to look at movements between Groups, the need to weight
the achieved FAMR 2018 Survey interviews to adjust for the differences in the FAMR Group profile as
at 2017 was important. If weighting by 2017 Group were not conducted then we would not be able
to report on changes in Group size as these results would most likely be due to a differential response
by Group to the 2018 survey, and not to genuine shifts in Group size. This is because respondents to
the FAMR 2018 Survey who had received financial advice in 2017 (Group 1) were over-represented in
the FAMR 2018 Survey sample (14.0% vs 6.2%). It was likely therefore that this over-representation
in the sample of those who took advice in 2017 would have impacted other measures, in particular,
whether they had received advice in 2018. Without weighting on this variable the FAMR 2018 Survey
results were likely to have been biased towards those receiving financial advice.
25For the Financial Lives Survey 2017 weighting resulted in the sample size dropping by about a third to produce a net effective
sample size of 9,060.
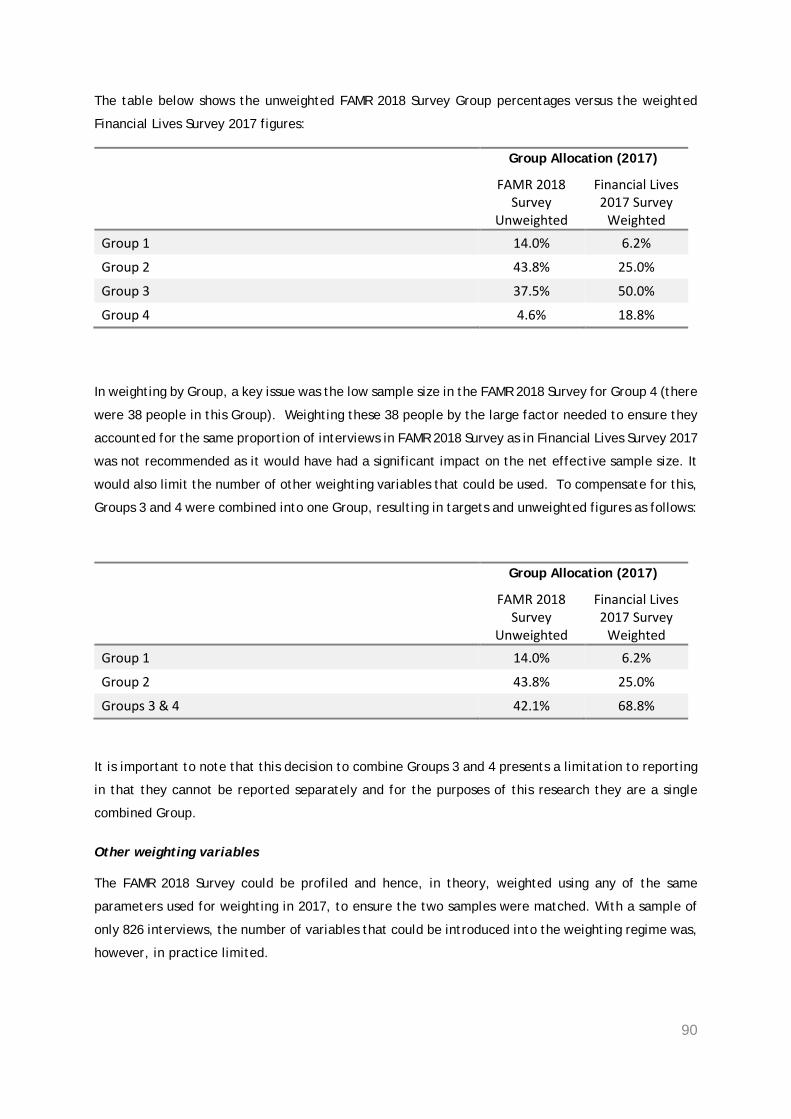
90
The table below shows the unweighted FAMR 2018 Survey Group percentages versus the weighted
Financial Lives Survey 2017 figures:
Group Allocation (2017)
FAMR 2018 Survey
Unweighted
Financial Lives 2017 Survey
Weighted Group 1 14.0% 6.2%
Group 2 43.8% 25.0%
Group 3 37.5% 50.0%
Group 4 4.6% 18.8%
In weighting by Group, a key issue was the low sample size in the FAMR 2018 Survey for Group 4 (there
were 38 people in this Group). Weighting these 38 people by the large factor needed to ensure they
accounted for the same proportion of interviews in FAMR 2018 Survey as in Financial Lives Survey 2017
was not recommended as it would have had a significant impact on the net effective sample size. It
would also limit the number of other weighting variables that could be used. To compensate for this,
Groups 3 and 4 were combined into one Group, resulting in targets and unweighted figures as follows:
Group Allocation (2017)
FAMR 2018 Survey
Unweighted
Financial Lives 2017 Survey
Weighted Group 1 14.0% 6.2%
Group 2 43.8% 25.0%
Groups 3 & 4 42.1% 68.8%
It is important to note that this decision to combine Groups 3 and 4 presents a limitation to reporting
in that they cannot be reported separately and for the purposes of this research they are a single
combined Group.
Other weighting variables
The FAMR 2018 Survey could be profiled and hence, in theory, weighted using any of the same
parameters used for weighting in 2017, to ensure the two samples were matched. With a sample of
only 826 interviews, the number of variables that could be introduced into the weighting regime was,
however, in practice limited.
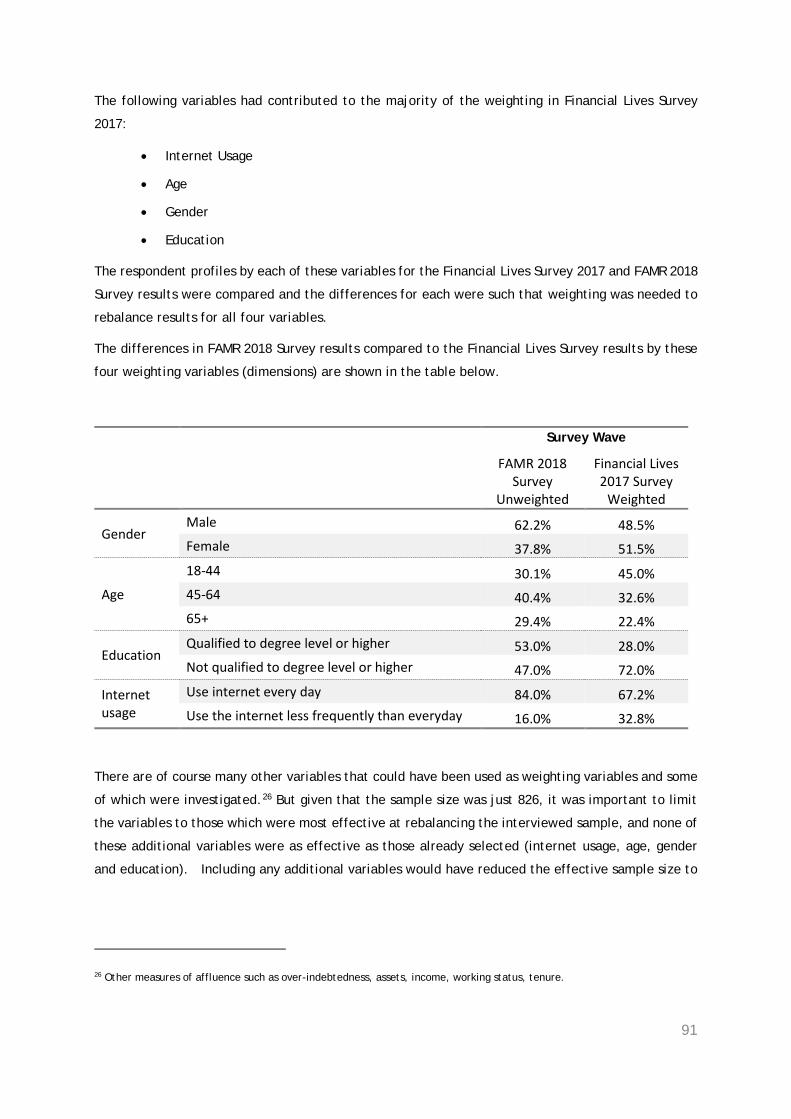
91
The following variables had contributed to the majority of the weighting in Financial Lives Survey
2017:
• Internet Usage
• Age
• Gender
• Education
The respondent profiles by each of these variables for the Financial Lives Survey 2017 and FAMR 2018
Survey results were compared and the differences for each were such that weighting was needed to
rebalance results for all four variables.
The differences in FAMR 2018 Survey results compared to the Financial Lives Survey results by these
four weighting variables (dimensions) are shown in the table below.
Survey Wave
FAMR 2018 Survey
Unweighted
Financial Lives 2017 Survey
Weighted
Gender Male 62.2% 48.5% Female 37.8% 51.5%
Age
18-44 30.1% 45.0% 45-64 40.4% 32.6% 65+ 29.4% 22.4%
Education Qualified to degree level or higher 53.0% 28.0% Not qualified to degree level or higher 47.0% 72.0%
Internet usage
Use internet every day 84.0% 67.2% Use the internet less frequently than everyday 16.0% 32.8%
There are of course many other variables that could have been used as weighting variables and some
of which were investigated.26 But given that the sample size was just 826, it was important to limit
the variables to those which were most effective at rebalancing the interviewed sample, and none of
these additional variables were as effective as those already selected (internet usage, age, gender
and education). Including any additional variables would have reduced the effective sample size to
26 Other measures of affluence such as over-indebtedness, assets, income, working status, tenure.
92
a level where any advantage of improving the weighting programme is removed by having a smaller
sample (since confidence intervals for estimates would be significantly increased).
Cell weighting or RIM weighting
Once the weighting dimensions were established, two techniques were considered for applying the
weights themselves, Cell weighting and Random Iterative Method (RIM) weighting. Cellular
weighting uses interlocking targets across all variables. It is precise because the interlocking targets
are known (from the Financial Lives Survey 2017) and can therefore be achieved by devising a matrix
of interlocking dimensions. Even using simple groupings (Group x3, Gender x2, Age x2, Education x2,
Internet usage x2) generated 72 cells. With a sample size of 826, if distributed evenly, there would
only have been c. 11 interviews per cell, when 30-50 interviews per cell is recommended for cell
weighting.
An alternative approach was RIM weighting which allows the proportionality of multiple dimensions
to be adjusted at the same time by making assumptions about how each dimension interlocks.
Crucially the algorithm attempts to find a solution which distorts each dimension the least, thus
maximising effective sample size. RIM weighting was the most effective solution to weight the FAMR
2018 Survey.
Capping the weights
The Financial Lives Survey 2017 was weighted using maximum and minimum individual weights of 4.0
and 0.25, respectively, and the same approach was taken when weighting FAMR 2018 Survey results.
This capping ensures that no one individual would have their answers weighted up by more than a
factor of 4 or reduced by a factor of less than 0.25, and that large weighting factors do not reduce
the effective sample size to a level that may limit the ability to usefully analyse results. This approach
is widely accepted within the research industry as necessary to avoid possible extreme RIM weighting
solutions.
Weighting efficiency
The final weighting solution for the FAMR 2018 Survey was a good compromise of accuracy and
effective sample size, and resulted in an effective sample of 409 from a starting sample of 826
interviews. This is a weighting efficiency of 49.5%, or, in other words, the survey is equivalent to a
simple random sample survey27 of 409 interviews.
27 A survey where all UK adults have an equal and known chance of selection and the sample drawn is a perfect match to the
population and no weighting is required.
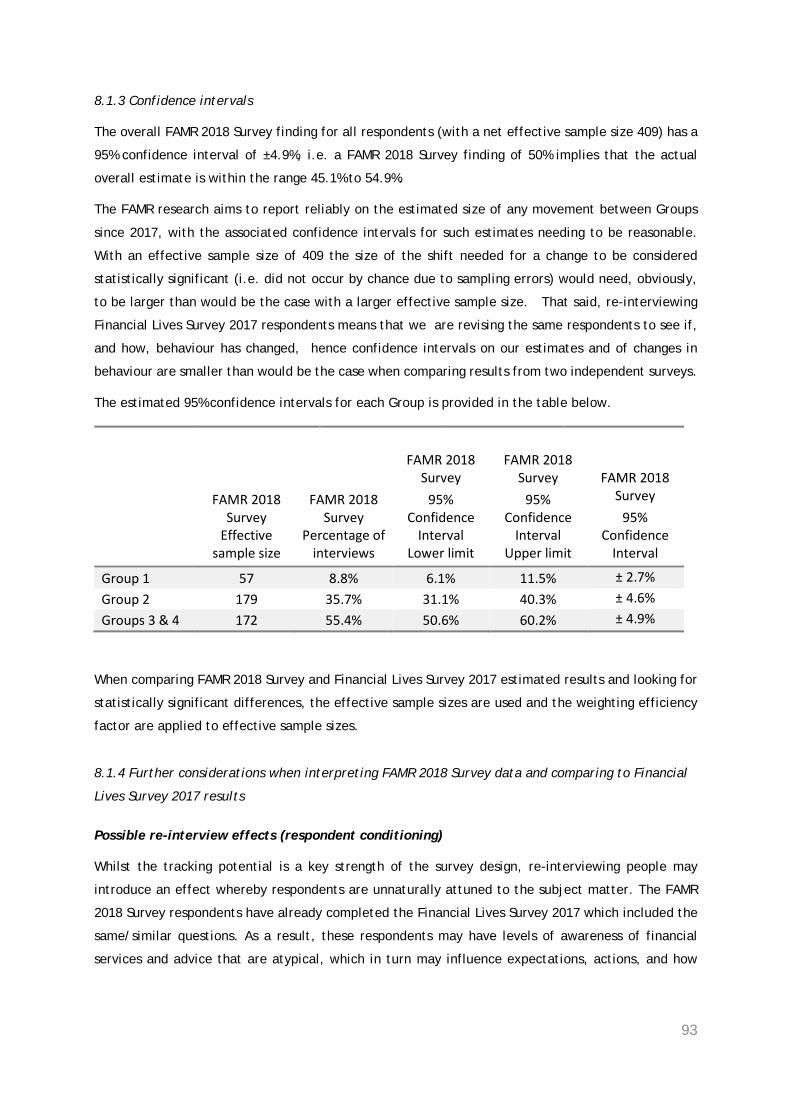
93
8.1.3 Confidence intervals
The overall FAMR 2018 Survey finding for all respondents (with a net effective sample size 409) has a
95% confidence interval of ±4.9%, i.e. a FAMR 2018 Survey finding of 50% implies that the actual
overall estimate is within the range 45.1% to 54.9%.
The FAMR research aims to report reliably on the estimated size of any movement between Groups
since 2017, with the associated confidence intervals for such estimates needing to be reasonable.
With an effective sample size of 409 the size of the shift needed for a change to be considered
statistically significant (i.e. did not occur by chance due to sampling errors) would need, obviously,
to be larger than would be the case with a larger effective sample size. That said, re-interviewing
Financial Lives Survey 2017 respondents means that we are revising the same respondents to see if,
and how, behaviour has changed, hence confidence intervals on our estimates and of changes in
behaviour are smaller than would be the case when comparing results from two independent surveys.
The estimated 95% confidence intervals for each Group is provided in the table below.
FAMR 2018 Survey
Effective sample size
FAMR 2018 Survey
Percentage of interviews
FAMR 2018 Survey
95% Confidence
Interval Lower limit
FAMR 2018 Survey
95% Confidence
Interval Upper limit
FAMR 2018 Survey
95% Confidence
Interval
Group 1 57 8.8% 6.1% 11.5% ± 2.7% Group 2 179 35.7% 31.1% 40.3% ± 4.6% Groups 3 & 4 172 55.4% 50.6% 60.2% ± 4.9%
When comparing FAMR 2018 Survey and Financial Lives Survey 2017 estimated results and looking for
statistically significant differences, the effective sample sizes are used and the weighting efficiency
factor are applied to effective sample sizes.
8.1.4 Further considerations when interpreting FAMR 2018 Survey data and comparing to Financial
Lives Survey 2017 results
Possible re-interview effects (respondent conditioning)
Whilst the tracking potential is a key strength of the survey design, re-interviewing people may
introduce an effect whereby respondents are unnaturally attuned to the subject matter. The FAMR
2018 Survey respondents have already completed the Financial Lives Survey 2017 which included the
same/similar questions. As a result, these respondents may have levels of awareness of financial
services and advice that are atypical, which in turn may influence expectations, actions, and how
94
their own actions are recalled. The impact of this effect cannot be measured, and is not something
which can be adjusted for with weighting.
Data collection methods
In the Financial Lives Survey 2017 only a small minority (<10%) of respondents were interviewed face
to face, the remainder answering a self-completion survey online. For the FAMR 2018 Survey, a
significant proportion (>30%) were interviewed by telephone, with the remainder of the interviews
conducted via a self-completion survey online. Furthermore, the Financial Lives Survey 2017
questions about advice were a part of a much longer interview, whereas the FAMR 2018 Survey
questionnaire only covered questions about financial advice and was therefore far shorter. Both the
changes in method and the shorter survey length may have an impact on results. These impacts
cannot be measured, and are also not something which can be adjusted for with weighting.
Questionnaire design
Some FAMR questions in the Financial Lives Survey 2017 were changed for the FAMR 2018 Survey.
These changes had an impact on how we allocated respondents to the four Groups and in some cases
how far we can make comparisons between the results from the two surveys. Further detail can be
found in Section 1.3.3.
8.2 2018 Qualitative Research
Ignition House undertook a programme of qualitative research to support the findings from the FAMR
2018 Survey. In total, we interviewed 34 consumers over the telephone in March and in June 2018.
Interviews lasted approximately 30 minutes.
In commissioning this study, the FCA was interested in exploring two specific groups of consumers:
• Those who have not had regulated financial advice in the last 12 months but might have
need for it – described in this report as Group 2
• Those who had regulated financial advice in 2017 but not in 2018, or did not have
regulated financial advice in 2017 but did in 2018 - described in this report as ‘movers’
In total, we conducted 25 interviews with Group 2 adults and 9 interviews with ‘movers’ – 4 who had
moved into Group 1 and 5 who moved out of Group 1.
8.2.1 Qualitative research with Group 2 adults, March 2018
The main purpose of our discussion was to determine why this Group did not have regulated financial
advice despite potentially having a need for it, and what, if any, sources of information and guidance
they might be using to inform their decision making instead.
95
Due to project constraints, our qualitative research with Group 2 adults had to take place prior to the
completion of the FAMR 2018 Survey. For this reason, we drew respondents from a pool of adults who
were in Group 2 based on their responses to the Financial Lives Survey 2017 (and agreed to participate
in further research), not adults who are classified as Group 2 based on their responses to the FAMR
2018 Survey. One of the 25 respondents had moved out of Group 2 (into Group 1) in 2018.
Seventeen of our 25 respondents qualified for Group 2 because they reported having more than
£10,000 of investible assets in the Financial Lives Survey 2017. Additional quotas were set for this
Group to ensure that we had a good mix of respondents. Firstly, we screened to get a representation
across different levels of investible assets, ensuring a mix of those with £10,000-£29,999, £30,000-
£49,999 and £50,000 or more. Secondly, we had a roughly equal split of those who had made a
financial decision in the last 12 months compared to those who had not. Our definition of financial
decision was broad and encompassed switching providers, changing funds, making a decision on a
maturing savings or investment product or changing pension contributions. Finally, we recruited to
ensure a balance between males and females and by age (under 40s, 40-50 year olds, and those aged
50 and over).
The remainder of our respondents originally qualified for Group 2 in 2017 on the basis they were going
to be retiring or accessing a DC pension of over £10,000 within the next two years. One year later,
three had made a decision and the rest are drawing closer towards making a decision. Due to the
small number of re-contactable respondents no additional quotas were set for this Group.
8.2.2 Qualitative research with ‘movers’, June 2018
All respondents in our FAMR 2018 Survey were sourced from the Financial Lives Survey 2017. The key
benefit of this approach is that it allows us to track movements in peoples’ circumstances over time.
One early finding from the FAMR 2018 Survey was that there appeared to be significant movement in
and out of Group 1 over the course of a year, i.e. people who had advice in 2017 but did not in 2018
and vice versa. Our qualitative research with ‘movers’ was designed to unpick the potential reasons
for this.
In total, we spoke to 9 ‘movers’, 3 who had had regulated financial advice in 2018 but not in 2017
and 6 who had regulated financial advice in 2017 but not in 2018.
8.3 Financial Lives Survey 2017
This is the FCA’s large-scale tracking survey of consumers’ behaviour and experiences when engaging
with financial services firms and buying financial products. The 2017 survey was conducted between
December 2016 and April 2017 and included interviews with nearly 13,000 adults across the UK – all
96
adults aged 18 and over. For further information about this survey and related publications, please
see:
• www.fca.org.uk/publication/research/famr-quantitative-research.pdf (FAMR 2017 baseline report)
• www.fca.org.uk/publications/research/understanding-financial-lives-uk-adults
(Financial Lives Survey 2017 October report)
• www.fca.org.uk/publication/research/financial-lives-survey-2017-technical-
report.pdf (Financial Lives Survey 2017 technical report)
8.4 Reporting conventions
8.4.1 Table and chart conventions
In tables and charts, the following conventions are used when displaying results:
* Percentages based on fewer than 50 unweighted observations have been removed.
[x] Percentages based on 50 or more but fewer than 100 unweighted observations.
0 No observations.
– Category not applicable.
8.4.2 Rounding
In tables, charts and report text, percentages derived from the survey analysis or associated
calculations are usually rounded upwards or downwards to the nearest whole number. Where a
percentage, calculated to one decimal place, is x.5% the convention is to round upwards, e.g. 56.5%
is shown as 57%. Totals in tables may, therefore, not add to 100%.
8.4.3 Treatment of ‘don’t know’ and ‘prefer not to say’ responses
Findings are usually rebased to exclude respondents who refused to answer a question or where the
respondent said ‘don’t know’, yet their ‘don’t know’ response is not a meaningful result. The base
information below the charts and tables gives the details on the proportion of respondents that have
been excluded because they refused to answer or were not able to give an answer.
8.4.4 Statistically significant differences
We have tested all of the survey results to a confidence interval (CI) of 95%. Where we pick out results
in the report text, they are always statistically significant to a CI of 95%, unless we explicitly say
they are not.

97
For example, if we say that ‘retirees are more likely than the population as a whole to have had
regulated financial advice in the last 12 months’, there is just a 5% chance that this difference could
have happened by chance.
98
Abbreviations
Abbreviation Definition
CAB
CI
DB
DC
FAMR
FCA
HMT
IFA
ISA
MAS
TPAS
UFPLS
UK
Citizens Advice Bureau
Confidence intervals
Defined benefit
Defined contribution
Financial Advice Market Review
Financial Conduct Authority
Her Majesty’s Treasury
Independent Financial Adviser
Individual Savings Account
Money Advice Service
The Pensions Advisory Service
Uncrystallised Funds Pension Lump Sum
United Kingdom
99
Glossary
In the table below, we list a number of terms that are referred to regularly in this report and describe
the way that these were explained to the survey respondents.
Research with consumers consistently shows that they struggle to understand industry terminology
and so, wherever possible, we have tried to use words and definitions in our survey that people can
understand and relate to. This means these definitions are not industry standard or to be found in the
FCA’s Handbook Glossary.
That said, although we have tried to make terms easier for our respondents to understand, and some
pre- urvey cognitive testing of terms was undertaken in 2017 to this end, it remains possible that not
all respondents will have understood terms put to them or understood them in quite the same ways.
This reflects a limitation of consumer research, particularly when relatively complex concepts are
involved.
Term Definition provided to respondents or term used in this report based on questions asked of respondents
Adult Aged 18 or over
Advice Shorthand for regulated financial advice.28
Advised Those who have received regulated financial advice in the last 12 months. Also referred to as Group 1.
Decumulation Accessing a DC pension, by buying an annuity, entering into income drawdown or UFPLS, or taking cash from it
Defined Contribution (DC) pension
Group
When respondents have an employer arranged private pension, the Financial Lives Survey 2017 prompts them with a description of a defined benefit and defined contribution pension. If they do not recognise these, we assume they have a defined contribution pension
The FAMR Group (1-4) a respondent is allocated to based on survey responses. See section 1.3.2.
Higher qualifications Postgraduate and first degrees, and diplomas or other HE (Higher Education) qualifications
28 Terms in bold are also included in this table.
100
Term Definition provided to respondents or term used in this report based on questions asked of respondents
Information or guidance We explained to respondents that sources of information or guidance about investments, saving into a pension or retirement planning included government, financial service industry and other private sector websites and services; the media; the workplace and friends and family.
Where we refer to information in this report we mean material that is purely factual. Where we refer to guidance this means material that provides an opinion about the relative merits of products generally as opposed to specific products but does not involve a personal recommendation. Respondents were, however, asked about their experiences of information or guidance, without being given these definitions.
Investible assets The total amount of money held in savings only, in investments only, or, if both held, in savings and investments combined.
Investments By ‘investments’ we mean retail investment products including stocks and shares ISAs, insurance bonds, investment funds and endowments, shares and equities, corporate bonds, gilts or government bonds, crowdfunding and peer-to-peer lending, and structured investments/ deposits. We do not include investment in property or in collectables like wine, art or jewellery.
‘Movers’ A term used in this report when describing adults who have moved in to or out of Group 1 between 2017 and 2018; i.e. those who had regulated financial advice in 2017 but not in 2018 or did not have regulated financial advice in 2017 but did in 2018.
Not advised consumer Consumer who has not received any regulated financial advice in the last 12 months. Such consumers fall into Groups 2, 3 or 4.
Regulated financial advice
By ‘regulated financial advice’ we mean advice that is paid for, or would be paid for if you took out a product, from one of the following advisers:
• An adviser from a financial advice firm such as an IFA (Independent Financial Adviser)
• An adviser from a bank or building society
• An adviser from an insurance company, investment company or pension provider
• Automated advice available online or as downloadable software. This is personalised advice which usually incurs a charge, where you input your financial information and objectives and this information is used to generate investment and/or pension recommendations suitable for you (automated). It does not include simple online tools and calculators.
In this report, regulated financial advice is always restricted to advice related to investments, saving into a pension or retirement planning.
101
Term Definition provided to respondents or term used in this report based on questions asked of respondents
Retirement planning By ‘retirement planning’ we mean the choices you need to make when starting to take money from your pension savings to fund your retirement. This could include buying an annuity or entering into income drawdown or taking cash from your pension pot.
Saving into a pension By ‘pension’ we mean a pension arranged through an employer or one you have arranged yourself. Please do not think about State pensions.
Savings Money that is held in deposit-based accounts, including current accounts, savings accounts, Post Office card accounts, NS&I bonds, credit union savings accounts, e-money accounts and cash ISAs.
102
The team and the authors
This report is based on the findings of a survey conducted by Critical Research, and directed by Steve
Pick, and of qualitative depth interviews conducted by Ignition House, and managed by Janette Weir.
Ed Ripley from Ignition House is the main report author, supported by Janette Weir on the qualitative
research elements and, from the FCA, Claire Older. Derek Farr, consultant statistician at Critical
Research designed the re-contact panel methodology and weighting regime and authored Section 8.1.
The views expressed in this report are those of the Ignition House and Critical Research authors. The
authors are:
Derek Farr: A Statistical Consultant at Critical Research, Derek has been working as a statistician
in market research since the 1970s. Initially working for The Post Office and BT, Derek moved
agency side and became a board director in the 1980s. In 1991 he founded Critical Research as a
specialist research company, focusing on financial research. Since then Derek regularly
contributes to the industry by providing specialist advice and speaking at conferences.
Dr Claire Older: An FCA Senior Associate in the Consumer Insight department, Claire is a
qualitative research specialist who works across all retail financial sectors, while specialising in
financial capability, pensions and general insurance market research. Claire has also worked as
a researcher at the Money Advice Service. Earlier in her career, she focused on academic research
in the field of health psychology.
Edward Ripley: A Director at Ignition House since 2008, Edward has over 15 years’ experience
working in the market research and advisory industry, previously as Director for Corporate
Strategy and New Business Development at the Corporate Executive Board and as Lead Analyst
for the Retail Banking team at Datamonitor.
Janette Weir: The Managing Director of Ignition House since 2008, Janette has more than twenty-
five years’ experience in the financial services sector and brings a broad range of research and
consultancy skills and experience from her previous roles as Chief Economist of the ABI,
Economist at the DWP, and Head of UK Financial Services Research at McKinsey and Company.
103
Acknowledgements
Thanks first and foremost go to the consumers throughout the UK who were willing to complete the
survey and the in-depth interviews and gave their time to do so.
We also thank Steve Pick who directed the team at Critical Research on this assignment, and James
Hopkins, who has worked on the Financial Lives programme for the last two years and who supported
Steve and his team.
From Ignition House we would like to thank Eirik Barr and Joseph Birch for their support on the
qualitative research.
Finally, we would like to thank from the FCA Edward Oxley and Alison Rose, who work on the Financial
Advice Market Review (FAMR), and Margaret Watmough, who leads the Financial Lives programme,
for their collective inputs.