the characterization and quantification … characterization and quantification of methanogenic and...
TRANSCRIPT

THE CHARACTERIZATION AND QUANTIFICATION OF METHANOGENIC AND
METHANOTROPHIC BACTERIAL COMMUNITIES ASSOCIATED WITH
PETROLEUM DEGRADATION
A thesis presented to the
Faculty of the Biological Sciences Department
California Polytechnic State University, San Luis Obispo
In Partial Fulfillment
of the Requirements for the Degree
Master of Science in Biological Sciences
by
Wendy Anjanette Phillips
October 2006

© 2006
Wendy Anjanette Phillips
All Rights Reserved

ABSTRACT
The Characterization and Quantification of Methanogenic and Methanotrophic Bacterial
Communities Associated With Petroleum Degradation
By
Wendy A. Phillips
Natural attenuation is contributing to the reduction of contaminant concentrations
in the environment through natural biological mechanisms at the former Guadalupe Dunes
Oil Field near Guadalupe, CA. While a large variety of microorganisms contribute to
natural attenuation processes, this study focused only on methanogenic and
methanotrophic bacterial communities associated with the Guadalupe Dunes aquifer.
Methane is commonly detected in petroleum-affected groundwater at Guadalupe,
but not above ground or in surface samples. This suggests that methanogens produce
methane under anaerobic conditions at this site and methanotrophs rapidly degrade it
before it reaches the surface. Therefore, the methanogenic and methanotrophic
communities at Guadalupe work together to complete the conversion of total petroleum
hydrocarbons (TPH) to CO2 in a combination of anaerobic and aerobic processes. This
study characterized the methanogenic and methanotrophic populations in groundwater
samples collected from the Guadalupe Dunes site. Soil samples were also collected from
the CP plume at this site to quantify the methanogenic and methanotrophic bacterial
communities associated with petroleum degradation.
Twenty-eight groundwater samples were collected from ten different dissolved
phase petroleum plumes which were analyzed for TPH and nutrients. Bacterial DNA from

these samples was analyzed by Terminal Restriction Fragment Length Polymorphism
(TRFLP) to characterize methanogenic and methanotrophic populations.
Methanogenic bacteria were only detected in groundwater samples with high TPH
concentrations. Two to three genera of methanogenic bacteria dominated methanogen
communities, but the distribution of these genera was not correlated with any physical or
chemical gradient in groundwater chemistry. Thus, the type of methanogen present in the
groundwater plumes is independent of groundwater chemistry.
In contrast, the distribution of methanotrophic bacteria was correlated with a redox
gradient in groundwater chemistry. Thus, the type of methanotroph varied with indications
of a redox gradient such as increasing methane and TPH, and decreasing oxygen
concentrations. As with methanogens two to three genera of methanotrophs dominated the
community.
Based on these results it appears that methanogens are actively producing methane
in the central, high TPH portions of groundwater plumes, while methanotrophs survive in
the oxygen rich peripheries metabolizing the dissolved methane before it diffuses to the
surface. Some populations of methanotrophs prefer lower methane and higher oxygen,
while others prefer higher methane and lower oxygen.
Quantitative PCR (qPCR) was used to measure the size of the methanogenic and
methanotrophic populations. Groundwater samples were not useful for qPCR due to
inherent sampling irregularities such as different amounts of suspended solids and different
filtration volumes. Soil samples, however, were appropriate for qPCR because sample
processing was easily standardized. Soil samples were collected from a vertical profile

above a large source of petroleum at the Guadalupe Dunes site. Samples were collected at
half foot intervals from 30.5 to 128.5 ft with the water table at 118 feet.
Methanogenic bacteria were detected in soil samples from 118 to 128.5 ft, with
maximum population numbers near 118 ft, at the groundwater/air interface. Shallower soil
samples collected above this depth showed a sudden and significant drop in methanogen
numbers, indicating that soils above the groundwater interface are too oxygen rich to
support methanogenic populations. Methanotrophic bacteria were detected from 30.5 to
120 ft., with maximum population numbers near 95 ft, which correlated with intermediate
levels of methane.
Results from this study suggest that the Guadalupe Dunes site supports a complex
population of both methanogenic and methanotrophic bacteria. Their presence actively
contributes to the natural attenuation processes occurring at the Guadalupe Dunes site.

ACKNOWLEDGEMENTS
I would like to thank Dr. Chris Kitts for all of his encouragement, technical expertise,
availability, and patience. I am always amazed at the amount of time he invests with each
of his students, and I am more grateful to him than I could ever possibly express. I would
also like to thank Drs. Raul Cano and Yarrow Nelson for their support and assistance with
the completion of my thesis. I am very grateful to them and all of the faculty in the
Biological Sciences Department who helped me mature from an undergraduate student into
an independent graduate researcher. I would also like to thank Unocal for providing the
financial support that made this and many other educational projects possible.
In addition to the above I would like to thank Andre Hsiung for his constant and
unwavering support. I am forever grateful for all of the opportunities he has provided me
with in the advancement of my professional career. Andre is a truly wonderful mentor and
a dear friend. I am also thankful to my fellow graduate students Anna Engelbrektson and
Kelly Wrighton for their support and friendship, and to my two dear friends Beckie
Hellwig and Darin Gabler for their amazing friendship and shared love of coffee breaks.
Lastly I’d like to thank the two people who have most impacted my life. My mother, who
has been an unwavering source of constant support and love, and my brother with whom I
share a very special and treasured bond. I would never have made it this far without either
of them in my life, and words cannot adequately express the depth of my love and
gratitude for them. Thank you David and Mom for all of your unwavering support, advice,
laughter, and love. I hope you both know how fortunate I feel to have you in my life.

TABLE OF CONTENTS
Page
List of Figures………………………………………………………………………....x
List of Tables…………………………………………………………………………xi
Introduction……………………………………………………………………………1
Methods and Materials………………………………………………………………...7
Principal Component Analysis of Hydrogeochemical Data….……………….7
DNA Extraction and PCR Amplification……………………………………..7
TRFLP Generation…………………………………………………..………...9
TRFLP Analysis……………………………………..………………………10
TRFLP Database Matching…………………………………………………..11
qPCR of Soil Samples……………………………………………………..…11
Results………………………………………………………………………………..14
Site Sampling – Groundwater Collection……………………...…………….14
Groundwater Chemical Analysis.…………….……………………………...16
Groundwater Chemical Analysis of DT Plume……………………………...17
PCR Amplification of the mcrA gene………………………………………..19
PCR Amplification of the pmoA gene……………………………...………..20
Methanogen mcrA TRFLP Patterns..……...…………………………………21
Methanotroph pmoA TRFLP Patterns...…...…………………………...……21
Effect of Groundwater Chemistry on Microbial Community Structure……..22
Influence of Groundwater Chemistry on Methanogens in the DT Plume…...23
Influence of Groundwater Chemistry on Methanotrophs in the DT Plume….23

Quantification of mcrA and pmoA in Soil Samples from the CP Site………26
Vertical Distribution of Methanogenic and Methanotrophic Bacteria…........27
Discussion……………………………………………………………………………29
References……………………………………………………………………………34

List of Figures
Figure Page
1. Guadalupe Dunes Regional Map………………………………………………...15
2. PCA Analysis of the Hydrogeochemical Data of the 10 Plumes………………...17
3. PCA Analysis of the Hydrogeochemical Data of DT Plume…………………….18
4. Gel Electrophoresis of Methanogenic DNA…………………………………..…19
5. Gel Electrophoresis of Methanotrophic DNA…………………………………...20
6. Example of mcrA TRFLP Pattern………….………..………………………..….21
7. Example of pmoA TRFLP Pattern…………….…………………………………22
8. PCA of mcrA TRFLP data from the DT Plume Samples………………………..24
9. Regression Analysis of mcrA PC1 and DT Chem PC1……………………….....24
10. PCA of pmoA TRFLP data from the DT Plume Samples…………………...…..25
11. Regression Analysis of pmoA PC1 and DT Chem PC1……………………...….25
12. qPCR Standard Curves for mcrA and pmoA…………………………………….26
13. Vertical Profile of Soil Gases and Populations of Methanogens and Methantrophs
……………………………………………………………………………………….28

List of Tables
Tables Page
1. Hydrogeochemical Data from Zymax Envirotechnology of DT Plume………..16

Chapter 1
INTRODUCTION
Environmental contamination can be tied to practices such as improper waste
disposal, storage, and transfer (2). When environmental contamination occurs, efforts are
usually made to remediate the affected area as soon as possible to prevent contaminants
from adversely affecting nearby wildlife and human populations. Unfortunately the
removal of environmental contaminants can be very labor intensive and expensive, and can
often result in its own set of environmental impact problems. Because of this, natural
attenuation has become a popular bioremediation option since it often offers an effective
and inexpensive alternative for pollutant removal at contaminated sites (1). Natural
attenuation relies on biological, chemical, and physical processes to contain and eliminate
the spread of contamination from its original source (3). This study focuses on the natural
attenuation processes occurring within petroleum affected soils and groundwater at the
Former Guadalupe Oil Field in California.
Recovery of oil from the Guadalupe Dunes site began in 1949 and continued until
the 1990s. Unfortunately the crude oil at this site was found to be extremely viscous with a
density comparable to that of asphalt at room temperature. The physical properties of
Guadalupe’s petroleum made it very hard to extract, so a petroleum thinner, referred to as
diluent, was pumped into the site to dilute the crude oil and make recovery easier (12).
This diluent was derived from the distillation of crude oil, whose specific chemical
composition varied, but was consistently similar to a mixture of kerosene and diesel (21).
As time progressed, the network of pipes that delivered diluent within the Guadalupe Oil
Field began to develop many substantial leaks. It has been estimated that approximately 8-

20 million gallons of diluent accidentally spilled out and contaminated 250 acres of this
site before the oil field was abandoned in the 1990s.
The Guadalupe Dune site is located in a unique and delicate environmental setting.
It is bordered on the south by the Santa Maria River, on the west by the Pacific Ocean, on
the north by Nature Conservancy-managed land, and on the east by agricultural land (12).
A total of three aquifers are located beneath the Guadalupe Dunes and dissolved petroleum
has been found in the uppermost dune sand aquifer. Groundwater in this aquifer is
estimated to flow at a rate of 0.3 m/day in an east to west direction resulting in dissolved
total petroleum hydrocarbons (TPH) flowing directly towards the Pacific Ocean and the
Santa Maria River. The rapid groundwater flow rate and permeable sand matrix has
resulted in groundwater contamination at the site, impacting numerous fragile land and
water ecosystems and threatening the welfare of many endangered species occupying this
area. Because of the depth of the groundwater, the fragile ecosystems involved, and the
presence of endangered species, natural attenuation was investigated as a remediation
solution for this site (13).
In order for natural attenuation to be considered as an acceptable remediation
method, regulatory agencies require evidence that clearly demonstrates sustainable
biodegradation (28). This evidence can include the detection of hydrocarbon degradation
intermediates, depletion of electron acceptors, microcosm studies, and a description of the
microbial community associated with hydrocarbon degradation (6, 28). At the Guadalupe
Dunes site subsurface methane has been detected which indicates the presence of an active
community of methanogenic bacteria. While these bacteria cannot utilize petroleum
hydrocarbons directly, they can utilize petroleum degradation products such as carbon

dioxide, hydrogen, and acetate for methane production (19). Therefore, methanogens
provide evidence that sustainable petroleum degradation is actively occurring at the
Guadalupe site. In addition to this, methane has not been detected above ground, which
indicates the presence of an active methanotrophic community. Methanotrophs degrade
methane into carbon dioxide and water, and must have a steady supply of methane
available for their survival (9). Therefore, methanotrophs provide additional evidence that
sustainable methanogenesis is occurring at the Guadalupe site, which in turn offers
evidence for sustainable natural attenuation.
Methanogenesis is commonly associated with organic material dissolved in
groundwater, since water acts as a physical barrier to rapid oxygen diffusion allowing for
the creation of anaerobic conditions (19). Since methanogenesis is the least energetically
favorable anaerobic process, all other electron acceptors such as oxygen, nitrate and
sulfate, must be completely depleted before this process occurs (20). Methanogenesis in
some bacteria can be driven by the oxidation of acetate, methanol, or formate. However,
Archaea derive energy from methanogenesis from the oxidation of molecular hydrogen
using carbon dioxide as a terminal electron acceptor. Archaea have a suite of unique
enzymes for the reduction of CO2 to methane that can serve as molecular markers for this
important group of methanogens. For the purpose of this study we’re focusing on the alpha
subunit of the methyl-coenzyme M reductase gene (mcrA). This functional gene is housed
in the methyl coenzyme-M reductase (MCR) complex where the reduction of a methyl
group occurs, resulting in the release of methane (19). This enzyme complex is both
unique and ubiquitous in all methanogenic Archaea (20).
In the absence of oxygen methane is very stable, but under aerobic conditions this
gas can be readily oxidized. Methane oxidation occurs through metabolic processes that
are unique to methanotrophic bacteria (9). The methanotrophs oxidize methane to CO2
through methanol, formaldehyde and formate intermediaries. For the purpose of this study
we focused on the methane mono-oxygenase gene (pmoA). This gene is associated with
the membrane bound pMMO complex unique to methanotrophic bacteria (9). The pMMO
enzyme oxidizes methane to methanol utilizing molecular oxygen (O2). This enzyme
complex is both unique and ubiquitous in all methanotrophic bacteria (9).
For this study culture-dependent methods were deemed too inaccurate and
unreliable. For the most part culture-dependent methods are time-consuming, use large
amount of materials, and are biased towards organisms that can survive in a laboratory
setting. In fact, approximately 0.1% of microorganisms present in soil or groundwater
samples can be successfully cultivated under laboratory conditions (15). Due to the
limitations associated with culture-dependent methodology, DNA based methods were
used exclusively in this study.
Terminal Restriction Fragment Length Polymorphism (TRFLP) was used to
characterize methanogenic and methanotrophic communities in Guadalupe groundwater
samples. This technique is based on the amplification of DNA with a primer set that
contains one fluorescently end labeled primer (15). The resulting amplified DNA is
digested with an appropriate restriction enzyme specific for the amplified gene target. Due
to variations in the target gene sequence, restriction sites for each species in the community
are usually different, resulting in different sized end labeled, “terminal restriction
fragments” (TRF) (21). These fragments are separated by size and detected in a DNA

sequencing machine resulting in a pattern of peaks that represent each TRF. The area under
each peak can be used to determine relative species abundance, and the location of each
peak can help indicate dominant genera in the community (20). The methanogenic
community was characterized using TRFLP of the mcrA gene, while the methanotrophic
community was characterized using TRFLP of the pmoA gene. Principal Components
Analysis (PCA) was used with the generated TRFLP data to evaluate trends in community
structure and hydrogeochemistry.
Although TRFLP can indicate dominant members of a community, it cannot be
used to quantify the absolute numbers of bacteria in a sample. To accomplish this,
methanogenic and methanotrophic bacteria were quantified by Quantitative PCR (qPCR)
of the mcrA and pmoA gene respectively. qPCR quantifies DNA by measuring the amount
of DNA produced during PCR amplification of a target gene. The method used in this
study required a fluorescent reporter molecule, SYBR Green, which intercalates into newly
synthesized double stranded DNA (dsDNA). As the amount of dsDNA product increases
so too does the fluorescence intensity. This intensity level is measured and recorded as
amplification occurs, and can later be used to calculate initial DNA concentrations in a soil
sample.
Therefore, the overall purpose of this study was to both characterize and quantify
methanogenic and methanotrophic populations at the Guadalupe Dune site. These two
groups of bacteria were selected because methanogenesis is a major contributor to
degradation and detoxification of Guadalupe’s petroleum affected soil and groundwater.
TRFLP analysis was performed on groundwater samples to provide information on
bacterial community structure and relative species abundance. qPCR was performed on

soil samples collected from the CP site to quantify the methanotrophic and methanogenic
populations. Also at the CP site a vertical profile of soil gas sampling wells nearby was
used to measure methane and oxygen levels present in the soil column.

Chapter 2
MATERIALS AND METHODS
Principal Components Analysis of Hydrogeochemical Data
Trends in the hydrogeochemical data generated by Zymax Envirotechnology were
visualized by Principal Component Analysis (PCA) using Minitab 14 (Minitab Inc., State
College PA). PCA is a rapid method for visualizing trends in multidimensional data that
serves to transform the data into new variables called the principal component scores.
These scores are constructed to represent the greatest variation in the data set. The first
principal component (PC) accounts for as much variation in the data as possible, and each
succeeding PC accounts for as much of the remaining variation as possible. PC scores are
generated by summing the total of all variables multiplied by their loading factors. A
meaningful result would be an obvious grouping or gradient of samples in a PCA plot.
The hydrogeochemical data set was adjusted prior to being imported into Minitab
14. Certain chemical variables were excluded due to a lack of data or accuracy in sampling
techniques. Half detection limit values replaced non-detect data. All variables were
normalized to Z scores to account for scaling (correlation matrix analysis). The final
chemical variable set included the following variables: TPH, BTEX, methane, oxygen,
hydrogen, carbon dioxide, nitrate, sulfate, ammonium, phosphate, dissolved iron, and pH.
DNA Extraction and PCR Amplification
Four liters of groundwater from each well of the 11 plumes were filtered through
0.2 µm nylon membrane filters. These filters were frozen until half of each filter was
removed and homogenized with liquid nitrogen. Samples were extracted using the MoBio
Ultraclean® soil DNA kit (MoBio® Laboratories Inc., Solana Beach, CA) following
manufacturer’s protocol. Success of each extraction was determined by measuring DNA
concentration in the extraction product with a Spectramax spectrophotometer (Molecular
Devices, Palo Alto CA).
Methanogenic bacteria were detected by amplifying the alpha subunit of the
methyl-coenzyme M reductase gene (mcrA) unique to all methanogens. This gene
produces the enzyme that catalyzes the reduction of methyl-coenzyme M, which leads to
the release of methane gas. The mcrA gene was amplified with the primer set MCRf and
MCRr (18). The MCRf primer was fluorescently labeled with a Cy5 phosphamide dye
(ProLigo LLC, Boulder, CO) and recognized the sequence 5′-
TAYGAYCARATHTGGYT-3′. The MCRr primer was an unlabeled reverse primer that
recognized the sequence 5′-ACRTTCATBGCRTARTT-3′. PCR was performed using the
following reagents: 10X Buffer, 10mM dNTP, 25mM MgCl2, 0.8 µg/ml BSA, PCR water,
and 5 U/ul AmpliTaq Gold (Applied Biosystems, Foster City, CA). Once a master mix was
created with these reagents, 49 µl was aliquot into a 96 well plate. Each groundwater
sample that had been previously processed was diluted to final concentration of 2 ng/µl
DNA and was then added to an individual well. The general PCR reaction protocol for the
mcrA primers involved the following temperatures and cycling: 95ºC for 10 min, 30 cycles
of 94ºC for 1 min, 45ºC for 1 min, and 72ºC for 2 min, followed by 72ºC for 10 min.
Successful PCR reactions were confirmed by gel electrophoresis with positive samples
showing a single band of approximately 470 base pairs.
Methanotrophic bacteria were detected by amplifying the methane monooxygenase
gene (pmoA) unique to all methanotrophs. This gene codes for the enzyme responsible for

the oxidation of methane to methanol, and was amplified with the primer set A189 and
A682 (11). The A189 forward primer was fluorescently labeled with a Cy5 phosphamide
dye (ProLigo LLC, Boulder, CO) and recognized the sequence 5′-
GGNGACTGGGACTTCTGG-3′. The A682 primer was an unlabeled reverse primer and
recognized the sequence 5′- GAASGCNGAGAAGAASGC-3′. PCR was performed using
the following reagents: 10X Buffer, 10mM dNTP, 25mM MgCl2, 0.8 µg/ml BSA, PCR
water, and 5 U/ul AmpliTaq Gold (Applied Biosystems, Foster City, CA). Once a master
mix was created 49 µl was aliquot into a 96 well plate. Each of the groundwater samples
that had been previously processed were diluted to 2 ng/µl DNA and were then added to an
individual well. The general PCR reaction protocol for the pmoA primers involved the
following temperatures and cycling: 95ºC for 10 min, 35 cycles of 94ºC for 1 min, 51.5ºC
for 1 min, and 72ºC for 1 min, followed by 72ºC for 10 min. Successful PCR reactions
were confirmed by gel electrophoresis with positive samples showing a single band of
approximately 525 base pairs.
TRFLP Generation
Three 50µl replicate PCR reactions were performed on each groundwater sample
with both respective primer sets. The excess primer, dNTPs, and MgCl2 were removed
using the MoBio Ultra Clean PCR cleanup kit (MoBio® Laboratories Inc., Solana Beach,
CA) following the manufacture’s protocol. Samples were washed with SpinClean solution
to remove any excess impurities before elution. The cleaned PCR product was eluted with
50µl of PCR water, and was quantified using a fluorometer (Bio-tek Instruments INC.,
Winooski, VT) tuned to the Cy5 labeling dye.
Methanogenic DNA (75 ng) was digested with 0.06µl of Sau96I enzyme (New
England Biolabs Inc., Beverly, MA), 4 µL of manufacturer recommended buffer and PCR
water to create a final volume of 40 µL. The Sau96I enzyme cut at sequences with
5′…G٧GNCC…3′. This digestion was incubated for 4 hours at 37ºC and deactivated for
20 min by incubation at 80ºC.
Methanotrophic DNA (75 ng) was digested with 0.5µl of HpaII enzyme (New
England Biolabs Inc., Beverly, MA), 4µl buffer, and PCR water to create a final volume of
40µl. The HpaII enzyme cut at sequences with 5′…C٧CGG…3′. This digestion was also
incubated for 4 hours at 37ºC and deactivated for 20 min by incubation at 80ºC.
Following digestion the methanogenic and methanotrophic DNA was purified by
ethanol precipitation. The purified DNA was dissolved in 20 µL of CEQ™ Sample
Loading Solution and 0.25 µL of CEQ™ DNA size standard-600 (Beckman Coulter Inc,
Fullerton, CA) and run on a CEQ™ 8000 (Beckman Coulter Inc, Fullerton, CA). Fragment
results were analyzed with CEQ™ 8000 Genetic Analysis System. TRF peaks were
aligned using the AFLP align function of the CEQ™ 8000 software.
TRFLP Analysis
Terminal Restriction Fragment (TRF) length in nucleotides, and TRF peak area
were exported from the CEQ8000 into Excel (Microsoft, Seattle WA). To standardize the
data for comparison between samples, the area under each TRF peak was normalized to
total amount of DNA analyzed and expressed as parts per million (ppm). Dominant peaks
were noted, and the data containing peak size and area were copied from Excel into
Minitab for subsequent statistical analysis. TRF peaks with an area of less than 10,000

ppm (<1.0% of the total for that sample) were excluded from analysis. The TRF data were
transformed by taking the square root of each TRF peak area to de-emphasize large TRF
peaks, while still taking relative abundance into account for Principle Components
analyses. Because all TRF variables are measured on the same scale, PCA was performed
without normalization (covariance matrix analysis).
TRFLP Database Matching
Tentative assignments of organism identity were made by comparison to a database
composed of TRF lengths predicted from approximately 30,000 gene sequences in the
Ribosomal Database Project and GenBank (22). In addition to these databases TRFLP
patterns were compared with published results using the same primer sets (9, 18).
Observed TRFs were matched to a database entry only if they fell within 2 base pairs of
the predicted TRF from the database (12).
qPCR of Soil Samples
Soil samples collected from the CP plume (Figure 1) were extracted using the
MoBio Ultraclean® soil DNA kit (MoBio® Laboratories Inc., Solana Beach, CA). The
extracted DNA was amplified with qPCR using a master mix of the following reagents:
SYBR Green PCR ReadyMix (Roche Laboratories), 25mM MgCl2, and PCR water. This
master mix was aliquot into individual qPCR tubes along with 2µl of DNA isolated from
one soil sample. Following qPCR amplification methanogenic and methanotrophic cells
were quantified by comparing their location to that of known quantity values on a
previously generated standard curve.

To create a methanogenic standard curve, controlled amounts of methanogenic
cells needed to be amplified with qPCR. Since cultivating methanogenic bacteria in a lab is
extremely difficult due to their anaerobic requirements, a pure sample of a methanogen
culture was ordered from the American Type Culture Collection (ATCC). Methanococcus
janneschi cells were ordered from ATCC with a known concentration of 1x10⁷ cells/µl.
This concentration was verified with a petroff-hauser counting chamber slide. Dilutions of
this suspension were prepared using 9 ml saline blanks to reach a final dilution of 1x10²
cells per milliliter. One ml aliquots were removed from each dilution and were spiked into
individual bead tubes from the MoBio Ultra Clean Soil DNA Extraction Kit (Mo Bio,
Solana Beach, CA). A gram of soil that was previously verified to be negative for
methanogenic bacteria was also added to the bead tubes to simulate normal soil sample
processing. Extractions were carried out as previously described and were quantified with
a 96-well spectrophotometer (Spectramax Plus, Molecular Devices, Sunnyvale, CA).
Following this procedure each sample was diluted to a concentration of 2ng/µl DNA to be
analyzed with the qPCR Smart Cycler® (Cepheid).
Methanogenic bacteria were quantified with the MCRf and MCRr primer set that
was were previously described (19). With qPCR however the MCRf primer was left
unlabeled so as to not interfere with SYBR green fluorescence. The mcrA primers were
amplified with the following temperatures and cycling times: 95ºC for 10 min, 30 cycles of
94ºC for 30 sec, 52ºC for 30 sec, and 72ºC for 30 sec, and 72ºC for 2 min followed by
72ºC for 10 min. Successful qPCR amplification was confirmed both visually by observing
fluorescent levels and by using a melt curve to verify true qPCR product. On a melt curve

false positives from primer-dimers were easily detected since these products have a much
lower melting point than true dsDNA product.
To prepare methanotroph qPCR standards, the methanotrophic bacterium
Methylomonas methanica was grown in the lab to a final concentration of 1x10⁸ cells/µl
(28). This concentration level was determined by direct microscopic count utilizing a
petroff-hauser counting chamber slide. Subsequent dilutions were performed using 9 ml
saline blanks to reach a final dilution of 1x10² cells. One ml was removed from each
dilution and spiked into individual bead tubes from the MoBio Ultra Clean Soil DNA
Extraction Kit (Mo Bio, Solana Beach, CA). A gram of soil that was previously verified to
be negative for methanotrophic bacteria was also added to the bead tubes to simulate
normal soil sample processing. Extractions were carried out as previously described and
were quantified with a 96-well spectrophotometer (Spectramax Plus, Molecular Devices,
Sunnyvale, CA). Each sample was then diluted to a concentration of 2ng/µl to be analyzed
with the qPCR Smart Cycler® (Cepheid). As previously described these samples were
used to construct a standard curve to which field samples were later compared to determine
cell quantity.
Methanotrophic bacteria were quantified by amplifying the methane
monooxygenase gene (pmoA) with the primers A189 and A682 (9). This method once
again utilized SYBR green as a marker dye to fluorescently label dsDNA products. With
qPCR the A189 primer was left unlabeled so as to not interfere with DNA quantification.
The general qPCR reaction protocol for the pmoA primers was the following temperatures
and cycling: 95ºC for 10 min, 30 cycles of 94ºC for 30 sec, 58.5ºC for 30 sec, and 72ºC for
30 sec, and 72ºC for 2 min followed by 72ºC for 10 min.

Chapter 3
RESULTS
Site Sampling – Groundwater Collection
Twenty-eight groundwater wells from ten different plumes of dissolved phase
diluent were sampled from the Guadalupe Dunes restoration site (Figure 1). These
groundwater samples were collected in sterile glass bottles after approximately 4 well
volumes of standing water was removed from the well via a submersible pump. Any
headspace in the bottle was carefully removed to maintain anaerobic conditions. Ground
water samples were immediately transferred to the laboratory and stored for less than 24
hours at 4°C until further chemical and biological processing could occur.
Additional groundwater samples were sent to Zymax Envirotechnology in San Luis
Obispo, CA for chemical analysis. Chemical analysis included the following variables:
dissolved TPH, acetate, benzene, ethylbenzene, toluene, xylene, methane, hydrogen,
ammonium, dissolved iron, oxygen, carbon dioxide, nitrate, sulfate, and phosphate. The
total concentration of benzene, toluene, ethylbenzene, and xylene were summarized
together as the variable BTEX. Chemical variables with concentrations consistently below
detection limits were excluded from analysis (Table 1). The hydrogeochemical data was
analyzed to look for trends across the plume profile, and later to summarize the data for
comparison to methanogenic and methanotrophic bacterial community TRFLP patterns.
Soil samples for qPCR analysis were collected from a vertical profile above a large
source of petroleum at the CP site in the Guadalupe Dunes (Figure 1). A vertical profile of
soil gas sampling wells nearby was used to measure methane and oxygen in the soil

column. Soil gases were measured by gas chromatography at an external lab (Inland
Empire Laboratories). Forty-five soil samples were collected at half-foot intervals from
30.5 to 32.5 feet and from 80.5 to 128.5 feet. Aliquots of each sample were given to
Yarrow Nelson at the EBI to assess methanogenic and methanotrophic activities in
microcosm experiments (24).
Figure 1: Guadalupe Dunes Regional Map
Geographical location of the ten dissolved phase groundwater plumes (colored
symbols) and wells (black triangles) that were sampled and analyzed. This map
also shows the natural flow of groundwater at this site in relation to the Pacific
Ocean and Santa Maria River (blue lines). The red circle indicates the DT plume
that was used for statistical analysis with methanotrophic and methanogenic
TRFLP patterns. The orange triangle indicates the CP plume where soil samples
were collected along a vertical profile for qPCR analysis.

Table 1. Hydrogeochemical Data from Zymax Envirotechnology of DT Plume.
Well Number
Distance to
Source
Screen Length TPH BTEX CH
4 NH4 Fe
2+ CO
2 O
2 SO
4 NO
3
EPA Method - -
EPA 8015
DIESEL
EPA 8260
EPA RSK SOP-175
EPA 350.1
EPA 6020
EPA RSK SOP-175
EPA RSK SOP-175
EPA 300.0
EPA 300.0
Units m m mg/L mg/L mg/L mg/L mg/L mg/L mg/L mg/L mg/L 204-A 140 6.1 2.3 ND 0.18 0.5 8.4 16.37 0.46 23 ND 206-C 51 6.1 4.25 ND 0.23 1.7 15 15.07 0.15 43 ND 207-B 744 6.1 0.46 ND 0.003 ND 0.39 5.52 6.41 59 7.52 209-C 44 6.1 14.5 28.15 7.83 3.7 38 17.72 0.28 2.8 ND 209-D 324 6.1 7.95 24.65 0.08 0.04 93 19.08 2.95 11 0.71 F4-1 343 4.6 1.35 ND ND 0.25 1.3 6.99 7.01 38 0.65 G3-1 134 4.6 10.5 22.4 5.88 0.83 16 13.46 1.5 20 ND G3-2 211 4.6 12.5 17.9 6.09 0.49 12 24 0.66 7.4 ND G4-3 131 4.6 7.05 134 2.85 0.31 2.7 16.31 2.1 4.4 ND H11-1 124 4.6 3 ND ND ND 0.38 11.8 1.5 24 0.33 H1-3 41 4.6 10.4 23.2 0.82 0.42 11 14.98 0.2 21 ND
ND, Non Detect -, Not Measured
Groundwater Chemical Analysis
Trends in the hydrogeochemical data generated by Zymax Envirotechnology were
visualized by Principal Component Analysis (PCA). This analysis created a new variable,
Chem. PC1, which consolidated 13 physical and chemical variables in the final data set.
Chem PC1 represented a parameter associated with TPH degradation that accounted for
48% of the variation in the physical and chemical data, while PC2 explained another 11%
of the variation left in the data set (Figure 2).

Figure 2: PCA Analysis of the Hydrogeochemical Data of the 10 Plumes
Wells are indicated in black, and hydrogeochemical variables are in blue. A
high negative Chem. PC1 value (e.g. wells H5-6, G3-2, 209-C) represents
anaerobic, lower redox, higher TPH environments. A high positive Chem. PC1
value (e.g. wells A8-8, F4-1, and 207-B) represents more aerobic, higher redox,
and lower TPH environments.
Different plumes may have been formed from source materials with differing
compositions. A separate analysis of the DT plume was performed below because it was
associated with the largest contaminant source at the Guadalupe Dune site and contained
the largest number of individual samples.
Groundwater Chemical Analysis of the DT Plume
When only the DT plume was analyzed the new variable, DT Chem. PC1,
accounted for 58% of the variation in hydrogeochemical data (Figure 3), as opposed to

48% for PC1 when all of the plumes were included (Figure 2). This indicates that plume-
to-plume variation of groundwater chemistry was significant. However, DT Chem. PC1
represented the same parameter associated with TPH degradation, a gradient from
anaerobic, lower redox, higher TPH environments to more aerobic, higher redox, and
lower TPH environments.
Figure 3: PCA Analysis of the Hydrogeochemical Data of DT Plume
Sample wells are in black and groundwater variables are in blue. A high
negative Chem. PC1 value (e.g. wells 209C, G3-2, 206-C) represents anaerobic,
lower redox, higher TPH environments. A high positive Chem. PC1 value (e.g.
wells 207-B, F4-1, and H11-1) represents more aerobic, higher redox, and
lower TPH environments.
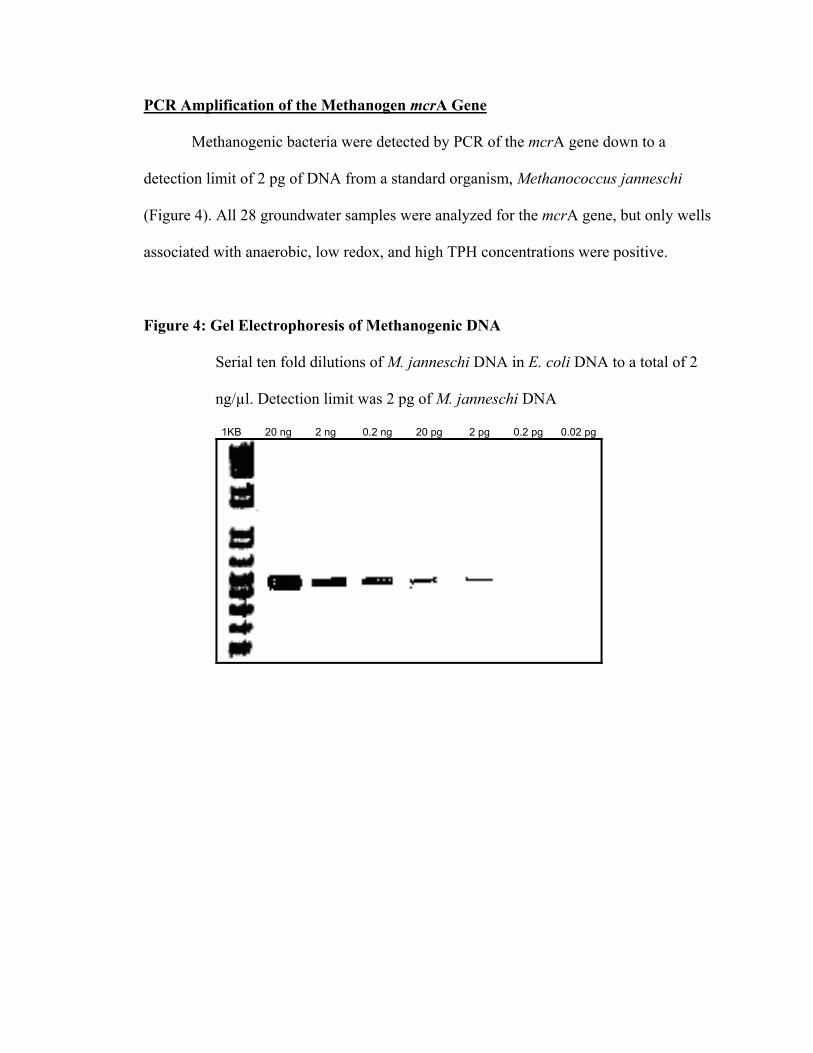
PCR Amplification of the Methanogen mcrA Gene
Methanogenic bacteria were detected by PCR of the mcrA gene down to a
detection limit of 2 pg of DNA from a standard organism, Methanococcus janneschi
(Figure 4). All 28 groundwater samples were analyzed for the mcrA gene, but only wells
associated with anaerobic, low redox, and high TPH concentrations were positive.
Figure 4: Gel Electrophoresis of Methanogenic DNA
Serial ten fold dilutions of M. janneschi DNA in E. coli DNA to a total of 2
ng/µl. Detection limit was 2 pg of M. janneschi DNA
1KB 20 ng 2 ng 0.2 ng 20 pg 2 pg 0.2 pg 0.02 pg
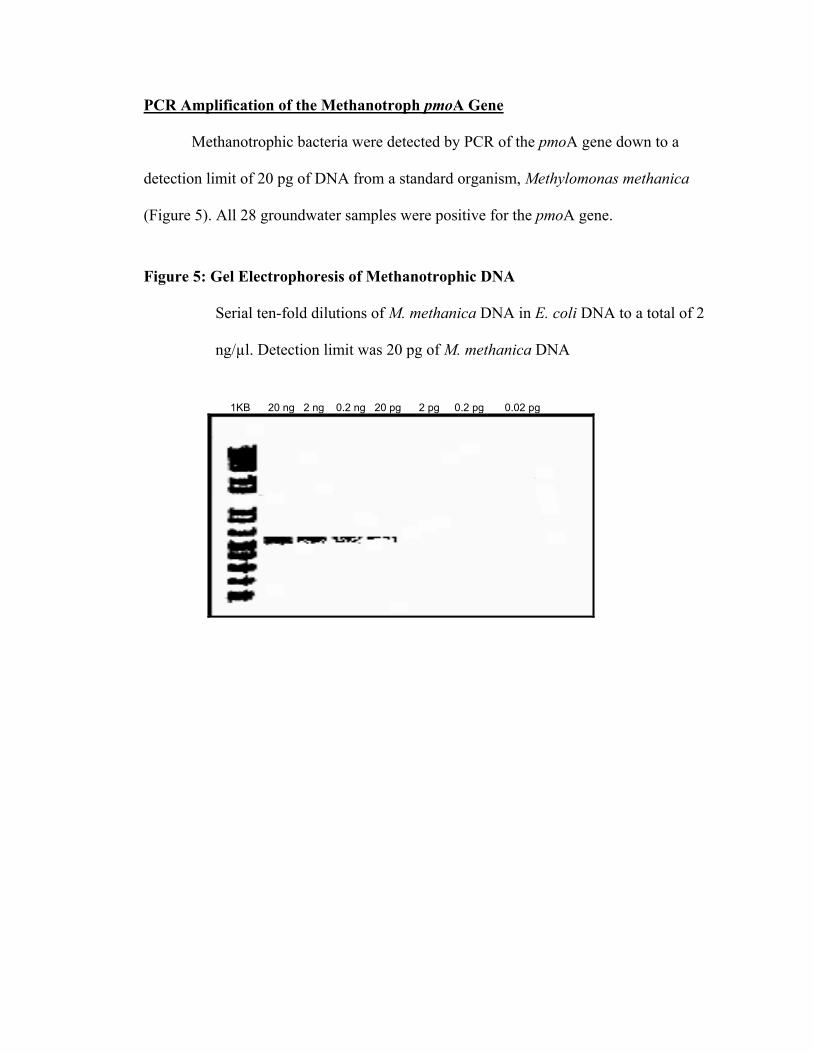
PCR Amplification of the Methanotroph pmoA Gene
Methanotrophic bacteria were detected by PCR of the pmoA gene down to a
detection limit of 20 pg of DNA from a standard organism, Methylomonas methanica
(Figure 5). All 28 groundwater samples were positive for the pmoA gene.
Figure 5: Gel Electrophoresis of Methanotrophic DNA
Serial ten-fold dilutions of M. methanica DNA in E. coli DNA to a total of 2
ng/µl. Detection limit was 20 pg of M. methanica DNA
1KB 20 ng 2 ng 0.2 ng 20 pg 2 pg 0.2 pg 0.02 pg

Methanogen mcrA TRFLP Patterns
Two to three genera dominated the methanogenic community in groundwater
samples positive for mcrA. Data base matching of the dominant TRF peaks indicated that
Methanococcus and Methanobacteracea spp. were the most commonly detected
methanogens (Figure 6).
Figure 6: Example mcrA TRFLP Pattern
McrA PCR product digested with the Sau96I enzyme. This sample is from well
G3-1 found in the DT plume and shows two pairs of dominant peaks
corresponding to Methanococcus and Methanobacteracea spp.
Methanotroph pmoA TRFLP Data
Similarly, two to three genera dominated the methanotrophic community in
groundwater samples positive for pmoA. Database matching of the dominant TRF peaks
indicated that Methylococcus and Methylosinus spp. were the most commonly detected
methanotrophic genera (Figure 7).
0
1000
2000
3000
4000
5000
6000
7000
8000
9000
10000
11000
12000
13000
50 100 150 200 250 300 350 400 450 500 550Size (nt)
Methanobacteracea spp.
Methanococcus spp.

Figure 7: Example of a pmoA TRFLP Pattern
PmoA PCR product digested with the HpaII restriction enzyme. This sample is
from well G3-1 in the DT plume and shows two dominant peaks corresponding
to Methylococcus and Methylosinus spp
The Effect of Groundwater Chemistry on Microbial Community Structure
Trends in the TRFLP data indicating methanogenic and methanotrophic bacterial
community structure were visualized by PCA. Potential relationships between bacterial
community structure and groundwater chemistry were investigated by comparing PCA of
the two data sets. No correlation could be detected between Chem. PC1 and either
methanogenic or methanotrophic bacterial community structure when all 28 wells were
included in the analysis (data not shown). Consequently, this analysis was repeated with
samples from the DT plume only.
0
5000
10000
15000
20000
25000
30000
100 150 200 250 300 350 400 450 500 550Size (nt)
Methylosinus spp.
Methylococcus spp.

Influence of Groundwater Chemistry on Methanogens in the DT Plume
PCA of methanogenic bacteria based on the mcrA TRFLP data showed some
clustering of the DT plume samples based on the relative abundance of dominant genera
(Figure 8). However, a regression analysis of the mcrA PC1 (Figure 8) with DT Chem PC1
(Figure 3) did not show a correlation (Figure 9). This indicates that different types of the
mcrA gene do not dominate under different groundwater conditions along the redox
gradient represented by DT Chem PC1.
Influence of Groundwater Chemistry on Methanotrophs in the DT Plume
PCA of methanotrophic bacteria based on the pmoA TRFLP data showed a
distribution of the DT plume samples based on the relative abundance of dominant genera
(Figure 10). This time, a regression analysis of the pmoA PC1 (Figure 10) with DT Chem
PC1 (Figure 3) showed a correlation (Figure 11). This indicates that different types of the
pmoA gene dominate under different groundwater conditions along the redox gradient
represented by DT Chem PC1.
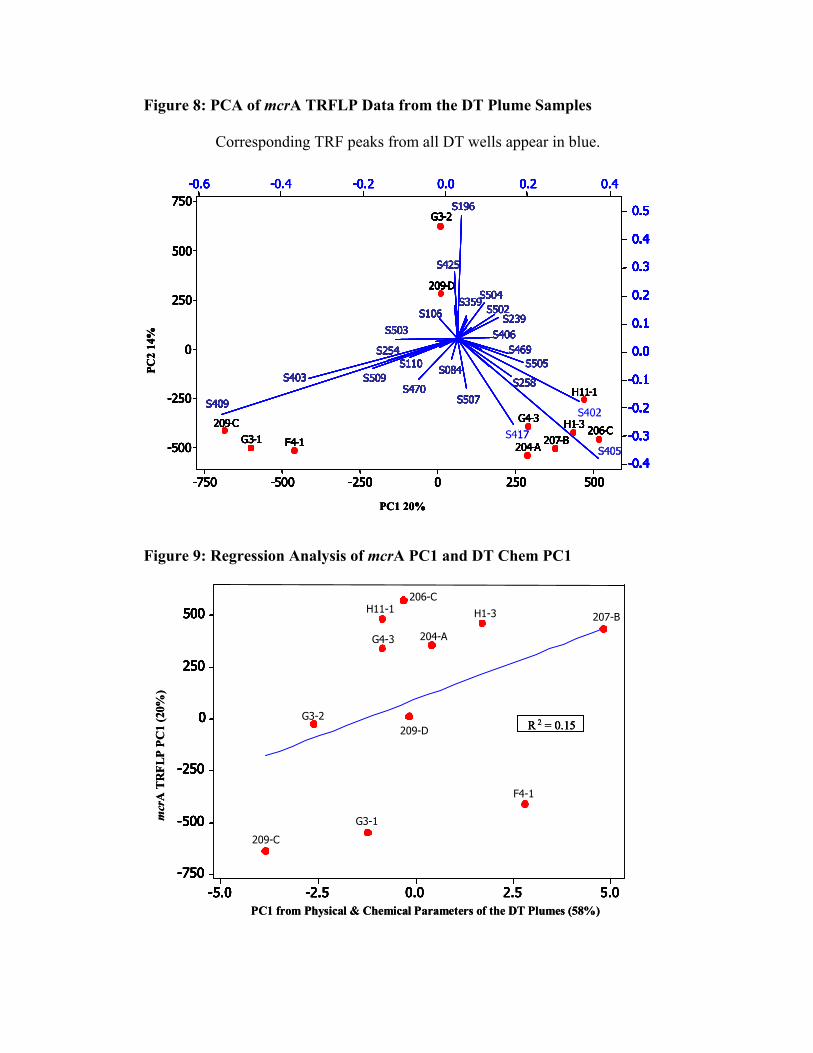
Figure 8: PCA of mcrA TRFLP Data from the DT Plume Samples
Corresponding TRF peaks from all DT wells appear in blue.
S509
S507
S505
S504
S503
S502
S470
S469
S425
S417
S409
S406
S403
S402
S359
S258
S254
S239
S196
S110
S106
S084
PC1 20%
5002500-250-500-750
750
500
250
0
-250
-500
H1-3
H11-1
G4-3
G3-2
G3-1 F4-1
209-D
209-C
207-B206-C
204-A
PC2
14%
0.40.20.0-0.2-0.4-0.6
0.5
0.4
0.3
0.2
0.1
0.0
-0.1
-0.2
-0.3
-0.4
S509
S507
S505
S504
S503
S502
S470
S469
S425
S417
S409
S406
S405
S403
S402
S359
S258
S254
S239
S196
S110
S106
S084
5002500-250-500-750
750
500
250
0
-250
-500
H1-3
H11-1
G4-3
G3-2
G3-1 F4-1
209-D
209-C
207-B206-C
204-A
0.40.20.0-0.2--0.6
0.5
0.4
0.3
0.2
0.1
0.0
-0.1
-0.2
-0.3
-0.4
0.5
0.4
0.3
0.2
0.1
0.0
-0.1
-0.2
-0.3
-0.4
0.4
0.3
0.2
0.1
0.0
-0.1
-0.2
-0.3
-0.4
S509
S507
S505
S504
S503
S502
S470
S469
S425
S417
S409
S406
S403
S402
S359
S258
S254
S239
S196
S110
S106
S084
PC1 20%
5002500-250-500-750
750
500
250
0
-250
-500
H1-3
H11-1
G4-3
G3-2
G3-1 F4-1
209-D
209-C
207-B206-C
204-A
PC2
14%
0.40.20.0-0.2-0.4-0.6
0.5
0.4
0.3
0.2
0.1
0.0
-0.1
-0.2
-0.3
-0.4
0.5
0.4
0.3
0.2
0.1
0.0
-0.1
-0.2
-0.3
-0.4
S509
S507
S505
S504
S503
S502
S470
S469
S425
S417
S409
S406
S405
S403
S402
S359
S258
S254
S239
S196
S110
S106
S084
5002500-250-500-750
750
500
250
0
-250
-500
H1-3
H11-1
G4-3
G3-2
G3-1 F4-1
209-D
209-C
207-B206-C
204-A
0.40.20.0-0.2--0.6
0.5
0.4
0.3
0.2
0.1
0.0
-0.1
-0.2
-0.3
-0.4
0.4
0.3
0.2
0.1
0.0
-0.1
-0.2
-0.3
-0.4
0.5
0.4
0.3
0.2
0.1
0.0
-0.1
-0.2
-0.3
-0.4
0.4
0.3
0.2
0.1
0.0
-0.1
-0.2
-0.3
-0.4
S417
S402
S509
S507
S505
S504
S503
S502
S470
S469
S425
S417
S409
S406
S403
S402
S359
S258
S254
S239
S196
S110
S106
S084
PC1 20%
5002500-250-500-750
750
500
250
0
-250
-500
H1-3
H11-1
G4-3
G3-2
G3-1 F4-1
209-D
209-C
207-B206-C
204-A
PC2
14%
0.40.20.0-0.2-0.4-0.6
0.5
0.4
0.3
0.2
0.1
0.0
-0.1
-0.2
-0.3
-0.4
S509
S507
S505
S504
S503
S502
S470
S469
S425
S417
S409
S406
S405
S403
S402
S359
S258
S254
S239
S196
S110
S106
S084
5002500-250-500-750
750
500
250
0
-250
-500
H1-3
H11-1
G4-3
G3-2
G3-1 F4-1
209-D
209-C
207-B206-C
204-A
0.40.20.0-0.2--0.6
0.5
0.4
0.3
0.2
0.1
0.0
-0.1
-0.2
-0.3
-0.4
0.5
0.4
0.3
0.2
0.1
0.0
-0.1
-0.2
-0.3
-0.4
0.4
0.3
0.2
0.1
0.0
-0.1
-0.2
-0.3
-0.4
S509
S507
S505
S504
S503
S502
S470
S469
S425
S417
S409
S406
S403
S402
S359
S258
S254
S239
S196
S110
S106
S084
PC1 20%
5002500-250-500-750
750
500
250
0
-250
-500
H1-3
H11-1
G4-3
G3-2
G3-1 F4-1
209-D
209-C
207-B206-C
204-A
PC2
14%
0.40.20.0-0.2-0.4-0.6
0.5
0.4
0.3
0.2
0.1
0.0
-0.1
-0.2
-0.3
-0.4
0.5
0.4
0.3
0.2
0.1
0.0
-0.1
-0.2
-0.3
-0.4
S509
S507
S505
S504
S503
S502
S470
S469
S425
S417
S409
S406
S405
S403
S402
S359
S258
S254
S239
S196
S110
S106
S084
5002500-250-500-750
750
500
250
0
-250
-500
H1-3
H11-1
G4-3
G3-2
G3-1 F4-1
209-D
209-C
207-B206-C
204-A
0.40.20.0-0.2--0.6
0.5
0.4
0.3
0.2
0.1
0.0
-0.1
-0.2
-0.3
-0.4
0.4
0.3
0.2
0.1
0.0
-0.1
-0.2
-0.3
-0.4
0.5
0.4
0.3
0.2
0.1
0.0
-0.1
-0.2
-0.3
-0.4
0.4
0.3
0.2
0.1
0.0
-0.1
-0.2
-0.3
-0.4
S417
S402
Figure 9: Regression Analysis of mcrA PC1 and DT Chem PC1
-
-
-
-
-
-
-
-
-
-
-
-
R2 = 0.15
5.02.50.0-2.5-5.0
500
250
0
-250
-500
-750
H1-3H11-1
G4-3
G3-2
G3 1
F4-1
209 D
209 C
207 B
206 C
204 A
R2 = 0.15R2 = 0.15
5.02.50.0-2.5-5.0
500
250
0
-250
-500
-750
H1-3H11-1
G4-3
G3-2
G3 1
F4
-2.5-5.0
500
250
0
-250
-500
-750
H1-3H11-1
G4-3
G3-2
G3 1
F4-1
209-D
209 C
207 B
206-C
204 A
R 2 = 0.15
-
-
-
-
-
-
-
-
-
-
-
-
-
-
-
-
-
-
-
-
-
-
-
-
R2 = 0.15
5.02.50.0-2.5-5.0
500
250
0
-250
-500
-750
H1-3H11-1
G4-3
G3-2
G3 1
F4-1
209 D
209 C
207 B
206 C
204 A
R2 = 0.15R2 = 0.15
PC1 from Physical & Chemical Parameters of the DT Plumes (58%)
mcr
A T
RFL
P PC
1 (2
0%)
R 2 = 0.15R 2 = 0.15
H1-3H11-1
G4-3
G3-2
G3-1
F4-1
209-D
209-C
207-B
206-C
204-A
R 2 = 0.15
-
-
-
-
-
-
-
-
-
-
-
-
R2 = 0.15
5.02.50.0-2.5-5.0
500
250
0
-250
-500
-750
H1-3H11-1
G4-3
G3-2
G3 1
F4-1
209 D
209 C
207 B
206 C
204 A
R2 = 0.15R2 = 0.15
5.02.50.0-2.5-5.0
500
250
0
-250
-500
-750
H1-3H11-1
G4-3
G3-2
G3 1
F4
-2.5-5.0
500
250
0
-250
-500
-750
H1-3H11-1
G4-3
G3-2
G3 1
F4-1
209-D
209 C
207 B
206-C
204 A
R 2 = 0.15
-
-
-
-
-
-
-
-
-
-
-
-
-
-
-
-
-
-
-
-
-
-
-
-
R2 = 0.15
5.02.50.0-2.5-5.0
500
250
0
-250
-500
-750
H1-3H11-1
G4-
-2.5-5.0
500
250
0
-250
-500
-750
H1-3H11-1
G4-3
G3-2
G3 1
F4-1
209-D
209 C
207 B
206-C
204 A
R 2 = 0.15
-
-
-
-
-
-
-
-
-
-
-
-
-
-
-
-
-
-
-
-
-
-
-
-
R2 = 0.15
5.02.50.0-2.5-5.0
500
250
0
-250
-500
-750
H1-3H11-1
G4-3
G3-2
G3 1
F4-1
209 D
209 C
207 B
206 C
204 A
R2 = 0.15R2 = 0.15
PC1 from Physical & Chemical Parameters of the DT Plumes (58%)
mcr
A T
RFL
P PC
1 (2
0%)
R 2 = 0.15R 2 = 0.15
H1-3H11-1
G4-3
G3-2
G3-1
F4-1
209-D
209-C
207-B
206-C
204-A
R 2 = 0.15

Figure 10: PCA of pmoA TRFLP Data from the DT Plume Samples
Corresponding TRF peaks from all DT wells appear in blue.
PC1 16%5002500-250-500-750
500
250
0
-250
-500
H11-1
G4-3
G3-2
G3-1
209-D 209-CPC2
13%
0.40.30.20.10.0-0.1-0.2-0.30.4
0.3
0.2
0.1
0.0
-0.1
-0.2
-0.3
-0.4
H538H537
H536
H324
H291
H258
H244
H243
H234
H228
H208
H207
H142
H134
H125
H122
H114
H107
H105
H092
H089H088
H078
H073
H070
H069
H068
H066
H057
0---
500
0
-250
H11-1
G4-3
G3-2
G3-1
209-D 209-C
0.40.30.0--0.2-0.3
0.3
0.1
0.0
-
-0.2
-
-
H536
H291
H258 H208
H207
H134
H125
H122
H114
H089
H078 H069
H068
PC1 16%5002500-250-500-750
500
250
0
-250
-500
H1-3
H11-1
G4-3
G3-2
G3-1
F4-1
209-D 209-C
207-B
206-C
PC2
13%
0.40.30.20.10.0--0.2-0.30.4
0.3
0.2
0.1
0.0
0.4
0.3
0.2
0.1
0.0
-0.1
-0.2
-0.3
-0.4
H538H537
H536
H324
H291
H258
H244
H243
H234
H228
H208
H207
H134
H125
H122
H114
H107
H092
H089
H078H069
H068
H057
0---
500
0
-250 G4-3
G3-2
G3-1
209-D209-D
0.40.30.0-0.2-0.3
0.3
0.1
0.0
-
-0.2
-
-
H536
H291
H258 H208
H207
H134
H125
H122
H121H114
H089
H078 H069
H068H075
H11-1
PC1 16%5002500-250-500-750
500
250
0
-250
-500
H11-1
G4-3
G3-2
G3-1
209-D 209-CPC2
13%
0.40.30.20.10.0-0.1-0.2-0.30.4
0.3
0.2
0.1
0.0
0.4
0.3
0.2
0.1
0.0
-0.1
-0.2
-0.3
-0.4
H538H537
H536
H324
H291
H258
H244
H243
H234
H228
H208
H207
H142
H134
H125
H122
H114
H107
H105
H092
H089H088
H078
H073
H070
H069
H068
H066
H057
0---
500
0
-250
H11-1
G4-3
G3-2
G3-1
209-D 209-C
0.40.30.0--0.2-0.3
0.3
0.1
0.0
-
-0.2
-
-
H536
H291
H258 H208
H207
H134
H125
H122
H114
H089
H078 H069
H068
PC1 16%5002500-250-500-750
500
250
0
-250
-500
H1-3
H11-1
G4-3
G3-2
G3-1
F4-1
209-D 209-C
207-B
206-C
PC2
13%
0.40.30.20.10.0--0.2-0.30.4
0.3
0.2
0.1
0.0
0.4
0.3
0.2
0.1
0.0
-0.1
-0.2
-0.3
-0.4
H538H537
H536
H324
H291
H258
H244
H243
H234
H228
H208
H207
H134
H125
H122
H114
H107
H092
H089
H078H069
H068
H057
0---
500
0
-250 G4-3
G3-2
G3-1
209-D209-D
0.40.30.0-0.2-0.3
0.3
0.1
0.0
-
-0.2
-
-
H536
H291
H258 H208
H207
H134
H125
H122
H121H114
H089
H078 H069
H068H075
H11-1
Figure 11: Regression Analysis of pmoA PC1 and DT Chem PC1
5.02.50.0-2.55.0
500
250
0
-250
-500
-750
209-C
PC1 from Physical & Chemical Parameters of the DT Plume (58%)
-
-
R2 = 0.561
H1-3
G4-3
G3-2
G3-1
F4-1
209-D
207-B
206-C
-
R2 = 0.561H11-1
pmoA
TR
FLP
PC1
(16%
)
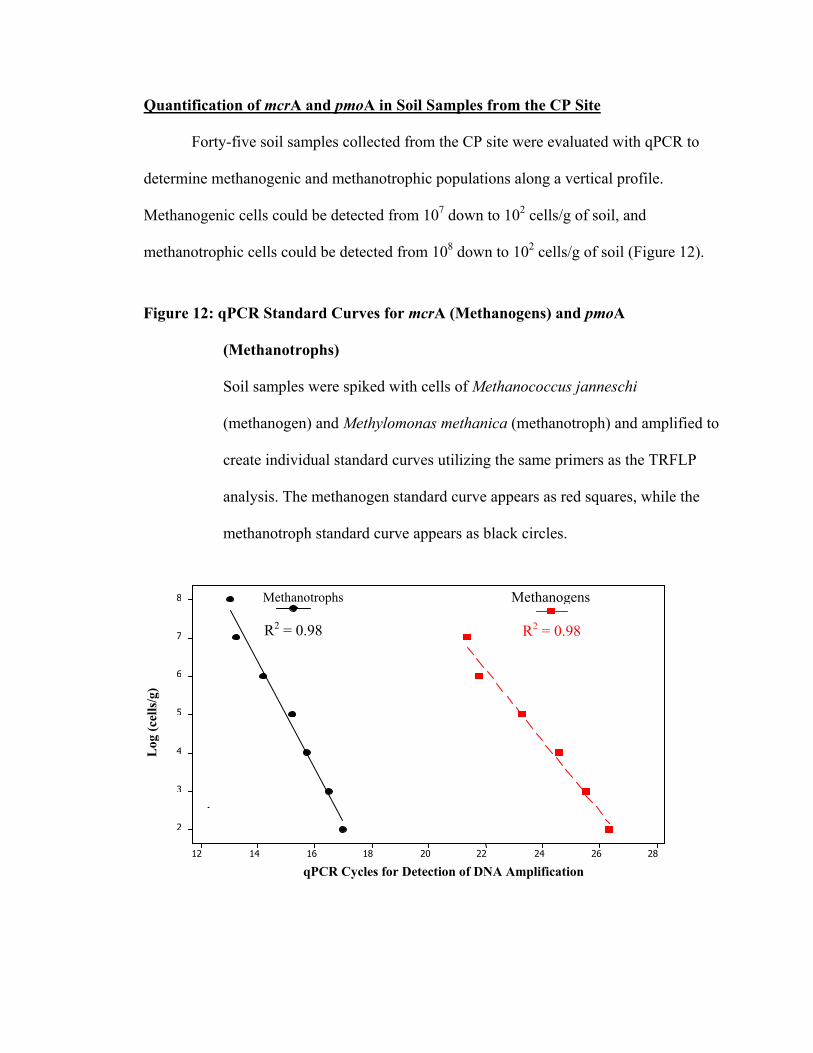
Quantification of mcrA and pmoA in Soil Samples from the CP Site
Forty-five soil samples collected from the CP site were evaluated with qPCR to
determine methanogenic and methanotrophic populations along a vertical profile.
Methanogenic cells could be detected from 107 down to 102 cells/g of soil, and
methanotrophic cells could be detected from 108 down to 102 cells/g of soil (Figure 12).
Figure 12: qPCR Standard Curves for mcrA (Methanogens) and pmoA
(Methanotrophs)
Soil samples were spiked with cells of Methanococcus janneschi
(methanogen) and Methylomonas methanica (methanotroph) and amplified to
create individual standard curves utilizing the same primers as the TRFLP
analysis. The methanogen standard curve appears as red squares, while the
methanotroph standard curve appears as black circles.
(
qPCR Cycles for Detection of DNA Amplification
Log
(cel
ls/g
)
2826 2422201816 14 12
8
7
6
5
4
3
2
Methanotrophs Methanogens
R2 = 0.98 R2 = 0.98
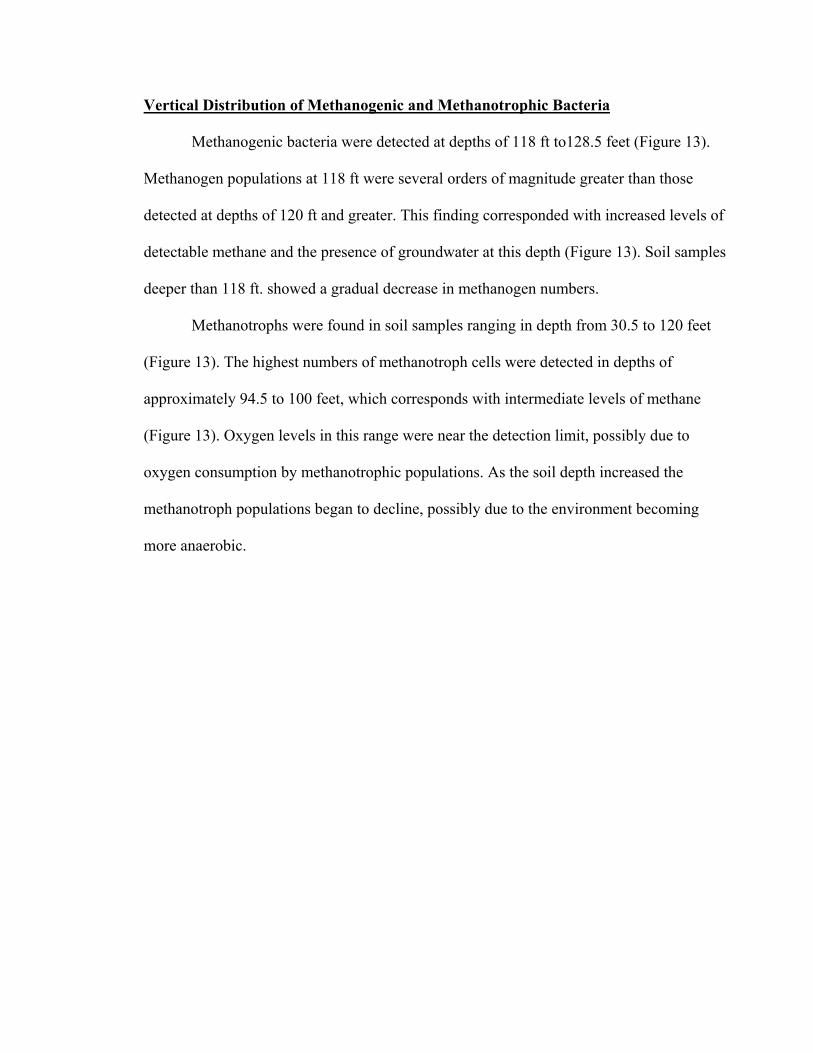
Vertical Distribution of Methanogenic and Methanotrophic Bacteria
Methanogenic bacteria were detected at depths of 118 ft to128.5 feet (Figure 13).
Methanogen populations at 118 ft were several orders of magnitude greater than those
detected at depths of 120 ft and greater. This finding corresponded with increased levels of
detectable methane and the presence of groundwater at this depth (Figure 13). Soil samples
deeper than 118 ft. showed a gradual decrease in methanogen numbers.
Methanotrophs were found in soil samples ranging in depth from 30.5 to 120 feet
(Figure 13). The highest numbers of methanotroph cells were detected in depths of
approximately 94.5 to 100 feet, which corresponds with intermediate levels of methane
(Figure 13). Oxygen levels in this range were near the detection limit, possibly due to
oxygen consumption by methanotrophic populations. As the soil depth increased the
methanotroph populations began to decline, possibly due to the environment becoming
more anaerobic.

Figure 13: CP Vertical Profile of Soil Gases and Populations of Methanogens and
Methanotrophs
Methane is not detected in measurable levels until soil depth increases (blue
triangles), while oxygen is detected at high levels in shallower depths and low
levels at deeper depths (green diamonds). Methanogens (red squares) and
methanotrophs (black circles) are included on this graph to show correlations
to soil gases.
Depth (ft)
L
140 120 1006040 20
9
8
7
6
5
4
3
2
1
0
20
15
10
5
0
Oxygen
MT log(cells)
Methane
MG log(cells)
80
Log
(cel
ls/g
)
Soil
Gas
(%)

Chapter 4
DISCUSSION
Analysis of Data from all 10 Groundwater Plumes
PCA was used to create new variables describing the major sources of variation in
both the hydrogeochemical data and the bacterial community data collected from all 10
groundwater plumes (Figure 2, TRFLP data not shown). Regression analysis of Chem PC1
vs. TRFLP PC1 showed no correlation for either mcrA or pmoA TRFLP data (data not
shown) indicating that hydrogeochemistry does not affect the methanogenic community
structure. One explanation for this lack of correlation may be the method used to collect
the groundwater. Samples were collected from wells with screens from 15 to 20 ft in
length. Before sampling, 4 well volumes were removed to homogenize the well water,
which resulted in disruption of any established vertical gradient. Thus, one sample could
contain bacteria from both aerobic and anaerobic groundwater zones in the surrounding
soil. Also each plume was generated by potentially different source material resulting in
additional variation (17). All of these factors may have contributed to the apparent lack of
relationship between redox gradients and bacterial community structure when data from all
10 plumes were analyzed.
Analysis of Data from the DT Plume
To decrease plume-to-plume variation, a single plume, DT, was chosen for further
analysis. Once again PCA was used to describe the major sources of variation in both the
hydrogeochemical data and the bacterial community data (Figures 3, 8, 10). Regression

analysis of DT Chem PC1 vs. TRFLP PC1 showed no correlation for mcrA data (Figure
9). Based on this finding it would appear that methanogen community structure has no
relationship to groundwater chemistry. Although methanogens do not utilize petroleum
hydrocarbons directly, the concentrations of methanogenic substrates, H2 and acetate, were
consistently non-detect and so could not contribute to analysis. As described above
because of mixing in the well before sampling it is possible that more subtle correlations to
hydrogeochemistry were missed.
Regression analysis of Chem PC1 vs. TRFLP PC1 showed a definite correlation for
pmoA data (Figure 11). This indicates that the distribution of dominant genera in the
methanotroph community is directly influenced by the area’s hydrogeochemistry. In
particular, there was a strong correlation with dissolved oxygen and methane in the
groundwater, possibly corresponding with the different types of methanotrophic bacteria.
Type I methanotrophs favor environments with limited methane and increased levels of
oxygen and nitrogen, while type II methanotrophs favor environments with high methane
levels and limited oxygen and nitrogen (7). Type I methanotrophs also prefer environments
with steady and sustained levels of methane, while type II methanotrophs can survive in
environments where methane levels are highly variable (7). Complete sequencing of the
rRNA genes from these samples is necessary though to confirm the presence and
dominance of type I and type II methanotrophs.
Tentative Identification of mcrA and pmoA Organisms in the DT Plume
The most common methanogen (mcrA) gene TRFs were 405 to 409 nucleotides in
length, and most likely represented Methanobacteracea spp. according to database

matching (19). Methanobacteracea spp. are dominant methanogens commonly isolated
from petroleum contaminated areas worldwide (18). The most common methanotroph
(pmoA) gene TRFs were 121, 134 and 207 nucleotides in length, and represented
Methylococcus spp. along with other unknown methanotroph species. Methylococcus spp.
are type I methanotrophs that are commonly isolated in areas with sustained methane
levels from either natural or pollutant sources (9). Since the dominant species in this area
are type I methanotrophs this provides evidence for constant methanogenesis at the
Guadalupe Dunes site.
qPCR of CP Soil Samples
qPCR was used to quantify methanotrophic and methanogenic bacteria because
TRFLP cannot be used to quantify the absolute numbers of bacteria in a sample. One of the
most crucial aspects of the qPCR process is constructing a standard curve for the target
populations (Figure 12). The choice of control organism used to construct a standard curve
must address the issue of gene copy number. Different species of methanogens have 1 to 4
copies of the mcrA gene in their genome, while methanotrophs can have 2 to 6 copies of
the pmoA gene. Thus, sample populations with gene copy numbers different from the
control organism may be misrepresented. Control organisms chosen for this study had an
average number of the selected target genes. Methanococcus janneschi has 2 copies of the
mcrA gene, the average number for cultured methanogenic bacteria. Methylomonas
methanica has 4 copies of the pmoA gene, the average copy number for most cultured
methanotrophic bacteria. In spite of these precautions the qPCR results from some of the
CP soil samples seemed inappropriately high. For example, 107 to 108 methanogen cells/g
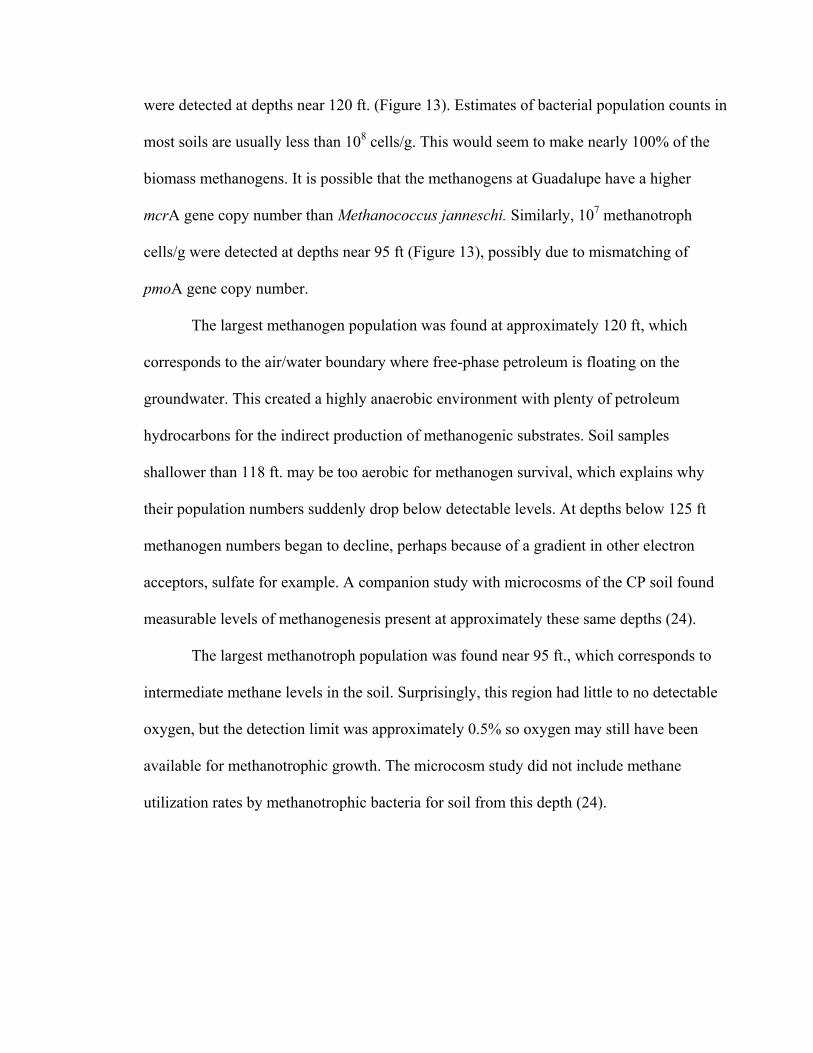
were detected at depths near 120 ft. (Figure 13). Estimates of bacterial population counts in
most soils are usually less than 108 cells/g. This would seem to make nearly 100% of the
biomass methanogens. It is possible that the methanogens at Guadalupe have a higher
mcrA gene copy number than Methanococcus janneschi. Similarly, 107 methanotroph
cells/g were detected at depths near 95 ft (Figure 13), possibly due to mismatching of
pmoA gene copy number.
The largest methanogen population was found at approximately 120 ft, which
corresponds to the air/water boundary where free-phase petroleum is floating on the
groundwater. This created a highly anaerobic environment with plenty of petroleum
hydrocarbons for the indirect production of methanogenic substrates. Soil samples
shallower than 118 ft. may be too aerobic for methanogen survival, which explains why
their population numbers suddenly drop below detectable levels. At depths below 125 ft
methanogen numbers began to decline, perhaps because of a gradient in other electron
acceptors, sulfate for example. A companion study with microcosms of the CP soil found
measurable levels of methanogenesis present at approximately these same depths (24).
The largest methanotroph population was found near 95 ft., which corresponds to
intermediate methane levels in the soil. Surprisingly, this region had little to no detectable
oxygen, but the detection limit was approximately 0.5% so oxygen may still have been
available for methanotrophic growth. The microcosm study did not include methane
utilization rates by methanotrophic bacteria for soil from this depth (24).
Guadalupe Dune Site Summary
Results from this study indicate that there are active populations of methanogens
and methanotrophs contributing to the natural attenuation processes occurring at the
Guadalupe Dunes site. Together these two groups are working synergistically to complete
the conversion of TPH to CO2 in a combination of anaerobic and aerobic processes. Thus,
the presence of these communities offers strong evidence for sustainable natural
attenuation at the Guadalupe Dunes site.

REFERENCES
1. Atlas R.M. 1991. Microbial Hydrocarbon degradation – Bioremediation of Oil Spills.
J. Chem. Tech Biotechnology 52: 149-156
2. Atlas, R. 1995. Petroleum Biodegradation and Oil Spill Bioremediation. Marine
Pollution Bulletin. 31: 178-182
3. Balba, M., Al-Awadhi, N. & Al-Daher, R. 1998. Bioremediation of Oil-Contaminated
Soil: Microbiological Methods for Feasibility Assessment and Field Evaluation.
Journal of Microbiological Methods. 32: 155-164
4. Blackwood, C.B., T. Marsh, S. Kim, and E.A. Paul. 2003. Terminal Restriction
Fragment Length Polymorphism Data Analysis for Quantitative Comparison of
Microbial Communities. Applied Environmental Microbiology. 69: 926-932.
5. Clement, B.G., L. E. Kehl, K. L. DeBord, and C. L. Kitts. 1998. Terminal Restriction
Fragment Patters (TRFPs), a rapid, PCR-based Method for the Comparison of
Complex Bacterial Communities. Journal Microbiology Methods 31: 135-142.
6. Dojka, M., Hugenholtz, P., Haack, S., Pace, N. 1998. Microbial Diversity in a
Hydrocarbon- and Chlorinated-Solvent-Contaminated Aquifer Undergoing Intrinsic
Bioremediation. Applied Environmental Microbiology. 64: 3869-3877.
7. Hanson, R. S., and T. E. Hanson. 1996. Methanotrophic Bacteria. Microbiology and
Molecular Biology Review. 60:439-471.
8. Hill, G., Mitkowski, N., Aldrich-Wolfe, L., Emele, L., Jurkonie, D., Ficke, A.,
Maldonado-Ramirez, S., Lynch, S. & Nelson, E. 2000. Methods for Assessing the
Composition and Diversity of Soil Microbial Communities. Applied Soil Ecology.
15: 25-36.
9. Horz, P., M. Yimga, & W. Liesack. 2001. Detection of methanotroph diversity of
roots of submerged rice plants by molecular retrieval of pmoA, mmoX, mxaF, & 16S
rRNA & ribosomal DNA, including pmoA-based terminal restriction fragment length
polymorphism profiling. Applied Environmental Microbiology. 67: 4177-4185.
10. Huesemann, M. 1994. Guidelines for Land-Treating Petroleum Hydrocarbon-
Contaminated Soils. Journal of Soil Contamination. 3: 299-318.
11. Kaplan, C.W., B.G. Clement, A. Hamrick, R. W. Pease, C. Flint, R. J. Cano, and C. L.
Kitts. 2003. Complex Co-substrate Addition Increases Initial Petroleum Degradation
Rates During Land Treatment by Altering Bacterial Community Physiology.
Remediation 13: 61-78.
12. Kaplan, C. W. and C. L. Kitts. 2004. Bacterial Succession in a Petroleum Land
Treatment Unit. Applied Environmental Microbiology. 70: 1777-1786.
13. Kleikemper, J., Pombo S., Schroth, M., Sigler, W., Pesaro, M., & Zeyer, J. 2005.
Activity and Diversity of Methanogens in a Petroleum Hydrocarbon-Contaminated
Aquifer. 71: 149-157.
14. Kitts, Christopher L. (California Polytechnic State University, San Luis Obispo).
2002-2006. Personal Communication.
15. Kitts, C. 2001. Terminal Restriction Fragment Patterns: A Tool for Comparing
Microbial Communities and Assessing Community Dynamics. Current Issues in
Intestinal Microbiology. 2: 17-25

16. Leahy, J. & Colwell, R. 1990. Microbial Degradation of Hydrocarbons in the
Environment. Microbiological Reviews. 54: 305-315.
17. Levine Frick Report. 1996 Remedial Action Plan to Address Separate-Phase and
Dissolved-Phase Diluent at the Guadalupe Oil Field, San Luis Obispo County, CA. p.
12.
18. Little, A. D. 1997. Guadalupe Oil Field Remediation and Abandonment Project,
Public Draft Environmental Impact Report (EIR), P.ES5-ES7. Department of
Planning and Building County Government Center. San Luis Obispo, CA.
19. Lueders, T., K. Chin, R. Conrad, & M. Friedrich. 2001. Molecular analyses of
methyl-coenzyme M reductase α-subunit (mcrA) genes in rice field soil and
enrichment cultures reveal the methanogenic phenotype of a novel archael lineage.
Environmental Microbiology 3: 194-204.
20. Lueders, T. and M. Friedrich. 2002. Evaluation of PCR amplification bias by terminal
restriction fragment length polymorphism analysis of small-subunit rRNA and mcrA
genes by using defined template mixtures of methanogenic pure cultures and soil
DNA extracts. Applied and Environmental Microbiology. 69: 320-326.
21. Macnaughton, S., Stephen, J., Venosa, A., Davis, G., Chang, Y. & White, D. 199
Microbial Population Changes During Bioremediation of an Experimental Oil Spill.
Applied and Environmental Microbiology. 65: 3566-3574.
22. Maidak, B. L., J. R. Cole, C. T. Parker, G. M. Garrity, N. Larsen, B. Li, T. G. Liburn,
M. J. McCaughey, G. J. Olsen, R. Overbeek, S. Pramanik, T. M. Schmidt, J. M.
Tiedje, and C. R. Woose. 1999. A New Version of the RDP (Ribosomal Database
project). Nucleic Acids Res. 27: 171-173.
23. Mills, H. J., R. J. Martinez, S. Story, and P.A. Sobecky. 2005. Characterization of
Microbial Community Structure in Gulf of Mexico Gas Hydrates: Comparative
Analysis of DNA- and RNA-Derived Clone Libraries. Applied Environmental
Microbiology. 71: 3235-3247.
24. Nelson, Yarrow. (California Polytechnic State University, San Luis Obispo). 2006.
Personal Communication.
25. Philip, J.C., A.S. Whitley, L. Ciric, and M.J. Bailey. 2005. Monitoring
Bioremediation, p. 245-255. In R.M. Atlas and J. Philip (ed.), Bioremediation Applied
Microbial Solutions for Real-World Environmental Cleanup. American Society of
Microbiology, Washington D.C.
26. Ramakrishnan, B., T. Leuders, T. Dunfield, R. Conrad, & M. Friedrich. 2001.
Archaeal community structures in rice fields from different geographical regions
before and after initiation of methane production. FEMS Microbiol Ecol 37: 175-186.
27. Schroeder, K. F. 2003. Monitoring Plan for Water Monitoring and Remediation
Activities at the Former Guadalupe Oil Field, p. 10-12. Regional Water Quality
Control Board, San Luis Obispo, CA.
28. Suzuki, M. T., and S. J. Giovannoni. 1996. Bias Caused by Template Annealing in the
Amplification of Mixtures of 16S rRNA Genes by PCR. Applied Environmental
Microbiology. 62: 625-630.
29. U.S. Environmental Protection Agency. 1999. Commonly Asked Questions
Regarding the Use of Natural Attenuation for Petroleum Contaminated Sites at
Federal Facilities. U.S. Environmental Protection Agency, Washington, D.C.
http://www.epa.gov.swerffrr.petrol.htm

30. Whittenbury R, Phillips KC and Wilkinson, JF. 1970. Enrichment, Isolation, and
Some Properties of Methane Utilizing Bacteria. Journal of General Microbiology. 61:
205–218.
31. Zwolinski, M.D., Schreiber, M.E., Bahr, J.M, Sewell, G. W. and Hickey, W.J. 1999.
Molecular Analysis of Microbial Community Structures in Pristine and Contaminated
aquifers: Field and Laboratory Microcosm Experiment. Applied and Environmental
Microbiology. 65: p. 2143-2150.
32. Special thanks to Andria Costell, Ph.D. from Syracuse University, NY and Peter
Dunfield, Ph.D. from h bMax-Planck Institute for Terrestrial Microbiology, Germany
for providing control methanotroph DNA.