the characterization of zsm-5 - pure - … ii contents general introduction .1 zeolite zsm-5 .1.1...
TRANSCRIPT

The characterization of ZSM-5 : a physical, catalytic andspectroscopic studyPost, J.G.
DOI:10.6100/IR23021
Published: 01/01/1984
Document VersionPublisher’s PDF, also known as Version of Record (includes final page, issue and volume numbers)
Please check the document version of this publication:
• A submitted manuscript is the author's version of the article upon submission and before peer-review. There can be important differencesbetween the submitted version and the official published version of record. People interested in the research are advised to contact theauthor for the final version of the publication, or visit the DOI to the publisher's website.• The final author version and the galley proof are versions of the publication after peer review.• The final published version features the final layout of the paper including the volume, issue and page numbers.
Link to publication
Citation for published version (APA):Post, J. G. (1984). The characterization of ZSM-5 : a physical, catalytic and spectroscopic study Eindhoven:Technische Hogeschool Eindhoven DOI: 10.6100/IR23021
General rightsCopyright and moral rights for the publications made accessible in the public portal are retained by the authors and/or other copyright ownersand it is a condition of accessing publications that users recognise and abide by the legal requirements associated with these rights.
• Users may download and print one copy of any publication from the public portal for the purpose of private study or research. • You may not further distribute the material or use it for any profit-making activity or commercial gain • You may freely distribute the URL identifying the publication in the public portal ?
Take down policyIf you believe that this document breaches copyright please contact us providing details, and we will remove access to the work immediatelyand investigate your claim.
Download date: 19. May. 2018

THE CHARACTERIZATION OF ZSM-5
A PHYSICAL, CATALYTIC AND
SPECTROSCOPIC STUDY
TER VERKRIJGING VAN DE GRAAD VAN DOCTOR IN DE
TECHNISCHE WETENSCHAPPEN AAN DE TECHNISCHE
HOGESCHOOL EINDHOVEN, OP GEZAG VAN DE RECTOR
MAGNIFICUS, PROF. DR. S.T.M. ACKERMANS, VOOR
EEN COMMISIE AANGEWEZEN DOOR HET COLLEGE
VAN DEKANEN IN HET OPENBAAR TE VERDEDIGEN OP
DINSDAG 12 JUNI 1984, TE 16.00 UUR
DOOR
JOSEPH GEORGE POST
I
GEBOREN TE VENLO

Dit proefschrift is goedgekeurd door de promotoren:
prof. dr. ir. J.H.C. van Hooff
prof. dr. R. Prins
I
II
CONTENTS
GENERAL INTRODUCTION
.1 Zeolite ZSM-5
.1.1 Structure
.1.2 Catalyst
.2 Scope of this thesis
.2.1 The aim of this work
.2.2 The plan of this thesis
.3 References
SYNTHESIS OF ZEOLITE ZSM-5
Page
1
9
9
11
12
12
13
14
16
.1 Introduction 16
.2 Experimental 17
.2.1 Synthesis 17
.2.2 Characterization of the crystallization 19
product
.3 Discussion
.4 References
24
28
III ACIDITY AND ACTIVITY OF ZEOLITE H-ZSM-5
.1 Introduction
30
30
31
34
34
36
41
45
47
.2 Experimental
.3 Results and discussion
.3.1 n-Hexane cracking
.3.2 NH3-TPD
.4 Curve fitting
.s Conclusions
.6 References

IV STRUCTURAL CHARACTERIZATION OF ZSM-5
BY MAGIC-ANGLE-SPINNING NMR
.1 Introductlon
.2 Experimental
.3 Results and discussion
.3.1 Curve deconvolution of the 29Si NMR
spectra of silicalite
.3.2 29Si and 27Al NMR spectra of ZSM-5
.4 Conclusions
.5 References
V DEACTIVATION OF ZEOLITE CATALYSTS
VI
BY COKE FORMATION
.1 Introduction
.2 Experimental
.3 Results
.4 Discusion
.5 Conclusions
.6 References
INFRARED SPECTROSCOPY ON ZSM-5
.1 Introduction
.2 Experimental
.3 Results and discussion
.4 Conclusions
.5 References
VII FINAL REMARKS
SUMMARY
SAMENVATTING
DANKWOORD
CURRICULUM VITAE
48
51
51
52
52
56
58
59
61
61
63
63
67
70
71
73
73
75
75
83
85
87
90
92
94
95

- 1 -
CHAPTER I GENERAL INTRODUCTION
This thesis deals with zeolites wich have been defined
by J.V. Smith in the following way (1): "A zeolite is an
aluminosilicate with a framework structure enclosing cavities
occupied by large cations and water molecules, both of wich
have considerable freedom of movement permitting ion-exchange
and reversible dehydration."
Zeolites are not a new class of compounds as often is
thought but are already known as·minerals for more than three
centuries. For long time zeolites were was not more than a
scientific curiosity but around 1935 R.M. Barrer suggested
(2) the idea that their porous structure could make them
suitable for the adsorption of gases and started research in
this field. With this he laid the foundation for the
practica' application of zeolites.
The preparation of the first synthetic zeolite by co
workers of the Union Carbide corporation around 1950 meant an
important break-through in this development (3). From an
aqueous solution of sodiumsilicate and sodiumaluminate they
synthesized the new zeolite A. This zeolite, like all other
zeolites, consists of Si04 and Al04 tetrahedra that share
corners to form a three dimensional framework structure
enclosing cavities. Characteristic for zeolite A is a Si/Al
atomic ratio of 1 and the presence of two types of
interconnected cavities:
1 The so called sodalite cages with a diameter of 6.6 A and an opening of 2.2 A.

- 2 -
a b c
Fig. 1 The stuature of a) the sodalite unit and their arangements
in b) zeolite A and a) zeolite X/Y.
ii The supercages with a diameter of 11 A and openings of
4. 2 A, formed by 8 membered rings of the SiO 4
and AlO 4
tetrahedra (see fig. 1).
After dehydration, these cavities are accessible for gas
molecules that can pass the windows, i.e. molecules with a
diameter smaller than 4.2 Jl., So zeolite A makes it possible
to seperate a mixture of small and large molecules by
selective adsorption of the small molecules: it acts as a
molecular sieve. For example: small water molecules can
selectively be seperated from large gas molecules. This was
the first commercial application: the drying of refrigerants
of household ~efrigerators. Later on, this has been followed
by several other applications in separation and purification
processes.
The next step in the development was the invention of
the zeolites X andY again by Union Carbide (4). The main
difference between these zeolites and zeolite A is the more
open structure with supercages with a diameter of 13 A and
openings of 7.4 A formed by rings of 12 SiO 4 and AlO 4 tetra
hedra (see fig. 1). This makes these zeolites accessible even
to relatively large molecules like branched paraffins and
aromatics. Another difference is the lower Al content. The
- 3 -
typical Si/Al ratio for zeolite X is 2.5 and for zeolite Y
5, which causes an increasing chemical and thermal stability.
The main application of these zeolites is not in adsorption
but in catalysis, initiated by the recognition of the acidic
properties of the hydrogen (H+) or multivalent cation (Mg2+
or Rare Earth3+) forms of zeolite X and Y. A zeolite Y
catalyst, introduced by Union Carbide in 1959 (5), for the
isomerization of n-paraffins, was the first of a series of
molecular sieve based catalysts for the petroleum industry.
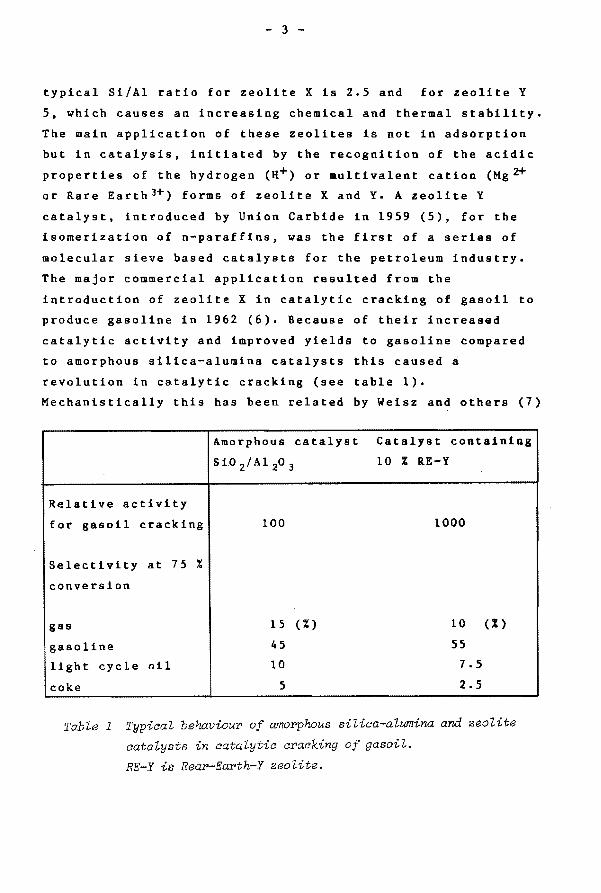
The major commercial application resulted from the
introduction of zeolite X in catalytic cracking of gasoil to
produce gasoline in 1962 (6). Because of their increased
catalytic activity and improved yields to gasoline compared
to amorphous silica-alumina catalysts this caused a
revolution in catalytic cracking (see table 1).
Mechanistically this has been related by Weisz and others (7)
Amorphous catalyst Catalyst containing
SiD 2/Al 20 3 10 % RE-Y
Relative activity
for gasoil cracking 100 1000
Selectivity at 75 %
conversion
gas 15 (%) 10 (%)
gasoline 45 55
light cycle oil 10 7.5
coke 5 2.5
Table 1 Typical behaviour of amorphous silica-alumina and zeolite
catalysts in catalytic cracking of gasoil.
RE-Y is Rear-Earth-Y zeolite.

- 4 -
to the more efficient hydrogen redistribution between hydro
carbon molecules over zeolite catalysts.
Developments since 1962 in zeolite catalytic cracking
have occurred both in materials and processes. Zeolite X has
been replaced essentially by the more stable and active
zeolite Y. Process innovations to u~ilize the unique proper
ties of zeolites include concepts based on short contact
riser cracking and have led to some proprietary engineered
designs based on zeolite catalysts, which are now in
commercial use (8). An economic study published in 1966 (9)
estimated that the savings to refiners alone, from use of
zeolite cracking catalysts over the older amorphous forms,
were $ 250 million per year.
Other established industrial processes that use zeolite
based catalysts in addition to catalytic cracking are hydro
cracking and paraffin isomerization (10). All are based on
the unique properties of zeolite catalyst which have in
common: extremely high strength acid sites and selectivities
related to strong adsorptive forces within the zeolite.
The addition of alkylammonium cations to the synthesis
gels was the next major advance in the synthesis of new
zeolite materials. Barrer et al. (11) first reported the
synthesis of zeolite N-A a more siliceous analog of zeolite
A, by adding tetramethylammonium cations to sodium
aluminosilicate gels. Later on, analogs of zeolites B, X and
Y were also synthesized (12). Thus the first effect of the
addition of alkylammonium cations was to generate more
sileceous framework compositions of previously known
structure types. Subsequently addition of alkylammonium
cations to sodium- aluminosilicate gels led to the
crystalizati~n of new zeolite structure types. In the recent
work by Mobil R & D scientists the addition of tetrapropyl
ammonium (TPA) and tetrabutylammonium (TBA) to higly
siliceous gels (Si/Al = 10 - 100) resulted in the high silica
zeolites ZSM-5 (13) and ZSM-11 (14). The addition of alkyl
ammonium to pure silica synthesis gels ultimately resulted in

- 5 -
silica molecular sieves: silicalite with TPA (15) and
silicalite-2 with TBA (16).
In contrast to the "low" and "intermediate" silica
zeolites, representing heterogeneous hydrophylic surfaces
within a porous crystal, the surface of high stlica zeolites
approaches a more homogeneous characteristic with an organo
phylic- hydrophobic selectivity. They more strongly adsorb
the less polar organic molecules and only weakly interact
with water and other polar molecules. Another important
fe&ture of this new class of zeolites is the unique crystal
structure with 5.5 A pores outlined by 10 membered rings of
tetrahedra. As ilustrated in fig. 2 this pore size is just in
the range of the dimensions of some important groups of
reactant or product molecules and so reactions with these
molecules may be submitted to shape selectivity effects.
Examples of commercial or near commercial applications
kinetic diameter
1-----
o-xylene m-xylene -
& --p-xylene toluene-benzene
1.-paraffins-
s ------
n-paraffins-·-n Fig. 2 Schematic representation of the pore dimensions of some
important zeolites and the kinetic diameter of several
molecules.

- 6 -
of shape selective catalysis are:
i The selectoforming process in which an offretite
er~onite type catalyst is used for selective hydro
cracking of the n-paraffin components of catalytic
reformate to increase the octane number of the remaining
gasoline (17).
ii The catalytic dewaxing of gasoil by a selective hydro
cracking proces employing a large pore mordenite
containing single channels approximately_ 7 A in
diameter which provide for the wanted selectivity (10).
iii The isomerization of C8 aromatics to produce
isomerically pure xylenes, especially para-xylene for
polyester manufacture, using ZSM-5 (10).
iv The synthesis of ethylbenzene for styrene production
also using ZSM-5 (10).
v The conversion of methanol to gasoline, also with ZSM-5
(18).
During and after the oil crisis, in the early 70's, this
latter application of ZSM-5 has recieved much attention
because it presents a new route from coal or natural gas to
motor fuel. The first commercial plant for the production of
gasoline from natural gas using this process is under
construction in New Zealand (19). The advantages of this so
called MTG process compa~ed to the older Fischer-Tropsch
process are illustrated in table 2 (18, 20). Both yield and
quality of gasoline obtained with the MTG process are
superior to that of the Fischer-Tropsch process.
It is because of these promissing properties that at the
Eindhoven University of Technology research in this field was
started in 1977. The first objective was to elucidate the
mechanisms of the reaction that take place during the con
version of methanol to.gasoline. The results of this have
been reported in the thesis of J.P. van den Berg (21). But
still many qu sti~ns about this process and especially about
the used catalyst ZSM-5 are unanswered, which led to the
investigations reported in this thesis.

- 7 -
Col!lposition of Fischer-Tropsch process MTG
reaction product fixed-bed fluid-bed
light gases (C 1+C 2) 11 23 2
LPG (C 3+C
4) 11 29 22
gasoline (CS-C!O) 25 34 76
fueloil (>C s> 51 5 -oxygenates 2 9 -
octane number ~7 5 -7 5 -95
Table 2 Comparisan of the product distribution of the Fischer
Tropsch and MTG processes.
However, before we start with the description of this
subject, the latest development in zeolite application must
be mentioned, the application of zeolites as builders in
detergents. This single potentially largest ion exchange
application is ironically in the water softening area, the
ion exchange application originally considered in the 50's.
It became a commercial reality due to two changed factors.
Firstly, its present use as builder in detergents, to soften
water, is non-regenerative and therefore the main earlier
disadvantage in regeneration as evaluated in the 50's is
absent. Secondly, there are currently a number of areas in
the world in which the use of phosphate builders is
restricted for environmental reasons. Zeolite A, in powder
form, provides the same function as phosphates, the removal
of hardness ions Ca 2+ and Mg2+ from the wash water. The
market in the detergent area is reported to be approximately
50,000 tons of zeolite A in 1980 (22) and an optimistic
projection for growth to a 200,000 tons market in 1984 (23).
These figures must be compared with a market for cracking
catalysts of approximately 250,000 tons which, with an
- 8 -
average zeolite content of about 20 %, accounts for 50,000
tons of zeolite Y.
z a ·f
c
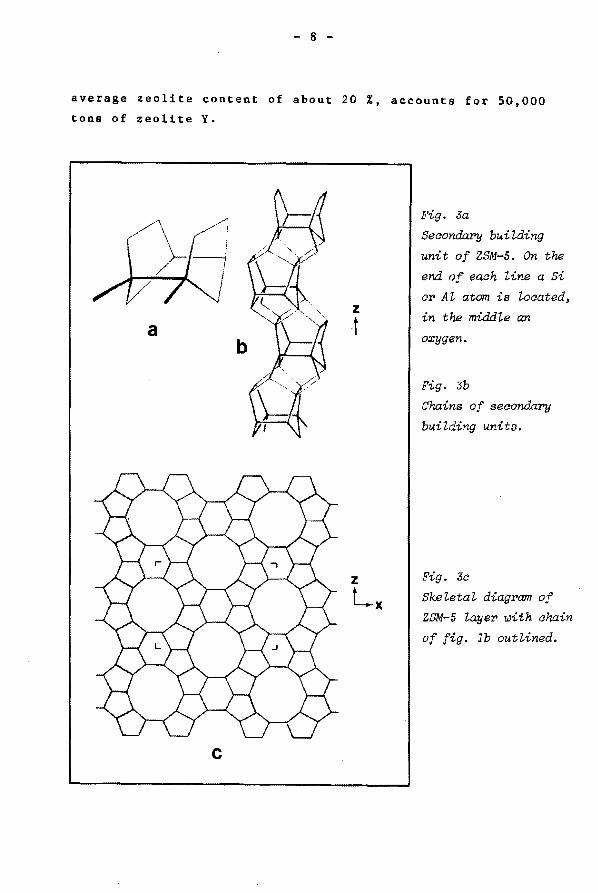
Fig. Ja
Secondary bui~ding
unit of ZSM-5. On the
end of each line a Si
or Al atom is located,
in the middle an
oxygen.
Fig. 3b
Chains of secondary
building units.
Fig. 3a
Skeletal diagram of
ZSM-5 layer ~ith chain
of fig. lb outlined.

- 9 -
I.l ZEOLITE ZSM-5
I.l.l STRUCTURE
As alrea4y mentioned zeolite ZSM-5 was discovered by
Argauer and Landolt (13). It is a high silica zeolite with a
Si/Al ratio that can range from 12 to ~. The framework can be
constructed from a building unit consisting of 12 tetrahedra
as is shown in fig. 3a (24). Applying a twofold screw axis to
this unit a chain is formed in the [001] direction (fig. 3b).
By mirror operation in the [010] direction a layer is
obtained (fig. 3c). In this layer the pore openings are
already visible. They are formed by a 10 membered ring of
tetrahedra and have an opening of about 5.5 A. By inversion
of the layers in the [100] direction the three dimensional
structure of ZSM-5 is created (fig. 4). In the mirror
direction ([010])straight channels ~reformed and in the
inversion direction( [100]) sinusoidal channels, with pore
diameters of 5.4 x 5.6 A and 5.1 x 5.5 A, respectively. On
the contrary the framework of ZSM-11 is formed by mirror
operation in both the (100] and [010] direction, which
results in straight channels in both directions. Intergrowths
Fig. 4 2-dimensional plot of ZSM-5.

- 10 -
between ZSM-5 and ZSM-11 are obvious and are indeed observed
with very sophisticated high resolution transmission electron
microscopy (25).
The two channel systems are interconnected as
schematically is shown in fig. 5. In this way a three
dimensional poresystem is formed. This is the explanation for
the high accessibility of every place in the pores. Although
fig. 5 suggests a system of channels and cross-sections, the
channels are formed by direct neighbouring cross-sections. So
every Si or Al atom is located at a cross-section.
The unit cell composition of ZSM-5 is: Nan(Aln Si 96 _no 192 > wherein n can range from about 8 to 0. If n is 0 we have an
Al free ZSM-5, which is called silicalite. This material
possesses no acidic properties and in contrast to the Al
containing ZSM-5 it is strongly hydrophobic (26). Its use as
a model compound will be discussed in this thesis.
The lattice of ZSM-5 is stable at high temperatures,
at least up to 9oooc and in strong acidic environment.
a b
Fig. 5 Schematic Pepresentation of the pore system of
a) ZSM-5 and b) ZSM-11.

- 11 -
1.1.2 CATALYST
The positioning of an Al3+ instead of a Si 4+ ion at
a tetrahedral site causes a positive charge deficit. This
is compensated by a cation. After synthesis and calcination
this can be Na+, K+ or H+. These cations are not incorporated
in the lattice but are located in the pores in the
neighbourhood of the Al atom. Na+ and K+ can be exchanged by
H+ (as will be described in chapter II) to obtain H-ZSM-5
which can act as an acidic catalyst. By heat treatment these
Br~nsted acid (proton donating) sites can be converted to
Lewis acid (electron accepting) sites as is shown in fig. 6.
This dehydroxylation of the lattice usually does not
occur below 6ooOc (27,28).
The main catalytic properties of H-ZSM-5 are :
- High catalytic activity due to the high acid strength
(chapter III).
- Slow deactivation (chapters III and IV).
- Shape selectivity with respect to reactants and products
(e.g. 29).
- High accessibility of the acidic sites.
The last three properties are due to the three dimensional
pore system with its special pore dimensions of about 5.5 A.
Fig. 6 Conversion of Br¢nsted to Lewis acid sites.
1) Br¢nsted acid site
2) Conjugated base of Br¢nsted acid
3) Lewis acid

- 12 -
With 10 Si or Al membered pore-rings ZSM-5 takes position
between the zeolites A andY. The 8 membered rings of A.are
too small for most of the hydrocarbons to enter the zeolite
and to react. The 10 membered rings of ZSM-5 limits the
hydrocarbon reactants or products to molecules with a kinetic
diameter of 5.5 - 6 A moreover diffusional limitation favours
linear molecules. This is of commercial interest, for example
in the para-xylene production (e.g. 30) and the methanol-to
gasoline process (e.g. 21 and references therein). In the
latter process methanol is converted over H-ZSM-5 to a
hydrocarbon mixture in the gasoline range with a research
octane number of 90-100. The 12 membered rings of zeolite Y
are too large to show these shape selective properties.
I.2 SCOPE OF THIS. THESIS
I.2.1 THE AIM OF THIS WORK
The aim of the work described in this thesis is to
characterize the physical properties of H-ZSM-5 and to
correlate these with its catalytic behaviour. During a
mechanistic study on the formation of the first C-C bond in
the methanol-to-gasoline reaction (21) questions arose about
the zeolite itself. It had turned out that by using different
batches of ZSM-5 different cataly~ic results were obtained.
The same holds when comparing our results with those from
other investigators. The main differences concern the factors
which determine the quality of a catalyst:
i The activity for a certain reaction.
ii The deactivation during that reaction.
iii The selectivity in that reaction.
The physical properties which are likely to determine these
differences are:
i The number and acid strength of the active sites.
ii The location of the acidic sites in the particle.

- 13 -
iii The presence of lattice defects in the zeolite crystals.
iv The shape and size of the catalyst particles.
In this work is tried to correlate some of these
physical properties to the catalytic behaviour. The reaction
selectivity will not and the the influence of the shape and
size of the zeolite particles will only briefly be discussed.
I.2.2 THE PLAN OF THIS THESIS
The synthesis and primarily characterization of ZSM-5 is
discussed in chapter II. By use of X-ray diffraction,
chemical analysis, pore volume determination and scanning
electron microscopy basic information is obtained about the
several synthesized ZSM-5 batches.
The characterization of the acidity of H-ZSM-5 is
presented in chapter III. The technique used for this is the
temperature programmed desorption of ammonia (NH 3-TPD). In
the same chapter the results are reported of the conversion
of n-hexane. This is used as a test reaction for determining
the activity of the catalyst and the deactivation during the
reaction time. The acidity, which means the number and the
strength of the acidic sites, is related to the activity. No
relation is found between the acidity and the deactivation.
A relatively new technique is solid-state magic-angle
spinning (MAS) NMR. With this technique it is possible to
obtain well resolved spectra from solids. Structural proper
ties of ZSM-5 are studied with 29si and 27Al MAS-NMR. This
is reported in chapter IV. Special attention is payed to the
relation between structural changes upon heat treatment, the
changes in the corresponding 29Si NMR spectra and to the
influence of Al on the line broadening in the 29si spectra.
The deactivation of H-ZSM-5, an important parameter in
catalytic applications, is due to coke deposition in or on
the catalyst particle. Coking of the catalyst is achieved
with the already mentioned test reaction: the cracking of n
hexane. The amount of coke is determined by thermogravimetry.

- 14 -
In chapter V the deactivation of ZSM-5, mordenite and zeolite
Y are compared. For deactivation a model is proposed wherein
the crystal structure of ZSM-5 is the determining factor.
Another technique used in this work is infrared spec
troscopy. With this technique both structural and acidic
properties can be studied. We have focussed our attention to
the structural part as described in chapter VI. The
assignment of infrared vibration bands to structural features
of ZSM-5 is discussed. Also the influence of Al on the band
positions and the bandwith is mentioned. Remarkable results
are achieved with low temperature measurements of silicalite.
This gives a very well resolved spectrum.
Finally, in chapter VII, the main results and con
clusions of the work reported in this thesis are discussed
and, if possible, put together.
1.3 REFERENCES
1. Smith J.v., Amer. Mineral. Soc. Spec. Papers, l• 281
(1963).
2. Barrer R.M., "Zeolites and clay minerals as sorbents and
molecular sieves", Acedemic Press, London (1978).
3. Milton R.M., u.s. Pat tent 2,882,243 (1959),
u.s. Pat tent 2,882.244 (1959).
4. Breck n.w., u.s. Pat tent 3,130,007 (1964).
5. Milton R. M., "Molecular sieves", Soc.Chem. Ind., London
(1968), p 199.
6. Planck C.J., Rosinski E.J. and Hawthorne W.P., Ind.
Eng. Chem. Prod. res. dev., ~. 165 (1964).
1. Weisz P.B., Chemtech, 498 (1973).
8. Magee J.s. and Blazek J,J,, "Zeolite chemistry and
catalysis", Am. Chem. Soc. Monograph, 171, 615 (1976).
9. Venuto P.B. and Habib E.T., "Fluid catalytic cracking
with zeolite catalysts", Dekker, New York (1979).
10. Rabo J.A., Bezman R.D. and Poutsma M.L., Acta Phys.
Chem., 24, 39 (1978).

- 15 -
11. Barrer R.M. and Denny P.J.,. Chem. Soc., 971 (1961).
12. Barrer R.M., Denny P.J. and Flanigan E.M., u.s. Pattent
3,702,886 (1972).
13. Argauer R.J. and Landolt C.R., u.s. Pattent 3,702,886
(1972).
14. Chu P., U.S.Pattent 3,709,979 (1973).
15. Flanigan E.M., u.s. Pattent 4,061,724 (1977).
16. Kokotailo G.T., Chu P., Lawton S.L. and Meier W.M.,
Nature, 27 119, (1978).
17. Weisz P.B. and Frilette v.J., J, Phys. Chem., 64, 382
(1960).
18. Chang c.c. and Silvestri A.J., J. Cat., 47, 249 (1977).
19. Titchener A.L., Chem. Ind.,~. 841 (1982).
20. Frohning C.D. and Cornils B., Hydr. Proc., 53, 143
(1974).
21. van den berg J.P., Ph.D. Thesis, Eindhoven Univ.
Technol., Eindhoven (1982).
22. N.N. Chem. Week, Jan. 2, 29 (1980).
23. N.N. Chem. Eng. News, May 22, 11 (1978).
24. Olson D.H., Kokotailo G.T., Lawton S.L. and Meier W.M.,
J. Phys. Chem., 85, 2238 (1981).
25. Thomas J.M. and Millward G.R., J. c. S. Chem. Commun.,
1380 (1982).
26. Flanigan E.M., Bennet J.M., Grose R.W., Cohen J.P.,
Patton R.L. and Kirchner R.M., Nature, 271, 512 (1978).
27. Auroux A., Bo1is V., Wierzchowski P., Gravelle P.C. and
Vedrine J.c., J. c. s. Farad. Trans. 1, z.1, 2544 (1979).
28. Topsoe N-Y, Pedersen K. and Derouane E.G., J. Cat., 70,
41 (1981).
28. Haag w.o., Lago R.M. and Weisz P.B., Farad. Disc. Chem.
Soc., ~. 317 (1982).
30. Keading w.w., Chu c., Young L.B., Weinstein B. and
Butter S.A., J. Cat.,~. 159 (1981).

- 16 -
CHAPTER II SYNTHESIS OF ZEOLITE ZSM-5
II.1 INTRODUCTION
For research in the field of ZSK-5 zeolites it is
necessary to synthesize your own zeolite samples. This
because ZSK-5 still is not commercially available. Of course
this fact stimulates investigation of zeolite
crystallization. Factors as the relative amount of the
starting materials, their purities, the way of mixing, the
application of a digestion period or not can influence the
product. For this reason the comparison of results between
different laboraties is often difficult and confusing.
The basic crystallization mixture consists of alkali
oxide (Na 2o and K 20), silica (Si0 2),alumina (Al 20 3), and.
tetra-propylammoniumhydroxide ((C 3H 7 )~NOH, TPAOH). Changes of
the relative concentrations of the components has various
results. The stability of the ZSM-5 phase depends on the
complete composition. Within certain boundaries (3) the
crystallization rate increases rapidly with the Si0 2/Al 2o 3 ratio (4). The degree of crystallinity increases with Si0 2 content (S). This seems to point out that the ZSK-5
preferentially accomodates the silica, which might be the
explanation for the possibility of synthesizing siliealite,
the Al 2o3 free ZSM-5.
The template effect of the TPA+ ion, already suggested
in early literature (e.g. 6) and reinvestigated recently with
new methods (7,8,9), is still a subject of research. The
- 17 -
structure directing role of organic molecules is recently
reviewed by Lok (10). The tetra-propyl, -butyl and -ethyl
amines can be used to synthe~ize ZSM-5, -11 and -12,
respectively. Also the use of diamino-alkanes for the same
and other ZSM zeolites is illustrated. However, preparation
methods of zeolites, using other organic molecules like
alcohols, ketones glycerol and organic sulpher (10), do not
support the template crystallization model.
In this chapter the zeolite synthesis and the primarily
characterization with X-ray diffraction (XRD), chemical
analysis, pore volume determination and scanning electron
microscopy will be discussed.
11.2 EXPERIMENTAL
11.2.1 SYNTHESIS
The ZSM-5 samples were synthesized in a teflon vessel
placed in a autoclave, under autogeneous pressure (5-6 atm)
for 6 days at tsoOc. A typical crystallization mixture,
expressed in molar ratios, was : Al 20 3 : SiO 2 : Na 20 : K 20
TPAOH : H20 = 1 : 59 : 1.25 : 0.87 : 12.5 : 1200 • The
procedure for preparing the reaction mixture was
- Silicagel or colloidal silica is added to the TPAOH
solution.
- Sodiummetaaluminate aqueous solution is added.
-This mixture is stirred for l hour at 8QOC to obtain a
homogeneous mixture.
The starting materials are listed in table 1. Also
silicalite, the aluminum free end member of the ZSM-5 family,
is synthesized (without sodiummeta- aluminate addition, but
with potassiumoxide present in the TPAOH solution). The
crystallization product is first filtered and washed with
water and next dried at 100oc. To remove the organic template
which is still present in the zeolite pores (7) the material
is calcined in a shallow bed at 5000c for 3 hours. We then

co ......
wt % Al 20 3 SiO 2 Na 20 K 20 Fe 20 3 CaO Tt0 2 Zr0 2 TPAOH
chemicals
NaAL0 2 51.59 - 31.8 0.49 0.05
SiO -soli 2 - 36.3 0.14 0.002 0.001
Si0 2 -ge12 - 99.85 0.004 - 0.007 0.02 0.06 0.03
TPAOH 3 .. 0.01 0.04 0.67 -TPAOH 4 - - - 0.51 -
1) Silica sol AS 40, AKZO - Ketjen, Amste~dam, The Nethe~lands.
2) Silica gel 11Da1Jison g~ade 950", Koch - Light, Colnb~ooks, England.
3) TPAOH, Fluka, Buchs, Swiss.
4) TPAOH, Chemische Werke Lahr, Lahr, Germany.
Table 1 Chemical composition of the starting materials used for
ZSM-5 synthesis.
:::20
"'20
H20
o:6 4
::<80
:::80

- 19 -
obtain the Na/K/H-ZSM-5 in which Na+ and K+ occupy 50-70 % of
the available cationic sites. To transfer it into an active
catalyst the Na+ and K+ ions have to be replaced by H+ ions.
This is done by suspending the zeolite in a 2M"NH 4N0 3 solution (lOg of zeolite in 100 ml of solution) and stirring
the suspension during 30 min at about 80°C. After repeating
this treatment 3 times almost all Na+ and K+ has been
replaced by NH 4+. Finally, activaton is carried out by
calcination at 550°C for 3 hours. Under these circumstances
the NH 4+ is decomposed into gaseous NH 3 and H+.
This exchange procedure is preferred over a direct
exchange with a diluted HCl solution, because in the latter
method not only the Na+ and K+ are exchanged but also some Al
will be removed from the zeolite lattice (e.g. 11,12).
II.2.2 CHARACTERIZATION OF THE CRYSTALLIZATION PRODUCT
CHEMICAL ANALYSIS
For chemical analysis the zeolites are dissolved in
fuming sulphuric acid. This solution is filtered. Ry ignition
of the residue with HF the Sio 2 content is determined. The
ash is dissolved with pyrosulfate and added to the filtrate.
From this solution the content of Al. Na and K is determined
with atomic absorption measurements. The compositions of the
zeolites are listed in table 2.
X-RAY DIFFRACTION {XRD)
X-ray powder diffraction patterns were measured on a
Philips X-ray diffractometer equipped with a PW 1120 X-ray
generator and a PW 1352 detection system. All samples of
table 2 give XRD results similar to that shown in fig. 1.
From this we conclude that the product has good crystallinity
and is a zeolite of the type ZSM-5 (2. 14).

- 20 -
Al 20 3 SiO 2 Na 20 K 20
sample wt% RMC 1 wt% RMC wt% RMC wt% .RMC
E 6.83 1 88.85 22.1 0.184 0.04 0.660 0.10
F 3.15 1 91.9 7 49.5 0.067 0.03 0.206 0.07
H 2. 30 1 93.10 68.8 0.010 0.01 0.051 0.02
I 3.76 1 90.84 41.0 0.026 0.01 0.036 0.01
K 0.99 1 88.11 151 0.004 0.01 0.002' o.o L 2.45 1 87.12 60.3 0.005 0.003 0.008 0.003
M 2.16 1 87.84 69.0 0.009 0.01 0.023 0.01
N 2.63 1 91.93 59.3 0.003 o.o 0.038 0.02
0 2.81 1 81.28 49.1 0.011 0.01 0.045 0.02
silicalite - - 99.40 - o.08 - 0.052 -RMC = Pelative moleculap Patio noPmalized to Al2o3.
Table 2 Chemical composition of the H-ZSM-5 samples.
PORE VOLUME
The pore volume is determined by measuring the amount of
n-butane that adsorbs on the zeolite with a Cahn' RG
electrobalance. The He vectorgas (200 ml/min) was purified by
passing it over a molsieve, BTS and Carbosorb column. After
drying the sample at 400°C the n-butane is absorbed at room
temperature until the catalyst is saturated. The total flow
is kept at 200 ml/min with a n-butane/He ratio of 1/4,
results are listed in table 3. These results are obtained
using the density of liquid n-butane at room temperature (p •
0.5788 g/ml) and assuming capillary condensation for the
adsorbed n-butane.

- 21 -
60 50 40 30 20
Fig. 1 Typiaal X-ray diffraction pattern of ZSM-5.
Slits are ahanged at 10, 19 and 38 °28.
Sample pore volume (ml/g)
E 0.168
F 0.156
I 0.156
H 0.163
silicalite 0.174
10 ~029
Table 3 Pore volume of some ZSM-5 samples.
MORPHOLOGY
Some scanning electron photomicrographs were made with a
JEOL Superprobe 733 (fig.2) to obtain a view on the
morphology of the crystalline product.

- 22 -
Fig. 2 Electron photomicrographs of ZSM-5: a) sample E, b) sample F.
b 101Jm

- 23 -
Fig.2 EleetPon photomiaPOgPaphs of ZSM-5: e) sample N, d) sample L.
c 101Jm
d 101Jm

- 24 -
II.3 DISCUSSION
In the original patents of Mobil (2) a 8i0 2/TPAOH ratio
of about 1.6 was used in the crystallization mixture. Only
for the catalyst E we used this ratio. The others were
prepared with a lower TPAOH content (8i0 2/TPAOH ratio of
about 4.7). From XRD we conclude that this leads to larger
crystals (peakwidths are smaller) and a higher crystallinity
of the sample (higher intensity, better signal to noise
ratio). This is in agreement with the crystallization
mechanisms proposed by Derouane and coworkers (14) and
recently reinvestigated by Gabelica et al. (15) with more
refined techniques and better controlled crystallization
environment (teflon lined auto-claves instead of pyrex
tubes). The two proposed mechanisms are liquid phase
transportation crystallization (type A) and hydrogel
transformation crystallization (type B).
In the first mechanism a "silica solution" in TPAOH
contains a mixture of silica sol (colloidal silica) and
dissolved mono-silicate and poly-silicate ions. The other
sodium aluminate solution contains monomeric aluminum
hydroxide species. Upon mixing of these. solutions an alumino
silicate gel is formed. This gel phase is rich in aluminum,
due to the slow depolimerization of the silica sol resulting
in a rather small concentration of silicate ions that can
condense with the aluminate species. Continueing production
of silicate ions on the surface of the colloidal silica
particles results in the formation of alumino-silicate
complexes on the surfaces of the particles, which are
insoluble under the crystallization conditions. In this way
the colloidal silica particles are transformed in a silica
alumina sol. Meanwhile a limited number of nuclei is formed
from the remaining silicate ions in the solution. Once a
sufficient number of nuclei is formed, crystal growth will
become more important, because, under these conditions, the
activation energy of crystal growth is smaller than that of

- 25 -
nucleation. Initially the growth is fed by the silicate ions
in the solution. When this source is exhausted, the gel and
the sol phase will dissolve and the silica and the alumina
species go into the solution. Around the silica rich core of
the crystals an outer layer of silica-aluminates will be
formed. So type A crystallization results in a small number
of large crystals with an inhomogeneous Al distribution.
In the type B crystallization a different reaction
mixture is used (see table 4). A hydrous alumino-silicate gel
also containing Na+ and TPA+ ions is formed from waterglass,
the silica source and aluminum sulphate. This gel has about
the same Si/Al ratio as the reagents since the supply of
silica anions is not limited by the depolymerization of
silica sol. In this gel nucleation occurs rapidly and a large
number of nuclei is formed, due to the high concentration of
reactive silicate and aluminate anions which are in intimate
interactions with TPA+ ions. So type B crystallization
results in a large number of small crystals with homogeneous
Al distribution. These crystals are formed with a higher
crystallization rate than is achieved with the type A
crystallization.
type A type B
Si/Al 14 45
Na/Al 1.5 60
TPA/(Si+Al) 1.8 10
H2 0/(Si+A1) 15 28
Table 4 Relative composition of the reaction mixture of type A
and B crystallization.
- 26 -
The crystallization mixture of catalyst E corresponds with
the liquid phase transportation type crystalli~ation while
the others tend to the hydrogel transformation type. The
latter mixtures gives better crystallinity within 6 days.
From XRD we can also conclude that the silicalite we
prepared is a very pure highly crystalline ZSM-5. The absence
of Al (or the extreem low Al content) makes silicalite a very
special ZSM-5 with a hydrophobic character (6). This causes
a.o. a different sorption behaviour. The absence of the
acidity and the structure complicating effect of Al makes
silicalite a usefull reference or model compound. This will
be discussed in the next chapters.
The pore volumes of the ZSM-5 samples are in good
agreement with literature (2). The validity of the n-butane
absorption method is already stated by van den Berg (13, page
21) and recently reconfirmed by Jacobs (18). This method
essentially acounts for the amount of micropores (smaller
then 20 A). In addition to the XRD measurements this proves
the good crystallinity of the samples, because the presence
of amorphous material would strongly decrease the micropore
volume.
The electron photomicrographs show some typical examples
of crystal morphology. By changing the Si0 2/TPAOH ratio
different ZSM-5 crystals are obtained. The ratios are 1.6
(catalyst E), 4.7 (F and N) and 9.4 (L). The value 1.6 is
typical for the liquid phase ion transportation mechanism and
,,4 for the solid phase hydrogel transformation (14). The
crystal types shown here are in agreement with those reported
in literature (14,17) for similar crystallization conditions.
However, one has to be careful with electron photomicrographs
because it is difficult, if possible at all, to take a
picture which is representative for the whole sample.
In this work allways TPAOH is used as the ·magic·
structure determining agent in the ZSM-5 synthesis. In early
literature (e.g. 2, 18, 3) this is reported as the only
possibility. With the new magic-angle-spinning NMR technique

- 27 -
it is possi~le to look at the solid phase and at the zeolite
precursors in the crystallization mixture. Recent
investigations by Boxhoorn (7) with 13c-MAS-NMR proved the
presence of TPA+ ions in the crystalline ZSM-5 product~ The
nitrogen atom is located at the intersections of the 3-
dimensional pore system and each propyl chain points in
another pore direction. The TPA+ ion is fixed in this
position and not able to diffuse out of the ZSM-5 crystal.
The filling is almost 4 TPA+ ions in each unit cell which
means one at each pore intersection. Other investigators have
confirmed this (8, 17).Whereas 21Al-MAS-NMR (9) makes it
likely that there are already tetrahedrally silica-alumina
species in the precursor state. These findings make us
believe that silica-alumina tetrahedra chains or rings are
formed in the liquid or gel phase. The crystallization occurs
by arranging the chains or rings around the TPA+ ions. In
this way the type of zeolite is determined by the kind of
tetraalkylammonium ion which is used. This, for instance,
tetrabutylammonium is used for preparing ZSM-11. Recently,
however, the preparation of ZSM-5 without the use of TPAOH is
reported (10 and references therein). Especially the ICI
method, using 1-6 hexanediol, is commercially of great
interest. A brief investigation of this preparation method
gave good XRD results. Others (19) have also good experience
with the catalytic behaviour of ZSM-5 prepared in this way.
This makes clear that,in spite of the MAS-NMR results of
Boxhoorn et al.(7), the template effect of TPA+ is not
reserved for this compound alone or this effct is not the
structure determining step in the crystallization. Further
investigations are necessarily to elucidate this completely.
MAS-NMR either with Al, Si or C as target nucleus seems to be
a promising technique in this research.

- 28 -
II.4 REFERENCES
1. Sand L.B., Proc. 5th Int. Conf. Zeolites (Rees L.v.c.,
ed.) 1-9, Heyden, London, 1980.
2. Argauer J~A· and Landolt G.R., u.s. pattent 3,702,886
(1972).
3. Erdem A. and Sand L.B., J, Cat., 60, 241-256 (1979)
4. Lecluze v. and Sand L.B., Recent Progr. Rep. 5th Int.
Conf. Zeol. (Sersale R.,ed.) 41-44, Giannini, Napels,
1981.
5. Mostowicz R. and Sand L.B., Zeolites, !• 143-146 (1982)
6. Flanigen E.M., Bennet J,M., Grose R.W., Cohen J.P.,
Patton R.L., Kirchner R.M. and Smith J.V., Nature, 271,
512-516 {1978).
7. Boxhoorn G., J.c.s. Chem. commun., 264-265 (1982).
8. Nagy J.B., Gabelica z. and Derouane E.G., Zeolites, !• 43-49 (1983).
9. Derouane E.G., Nagy J.B., Gabelica z. and Blom N.,
Zeolites, !• 299-302 (1982).
10. Lok B.M., Cannan T.R. and Messina C.A., Zeolites !• 283-291 (1983).
11. Breck D.w., Zeolite Molecular Sieves, 569, Wiley,
New York (1974).
12. van den Berg J.P., Thesis. Eindhoven Un.Techn. (1981).
13. Wu E.L., Lawton S.L., Olson D.H., Rohrman A.C. and
Kokotailo G.T., J, Phys. Chem., !!• 2777-2781 (1979).
14. Derouane E.G., Dertremmerie s., Gabelica z. and Blom
N., Appl. Cat., l• 201-224 (1981).
15. Gabelica z., Nagy J.B. and Debras G., J, Cat., 84,
256-260 (1983).
16. Jacobs P.A., Beyer H.K. and Valyon J,, Zeolites, l• 161-168 (1981).
17. Gabe1ica z., Blom N. and Derouane E.G., Appl. Cat., i• 227 (1983).
18. Kokotailo G.T., Lawton S.L. and Olson D.H., Nature, 272,
417-441 (1978).

- 29 -
19. Oudejans J.c., van den Gaag F.J. and van Bekkum H.,
Proc. 6th Int. Conf. Zeolites, Reno, USA, july 1983.

- 30 -
_C_H~A_P~T~E~R __ I~I~I--~A~C~I~D~I~T~Y ___ AND ACTIVTIY OF ZEOLITE H-ZSM-5
III.l. INTRODUCTION
The acidity of zeolites can be investigated with several
methods. With infrared spectroscopy one can determine whether
Lewis or Br,nsted sites are present (e.g. 1,2). According to
the results obtained with this method it may be concluded
that the ZSM-5 samples as used in this work will contain
mainly Br~nsted acid sites.
The acid strenght can be determined by measuring the
heat of adsorption or desorption of a suitable probe
molecule. Ammonia meets the requirements for such a probe
molecule. Firstly it is small enough to enter all the zeolite
pores and secondly it can react both with the Br6nsted and
Lewis acid sites. Pyridine is much less suitable regarding
the first requirement.
The heat of adsorption can be measured with calorimetry
and the heat of desorption with temperature programmed
desorption (TPD). In the first techniqu~ the heat of adsorp
tion is directly measured. During adsorption NH 3 enters the
zeolite and adsorbs at the first available site. This is not
necessarily the strongest one. So in this way too low a value
of the acid strength is obtained. In the latter technique all
the chemisorption sites of a zeolite sample are initially
covered with NH 3• Then the rate of desorption is measured
during a linear increase of the sample temperature. As will
be discribed below, the heat of desorption can be

- 31 -
determined from the temperature dependance of the desorption
rate. During desorption starting with all sites covered,
ammonia will first desorb from the weakest site. Therefore
TPD, in theory the most correct .method, is applied in this
work.
Although TPD is a well known method, not much has been
reported about TPD with zeolites,especially ZSM-5. A theory
for determining the heat of desorption from the TPD plot has
been developed by Cvetanovic and Amenomiya (3). Gorte (4) and
Alnot (5) reported that the method of a sequence of
measurements with different heating rates gives the most
reliable values for the heat of desorption. Using this method
Tops~e (l) has already reported NH 3-TPD with ZSM-5.
The cracking of n-hexane is used as a test reaction to
determine the activity and the deactivation of the catalyst.
As has been shown earlier (6) this simple reaction can be
used for testing the suitability for the methanol conversion.
In this work an attempt is made to find the relation between
the acidity, measured with NH3-TPD and the catalytic
behaviour of ZSM-5. Variation of the acidity is achieved by
variation of the Al content (5) and by changing the degree of
exchange of Na+/Ka+ versus a+.
111.2. EXPERIMENTAL
ZSM-5 catalysts were synthesized as described in chapter
II. The samples used in this ~hapter are summarized in table
1.
The n-hexane cracking (also called a-test, see chapter
II, ref. 2) was carried out in a tubular quartz reactor. The
n-hexane was fed in the He carrier-gasstream by a syringe
pump and led over the catalyst at JooOc. The flow of n-hexane
was 1 g/(g catqlyst hr). The reactor bed contained 0.5 g ZSM-
5, particle size 60 -125 ~m. The reactionproduct was on
line chromatographically analysed, every 25 min for at least
4 hours.

- 32 -
chemical composition n-hexane cracking
samples SiO 2 N 1) exch. 2) N + 3) k (hr- 1) >. oo- 2> Al if3
Al,uc H , uc
E1 22.1 8.0 0.75 6.0 0.56 2.80
E3 22.1 8.0 o.85 6.8 o. 9 2 1. 63
11 41.0 4.5 0.96 4.32 1.20 19.6 .. 13 41.0 4.5 0.98 4.41 1.43 25.8
Fl 49.5 3.7 0.52 1.92 0.48 4.98
F2 49.5 3.7 0.81 3.00 0.67 4.29
F3 49.5 3.7 0.89 3.29 0.65 4.21
H1 68.8 2.7 0.88 2.38 0.51 4.17
H3 68.8 2.7 0.97 2.62 0.46 3.03
NH 3-TPD
HTP LTP
samples AHdes AHdes (kJ/mol)
20N (10 sites/g) (kJ/mol)
20N (10 sites/g)
E1
E3 73 1.8 45 5.7
11
13 137 2.8 68 6.1
F1 116 1.3 103 3.4
F2
F3 169 1.8 109 3.3
H1
H3 138 0.9 76 2.0
1) NAl,ua = number of Al per unit cell ( AlxSi96_xo192J. 2) exah (mol AZ. -mol (Na+K) )/mol Al.
3) NH+ = number of H+ unit cell. ,uc •
Table 1 Chemical composition of the catalysts, results of the
n-hexane cracking and TPD measurements.
- 33 -
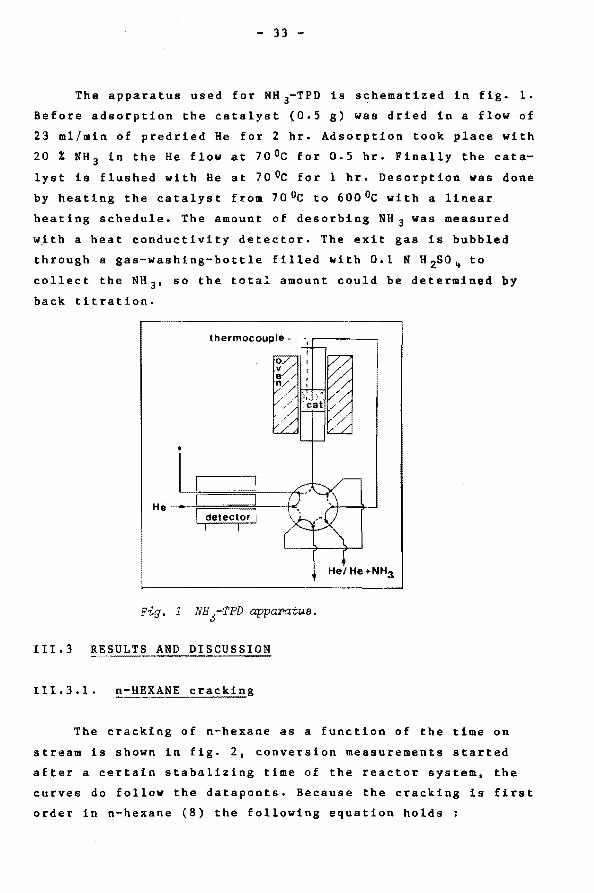
The apparatus used for NH 3-TPD is schematized in fig. 1.
Before adsorption the catalyst (0.5 g) was dried in a flow of
23 ml/min of predried He for 2 hr. Adsorption took place with
20 % NH 3 in the He flow at 7oOc for 0.5 hr. Finally the cata
lyst is flushed with He at 700c for 1 hr. Desorption was done
by heating the catalyst from 70°c to 6ooOc with a linear
heating schedule. The amount of desorbing NH 3 was measured
w~th a heat conductivity detector. The exit gas is bubbled
through a gas-washing-bottle filled with 0.1 N H 2so 4 to
collect the NH 3 , so the tota! amount could be determined by
back titration.
thermocouple
+
He/He+NH3
Fig. 1 NH3-TPD apparatus.
III.3 RESULTS AND DISCUSSION
111.3.1. n-HEXANE cracking
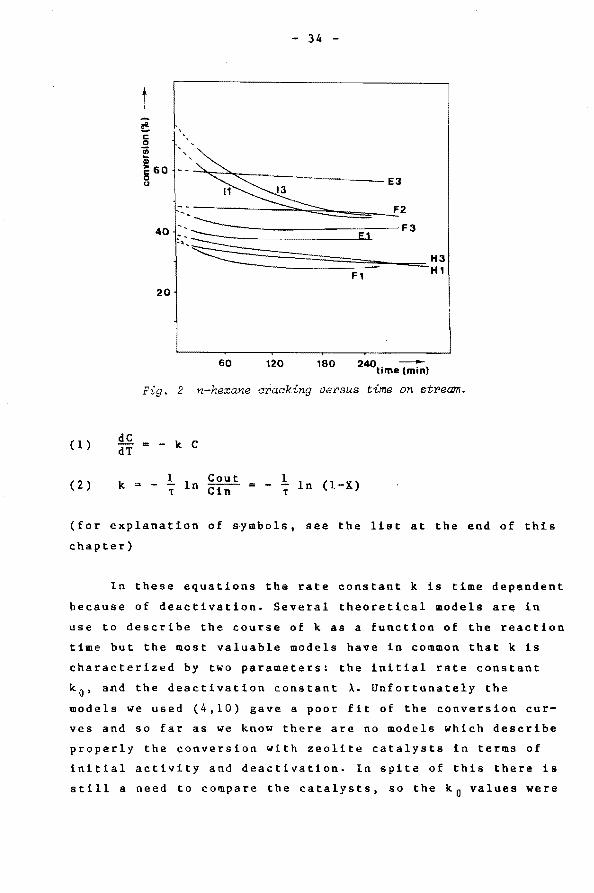
The cracking of n-hexane as a function of the time on
stream is shown in fig. 2, conversion measurements started
after a certain stabalizing time of the reactor system, the
curves do follow the dataponts. Because the cracking is first
order in n-hexane (8) the following equation holds :
( 1)
(2)
dC dT
k =
- 34 -
t '
F1
20
60 120 180 240 --time (min)
Fig. 2 n-hexane cracking versus time on stream.
- k c
1 ln Cout T Cin ~ ln (1-X)
{for explanation of •ymbols, see the list at the end of this
chapter)
In these equations the rate constant k is time dependent
because of deactivation. Several theoretical models are in
use to describe the course of k as a function of the reaction
time but the most valuable models have in common that k is
characterized by two parameters: the initial rate constant
k 0 , and the deactivation constant x. Unfortunately the
models we used (4,10) gave a poor fit of the conversion cur
ves and so far as we know there are no models which describe
properly the conversion with zeolite catalysts in terms of
initial activity and deactivation. In spite of this there is
still a need to compare the catalysts, so the k 0 values were

- 35 -
determined by graphical extrapolation of the converssion at t
= 0 (fig. 2) and A by the following equation:
(3)
The results are presented in table 1. They show that
there tends to be an increasing activity with an increasing
degree of exchange. Such a relation can not be found for the
deactivation. XRD and absorption of n-butane are used to
examine the crystallinity of the zeolites. As mentioned
b~fore all samples show a good XRD crystallinity and there is
no significant difference between them. The pore volume de
termination with n-butane absorption (at 2JOC) results for
all samples in values between 0.162 and 0.173 ml/g, which is
in good agreement with other investigations (11,12). So it is
not possible to explain the differences in catalytic be
haviour by differences in crystallinity.
As expected silicalite shows no activity in the n-hexane
test. Only 1-2 % isomerisation occured. The acidity of sili
calite comes from the =Si-OH groups at the external crystal
surface or at lattice defects and is far to weak for n-hexane
cracking.
III.3.2. NH3-TPD
Fig. 3 shows a typical TPD plot. The catharometer res
ponse in arbitrary units, which is proportional to the de
sorption rate r, is given as a function of the desorption
temperature.
With the theory developed by Cvetanovic and Amenomiya
(3) it is posible to determine the activation energy Edes or
the heat of desorption ~Hdes. The investigations of Gorte (4)
of the design parameters of a TPD apparatus show that this

90 -; .s Gl <II c 0
~60 ~
30
- 36 -
400 600 800 )1000 temp(K -
Fig. J NH3-TPD pZot for cataLyst I3, detector respons versus
temperature.
theory is applicable for our experimental setup and that
readsorption most likely occurs freely. The desorption-rate
is given by:
( 4) r = de dt
v en (-Edes) exp ~
The coverage e equals unity when all available adsorp
tion sites are covered. The desorption is first order if
log r/e versus 1/T gives a linear relationship. Fig. 4 shows
that this holds very well for the high temperature peak (HTP)
but not for the low temperature peak (LTP). TPD plots of
silicalite only show the LTP, s~ combined with the fact that
silicalite does not crack n-hexane, it is clear that only the
HTP is of catalytic interest. Because in the HTP NH 3 desorp
tion is first order and readsorption occurs freely, the rela
tion between the peak maximum temperature Tm and the heat of
desorption 6Hdes is given by (3):

(5)
- 37 -
t (]) -(/) 3.4 01
.2 \+
\ J
\ \
I \ 241 . + • +
\·· 1
+
1.4
1.2 2.0 2.6 1000/T (K"1)-
Fig. 4 Log S/6 versus 1000/T belonging to the TPD plot of fig. 3
S is the aatharometer respons in arbitrary units.
AHdes 2 log Tm - log 6 = 2 , 303 RTm +
~
2 log ( (1- 6) Vs AHdes
F A R
B is the linear heating rate
An analoguous relation can be written between Tm, B and
Edes, but this relation is only valid in the case that read
sorption does not occur, which is not very likely in micro
porous catalysts (4). Because Ead is expected to be
negligible, AHdes is almost equal to Edes. If the.TPD curves
are recorded with various heating-rates B· AHdes can be
determined according to relation (5) by plotting 2 log Tm -
log B against 1/Tm. This was done for the LTP and the HTP
(cf. fig • .S).
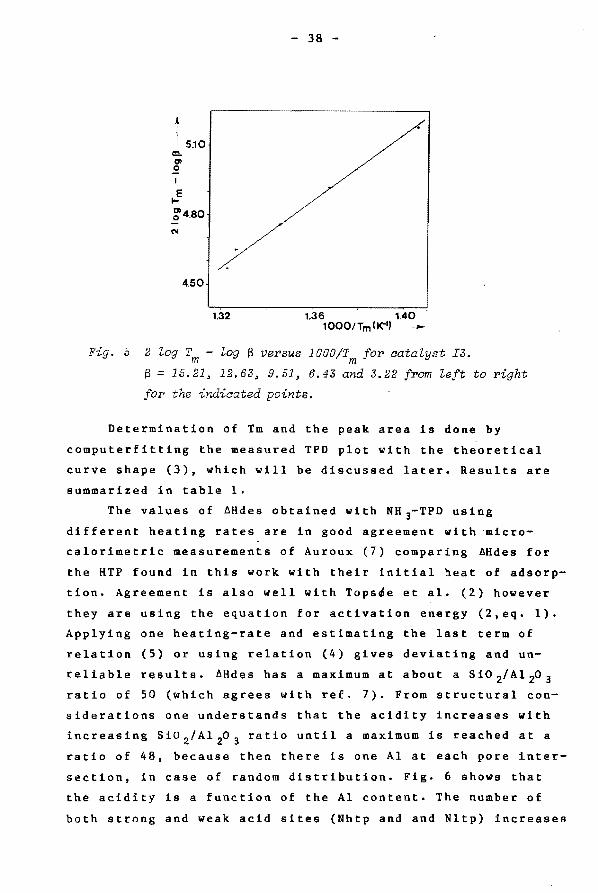
Fig. 5
5.10 <::!.. Cll 0
1-E
g'4.80
N
4.50
- 38 -
1.32 1.36 1.40 1000/Tm(K"1)-
2 ~og T - ~og S versus 1000/T for aata~yst I3. m m S = 15.21~ 12.63, 9.51, 6.43 and 3.22 from ~eft to right
for the indicated points.
Determination of Tm and the peak area is done by
computerfitting the measured TPD plot with the theoretical
curve shape (3), which will be discussed later. Results are
summarized in table 1.
The values of AHdes obtained with NH 3-TPD using
different heating rates are in good agreement with micro
calorimetric measurements of Auroux (7) comparing AHdes for
the HTP found in this work with their initial heat of adsorp
tion. Agreement is also well with Tops-e et al. (2) however
they are using the equation for activation energy (2,eq. 1).
Applying one heating-rate and estimating the last term of
relation (5) or using relation (4) gives deviating and un
reliable results. AHdes has a maximum at about a Si0 2/Al 2o 3 ratio of 50 (which agrees with ref. 7). From structural con
siderations one understands that the acidity increases with
increasing Si0 2/Al 2o 3 ratio until a maximum is reached at a
ratio of 48, because then there is one Al at each pore inter
section, in case of random distribution. Fig. 6 shows that
the acidity is a function of the Al content. The number of
both strong and weak acid sites (Nhtp and and Nltp) increases

Fig. 6
t ~6 ~ -~ ~ ~5 ~
0 N g4 z
3
2
- 39 -
LTP
HTP
2 3 4 5 6 H~uc ~
+ Amount of desorbed molecules NH3 versus the number of H
per unit eell for the LTP and HTP of the catalysts (table 1).
with the Al content.Tha strong increase of the weak acid
sites makes it clear that these sites can not only be silanol
(Si-OH) surface sites, but might be caused by multiple ad
sorption of NH 3 on strong acidd sites. Plotting the initial
rate-constant k 0 of n-hexane cracking versus the Nhtp (fig.
7) gives an almost linear relationship. So it seems that for
n-hexane cracking it is mainly the number of strong acid
sites which is important and not the strenght. Apparently
they are stronger than a certain threshold level needed for
the n-hexane cracking. The k 0 has no relation with the ~des.
The deactivation constant A of the catalyst cannot be related
with any other parameter. Only with some care it can be
stated that A increases with the number of acid sites. To
inquire if coke formation at the external surface is the
reason of deactivation (13, 14) and is a function of the
crystalLite surface acidity, TPD was done with an other probe
molecule. Instead of NH 3 triethylamine (TEA) was used. This
is to large to enter the ZSM-5 pores but it has the same
basic properties as NH 3• For TEA-TPD the same procedure as
for NH3-TPD was followed. Again there is a HTP (Tm about

- 40 -
t £ 1.2
0 .>1:
0.8
0.4
2 4 6 N (1020sites/g)-
Fig. 7 Initial rate konstant k0 versus sites per g catalyst for
the LTP and HTP of the catalysts (table 1).
49oOc) and a LTP (Tm about 18QOc) and silicalite only
posseses the LTP. However the relation between TEA-TPD
(external surface acidity) and deactivation is not better
than that obtained for NH 3-TPD.
III.4 CURVE FITTING
The Cvetanovic and Amenomiya model (3).
It is possible that the NH 3-TPD plot consists of more
than the two peaks, which are visible at first sight.
Depending on the heating rate, some catalysts show a weak
shoulder at the high temperature side of the LTP. Therefore
attemps were made to deconvolute the TPD plot with the model
of Cvetanovic and Amenomiya. To do this we have to now what
the concentration C of the desorbing species is as a function
of the catalyst temperature. The mass balance for NH 3 desorp
tion in the reactor is:
F C Vs Vm kd 6 - Vs ka C (1-6)

- 41 -
From this, equation (6) can be derived.
(6) Vs Vm kd 6
c - F + Vs k (1-6) a
The amoun~ of NH 3 leaving the catalyst is
d6 Vs Vm dt = - F C
With a linear heating rate T
( 7 ) _ C = V s Vm 6 d 6 F dt
To make mathematical treatment possible we have to
assume a homogeneous surface, i.e. Ed is not a function of 6.
Furthermore we can assume that readsorption occurs freely
with NH 3 in ZSM-5 under the conditions we used in the TPD
experiments (4). In this case F << Vs ka (1 - 6), so for
equation (6) is obtained
( 8) c Vm K 6
1- e
kd -68 K = A* [ des J k = exp R T A* = exp [:5
] a
At the maximum of the desorption curve
dC dTm
0
This gives with equa~ion (8)
!!.£__ dTm
AHdes r- 6Hdes J _6_ Vm A* -a-tm2 exp , R Tm 1-6
+ Vm A* (- AHdes ) exp R Tm d6 0 dTm •

- 42 -
(9) d6 -AHdes a (1-e) ,. -F 6 Km
R Tm2 va--s 1-6 (from eq. 7 and 8) --. dTm
From this we can obtain equation 5 in the following way
( 10) Km = Vs S ( 1-a) 2 AHdes A* (-AHdes) F R Tm = exp R Tm This can be rewritten to :
Tm2 Vs (1- 6) 2 AHdes (AHdes) B = F A* R exp RTm
(5). 2 log Tm - log S AHdes + log (Vs (1-6) AHdes) 2. 303 R Tm F A* R
As already stated, by plotting 2 log Tm - log B versus
1/Tm the slope of the straight line gives AH. This gives much
better results then applying one heating rate estimating the
last term of the equation (4,5).
Substituting F/(Vs B) from equation (10) in equation (9)
and solving the differential equation by integration from 9i
to em gives
(11)
Where
- ln (9m/9i)- 9i- (6m- 61),. (1 - 6) 2
AHdes R Tm and Tn • im
The same integration from em to 9 gives
X X
(12) ln (6)- 6 = ln (6m)- 6m- (l-6m)2 f (~-x/e: )2 dx o m

Where x = e (1-1/Tn) m
- 43 -
Cn C I Cm together with equation 8 gives
C 6 1 - 6m X
(13) n = 1 - a em e
Using a computer we can obtain from equation (11), (12)
and (13) Cn as a function of Tn and also C as a function of T
this is done with a = 1 • Now we can try to deconvolute the
experimental curve.
By varying em the theoretical curve can be fit to the
ascending slope of the first experimental peak. With the
fitted em the theoretical descending slope is computed. After
subtraction the theoretical curve from the experimental one,
the procedure is repeated for the remaining curve. The result
is shown in fig. Sa. It is possible to connect to each peak a
AHdes value by applying different heating rates as desribed
before. This results in decreasing AHdes values for peaks
with increasing Tm, which is physically impossible.
Furthermore not every catalyst shows the same number of re
solved peaks. So this way of curve resolving is unreliable.
If the theory is valid, it should also be possible to resolve
the curve in the opposite direction. So from high to low
tempera~ure (fig. 8b). In this way a direct resolving of the
HTP, which is of catalytic interest, is obtained. With this
method the HTP area is determined, for the LTP area the total
area minus the HTP area is taken. The bad fitting of the LTP
makes clear that the theoretical model can not be applied for
the whole plot. Because the theoretical curve shape is
asymetric with respect to Tm, curve resolving gives a better
method to determine the HTP peak area.

- 44 -
120
t -:;; 80 <'0 -Q) en c 0 40 c. en Q) ...
120
80
40
400 600 temperature (K )___....
Fig. 8 TPD curve resolving for catalyst IJ
a) in forward direction, b) in backward direction.
III.S. CONCLUSIONS
The cracking of n-hexane has been used to determine the
activity and deactivation of ZSM-5. This reaction seems to
have a threshold level for acid strength. Above this level
the activity only depends on the number of acid sites.
Therefore translation of n-hexane activity and deactivation
to other chemical reactions has to be done with great care.
- 45 -
To examine the relation between deactivation and acidity a
better model for deactivation then applied in this work is
needed.
NH 3-TPD is a useful method for characterising the
acidity of a catalyst in terms of acid strength (AHdes) and
the number of acid sites. For reliable values of ~Hdes the
met~od of different heating rates has to be applied. It was
not possible to relate the strong or weak acid sites to
discrete lattice positions. With curve resolving according to
Cvetanovic and Amenomiya it is not possible to distinguish in
a proper manner more than two acid strengths. The advantage
of the backwards curve resolving over determining just the
peak maximum temperature ~s the more accurate way of
determining the area of the HTP.
LIST OF SYMBOLS
A preexponetial factor
A* factor exp(~S/R)
c concentration, in reactor in
out = reactor out
Edes activation energy of desorption (kJ/mol K)
F carriergas flow rate (ml/min)
~Hdes heat of desorption (kJ/mol)
k rate constant (g n-hexane/g catalyst hr)
k 0 rate constant at t = 0
ka,d rate constant of adsorption, desorption
K equilibrium constant
n order
Nhtp number of NH 3 desorbing in high temperature peak
Nltp number of NH 3 desorbing in low temperature peak
r reaction rate
rdes desorption rate
R gasconstant
~s entropy
t time

- 46 -
T temperature (K)
Vm amount of NH 3 adsorbed at 9 = 1 (mol NH 3/cm3 catalyst)
Vs volume of the catalyst bed (cm3)
WHSV weigth hourly space velocity (g n-hexane/g catalyst hr)
X conversion
index i initial
m at peak maximum
n normalised to peak maximum (e.g. Tn T/Tm)
B heating rate (K/min)
e: factor AH/R Tm
a coverage
A deactivation constant
\1 frequency
III.6 REFERENCES
1. Auroux A., Bolls v., Wierzchowski P., Gravelle P. and
Vedrine J. c., J.c.s. Far. Trans., l1• 2544-2555(1979).
2. Tops~e N-Y, Pedersen K. and Derouane E.G., J.Cat., !Q,
41-52 (1981).
3. Cvetanovic R.J. and Amenomiya Y., Adv.' Cat., !.Z_,
103-149 (1967).
4. Gorte R.J., J. Cat., l}, 164-174 (1982).
s. Alnot M. and Cassuto A., Surf. Sci., 112, 325-342
(1981).
6. van den Berg J.P., PhD Thesis, Eindhoven Univ. Technol.,
Eindhoven (1981), The Netherlands
7. Auroux A., Gravelle P.C.,Vedrine J.C. and Rekas M.,Proc.
5th Int. Conf. Zeolites, 433-439 (1980), (ed Rees L.V.)
Heyden, London.
8. Haag w.o., Lago R.M. and Weisz P.B., Far. Disc. Chem.
Soc.,~. 317-330 (1982).
9. Weekman v.w. jr., Ind. Eng. Chem. Proc. Des. Dev.,
!._, 90-95 (1968).
10. Thakur D.K. and Weller s.w., ACS Monograph 121,
(Molecular Sieves) 596-604 (1973).

- 47 -
11. Olson D.H., Haag w.o. and Lago R.M., J, Cat.,~.
390-396 (1980).
12. Jacobs P.A., Beyer H. and Valyon J. ,Zeolites, l• 161-168 (1981).
13. Erdem A and Sand L.B., Proc. 5th Int. Conf. Zeolites,
64-72 (1980), (ed. Rees L.V.), Heyden, London.
14. Langner B.E.,Ind. Eng. Chem. Proc. Des. Dev., 20,
326-331 (1981).

- 48 -
CHAPTER IV STRUCTURAL CHARACTERIZATION OF ZSM-5
BY MAGIC-ANGLE-SPINNING NMR
IV.l INTRODUCTION
Most of the structural information of ZSM-5 has been
obtained from X-ray diffraction (XRD). Extensive studies
(1,2) revealed that ZSM-5 as-synthesized possesses ortho
rhombic symmetry, with space group Pnma. After treatments
like cation exchange and calcination at high temperature, the
symmetry changed to monoclinic with space group P2 1/n (1).
However, XRD is not capable to distinguish between,Si and Al,
this because of their almost equal X-ray scattering proper
ties. With the introduction of superconducting high-field
magnets in combination with the technique of magic-angle
spinning (MAS), solid-state high-resolution NMR became
available (3). The applications of MAS-NMR on solids in
general (4) and in particular on zeolites (5) have been
reviewed recently. Before the development of MAS-NMR only
wide line NMR was possible on solids. The peaks are broadened
in solid-state NMR by homo- and heteronuclear dipolar inter
actions and by chemical shift anisotropies (CSA). The total
magnetic interaction Htot of a nucleus A in the presence of a
nucleus B is givert by:
H + H + H + H Zeeman A-B,dipolar A-A,dipolar CSA
(For nuclei with spin unequal to 1/2, like 27Al, also a
quadrupolar term should be included)

- 49 -
The Zeeman interaction splits the spin energy into two
levels (for nuclei with spin 1/2) under the influence of an
external magnetic field. In equilibrium the spins of the
nuclei A are distributed over the energy levels, the lower
level is more populated. An external magnetic field, with a
frequency corresponding to the energy difference between the
two levels, transfers a number of spins from the lower to the
higher level. This causes a change of impedance in the
transmitter/receiver coil which can be detected as a "NMR
signal". Alternatively, on modern equipment, pulse exitation
is used after which the spectrum may be obtained by sampling
the free induction decay, followed by fourier
transformation.
The last three terms of equation 1 cause a broadening of
the NMR peak of solids. Generally, the heteronuclear dipolar
interaction can be eliminated by decoupling the spin reser
voir B from that of A, by locking the B spins in the y-z
plane {were z is the direction of the external magnetic
field). In zeolites, in most cases, this term can be
neglected. The dipolar interactions, that can occur, between
29si and 27Al or lH are small because usually only a few Al
atoms or protons are present and they are not directly bound
to Si. The homonuclear dipolar interaction can also be
neglected. The natural abundance of 2 ~i, in the zeolite
lattice, or of 13c, in adsorbed species, is small and there
fore they are isolated and do not interact. 27Al which has an
abundance of 100 % is geometrically diluted in the lattice
and therefore the mutual interactions are also small.
However, its quadrupole moment and the coupling (dipolar or
scalar) to 2~i may well cause signal broadening of the 2%i
NMR lines.
So the main line broadening in zeolite NMR stems from the
chemical shift anisotropies (CSA). This CSA is caused by the
anisotropy in the distribution of surrounding electrons. In
(polycrystalline) solids, the crystals are oriented in all
directions, with respect to the external magnetic field,
thus yielding the well kno~~owder spectrum appearance. In

- 50 -
liquids the rapid isotropic tumbling of molecules averages
the different orientations of the nuclei and thus only the
isotropical shifts are left. When rotating the solid-state
sample, the orientational dependance of the CSA is given by:
2 2 2) HCSA = (3cos a- 1)(other terms) + (3/2sin a)oilzBO
Were a is the angle between the rotation axis and the
direction z of the external field B0, oi is the isotropical
shielding and I the spin component in z direction. Rapid z
rotation of the sample at an angle of 54°77'equals
(3cos2a - 1) to zero and (3/2 sinZa) to unity. The
anisitropic part is eliminated and orily the isotropic part is
left. Now, with MAS-NMR, it is possible to obtain much
improved spectra from zeolites.
With 29si and 27Al MAS-NMR structural information is
obtained. In zeolites the Si0 4 tetrahedra are connected with
0- 4 Al0 4 tetrahedra (Si(OAl)n, n = 0 -,4) resulting in 5
distinct 29gi signals (fig. 1) (6, 7). Loewensteins rule (8)
which forbids Al - 0 -Al linkages seemed at first to be
violated (6, 7, 9),but later, more detailed studies (10, 11)
reconfirmed the validity of this rule. The coordination of Al
can easily be investigated (12, 13). It is possible to
distinguish lattice (tetrahedrally coordinated) from extra
lattice (octahedrally coordinated) Al from their chemical
shifts of about 50 and 0 ppm, respectively.
In ZSM-5 zeolites, with high Si/Al ratio, for Si(OA1) 0 different lattice sites have been detected (14, 15).
Conclusions have been drawn with respect to crystal symmetry
and assignment of distinct 29gi peaks to specific lattice
possitions. In this chapter some additional results will be
presented and will be discussed.
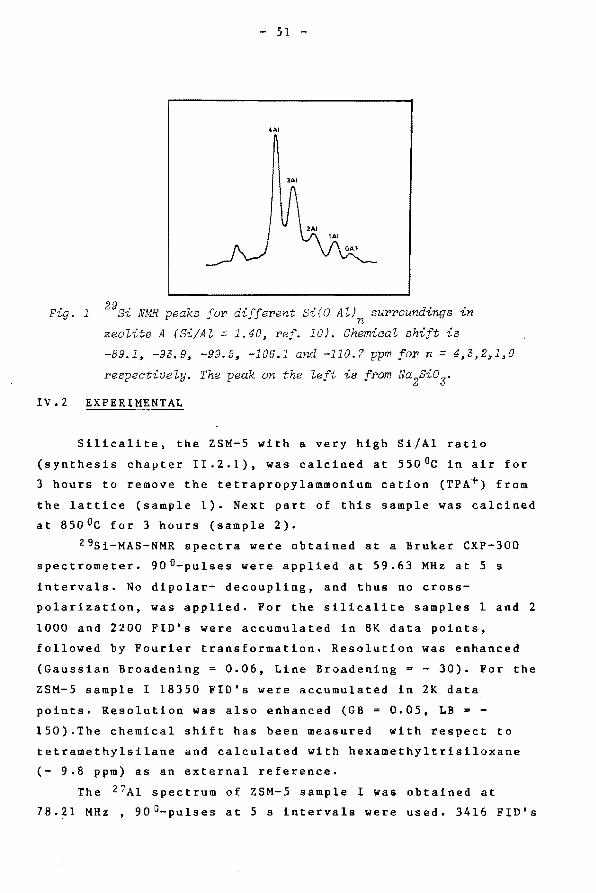
Fig. 1
- 51 -
4AI
lAI
NMR peaks for different Si(O Al) surroundinns in w •• n ·~
zeolite A (Si/Al = 1.40, ref. 10). Chemical shift is
-89.1, -93.9, -99.D, -106.1 and -110.7 ppm for n = 4,3,2~1~0
respectively. The peak on the left is from Na2Si03.
IV.2 EXPERIMENTAL
Silicalite, the ZSM-5 with a very high Si/Al ratio
(synthesis chapter 11.2.1), was calcined at 5500c in air for
3 hours to remove the tetrapropylammonium cation (TPA+) from
the lattice (sample 1). Next part of this sample was calcined
at 8So0c for 3 hours (sample 2).
29si-MAS-NMR spectra were obtained at a Bruker CXP-300
spectrometer. 900-pulses were applied at 59.63 MHz at 5 s
intervals. No dipolar- decoupling, and thus no cross
polarization, was applied. For the silicalite samples 1 and 2
1000 and 2200 FID's were accumulated in 8K data points,
followed by Fourier transformation. Resolution was enhanced
(Gaussian Broadening = 0.06, Line Broadening = - 30). For the
ZSM-5 sample I 18350 FID's were accumulated in 2K data
points. Resolution was also enhanced (GB = 0.05, LB • -
150).The chemical shift has been measured with respect to
tetramethylsilane and calculated with hexamethyltrisiloxane
(- 9.8 ppm) as an external reference.
The 27Al spectrum of ZSM-5 sample I was obtained at
78.21 MHz , 900-pulses at 5 s intervals were used. 3416 FID's

- 52 -
were accumulated in 8K data points. No resolution enhancement
was applied. Chemical shift is with respect to Al 2o 3•
For the silicalite spectra Gaussian peak-deconvolution
was done with a least-squares procedure. In this procedure
peak positions, widths and intensities are variables. Only
the number of peaks is fixed.
XRD diagrams were taken as in chapter II.2.2 .
IV.3 RESULTS AND DISCUSSION
IV.3.1 CURVE DECONVOLUTION OF SILICALITE
29Si-NMR SPECTRA
The XRD patterns of sample 1 and 2 are nearly identical.
However, peaks at 29 values 24.4 and 29.2 are single peaks
for sample 1 and split up for sample 2 (fig. 2). This
indicates a change from orthorhombic to monoclinic structure
due to the high-temperature treatment, in accordance with
earlier findings (1, 14)
a b
Fig. 2 XRD of silicalite a) sample 1 and b) sample 2.

- 53 -
The 29si NMR spectrum of sample 2 is comparable with
that of Fyfe et al. (14). Gaussian peak-deconvolution& were
carried out for samples 1 and 2 (fig. 3). The rrumber of peaks
was fixed at nine. Results are included in table 1. Without
assigning individual 2 9si NMR signals to specific tetrahedral
a
-109 -115 -117 --[,(ppm)
b
-109 ·111 -113 ·115 -n7 ---b(ppm)
Fig. 3 NMR speetra of siliealite a) sample 1 and b) sample 2.
Solid line - Gaussian eurve. Dots - experimental speetrum.
Solid line through dots - aeeumulated Gaussian eurves.

- 54 -
lattice positions, we can conclude from the deconvolution
procedure that NMR signals at the same positions contribute
to the spectra of samples 1 and 2. The relative intensities
and peakwidths differ between the two samples (vide infra).
We would like to note in passing that the relative contri
bution of the different peaks to the spectrum of sample 2
differ from those quoted in ref. 14 . And in our view the
assignment of a number of Si atom positions, in a repeat of
24 positions, to a specific NMR peak as presented in ref. 14
seems a rather arbitrary choice *· Moreover, the point of
widely different peakwidths is as yet unresolved. A
suggestion has been made that residual line broadening in
peakpositions peakwidth peakarea
(-ppm) (ppm) {%)
sample 1 2 1 2 1 2
peak
1 110.2 110.0 0.88 0.43 4.76 5.29
2 112.4 112 .o 1. 32 0.47 24.35 8.65
3 112 .a 112 .8 0.38 0.41 1.86 11.18
4 113;4 113.4 0. 7 8 0.53 18.35 23.07
5 114.1 114.1 0.66 0.48 20.48 27.12
6 114.7 114.7 0.69 0.62 11.15 10.20
7 115.3 115.2 0.74 0.35 7.00 2.42
8 116.1 116.0 0. 7 2 0.47 6.30 8.44
9 117 .o 117.1 0.96 0.42 5.74 4.65
Table 1 Results of NMR deconvolution.
* After this work was finished, it was demonstrated that
the use of still larger magnetic field strengths, with a
proton resonance of 400 MHz, enable the recording of higher
quality 29si NMR spectra in which at least 15 different
signals could be distinguished (16) ! This underscores our
remark on this point.
- 55 -
2 9si spectra of highly dealuminated ZSM-5 and other zeolites
might he caused by differing contributions to the 29si
chemical shift of Al in the second or higher coordination
sphere of the Si atom under study. In the present case, how
ever, this an unlikely explanation of our results since the
silicalite has been synthesized directly from Al free
reagents. The Si/Al ratio can be estimated at 5000 (minimal).
Consequently, no Si(OA1) 1 resonances (at about -105 ppm) are
found in our spectra which are completely located in the
Si(OA1) 0 range.
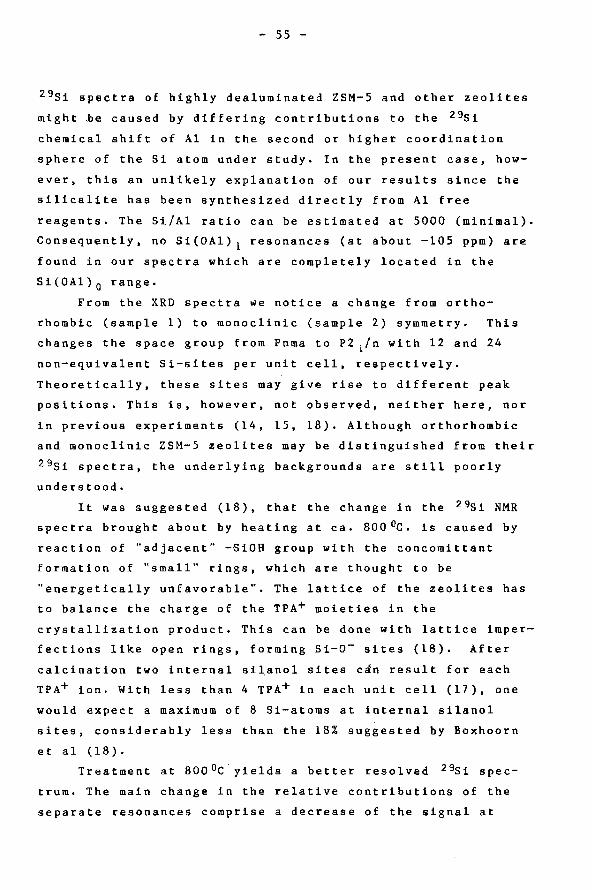
From the XRD spectra we notice a change from ortho-
rhombic (sample 1) to monoclinic (sample 2) symmetry. This
changes the space group from Pnma to P2 1/n with 12 and 24
non-equivalent Si-sites per unit cell, respectively.
Theoretically, these sites may give rise to different peak
positions. This is, however, not observed, neither here, nor
in previous experiments (14, 15, 18). Although orthorhombic
and monoclinic ZSM-5 zeolites may be distinguished from their
29si spectra, the underlying backgrounds are still poorly
understood.
It was suggested (18), that the change in the 29si NMR
spectra brought about by heating at ca. 800°c. is caused by
reaction of "adjacent" -SiOH group with the concomittant
formation of "small" rings, which are thought to be
"energetically unfavorable". The lattice of the zeolites has
to balance the charge of the TPA+ moieties in the
crystallization product. This can be done with lattice imper
fections like open rings, forming Si-0- sites (18). After
calcination two internal silanol sites c~n result for each
TPA+ ion. With less than 4 TPA+ in each unit cell (17), one
would expect a maximum of 8 Si-atoms at internal silanol
sites, considerably less than the 18% suggested by Boxhoorn
et a1 (18).
Treatment at 8000C yields a better resolved 29si spec
trum. The main change in the relative contributions of the
separate resonances comprise a decrease of the signal at

- 56 -
-111.97 ppm and an increase at -112.75 ppm. Smaller increase
are found at -133.44 ppm and -114.06 ppm, whereas a small
decrease is noted at -115.20 ppm. These results do not fit
with the suggestion (15) that peaks near -115.80 ppm are to
be ascribed to Si-atoms in four-membered rings, while at the
same time these rings are considred to be strained
(14, 15, 18) and therefore energetically unfavourable (18).
XRD measurements on ZSM-5 indicates that there are
considerable deviations from the tetrahedral angle of 109.50
for 0 - Si - 0 moieties in both the "four-"and "five
membered" rings (in reality: eight- and ten-membered rings,
respectively). The same applies albeit to a smaller extent,
to "six-membered" rings. The deviations are largest in the
five membered rings. Using deviations from tetrahedral bond
angles as criteria for ring strain, it is thus not possible
to ascribe strain to one particular type of ring. So, either
the lattice perfectioning process is considerably more com
plicated than small ring formation at high temperature (18),
or these rings do not absorb mainly in the low-frequency
region of the 29si NMR spectrum (14, 15, 18).
Another difference in the present results with respect
to previous reports (18) is that 29si NMR spectra with the
cross-polarization pulse sequence of samples 1 and 2 yield
only signals at the same positions as those in the single
pulse spectra but with slightly different relative areas.
Thus, no signal near -102 ppm, attributable to Si-OH sites is
observed at all.
rv.3.2. 29Si AND 27Al SPECTRA OF ZSM-5
The resolution of the 29si spectrum drastically
decreases with increasing Al content of the ZSM-5. Fig. 4
shows the spectrum of sample I which has a Si/Al ratio of
about 20.5 • Even treatment at 8000C does not enhance the
resolution significantly. With this Si/Al ratio we can only
expect (SiO) 4 - Si - (OAl) 0 and (SiO) 3 - Si - (OAl) l

- 57 -
-100 -110 -120 8 (ppm)__._
F . 4 29s. " ~g. ~ MHS NMR spectrum of ZSM-5, sampZe I.
configurations to be present. In each unit cell of 96 tetra
hedral sites there are only about 4 Al atoms. Even at homo
geneous distribution the distance from an Al to a Si atom
ranges from the first to the fourth coordination shell. At
random distribution greater differences can be expected (19).
So the influence of Al on the chemical shift of Si covers a
wide range, which broadens the individual 29si NMR peaks.
Only at high Si/Al ratios the Al - Si interaction becomes
negligible and good resolution is obtained (e.g. fig.2b, 14).
150 50 -50 8(ppm)__._
Fig. 5 27 AZ MAS NMR spectrum of ZSM-5 sampZe I.
- 58 -
At low ratios,where only a few (SiO)n - Si - (OA1)4-n con
figurations are possible, resolution is also good. This is
shown for zeolites A, X andY (e.g. 6, 10, 11).
The 27 Al spectrum of ZSM-5 sample 1 is shown in fig. S.
Tetrahedrally coordinated Al (in the lattice) has a peak at
about SO ppm, octahedrally coordinated Al (extra-lattice) at
about 0 ppm. Thus there is no extra-lattice Al present in
this sample, which is typical for the other samples described
in chapter II.
IV.4 CONCLUSIONS
MAS-NMR has contributed much to the knowledge of zeolite
&tructure. However, assigning the different Si(OA1) 0 peaks to
specific tetrahedra lattice sites is still tentative.
The above results lead us to conclude that closing of
energetically unfavourable rings of whatever type from
silanol sites plays only a minor role in determining the
spectral changes in 29si NMR spectra of the silicalite sample
treated at higher temperatures. More likely, a number of
subtle changes in the framework takes place, causing better
defined sites for the Si atoms within the framework going
from an orthorhombic to a monoclinic lattice. This process
does not cause a relative rise of spectral density in the
low-frequency range of the 29si NMR spectrum.
High magnetic field strengths are of great benefit for
better resolving the 29Si spectrum of low Aluminum zeolites.
It is also needed for 2 1Al NMR, because of the high quadru
pole moment of this nucleus. 27Al NMR does not give much
structural information. Although it shows that all Al,
present in the ZSM-5 used in this work, is incorporated in
the lattice on tetrahedral sites. From a catalytic point of
view the most important zeolites are those with intermediate
Si/Al ratios (chapter III). Unfortunately those are also the
most difficult NMR samples, because of the great variety of
Si-Al configurations in first or higher coordination shells,

- 59 -
which causes a poorly resolved spectrum.
IV.5 REFERENCES
1. Wu E.L., Lawton S.L., Olson D.H., Rohrman A.G~ and
Kokotailo G.T., J. Phys. Chem., 83, 2777-2781 (1979).
2. Olson D.H., Kokotailo G.T., Lawton S.L. and Meier W.M.,
J, Phys. Chem., ~. 2238-2243 (1981).
3. Mehring M., High Resolution NMR in Solids, Springer,
Berlin (1983).
4. Duncan T.M. and Dybowsky c., Surf. Sci. Rep., l• 158-250 (1982).
5. Fyfe C.A., Thomas J.M., Klinowski J. and Gobbi G.C.,
Angew. Chem., 95, 257-338 (1983).
6. Lippmaa E., Magi M., Samoson A., Tarmak M. and
Engelhardt G., J. Am. Chem. Soc., 103, 4992-4996, (1981).
7. K1inowski J., Thomas J.M., Fyfe C.A. and Hartman J.s.,
J. Phys. Chem., !!1. 2590-2594 (1981).
8. Loewenstein w., Am. Mineral.,~. 92-96 (1954).
9. Ramdas s., Thomas J.M., Klinowski J., Fyfe C.A. and
Hartman J.S., Nature, 2 228-230 (1981).
10. Melchior M. T. , Vaughan D.E.W., Jarman R.H. and Jacobson
A • J • ' Nature, 298, 455-456 (1982).
11. Klinowski J. ' Ramdas s •• Thomas J • M • ' Fyfe c.A. and
Hartman c. s •• J. c. s. Farad. Trans 2, 2_!!, 1025-1050
(1982).
12. Fyfe C.A., Gobbi G.c., Hartman J.s., Klinowski J, and
Thomas J.M., J. Phys. Chem., 86, 1247-1250 (1982).
13. Klinowski J,, Thomas J.M., Fyfe C.A. and Gobbi G.C.,
Nature, 2 , 533-536 (1982).
14. Fyfe C.A., Gobbi G.C., Klinowski J., Thomas J.M. and
Ramdas s., Nature, 296, 530-533 (1982).
15. Nagy J.B., Gabelica z., Derouane E.G. and Jacobs P.A.,
Chem. Lett., 2003-2006 (1982).
16. Fyfe C.A., Gobbi G.C. and Kennedy G.J., Chem. Lett.,
1551-1554 (1983).

- 60 -
17. Nagy J.B., Gabelica z. and Derouane E.G., Zeolites, !• 43-49 (1983).
18. Boxhoorn G., A.G.T.G. Kortbeek, Hays G.R. and Alma
N.C.M., Zeolites, ~. 15-21 (1984).
19. Vega A.J., A.c.s. Symp. Series 218 (Intrazeolite
Chemistry), 217-230 (1983) (eds. Stucky G.D. and Dwyer
F.G.).

- 61 -
CHAPTER. V DEACTIVATION OF ZEOLITE CATALYSTS
BY COKE FORMATION
V.1 INTRODUCTION
The most important catalytic applications of zeolites
are in the field of ihe petroleum and petrochemical industry.
Zeolite Y is widely used in cataly~ic cracking (1). Processes
with ZSM-5 are beginning to come into commercial operation.
Examples are the xylene isomerization to produce para-xylene
and the methanol-to-gasoline process (1, 2, 3). Also the
synthesis of hydrocarbons from synthesis gas is of interest.
In industrial applications catalyst deactivation is of great
economical and engineering importance. It is mainly due to
coke formation in and on the catalyst particle. In general
coke is considered to consist of low volatile products with
poly-aromatic structure and high C/H ratio. In this work we
want to define coke as the carboneceous material remaining on
the catalyst under reaction conditions (4). This material can
influence the activity in two manners : Firstly, active sites
can be occupied by coke, making further reaction impossible.
Secondly, transportation of reactants and products can be
hindered by coke deposition in the pores or by pore-mouth
blocking. Earlier investigations pointed out that in large
pore zeolites, like zeolite Y and mordenite, a combination of
the two phenomena caused deactivation (5, 6). Whereas in
medium-pore zeolites, like ZSM-5, deactivation is caused by
coke deposition on the outer surface and by pore-mouth
blocking (6, 7).
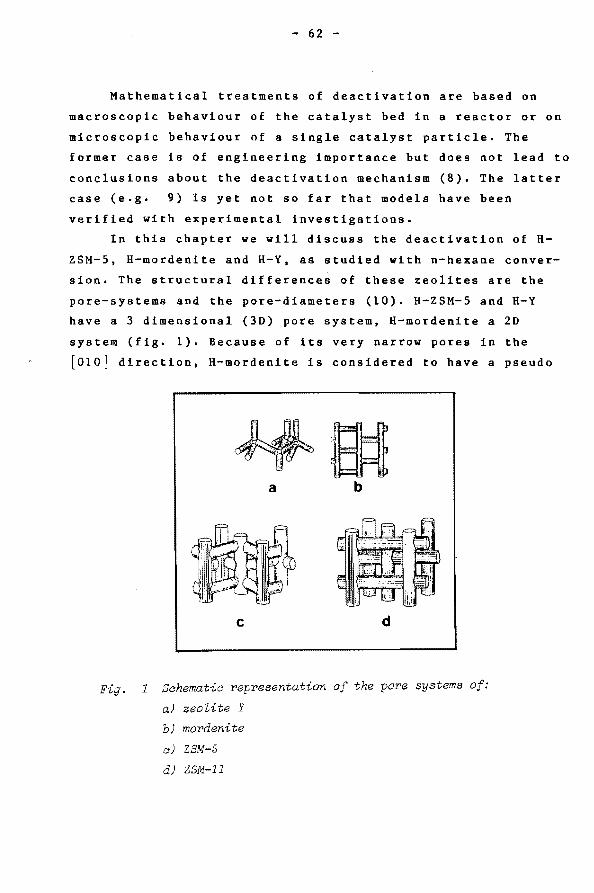
- 62 -
Mathematical treatments of deactivation are based on
macroscopic behaviour of the catalyst bed in a reactor or on
microscopic behaviour of a single catalyst particle. The
former case is of engineering importance but does not lead to
conclusions about the deactivation mechanism ( 8). The latter
case (e.g. 9) is yet not so far that models have been
verified with experimental investigations.
In this chapter we will discuss the deactivation of H
ZSM-5, H-mordenite and H-Y, as studied with n-hexane conver
sion. The structural differences of these zeolites are the
pore-systems and the pore-diameters (10). H-ZSM-5 and H-Y
have a 3 dimensional (3D) pore system, H-mordenite a 2D
system (fig. 1). Because of its very narrow pores in the
[010] direction, H-mordenite is considered to have a pseudo
a b
c d
Fig. 1 Sahematic representation of the pore systems of:
a) zeolite Y
b) mordenite
c) ZSM-5
d) ZSM-11
- 63 -
1D pore system. The pore diameters are about 5.5., 6.8 and
7.4 A for H-ZSM-5, H-mordenite and H-Y respectively. The
amount of coke will be determined by thermogravimetry and the
influence on pore-volume by n-butane adsorption.
Deactivation will be discussed qualitatively and no attemps
will be made to fit a particular mathematical model to
experimental results.
V.2 EXPERIMENTAL
The zeolites used in this chapter are H-ZSM-5 samples
(see table 2, chapter II), zeolite H-Y and H-mordenite. H-Y
is the commercial available SK-40 from Union Carbide and
H-mordenite is Zeolon from Norton. The Si0 2/Al 2o 3 ratio of H
y and H-mordenite are 5 and 13.35, respectively.
The deactivation is measured with n-hexane conversion as
desribed in chapter III with the same feed and under the same
reaction conditions (WHSV = 1 hr-1, Temperature= 3Q00c). The
pore-volume is measured with n-butane adsorption as described
in chapter II. Only the n-butane concentration was lowered to
a butane/helium ratio of 1/36 (5 ml c 4 and 180 ml He per min)
to make it possible to study the adsorption rate on the
zeolites. This does not influence the total amount of butane
adsorbed as will be shown. The drying temperature is lowered
to 3ooOc, which is the same as the reaction temperature. The
coke content is measured thermogravimetrically by measuring
the weight loss by in situ burning off with oxygen.
V.3 RESULTS
The coke deposition and pore-volume decrease as a result
of 300 min on stream in n-hexane conversion for the H-ZSM-5,
H-Y and H-mordenite catalysts is summarized in table 1. The
pore-volumes of E, F and I are the same as listed in table 3
of chapter II, so the decrease of the butane/helium ratio
from 1/5 (chapterii) to 1/36 (this chapter) does not

sample
E
F
I
L
N
H-Y
H-mordeniet
H+/uc wt % coke total conversion pore volume pore volume
n-C6 (g/g cat.) fresh cat. (ml/g) coked cat.
6.80 2. 25 2.52 0.168 0.146
3.29 2.07 1.69 0.156 0.146
4.41 1. 58 1. 71 0.156 0.132
3. 05 2.03 1. 54 0.153 0.134
3.07 1.93 1. 82 0.145 0.134
* 2.59 0.22 0.141 0.084
* 4.75 0.34 0.099 0.022
t.o.s. = 300 min, T t = 300 °c, load = 1 g n-hexane/(g aat) hr reaa or * not aonrparable with H-ZSM-5. Si0
2 I Al
2o3 ratio is 5 and 13.35 for
H-Y and H-mordenite, respectively. Degree of exchange is more than
0.95.
Table 1 Aging results in the n-hexane conversion for H-ZSM-5, H-Y
and H-mordeni te.
coke volume
(ml/g) (ml/g)
0.023
0.021
0.016
0.020
0.019
0.026
0.048

- 65 -
influence the total adsorption. This agrees with adsorption
isotherms already reported (12). Included is also the
integral conversion of n-hexane which is determined by
integrating the conversion versus time on stream plot of fig.
2.
t *50 0 E -co (.)
I c: 5 30 ·;; .. ~ c: 0 (,)
10
40 120 200 280 t.o.s. (min) •
Fig. 2 Conversion of n-hexane versus time on stream for H-ZSM-5
samples 1) 2) F, 3) I, 4) L, 5) N and 6) H~ordenite
and 7) zeolite H-Y.
The coke deposition as function of time on stream is
measured for H-ZSM-5 sample N and related to its conversion
(fig. 3). For every datapoint on the coke curve a fresh
catalyst is taken from the same batch N and for a certain
time exposed to the n-hexane feed. Also the pore-volume is
measured for each datapoint. The relation of the pore-volume

- 66 -
t Cll ~ 1.8 0
10
36 0.2
40 200 360 520 t:o.s. (min)-
Fig. 3 Conversion of n-hexane and the amount of aoke deposited
on H-ZSM-5 sample N versus time on stream.
t 0:16
-....... ~ E - 0.15 > a.:
40 120 200 280 t .o.s. (min) •
Fig. 4 Por9 volume of m.d amount of aoke deposited on H-ZSM-5
sample N versus time on stream during the aonversion of
n-hexane.

- 67 -
and the coke deposition versus time on stream is given in
fig. 4.
The result of n-butane adsorption versus time is shown in
fig. 5. It includes one typical example for the H-ZSM-5
catalyst and the adsorption behaviour of H-Y and H-mordenite,
for a fresh catalyst and for a catalyst after 300 min
n-hexane conversion.
From table 1 we can see that the coke deposition on the
zeolites H-Y and H-mordenite is greater than on the H-ZSM-5
samples. Taking into acount the very low conversion of n
hexane with zeolite H-Y we can estimate that about 8 times as
much of the cracked n-hexane is converted to coke in H-Y in
comparison with H-ZSM-5. For H-mordenite it is about 5 times
as much. Also within the H-ZSM-5 series the amount of coke
deposited varies. However, there is no relation between the
number of acidic sites (table 1) and the amount of coke, or
between the number of acidic sites and the total conversion.
This cannot be due to the difference in acid strength, since
for zeolites with different acid strength like H-ZSM-5,
offretite and H-mordenite equal initial coking rates have
been reported (6). Also there is no relation between the
amount of coke and the total n-hexane conversion. So these
results support the finding that coke deposition is deter
mined by the zeolite pore structure and dimensions (7, 13).
From a study on the nature of coke (4), as is formed
during cracking of parafins on acidic catalysts, we can
expect hi-and tri-aromatics to be the main coke species. With
an average density of 1 g/ml for these species the coke
volume listed in table 1 has been estimated. The decrease of
the pore-volume after 300 min on stream is for the H-ZSM-5
catalyst about equal to the coke volume. This does not mean
that all the coke is deposited in the pores. From fig. 3 it
follows that at constant pore-volume the coke deposition

-~6 -.! Q)4 c;
!!2 ;:, .D
I c;
8
4
2
8
6
4
2
- 68 -
8 16 24 32 40 adsorption time (min) •
Fig. 5 Adsorption of n-butane on: a) H-ZSM-5 sample N
b) zeolite H-Y
a) H-mordenite
for a fresh aatalyst (line) and for a aatalyst after
300 min n-hexane aonversion (broken).

- 69 -
contin.ues. So this must be external coke deposition. For H
mordenite th~ decrease of the pore-volume is about twice as
much as the coke volume. This means that part of the pores,
which are not filled with coke itself, are no longer
accessible by blocking of their entrance. That this way of
loosing pore-volume is easier with the 1 dimensional pore
system of H-mordenite than with the 3 dimensional system of
H-ZSM-5 is rather obvious and already reported (14). The 3
dimensional large-pore zeolite H-Y, however, also has a great
loss of pore-volume relatively to its coke depostion. This
seems to agree with earlier findings (6, 13) that the small
pore zeolites H-ZSM-5 and H-mordenite mainly have coke
deposition on the outer shell or external surface of the
particle, whereas zeolite H-Y has coke deposition in the
pores.
The deactivation of H-ZSM-5 sample N terminates after
150 min on stream (fig. 3). The amount of coke, however, is
still increasing. Although not so clear, also the pore-volume
decreases the first 150 min and becomes almost constant
thereafter. Appearently after 150 min the coke formation does
neither decrease the number of acid sites nor their
accessibility.
The adsorption of n-butane (fig. 5) is used for deter
mining the pore-volume of the fresh and the deactivated
catalyst as wel as the diffusion limitation caused by the
coke deposition ••
The adsorption on sample N is typical for H-ZSM-5. The
pore-volume of the coked H-ZSM-5 is about 10 % lower than
that of the decoked one. The rate of adsorption is equal.
After 30 min no more butane is adsorbed. For zeolite H-Y the
adsorption rate is almost the same for the coked and the
decoked catalyst. The top level of the coked catalyst is much
lower as for the decoked. After 12 and 24 min for the coked
and decoked H-Y, respectively , there is still adsorption at
a very low rate. H-mordenite behaves different. The coked
sample has a constant low adsorption rate and a small pore

- 70 -
volume. The decoked catalyst has initially a high adsorption
rate, successively an intermediate and finally the same low
rate as the coked catalyst.
The coking of zeolites can have three different
consequences: Active sites are poisoned by coke, pore volume
is decreased and diffusion is limited by pore or pore-mouth
blocking. The first factor does not have a large influence on
the adsorption results. For a~zsM-5 the pore volume of the
coked sample is a little lower. Dejaifve (6) did not report a
loss of pore volume but he found a decrease of 25 % of NH 3 adsorption. On itself NH 3 adsorption is a sensitive method
for detecting the number of acid sites. Such a large
decrease, however, must also have consequences for the pore
volume. The adsorption rate is not altered by the coke. This
has to be due the 3 dimensional pore system, making every
place in the particle still accessible by bypassing the coke.
Gabelica (15) reports a slower adsorption of n-hexane for a
coked H-ZSM-5. His thermogravimetric results, however, show
only a slight difference (fig. 2 of ref. 15). Zeolite H-Y has
a considerable loss of pore volume. The adsorption rate does
not change that much. Pores which are not filled with coke
are still readily accessible. H-mordenite shows both pore
volume loss and decrease of the adsorption rate. Probably the
adsorption rate is strongly reduced by pore-mouth blocking or
coke formation in the outer region of the particle. A very
slow adsorption could be possible through the narrow pores in
the [010] direction (see above). The re~ults for H-Y and H
mordenite are in good agreement with the literature (6, 7,
13).
V.5 CONCLUSIONS
Deactivation of zeolites is caused by the formation of
carbonaceous deposits which do not leave the catalyst under
reaction conditions. Generally these are called coke. Our
findings that the amount of coke is determined by pore-

- 71 -
structure and -dimensions and not by the number or acid
strength of active sites is in·agreement with literature
(6, 7, 12). Compared with H-Y and H-mordenite, H-ZSM-5 shows
a high activity and great stability. This is due to a low
loss of pore volume and a remaining high accessibility of the
active sites. In contrast with literature (15) a small loss
of pore volume is found for H-ZSM-5. During the n-hexane
conversion the activity initially decreases together with the
pore volume but after a certain time both become stable while
the coke content still increases. This leads to the
suggestion that deactivation in H-ZSM-5 is caused by internal
coking of the catalyst during the beginning of the reaction
period. It is found that acidic sites are occupied by coke
(5, 6, 15).There must be a limited number of places which
have room enough for the formation of large carbonaceous
species, which are to big to diffuse out of the particle.
Such places can be stacking faults in the lattice. Once these
places are filled with coke, internal coking stops and
activity no longer decreases. From that moment the coke is
deposited only on the outer surface and accessibility of the
active sites does not decrease noticably anymore. The
different behaviour of the H-ZSM-5 samples may be explaind by
differences in the number of these faults. However, with XRD
these differences could not be observed.
V.6 REFERENCES
1. Vaughan D.E., Prop. Appl. Zeolites, 294-328 (1979),
(ed. Townsend) London.
2. Flanigan E.M., Proc. 5th Int. Conf. Zeolites, 760-780
(1980), (ed. Rees L.V.) Heyden, London.
3. Titchener A.L., Chem. Ind., 3.!_, 841-846 (1982).
4. Appleby W.G., Gibson J.W. and Good G.M., Ind. Eng. Chem.
Proc. Des. Dev., !.• 102-11~ (1962).
5. Blackmond D.G., Goodwin J.G. and Lester J,F., J. Cat.,
78, 34-43 (1982).

- 72 -
6. Dejaifve P., Auroux A., Gravelle P.C, Vedrine J.c., Gabelica z. and Derouane E.G., J. Cat, 70, 123-126
(1981).
7. Walsh D.E. and Rollmann L.D., J. Cat., 1i• 195-197
(1979).
8. Wolf E.E. and Alfani F., Catal.Rev.-Sci. Eng.,~.
329-371 (1982).
9. Beeckman J.w. and Froment G.F., Ind. Eng. Chem. Fundam.,
~. 243-250 (1982).
10. Meier W.M. and Olson D.H., Atlas of zeolite struct~re,
Polycrystal Book Service, Pittsburg, USA (1978),
11. Breck D.W., Zeolite Molecular Sieves, 605 (1974),
Wiley, New York.
12. Rollmann L.D., J. Cat., !I• 113-121 (1977).
13. Butt J.B., Delgado-Diaz S. and Muno W.E., J. Cat., !L, 158-165 (1975).
14. Eisenbach D. and Gallei E., J, Cat., 56, 377-389 (1979).
15. Gabelica z., Gilson J.-P. and Derouane E.G., Proc. 2th
Eur. Symp. Therm. Anal., 434-438 (1981).
- 73 -
CHAPTER VI INFRARED SPECTROSCOPY ON ZSM-5
VI.1 INTRODUCTION
Infrared spectroscopy can provide information about the
acidic properties as well as about the sttucture of
zeolites.
The first issue has been studied extensively for a
variety of zeolites and reviewed by Ward (1). More recently
also infrared studies have been made to characterize the
acidity of ZSM-5. Spectra of dehydrated H-ZSM-5 without or
with adsorbed pyridine gives information of the Br6nsted and
Lewis acid sites (e.g. 2,3). The spectral region is 3550-
3750 cm-1 for the OH vibrations and 1450-1650 cm-1 for the
bound pyridine vibrations.
The structural information is obtained from the 200-
1400 cm-1 region, since the fundamental vibrations of the
tetrahedra present in aluminosilicate frameworks have bands
in this region. In an extensive study Flanigan and coworkers
(4) have proposed an assignment of the infrared bands to
certain structural properties of zeolites. They distinguish
internal and external tetrahedral vibrations. The first type
is not structure sensitive and is also found in crystalline
and amorphous silica (e.g. 5). The infrared absorptions are
due to symmetrical and asymmetrical 0 - T - 0 stretches (T is
Si orAl). The second type is structure sensitive. The
vibration frequency depends on the way tetrahedra are linked
together. According to Flanigan (4) certain infrared bands

- 74 -
can be assigned to double ring structures and pore rings. It
is suggested by Jacobs et al. (6) that the double -5-ring
structure of ZSM-5 and ZSM-11 gives rise to bands at 615, 575
and 550 cm-1.
Both in the internal and external tetrahedral vibrations
the Al content of the zeolite can be recognized. Generally an
increase of the Al content lowers the vibration frequency of
a specific band (e.g. 4). This is due to the smaller Al - 0
bond strength compared with Si - 0. The mass difference
between Al and Si has only a minor influence. Therefore it
seems not possible to discriminate between Si - 0 and Al - 0
bands. However, it has been suggested that the band at about
730 cm-1 can be ascribed to isolated Al04 tetrahedra (7). In
contrast it is generally agreed that bending vibrations (at
about 450 cm- 1 ) are not influenced by the Al content (4, 8).
Although these assigments are still rather qualita
tively, infrared spectra are a good fingerprint for recog
nizing the type of zeolite. Its sensitivity for $hort range
order, makes it a more suitable tool for detecting the
beginning of crystallinity during synthesis than XRD (9, 10).
Typical ratios A/B are 0.72 for ZSM-5 and 0.60 for ZSM-11
(where A is the optical density of the 550- 660 cm-1 region
and B that of 440 - 480 cm-1). The development of Fourier
transform infrared (FT-IR) machines (11) improved the
sensitivity and spectral resolution considerably. FT-IR is
possible with very low transmittance. This is a great advan
tage when working with self-supporting zeolite discs, which
is necessary to study OR or bound pyridine vibrations.
In this chapter the influence of Al on the infrared
spectrum of ZSM-5 in the region of 400 to 1400 cm-1 will be
dicussed. Attention is payed to the structural information
that can be obtained with infrared spectroscopy by comparing
different types of zeolites. Two more items of investigation
are the spectra obtained at 77 K and the influence of the
various sample pretreatments on the infrared spectra.

- 75 -
VI.2 EXPERIMENTAL
The zeolites used in this chapter are the different
ZSM-5 samples (as mentioned in chapter II) and the zeolites
Y, A and mordenite. Y is SK-40 (Na-Y) and A is 4A sieve (Na
A) from Union Carbide. Mordenite is Zeolon (H-mordenite) from
Norton. Si0 2/Al 2o 3 ratios are 5, 2, 13.35 respectively.
All spectra in this chapter were obtained with a Bruker
LfS ll3v. This is a single beam Fourier-transform spectro
photometer. As infrared source was used a globar (Sir.) and as
detector a deuterated triglycinesulphate pyroelectric
detector for the 400-1400 cm-1 region.
For the low frequency room temperature measurements the
samples were embedded in KBr (1 mg or less zeolite, see text
of figures, in 200 mg KBr, discs are 13 mm in diameter) and
placed in the evacuated sample compartiment of the spectro
photometer. The spectral resolution is 4 cm-I unless other
wise stated. For the low temperature measurements the KBr
discs are placed in a special cell in which the sample holder
can be cooled with liquid nitrogen to 77 - 79 K.
VI.3 RESULTS AND DISCUSSION
The influence of Al on the frequency of specific inter
nal and external vibration bands has been extensively studied
for zeolite Y (4, 7, 8, 12, 13). The zeolites X, Y and US-Y
(ultra stable) having the same structure and have a Al/Si+Al
ratio from 0.5 to a minimum of about 0.1. In this range a
linear relationship is found between the Al content and the
position of bands at about 617, 837, 798, 1090 and 1186 cm-1
(8, wavenumbers in this reference extrapolated to an Al
content of zero). For a stable ZSM-5 the Al/Si+Al ratio is
always below 0.1. In fig. 1 infrared spectra are shown of
some ZSM-5 samples with different Al contents includin~
silicalite. In table 1 the positions of some charact~rlstic
vibration bands are summarized. For the Al containing ZSM-5

1.0
c 0 ·u;
.!!? E (/) c e -
0.0
- 76 -
600 800 1000 1200 wavenumber (cm-1)
Fig. 1 Infrared spectra of ZSM-5 samples with different Al content.
Al/(Si+Al) mg/g KBr
a) F 0.038 5.0
b) L 0.032 1.65
c) M 0.028 5.0
d) K 0.013 . 5. 0
e) silicalite 0.0 5.0 -1 (400-880 em ) 0.29 -1 (880-1400 em )

- 77 -
sample Al/(Si+Al) frequencies (cm-1)
F 0.038 548 586 625 797
L 0.032 548 586 625 798
M 0.028 550 586 625 798
K 0.013 548 586 627 798
silicalite o.o 552 588 629 804
Table 1 Infrared bandpositions of of ZSM-5 samples of fig. 1.
samples the band position is independent on the Al content.
Silicalite seems to have the highest frequencies, but the
differences are small and in the the order of the spectral
resolution. The linear relationship between the Al content
and the band position that applies to faujasites in the
Al/Si+Al ratio from 0.5 to 0.1 is not found for ZSM-5. The
vibration band positions of the low Al ZSM-5 seems to be
independent on the Al content. It is likely that this can be
stated for every zeolite if it could be prepared in the same
low Al region, i.e. a Al/Si+Al ratio below 0.1.
No changes in the relative band intensities could be
observed with decreasing Al content. This agrees with earlier
reports for zeolite Y (8). Others (7, 14), however, reported
for Y and mordenite a decrease of the intensity of a band at
730 cm- 1 with decreasing Al content.
The most significant feature in the ZSM-5 serie (fig. 1)
is that with decreasing Al content the number of peaks, that
can be distinguished, increases and that their bandwidths
decrease. This is already reported by von Ballmoos (15). As
will be discussed lateron this is a result of the varying Si
Al coordination distance. High temperature treatment changes
the spectrum of an Al containing ZSM-5 in a silicalite like
spectrum (see fig. 2) A reason for this phenomenon can be the
migration of Al from lattice sites to extra-lattice
positions (16). The influence of A1 on the bandwidth becomes
visible only at high Si/Al ratios (probably 100 or more): the

- 78 -
bands become sharper. That such a low Al content is necessary
can be explained by the fact that, for a homogeneous
distribution, even at a Si/Al ratio of 100 every Si has an Al
in at least the third coordination shell. Another
explanation, that during heat treatment dealumination
together with a perfectioning of the lattice occurs, is not
likely (12). Heat treatment of silicalite does not change its
1.0
c 0
'Ci) .!! E 0 c e ....
0.0
2
600 800 1000 1200 wavenumber (cm-1)
Infrared speatra of ZSM-5 mg/g KBr
a) M calcined at 0 550 C for 3 hr 5.0
b) M additionally aatcined at 0 880 C for 1 hr 1. 65
c) siUcalite 1.45

- 79 -
spectrum. There are no reasons (e.g. synthesis procedure,
XRD) to believe that silicalite has a better crystallinity
than ZSM-5.
In order to obtain structural information the spectra of
3 different types of zeolites are compared in fig. 3. Zeolite
Y and mordenite are dealuminized. From a comparison with the
literature (12, 14) we can expect that further dealumination
will not raise the band frequencies anymore. According to
1.0
c 0 ·u; .~ E (f) c ~ -
0.0
a
600 800 1000 1200 wavenumber (cm-1)
Fig. 3 Infrared spectra of
a) dealuminated H-Y
mg/g KBr
3.0
b) dealuminated H~ordenite 3.0
a) ZSM-5 sample L 3.0

- 80 -
Flanigan (4) the vibration bands of Y can be assigned to:
T- 0 bending, 461 cm-1, double 6-rings (D6R), 613 cm-1,
internal symmetrical stretch, 678 cm-1 and external
symmetrical stretch, 791 and 831 cm-1. The assignment of the
D6R is supported by normal coordinate calculations (13). From
the spectra it can be seen that the symmetry of the zeolites
increases in the sequence ZSM-5, mordenite and Y. It seems
that in ZSM-5 and mordenite similar bands, although shifted,
can be recognized as in zeolite Y. This is indicated in table
2. The band at 613 cm-1 in Y is assigned to D6R. This band
corresponds to the 577 cm-1 band in the Al rich Na-Y in
fig. 4. In the same figure are shown the spectra of Na-X and
Na-A. In Na-A, however, the double ring is a double 4-ring
(4,13). The difference in frequency between the D6R of Na-i
and the D4R in Na-A seems to be mainly a consequence of
different Al content in both zeolites. Taking this into con
sideration it is likely that the 550 cm-1 band of ZSM-5 and
corresponding bands in mordenite and Y are typical zeolite
features (4, 10, 14), and can be used to determine the
crystallinity (9). However, the assignment to structural
groups is still a subject of research. ' The influence of Al on the infrared spectra can also be
seen in fig. 5. In this figure the spectra of silicalite, K
(ZSM-5), mordenite and Na-A obtained at 77 K are shown. Also
sample frequencies (cm-1)
H-Y 613 678 831
H-Mordenite 573/594 660 798/825
L (ZSM-5) 548 625 798
TabZe 2 infrared bandpositions of zeoZite sampZes of fig.3.

- 81 -
is indicated in which figure the corresponding room
temperature (RT) spectra are shown. The 77 K spectra of
silicalite is very well resolved, much more than the RT spec
trum. Going from RT to 77 K the spectra of Na-A and K {with a
Si/Al ratio of 76) are also improved, but not so much as with
silicalite. The slightest improvement is obtained with de
aluminated mordenite. The bandwidth of specific vibration
bands depends on two factors. Firstly the natural bandwidth,
but unfortunately there is no satisfying theory describing
1.0
c: 0 ·c;; .~ E t/) c: ~ -
0.0
Fig. 4
600
Infrared
a) Na-A
b) Na-X
C) Na-Y
800 1000 1200 wavenumber (cm-1)
speatra of A'L/(Si+Al) mg/g KBr
0.5 0.33
0.44 1.0
0.29 0.33

1.0
c: 0 ·u; -~ E UJ c ~ -
0.0
600
Fig. 5 Infrared spectra of:
a) Na-A
b) H-mordenite
c) K (H-ZSM-5)
d) siliaalite
- 82 -
a
800 1000 1200 wavenumber (cm-1)
mg/g KBr
5
5
5
5 (400-900 cm-1) -1 1.45 (900-1400 em )
-1 -1 Spectral resolution is 1 am for siliaalite, all others 4 em •
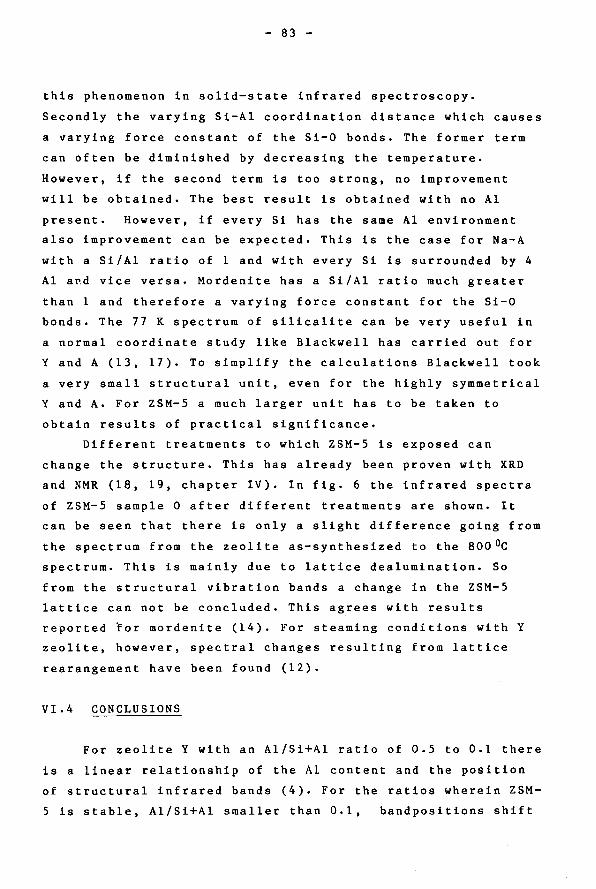
- 83 -
this phenomenon in solid-state infrared spectroscopy.
Secondly the varying Si-Al coordination distance which causes
a varying force constant of the Si-0 bonds. The former term
can often be diminished by decreasing the temperature.
However, if the second term is too strong, no improvement
will be obtained. The best result is obtained with no Al
present. However, if every Si has the same Al environment
also improvement can be expected. This is the case for Na-A
with a Si/Al ratio of 1 and with every Si is surrounded by 4
Al a~d vice versa. Mordenite has a Si/Al ratio much greater
than 1 and therefore a varying force constant for the Si-0
bonds. The 77 K spectrum of silicalite can be very useful in
a normal coordinate study like Blackwell has carried out for
Y and A (13, 17). To simplify the calculations Blackwell took
a very small structural unit, even for the highly symmetrical
Y and A. For ZSM-5 a much larger unit has to be taken to
obtain results of practical significance.
Different treatments to which ZSM-5 is exposed can
change the structure. This has already been proven with XRD
and NMR (18, 19, chapter IV). In fig. 6 the infrared spectra
of ZSM-5 sample 0 after different treatments are shown. It
can be seen that there is only a slight difference going from
the spectrum from the zeolite as-synthesized to the 8000C
spectrum. This is mainly due to lattice dealumination. So
from the structural vibration bands a change in the ZSM-5
lattice can not be concluded. This agrees with results
reported ror mordenite (14). For steaming conditions withY
zeolite, however, spectral changes resulting from lattice
rearangement have been found (12).
VI.4 CONCLUSIONS
For zeolite Y with an Al/Si+Al ratio of 0.5 to 0.1 there
is a linear relationship of the Al content and the position
of structural infrared bands (4). For the ratios wherein ZSM-
5 is stable, Al/Si+Al smaller than 0.1, bandpositions shift

- 84 -
hardly with Al content. The shift is much too low for using
the bandposition as a measure for the Al content as it is
done for zeolite Y (4, 7, 8, 12, 13).
With the low Al ZSM-5 it is shown ~hat the bandwidth
1.0
c .Q fn .!! E fn c e -
0.0
1000 1200 wavenumber (cm-1)
600 800
Fig. 6 Infrared speatra of ZSM-5 sampZ.e 0 With varying aonsecutive
pretreatments: a) as-synthesized
b) aaZ.ained at 550 °C for 3 hr + a) NH4 exahanged
d) aaZ.ained at 550 °C for 3 hr
e) aaZ.ained at 780 °C for 3 hr

- 85 -
decreases with decreasing Al content. This also found for
29si-NMR bandwidths. Although in IR spectroscopy and NMR
different interaction mechanisms occur, it seems to be that
in both cases the varying influence of Al on the Si atoms
causes the decrease in bandwidth (see chapter IV). At 77 K
very well resolved structural spectra can be obtained for
ZSM-5 and silicalite. Assignments of specific bands to
structural groups is, however, still very qualitative. The
improvement which can be obtained by low temperature
measurements depends also on the Al content of the zeolite.
The lower the Al content the better the peak resolution.
Also a Si/Al ratio of 1, in zeolite A, with consequently a
homogeneous ditribution, makes an improvement possible.
VI.S REFERENCES
1. Ward J.w., ACS Monograph 1 (Zeolite chemistry and
catalysis), 118-284, (1976) (ed.Rabo J.A.).
2. Vedrine J.C.,Auroux A., Bolis v., Dejaifve P., Naccacbe
c., Wierzchowski P., Derouane E.G., Nagy J.B.,
Gilson J.-P., van Hooff J.H~C., v~n den Berg J.P. and
Wolthuizen J., J, Cat., 1!,248-262 (1979).
3. Auroux A., Bolis v., Wierzchowski P., Gravelle P.c. and
Vedrine J.C., J. c. s. Farad. Trans. 1, Z1· 2544-2555
(1979).
4. Flanigan E.M., Khatami H. and Szymanski H., Adv. Chem.
Series, 101, 201-229 (1971).
5. Lazarev A.N., Vibrational spectra and stucture of
silicates (1972), Consultants Bureau, New York.
6. Jacobs P.A., Beyer H.K. and Valyon J., Zeolites, l• 161-
168 ~1981).
7. Pichat P., Beaumont Rand Bartbomeuf D., J. c. s. Farad. Trans. 1, 70, 1402-1407,(1974).
8. Lohse u.,Alsdorf E. and Stach H., z. anorg. allg. Chem.,
447, 64-74 (1978).
- 86 -
9. Jacobs P.A., Derouane E.G. and Weitkamp J,, J, c. s. Chem. Comm., 591-593 (1981).
10. Coudurier G., Naccache c. and Vedrine J.C., J, c. s. Chem. Comm., 1413-1415 (1982).
11. Bell R.J,, Introductory Fourier transform spectroscopy
(1972), Acedemic Press, New York.
12. Scherzer J, and Bass J.L., J, Cat.,~. 101-115 (1973).
13. Blackwell c.s., J. Phys. Chem., 83, 3275-3261 (1979).
14. Baik Hyon Ha, Guidot J. and Barthomeuf D., J, c. s. Farad. Trans. 1, 7 , 1245-1253 (1979).
15. von Ballmoos R., Dissertation ETH ZUrich, Sauerlander,
Aarau (1981).
16. Klinowski J,, Thomas J,M., Fyfe C.A., and Gobbi G.C.,
Nature, 296, 533-536 (1982).
17. Blackwell c.s., J, Phys. Chem., ~. 3251-3257 (1979).
18. Fyfe C.A., Gobbi G.C., Klinowski J., Thomas J,M. and
Ramdas s., Nature, 29 530-533 (1982).
19. Wu E.L., Lawton S.L., Olson D.H., Rohrman A.C. and
Kokotailo G.T., J. Phys. Chem., 83, 2777-2781 (1979).
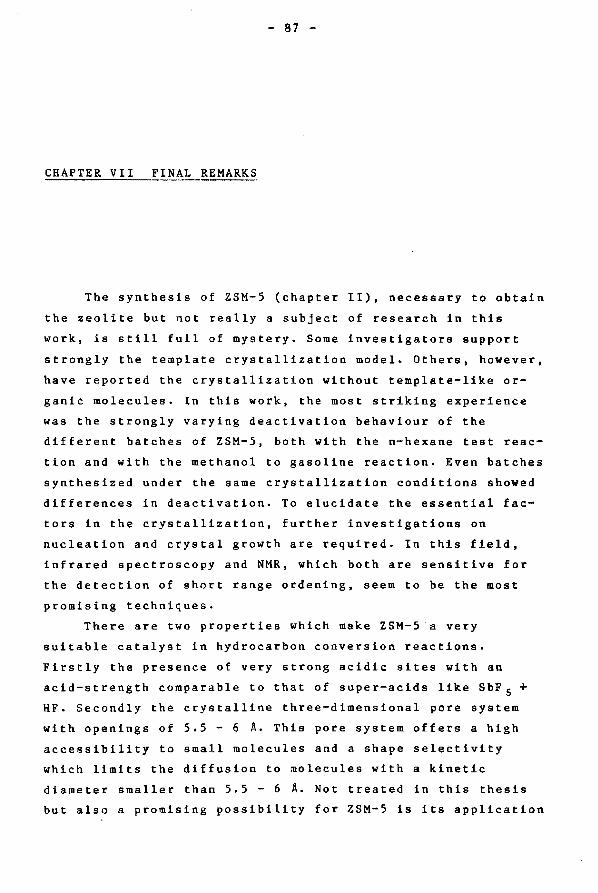
- 87 -
CHAPTER VII FINAL REMARKS
The synthesis of ZSM-5 (chapter II), necessary to obtain
the zeolite but not really a subject of research in this
work, is still full of mystery. Some investigators support
strongly the template crystallization model. Others, however,
have reported the crystallization without template-like or
ganic molecules. In this work, the most striking experience
was the strongly varying deactivation behaviour of the
different batches of ZSM-5, both with the n-hexane test reac
tion and with the methanol to gasoline reaction. Even batches
synthesized under the same crystallization conditions showed
differences in deactivation. To elucidate the essential fac
tors in the crystallization, further investigations on
nucleation and crystal growth are required. In this field,
infrared spectroscopy and NMR, which both are sensitive for
the detection of short range ordening, seem to be the most
promising techniques.
There are two properties which make ZSM-5 a very
suitable catalyst in hydrocarbon conversion reactions.
Firstly the presence of very strong acidic sites with an
acid-strength comparable to that of super-acids like SbF 5 +
HF. Secondly the crystalline three-dimensional pore system
with openings of 5.5 - 6 A. This pore system offers a high
accessibility to small molecules and a shape selectivity
which limits the diffusion to ~oleeules with a kinetic
diameter smaller than 5.5 - 6 A. Not treated in this thesis
but also a promising possibility for ZSM-5 is its application

- 88 -
as a metal support. This opens the way to shape selective
Fischer - Tropsch reactions and bifunctional catalysis, e.g.
the conversion of CO + H2 via methanol to gasoline in one and
the same catalyst particle.
The acidity of H-ZSM-5 has been studied with NH 3-TPD
(temperature programmed desorption of ammonia) as described
in chapter III. A relation between the Si0 2/A1 2o 3 ratio and
the observed acid-strength could be obtained. Maximum acid
strength is reached with a Si0 2/Al 2o 3 ratio of about 50.
However, for all other possible ratios the acid-strength is
still high enough to catalyze the cracking of n-hexane. It is
pointed out ~hat the activity for this reaction is determined
by the number of acidic sites and not by their acid-strength.
A relation between acidity and deactivation has not been
found.
The specific pore system of ZSM-5 is responsible for the
slow deactivation when used as a catalyst. As shown in
chapter V H-ZSM-5 gives a higher conversion of n-hexane and
has a better stability than H-mordenite and zeolite H-iY. Only
a small amount of coke is formed in the ZSM-5 pores and the
coke deposition on the external surface of the zeolite par
ticles slightly influences the activity; it even increases
the selectivity, for example for para-xylene. It is suggested
(chapter V) that initially coke is formed at certain places,
like stacking faults in the zeolite lattice. This can explain
the difference in deactivation behaviour of the different
ZSM-5 batches as reported in chapter III. As already stated,
the synthesis of ZSM-5 is very sensitive to small variations
in the crystallization conditions (chapter II). So it is to
be expected that the number of internal coking sites is not
the same for every batch.
The structural properties of ZSM-5 have been studied
with 29si and 27Al MAS-NMR and with infrared spectroscopy
(chapters IV and VI). In these studies silicalite turned out
to be a very useful model compound. It possesses the same
structural properties as ZSM-5 but it lacks the influence of

- 89 -
Al on the 29si NMR and infrared spectra. Especially in 29si
NMR, but also to some extent in infrared spectroscopy, Al
causes a broadening of the spectral lines. In both techniques
this is due to different Si-Al coordination distances that
give rise to a specific NMR peak or infrared band.
The power of 29si NMR and infrared spectroscopy would be
much improved if it were possible to assign the spectral
feat~res to structural groups.
With 29si MAS-NMR combined with the cross-polarization
pulse technique silanol sites (Si-OH) can definitely be
assigned. The assignment of the other peaks, for instance to
4, 5, 6 and 10 Si or Al membered rings, is still a problem.
In infrared spectroscopy the assignment of bands in the
structural region (400- 1400 cm- 1) is very qualitative.
Only external and internal (symmetrical and asymmetrical)
stretching bands have been distinguished for the SiO~ and
Al0 4 tetrahedra. The band at about 550 cm-1 is characteristic
for ZSM-5. Low temperature spectra, obtained at about 77 K,
of silicalite are very well resolved. With these spectra
attemps could be made to assign the number of bands and their
positions with the aid of normal coordinate calculations.
Although this is a complex problem, its solution would
greatly improve the theoretical background of ZSM-5
knowledge.
Special treatments of ZSM-5, like high temperature cal
cination (SooDc), can be expected to cause structural
changes. With XRD a change from orthorhombic to monoclinic
symmetry has been shown (chapter IV). 29si NMR spectra for
the same samples are also different. Except that lattice
perfectioning could be the reason, this phenomenon is yet not
fully understood. In contrast with this infrared spectra do
not change. Only lattice dealumination due to the thermal
treatment is found.
The aim of the work presented in this thesis was to
correlate the stuctural and physical properties of ZSM-5 to
its catalytic behaviour. From this and other work an under
standing of this subject is growing.

- 90 -
SUMMARY
Investigations have been carried out to study the fac
tors which determine the catalytic behaviour of zeolite
H-ZSM-5. The acidity and the structural properties of the
catalyst have been related to the its activity and deac
tivati9n in hydrocarbon conversion. The results are reported
in this thesis.
The temperature programmed desorption of ammonia has
been used to characterize the the acidity of certain batches
of H-ZSM-5. The number of acid sites and their acid strength
were determined. Moreover the same batches were used in the
conversion of n-hexane as a test reaction. It has been shown
that the activity of H-ZSM-5 in this conversion is determined
by the number of acid sites with a strength above a certain
treshold level. The deactivation of the catalyst, during the
the reaction time, could not be related with the acidity.
The deactivation of zeolites in hydrocarbon conversion
processes is caused by the deposition of carbonaceous
residues, called coke. The amount of deposited coke and the
influence on the pore volume of ZSM-5, zeolite Y and
mordenite, has been determined with thermogravimetical
measurements. Zeolite Y and mordenite were studied because of
their deviating deactivation behaviour due to a different
pore structure and different pore dimensions. The coke was
formed in the already mentioned test reaction: the conversion
of n-hexane. For the deactivation of ZSM-5 a model is
proposed wherein two steps are distinghuised. In the first

- 91 -
step coke deposition takes place in the catalyst particle at
certain places where there is sufficient room to contain the
large coke molecules. This is accompanied by a rapid decrease
of the initial actvity to a lower level. In the second step
coke is deposited at the outer surface of the particle. This
coke formation causes only a minor decrease of the activity.
Even if some pore-mouths are blocked by coke, the three
dimensional pore system facilitates an easy acces of reactant
molecules to the remaining active sites in the particle.
Structural properties of ZSM-5 have been studied with
two spectroscopic techniques: magic-angle-spinning NMR and
infrared spectroscopy. 2 9si NMR spectra have been recorded
from silicalite, the Al free ZSM-5. Upon heat treatment
crystallographic changes have been observed with X-ray
diffraction. These changes resulted in different 29si NMR
spectra. After Gaussian deconvolution it is concluded that
attemps to assign the individual peaks to specific Si
positions in the zeolite lattice is still tentative. This is
in contrast to conclusions which are reported in literature.
Infrared spectra of ZSM-5 and other zeolites have been
collected in the region wherein structural vibrations appear:
400 - 1400 cm-1. In contrast to zeolites with a higher Al
content, the band positions of ZSM-5 shifts hardly with
varying Al content. In ZSM-5 only the band width becomes
smaller with decreasing Al content. For silicalite, at 77 K,
a very well resolved spectrum has been obtained. This
spectral improvement was only possible for zeolites with a
very low Al content or a homogeneous Si-Al surrounding, like
in zeolite A. Therefore it is concluded that the influence of
Al on the band width is due to different Si-Al coordination
distances which are present in ZSM-5.

- 92 -
SAMENVATTING
In dit proefschrift is h~t onderzoek beschreven dat is
gedaan naar de factoren die het katalytisch gedrag van zeo
liet H-ZSM-5 bepalen. De zure en de strukturele eigenschappen
van de katalysator zijn gerelateerd aan zijn aktiviteit en
deaktivering bij de omzetting van koolwaterstoffen.
Met de temperatuur geprogrammeerde desorptie van
ammoniak is de zuurheid van verschillende batches van H-ZSM-5
gekarakteriseerd. Het aantal zure plaatsen en de zuursterkte
daarvan werden op deze wijze bepaald. Daarnaast werden
dezelfde batches onderworpen aan bet kraken van n-hexaan als
testreaktie. Hierbij is gebleken dat de aktiviteit van
H-ZSM-5, voor de omzetting van n-hexaan, wordt bepaald door
het aantal zure plaatsen met een zuursterkte hoven een be
paalde drempelwaarde. De deaktivering van de katalysator
tijdens de reaktie kon niet in verband worden gebracht met
zijn zuurheid.
Bij de omzetting van koolwaterstoffen vindt deaktivering
plaats door de afzetting van koolstof rijke moleculen, coke
genaamd, op de zeolieten. De grootte van de coke afzetting en
de invloed op het porievolume zijn thermogravimetrisch be
paald voor ZSM-5, zeoliet Y en mordeniet. Zeolie~ Y en mor
deniet zijn onderzocht omdat ze een andere poriestruktuur en
andere poriedimensies hebben dan ZSM-5 en daardoor een ander
deactiverings gedrag. De coke vorming vond plaats in de
eerder genoemde testreaktie: de omzetting van n-hexaan. Er is
voor ZSM-5 een model voor de deaktivering voorgesteld waarin
twee fasen worden onderscheiden. Tijdens de eerste fase vindt

- 93 -
coke afzetting plaats op bepaalde plaatsen in het katalysator
deeltje, die ruim genoeg zijn voor de grote coke molekulen.
Dit gaat gepaard met een snelle afname van de initiele
acktiviteit tot een lager nivo bereikt wordt. Tijdens de
tweede fase wordt de coke op het buiten oppervlak van het
katalysator deeltje afgezet. Deze coke vorming vermindert
nauwelijks de aktiviteit. Door het drie dimensionale porie
systeem blijven de aktieve plaatsen binnen in het deeltje
goed bereikbaar, zelfs als sommige porie-monden geblokkeerd
worden.
De struktuur van ZSM-5 is bestudeerd met twee spektros
kopische technieken: magic-angle-spinning NMR en infrarood
spektroskopie.
Van silicaliet, de Al vrije ZSM-5, zijn 29st NMR opnamen
gemaakt, voor en na hoge temperatuur behandeling. Dit resul
teerde in verschillende spektra. Met rBntgen-diffraktie werd
vastgesteld dat de temperatuur bebandeling een verandering in
het rooster tot gevolg had. Ret NMR spektrum werd gedekon
volueerd op basis van een Gauss piekvorm. Er is gekonkludeerd
dat de pogingen om de individuele pieken, resulterend uit de
dekonvolutie, toe te schrijven aan specifieke Si posities in
het zeoliet rooster nog erg onzeker zijn. Dit is in tegen
stelling met in de literatuur vermelde konklusies.
Van ZSM-5 en andere zeolieten zijn infrarood opnamen
gemaakt in het gebied waarin de strukturele vibraties voor
komen: 400- 1400 cm-1. In tegenstelling tot zeolieten met
een boger Al gehalte verschuiven de bandposities van ZSM-5
nauwelijks met veranderende Si/Al verbouding. In ZSM-5 wordt
alleen de bandbreedte smaller met afnemend Al gehalte. Met
silicaliet is, bij 77 K, een erg goed opgelost spektrum
verkregen. Deze verbetering van bet spektrum was alleen
mogelijk bij zeolieten met een erg laag Al gehalte of met een
homogene Si-Al omringing, zoals bij zeoliet A. Daarom is er
gekonkludeerd dat de invloed van Al op de bandbreedte veroor
zaakt wordt door de vescbillende Si-Al koordinatie afstanden
die voorkomen in ZSM-5.
- 94 -
DANKWOORD
Aan het einde van deze periode van vier jaar wil ik
iedereen bedanken die bijgedragen heeft aan de tot stand
koming van dit proefschrift.
Met name wil ik Bert Cals, Andre van der putten, Peter
Vollenberg, Lex van den Bout en Paul Wijnands danken, zij
hebben tijdens hun 59-praktikum, S8-praktikum of afstudeer
periode een belangrijke bijdrage aan dit werk geleverd.
Jan van den Berg, Charles Engelen en Jillus Wolthuizen
dank ik voor hun direkte steun bij bet zeoliet-onderzoek dat
ik met hun gedeeld heb.
De kollega's van de vakgroep Anorganische Chemie dank ik
voor de prettige samenwerking. Met name ben ik dank verschul
digd aan Wout van Herpen, voor zijn steun bij de verwer
kelijking en reparatie van apparatuur, aan Adelheid Elemans
voor haar analyses van de zeolieten, aan Jos van Wolput voor
zijn ondersteuning bij de infrarood spektroskopie en aan Hans
van Zon voor zijn goede hulp bij het schrijven van komputer
programma's.
Jan de Haan en Leo van de Ven ben ik erkentelijk voor de
NMR metingen die zij uitgevoerd hebben en de vele gevoerde
discussies, die mij veel over NMR geleerd hebben en, near ik
hoop, hun iets over zeolieten.
Tenslotte wil ik Jacqueline bedanken dat zij niet alleen
de voorspoed met mij deelde, maar ook een steun was tijdens
de tegenslag de afgelopen vier jaar.
- 95 -
CURRICULUM VITAE
Joseph George Post werd geboren op 26 januari 1955 te
Venlo. In juni 1972 behaalde hij, aan het St. Thomascollege
te Venlo, bet diploma HBS-b.
Hierna studeerde hij van september 1972 tot februari
1980 aan de Technische Hogeschool Twente te Enschede. Hij is.
afgestudeerd bij prof. dr. P.J. Gellings in de vakgroep
Anorganische Chemie en Materiaalkunde, met als onderzoek
"hoge temperatuur korrosie aan metalen".
Sinds 1 april 1980 heeft hij aan de Technische Hoge
school Eindhoven promotie-onderzoek verricht onder leiding
van prof. dr. J.H.C. van Hooff,

Stellingen bij het proefschrift van J.G. Post
1. Het resultaat van de bepaling van de Si/Al verhouding van een zeoliet, m.b.v. 29si ~m. is twijfelachtig als de pieken, toegeschreven aan Si omringd door respektievelijk 0,1,2,3 of 4 Al atomen, gedeeltelijk samenvallen.
Fyfe C.A., Gobbi G.C., Murphy W.J., Orubko R.S. and Slack D.A,, Chem. Lett. 1547 (1983). Thomas J.M., Fyfe C.A., Ra"ldas S., Klinowski J. and Gobbi G.C., J. Phys. Chern., 86, 3061 (1982). Klinowski J., Thomas J.M., Fyfe C.A. and Gobbi G.C., Nature, 296, 533 (1982).
2. De veronderstelling d~t strong metal-support-interaction (SMSI) een grote invloed heeft op het katalytisch gedrag van rhodium/titania katalysatoren tijdens de hydrogenering van koolmonoxide is onjuist.
Vannice M.A., J. Catal., 74, 199 (1982). van •t Blik H.J.F., Proefschrift, Technische Hogeschool Eindhoven (1984).
3. De tegenstrijdigheid tussen de zeer fundamentele uitvoering van de berekening van de roostervibraties van zeoliet Y en de aanpassing van de resultaten hiervan aan de gemeten spektra, vergroten het vertrouwen in de konklusies van Blackwell niet.
Blackwell C.S., J. Phys. Chern., 83, 3251 (1979).
4. Het onvermeld laten van de details over het medium waarin Christou et al. 2- 3-[Fe4S4(SCHZCH20H4)4] m.b.v. [Fe(CN) 6] oxideerden, maakt dat de publi-
katie van het ESR-spektrum van het geoxideerde komplex weinig zinvol is.
Christou G., Gamer C., Drew M.G.B. and Cammack R., J. C. S. Dalton, ... 1550 (1981). Yates M.G., O'Donnel M.J., Lowe D.J. and Bothe H., Eur. J. Biochem., 85, 291 (1978).

5. De spanning in Z~I-5 ringstrukturen wordt op zichzelf niet bewaarheid door het feit dat de verschillende onderzoekers er in navolging van elkaar gewag van maken.
Nagy J.B., Gabelica Z. and Derouane E.G., Chern. Lett,, 2003 (1982), Boxhoorn G., Kortbeek A.G.T.G., Hays G.R. and Alma N.C.~!., Zeolites,
±· 15 (1984).
6. .De bewering van Marques et al. dat de anomalie in de fase-verschuivingsfunktie van een 1 wt~ Pt/Sio2 katalysator veroorzaakt wordt door een asymmetrische beweging van de oppervlakte-atomen moet, gezien de invloed die de signaal-ruis verhouding kan hebben op deze fase, onjuist worden geacht.
~mrques E.C., Sandstrom D.R., Lytle F.W. and Greegor R.B., J. Chem. Phys., 77, 1027 (1982).
7. Uitspraken, op basis van transmissie elektronenmikroskopie opnamen, omtrent de morfologie van metaalkristallieten aanwezig in gereduceerde ultradisperse metaalkatalysatoren zijn aan bedenkingen onderhevig.
Yates D.J.C., ~rurrell L.L. and Prestridge E.B., J. Catal., 57, 41 (1979).
8. Als er op grensoverschrijdende lucht- en waterverontreiniging dezelfde belastingen geheven zouden worden als op andere importartikelen, dan zou de stimulans om deze verontreiniging multinationaal te bestrijden veel grater zijn.