the china-u.s. trade war and future economic relations
TRANSCRIPT

The China-U.S. Trade War
and Future Economic RelationsLawrence J. Lau
Ralph and Claire Landau Professor of Economics, The Chinese Univ. of Hong Kongand
Kwoh-Ting Li Professor in Economic Development, Emeritus, Stanford University
Tsinghua Entrepreneur and Executive ClubKerry Hotel
Hong Kong, 18 May 2019
Tel: +852 3943 1611; Fax: +852 2603 5230
Email: [email protected]; WebPages: www.igef.cuhk.edu.hk/ljl
*All opinions expressed herein are the author’s own and do not necessarily reflect the views of
any of the organisations with which the author is affiliated.

Introduction The National Bureau of Statistics of China has recently reported the
2019Q1 result for the Chinese economy. Real GDP grew at an annualized rate of 6.4%. The target range of the rate of growth of 2019 is 6%-6.5%. The economy is on course.
For 2018 as a whole, the rate of growth of real GDP was 6.6%, exceeding the target of 6.5%. The result also reflects the impacts of the expectation of a trade war since January 2018 and the uncertainty it has created, as well as half a year of U.S. tariffs on Chinese exports to the U.S., in addition to the rise of rates of interest globally.
In the following chart, the quarterly rates of growth of Chinese real GDP, year-on-year, are presented in colour-coded columns (light green for first quarter, red for second quarter, yellow for third quarter and blue for fourth quarter). The five quarterly year-on-year rates of growth were, from 2018Q1 through 2019Q1, respectively: 6.8%, 6.7%, 6.5%, 6.4% and 6.4%. It is clear from the chart that the rate of growth of Chinese real GDP has stabilized--an L-shaped soft landing.
2

Quarterly Rates of Growth of Chinese Real
GDP, Year-on-Year, 1983 to the Present
-5%
0%
5%
10%
15%
20%
25%
1983q
11983q
31984q
11984q
31985q
11985q
31986q
11986q
31987q
11987q
31988q
11988q
31989q
11989q
31990q
11990q
31991q
11991q
31992q
11992q
31993q
11993q
31994q
11994q
31995q
11995q
31996q
11996q
31997q
11997q
31998q
11998q
31999q
11999q
32000q
12000q
32001q
12001q
32002q
12002q
32003q
12003q
32004q
12004q
32005q
12005q
32006q
12006q
32007q
12007q
32008q
12008q
32009q
12009q
32010q
12010q
32011q
12011q
32012q
12012q
32013q
12013q
32014q
12014q
32015q
12015q
32016q
12016q
32017q
12017q
32018q
12018q
32019q
1
Per
cen
t p
er a
nn
um
Quarterly Rates of Growth of Chinese Real GDP, Y-o-Y
GDPQ1 GDPQ2
GDPQ3 GDPQ4
3

Introduction Thus far, the trade war does not seem to have done too much
noticeable damage to the Chinese economy. The rate of growth
of Chinese real GDP declined by only 0.4 percentage point from
2017Q4 to 2018Q4 and from 2018Q1 to 2019Q1. However, the
6.4% rate of growth in 2018Q4 and 2019Q1 was the lowest rate
of growth of the Chinese real GDP since the first quarter of 2009,
in the aftermath of the outbreak of the global financial crisis,
when it grew 6.2 percent.
Moreover, it might have also reflected the (positive) effects of
accelerated shipments of Chinese exports of goods to the U.S. in
an attempt to beat the tariffs.
4

Introduction This magnitude of the decline in the rate of growth is well within the
expected range of the potential negative impact caused by the U.S. tariffs on Chinese exports of goods to the U.S. I had predicted that the maximum negative impact to the Chinese economy, assuming that half of Chinese exports to the U.S. are halted, would be 0.43% in the first instance, and eventually cumulatively 1.12% if all the indirect effects are included.
Up to 10 May 2019, the 25% tariff rate applied to only US$50 billion of Chinese exports of goods to the U.S. A 10% tariff rate applied to another US$200 billion of Chinese exports. But on 10 May 2019, the 10% tariff rate has been raised to 25%. The negative impact of the trade war on the real GDP of 2019 is likely to be higher than 0.4%. However, the marginal effect of this increase in the tariff rate from 10% to 25% is not likely to be large as the 10% tariff rate is already high enough to be almost prohibitive for most Chinese exports to the U.S. There simply is not that kind of profit margin for such exports to be absorbed by the manufacturers.
5

Introduction While the impacts on the Chinese economy of the U.S. tariffs have certainly
been significant and negative, they are still relatively small in real terms and quite manageable for China. There is no need to panic. The sky is not falling!
The Chinese economy is sufficiently flexible and resilient that it will be able to adopt appropriate measures. survive the negative impacts, and maintain significant positive economic growth. For example, it can increase domestic aggregate demand by mandating the enhanced provision of public goods such as environmental preservation, protection and restoration, education, health care and elderly care.
But even if the trade war, or at least the mutual tariffs, ends, hopefully soon, economic and technological competition between China and the U.S. is likely to continue for a long time. It will become the “new normal”. Moreover, the trade war itself may do damage to the longer-term relations between the two countries.
It is also a reflection of the rise of populism, isolationism, nationalism and protectionism almost everywhere in the world, including in the U.S.
6

Immediate Impacts The Chinese stock markets have already taken a hit. This is an area where
the psychological factor dominates. As of the end of 2018, the shares on the Shenzhen Stock Exchange had on average lost 30%, Shanghai 20%, and Hong Kong 10%. In contrast, the Standard and Poor 500 Index of U.S. stocks did not suffer any loss on a whole-year (2018) basis.
It should also be borne in mind that the increase in the rates of interest in the U.S. and elsewhere in 2018 would also have affected asset prices around the world negatively, so it was not solely the effect of the China-U.S. trade war.
At the beginning of 2019, the Chinese stock market continued to fall, until the latter part of January, then it began to rise, buoyed by hopes of a successful conclusion of a China-U.S. trade agreement. More recently, however, it has become quite volatile, reflecting the progress or lack thereof of the trade negotiations.
The Standard and Poor 500 Index also fell at the beginning of 2019, but has also recovered but experienced volatility similar to the Chinese stock market price indices more recently. 7

The Chinese, Hong Kong and U.S. Stock
Market Indexes, 2018M1 to Date
50
60
70
80
90
100
110
120
50
60
70
80
90
100
110
120Stock Price Indices of Various Stock Exchanges, 1 January 2018 = 100
Hong Kong (Overall) Hong Kong (China Enterprise)
Shanghai Shenzhen
MSCI China S&P 500 Index
8

Immediate Impacts However, the Chinese stock markets are not a good barometer of the
state of the Chinese real economy. There is essentially no correlation between the rate of growth of Chinese real GDP and the rate of growth of the Chinese stock market price index (see the following scatter diagram between the quarterly rates of growth of Chinese real GDP and the Shanghai Stock Exchange Composite Index).
The majority (over 80%) of Mainland Chinese investors are individual retail investors. They are typically short-term traders who tend to leave the market at the first sign of potential trouble. The average holding period of individual Chinese investors is less than 20 trading days. The Chinese institutional investors have a slightly longer average holding period of between 30 and 40 trading days.
The short holding period is due in part to the fact that Chinese publicly listed enterprises pay little or no cash dividends. Investors can make money only through frequent trading and have little incentive to hold a particular stock long term. 9

The Rate of Growth of Real GDP versus the
Rate of Growth of the Stock Price Index
6
7
8
9
10
11
12
13
14
15
16
-50 0 50 100 150 200 250
Qu
arte
rly
Rea
l R
ates
of
Gro
wth
of
GD
P, p
erce
nt
Quarterly Rates of Changes of Stock Exchange Composite Index, percent
Quarterly Rates of Growth of Chinese Real GDP vs.
Quarterly Rates of Changes of the Shanghai Stock Exchange Composite Index
GDP vs. Index of Shanghai SE
10

Immediate Impacts The Renminbi exchange rate has also been affected by the trade war. In
2018, relative to the US$, the Renminbi has devalued by approximately 8% from the end of January 2018 (at one time almost 10%).
However, the deviation of the Renminbi central parity rate from the CFETS (China Foreign Exchange Trade System) Index, the exchange rate of a Chinese trade-weighted basket of currencies, has remained within the 3% range. Our focus should be on the central parity rate (onshore rate) rather than the offshore rate and on its relation to the CFETS Index.
The Renminbi does not follow the US$ any more because the U.S. accounts for only slightly more than 20% of Chinese international trade. For the Renminbi to follow the US$ when the US$ rises with respect to other currencies implies that China will raise its price of exports to all her other customers that account for almost 80% of Chinese exports, which makes very little sense. Similarly, when the US$ falls with respect to other currencies, if the Renminbi follows the US$, it will imply that China lowers its price of exports to all her other customers, which also makes little sense. 11

The Renminbi Central Parity Exchange Rate
and the CFETS Index (31/12/2014 = 100)
95
97
99
101
103
105
107
109
111
113
115
Dec
-201
4Ja
n-2
015
Feb
-201
5M
ar-2
015
Ap
r-20
15M
ay-2
015
Jun
-201
5Ju
l-20
15A
ug-
2015
Sep
-201
5O
ct-2
015
Nov
-201
5D
ec-2
015
Jan
-201
6F
eb-2
016
Mar
-201
6A
pr-
2016
May
-201
6Ju
n-2
016
Jul-
2016
Au
g-20
16S
ep-2
016
Oct
-201
6N
ov-2
016
Dec
-201
6Ja
n-2
017
Feb
-201
7M
ar-2
017
Ap
r-20
17M
ay-2
017
Jun
-201
7Ju
l-20
17A
ug-
2017
Sep
-201
7O
ct-2
017
Nov
-201
7D
ec-2
017
Jan
-201
8F
eb-2
018
Mar
-201
8A
pr-
2018
May
-201
8Ju
n-2
018
Jul-
2018
Au
g-20
18S
ep-2
018
Oct
-201
8N
ov-2
018
Dec
-201
8Ja
n-2
019
Feb
-201
9M
ar-2
019
Ap
r-20
19M
ay-2
019
Comparison of the Central Parity Rate and CFETS Indexes
12/31/2014 = 100
Index CFETS Currency Basket (Yuan/Currency Basket)
Index of Central Parity Rate (Yuan/US$)
12

The RMB Central Parity Exchange Rate and
the CFETS Index, 29/12/2017 to the Present
95
96
97
98
99
100
101
102
103
104
105
106
107
108
29-D
ec-1
7
12-J
an-1
8
26-J
an-1
8
09-F
eb-1
8
23-F
eb-1
8
09-M
ar-1
8
23-M
ar-1
8
06-A
pr-
18
20-A
pr-
18
04-M
ay-1
8
18-M
ay-1
8
01-J
un
-18
15-J
un
-18
29-J
un
-18
13-J
ul-
18
27-J
ul-
18
10-A
ug-
18
24-A
ug-
18
07-S
ep-1
8
21-S
ep-1
8
05-O
ct-1
8
19-O
ct-1
8
02-N
ov-1
8
16-N
ov-1
8
30-N
ov-1
8
14-D
ec-1
8
28-D
ec-1
8
11-J
an-1
9
25-J
an-1
9
08-F
eb-1
9
22-F
eb-1
9
08-M
ar-1
9
22-M
ar-1
9
05-A
pr-
19
19-A
pr-
19
03-M
ay-1
9
The Central Parity Rate and the CFETS Index, 29 Dec. 2017 = 100
Index of CFETS Currency Basket (Yuan/Currency Basket)
Index of Central Parity Rate (Yuan/US$)
13

Immediate Impacts Maintaining the relative stability of the Renminbi exchange rate
with respect to the CFETS (China Foreign Exchange Trade System) Index, the exchange rate of a Chinese trade-weighted basket of currencies, implies that the Renminbi exchange rate vis-a-vis the currency of an average trading-partner country of China will be relatively stable and that the international purchasing power of the Renminbi will also be relatively stable.
By not following the US$, the Renminbi exchange rate will be less volatile than the US$ exchange rate when viewed from a third country.
It is in China’s interests to maintain a relatively stable Renminbi exchange rate. It is the only way for the internationalisation of the Renminbi to become a reality.
14

Real Impacts Today, China, as a large continental economy with a huge
domestic market, has a relatively low degree of export
dependence, and has always been relatively immune to external
disturbances, just like the U.S.
During the past decades, while the rates of growth of Chinese
exports and imports of goods fluctuate like those of all other
economies, the rate of growth of Chinese real GDP has remained
relatively stable, and in fact has always stayed positive. (See the
following charts which display the quarterly rates of growth of
exports, imports and real GDP of selected Asian economies from
1997 to the present, with China represented by the red line).
15

16
Quarterly Rates of Growth of Exports of
Goods: Selected Asian Economies since 1997
-50
-40
-30
-20
-10
0
10
20
30
40
50
60
70
Q1
1997
Q2
1997
Q3
1997
Q4
1997
Q1
1998
Q2
1998
Q3
1998
Q4
1998
Q1
1999
Q2
1999
Q3
1999
Q4
1999
Q1
2000
Q2
2000
Q3
2000
Q4
2000
Q1
2001
Q2
2001
Q3
2001
Q4
2001
Q1
2002
Q2
2002
Q3
2002
Q4
2002
Q1
2003
Q2
2003
Q3
2003
Q4
2003
Q1
2004
Q2
2004
Q3
2004
Q4
2004
Q1
2005
Q2
2005
Q3
2005
Q4
2005
Q1
2006
Q2
2006
Q3
2006
Q4
2006
Q1
2007
Q2
2007
Q3
2007
Q4
2007
Q1
2008
Q2
2008
Q3
2008
Q4
2008
Q1
2009
Q2
2009
Q3
2009
Q4
2009
Q1
2010
Q2
2010
Q3
2010
Q4
2010
Q1
2011
Q2
2011
Q3
2011
Q4
2011
Q1
2012
Q2
2012
Q3
2012
Q4
2012
Q1
2013
Q2
2013
Q3
2013
Q4
2013
Q1
2014
Q2
2014
Q3
2014
Q4
2014
Q1
2015
Q2
2015
Q3
2015
Q4
2015
Q1
2016
Q2
2016
Q3
2016
Q4
2016
Q1
2017
Q2
2017
Q3
2017
Q4
2017
Q1
2018
Q2
2018
Q3
2018
An
nu
aliz
ed P
erce
nt
per
an
nu
m
Quarterly Rates of Growth of Exports of Goods: Selected East Asian Economies
China,P.R.:Hong Kong India
Indonesia Korea
Malaysia Philippines
Singapore Thailand
China,P.R.: Mainland Japan
Taiwan Prov.of China
16

17
Quarterly Rates of Growth of Imports of
Goods: Selected Asian Economies since 1997
-60
-50
-40
-30
-20
-10
0
10
20
30
40
50
60
70
80
Q1
199
7Q
2 1
997
Q3
199
7Q
4 1
997
Q1
199
8Q
2 1
998
Q3
199
8Q
4 1
998
Q1
199
9Q
2 1
999
Q3
199
9Q
4 1
999
Q1
200
0Q
2 2
000
Q3
200
0Q
4 2
000
Q1
200
1Q
2 2
001
Q3
200
1Q
4 2
001
Q1
200
2Q
2 2
002
Q3
200
2Q
4 2
002
Q1
200
3Q
2 2
003
Q3
200
3Q
4 2
003
Q1
200
4Q
2 2
004
Q3
200
4Q
4 2
004
Q1
200
5Q
2 2
005
Q3
200
5Q
4 2
005
Q1
200
6Q
2 2
006
Q3
200
6Q
4 2
006
Q1
200
7Q
2 2
007
Q3
200
7Q
4 2
007
Q1
200
8Q
2 2
008
Q3
200
8Q
4 2
008
Q1
200
9Q
2 2
009
Q3
200
9Q
4 2
009
Q1
201
0Q
2 2
010
Q3
201
0Q
4 2
010
Q1
201
1Q
2 2
011
Q3
201
1Q
4 2
011
Q1
201
2Q
2 2
012
Q3
201
2Q
4 2
012
Q1
201
3Q
2 2
013
Q3
201
3Q
4 2
013
Q1
2014
Q2
201
4Q
3 2
014
Q4
201
4Q
1 2
015
Q2
201
5Q
3 2
015
Q4
201
5Q
1 2
016
Q2
201
6Q
3 2
016
Q4
201
6Q
1 2
017
Q2
201
7Q
3 2
017
Q4
201
7Q
1 2
018
Q2
201
8Q
3 2
018
An
nu
aliz
ed P
erce
nt
per
an
nu
m
Quarterly Rates of Growth of Imports of Goods : Selected East Asian Economies
China,P.R.:Hong Kong IndiaIndonesia KoreaMalaysia PhilippinesSingapore ThailandChina,P.R.: Mainland Japan
17

18
Quarterly Rates of Growth of Real GDP, Y-o-
Y: Selected Asian Economies since 1997
-18
-15
-12
-9
-6
-3
0
3
6
9
12
15
18
21
Q1
1994
Q2
1994
Q3
1994
Q4
1994
Q1
1995
Q2
1995
Q3
1995
Q4
1995
Q1
1996
Q2
1996
Q3
1996
Q4
1996
Q1
1997
Q2
1997
Q3
1997
Q4
1997
Q1
1998
Q2
1998
Q3
1998
Q4
1998
Q1
1999
Q2
1999
Q3
1999
Q4
1999
Q1
2000
Q2
2000
Q3
2000
Q4
2000
Q1
2001
Q2
2001
Q3
2001
Q4
2001
Q1
2002
Q2
2002
Q3
2002
Q4
2002
Q1
2003
Q2
2003
Q3
2003
Q4
2003
Q1
2004
Q2
2004
Q3
2004
Q4
2004
Q1
2005
Q2
2005
Q3
2005
Q4
2005
Q1
2006
Q2
2006
Q3
2006
Q4
2006
Q1
2007
Q2
2007
Q3
2007
Q4
2007
Q1
2008
Q2
2008
Q3
2008
Q4
2008
Q1
2009
Q2
2009
Q3
2009
Q4
2009
Q1
2010
Q2
2010
Q3
2010
Q4
2010
Q1
2011
Q2
2011
Q3
2011
Q4
2011
Q1
2012
Q2
2012
Q3
2012
Q4
2012
Q1
2013
Q2
2013
Q3
2013
Q4
2013
Q1
2014
Q2
2014
Q3
2014
Q4
2014
Q1
2015
Q2
2015
Q3
2015
Q4
2015
Q1
2016
Q2
2016
Q3
2016
Q4
2016
Q1
2017
Q2
2017
Q3
2017
Q4
2017
Q1
2018
Q2
2018
Q3
2018
An
nu
aliz
ed R
ates
in
Per
cen
t
Quarterly Rates of Growth of Real GDP, Year-over-Year: Selected East Asian Economies
China,P.R.:Hong Kong India
Indonesia Korea
Malaysia Philippines
Singapore Thailand
China,P.R.: Mainland Japan
Taiwan Prov.of China
18

Real Impacts Moreover, over the past ten years, Chinese dependence on exports has been
declining. The share of exports of goods in Chinese GDP has fallen from a peak of 35.3% in 2006 to 19.5% in 2018. The share of exports of goods to the U.S. in Chinese GDP has also fallen by half, from a peak of 7.2% in 2006 to 3.6% in 2018. (See the following charts.)
The 3.6% represented an increase from the 3.4% in 2017. However, the increase reflected the acceleration of exports of goods to the U.S. from China in anticipation of the increases in tariffs. The trend of Chinese exports of goods to the U.S. as a percent of Chinese GDP is downwards.
During this same period, the growth of Chinese exports to the world and to the U.S. has also slowed significantly. Chinese exports to the world grew at an average annual rate of 23.5% in the decade 1998-2007, but slowed to only 5.9% in the following decade, 2008-2018. Similarly, exports to the U.S. grew at 23.7% per annum in the decade 1998-2008, but slowed to less than 6.6% per annum in the most recent decade. Exports is no longer the engine of Chinese economic growth. 19

Chinese Exports of Goods and Services and
Goods Only as a Percent of Chinese GDP
0
5
10
15
20
25
30
35
40
1982
1983
1984
1985
1986
1987
1988
1989
1990
1991
1992
1993
1994
1995
1996
1997
1998
1999
2000
2001
2002
2003
2004
2005
2006
2007
2008
2009
2010
2011
2012
2013
2014
2015
2016
2017
2018
Per
cent
Exports of Goods and Services as a Percentage of GDP
Exports of Goods Only to the World as a Percentage of GDP
20

Chinese Exports of Goods and Services and
Goods to the U.S. as Percent of Chinese GDP
3
3.5
4
4.5
5
5.5
6
6.5
7
7.5
8
1999 2000 2001 2002 2003 2004 2005 2006 2007 2008 2009 2010 2011 2012 2013 2014 2015 2016 2017 2018
Per
cent
Exports of Goods
Exports of Goods and Services
21

The Annual Rates of Growth of Chinese
Exports of Goods to the World and to the U.S.
22
-20
0
20
40
60
80
100
1990
1991
1992
1993
1994
1995
1996
1997
1998
1999
2000
2001
2002
2003
2004
2005
2006
2007
2008
2009
2010
2011
2012
2013
2014
2015
2016
2017
2018
Per
cent
The Rate of Growth of Chinese Exports of Goods Only to the World
The Rate of Growth of Chinese Exports of Goods Only to the U.S.

Real Impacts U.S. tariffs have been imposed on US$250 billion of U.S. imports of
goods from China (arrival value, approximately equal to US$227 (250 x 10/11) billion of Chinese exports of goods to the U.S., f.o.b. or departure value), or slightly less than half of Chinese exports of goods to the U.S. in 2018. (Chinese exports of goods to the U.S. in 2018 amounted to US$540 billion according to U.S. data based on arrival value, which is approximately equivalent to US$500 billion at f.o.b. or departure value.)
The U.S. tariff rate has recently been raised to 25% on the value of the imports from China. These rates will be prohibitive for most of the Chinese exports of goods to the U.S., as neither the Chinese exporters nor the U.S. importers have the kind of profit margins that can afford these tariffs. There is no evidence that the Chinese producers or exporters will pay for the U.S. tariffs. The cost of the tariffs will be mostly borne by U.S. consumers and users of Chinese imports.
Thus, Chinese exports of goods amounting to slightly less than 1.8% (3.6%/2) of Chinese GDP will be affected.
23

Real Impacts on the Chinese Economy But the direct domestic value-added content of Chinese exports to the
U.S. is less than 25%. Thus, the maximum loss in Chinese GDP, assuming that half of the exports to the U.S. is completely halted, in the first instance, may be estimated at 0.45% (3.6%/2 x 0.25), a tolerable level, especially for an economy growing at an average annual real rate of 6.6 percent and with a per capita GDP of US$9,410 in 2018.
However, the reduction of exports leads to a reduction in the demand for domestic inputs used in their production, which in turn leads to a second-round reduction in the demand for domestic inputs used in the production of the domestic inputs.
With the indirect, that is, second-, third-, fourth- and higher-round effects of the reduction of Chinese exports kicking in, the total domestic value-added affected will eventually increase to 66 percent cumulatively. This implies ultimately a maximum total loss in Chinese GDP of 1.19% ((3.6%/2 x 0.66). In absolute terms, this amounts to US$156 billion in 2018 prices.
24

Real Impacts on the Chinese Economy A reduction of 1.2% from an expected annual real rate of growth of
6.5% leaves 5.3%, still a very respectable rate compared to the average of 3.7% for the world in 2018 projected by the International Monetary Fund (IMF). The IMF has recently lowered its projected rates of growth of world GDP for 2019 and 2020 to 3.5% and 3.6% respectively, compared to the 2.9% and 2.8% projected by the World Bank.
It is instructive to examine what transpired during the Global Financial Crisis of 2008-2009. Chinese exports of goods to the world and to the U.S. declined by 16.0% and 12.5% respectively in 2009, with a total decrease of Chinese exports of US$230 billion, approximately the same magnitude if half of Chinese exports of goods to the U.S. is completely halted in 2019. Yet the Chinese real GDP still managed to grow 9.7% and 9.4% in 2008 and 2009 respectively. What this shows is that a decline in Chinese exports of goods of this magnitude is still quite manageable. 25

Real Impacts on the Chinese Economy Bear in mind, however, that our calculation of the loss in real GDP
and other similar calculations do not take into account the effects of any possible economic stimulus measures that may be undertaken by the Chinese government. They also do not take into account the possibility of substitution of Chinese exports of goods from factories located elsewhere. For example, instead of shipping from a factory in China, the factory owner can ship goods to the U.S. from another factory it owns in Vietnam and instead ship goods to Japan from its factory in China. This would result in no decrease in its total Chinese export of goods despite the U.S. tariffs. More generally, exports of goods originally destined for the U.S. can be sold elsewhere in the world.
The same can apply to Chinese imports of goods. For example, instead of importing soybeans from the U.S., the Chinese importers can import from Brazil, and the U.S. exporters can sell to the original customers for the Brazilian soybeans. 26

Real Impacts on the Chinese Economy There is also the threat of a 25% tariff on the remaining half of
Chinese exports of goods to the U.S. (estimated to be US$290 billion according to U.S. data). Since a 25% tariff is basically prohibitive, if implemented, it will mean the total cessation of Chinese exports of goods to the U.S. The maximum damage that can be done is 2.38% (3.6% x 0.66) of GDP, which is significant but not intolerable.
However, it appears unlikely that the tariffs on this last batch of Chinese exports to the U.S. will be implemented in full because they consist of products such as the Apple iPhones (around US$50 billion), personal computers, garments and shoes and packaged re-exports of semi-conductors. The incidence of the tariffs will be mostly borne by U.S. consumers and producers including Apple Inc. (One incidental and unintended beneficiary will be Samsung of South Korea whose Galaxy cellphones compete with the Apple iPhones and they are not subject to the new tariffs on U.S. imports from China.)
27

Real Impacts on the Chinese Economy What is the impact on the Chinese trade surplus in goods and services with the
world? With a reduction of half of the total Chinese exports of goods to the U.S.,
amounting to 1.8% of Chinese GDP as a result of the trade war, a corresponding reduction in Chinese imports of goods from the U.S. is to be expected. Chinese imports of goods from the U.S. amounted to US$155 billion, or 1.18% of Chinese GDP in 2018. Assuming that half of such imports are halted because of the prohibitive Chinese tariff (for example on liquefied natural gas and soybeans), it would be 0.59% (=1.18%/2) of Chinese GDP. The net effect on the Chinese trade surplus with the world would be a negative 1.21% (1.8%-0.59%) of GDP.
This analysis does not take into account the possible diversion of Chinese exports of goods to other countries or the substitution of U.S. exports of goods to China by third country exports. It also does not take into account the possible reduction of the U.S. net trade surplus with China in services.
The Chinese trade in goods and services with the world had a surplus of 0.8% of GDP in 2018. It is likely to have a net deficit equal to 0.41% (0.8%-1.21%) of its GDP, or approximately US$54 billion. This is a relatively small amount that can be easily absorbed by the Chinese official foreign exchange reserves of US$3 trillion. Thus, there should be little pressure for the Renminbi to devalue. 28

Chinese Trade Surplus in Goods and Services
with the World and the U.S. as % of GDP
-5
-4
-3
-2
-1
0
1
2
3
4
5
6
7
8
9
1982
1983
1984
1985
1986
1987
1988
1989
1990
1991
1992
1993
1994
1995
1996
1997
1998
1999
2000
2001
2002
2003
2004
2005
2006
2007
2008
2009
2010
2011
2012
2013
2014
2015
2016
2017
2018
Per
cent
Chinese Trade Surplus with the World
Chinese Trade Surplus with the U.S.29

Real Impacts on the Chinese Economy In fact, it is probably in the best interests of the Chinese economy
to maintain a relatively stable Renminbi exchange rate. By
following the CFETS Index, an index of a trade-weighted basket
of currencies, the Renminbi exchange rate will have a lower
volatility than the U.S. Dollar exchange rate because it will
move, in general, in the same direction as the U.S. Dollar but by
a smaller amount. This means when the U.S. Dollar appreciates
with respect to other currencies, the Renminbi will devalue
relative to the U.S. Dollar, and when the U.S. Dollar devalues
with respect to other currencies, the Renminbi will appreciate
relative to the U.S. Dollar. The Renminbi exchange rate will be
less volatile than the U.S. Dollar exchange rate. 30

Real Impacts on the Chinese Economy In the longer run, if tariffs continue on both sides, the U.S. importers
will begin to replace Chinese imports by imports from other Asian countries such as Vietnam, Cambodia and Bangladesh, and eventually perhaps even North Korea if an agreement can be struck between it and the U.S.
But the shift in the sourcing of imports away from China has already been occurring since 2010, because of the rise in labour costs in China and because of the appreciation of the Renminbi. This is similar to the earlier shift of the sources of U.S. imports of apparel from Hong Kong, South Korea and Taiwan to Mainland China (see the following chart). The new U.S. tariffs will accelerate this process.
The ASEAN and South Asian countries may benefit, but it is really hard to predict by how much because the supply chains today are so internationalised. However, it is unlikely, in most cases, that the tariffs will stimulate new domestic production in the U.S.
31

The Distribution of U.S. Apparel Imports by
Countries of Origin
32

Real Impacts on the Chinese Economy:
Specific Regional Impacts Even though the real impacts on the Chinese economy in the
aggregate are relatively small, they can be more significant for
individual specific municipalities and provinces, especially those
oriented towards exports.
Guangdong, including Shenzhen, is the largest exporting region
in China, followed by Shanghai and Zhejiang in second and third
places. Even then, Guangdong exports as a percent of its GDP,
which at one time had exceeded 90%, was just below 45.5% in
2018, and exports to the U.S. had fallen to only 7.9%. What this
means is that the economic growth of Guangdong is increasingly
dependent on internal demand rather than exports.
33
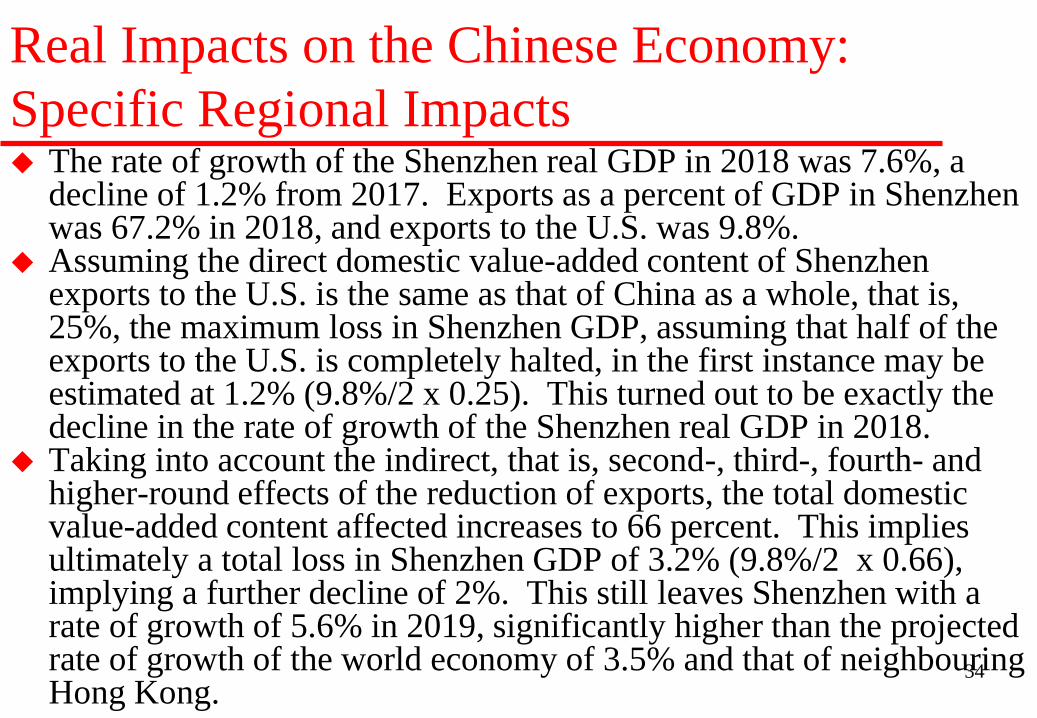
Real Impacts on the Chinese Economy:
Specific Regional Impacts The rate of growth of the Shenzhen real GDP in 2018 was 7.6%, a
decline of 1.2% from 2017. Exports as a percent of GDP in Shenzhen was 67.2% in 2018, and exports to the U.S. was 9.8%.
Assuming the direct domestic value-added content of Shenzhen exports to the U.S. is the same as that of China as a whole, that is, 25%, the maximum loss in Shenzhen GDP, assuming that half of the exports to the U.S. is completely halted, in the first instance may be estimated at 1.2% (9.8%/2 x 0.25). This turned out to be exactly the decline in the rate of growth of the Shenzhen real GDP in 2018.
Taking into account the indirect, that is, second-, third-, fourth- and higher-round effects of the reduction of exports, the total domestic value-added content affected increases to 66 percent. This implies ultimately a total loss in Shenzhen GDP of 3.2% (9.8%/2 x 0.66), implying a further decline of 2%. This still leaves Shenzhen with a rate of growth of 5.6% in 2019, significantly higher than the projected rate of growth of the world economy of 3.5% and that of neighbouring Hong Kong.
34

Exports to the World and the U.S. as Percent of
GDP: Shenzhen
0
50
100
150
200
250
1986
1987
1988
1989
1990
1991
1992
1993
1994
1995
1996
1997
1998
1999
2000
2001
2002
2003
2004
2005
2006
2007
2008
2009
2010
2011
2012
2013
2014
2015
2016
2017
2018
Per
cent
Exports to the World and Exports to the U.S. as Percentages of GDP: Shenzhen
Exports the the World as a Percent of GDP
Exports to the U.S.
35

Real Impacts on the Hong Kong Economy Hong Kong domestic exports of goods to the U.S. are not subject to
any of the new U.S. tariffs against China, whereas the Hong Kong re-exports of Chinese goods to the U.S. will be subject to the new U.S. tariffs and will be affected. Hong Kong re-exports to the U.S. grew rapidly from 1.1 percent of Hong Kong GDP to a peak of 23.3 percent in 2000, but has since fallen to 12.4 percent of Hong Kong GDP in 2018. However, the domestic Hong Kong value-added on Hong Kong re-exports of Chinese goods to the U.S. is very low, so that the real impacts on the GDP of Hong Kong will be basically negligible.
Hong Kong domestic exports to the U.S. was a highly significant 23.4 percent of the Hong Kong GDP back in 1984, but has since fallen to an insignificant 0.1 percent in 2018. Hong Kong exports of services to the U.S. amounted to 4.2 percent of Hong Kong GDP in 2018. In any case, neither Hong Kong domestic exports nor exports of services to the U.S. are subject to the new U.S. tariffs.
36

Exports to the World as Percent of GDP: Hong
Kong
0
30
60
90
120
150
180
210
1961
1963
1965
1967
1969
1971
1973
1975
1977
1979
1981
1983
1985
1987
1989
1991
1993
1995
1997
1999
2001
2003
2005
2007
2009
2011
2013
2015
2017
Per
cen
t
Total Exports of Goods and Services
Total Exports of Goods Only
Domestic Exports of Goods Only
Re-Exports of Goods Only
37

Exports to the U.S. as Percent of GDP:
Hong Kong
0
5
10
15
20
25
30
35
1972
1974
1976
1978
1980
1982
1984
1986
1988
1990
1992
1994
1996
1998
2000
2002
2004
2006
2008
2010
2012
2014
2016
2018
Per
cen
t
Total Exports of Goods and Services
Total Exports of Goods Only
Domestic Exports of Goods Only
Re-Exports of Goods Only
38

Real Impacts on the Hong Kong Economy The principal real impacts of the China-U.S. trade war on the Hong
Kong economy are indirect. Actually, the Hong Kong economy has also been affected by the rise in the rates of interest globally, especially in its stock and residential housing markets, and not just by the trade war.
The sector that will be first affected is domestic consumption. The slowdown in the Mainland economy also affects the willingness of the Mainland investors to invest in Hong Kong, and also the number of Mainland tourists visiting Hong Kong as well as their level of spending. Mainland tourists to Hong Kong constitute almost 80% of the total number of tourists of 65 million per year. Of these Mainland visitors, approximately two-thirds are from the Province of Guangdong.
The reduction of tourists to Hong Kong would also affect the tour and travel, retail, lodging and food and beverage sectors in Hong Kong.
39

Real Impacts on the U. S. Economy The degree of dependence of the U.S., a large continental economy,
on exports is even lower than that of China’s. U.S. exports of goods and services combined as a share of GDP was 12.2% in 2018. The exports of goods alone as a share of GDP was only 8.2%.
Between 2017 and 2018, the shares of U.S. exports of goods and services and goods alone to China in U.S. GDP declined from 0.97% to 0.88% and 0.67% to 0.58% respectively, reflecting the effects of the trade war (all of which were borne by the exports of goods). In absolute value, they were respectively US$180 billion and US$121 billion in 2018, much lower than those of Chinese exports to the U.S. However, the shares of U.S. exports of both goods and services and goods only to China have been rising over time until more recently.
At the present time, Chinese tariffs have been imposed on US$110 billion of U.S. exports of goods, with rates up to 25%.
40

U.S. Exports of Goods and Services and Goods
Only as Percent of U.S. GDP
0
2
4
6
8
10
12
14
16
1999
2000
2001
2002
2003
2004
2005
2006
2007
2008
2009
2010
2011
2012
2013
2014
2015
2016
2017
2018
Per
cent
Exports of Goods and Services as a Percent of GDP
Exports of Goods Only to the World as a Percent of GDP
41

U.S. Exports of Goods and Services and Goods
Only to China as Percent of U.S. GDP
0.0
0.1
0.2
0.3
0.4
0.5
0.6
0.7
0.8
0.9
1.0
1999 2000 2001 2002 2003 2004 2005 2006 2007 2008 2009 2010 2011 2012 2013 2014 2015 2016 2017 2018
Per
cent
Exports of Goods and Services
Exports of Goods
42

Real Impacts on the U. S. Economy The direct domestic value-added content of U.S. exports of goods to
China may be estimated to be 50.8%. Thus, the maximum loss in the U.S., assuming that all of the exports to China is completely halted by the tariffs, may be estimated in the first instance at 0.29% (0.58% x 0.508), less than the initial impact on Chinese GDP of 0.43%, based on the assumption that half of Chinese exports of goods to the U.S. will be halted.
Moreover, it is unlikely that all of the U.S. exports of goods will be halted; for example, computer chips will continue to be imported by China in large quantities in the medium term. (The price elasticity is low.) Suppose only half of U.S. exports of goods to China is halted, it would amount to a loss of U.S. GDP of 0.145% (0.29%/2). This is not significant for the U.S. economy, which grew 2.9% in 2018 (2.6% in 2018Q4), as a whole. U.S. GDP per capita is approximately US$62,609. The U.S. economy can easily weather a reduction of 0.145% in its rate of growth. 43

Real Impacts on the U. S. Economy With the indirect, that is, second-, third-, fourth- and higher-round
effects of the reduction of U.S. exports of goods kicking in, the total domestic value-added affected increases to 88.7% cumulatively. This implies ultimately a total loss in U.S. GDP of 0.26% (0.58%/2 x 0.887), assuming that half of U.S. exports to China will be halted.
In absolute terms, this amounts to US$53.3 billion (0.26 x 20.5 trillion) in 2018 prices, much less than the estimated Chinese loss in terms of GDP of US$156 billion.
Thus, in both absolute and relative terms, the Chinese losses in real GDP will be much higher than those of the U.S.
However, the U.S. has a significant trade surplus in services with China, estimated to be US$40 billion by the U.S. Government but US$54 billion by the Chinese Government for 2017. This surplus may be in jeopardy if China-U.S. relations deteriorate further.
44

The Annual Rates of Growth of U.S. Exports
of Goods to the World and to China
-20
-10
0
10
20
30
40
1990
1991
1992
1993
1994
1995
1996
1997
1998
1999
2000
2001
2002
2003
2004
2005
2006
2007
2008
2009
2010
2011
2012
2013
2014
2015
2016
2017
2018
Per
cent
The Rate of Growth of U.S. Exports of Goods Only to the World
The Rate of Growth of U.S. Exports of Goods Only to China
45

Longer-Term Developments President Donald Trump’s primary objective is to run for and win re-
election in 2020. He will use China as a villain in the presidential election, as he did in the mid-term election. It is easy enough to bash China and he did promise that he would be tough on China during his presidential campaign in 2016. Bashing China will appeal to his base constituency of rural, non-college-educated, white males.
Moreover, Representative Nancy Pelosi, a Democrat who has been elected the Speaker of the U.S. House of Representatives, is also a persistent critic of China. So, one cannot expect a let-up of the anti-China rhetoric in the U.S. any time soon. In fact, there may be a China-bashing competition between the two parties.
By appearing to be touch on China, President Trump will be able to shield himself from attacks from the Democratic presidential candidates for being “soft on China”.
46

Longer-Term Developments One of the principal causes of the current trade war between China and the
United States is actually not trade itself, but the potential competition between China and the U.S. for economic and technological dominance in the world.
This competition, whether explicit or implicit, and whether intentional or not, will not go away soon. It did not begin with President Donald Trump. Both the “pivot to Asia” and the “Trans-Pacific Partnership” were initiated by President Barack Obama as initiatives aimed in part at containing China. It will not go away even after President Trump leaves office.
However, competition can potentially lead to constructive and positive as well as destructive and negative outcomes. For example, the competition on creating the fastest super-computer has already resulted in both countries producing better and faster super-computers. The champion in 2018 is the IBM Summit, a U.S. super-computer, which beat the Sunway TaihuLight, the champion in 2016 and 2017, a Chinese super-computer that was built entirely with indigenously designed chips. 47

Longer-Term Developments In terms of aggregate GDP, China went from only one-fifth of the
U.S. GDP in 2000 to two-thirds in 2017, taking only 17 years (64.1% in 2018 because of exchange rate changes). It is only a matter of time that the Chinese GDP will catch up with the U.S. GDP, probably in the early 2030s. However, in terms of GDP per capita, China is still way behind, with US$9,410 compared to almost US$62,609 for the U.S. in 2018. My own projections suggest that it will probably take until the end of the 21st Century before Chinese GDP per capita approaches the U.S. level.
In terms of the number of nuclear-armed warheads, according to the New York Times, the U.S. is estimated to have more than 6,000 such warheads, compared to less than 300 for China. The difference is even more striking in per capita terms. This is not a competition that China should wish to join. However, a race to find an effective cure for cancer or Alzheimer’s disease would be worthwhile for both countries and in fact for the entire mankind. 48

Longer-Term Developments U.S. grievances against China include insufficient intellectual property
rights protection, forced transfer of technology and cyber-theft. (Note that none of these grievances have much to do with trade per se.)
Intellectual property right protection in China has actually been vastly improved since special intellectual property courts were set up in Beijing, Shanghai and Guangzhou in 2014. Economically meaningful fines have begun to be levied on violators of intellectual property rights in China.
Both Japan and Taiwan in their early stages of economic development did not do much to protect intellectual property rights either. But as they changed from being a user and imitator to a creator of intellectual property, they began to enforce intellectual property rights vigorously.
Intellectual property right protection in China should get even better over time. Today, China grants the largest number of patents in the world, over 300,000 a year. And Chinese inventors and discoverers, just like their foreign counterparts, will want their intellectual property rights protected.
The way forward is to step up enforcement action in and by Chinese courts, through lawsuits filed by the victims against the perpetrators.
49

Longer-Term Developments Forced technology transfer has to do with the Chinese requirements
for foreign direct investors in certain industries to take Chinese
enterprises as equal (50-50) joint-venture partners.
However, the sharing of technology in a joint venture is a voluntary
one. The foreign direct investor will have to weigh the benefits of
having a local joint-venture partner versus the costs, including the
sharing of the technology. In any case, the technology used in the
current manufacturing process is probably already on the way to
becoming obsolete. What is more valuable is the next-generation
technology that has yet to be implemented. This is what the foreign
direct investor can still maintain as its own in its home factories and
laboratories. 50

Longer-Term Developments Forced transfer of technology is fast becoming a moot issue because
of recent Chinese liberalisation measures, including the abolition of
the joint-venture requirement. For example, in the automobile
manufacturing industry, Tesla of the U.S. has been able to establish a
wholly-owned subsidiary in Shanghai to manufacture electric cars;
Germany’s BMW has been able to increase its ownership stake in its
China automobile-manufacturing joint-venture to 75 percent; and even
though it is now possible for the U.S.’s General Motors to buy out its
Chinese joint-venture partner, it has indicated that it does not intend to
do so. Allianz of Germany and Chubb of the U.S. (based in
Switzerland) have been allowed to wholly-own insurance companies
in China. 51

Longer-Term Developments These latest policies and measures adopted by the Chinese
government and the new, much shortened negative list on foreign
direct investment should go a long way towards eliminating the issue
of forced technology transfer and market access.
If a foreign direct investor is no longer required to take an equal
domestic joint-venture partner, there is no transfer of technology, and
certainly no forced transfer of technology.
The newly passed foreign-investment law is a step in the right
direction. The expectation is that China will continue to open its
economy to international trade in goods and services and to both
inbound and outbound cross-border direct investment on a reciprocal
basis, regardless of the outcome of the China-U.S. trade war. 52

Longer-Term Developments The best solution is for China to grant national treatment to all
foreign direct investors on a reciprocal basis (with national
security consideration being the only possible exception).
Commercial cyber-thefts should be vigourously prosecuted, with
the collaboration and cooperation of both governments.
If Huawei is perceived as a national security risk by the U.S., will
the Apple iPhone be considered a national security risk by China
eventually?
53

Longer-Term Developments Another issue is that of “state-owned enterprises (SOEs)”. I believe
Chinese SOEs are here to stay. One should be specific as to why one objects to SOEs. It can be either behaviour, for example, anti-competitive behavior such as predatory pricing, or attempting to monopolise the market, etc.; or it can be government subsidies; or it can be something else. It is much more effective and productive to focus on the behaviour of the enterprises and discriminatory treatment by the government rather than the ownership. Otherwise, if all firms, domestic (state-owned or private), joint-venture and foreign firms are granted national treatment, it will be a level playing field for all. (National security considerations will be the only acceptable exception.)
Basic research will be financed and supported by the government and non-profit organization as is done in all countries including the U.S.
54

Projections of the Future: Long-Term Forecasts
of the Chinese and the U.S. Economies It is assumed that the Chinese economy will continue to grow above 6% per annum
for a few more years, declining gradually to between 5% and 6%, and that the U.S.
economy will grow at an average rate of 3% per annum between now and 2050.
In 2018, the Chinese economy grew 6.6%. The 2019 target growth rate for the
Chinese economy is between 6% and 6.5%. In 2019Q1, the Chinese economy
grew 6.4%. In 2018, the U.S. economy grew at 2.9%. But both the U.S. Federal
Reserve Board and the U.S. Congressional Budget Office expect 2.3% growth for
2019.
It may be thought that the Chinese economy will be unable to sustain an average
annual rate of growth of between 5% and 6% for such a long time. Experience
shows that the rate of growth of an economy declines as its real GDP per capita
rises. But given the still relatively low level of real GDP per capita in China, and
the low level of its capital per unit labor, such a rate of growth should still be
possible for at least several decades (see the following chart in which the
experiences of China, Japan and the U.S. are compared.)55

Growth Rate vs. Level of Real GDP per Capita
(2017 tril. US$): China, Japan and the U.S.
-30
-20
-10
0
10
20
30
0 10 20 30 40 50 60Per
cent
Real GDP per Capita, thousand USD, in 2017 prices
Rate of Growth of Real GDP vs. Real GDP per Capita (in 2017 US Dollars)
China USA Japan
56

Projections of the Future: Long-Term Forecasts
of the Chinese and the U.S. EconomiesThe Chinese national savings rate is very high, which
enables a very high investment rate. The capital-labour ratio of the Chinese economy is still very low compared to the U.S. and Japan. There is a great deal of room to grow.
In addition, there is still significant surplus labour in the Chinese economy. The share of employment in the primary sector is around 30% whereas the share of GDP originating from the primary sector is below 10%.
The projections of Chinses and U.S. real GDP and real GDP per capita between now and 2050 are presented in the following charts. 57

Projections of the Chinese and the U.S.
Economies In his work report to the Nineteenth National Congress of the
Communist Party of China, President XI Jinping identified several milestones in his speech at the Nineteenth Party Congress at 2020, 2035 and 2050.
The first milestone is to become a moderately well-off society by 2020. Our projections show that by 2020, Chinese real GDP per capita (in 2018 prices) will exceed US$10,582 (compared to US$65,541 for the U.S.).
Our projections also show that by 2033, Chinese real GDP will surpass U.S. real GDP (US$32.7 trillion versus US$31.9 trillion), making China the largest economy in the world. However, in terms of real GDP per capita, China will still lag behind significantly, with US$22,088 compared to US$89,363 for the U.S.
58
Projections of the Chinese and the U.S.
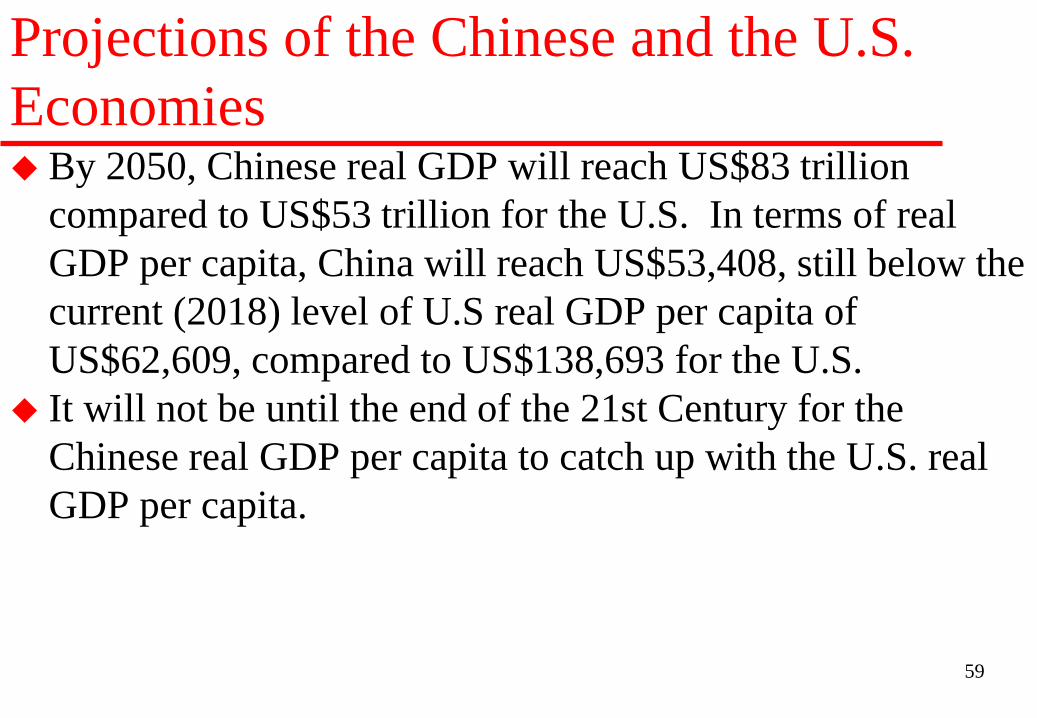
Economies By 2050, Chinese real GDP will reach US$83 trillion
compared to US$53 trillion for the U.S. In terms of real
GDP per capita, China will reach US$53,408, still below the
current (2018) level of U.S real GDP per capita of
US$62,609, compared to US$138,693 for the U.S.
It will not be until the end of the 21st Century for the
Chinese real GDP per capita to catch up with the U.S. real
GDP per capita.
59

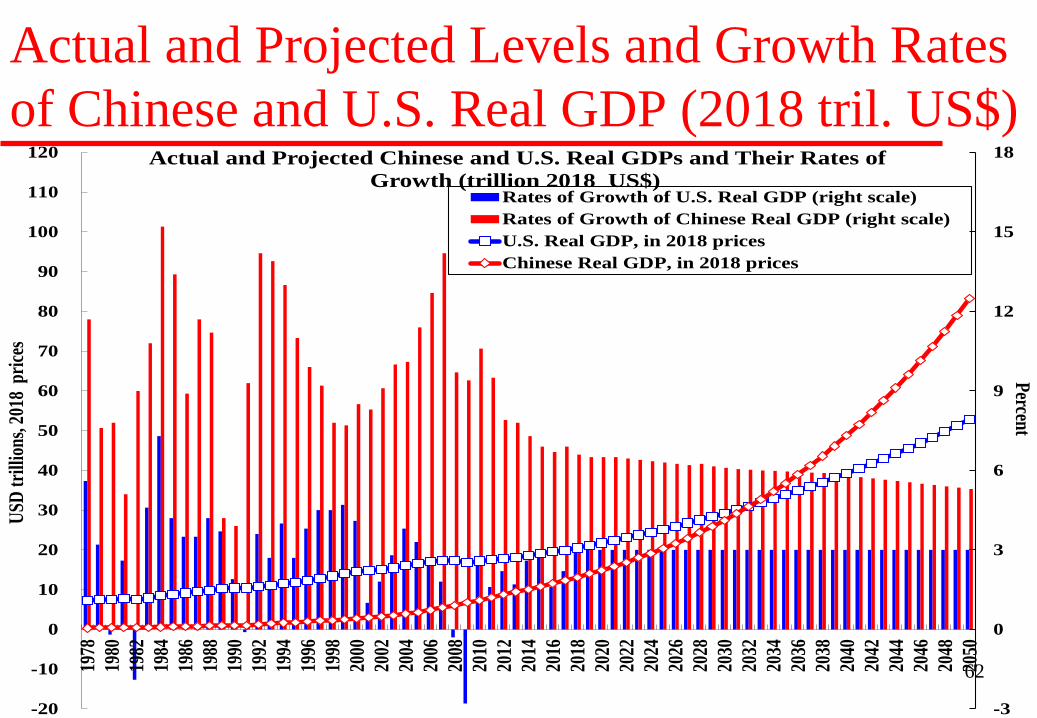
Actual and Projected Levels and Growth Rates
of Chinese and U.S. Real GDP (2018 tril. US$)
-3
0
3
6
9
12
15
18
21
24
-5
0
5
10
15
20
25
30
35
40
1978
1979
1980
1981
1982
1983
1984
1985
1986
1987
1988
1989
1990
1991
1992
1993
1994
1995
1996
1997
1998
1999
2000
2001
2002
2003
2004
2005
2006
2007
2008
2009
2010
2011
2012
2013
2014
2015
2016
2017
2018
2019
2020
2021
2022
2023
2024
2025
2026
2027
2028
2029
2030
2031
2032
2033
2034
2035
Percent
USD
tri
llion
s, 2
018
pri
ces
Actual and Projected Chinese and U.S. Real GDPs and Their Rates of
Growth (trillion 2018 US$)
Rates of Growth of U.S. Real GDP (right scale)
Rates of Growth of Chinese Real GDP (right scale)
U.S. Real GDP, in 2018 prices
Chinese Real GDP, in 2018 prices
60

Actual and Projected Chinese and U.S. Real GDP/Capita
and Their Annual Rates of Growth (1,000 2018 US$ & %)
-4
-2
0
2
4
6
8
10
12
14
16
-25
-20
-15
-10
-5
0
5
10
15
20
25
30
35
40
45
50
55
60
65
70
75
80
85
90
95
100
1978
1979
1980
1981
1982
1983
1984
1985
1986
1987
1988
1989
1990
1991
1992
1993
1994
1995
1996
1997
1998
1999
2000
2001
2002
2003
2004
2005
2006
2007
2008
2009
2010
2011
2012
2013
2014
2015
2016
2017
2018
2019
2020
2021
2022
2023
2024
2025
2026
2027
2028
2029
2030
2031
2032
2033
2034
2035
percentU
SD th
ousa
nd, 2
018
pric
es
Actual and Projected Chinese and U.S. Real GDP per Capita and Their Rates of
Growth (thousand, 2018 US$)
Rates of Growth of U.S. Real GDP per capita (right scale)
Rates of Growth of Chinese Real GDP per Capita (right scale)
U.S. Real GDP per Capita, in 2018 prices
Chinese Real GDP per capita, in 2018 prices
61
Actual and Projected Levels and Growth Rates
of Chinese and U.S. Real GDP (2018 tril. US$)
-3
0
3
6
9
12
15
18
-20
-10
0
10
20
30
40
50
60
70
80
90
100
110
120
1978
1980
1982
1984
1986
1988
1990
1992
1994
1996
1998
2000
2002
2004
2006
2008
2010
2012
2014
2016
2018
2020
2022
2024
2026
2028
2030
2032
2034
2036
2038
2040
2042
2044
2046
2048
2050
Percent
USD
tri
llion
s, 2
018
pri
ces
Actual and Projected Chinese and U.S. Real GDPs and Their Rates of
Growth (trillion 2018 US$) Rates of Growth of U.S. Real GDP (right scale)
Rates of Growth of Chinese Real GDP (right scale)
U.S. Real GDP, in 2018 prices
Chinese Real GDP, in 2018 prices
62

Actual and Projected Chinese and U.S. Real GDP/
Capita and Their Rates of Growth (1,000 2018 US$)
-4
-2
0
2
4
6
8
10
12
14
16
-40
-20
0
20
40
60
80
100
120
140
160
1978
1980
1982
1984
1986
1988
1990
1992
1994
1996
1998
2000
2002
2004
2006
2008
2010
2012
2014
2016
2018
2020
2022
2024
2026
2028
2030
2032
2034
2036
2038
2040
2042
2044
2046
2048
2050
percentU
SD th
ousa
nd, 2
018
pric
es
Actual and Projected Chinese and U.S. Real GDP per Capita and Their Rates of
Growth (thousand, 2018 US$)
Rates of Growth of U.S. Real GDP per capita (right scale)
Rates of Growth of Chinese Real GDP per Capita (right scale)
U.S. Real GDP per Capita, in 2018 prices
Chinese Real GDP per capita, in 2018 prices
63

Technological Competition Technological competition is motivated by national security
considerations as well as commercial considerations. No individual or firm will want to give away or sell its core
competence. In old China, masters typically do not teach their apprentices everything, unless they are male lineal descendants.
It should therefore not be surprising that nations will protect their core competences,
In the case of the atomic bomb—the former Soviet Union developed it independently; China developed it independently, without any foreign assistance; the U.K., France, India, Pakistan and even North Korea developed their nuclear bombs independently.
China will have to continue to develop its own advanced semiconductor, artificial intelligence, and aircraft industries as it may not be able to import the best available from other countries.
64

Investment in Intangible Capital (Human and
R&D Capital) Investment in intangible capital (human capital and Research and
Development (R&D) capital) is indispensable for innovation. The annual expenditure on R&D as percentages of GDP are
presented for selected economies in the following chart. The chart shows that the U.S. has consistently invested a
relatively high percentage of its GDP in R&D, averaging 2.5% since 1963. The East Asian economies, including Mainland China, has been catching up fast, with the exception of Hong Kong.
China is expected to reach its target of 2.5% of GDP in 2020, approximately the same as the average U.S. share over the past more than fifty years. However, it will still be below the expected or targeted levels of the European countries (France, Germany and the U.K.), Japan and South Korea.
65

R&D Expenditures as a Share of GDP and Their Target Levels
at 2020: G-7 Countries, 4 East Asian NIEs, China & Israel
Japan
Germany, U.K.,
France
China
Italy
0
0.5
1
1.5
2
2.5
3
3.5
4
4.5
1963
1964
1965
1966
1967
1968
1969
1970
1971
1972
1973
1974
1975
1976
1977
1978
1979
1980
1981
1982
1983
1984
1985
1986
1987
1988
1989
1990
1991
1992
1993
1994
1995
1996
1997
1998
1999
2000
2001
2002
2003
2004
2005
2006
2007
2008
2009
2010
2011
2012
2013
2014
2015
2016
2017
2020
Taregt P
ercentP
erce
nt
R&D Expenditures as a Ratio of GDP: G-7 Countries, 4 East Asian NIEs, China & Israel
U.S. Japan W. Germany
Germany U.K. France
Canada Italy South Korea
Singapore Taiwan, China Mainland, China
HK, China Israel
66

Investment in Intangible Capital (R&D
Capital) One indicator of the potential for technical progress is the number of
patents created each year. In the following chart, the number of patents granted in the United States each year to the nationals of different countries, including the U.S. itself, over time is presented.
The U.S. is the undisputed champion over the past forty years, with 140,969 patents granted in 2015, followed by Japan, with 52,409. (Since these are patents granted in the U.S., the U.S. may have a home advantage; however, for all the other countries and regions, the comparison across them should be fair.)
The number of patents granted to Mainland Chinese applicants each year has increased from the single-digit levels prior to the mid-1980s to 8,166 in 2015.
The economies of South Korea and Taiwan, granted 17,924 and 11,690 U.S. patents respectively in 2015, were far ahead of Mainland China. In contrast, the number of U.S. patents granted to Hong Kong nationals was only 601 in 2015. 67

Patents Granted in the United States: G-7
Countries, 4 East Asian NIEs, China & Israel
68

Investment in Intangible Capital (R&D
Capital) The R&D capital stock, defined as the cumulative past real
expenditure on R&D less depreciation of 10% per year, is an useful indicator of innovative capacity. R&D expenditure should quite properly be treated as investment since R&D efforts generally take years to yield any results.
The R&D capital stock can be shown to have a direct causal relationship to the number of patents granted (see the following chart, in which the annual number of U.S. patents granted is plotted against the R&D capital stock of that year for each economy).
The chart shows clearly that the higher the stock of R&D capital of an economy, the higher is the number of patents granted to it by the U.S.
69

U.S. Patents Granted and R&D Capital Stocks:
G-7 Countries, 4 EANIEs, China & Israel
0
1
10
100
1,000
10,000
100,000
1,000,000
0 1 10 100 1,000 10,000
Nu
mb
er o
f U
.S. P
aten
ts G
ran
ted
R&D Capital Stocks, in 2016 US$ billions
Canada France
Germany Italy
Japan United Kingdom
United States China
Hong Kong, China South Korea
Singapore Taiwan, China
Israel Linear Regression
𝒚 = 2.160 + 1.145 𝐱 (0.126) (0.025)
70

Investment in Intangible Capital (R&D
Capital) In order for break-through discovery or invention to be made,
there must be significant investment in basic research. Basic research is by definition patient and long-term research.
The rate of return, at any reasonable discount rate, will be low. It must therefore be financed by the government or non-profit institutions and not by for-profit firms.
The atomic and hydrogen bombs, the nuclear reactors, the internet, the packets transmission technology and the browser are all outcomes of basic research done many years ago.
However, Chinese investment in basic research has remained low relative to the other major countries (see the following chart). China devoted only 5 percent of its R&D expenditures to basic research, compared to the more than 15 percent of the U.S.
71

Basic Research Expenditure as a Share of Total
R&D Expenditure: Selected Countries
72

Promoting Mutual Economic Interdependence The problem with a trade war is that there are no real winners—both
countries lose because the feasible choices open to each of them are
reduced.
Exporters in both countries will be hurt because of the reduction in
their exports, and importers in both countries will see their businesses
decline. And the consumers and producers who rely on imported
goods and inputs in both countries will have to pay higher prices.
A better way to narrow the U.S. trade deficit with China is for the U.S.
to increase its exports of goods and services to China, especially
newly created goods and services, for example, by exporting newly
developed liquefied natural gas from Alaska and shale oil and shale
gas from the continental U.S. and producing and exporting meat (beef,
pork and poultry) instead of feed grains (corn and soybeans) to China. 73

Concluding Remarks: What is the outlook for
the Chinese economy in the near term? Even though the direct real impacts of the China-U.S. trade war are
relatively small and manageable for the Chinese economy, the uncertainty that it has created, and the negative influence it has on public confidence and expectations, have also affected the real economy.
Regardless of whether China and the U.S. can reach an agreement, once it is settled one way or the other, it will at least eliminate the uncertainty. And firms and households can make their investment and consumption decisions accordingly.
The Chinese Government is expected to implement cuts in its tax rates, including the value-added tax, corporate and individual income tax, social insurance contribution rates, and continue investing in basic infrastructure projects such as high-speed railroads and urban mass-transit systems. Additional investments in public goods provisions such as environmental preservation, protection and restoration are also possible, especially if an agreement fails to materialise as expected.
The Chinese economy should be able to achieve a real rate of growth of at least 6% in 2019 even though the level of its exports may decline.
74

Concluding Remarks The competition between China and the U.S., whether friendly or
unfriendly, can be assumed to be an ongoing and long-term one. It is the “new normal”. The trade dispute is only a symptom of the potential possible conflicts between the two countries.
Graham Allison, a professor at the Kennedy School of Harvard University, has written about the inevitability of a China-U.S. war. As a rising power challenges the dominance of an established power, the established power is likely to respond with force. He refers to this “inevitability” as the “Thucydides Trap”, drawing on the book by Thucydides, History of the Peloponnesian War.
However, the rise of the former Soviet Union between the end of the Second World War and 1990 provides a counter-example that an established power and a rising power must go to war. The truth is that a thermonuclear war today is so devastating that there are effectively no real winners.
75

Concluding Remarks To reduce the probability of an armed conflict between China and the
U.S. down the road, China-U.S. relations must be carefully managed going forward. Both countries should promote greater mutual economic interdependence, to make their relations win-win, so that a war between them would be unthinkable, just as another war between France and Germany, which fought three wars between them, in 1870, 1914 and 1939, is not possible today.
It is likely that the China-U.S. trade negotiations will be stretched out, perhaps with an interim “understanding”, and that the U.S. tariffs on the remaining approximately half of Chinese exports of goods to the U.S. (US$290 billion in 2018 according to U.S. data) will be put on hold. I believe a complete rupture of the China-U.S. relation is unlikely as the U.S. still needs Chinese cooperation on such issues as North Korean denuclearization and large U.S. corporations still have significant interests in the large and growing Chinese market. China also needs the U.S. to supply critical semi-conductors and semi-conductor manufacturing equipment.
76

Concluding Remarks President Donald Trump is focused solely on his re-election in 2020.
Signing an agreement with China will most certainly expose him to attacks by his Democratic opponent(s). Dragging things out is not such a bad strategy because it shows that he is tough on China and that he will not hesitate to walk away from a “bad deal”. No one will attack him openly for no agreement.
President XI Jinping is also not likely to accept any terms that appear to infringe on Chinese sovereignty because it may arouse domestic discontent and possible opposition. Accepting U.S. terms under duress also creates moral hazard and encourages similar behaviour in the future.
Moreover, the Chinese side is also concerned about the possibility of imposition of last-minute additional conditions by the U.S. as in the Trump-Kim summit in Hanoi. In addition, if even Kim Jong-Un can refuse to accept last-minute U.S. conditions, it is most unlikely that President XI Jinping will be willing or able to accept them. 77

Concluding Remarks China and the rest of the world, except possibly the U.S., will
continue to uphold the current multilateral trading system under the World Trade Organisation (WTO). After all, they have all benefitted and will continue to benefit from it.
China should avoid turning inward or becoming isolated. It should continue to open its economy to international trade and both inbound and outbound direct investment, by lowering tariffs, reducing non-tariff barriers and offering national treatment to foreign direct investors on a reciprocal basis.
Maintaining good economic relations with the rest of the world, and opening its economy further to international trade and investment, in particular, to the European Union, ASEAN, Japan and Russia on a reciprocal basis, is a must for China going forward.
78

Concluding Remarks In the long run, if China and the U.S. cooperate and work
together, many global problems such as prevention of climate change, denuclearisation, and the economic development of Africa, can be solved.
China and the U.S. can both collaborate and compete in finding cures for diseases such as cancer and Alzheimer’s disease, and every country in the world will benefit from it.
The U.S. can invite China to participate in the exploration of Mars and share in the cost, which has been estimated to be hundreds of billions of U.S. dollars.
If the two countries compete in a friendly way, much innovation is possible, as in the competition to build the fastest super-computer. The two countries should aim to become competitive partners!
79
