the climatology of missouri region dew points …weather.missouri.edu/gcc/lupo-2-12.pdf · lupo, et...
TRANSCRIPT
Abstract
Corresponding Author: Anthony R. LupoDepartment of Soil, Environmental, and Atmospheric Science
302 E ABNR Building, University of Missouri, Columbia, MO 65211. E-mail: [email protected]
THE CLIMATOLOGY OF MISSOURI REGION DEW POINTS AND THE RELATIONSHIP TO ENSO
Anthony R. Lupo1,2*
Nicholas B. Smith1
Patrick E. Guinan1,2
Melissa D. Chesser1 1Department of Soil, Environmental, and Atmospheric Science
302 E Anheuser Busch Natural Resources Building University of Missouri Columbia, MO 65211
2Missouri Climate Center1-130 Agriculture Building
University of MissouriColumbia, MO 65211
Dew point temperature and Heat Index temperatures across the state of Missouri were evaluated for the period 1948-2010 to determine any significant long-term trends and interannual or interdecadal variability. The dew point data were used along with temperature data to calculate Heat Index as a measure of human comfort. Trends in dew point temperatures showed statistically significant increases across all of Missouri for the period of record, especially in the summer season, and are consistent with a prior study of an earlier time period. No similar trends were observed for the Heat Index. Seasonally averaged dew point temperatures since 1948 were also compared with the ENSO cycle. La Niña years, especially the spring and summer seasons, were associated with the lowest mean values while El Niño and neutral year values were similar to each other. A synoptic analysis of typical ENSO phase winter and summer seasons demonstrated that, during years with lower (higher) dew points, mean low-level synoptic flow into the Missouri region was out of the continental southwest (Gulf of Mexico).
Key words: dew point, climatology, interannual variability, Heat Index, El Niño, (WINNIE ASKED IF THIS PART IS INTENTIONAL - FIRST TIME USING KEY WORDS)
Submitted to: National Weather DigestSeptember 2011
Revised March 2012, June 2012, August 2012

Lupo, et al.
10 National Weather Digest
1. Introduction
Studying the climatological character of dew point temperature in a region, including the interannual variability of this quantity, would be important for short and long term forecasting, as well as an indicator of human comfort or the potential for fire danger. However, in order to best relate dew points with human comfort, a combination of moisture and temperature is appropriate, such as the Heat Index. This measure can also provide a means to examine interannual and interdecadal variability, as well as the individual parameters separately, and relate them to longer term (mean synoptic) atmospheric patterns and potentially global circulation regimes. The amount of water vapor in the atmosphere varies with time and location on the synoptic-scale; however, from a climatic point of view most of this gas is found within the lowest 1-2 km of the surface (e.g., Hurrell et al. 1995). Additionally, the dew point tends to correlate with air temperature in the mean (e.g., Ahrens 2012).
A climatological examination of dew point across Missouri has not been performed recently, and a survey of the meteorological literature reveals that there are not many climatological studies of dew point. Most studies relate to short term weather prediction or variations (e.g., Stensrud and Yussouf 2003), and as such do not address climatologic behavior. Gaffen and Ross (1999) published a climatological study that included specific humidity, dew point, and relative humidity across the United States from 1960-1995. The Missouri Region was part of the larger south-central region in their study, and they showed that summer season relative humidity was increasing across the region at the 95% confidence level. Other studies have examined global (e.g., Dai 2006), or local (e.g., Dixon 2004; Chen and Konrad 2006) trends in moisture variables, and the latter study examines the synoptic situations associated with more humid periods. Dixon (2004) studied the impact of urban growth on relative humidity trends and urban-rural humidity differences in the Southwest. This study found that the Phoenix urban area had higher atmospheric moisture content than rural areas, but that the long term trends in atmospheric moisture for both types of surface cover were small.
The climatological behavior of atmospheric water vapor amounts and implications for impacts on climate change have also been considered (e.g., IPCC 2007). Additionally, it has been theorized that the atmospheric water cycle would be more vigorous in a warmer world (GCCIUS 2009). Collectively, these have implied higher dew points with the same or higher temperatures. Such conditions could lead to increased human discomfort in the warm season as well, as reflected by higher Heat Index values. The Heat Index provides an equivalent
temperature based on the rate of energy lost from a human body as affected by the atmospheric moisture and wind (e.g., Steadman 1984). This integrative measure is valuable to weather forecasters in their issuance of advisories and excessive heat statements that could be issued more frequently given future climate scenarios presented in the literature.
The primary goal of the present work is to examine the climatological behavior of dew point temperatures and the Heat Index in the Missouri Region, and to examine their interannual and interdecadal variability. Following the methodologies of previous studies, we also test the data set to determine if the interannual variability in dew point temperatures is El Niño-related. Other studies that have examined the long-term behavior of climate in this region have found interannual (ENSO-related) or interdecadal variability in the snowfall (e.g., Berger et al. 2003; Lupo et al. 2005), tornadoes (e.g. Akyuz et al. 2004), and temperatures and precipitation (e.g. Lupo et al. 2007, 2008; Birk et al. 2010). Additionally, a test was conducted to determine whether there has been a statistically significant increase in dew point temperatures, especially in the summer season, and whether there have been any significant changes in the Heat Index. These were then considered with regard to synoptic regimes in an attempt to explain why some seasons may experience higher moisture levels (and possibly greater human discomfort) than others.
2. Data and Methods
2.1 DataDew point data were provided by the Missouri Climate
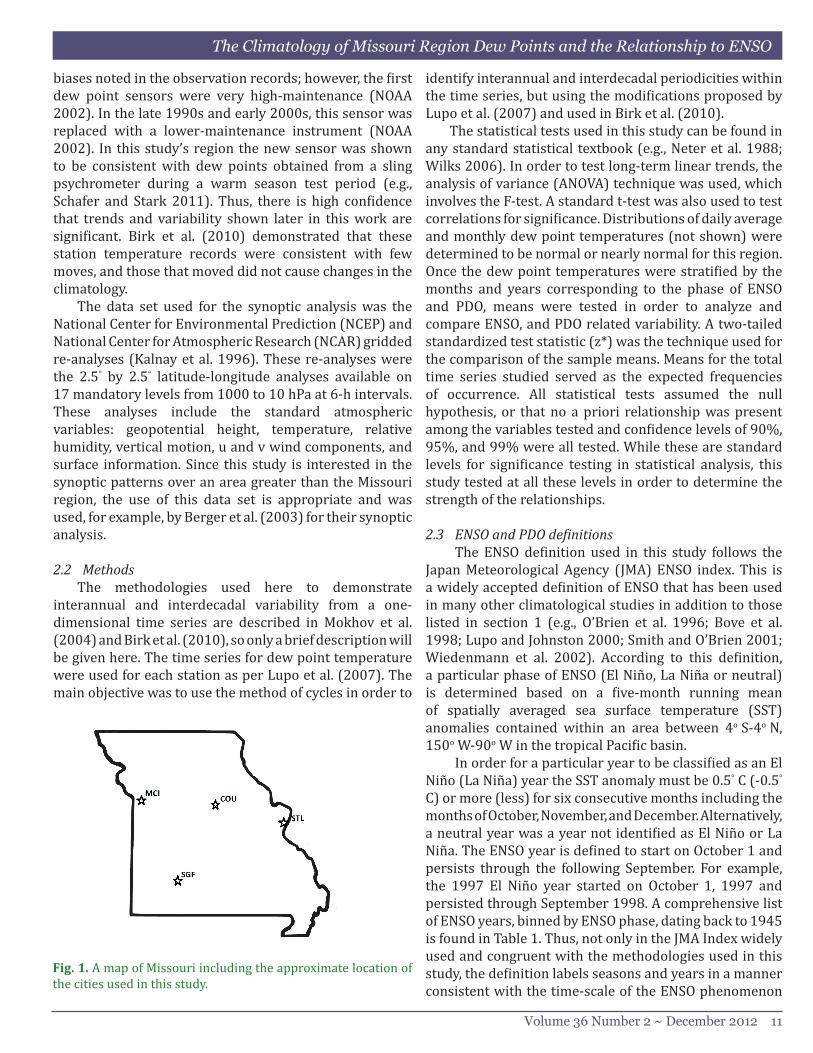
Center (MCC, http://climate.missouri.edu), through the Midwest Regional Climate Center (MRCC, http://mcc.sws.uiuc.edu). Degrees Fahrenheit were converted to degrees Celsius since the latter is the standard unit for the display of temperature even though archival of surface temperature information in the United States uses the former unit. The monthly mean dew point temperature was obtained for the cities of Columbia (COU), Kansas City (MCI), Saint Louis (STL), and Springfield (SGF), MO for a 63-year period from 1948-2010 (Fig. 1). These four stations were also included in the Gaffen and Ross (1999) study, and the time period used here is longer than the period of record used in their study. However, the analyses focus was on the COU dew point temperatures since these were most representative of the regional trends and variability as previously determined by Ratley et al. (2002).
During the early to mid-1990s, a modernization program resulted in the replacement of manual observations with the Automated Surface Observing System (ASOS) across Missouri. There were no significant
The Climatology of Missouri Region Dew Points and the Relationship to ENSO
Volume 36 Number 2 ~ December 2012 11
identify interannual and interdecadal periodicities within the time series, but using the modifications proposed by Lupo et al. (2007) and used in Birk et al. (2010).
The statistical tests used in this study can be found in any standard statistical textbook (e.g., Neter et al. 1988; Wilks 2006). In order to test long-term linear trends, the analysis of variance (ANOVA) technique was used, which involves the F-test. A standard t-test was also used to test correlations for significance. Distributions of daily average and monthly dew point temperatures (not shown) were determined to be normal or nearly normal for this region. Once the dew point temperatures were stratified by the months and years corresponding to the phase of ENSO and PDO, means were tested in order to analyze and compare ENSO, and PDO related variability. A two-tailed standardized test statistic (z*) was the technique used for the comparison of the sample means. Means for the total time series studied served as the expected frequencies of occurrence. All statistical tests assumed the null hypothesis, or that no a priori relationship was present among the variables tested and confidence levels of 90%, 95%, and 99% were all tested. While these are standard levels for significance testing in statistical analysis, this study tested at all these levels in order to determine the strength of the relationships.
2.3 ENSOandPDOdefinitions The ENSO definition used in this study follows the Japan Meteorological Agency (JMA) ENSO index. This is a widely accepted definition of ENSO that has been used in many other climatological studies in addition to those listed in section 1 (e.g., O’Brien et al. 1996; Bove et al. 1998; Lupo and Johnston 2000; Smith and O’Brien 2001; Wiedenmann et al. 2002). According to this definition, a particular phase of ENSO (El Niño, La Niña or neutral) is determined based on a five-month running mean of spatially averaged sea surface temperature (SST) anomalies contained within an area between 4o S-4o N, 150o W-90o W in the tropical Pacific basin. In order for a particular year to be classified as an El Niño (La Niña) year the SST anomaly must be 0.5° C (-0.5° C) or more (less) for six consecutive months including the months of October, November, and December. Alternatively, a neutral year was a year not identified as El Niño or La Niña. The ENSO year is defined to start on October 1 and persists through the following September. For example, the 1997 El Niño year started on October 1, 1997 and persisted through September 1998. A comprehensive list of ENSO years, binned by ENSO phase, dating back to 1945 is found in Table 1. Thus, not only in the JMA Index widely used and congruent with the methodologies used in this study, the definition labels seasons and years in a manner consistent with the time-scale of the ENSO phenomenon
Fig. 1. A map of Missouri including the approximate location of the cities used in this study.
biases noted in the observation records; however, the first dew point sensors were very high-maintenance (NOAA 2002). In the late 1990s and early 2000s, this sensor was replaced with a lower-maintenance instrument (NOAA 2002). In this study’s region the new sensor was shown to be consistent with dew points obtained from a sling psychrometer during a warm season test period (e.g., Schafer and Stark 2011). Thus, there is high confidence that trends and variability shown later in this work are significant. Birk et al. (2010) demonstrated that these station temperature records were consistent with few moves, and those that moved did not cause changes in the climatology.
The data set used for the synoptic analysis was the National Center for Environmental Prediction (NCEP) and National Center for Atmospheric Research (NCAR) gridded re-analyses (Kalnay et al. 1996). These re-analyses were the 2.5° by 2.5° latitude-longitude analyses available on 17 mandatory levels from 1000 to 10 hPa at 6-h intervals. These analyses include the standard atmospheric variables: geopotential height, temperature, relative humidity, vertical motion, u and v wind components, and surface information. Since this study is interested in the synoptic patterns over an area greater than the Missouri region, the use of this data set is appropriate and was used, for example, by Berger et al. (2003) for their synoptic analysis.
2.2 MethodsThe methodologies used here to demonstrate
interannual and interdecadal variability from a one-dimensional time series are described in Mokhov et al. (2004) and Birk et al. (2010), so only a brief description will be given here. The time series for dew point temperature were used for each station as per Lupo et al. (2007). The main objective was to use the method of cycles in order to
Lupo, et al.
12 National Weather Digest
2.4. Heat Index The Heat Index was calculated here by using the
Steadman (1984) formulation for a human comfort index. This index is an empirical formulation that approximates the effect of temperature, moisture, and wind on human comfort and is usually used at higher temperatures. The relationship can be written as follows:
HI (°C) = (-2.7) + 1.04*T (°C) + 2.0*pv (kPa) – 0.65*WS (ms-1) (1)
where T is the ambient outdoor temperature, pv is vapor pressure, and WS is the wind speed. This relationship assumes shaded conditions in the outdoors. Here, the wind speed is kept at a constant 2.5 m s-1 since that is close to 5 mph, which is assumed for the table distributed to the public or in operational forecasting that relates moisture to temperature and yield the Heat Index. Thus, the wind term represents essentially a constant value, which is appropriate in a multi-variable relationship since this analysis is examining the impact of temperature and moisture in the Heat Index. Additionally, there is no significant trend in the wind speed for this region (not shown). Then, Heat Index as calculated here is a function of temperature and vapor pressure, and vapor pressure can be obtained from the dew point by using the Clausius-Clapeyron equation. Thus, trends in the Heat Index values may be similar to the trends in dew point and/or temperature.1http://www.cpc.ncep.noaa.gov/products/analysis_monitoring/ensostuff/ensoyears.shtml
3. Long-Term Dew Point and Heat Index Trends
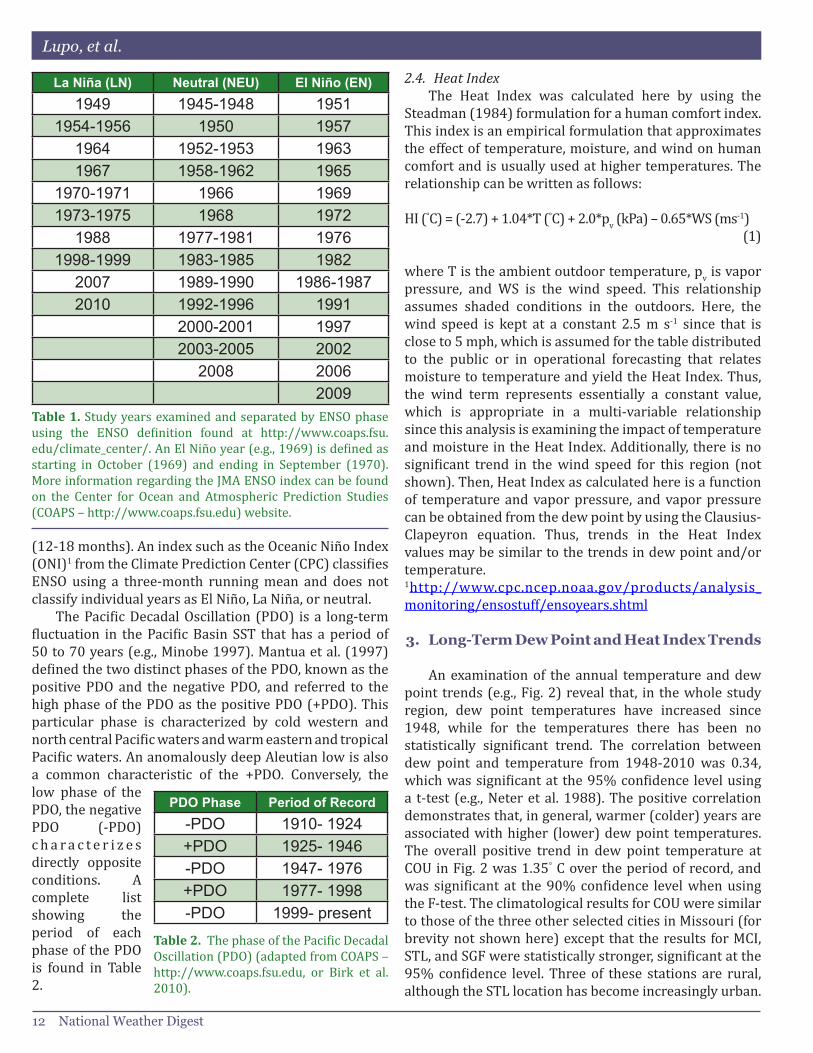
An examination of the annual temperature and dew point trends (e.g., Fig. 2) reveal that, in the whole study region, dew point temperatures have increased since 1948, while for the temperatures there has been no statistically significant trend. The correlation between dew point and temperature from 1948-2010 was 0.34, which was significant at the 95% confidence level using a t-test (e.g., Neter et al. 1988). The positive correlation demonstrates that, in general, warmer (colder) years are associated with higher (lower) dew point temperatures. The overall positive trend in dew point temperature at COU in Fig. 2 was 1.35° C over the period of record, and was significant at the 90% confidence level when using the F-test. The climatological results for COU were similar to those of the three other selected cities in Missouri (for brevity not shown here) except that the results for MCI, STL, and SGF were statistically stronger, significant at the 95% confidence level. Three of these stations are rural, although the STL location has become increasingly urban.
Table 1. Study years examined and separated by ENSO phase using the ENSO definition found at http://www.coaps.fsu.edu/climate_center/. An El Niño year (e.g., 1969) is defined as starting in October (1969) and ending in September (1970). More information regarding the JMA ENSO index can be found on the Center for Ocean and Atmospheric Prediction Studies (COAPS – http://www.coaps.fsu.edu) website.
La Niña (LN) Neutral (NEU) El Niño (EN)1949 1945-1948 1951
1954-1956 1950 19571964 1952-1953 19631967 1958-1962 1965
1970-1971 1966 19691973-1975 1968 1972
1988 1977-1981 19761998-1999 1983-1985 1982
2007 1989-1990 1986-19872010 1992-1996 1991
2000-2001 19972003-2005 2002
2008 20062009
Table 2. The phase of the Pacific Decadal Oscillation (PDO) (adapted from COAPS – http://www.coaps.fsu.edu, or Birk et al. 2010).
PDO Phase Period of Record -PDO 1910- 1924+PDO 1925- 1946-PDO 1947- 1976+PDO 1977- 1998-PDO 1999- present
(12-18 months). An index such as the Oceanic Niño Index (ONI)1 from the Climate Prediction Center (CPC) classifies ENSO using a three-month running mean and does not classify individual years as El Niño, La Niña, or neutral.
The Pacific Decadal Oscillation (PDO) is a long-term fluctuation in the Pacific Basin SST that has a period of 50 to 70 years (e.g., Minobe 1997). Mantua et al. (1997) defined the two distinct phases of the PDO, known as the positive PDO and the negative PDO, and referred to the high phase of the PDO as the positive PDO (+PDO). This particular phase is characterized by cold western and north central Pacific waters and warm eastern and tropical Pacific waters. An anomalously deep Aleutian low is also a common characteristic of the +PDO. Conversely, the low phase of the PDO, the negative PDO (-PDO) c h a r a c t e r i z e s directly opposite conditions. A complete list showing the period of each phase of the PDO is found in Table 2.
The Climatology of Missouri Region Dew Points and the Relationship to ENSO
Volume 36 Number 2 ~ December 2012 13
1948 to about 1977 (but not significant), and then both quantities were strongly positive until about 2000, and then the trends became steady thereafter. These patterns follow those of the global temperature trends during these time frames (e.g., Peterson and Baringer 2009), and the points at which the temperature and dew point trends change correspond approximately to shifts in the PDO (see Table 2 and Birk et al. 2010). However, these annual trends are not statistically significant.
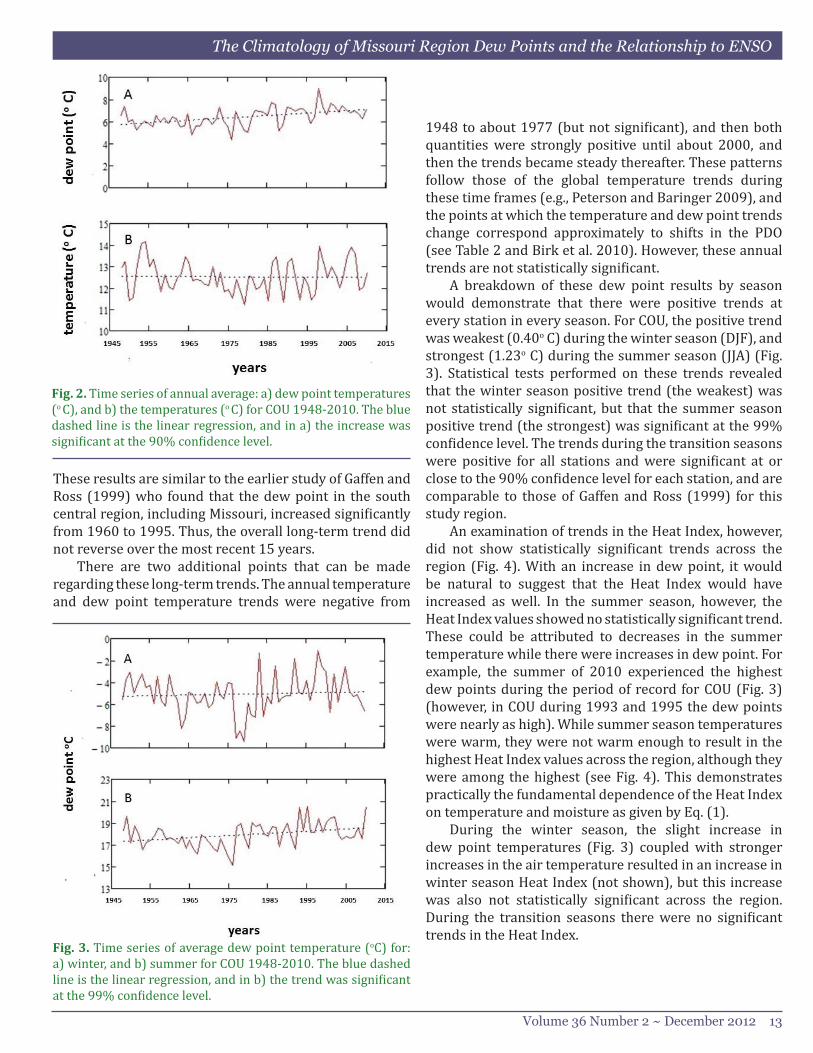
A breakdown of these dew point results by season would demonstrate that there were positive trends at every station in every season. For COU, the positive trend was weakest (0.40o C) during the winter season (DJF), and strongest (1.23o C) during the summer season (JJA) (Fig. 3). Statistical tests performed on these trends revealed that the winter season positive trend (the weakest) was not statistically significant, but that the summer season positive trend (the strongest) was significant at the 99% confidence level. The trends during the transition seasons were positive for all stations and were significant at or close to the 90% confidence level for each station, and are comparable to those of Gaffen and Ross (1999) for this study region.
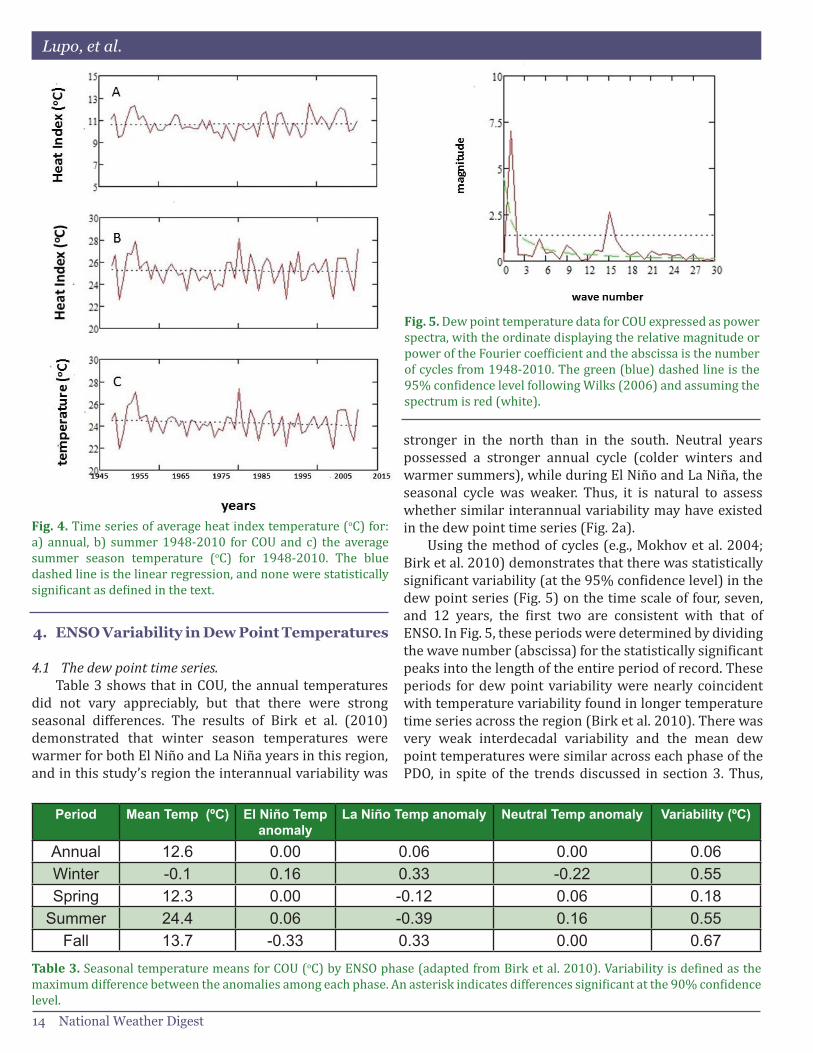
An examination of trends in the Heat Index, however, did not show statistically significant trends across the region (Fig. 4). With an increase in dew point, it would be natural to suggest that the Heat Index would have increased as well. In the summer season, however, the Heat Index values showed no statistically significant trend. These could be attributed to decreases in the summer temperature while there were increases in dew point. For example, the summer of 2010 experienced the highest dew points during the period of record for COU (Fig. 3) (however, in COU during 1993 and 1995 the dew points were nearly as high). While summer season temperatures were warm, they were not warm enough to result in the highest Heat Index values across the region, although they were among the highest (see Fig. 4). This demonstrates practically the fundamental dependence of the Heat Index on temperature and moisture as given by Eq. (1).
During the winter season, the slight increase in dew point temperatures (Fig. 3) coupled with stronger increases in the air temperature resulted in an increase in winter season Heat Index (not shown), but this increase was also not statistically significant across the region. During the transition seasons there were no significant trends in the Heat Index.
Fig. 2. Time series of annual average: a) dew point temperatures (o C), and b) the temperatures (o C) for COU 1948-2010. The blue dashed line is the linear regression, and in a) the increase was significant at the 90% confidence level.
Fig. 3. Time series of average dew point temperature (oC) for: a) winter, and b) summer for COU 1948-2010. The blue dashed line is the linear regression, and in b) the trend was significant at the 99% confidence level.
These results are similar to the earlier study of Gaffen and Ross (1999) who found that the dew point in the south central region, including Missouri, increased significantly from 1960 to 1995. Thus, the overall long-term trend did not reverse over the most recent 15 years.
There are two additional points that can be made regarding these long-term trends. The annual temperature and dew point temperature trends were negative from
Lupo, et al.
14 National Weather Digest
Fig. 4. Time series of average heat index temperature (oC) for: a) annual, b) summer 1948-2010 for COU and c) the average summer season temperature (oC) for 1948-2010. The blue dashed line is the linear regression, and none were statistically significant as defined in the text.
4. ENSO Variability in Dew Point Temperatures
4.1 The dew point time series. Table 3 shows that in COU, the annual temperatures
did not vary appreciably, but that there were strong seasonal differences. The results of Birk et al. (2010) demonstrated that winter season temperatures were warmer for both El Niño and La Niña years in this region, and in this study’s region the interannual variability was
Table 3. Seasonal temperature means for COU (oC) by ENSO phase (adapted from Birk et al. 2010). Variability is defined as the maximum difference between the anomalies among each phase. An asterisk indicates differences significant at the 90% confidence level.
Period Mean Temp (ºC) El Niño Temp anomaly
La Niño Temp anomaly Neutral Temp anomaly Variability (ºC)
Annual 12.6 0.00 0.06 0.00 0.06Winter -0.1 0.16 0.33 -0.22 0.55Spring 12.3 0.00 -0.12 0.06 0.18
Summer 24.4 0.06 -0.39 0.16 0.55Fall 13.7 -0.33 0.33 0.00 0.67
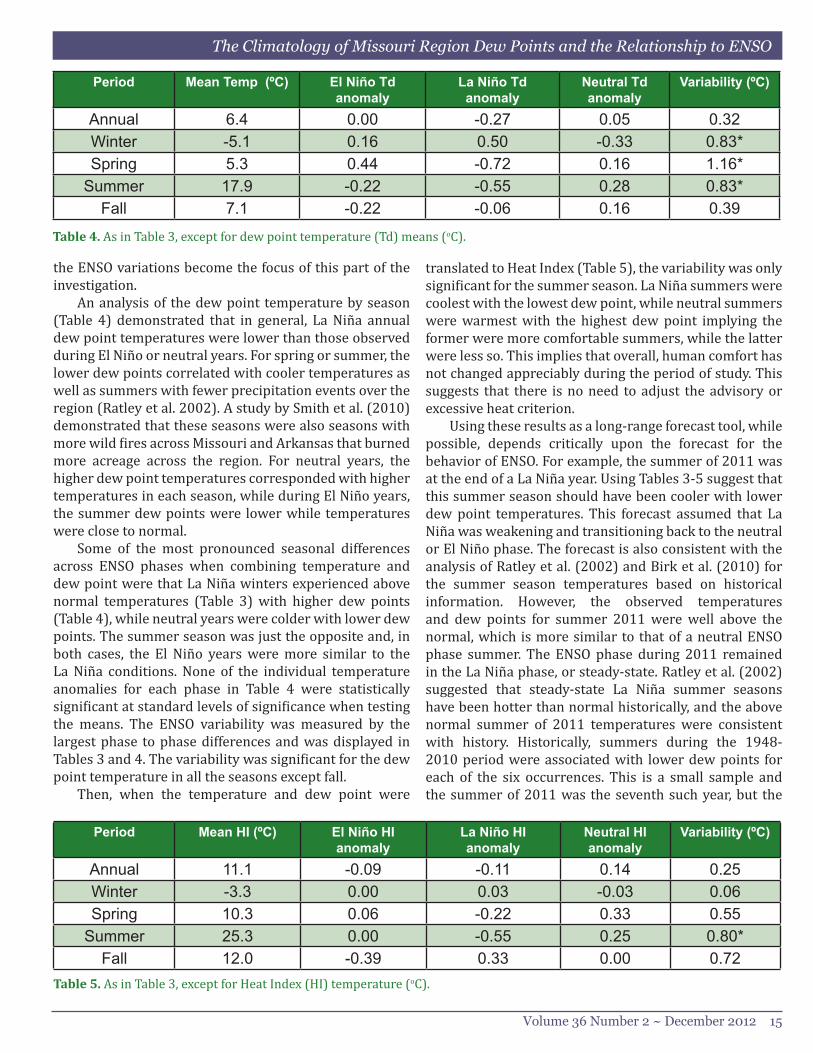
Fig. 5. Dew point temperature data for COU expressed as power spectra, with the ordinate displaying the relative magnitude or power of the Fourier coefficient and the abscissa is the number of cycles from 1948-2010. The green (blue) dashed line is the 95% confidence level following Wilks (2006) and assuming the spectrum is red (white).
stronger in the north than in the south. Neutral years possessed a stronger annual cycle (colder winters and warmer summers), while during El Niño and La Niña, the seasonal cycle was weaker. Thus, it is natural to assess whether similar interannual variability may have existed in the dew point time series (Fig. 2a).
Using the method of cycles (e.g., Mokhov et al. 2004; Birk et al. 2010) demonstrates that there was statistically significant variability (at the 95% confidence level) in the dew point series (Fig. 5) on the time scale of four, seven, and 12 years, the first two are consistent with that of ENSO. In Fig. 5, these periods were determined by dividing the wave number (abscissa) for the statistically significant peaks into the length of the entire period of record. These periods for dew point variability were nearly coincident with temperature variability found in longer temperature time series across the region (Birk et al. 2010). There was very weak interdecadal variability and the mean dew point temperatures were similar across each phase of the PDO, in spite of the trends discussed in section 3. Thus,
The Climatology of Missouri Region Dew Points and the Relationship to ENSO
Volume 36 Number 2 ~ December 2012 15
the ENSO variations become the focus of this part of the investigation.
An analysis of the dew point temperature by season (Table 4) demonstrated that in general, La Niña annual dew point temperatures were lower than those observed during El Niño or neutral years. For spring or summer, the lower dew points correlated with cooler temperatures as well as summers with fewer precipitation events over the region (Ratley et al. 2002). A study by Smith et al. (2010) demonstrated that these seasons were also seasons with more wild fires across Missouri and Arkansas that burned more acreage across the region. For neutral years, the higher dew point temperatures corresponded with higher temperatures in each season, while during El Niño years, the summer dew points were lower while temperatures were close to normal.
Some of the most pronounced seasonal differences across ENSO phases when combining temperature and dew point were that La Niña winters experienced above normal temperatures (Table 3) with higher dew points (Table 4), while neutral years were colder with lower dew points. The summer season was just the opposite and, in both cases, the El Niño years were more similar to the La Niña conditions. None of the individual temperature anomalies for each phase in Table 4 were statistically significant at standard levels of significance when testing the means. The ENSO variability was measured by the largest phase to phase differences and was displayed in Tables 3 and 4. The variability was significant for the dew point temperature in all the seasons except fall.
Then, when the temperature and dew point were
Table 4. As in Table 3, except for dew point temperature (Td) means (oC).
Table 5. As in Table 3, except for Heat Index (HI) temperature (oC).
Period Mean Temp (ºC) El Niño Td anomaly
La Niño Td anomaly
Neutral Td anomaly
Variability (ºC)
Annual 6.4 0.00 -0.27 0.05 0.32Winter -5.1 0.16 0.50 -0.33 0.83*Spring 5.3 0.44 -0.72 0.16 1.16*
Summer 17.9 -0.22 -0.55 0.28 0.83*Fall 7.1 -0.22 -0.06 0.16 0.39
Period Mean HI (ºC) El Niño HI anomaly
La Niño HI anomaly
Neutral HI anomaly
Variability (ºC)
Annual 11.1 -0.09 -0.11 0.14 0.25Winter -3.3 0.00 0.03 -0.03 0.06Spring 10.3 0.06 -0.22 0.33 0.55
Summer 25.3 0.00 -0.55 0.25 0.80*Fall 12.0 -0.39 0.33 0.00 0.72
translated to Heat Index (Table 5), the variability was only significant for the summer season. La Niña summers were coolest with the lowest dew point, while neutral summers were warmest with the highest dew point implying the former were more comfortable summers, while the latter were less so. This implies that overall, human comfort has not changed appreciably during the period of study. This suggests that there is no need to adjust the advisory or excessive heat criterion.
Using these results as a long-range forecast tool, while possible, depends critically upon the forecast for the behavior of ENSO. For example, the summer of 2011 was at the end of a La Niña year. Using Tables 3-5 suggest that this summer season should have been cooler with lower dew point temperatures. This forecast assumed that La Niña was weakening and transitioning back to the neutral or El Niño phase. The forecast is also consistent with the analysis of Ratley et al. (2002) and Birk et al. (2010) for the summer season temperatures based on historical information. However, the observed temperatures and dew points for summer 2011 were well above the normal, which is more similar to that of a neutral ENSO phase summer. The ENSO phase during 2011 remained in the La Niña phase, or steady-state. Ratley et al. (2002) suggested that steady-state La Niña summer seasons have been hotter than normal historically, and the above normal summer of 2011 temperatures were consistent with history. Historically, summers during the 1948-2010 period were associated with lower dew points for each of the six occurrences. This is a small sample and the summer of 2011 was the seventh such year, but the
Lupo, et al.
16 National Weather Digest
dew point was above normal. Thus, it is clear that in order to use this information as a reliable predictive tool, more analysis would be necessary.
In order to determine if the results identified above can be explained, the twice daily synoptic maps were averaged for a season and analyzed to determine if any differences across ENSO phase could be found in the predominant flow regimes. Years that were representative of each phase of ENSO were examined rather than composites of several years, since this type of compositing can filter out details in the flow regime with respect to the location of the feature of interest. While the NCEP re-analyses were of adequate resolution, further filtering of detail would be undesirable.
4.2 Synoptic500and850hPaheightfieldsIn examining the mean winter height fields (Fig. 6)
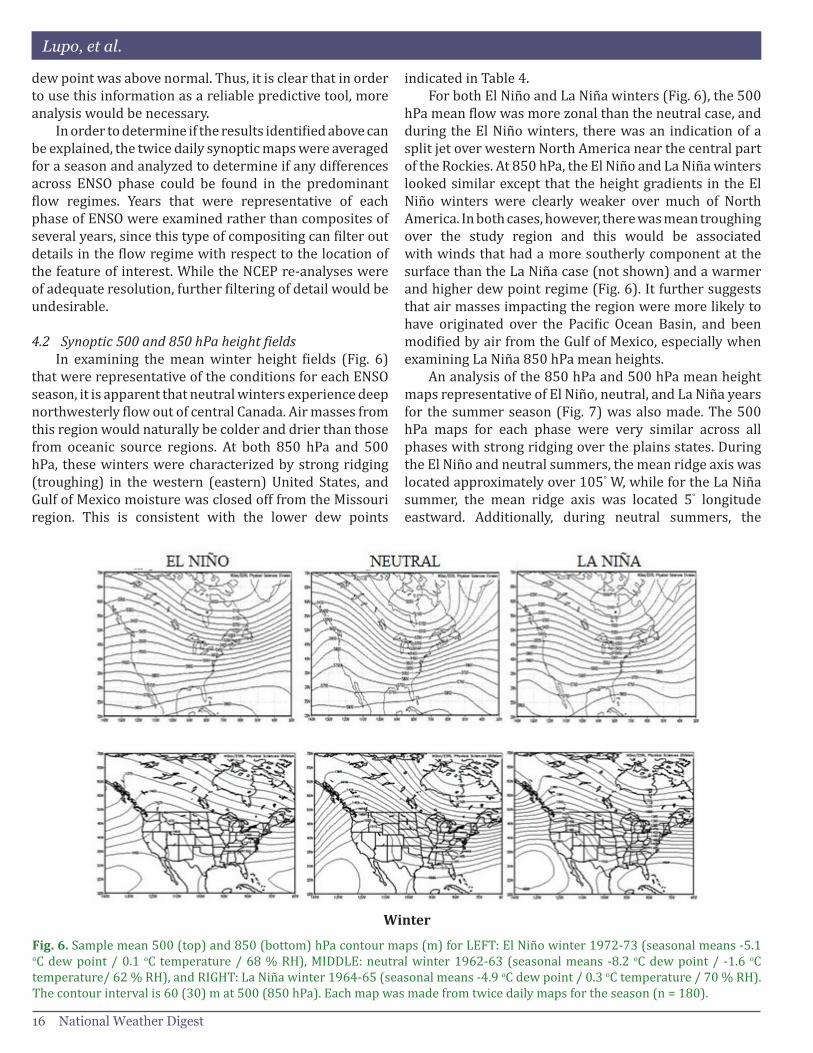
that were representative of the conditions for each ENSO season, it is apparent that neutral winters experience deep northwesterly flow out of central Canada. Air masses from this region would naturally be colder and drier than those from oceanic source regions. At both 850 hPa and 500 hPa, these winters were characterized by strong ridging (troughing) in the western (eastern) United States, and Gulf of Mexico moisture was closed off from the Missouri region. This is consistent with the lower dew points
indicated in Table 4. For both El Niño and La Niña winters (Fig. 6), the 500
hPa mean flow was more zonal than the neutral case, and during the El Niño winters, there was an indication of a split jet over western North America near the central part of the Rockies. At 850 hPa, the El Niño and La Niña winters looked similar except that the height gradients in the El Niño winters were clearly weaker over much of North America. In both cases, however, there was mean troughing over the study region and this would be associated with winds that had a more southerly component at the surface than the La Niña case (not shown) and a warmer and higher dew point regime (Fig. 6). It further suggests that air masses impacting the region were more likely to have originated over the Pacific Ocean Basin, and been modified by air from the Gulf of Mexico, especially when examining La Niña 850 hPa mean heights.
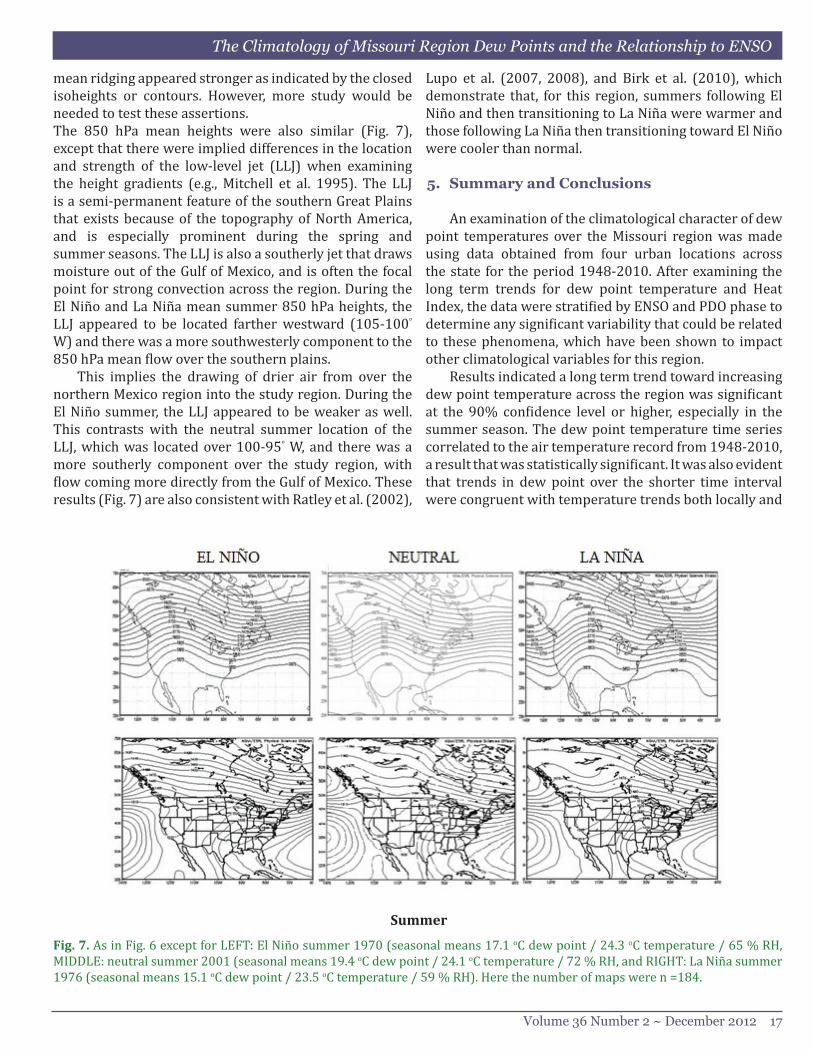
An analysis of the 850 hPa and 500 hPa mean height maps representative of El Niño, neutral, and La Niña years for the summer season (Fig. 7) was also made. The 500 hPa maps for each phase were very similar across all phases with strong ridging over the plains states. During the El Niño and neutral summers, the mean ridge axis was located approximately over 105° W, while for the La Niña summer, the mean ridge axis was located 5° longitude eastward. Additionally, during neutral summers, the
Fig. 6. Sample mean 500 (top) and 850 (bottom) hPa contour maps (m) for LEFT: El Niño winter 1972-73 (seasonal means -5.1 oC dew point / 0.1 oC temperature / 68 % RH), MIDDLE: neutral winter 1962-63 (seasonal means -8.2 oC dew point / -1.6 oC temperature/ 62 % RH), and RIGHT: La Niña winter 1964-65 (seasonal means -4.9 oC dew point / 0.3 oC temperature / 70 % RH). The contour interval is 60 (30) m at 500 (850 hPa). Each map was made from twice daily maps for the season (n = 180).
Winter
The Climatology of Missouri Region Dew Points and the Relationship to ENSO
Volume 36 Number 2 ~ December 2012 17
Fig. 7. As in Fig. 6 except for LEFT: El Niño summer 1970 (seasonal means 17.1 oC dew point / 24.3 oC temperature / 65 % RH, MIDDLE: neutral summer 2001 (seasonal means 19.4 oC dew point / 24.1 oC temperature / 72 % RH, and RIGHT: La Niña summer 1976 (seasonal means 15.1 oC dew point / 23.5 oC temperature / 59 % RH). Here the number of maps were n =184.
Summer
mean ridging appeared stronger as indicated by the closed isoheights or contours. However, more study would be needed to test these assertions.The 850 hPa mean heights were also similar (Fig. 7), except that there were implied differences in the location and strength of the low-level jet (LLJ) when examining the height gradients (e.g., Mitchell et al. 1995). The LLJ is a semi-permanent feature of the southern Great Plains that exists because of the topography of North America, and is especially prominent during the spring and summer seasons. The LLJ is also a southerly jet that draws moisture out of the Gulf of Mexico, and is often the focal point for strong convection across the region. During the El Niño and La Niña mean summer 850 hPa heights, the LLJ appeared to be located farther westward (105-100° W) and there was a more southwesterly component to the 850 hPa mean flow over the southern plains.
This implies the drawing of drier air from over the northern Mexico region into the study region. During the El Niño summer, the LLJ appeared to be weaker as well. This contrasts with the neutral summer location of the LLJ, which was located over 100-95° W, and there was a more southerly component over the study region, with flow coming more directly from the Gulf of Mexico. These results (Fig. 7) are also consistent with Ratley et al. (2002),
Lupo et al. (2007, 2008), and Birk et al. (2010), which demonstrate that, for this region, summers following El Niño and then transitioning to La Niña were warmer and those following La Niña then transitioning toward El Niño were cooler than normal.
5. Summary and Conclusions
An examination of the climatological character of dew point temperatures over the Missouri region was made using data obtained from four urban locations across the state for the period 1948-2010. After examining the long term trends for dew point temperature and Heat Index, the data were stratified by ENSO and PDO phase to determine any significant variability that could be related to these phenomena, which have been shown to impact other climatological variables for this region.
Results indicated a long term trend toward increasing dew point temperature across the region was significant at the 90% confidence level or higher, especially in the summer season. The dew point temperature time series correlated to the air temperature record from 1948-2010, a result that was statistically significant. It was also evident that trends in dew point over the shorter time interval were congruent with temperature trends both locally and

Lupo, et al.
18 National Weather Digest
globally. In spite of the increases in dew point across the region, the Heat Index values did not show statistically significant trends overall or in the summer season.
Within the dew point time series, interannual variability could also be identified using the method of cycles, and was statistically significant at the 95% confidence level. This was ENSO-related variability. In particular, El Niño and La Niña winters were warmer and associated with higher dew point temperatures than ENSO neutral winters. The Heat Index values showed some ENSO related variability, and this was significant during the summer season. This result implied that La Niña summers were more comfortable (lower Heat Index) in this region, these results could be useful for energy or power producers. An examination of the seasonal mean synoptic maps demonstrated that during the neutral winters, there was deep northwesterly flow over the region. This likely explains why these years were drier and colder than the overall average. During El Niño and La Niña winters, flow across the study region was more zonal aloft, and 850 hPa troughing was responsible for higher dew point temperatures across the region.
During the warm season, it appears that neutral summers were warmer and more humid (higher dew point temperatures), while El Niño and La Niña years were drier and cooler. The location and strength of the LLJ may explain these differences, in that the LLJ was located farther east and was stronger during neutral years, thus bringing more moisture into the study region from the Gulf of Mexico than during El Niño or La Niña summers.
Finally, these results would be useful for seasonal range forecasting and planning by the power industry, agriculture, or for the assessment of the potential for fire danger. These applications are just a few of those that are dependent on the temperature and moisture character of an extended period of time.
References
Ahrens, C. D., 2012: Meteorology Today: An Introduction to Weather, Climate, and the Environment. 10th ed., Brooks-Cole, 567 pp.
Akyuz, F. A., M. D. Chambers, and A. R. Lupo, 2004: The short and long-term variability of F2 or stronger (significant) tornadoes in the Central Plains, Trans. MO Acad. Sci. 38, 26-45.
Berger, C. L., A. R. Lupo, P. Browning, M. Bodner, C. C. Rayburn, and M. D. Chambers, 2003: A climatology of Northwest Missouri snowfall events: Long term trends and interannual variability, Phys. Geog. 14, 427-448.
Birk, K., A. R. Lupo, P. E. Guinan, and C. E. Barbieri, 2010: The interannual variability of Midwestern temperatures and precipitation as related to the ENSO and PDO, Atmosfera 23, 95-128.
Bove, M. C., J. B. Elsner, C. W. Landsea, X. Niu, and J. J. O’Brien, 1998: Effects of El Niño on U.S. landfalling hurricanes, revisited, Bull. Amer. Met. Soc. 79, 2477-2482.
Chen, F, and C. E. Konrad, 2006: A Synoptic Climatology of Summertime Heat and Humidity in the Piedmont Region of North Carolina, J. Appl. Met. Clim. 45, 674 – 685.
Dai, A., 2006: Recent climatology, variability, and trends in global surface humidity, J. Clim. 15, 3589-3606.
Dixon, P. G., 2004: The urban desert: A temporal study of humidity values in the Phoenix metropolitan area. J. AZ-NV Acad. Sci., 36(2), 127-138.
Gaffen, D. J., and R. J. Ross, 1999: Climatology and trends of U.S. surface humidity and temperature, J. Clim, 12, 811- 828. doi: 10.1175/1520-0442(1999)012.
GCCIUS, 2009: Global Climate Change Impacts in the United States, T.R. Karl, J. Melillo, T.C. Peterson, Cambridge University Press, 188 pp.
Hurrell, J. W., H. van Loon, and D. J. Shea, 1995: Meteorology of the Southern Hemisphere, NCAR Tech. Memo. NCAR/CAS/95-08, 77 pp.
Acknowledgments
The authors would like to thank J. Paul Dallavalle, P.G. Dixon, and P. Croft for their comments on this work. These helped to make the paper stronger. This work was partially supported by a COMET Partners grant, UCAR award number: S06-58398.
The Climatology of Missouri Region Dew Points and the Relationship to ENSO
Volume 36 Number 2 ~ December 2012 19
Neter, J., W. Wasserman, and G. A. Whitmore, 1988: Applied Statistics. 3rd ed., Allyn and Bacon Press, 1006 pp.
NOAA, 2002: Automated Surface Observing System (ASOS) Release Note Software Version – 2.6A Processor Upgrade/Rehost and Dew Point Temperature Replacement Sensor. [Available online at http://www.nws.noaa.gov/ops2/Surface/documents/relnoteprocup.pdf.]
O’Brien, J. J., T. S. Richards, and, A. C. Davis, 1996:, The effect of El Niño on U.S. landfalling hurricanes, Bull. Amer. Met. Soc. 77, 773-774.
Peterson, T. C., and M. O. Baringer, 2009: State of the climate in 2008, Bull. Amer. Met. Soc. 90, S1-S196.
Ratley C. W., A. R. Lupo, and M. A. Baxter, 2002: Determining the spring to summer transition in the Missouri Ozarks using synoptic scale atmospheric data, Trans. MO Acad Sci. 36, 69-76.
Schafer, K., and J. Stark, 2011: Central Iowa Dew Point Comparison-DEWPEX. [Available online at http://www.crh.noaa.gov/crh/?n=arp18-05.]
Smith, S. R., and J. J. O’Brien, 2001: Regional snowfall distributions associated with ENSO: Implications for seasonal forecasting, Bull. Amer. Met. Soc. 82, 1179-1191.
Smith, N. B., Guinan, P. E., M. D. Chesser, and A. R. Lupo, 2010: The long-term climatology of Mid-Mississippi Valley dew points and the implications for regional climate. 22nd Conference on Climate Variability and Change, 17-21 January, 2010, Atlanta, GA. [Available online at https://ams.confex.com/ams/90annual/techprogram/paper_164244.htm]
Steadman, R. G., 1984: A universal scale of apparent temperature, J. Clim. Appl. Met. 23, 1674-1687.
Stensrud, D. J., and N. Yussouf, 2003: Short-range ensemble predictions of 2-m temperature and dewpoint temperature over New England, Mon. Wea. Rev. 131, 2510-2522.
Wiedenmann, J. M., A. R. Lupo, I. I. Mokhov, E. A. Tikhonova, 2002: The climatology of blocking anticyclones for the Northern and Southern Hemisphere: Block intensity as a diagnostic. J. Climate 15, 3459-3474.
IPCC, Climate Change 2007: The Science of Basis, Contributions of Working Group I to the Fourth Assessment Report of the Intergovernmental Panel on Climate Change. S. Solomon, D. Qin, M. Manning, M. Marquis, K. Avery, M.M.B. Tignor, H.L. Miller, and Z. Chen, Cambridge University Press, Cambridge, UK. 996 pp.
Kalnay, E., and Coauthors, 1996: The NCEP/NCAR 40-year reanalysis project. Bull. Amer. Meteor. Soc., 77, 437-471.
Lupo, A. R., and G. Johnston, 2000: The interannual variability of Atlantic Ocean Basin hurricane occurrence and intensity, Nat. Wea. Dig. 24, 1-11.
Lupo, A. R., D. Albert, R. Hearst, P. S. Market, F. A. Akyuz, and C. L. Allmeyer, 2005: Interannual variability of snowfall events and snowfall-to-liquid water equivalents in South-west Missouri, Nat. Wea. Dig. 29, 13-24.
Lupo, A. R., E. P. Kelsey, D. K. Weitlich, I. I. Mokhov, F. A. Akyuz, P. E. Guinan, and J. E. Woolard, 2007: Interannual and interdecadal variability in the predominant Pacific Region SST anomaly patterns and their impact on a local climate, Atmosfera 20, 171-196.
Lupo, A. R., E. P. Kelsey, D. K. Weitlich, N. A. Davis, and P. S. Market, 2008: Using the monthly classification of global SST and 500 hPa height anomalies to predict temperature and precipitation regimes one to two seasons in advance for the mid-Mississippi region, Nat. Wea. Dig. 32, 11-33.
Mantua, N. J., S. R. Hare, Y. Zhang, J. M. Wallace, and R. C. Francis, 1997: A Pacific interdecadal climate oscillation with impacts on salmon production, Bull. Amer. Met. Soc. 78, 1069-1079.
Minobe, S., 1997: A 50-70 year climatic oscillation over the North Pacific and North America, Geophys. Res. Lett., 24, 683-686.
Mitchell, M. J., R. W. Arritt, and K. Labas, 1995: A climatology of the warm season Great Plains low-level jet using wind profiler observations, Wea.Forecasting., 10, 576-591.
Mokhov, I. I., D. V. Khvorostyanov, and A. V., Eliseev, 2004: Decadal and longer-term changes in ENSO characteristics, Int. J. Climatol. 24, 401-414.
Lupo, et al.
20 National Weather Digest
Wilks, D. S., 2006: Statistical Methods in the Atmospheric Science. 2nd ed., Academic Press, 627 pp.