the closing of the jobs gap - hamilton project€¦ · were lost in the united states during ......
TRANSCRIPT

1
The Hamilton Project • Brookings
The Closing of the Jobs Gap
A Decade of Recession and Recovery
By Diane Whitmore Schanzenbach, Ryan Nunn, Lauren Bauer, and Audrey Breitwieser *
ECONOMIC ANALYSIS
AUGUST 4, 2017
The Jobs Gap Has Closed
The Great Recession caused labor market devastation on a scale not seen for many decades. Millions of jobs
were lost in the United States during 2008 and 2009, leaving the labor market with a hard road to recovery.
Indeed, that recovery has required many years of job growth, and it was only in April 2014 that total
employment reached its pre-recession level.
However, this milestone did not mark a return to pre-recession labor market conditions. Because the U.S.
population is growing, simply reaching the previous number of jobs is not sufficient to return to pre-
recession employment rates. At the same time, more baby boomers have entered retirement, somewhat
offsetting the effects of population growth and reducing the number of jobs needed for a full economic
recovery.
In order to accurately track the progress of the labor market recovery, The Hamilton Project developed a
measure of labor market health—the “jobs gap”—that reflects changes in both the level and the
demographic composition of the U.S. population (more details regarding the jobs gap methodology are
provided in appendix A). Beginning in May of 2010, The Hamilton Project has calculated the number of
jobs needed to return to the national employment rate prior to the Great Recession, accounting for
population growth and aging.
Acknowledgments * We are grateful for valuable comments from Adam Looney, Kriston McIntosh, Jay Shambaugh, and Louise
Sheiner, as well as excellent research assistance from Patrick Liu, Karna Malaviya, Greg Nantz, and Rebecca
Portman. In addition, we thank the many individuals associated with The Hamilton Project who have
contributed to the development of the jobs gap project over the years.

2
The Hamilton Project • Brookings
With today’s employment report, we can report that the national jobs gap relative to November 2007 has closed
(see figure 1). This indicates that, by our calculations, nearly a full decade after the start of the recession,
employment has returned to its demographically adjusted pre-recession level. This does not mean that all harm to
the labor market resulting from the Great Recession has dissipated, nor that the economy is at full employment. It
does mean, though, that the economy has added enough jobs to make up for the losses during the Great Recession.
Because the population was growing while the labor market was shedding jobs, the trough of the jobs gap (more
than 10 million jobs needed to recover to pre-recession employment rates) exceeded the actual decline in number
of jobs (about 8.5 million). The average rate of recovery in the jobs gap after the trough of the Great Recession was
116 thousand jobs per month, and it took 89 months to close the gap.
To be sure, the closing of the jobs gap does not mean that the labor market scars of the Great Recession are entirely
healed. Indeed, while some economic markers indicate a tight labor market—a low unemployment rate and
relatively abundant job openings—others, like the depressed 25- to 54-year-old employment rate, an elevated share
of people working part-time for economic reasons, and restrained wage growth, are consistent with a weaker labor
market. The decline in the employment-to-population ratio for 25 to 54 year olds has been offset to some degree by
rising employment rates for those 55 and older, helping to close the jobs gap.1 Since November 2007, the overall
labor force participation rate has fallen from 66.0 percent to 62.9 percent. However, much of this drop was due to
demographic change, and a slight reduction in the unemployment rate over that period helped to mitigate the
impact on employment. Appendix A provides additional detail regarding the economic forces underlying
movement in the jobs gap.

3
The Hamilton Project • Brookings
In figure 2, we apply the jobs gap methodology to three other recent recessions: 2001, 1990, and 1981. Compared to
these recessions, the jobs gap during the Great Recession was much larger and took years longer to close. The
recessions of 1981 and 1990 involved smaller and briefer jobs gaps, with recovery to the demographically adjusted,
pre-recession employment rate after 40 and 48 months, respectively. The 2001 recession saw a more gradual decline
in jobs, and a slower recovery; the jobs gap from the 2001 recession did not close before the Great Recession started.
The fact that the labor market was not necessarily at full strength at the start of the Great Recession is one reason
the closing of the jobs gap does not necessarily signal an end to “slack” in the labor market: the under-used labor
that could be profitably employed.

4
The Hamilton Project • Brookings
An Uneven Recovery
The labor market recoveries depicted in figures 1 and 2 reflect the overall experience of the entire United States.
However, not all regions of the country or demographic groups experienced the same recovery—while some
groups have reached and substantially exceeded their pre-recession employment rates, others have lagged behind.2
Because the payroll employment data (from the Current Employment Statistics survey) do not include information
on demographic characteristics, we use individual-level Current Population Survey (CPS) data in these
calculations. These data are less current than the payroll data—we use individual-level data through May 2017—
and the growth in employment measured in the CPS is somewhat lower. Given these differences and the distinct
features of the CPS data, we will now implement the jobs gap concept as an “employment rate gap,” defined as the
difference between the demographically adjusted 2007 employment-to-population ratio and the actual
employment-to-population ratio at a given point in time.
The long-run impact of the Great Recession was particularly uneven across regions of the country, leaving some
states with larger 2017 employment rate gaps than others. Figure 3 shows the 2017 employment rate gap by state,
giving a sense of which places have prospered relative to their 2007 baseline and which have not. To account for

5
The Hamilton Project • Brookings
varying population levels and changes across states, we calculate the gap as the difference between the actual 2017
state employment rate and the demographically adjusted state employment rate. States shown in light green have
reached or exceeded the demographically adjusted employment rates that prevailed before the Great Recession,
while purple states continue to face employment rate gaps of varying sizes. States in the Northeast and Midwest
have seen particularly strong job growth, adjusting for demographic change; for example, Massachusetts has closed
its gap and added 1.1 percentage points. Some of the largest remaining gaps are observed in Western states, where
Wyoming has the largest employment rate gap of -4.3 percentage points. Importantly, these differences may reflect
differences in population growth and migration across the states.3
The employment rate gap recovery has been uneven in other respects: notably, women have outperformed men.
Two male-dominated occupation groups—production and construction—were particularly hard hit during the
Great Recession. Employment in these occupations remains low relative to other occupations, contributing to
weaker employment growth for men over the last ten years. In addition, the employment rate of men aged 25 to 54
had been falling for several decades prior to the Great Recession, driven by forces that are still not entirely
understood, but possibly contributing to the disparities between the employment trajectories of men and women.
Figure 4 shows the employment rate gap separately for men and women. The immediate employment loss from
the recession was somewhat less severe for women, with the gap reaching a trough of -2.9 percentage points in
2011. By contrast, the employment rate gap for men reached a low point of -5.5 percentage points in 2010. Men have
considerably more ground to make up than do women to regain their pre-recession employment rate: the gap for
men stands at -1.6 percentage points, while it has closed entirely for women. However, it is important to note that
men remain employed at a much higher rate than women, even with their relative decline over the past ten years:
65.7 percent of men and only 54.8 percent of women are employed.

6
The Hamilton Project • Brookings
The disparate labor market experiences of racial groups over the business cycle have recently received additional
deserved attention. In figure 5, we show that, while whites were less hard hit in the immediate aftermath of the
Great Recession than blacks and Hispanics, their recovery has been slower; whites are now in a worse position
relative to their pre-recession employment rates than are blacks and Hispanics. The employment rate gap for blacks
and Hispanics fell to a trough of -6.0 and -5.4 percentage points in 2011 before narrowing to 0.4 and -0.2 in 2017,
respectively. By contrast, the trough was smaller and occurred earlier for whites, at -3.4 percentage points in 2010,
and whites’ employment rate gap now stands at -0.6 percentage points. It is important to remember that each
group’s employment rate gap is measured relative to its pre-recession level. Blacks still face higher levels of
unemployment and lower levels of employment than Hispanics or whites.
In appendix B, we explore differences by race and gender in more depth, and find that the strong recovery among
Hispanics is driven by women, while Hispanic males still face a -1.9 percentage point employment rate gap.
Strikingly, the current gap for Hispanic women is 3.4 percentage points smaller than that of Hispanic men
(appendix figure 4).

7
The Hamilton Project • Brookings
Finally, we examine the employment rate gaps for people with differing levels of education. Figure 6 shows that
the employment rate gap has generally been largest for those with high school degrees or less, somewhat smaller
for those with only some college or an associate’s degree, and much smaller for people with bachelor’s degrees or
graduate degrees. At its trough, the employment rate gap for those with only a high school degree or less was -5.3
percentage points, as compared to -1.1 percentage points for those with graduate degrees. In fact, the employment
rate gap for people with a high school degree or less is worse today than the gap was for those with a bachelor’s
degree in 2010.
Conclusion
Ensuring that the gains from economic progress are broadly shared must be a primary goal of economic policy.
Since its inception, The Hamilton Project has worked to this end, maintaining a special focus on employment and
policies to promote both skills development and wage growth. From this perspective, the Great Recession was
particularly damaging insofar as it disproportionately harmed disadvantaged individuals and families. Now that—
by one important marker—American workers have returned to their pre-recession position, it is important for
policy makers to have a better understanding of how the labor market evolved during the recession and recovery.
8
The Hamilton Project • Brookings
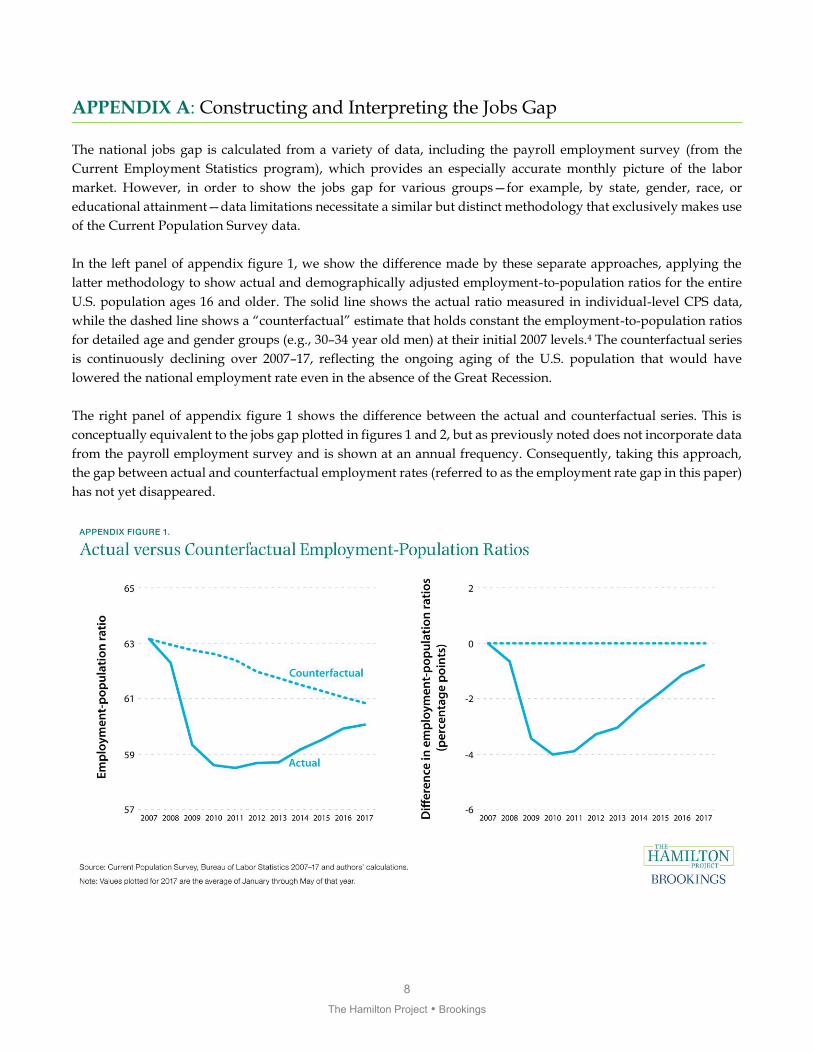
APPENDIX A: Constructing and Interpreting the Jobs Gap
The national jobs gap is calculated from a variety of data, including the payroll employment survey (from the
Current Employment Statistics program), which provides an especially accurate monthly picture of the labor
market. However, in order to show the jobs gap for various groups—for example, by state, gender, race, or
educational attainment—data limitations necessitate a similar but distinct methodology that exclusively makes use
of the Current Population Survey data.
In the left panel of appendix figure 1, we show the difference made by these separate approaches, applying the
latter methodology to show actual and demographically adjusted employment-to-population ratios for the entire
U.S. population ages 16 and older. The solid line shows the actual ratio measured in individual-level CPS data,
while the dashed line shows a “counterfactual” estimate that holds constant the employment-to-population ratios
for detailed age and gender groups (e.g., 30–34 year old men) at their initial 2007 levels.4 The counterfactual series
is continuously declining over 2007–17, reflecting the ongoing aging of the U.S. population that would have
lowered the national employment rate even in the absence of the Great Recession.
The right panel of appendix figure 1 shows the difference between the actual and counterfactual series. This is
conceptually equivalent to the jobs gap plotted in figures 1 and 2, but as previously noted does not incorporate data
from the payroll employment survey and is shown at an annual frequency. Consequently, taking this approach,
the gap between actual and counterfactual employment rates (referred to as the employment rate gap in this paper)
has not yet disappeared.

9
The Hamilton Project • Brookings
Aging and the labor market
The most important demographic change relevant to the measurement of the jobs gap is the aging of the U.S.
population. It is sometimes tempting to think of population aging as a long-run trend that has little impact on
shorter-run economic developments like the Great Recession and subsequent recovery. However, changes in the
age composition of the population and the labor force can occur surprisingly quickly. From 2007 through mid-2017,
population aging reduced the overall employment-to-population ratio by more than 2 percentage points.
Driving this reduction in employment are both an aging population and differing rates of employment by age.
These factors are depicted in appendix figures 2a and 2b. Appendix figure 2a shows how the population has
changed over the last ten years, with those 55 and older becoming relatively more numerous. Appendix figure 2b
provides the other part of the picture: employment rates are much higher for those aged 25 to 54 than for those who
are 55 or older, at 78.4 percent and 38.7 percent, respectively. Despite the increase over time in employment rates
for those 55 and older (not shown), older individuals remain less likely to be employed than their younger
counterparts, and population aging helped to depress the overall national employment rate over the last ten years.
10
The Hamilton Project • Brookings
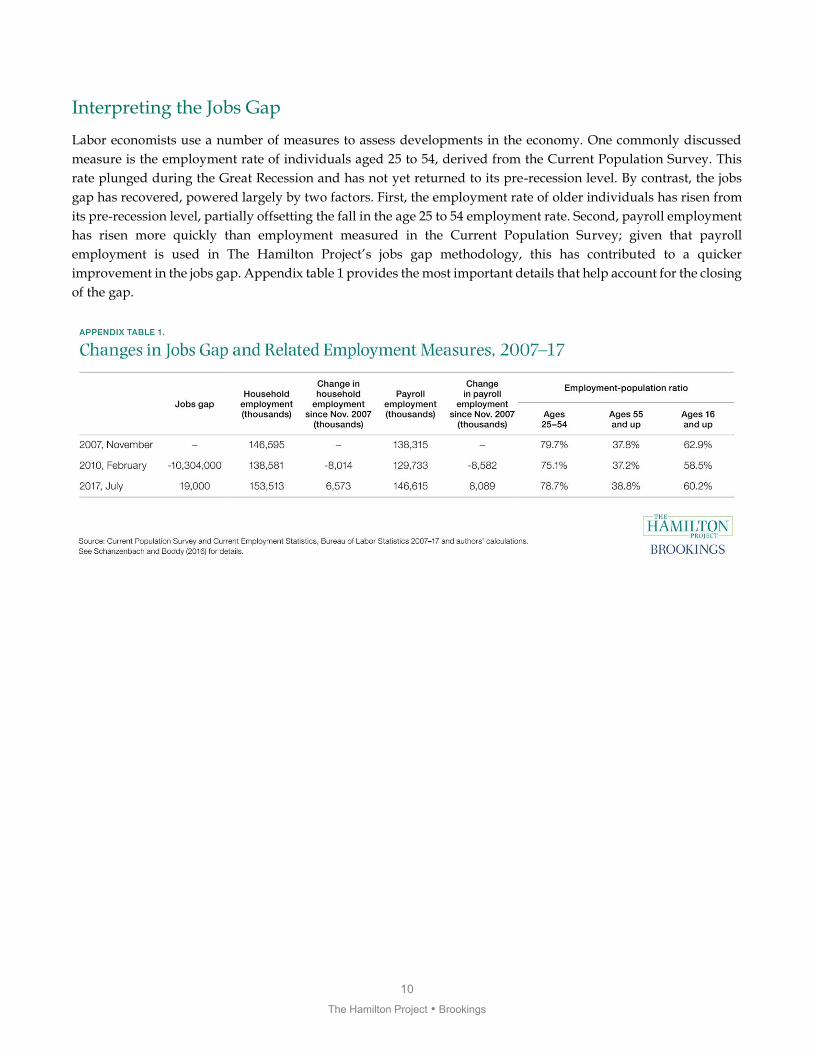
Interpreting the Jobs Gap
Labor economists use a number of measures to assess developments in the economy. One commonly discussed
measure is the employment rate of individuals aged 25 to 54, derived from the Current Population Survey. This
rate plunged during the Great Recession and has not yet returned to its pre-recession level. By contrast, the jobs
gap has recovered, powered largely by two factors. First, the employment rate of older individuals has risen from
its pre-recession level, partially offsetting the fall in the age 25 to 54 employment rate. Second, payroll employment
has risen more quickly than employment measured in the Current Population Survey; given that payroll
employment is used in The Hamilton Project’s jobs gap methodology, this has contributed to a quicker
improvement in the jobs gap. Appendix table 1 provides the most important details that help account for the closing
of the gap.
11
The Hamilton Project • Brookings
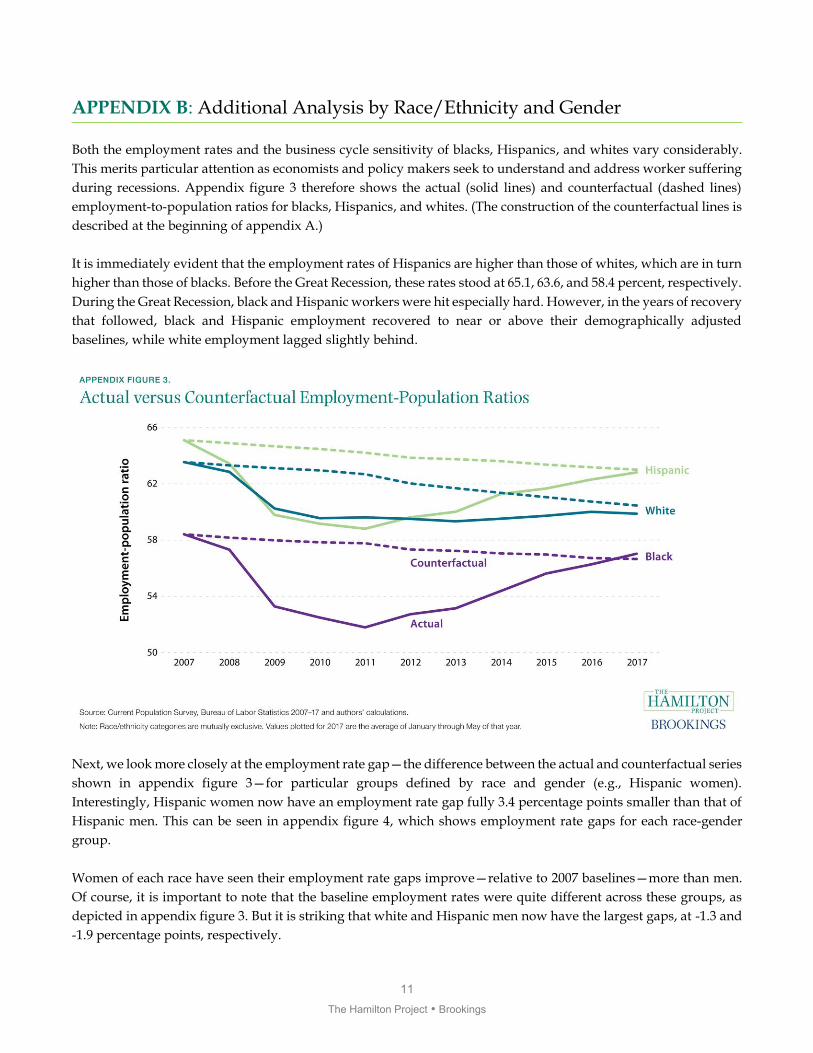
APPENDIX B: Additional Analysis by Race/Ethnicity and Gender
Both the employment rates and the business cycle sensitivity of blacks, Hispanics, and whites vary considerably.
This merits particular attention as economists and policy makers seek to understand and address worker suffering
during recessions. Appendix figure 3 therefore shows the actual (solid lines) and counterfactual (dashed lines)
employment-to-population ratios for blacks, Hispanics, and whites. (The construction of the counterfactual lines is
described at the beginning of appendix A.)
It is immediately evident that the employment rates of Hispanics are higher than those of whites, which are in turn
higher than those of blacks. Before the Great Recession, these rates stood at 65.1, 63.6, and 58.4 percent, respectively.
During the Great Recession, black and Hispanic workers were hit especially hard. However, in the years of recovery
that followed, black and Hispanic employment recovered to near or above their demographically adjusted
baselines, while white employment lagged slightly behind.
Next, we look more closely at the employment rate gap—the difference between the actual and counterfactual series
shown in appendix figure 3—for particular groups defined by race and gender (e.g., Hispanic women).
Interestingly, Hispanic women now have an employment rate gap fully 3.4 percentage points smaller than that of
Hispanic men. This can be seen in appendix figure 4, which shows employment rate gaps for each race-gender
group.
Women of each race have seen their employment rate gaps improve—relative to 2007 baselines—more than men.
Of course, it is important to note that the baseline employment rates were quite different across these groups, as
depicted in appendix figure 3. But it is striking that white and Hispanic men now have the largest gaps, at -1.3 and
-1.9 percentage points, respectively.

12
The Hamilton Project • Brookings
Endnotes
1. Note that the Hamilton Project’s jobs gap is calculated using the Bureau of Labor Statistics’ payroll survey. This
survey has shown stronger growth than the household survey, which is used to calculate employment-to-
population estimates. For additional discussion of The Hamilton Project jobs gap analysis, including details of
methodology and interpretation, please refer to Schanzenbach and Boddy (2016) and appendix A.
2. Importantly, though our analysis of states and demographic groups takes the same basic approach as our
national jobs gap calculation, the former differs in exclusively relying on the Current Population Survey.
Because employment as measured by this dataset has recovered more slowly than payroll employment,
recovery in the employment rate gap for state and demographic groups tends to be somewhat weaker. In
addition, we describe the results that follow recovery in employment rates in percentage points rather than
numbers of jobs. A final difference is that we present annual estimates for 2007–16. For 2017, we pool the
available five months of data; seasonality does not appear to be an important factor in these calculations.
3. The case of North Dakota illustrates the employment rate gap methodology. There is a well-known economic
boom in the state, which has had the largest percent increase in jobs (a gain of 78,392 jobs) since 2007. At the
same time, though, migration to the state has boosted the population—particularly among younger workers
with high levels of expected employment participation. The number of jobs created have not been enough to
offset the change in demographic characteristics, especially since the fracking boom has subsided over the last
few years.
4. We focus on adjustment for age and gender because these variables are determined prior to individuals’ labor
market decisions. Adjustments for other variables—like education—may yield different results, but would be
more difficult to interpret.

13
The Hamilton Project • Brookings
The Hamilton Project seeks to advance America’s promise of opportunity,
prosperity, and growth.
We believe that today’s increasingly competitive global economy demands public
policy ideas commensurate with the challenges of the 21st Century. The Project’s
economic strategy reflects a judgment that long-term prosperity is best achieved by
fostering economic growth and broad participation in that growth, by enhancing
individual economic security, and by embracing a role for effective government in
making needed public investments.
Our strategy calls for combining public investment, a secure social safety net, and fiscal
discipline. In that framework, the Project puts forward innovative proposals from
leading economic thinkers — based on credible evidence and experience, not ideology
or doctrine — to introduce new and effective policy options into the national debate.
The Project is named after Alexander Hamilton, the nation’s first Treasury Secretary,
who laid the foundation for the modern American economy. Hamilton stood for
sound fiscal policy, believed that broad-based opportunity for advancement would
drive American economic growth, and recognized that “prudent aids and
encouragements on the part of government” are necessary to enhance and guide
market forces. The guiding principles of the Project remain consistent with these
views.
WWW.HAMILTONPROJECT.ORG @HAMILTONPROJ