the coca-cola company - asq...•this is our products and packs. major brands in carbonated soft...
TRANSCRIPT

• Good Morning to All. Today here I am to give a brief note on our Process
Improvement Project and we share our Learning’s & Experience on Co2 yield
Improvement project by using a DMAIC methodology
• Next Slide
The Coca-Cola Company

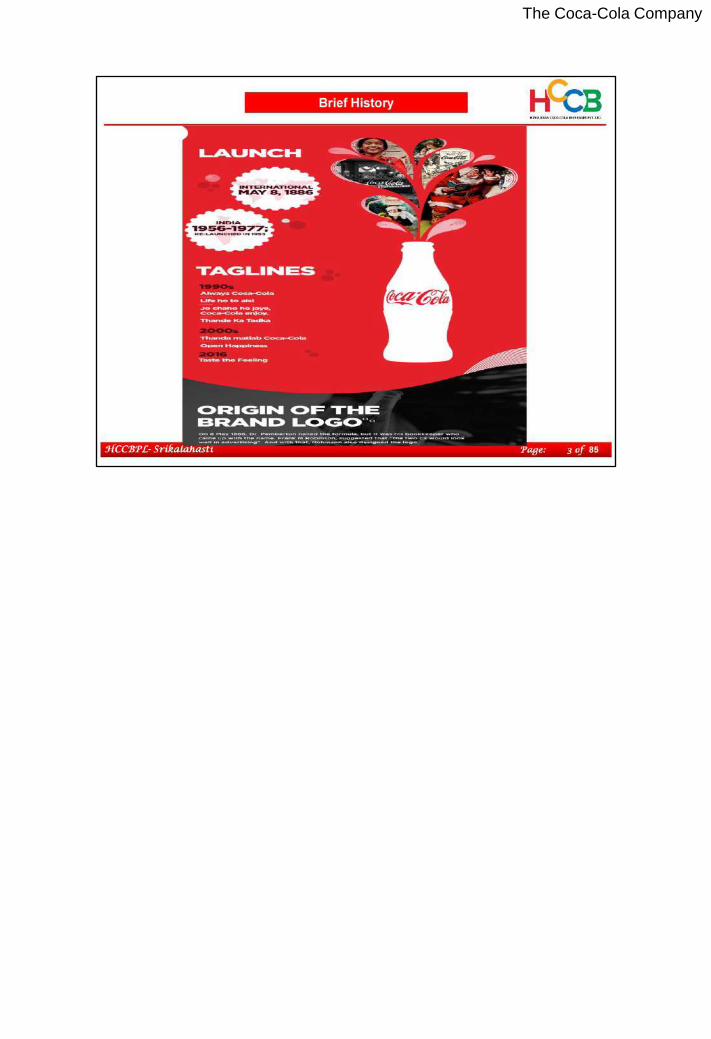
• Brief History about Coke : Coca-Cola was Formulated in 1886 by John F
Pemberton and we operate in more Countries than UN. Coke is Most Spoken
word After ok and most valued brand in the world
• Next Slide
The Coca-Cola Company
The Coca-Cola Company

The Coca-Cola Company

The Coca-Cola Company

The Coca-Cola Company

• This is our Products and Packs. Major Brands In Carbonated Soft Drinks are
Coke, Thumps up, Sprite, Limca, Fanta and Kinley. In Juices Maaza and Minute
Maid Products
• Next Slide
The Coca-Cola Company

• Company profile: We have 24 Bottling units in India, Out of Which 18 No’s is
Company Owned Bottling operations and 6 no's are Copackers. Entire India
Operations Divided in 3 Clusters i.e., East Cluster, West Cluster and South
Cluster. We Srikalahasthi Plant Come Under South Cluster. Total Employees is
8000 No’s. total our Business Volume is 500 Millions and Revenue is Rs. 9500
Crores
• Company Vision: To be the best Sales & Distribution Company for consumer
products in India connecting people and the products of their choice
• Company Mission: Enriching lives across the country by building a consumer -
driven, customer - focused, employee-friendly, profitable, sustainable and socially
responsible business in India
• Next Slide
The Coca-Cola Company

• Srikalahasthi Company Profile: we Have 3 Production lines I.e., Carbonated Soft
drink – Returnable Glass Bottle line 600 BPM(Bottles per Minute) , Carbonated
Soft drink – PET line 200BPM and Hot Fill Juice PET Line 200BPM. Our Plant
production Capacity is 1000 Bottles per Minute
• Next Slide
The Coca-Cola Company

• This is our Plant Mile stones - External Awards. We are Received JIPM
Excellence Award Category- A in the Year 2013 and received Golden award for
through Indian Manufacturing Excellence Association for Best Manufacturing
Practices
• Next Slide
The Coca-Cola Company

• This our Plant Mile Stones with in the HCCB. We Own 1st Prize on HCCB
Seasonal award-2019 and 7th HCCB National Kaizen Competition-2019
• Next Slide
The Coca-Cola Company

• Section: 1 Project Background & Purpose. In this Section we will discuss about
how HCCB does project Planning, project identification & Project Selection. Here
we will cover why this Project Selected along with Goals, Benefits & Success
Measures.
• Next Slide
The Coca-Cola Company

• This is our well established Process for Selection of projects. we will Identify all
the Improvement opportunities during cross functional Gemba Walk and Present
to Factory Manager on Weekly Departmental review time. Further this list is
presented to the Project Planning Committee, comprising of the Cluster Supply
Chain Vice President and Cluster Finance Head.
• Project Selection Committee is responsible for the rigorous project selection
process to ensure project’s alignment with strategic priorities and assigned to
respective members for action
• Next Slide
The Coca-Cola Company

• On Weekly departmental review with Factory Manager, Departmental
representative will present their area Identified Improvement Opportunities.
• Based on Inputs from all the functions, We select improvement projects with high
impact on strategic objectives and prioritized Based on impact to business &
Environment
• The first step is problem identification
• Second step is to identify key potential projects using proposals from all the
departments
• The third step is final selection of projects by using Project prioritization Matrix
based on key organizational strategies and objectives which is done by project
selection committee
• Next Slide
The Coca-Cola Company

• The Departmental Representative will provide data on each Identified project, and
the committee then evaluates these projects using project prioritization matrix.
Here we have shown examples on how the data is shared for project selection.
We will Present this Data to the project selection committee
• Next Slide
The Coca-Cola Company

• In this Slide We can see the Project Prioritization Matrix. Based on Data Provided
by Department head the Project Selection Committee evaluates how each project
accomplishes the criteria using project Prioritization matrix. Overall project Score
is arrived based on Impact on strategic priorities, financial impact, Impact on
Environment and Impact on Quality. This score defines in which category this
Project come under and what methodology would the project follow. We will give
Top Priority for which is having high impact on Quality and Environment
• Next Slide
The Coca-Cola Company

• Based on project prioritization Matrix, Co2 Yield Improvement Over all Score is
High.
• CO2 Waste is impacting us in 4 Ways i.e.,
• Environment: Co2 Emission. Plant Co2 Emission is 0.109 Kgs of Co2/Litre of
Beverages where as HCCB Target is 0.064 Kgs of Co2/Litre of Beverages
• Cost: Rs 2.97 Million Indian Rupees Loss in 2018 also Online Rejection of
production
• Product Quality: Low Gas Volume and Low Net Content
• Morale: High Rejection Stoppages
• Next Slide
The Coca-Cola Company

• Co2 is one of the Raw Material for our Product.
• Based On QSPECS Report, we are almost in the Bottom Plant with Co2 yield of
61.2% when Compared to all the HCCB plants
• Next Slide
The Coca-Cola Company

• Specific Project Goal is Improve CO2 Yield from 61.2 % to 86% (HCCB Best)
• Carbon Foot Print reduction
• Financial Benefit of Rs 2.5 Million Rupees
• Other Intangible Benefits
• Next Slide
The Coca-Cola Company

• The project aimed to improve CO2 yield from 61.2% to 86% where as Other
plants are having greater than 75% of Co2 yield. there is 43% Gap in Co2 yield
• Also reduce carbon foot print from 0.109 Kgs of Co2/ Litre of Beverages to 0.064
Kgs of Co2/ Litre of Beverages
• Next Slide
The Coca-Cola Company

• Section: 2 Project Frame work. In this Section we will cover Project Charter,
including:
1. A formal Project Statement
2. Type of Project
3. A Scope Statement
4. Assumptions and Expectations
5. Project Schedule
6. Resource Budget and
7. Risk Management concerns
• Next Slide
The Coca-Cola Company

• This Slide Shows the Project framework displays in a structured manner to
sharing all project related information to the project team. This framework explains
the type of the project , Scope of the project, timelines along with the assumptions
and associated risks Mitigation approach is also explained in this project
framework
• Next Slide
The Coca-Cola Company

• The project charter is required to register a project as a standard organizational
approach. This is applicable for all the projects selected by the project selection
committee. While defining the problem a detailed charter was prepared by the
team which clearly highlighted the goal of the project. Click 1 : To Improve Co2
yield from 61.2% to 86%
• This Project Charter explains the Project Team details, Problem statement,
Primary & Secondary Metric, Goal Statement Financial Benefit, Project scope,
Project mile Stones and Project Sign off Details
• Next Slide
The Coca-Cola Company

• This is Process Improvement type Project. Currently there is 2 types of Loss is
there in our process. i.e.,
1. Leakage Losses at Filler, Mixer and Lines
2. Process loss at Filler & mixer. There is 22% Co2 Loss at Filler Machine
• Next Slide
The Coca-Cola Company

• In line with the organization standard both in and out of scope items for the
projects were clearly defined by the Project team. This helped to enhance the
team to understand about the boundary lines of the project. Defining clear scope
for the project at the project charter stage is a standard process at HCCB
• Next Slide
The Coca-Cola Company

• As a part of comprehensive project planning exercise all possible assumptions
were discussed by the project team and documented to ensure the expectations
from the project are clear to project team members. These assumptions with
shared & agreed by all the stakeholders involved in the project & were the part of
planning process
• For example, expectation of Periodic project reviews with Champion & Sponsor
was shared to them & same agreed.
• we record what went well and what can be improved at the end of every project
and incorporate the learning from these projects in the Upcoming projects
• Next Slide
The Coca-Cola Company

• We have a standard DMAIC checklist which includes Project each Phase Start
and End Date along project plan and operations team ensure that teams complies
to it. we were asked by our Steering Committee to complete the project by the end
of End of the March. So that the project benefits could be reaped in Peak Season
• Project plan was part of the charter, any changes to the project plan would have
to be placed on a revised charter and is recorded in project tracker and needs to
be signed off by the original charter approvers
• Next Slide
The Coca-Cola Company

• No specific budget was required at this phase of the project, as the company
resources and infrastructure was utilized to conduct project related activities like
trainings, workshops, conference calls etc.
• We faced some resource constraints as cross functional team members had their
primary functional responsibilities but was successfully handled later by sharing
the common mission, vision & strategic relevance of the project with them
• Next Slide
The Coca-Cola Company

• We identified both stakeholder related and other project risks. Risks were
mitigated by using multiple solutions such as: Risk position for Production team
was identified to be moderately against as they quoted lack of time as a concern.
We addressed this by Holding meetings with stakeholders to discuss the benefits,
by showing them the big picture when project goals would be achieved, rework
would reduce, and cases would get issued faster
• Next Slide
The Coca-Cola Company

• Section: 3 Project Stakeholders & the Project team. In this section, we will cover
basic information about
1. Project stakeholders & how identified
2. Project Champion
3. Project team selection
4. Project Team Preparation
5. Project Team Routines
We will Cover here how the team was prepared to work together as a team & about
the team routines
• Next Slide
The Coca-Cola Company

• Once the project was selected, the project selection committee will identify the
Stakeholders along with their roles & responsibilities to understand the impact on
key stakeholders & then select Project Sponsor, Champion.
• Project stakeholder includes Supply Chain Management team, Steering
Committee, Core Execution Team, Process area team and Business unit team
• Stakeholders were further divided into "Influencer” and “Executor” to classify them
according to their level of influence or task to be executed
• Next Slide
The Coca-Cola Company

• Before starting the project, roles, expectations and time dedication for each team
member was agreed.
• understand the role of each key stakeholder including Sponsor and Champion
throughout the project. This was discussed during Project´s kick off meetings as
well
• For example, the Sponsor was expected to provide a strategic vision to the team,
Champion was expected to ensure business alignment and project teams role
was to actively participate in DMAIC methodology
• Fortnightly review with project team and monthly governance review with Sponsor
and Champion along with steering committee were some of the communication
routines that were established before the project started
• Next Slide
The Coca-Cola Company

• Once the methodology to be used in the project is agreed, System defines the
knowledge and skills required to optimize team membership and carry out the
project successfully.
• Firstly knowledge on technical and soft skills is identified.
• The team then used the Competency Evaluation Matrix to determine the current
level of knowledge and skills each role had.
• The red crosses in the Matrix highlights the gaps in knowledge and skills to be
addressed. Based on these, the team determined additional knowledge needed
before the project started.
• Next Slide
The Coca-Cola Company

• Here we can see the same analysis for Operational Excellence Manager and
stakeholders. We observed, there was need to train the project team on process
knowledge, basic innovation tools like Brainwriting and creative challenge to
generate break through ideas and Six Sigma green belt training for problem
solving tools
• For e.g. competency assessment stated that the Champion should know basic
innovation tools for idea generation & Operational Excellence manager should
have basic process knowledge to guide the team effectively
• Next Slide
The Coca-Cola Company

• Clarity of Goals and role, common understanding of the process and interpersonal
alignment are essential attributes for a team to work together. to assess where the
team members were in each of these areas for team bonding as well as clarifying
everybody’s roles and responsibilities considering the magnitude of the project
and the cross functional team involved
• Sponsor supported the team by conducting the kick off meeting
• Generative team building workshops helped us in bringing the cross functional
team together and helped in solving the interpersonal relations of the team
members which was low
• This is how official team preparation is done at HCCB for every project, ensuring
associates are working together effectively as project team
• Next Slide
The Coca-Cola Company

• Some of the Trainings Given to team as shown in this slide i.e.,
1. Co2 Leak Test Training
2. DMAIC Process
3. TPM Training Program
4. Filling & Carbonation Process Training Program Through OEM
Also done Team Building Exercise . After all this Training programs I Became WE
• Next Slide
The Coca-Cola Company

• Maintaining team routines and timely communications with stakeholders was
another deliverable which was expected from us as a team to ensure effective
teamwork. This ensured that Champion and Sponsor gets timely progress report
and periodic updates by using methods like governance reviews and team
huddles with their direct involvement
• Weekly review with project team and Business partners, fortnightly review with
Sponsor and Champion and monthly review with steering committee were some
of the routines that were established before the project started. Team routines are
reviewed by management committee to ensure effective project governance
• Next Slide
The Coca-Cola Company

• Section: 4 Project Overview. In this Section we will cover details of how the
project was run. This will include
1. Project Approach
2. Tools Used throughout Project
3. Tools output at different stages of Project
4. How team was prepared to use this tools
5. Dealing with project Risk
6. Encountering & Handling Resistance of a Risk
7. Stakeholder Involvement in project
• Next Slide
The Coca-Cola Company

• This project used a typical DMAIC process: Define, Measure, Analyze, Improve,
and Control. Most of the Control work will be discussed under Validation and
Maintaining the gains, so we will now go through the tools we used, why they
were selected and what we hoped to get from them, focusing on Define, Measure-
Analyze, and Control
• Next Slide
The Coca-Cola Company

• In this slide you will see the tools we used in each phase of the project and what
our purpose was in selecting those tools.
• In the next section of this presentation we will go through the tool output in detail
and show you how the data from the tools drive our project
• Next Slide
The Coca-Cola Company

• In this slide you will see the same tools listed in the above table. We have
replaced WHY the tools were used with a general understanding of the expected
outcomes.
• Let’s look at three examples from the last slide and this one.
1. High Level SIPOC: to Understand the Linkage between Cross functional Teams
2. Process Capability Study: to understand how stable our process is and Base line
Measurement for Improvement
3. Cause & Effect Matrix: to identify the High – Leverage root Cause which is
causing Low Co2 yield
• Next Slide
The Coca-Cola Company

• Once again, this is the identical tool list, only now we are showing which tools
were specifically trained by Operational Excellence Manager DMAIC Class. The
class was concluded with a written exam to demonstrate mastery prior to working
on the project. Team members were also trained on general data analysis and
quality tools.
• The next slide provides a little more detail on types of training used with some of
the specialized stakeholder groups
• Next Slide
The Coca-Cola Company

• To use these methods, Project team members were trained on Improve Phase
tools which is part of Six Sigma methodology,
• Apart from the regular Six Sigma training, team was also trained on additional
tools like Innovative thinking, Brain storming to come out with break through
solutions.
• Pre & Post test was conducted to evaluate the level of comprehension
• Next Slide
The Coca-Cola Company

• Risk position for Production team was identified to be moderately against as they
quoted lack of time as a concern. We addressed the identified resistances by:
Holding meetings with stakeholders to discuss the benefits, by showing them the
big picture when project goals would be achieved, rework would reduce
• Next Slide
The Coca-Cola Company

• In this slide we see how each key stakeholder got involved in the project, which
helped some with lessening resistance. How identified Resistance can be
Addressed to Successfully completing the Project
• Next Slide
The Coca-Cola Company

• Here are more details on stakeholder involvement and Communication Channel
to him. Stakeholders got involved by conducting frequent meetings within their
own departments to communicate the progress of project.
• For example, during the Root Cause detection production department should
provided records of gaps for root causes. Hence it was justifiable to have a SME
from this department
• Next Slide
The Coca-Cola Company

• Section: 5 Project Walk Through in this Section we will Cover
1. Project Methodology
2. Solution Validation
3. Solution Justification
4. Results
5. Maintaining the Gains
6. Project Communication
• Next Slide
The Coca-Cola Company

• We will now talk you through how we used primary tools to progress through the
Define phase of our project
• Next Slide
The Coca-Cola Company

• In Define Phase Setting the Desired Targets of our Project
1. Co2 yield Improvement from 61.2% to 86% (HCCB Best)
2. Co2 Loss Cost 0 Rupees
3. Carbon foot print Reduction from 0.109 Kgs of Co2/ Litre of Beverages to 0.064
Kgs of Co2/ Litre of Beverages
• Next Slide
The Coca-Cola Company

• CO2 Waste is impacting us in 4 Ways i.e.,
• Environment: Co2 Emission. Plant Co2 Emission is 0.109 Kgs of Co2/Litre of
Beverages where as HCCB Target is 0.064 Kgs of Co2/Litre of Beverages
• Cost: Rs 2.97 Million Indian Rupees Loss in 2018 also Online Rejection of
production
• Product Quality: Low Gas Volume and Low Net Content
• Morale: High Rejection Stoppages
• Next Slide
The Coca-Cola Company

• This is our Co2 Macro Level Process map. We have 2 Nos of Horizontal Co2
storage Tanks is there in plant and each one Capacity is 20 Tons. Mainly Co2 is
used in 4 Area
1. Quality lab for Testing Purpose
2. Water Treatment Plant for Coagulation system
3. RGB Line for Carbonation and Filling process
4. PET Line for Carbonation and Filling Process
• Next Slide
The Coca-Cola Company

• Co2 Process flow at PET Filling Hall. Mainly Co2 Used in Carbonation and filler
Process
• Next Slide
The Coca-Cola Company

• In this Slide we are explaining our Problem. Currently we have Mechanical float
System in our filler machine to Control the Bowl Level. Due to Frequent struck of
mechanical float either filler bowl get overfilled or Low filled. Which Causes Low
Filled Bottles, high Filled bottles, Now Gas Volume which leads to filler Stoppage
and inhouse quality rejections
• Next Slide
The Coca-Cola Company

• We started with SIPOC to clearly define project’s scope. SIPOC allowed us to
identify and confirm key stakeholders and team members from the various
departments
• Next Slide
The Coca-Cola Company

• We will now talk you through how we used primary tools to progress through the
Measure phase of our project
• Next Slide
The Coca-Cola Company

• Unit of Measurement of Co2 is %. Where as Numerator Value Consist of No of
Bottles Ok Produced Multiplies with Gas Volume & Density divided by Co2 used
from Receiving tank. Sample Size is 30 days Data and Type of Data is
Continuous.
• Next Slide
The Coca-Cola Company

• In this Slide we have Shown list of Measuring Instruments used for Data
Collection, Their Physical Condition and Calibration Status.
• Next Slide
The Coca-Cola Company

• We have used Mini-tab to create the Process capability report of our Co2 yield to
check our Process Stability
• Current Mean yield is 58% where as Target is 86%
• Next Slide
The Coca-Cola Company

• In this Slide we have Shown Pareto Chart for different types of Losses. i.e.,
Leakage Losses and Process Losses
• Leakage Losses can be eliminated through Zero Leak Approach through TPM
Methodology by implementing Daily routines, through shop floor involvement and
routine inspection and Tagging
• Process Losses cab be Minimized through Zero Wastage Process Optimization –
Six Sigma & Innovation by using Statistical Analysis skills, technical Skills and
Involvement of Cross functional Team
• Next Slide
The Coca-Cola Company

• In this Slide we have Shown al the Potential X’s which is Causing low Co2 yield
and Collected all the relevant data.
• In this 16 Potential X’s, X2, X3 and X15 are Discrete Variables and X1, X4-X14,
X16 are Continuous Variables.
• Next Slide
The Coca-Cola Company

• We used Boxplots to measure Flavor Wise variation and Pack wise Variation of
Co2 yield. When Boxplots overlap, there is no statistical difference and yield
variation in flavor because of pact size impact
• Low Co2 yield in lower Pack size (as no of Snifting will be more for same volume
of beverage bottled)
• Next Slide
The Coca-Cola Company

• In this Slide we are explaining about validation of Potential Causes i.e., Snifting
Pressure, Bowl Pressure, Pressurization, Paramix Pressure and Temperature at
PHE
• We have analysed the data through Multi –regression output of the data analysis
is follows
• All VIF <10 Means all the Inputs are Independent.
• P value for all the data is >0.05. No Significance in Running condition
• Change in input level for each parameter to check the impact of all these inputs
and Experiment for level Change impact
• we have analysed the SLE & Co2 yield data by using fitted line plot. It clearly
shows that SLE has a significant Impact on Co2 yield
• Next Slide
The Coca-Cola Company

• In this Slide we are explaining about Full factorial DOE to understand
Combination effect ( Inputs 1, 2, 3 ). This 3 inputs causing More Impact on Co2
yeild
• Next Slide
The Coca-Cola Company

• We will now talk you through how we used primary tools to progress through the
Analyze phase of our project
• Next Slide
The Coca-Cola Company
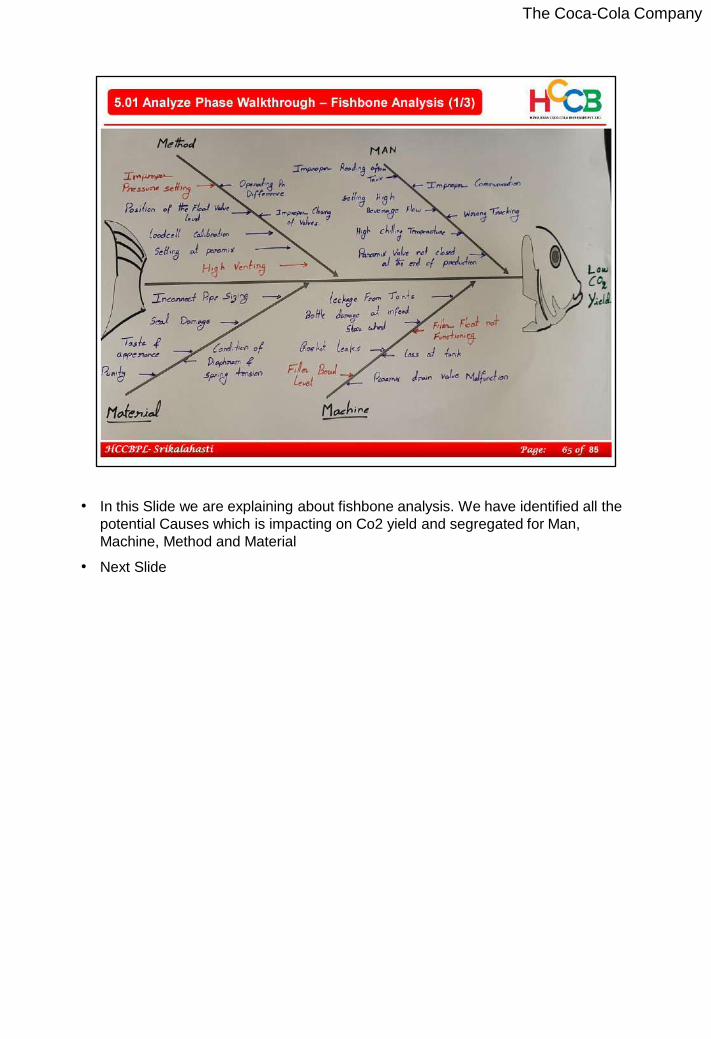
• In this Slide we are explaining about fishbone analysis. We have identified all the
potential Causes which is impacting on Co2 yield and segregated for Man,
Machine, Method and Material
• Next Slide
The Coca-Cola Company

• Based on fishbone analysis, we have prioritized all the Causes which is Having
Higher – leverage. 3 Causes which is having high Potential for causing low Co2
yield i.e.,
• Click 1:
• Filler bowl Level
• Paramix Pressure setting
• Filler Counter Pressure Setting
• Next Slide
The Coca-Cola Company
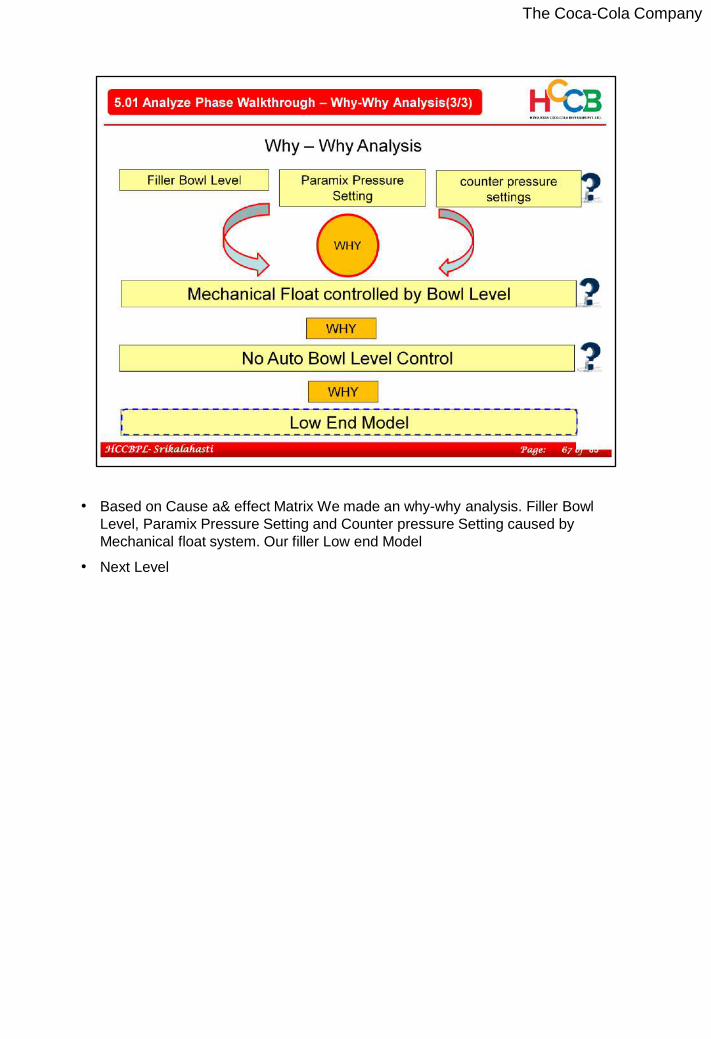
• Based on Cause a& effect Matrix We made an why-why analysis. Filler Bowl
Level, Paramix Pressure Setting and Counter pressure Setting caused by
Mechanical float system. Our filler Low end Model
• Next Level
The Coca-Cola Company

• We will now talk you through how we used primary tools to progress through the
Improve phase of our project
• Next Slide
The Coca-Cola Company

• In this Slide, Pictures shows that person is doing Leak test with soap solution and
performing the Standard Monthly Co2 Check list. We have identified leaks in pipe
lines, Carbonation and Filler area and Mitigating the Same. Bu doing this Leak
test Co2 yield was improved from 61.2 % to 67% only
• Next Slide
The Coca-Cola Company

• In this Slide we have shown few Pictures
• Picture 1: Leak at PET Line DRD Valve Base. Changed the DRD Valve base
• Picture 2: Filler Bowl Main Inlet pipe hole. Replaced the Joint
• Picture 3: Counter Pressure Setting Correction in RGB Filler
• Picture 4: Leak Arrested at RGB Paramix Regulator
• Next Slide
The Coca-Cola Company

• In this Slide we are explaining about the Solution Validation. How project team will
validate the Solution by using the Validation tools
• Solution 1: Arrangement of Level Switch with rotatory Slipring Control
• Solution 2: Sterile air System in place of Co2 for Counter Pressure
• Solution 3: Automatic Bowl level Control in Place of mechanical float System
• Next Slide
The Coca-Cola Company

• After pilot Trail success, KHS has shared their Offer for Upgradation of
Mechanical float system with Automatic Bowl Level sensor along with HMI.
• Next Slide
The Coca-Cola Company

• In this Slide we are explaining about how we have Justified the Solution
• Click 1: Idea-1 is Arrangement of Level Switch with rotatory Slipring Control, due
to high investment and difficult to Implement we have not Chosen
• Click 2: Idea-2 is a well established system in our Coke System is Sterile air
System in place of Co2 for Counter Pressure, due to high investment and high
maintenance cost we have not chosen this Project
• Click 3: Idea-3 Arrangement of Automatic Bowl level Control in Place of
Mechanical float system, Due to less Implement, Maintenance free, easy to
implement & replicate we have chosen this project
• Next Slide
The Coca-Cola Company

• In this Slide, Picture shows Cross Sectional View of the Filler Machine Bowl with
Capacitance type Level probes and same Approved by KHS Design Engineer
during Pilot Trail
• The Capacitance level probes (5) are provided on the top of the Filler Bowl. The
Signal from level probes (4 to 20mA) is fed to the Controller. The Controller
Opens or Closes the Beverage-incoming valve (2) as per the Set Point fixed from
the operating panel. Actual bowl level is displayed on the operating panel in
percentage
• The Co2 Regulator (4) is provided to adjust the counter pressure . Pressure signal
(4 to 20mA) is fed to the controller by pressure transmitter (1). The Solenoids for
the slow venting (7) & fast vending (6) are operated by the controller as per the
Set points fixed from the operational panel.
We have done Pilot Trail in KHS facilitation centre.
Next Slide
The Coca-Cola Company
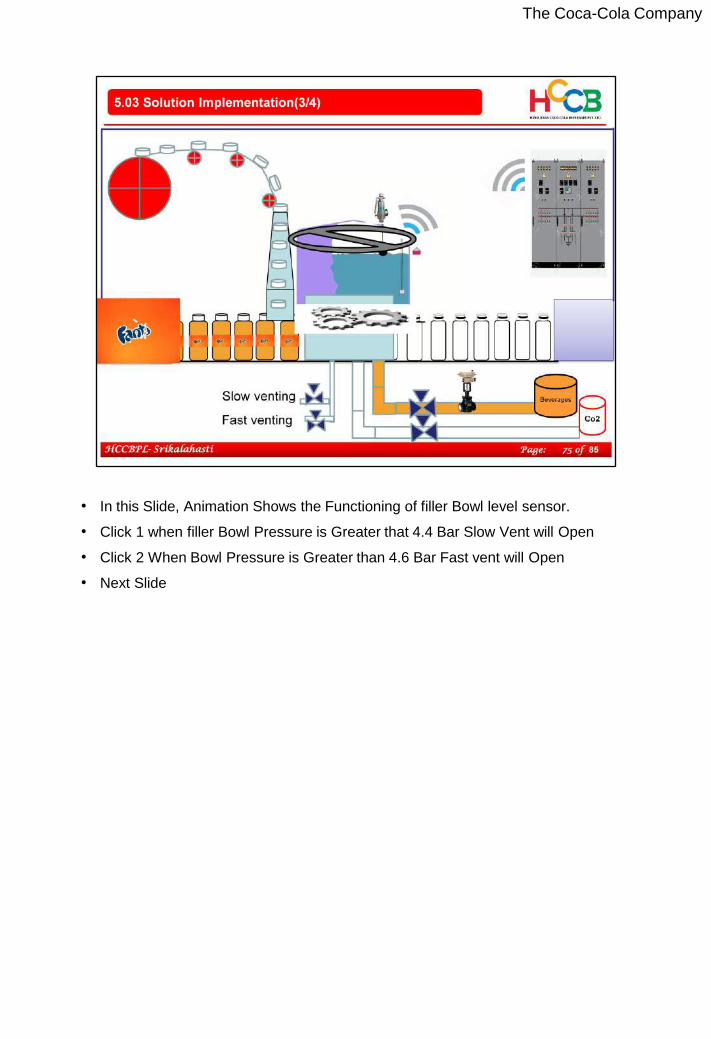
• In this Slide, Animation Shows the Functioning of filler Bowl level sensor.
• Click 1 when filler Bowl Pressure is Greater that 4.4 Bar Slow Vent will Open
• Click 2 When Bowl Pressure is Greater than 4.6 Bar Fast vent will Open
• Next Slide
The Coca-Cola Company

• In this Slide,
• Picture 1 Shows settings in Filler HMI for Bowl level, Product Shutoff Operation,
Slow Vent and Fast Vent Pressure’
• Picture 2 Shows level Sensor location on the top of the filler machine
• Picture 3 shows signal Transmitter location in filler Machine
• Picture 4 Shows Actual Value of Filler Bowl Level in % and Co2 Pressure in Bar
The Coca-Cola Company

• Results:
1. Co2 yield Improved from 61.2% to 87.1%. There is a 42% Improvement in Co2
yield (1st Bar Chart)
2. This is the Month on Month Co2 yield trend chart. After Project our Co2 yield is
Greater than 84%. We have Achieved 93.5% in the Month of Apr’19 Highest Co2
yield in HCCB History
3. Co2 Emission Reduced from 0.109 Kgs of Co2/ Litre of Beverages to 0.041 Kgs
of Co2/Lite of Beverages. There ia 41% Reduction in Carbon Emission. This is
the Best in Clase in HCCB History
4. Due to Co2 yield improvement we got an a Financial Benefit of Rs. 2.84 Million
Rupees and Saved 183 Tons of CO2
Next Slide
The Coca-Cola Company

• This is our Process Capability index Chart for Carbonation & Net Content. Earlier
our Upper Specification limit is Lower that the Target. Now Our Lower & Upper
Specification Limits is Above the Target. So Our Process is Stable
• Next Slide
The Coca-Cola Company

• Intangible benefits: Earlier we have one Man-day per Shift for fulls Inspection at
filler Outlet. After this Project we have removed this Man-days. There is an 26%
Saving in Overall line Man-days per year
• Next Slide
The Coca-Cola Company

• In QSPECS Competitive Analysis, Now we are in 2nd Position and In 2018 we are
almost Bottom Plant.
• Intangible Benefits are: Work Environment Become Clean, Easy to Accept
Smaller SKU’s
• Learning of OE Tools
• High Motivation within team Members
The Coca-Cola Company

• Everyone aware of trees can absorb Carbon di-oxide and Release Oxygen. But a
matured tree (age of 35 to 45 years tree) can only absorb 15kgs of Co2 in one
Calendar year. By doing this Project we have saved 183 tons of Co2. Need
12,198 trees to absorb this Co2 in one Calendar year.
• Next Slide
The Coca-Cola Company

• This is our Monthly HCCB Sustainability Report. Here you can clearly see Where
Chittoor plant Stands when Compared to Last Year (YTD Oct’2018 vs YTD
Oct’2019)
• Next Slide
The Coca-Cola Company

• Overall Saving of this Project is
• Co2 Saving is 1,82,969 Kgs
• Cost Saving due to yield Improvement is Rs. 2.84 Millions Rupees
• No of Man-days Reduced is – 817 Man-days
• Carbon Foot Print Reduction from 0.109 Kgs of Co2/Litre of Beverages to 0.041
Kgs of Co2/Litre of Beverages
• No of Trees Saved due to this 12,198 Tress
• Overall Cost Saving due to project is 3.12 Million Rupees
• Next Slide
The Coca-Cola Company

• We will now talk you through how we used primary tools to progress through the
Control phase of our project
• Next Slide
The Coca-Cola Company

• As a part on Control Plan, we have Same included in our Daily CLTI Checklist to
ensure on daily basis
• (Click 1)Made One Point Lesson for Filler Bowl Level Sensor to Communicate all
the Filler Team.
• (Click 2)This is our Necessary Routines to Sustain the Project outcome. In that
one hourly Monitoring and recording of Co2 Consumption, Daily leak test in Filler
and Carbonation Section and Weekly Once in Pipeline Section
• Next Slide
The Coca-Cola Company

• In this Slide we are explaining about replication of this project in entire HCCB
plants. After successfully completing the project, we have shared our learning and
experience to all HCCB Plants. So that they also started implementing the same
in their plants. This Project can be replicated in both Slow & High Speed Lines
also same can be replicated in other Carbonated Manufacturing units.
• Investment per line is around 5.6 Lakhs. Estimated Annualized cost saving is 2.5
Million per line and overall annual saving opportunity at national level is 55 Million
Rupees
• Shared this project details to Coca-Cola Global Supply Chain website for
replication in other Plants
• Next Slide
The Coca-Cola Company

• In the Month of May’19, we have Celebrated our Project Success on the
Occasion of Saving of 100 Tons of CO2 along with Our Cluster Supply chain Vice
President and Cluster Finance Head. On this Occasion we have done Plantation
in out Plant also
• Next Slide
The Coca-Cola Company

• During Senior Leadership visit, we have Rewards and Recognised to team those
who are actively participated in Co2 yield Improvement Project
• Learning from this Project:
• High Self Confidence of team
• Collaboration among Team Work
• Operator Morale Improved
Next Slide
The Coca-Cola Company

• Respected Jury members, on behalf of the project team, and HCCB Srikalahasthi
Plant we would like to thank you and the members in the audience. The biggest
benefit was the team learning and positive impact that each team member felt
during and after the project journey. Thank you once again
• End of the presentation
The Coca-Cola Company