the community eligibility provision (cep) presented by the mde office of child nutrition (ocn) &...
TRANSCRIPT

The Community Eligibility Provision (CEP)
Presented by the MDE Office of Child Nutrition (OCN)
& Office of Federal Programs (OFP)

Office of Child Nutrition
Scott Clements, Director

3
CEP History
• Healthy, Hunger-Free Kids Act of 2010
• Provides an alternative to household applications for free and reduced price meals
• Offers all students free meals in high poverty LEAs and schools

4
• School meal programs determine eligibility through:– Household income applications– Participation in assistance program (categorical
eligibility)• Through a case number on an application, such as
Supplemental Nutrition Assistance Program (SNAP)• Directly certified though matching participant lists with
enrollment lists
• CEP determines eligibility by:– Eliminating household applications– Based on the percentage of directly certified
students
Standard Procedures vs. CEP

5
• Increases access to school meals for children in high poverty areas
• Eliminates household applications and administrative burden
• Reduces chance of overt identification• Compares to other special provisions: no
base year
Benefits of CEP

6
• Phased in over a period of three years in a limited number of States
• LEAs and schools in eleven States are currently participating:– District of Columbia, Illinois, Kentucky,
Michigan, New York, Ohio, West Virginia, Florida, Georgia, Maryland, and Massachusetts
• Available to all eligible schools July 1, 2014
Implementation

7
Requirements for Participation
• Minimum percentage (≥ 40%) of identified students in the school year prior to implementing CEP
• Serve free lunches and breakfasts to all students for 4 years
• May not collect household applications for free and reduced price meals

8
Election and Eligibility Criteria
• LEAs may elect the Provision for:– all district schools– a group of schools or– an individual school
• Eligible school or group of schools must have an identified student percentage of at least 40% by April 1st of the school year prior to implementing CEP

9
Election and Eligibility Criteria
• LEAs are required to submit application by June 30 to begin CEP in the SY beginning July 1
• Participation is an LEA level decision but requires concurrence from the State Agency (MDE Office of Child Nutrition)
• Residential child care institutions (RCCIs) may not participate in CEP

10
State Approval Process
• LEA must obtain OCN approval to participate
• OCN must review documentation submitted by the LEA to ensure the LEA/school:– Meets the minimum identified student
percentage– Participates in both the NSLP and SBP– Is administratively capable

11
General Procedures
• LEAs and schools may opt in or opt out each year (June 30th)
• A new identified student percentage may be established each year of the four year cycle for use in the following year
12
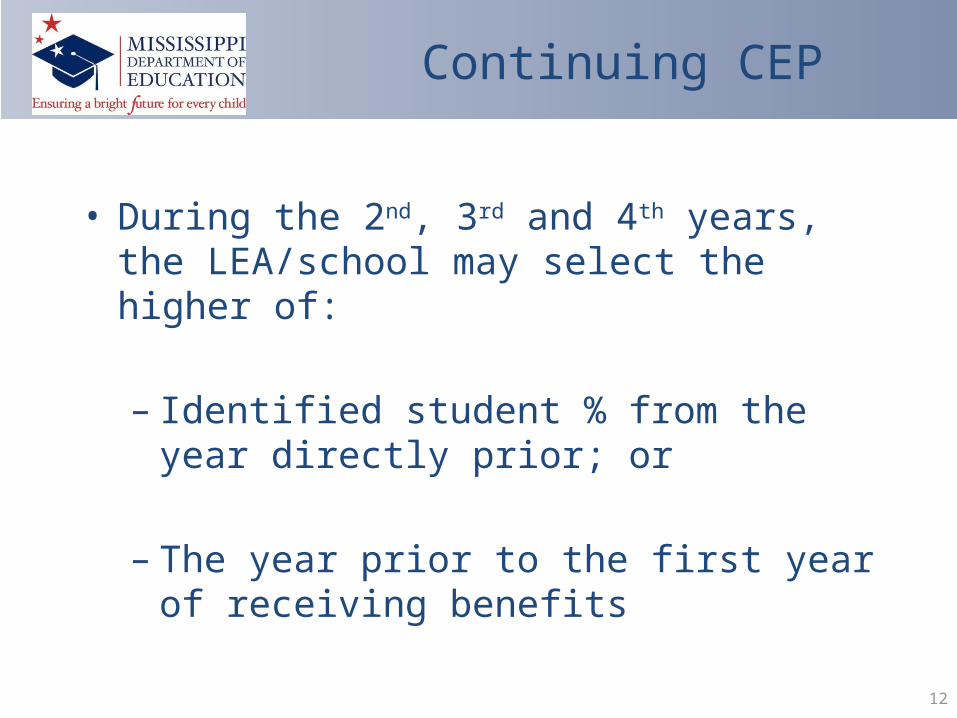
Continuing CEP
• During the 2nd, 3rd and 4th years, the LEA/school may select the higher of:
– Identified student % from the year directly prior; or
– The year prior to the first year of receiving
benefits

13
Continuing CEP
• LEAs/schools in year 4 with an identified student percentage <40% but ≥ 30% are permitted to elect for an additional year (a grace year)
• LEAs/schools that do not meet the threshold must return to normal procedures the following SY

14
Notification
• No later than April 15 of each SY,
– LEAs must submit to the State agency a list of schools
– State Agency must notify LEAs about their CEP district wide eligibility status and provide participation guidance

15
LEA Responsibility
• By April 15th of each year, LEAs must supply the State agency with a list of schools:– With an identified student percentage of at
least 40%– With an identified student percentage greater
than 30% but less than 40%

16
Identified Students, SNAP
School eligibility is based on the number of students who meet the “identified” definition
• Directly certified for free meals on the basis of their participation in the Supplemental Nutrition Assistance Program (SNAP) and the extension of benefits to students within the same household.

17
• Encouraged to update direct certification numbers annually to capture more current information.
• Non-CEP schools are required to conduct direct certification with SNAP files at least three times a year.
• Data are generally available through Statewide direct certification systems and for calculating State direct certification with SNAP performance measures.
Direct Certification Data
18
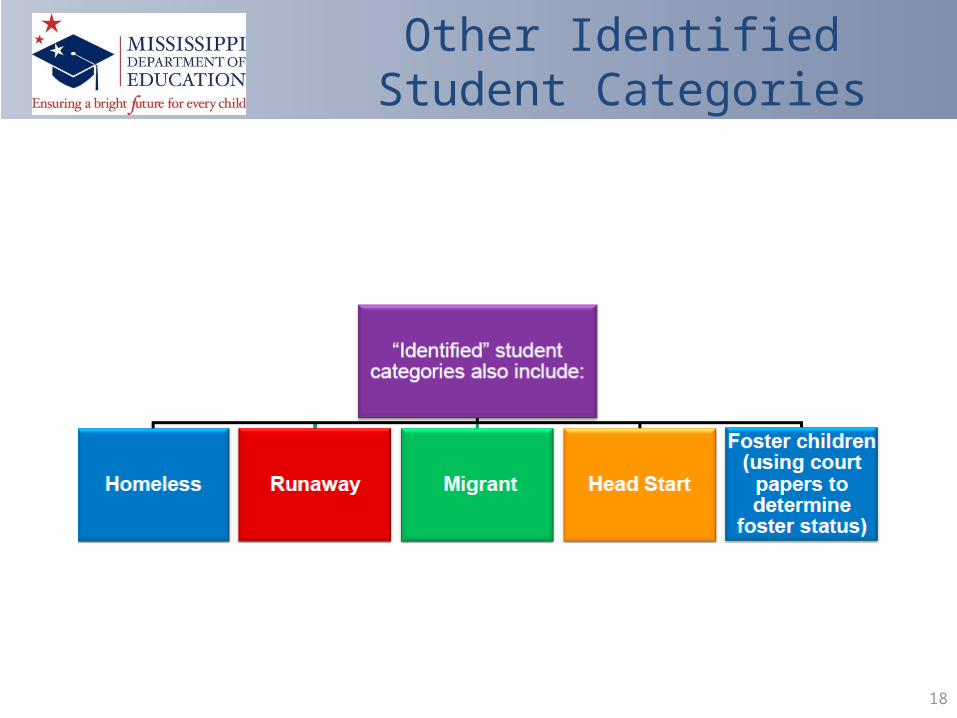
Other Identified Student Categories

19
Identified Student Percentage
# of Identified Students as of April 1 x 100
Total NSLP Enrollment as of April 1
The percent of Identified Students is then multiplied by the USDA determined factor of 1.6 for
SY 2014-2015

20
Applying the Multiplier
• School A has 600 students with access to the NSLP/SBP programs as of April 1
• 300 are in the “Identified Student” group
• Identified Student percentage of 50%
• 50% x 1.6 = 80% Free Reimbursement Rate, 20% Paid Reimbursement Rate

21
Meal Claiming Percentages
• Identified student percentage multiplied by a factor of 1.6 equals the % of total meals served reimbursed at the Federal free rate
• The remaining % of total meals is reimbursed at the Federal paid rate
• Any meal costs in excess of the total Federal reimbursement must be covered through non-Federal sources

22
Meal Claiming Percentages Examples
• 40% X 1.6 = 64% Free, 36% Paid
• 60% X 1.6 = 96% Free, 4 % Paid
• 62.5% X 1.6 = 100% Free
• Free Rate $3.01 vs Paid Rate $0.36

Office of Federal Programs
Marcus E. Cheeks, Bureau Director

24
• Within-District allocations
• Within-State allocations
• Equitable services to eligible private school students
• Accountability
Connections Between Title I and CEP
25
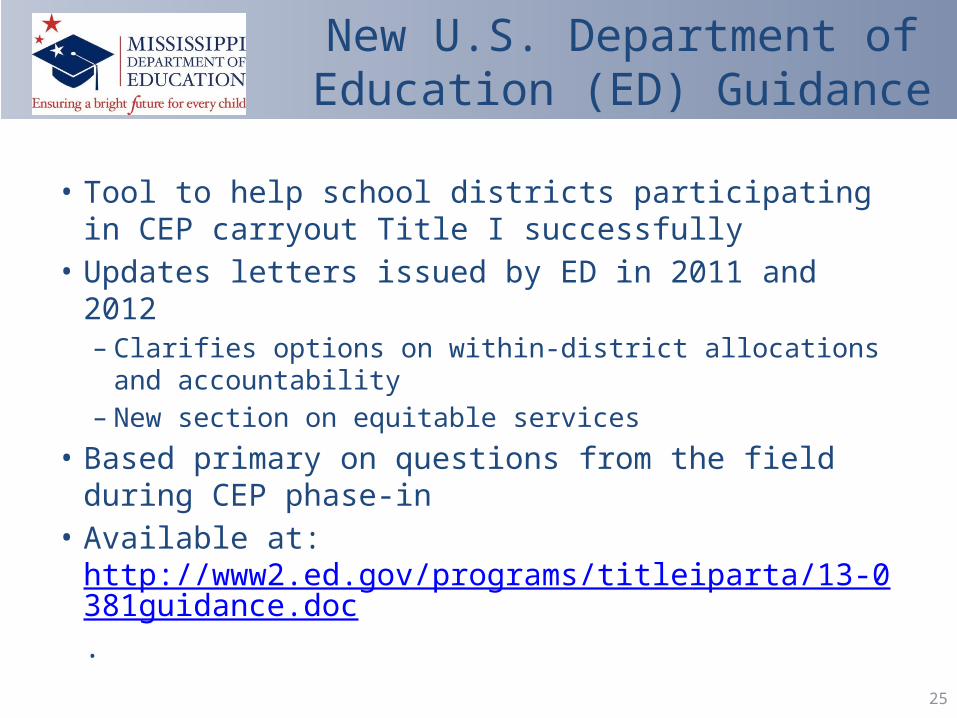
• Tool to help school districts participating in CEP carryout Title I successfully
• Updates letters issued by ED in 2011 and 2012– Clarifies options on within-district allocations and
accountability– New section on equitable services
• Based primary on questions from the field during CEP phase-in
• Available at: http://www2.ed.gov/programs/titleiparta/13-0381guidance.doc.
New U.S. Department of Education (ED) Guidance
26
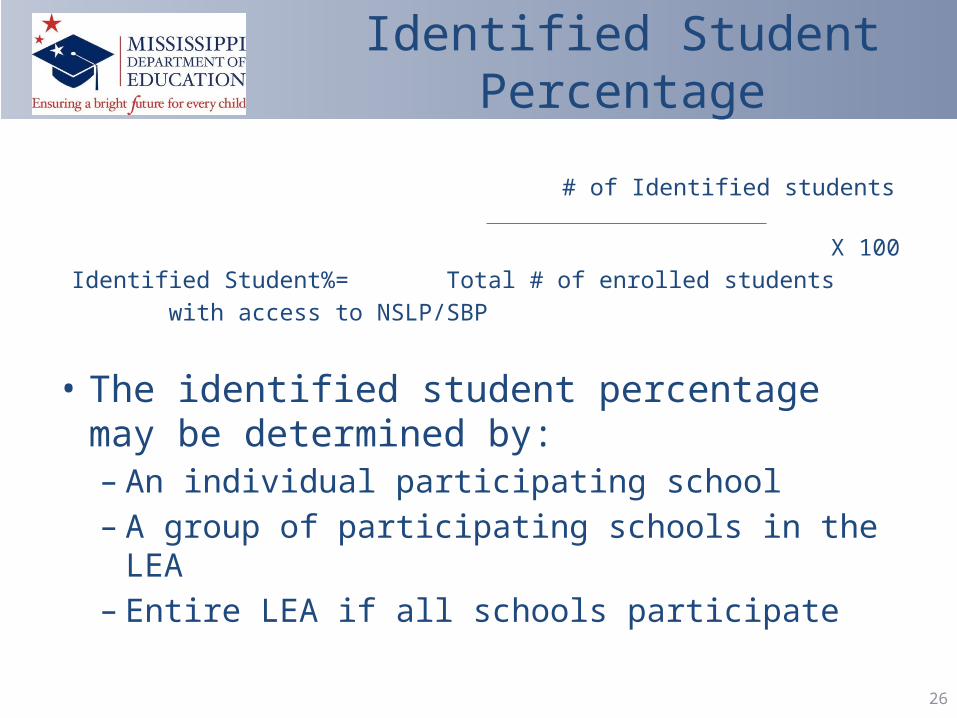
# of Identified students
X 100
Identified Student%= Total # of enrolled students
with access to NSLP/SBP
• The identified student percentage may be determined by:– An individual participating school– A group of participating schools in the LEA– Entire LEA if all schools participate
Identified Student Percentage

27
• LEAs intending to elect CEP for some or all schools must:– Submit to the State agency (Office of Child
Nutrition) documentation by June 30th of the year prior to starting CEP
– Ensure documentation demonstrates school or LEA meets the identified students percentage threshold as of April 1st of the prior school year
Procedures-Documentation
28
Within-District Allocations

29
• Title I ranking and serving procedures require school-level poverty data.
• Choices of school-level poverty measures include school lunch data as an option.
• CEP data are part of school lunch data.
• ED CEP guidance on within-district allocations applies when a school district has a CEP school and uses school lunch data to rank and serve schools.
Within-District Allocations

30
SCENARIOS WHERE SCHOOL DISTRICT HAS:• CEP and non-CEP schools (Q18 in guidance)
• All CEP schools (Q19 in guidance)
• Grouped schools for CEP eligibility and reimbursement purposes (Q21 in guidance)
Within-District Allocations

31
APPROACHES FOR CEP AND NON-CEP SCHOOLS (Q18)• Using Multiplier for CEP schools
– For CEP schools multiply the number of students identified by direct certification in a school by the 1.6 multiplier and divide by the enrollment in the school.
– For non-CEP schools use the direct certification plus household application count.
Within-District Allocations
Enrollment CEP Identified students
NSLP Count Percent Economically Disadvantaged
600 350 560 (350x1.6) 93% (560/600)

32
APPROACHES FOR CEP AND NON-CEP SCHOOLS (Q18)• Direct Certification: Rank all schools (CEP
and non-CEP) solely on the basis of the percentage of students directly certified through SNAP (or another direct certification measure available annually for all schools).
Within-District Allocations
Enrollment Direct Certification (e.g. SNAP)
Percent Economically Disadvantaged
750 500 67% (500/750)

33
ALL CEP SCHOOLS (Q19)• An LEA may have all CEP schools.
• If so, the LEA may rank its schools by the percentage of directly certified students in each school, even though the multiplier is used to determine the USDA reimbursement amount.
Within-District Allocations

34
GROUPED SCHOOLS FOR CEP (Q21)• An LEA may group schools to determine
CEP eligibility and reimbursement.
• An LEA with an enrollment of at least 1,000 students must rank schools individually to determine Title I eligibility and allocations.
Within-District Allocations

35
CIRCUMSTANCE THAT MAY OCCUR:• Multiple schools with 100 percent poverty rate
(Q20 in guidance)
• More schools above school district-established cutoff for serving (Q22 in guidance)
• Timing of data for CEP and non-CEP schools (Q24 in guidance)
Within-District Allocations

36
MULTIPLE SCHOOLS AT 100 PERCENT POVERTY (Q20)• Application of 1.6 multiplier may result in
more than one school with a 100 percent poverty rate.
• Among those schools, an LEA may allocate a greater per-pupil amount to the school with a higher direct certification percentage.
Within-District Allocations

37
CEP SCHOOLS ABOVE SCHOOL DISTRICT CUTOFF (Q22)• Application of 1.6 multiplier may result in more
schools above LEA-established cutoff for allocating Title I funds.
• LEA options include:– Raising cutoff– Using another permitted poverty measure or
composite of permitted measures
Within-District Allocations

38
TIMING OF CEP AND NON-CEP DATA (Q24)• LEA may collect household applications from non-CEP
schools at a different time than it identifies students in CEP schools (April 1).
• LEA options include:– Use data from the same school year.– Access direct certification data for non-CEP school on April
1 to use with household applications.– For Title I only, access direct certification data for CEP
schools at the same time as accessing this information and collecting household applications for non-CEP schools.
Within-District Allocations

39
EQUITABLE SERVICES TO ELIGIBLE PRIVATE SCHOOL STUDENTS

40
• In determining funding for Title I equitable services LEAs should continue to follow the current non-regulatory guidance titled Title I Services to Eligible Private School Children.
• Following consultation with private school officials, an LEA must identify the method it will use to determine the number of private school children from low income families who reside in participating public school attendance areas.
Equitable Services

41
METHODS FOR DETERMINING NUMBER OF PRIVATE SCHOOL CHILDREN FROM LOW-INCOME FAMILIES
1. Same poverty measure used by LEA for public schools students (e.g., school lunch data);
2. Comparable poverty data from a survey, extrapolating if complete data are unavailable;
3. Comparable poverty data from a different source;
4. Proportionality; or
5. Equated measure.
The method selected determines if CEP data are relevant.
Equitable Services

42
• CEP data are most relevant where an LEA uses school lunch data to allocate Title I funds for public schools and such data also are available for private school students.
• Title I funds for equitable services are generated on the basis of low income private school students who reside in a Title I public school attendance area.
• If a participating private school elects CEP, this does not necessarily mean that every private school student generates funds for equitable services.
Equitable Services

43
• ED’s CEP guidance includes three scenarios describing how an LEA determines the amount of funds generated for equitable services if the LEA uses school lunch data for within-district allocations and there are public and/or private Community Eligibility schools. (Q29 in guidance)
1. LEA has no CEP public schools and serves students in a CEP private school. (Q29, Scenario 1)
2. LEA has CEP public schools and serves students in a CEP private school. (Q29, Scenario 2)
3. LEA has CEP public schools and serves students in a non-CEP private school. (Q29, Scenario 3)
Equitable Services

44
CEP PRIVATE SCHOOLS-GENERAL PRINCIPLES• If a participating private school is a CEP school, the
LEA multiplies the number of directly certified private school students who reside in a participating Title I public school attendance by the 1.6 multiplier to derive the number of low income students in each attendance area.
• This calculation must be done separately for each Title I public school attendance area in which the private school’s students reside.
Equitable Services

45
CEP PRIVATE SCHOOLS EXAMPLE
Equitable Services
Public School Attendance Area
Number of Private School Students by Attendance Area
Number of Identified Students by Attendance Area
Derived number of Low-Income Students
A 100 80 100(80 x 1.6=128)¹
B 30 10 16(10 x 1.6=16)
C² 15 5 8(5 x 1.6=8)
¹The derived number of low-income private school students cannot exceed the total number of private school students who reside in the attendance area.
² For purposes of this example, the public school in this attendance area is not a Title I school. Under these circumstances, the students would not generate funding for Title I equitable services.
46
• An LEA need only take into account CEP data for a private school if the private school is a CEP school.
• To determine the number of low-income students in a non-CEP private school that reside in a participating public school attendance areas, an LEA would use one of the methods described in Q B-4 of the Title I Equitable Services Guidance.
Equitable Services

47
CEP AND PROPORTIONALITY• After consultation with private schools, an LEA
may choose to use proportionality to calculate the amount generated for equitable services.
• If a CEP public school’s poverty percentage for within-district allocations is 100 percent, every student in a private school that resides in that attendance area will generate funds for equitable services.
Equitable Services

48
Questions/Contact Info
Office of Child Nutrition601.576.5000Stephanie [email protected]
Office of Federal Programs 601.359.3499Delicia [email protected]

49
• Office of Career and Technical Education (601) 359-3461
• Office of School Financial Services (601) 359-3294
• Office of Special Education
(601) 359-3498
• Office of Management Information Systems (601) 359-3487
Additional Contact Information