the competitiveness impact of a uk carbon price: what do...
TRANSCRIPT

The competitiveness impact of a UK carbon price: what do the data say?
David Grover, Ganga Shreedhar and Dimitri
Zenghelis
Policy paper
January 2016
ESRC Centre for Climate Change Economics and
Policy
Grantham Research Institute on Climate Change and
the Environment

The Centre for Climate Change Economics and Policy (CCCEP) was established in 2008 to advance public and private action on climate change through rigorous, innovative research. The Centre is hosted jointly by the University of Leeds and the London School of Economics and Political Science. It is funded by the UK Economic and Social Research Council. More information about the ESRC Centre for Climate Change Economics and Policy can be found at: http://www.cccep.ac.uk The Grantham Research Institute on Climate Change and the Environment was established in 2008 at the London School of Economics and Political Science. The Institute brings together international expertise on economics, as well as finance, geography, the environment, international development and political economy to establish a world-leading centre for policy-relevant research, teaching and training in climate change and the environment. It is funded by the Grantham Foundation for the Protection of the Environment, which also funds the Grantham Institute for Climate Change at Imperial College London. More information about the Grantham Research Institute can be found at: http://www.lse.ac.uk/grantham/ This policy paper is intended to inform decision-makers in the public, private and third sectors. It has been reviewed by at least two internal referees before publication. The views expressed in this paper represent those of the author(s) and do not necessarily represent those of the host institutions or funders.

3
Table of contents 1. Introduction ...................................................................................................................... 6
2. Distribution of costs and implications for cost competitiveness ................................ 10
2.1. Which industries rely most heavily on fossil fuels? .................................................. 11
2.2. The impact of a hypothetical carbon price ................................................................ 17
2.3. Input-Output methodology ........................................................................................ 18
2.4. Input-Output findings ................................................................................................ 20
2.5. Carbon price impact in the context of long-run oil price changes ............................. 24
3. Carbon mitigation policies and industrial location ..................................................... 26
4. Comparison to study using 2003 data .......................................................................... 30
5. Imported emissions ........................................................................................................ 31
6. Key findings and policy recommendations .................................................................. 32
7. References ....................................................................................................................... 35
Appendix A: Minor explanations for differences between 2011 and 2003 estimates ....... 40
Appendix B: Derivation of carbon price multiplier ............................................................ 41
Appendix C: Key statistics for all UK industries, ranked by carbon intensity ................ 42
Appendix D: Example of Input-Output data structure and content ................................. 48
Figures and tables Figure 1: Share of primary energy inputs by industry (per cent) ............................................. 13 Figure 2: Share of primary and secondary energy inputs by industry (per cent) ..................... 14 Figure 3: Product price increase due to carbon price, by industry (per cent) .......................... 20 Figure 4: Carbon price and oil price change impact on whole economy costs ...................... 26 Figure 5: Industry trade openness versus carbon price-induced cost increase ......................... 28
Table 1: Fuel price increase due to carbon price (2011) .......................................................... 19 Table 2: Impact of carbon price shock on overall production costs and consumer prices ....... 20 Table 3: Carbon price impact, expressed as equivalent oil price increase* ............................. 25 Table 4: Estimated carbon price impact: 2003 versus 2011 ..................................................... 30 Table 5: Industries’ intermediate consumption, 2011 (the ‘Combined Use’ or input-output matrix) ...................................................................................................................................... 49

4
Executive summary It is often argued that if the United Kingdom (UK) cuts its greenhouse gas emissions faster than its main trading partners then the competitiveness of UK industry will suffer as a result of high energy input costs. For this reason, firms will relocate to countries where climate change policies are less stringent. Many studies have estimated the impact of the costs of climate policies on particular sectors. However, less is known about the extent to which these sectors pass on policy costs through their value chain and, ultimately, to consumers. This analysis uses the Input-Output tables from the UK National Accounts for 2011 to simulate the full multiplied impact of a uniform £20 per tonne carbon price on fuels and production costs across all 106 industries that comprise the UK economy, as well as whole economy production costs and final consumer prices. The carbon price is imposed on top of any carbon cost that was already present in 2011. Full cost pass-through is assumed along the value chain. A £20 per tonne carbon price is a similar rate to that applied to electricity generators by the UK carbon price floor (currently frozen at £18 per tonne). The results of this study therefore provide an indication of the potential impact of extending the carbon price floor across all fuels. It shows that 94 industries would see their input costs increase by less than one per cent of gross output. Four industries would see their costs increase by more than five per cent. They account for close to five per cent of GDP and are thus a substantial part of UK output. However, most of that output is non-tradable (e.g. electricity and gas) and therefore not subject to international competition. Only a small number of industries, accounting for around two per cent of GDP, are likely to face production cost increases of more than two per cent, which put them under pressure of competition from abroad. These include refineries, coal, iron, metals, some chemicals and cement. However, carbon policies will provide incentives to increase energy efficiency and resource productivity which could afford UK producers a competitive advantage in the long term, in a world where fossil fuel prices could rise and carbon reduction policies are likely to become more widespread and ambitious. The impact on final UK consumer prices, assuming full cost pass-through, is estimated at 0.9 per cent. The results of this study are not affected by the price of fossil fuels in the base year In an Input-Output analysis, increasing the carbon price will have a linear impact on consumer prices. Therefore, if a far more ambitious carbon price of £73 per tonne - consistent with the DECC shadow carbon price in 2030 - were to be applied today, the cost impact would rise proportionately, rendering more industries vulnerable to competitive pressure and relocation. Electricity costs would rise by 43 per cent and tradable sectors such as steel and cement would, all else equal, see costs rise by 13 per cent and 9 per cent of gross output respectively. A rise of this order could potentially eliminate profit margins and whole-economy prices would rise by approximately 3 per cent. Such effects would likely have a significant impact on the location decisions of tradable carbon-intensive sectors and on UK productivity. Moreover, this analysis does not include emissions from non-heat related processes which vary from firm to firm and are very difficult to assess at the level of

5
aggregation used here. Though relatively unimportant at the whole economy level, some vulnerable sectors may face additional carbon costs as a result of such emissions. Nevertheless, the cost estimates presented here constitute upper bounds. Firstly, the revenues raised from carbon taxes or emissions permit auctions are not in fact lost to the economy and can be recycled back into affected sectors, or into reducing distortionary taxes elsewhere in the economy. They reflect one side of a transfer rather than an underlying resource cost (as would be the case if the cost of extracting fossil fuels rose). Moreover, these estimates are static and do not allow for any behavioural change in terms of input switching, consumption switching or technological and process innovation. In the real world, industries and consumers would undertake such actions to limit costs; indeed that would be the objective of the carbon pricing policy. The higher and more certain the carbon price, the more likely these substitution opportunities are to reduce costs to exposed sectors as they implement efficiency measures, but also the more likely to lead to the relocation of production. Therefore, while carbon pricing forms a key part of an efficient framework to reduce greenhouse gas emissions in the UK, as the price of carbon rises the government should continue develop policies to reduce competitiveness risks for vulnerable sectors. They could, for instance, consider developing a trade adjustment policy for carbon pricing similar to the Trade Adjustment Assistance program in the United States (US), which offers assistance to the workers, firms, farmers and communities that are most affected by trade-related structural change in key industries, through worker retraining and relocation assistance. Japan also provides a good example of actively managing structural change in industries that are in decline. From 1987, it provided long-term support to ease the decline of what it called ‘structurally depressed’ industries, which included textiles and ship-building. This support reallocated resources both within and outside the depressed industries, provided financial assistance for firms to adjust and mitigated negative impacts on the labour force. The correct policy response is not to resist this change but to identify vulnerable sectors and buffer labour market participants against its sharpest effects. Countries and firms that resist enduring change and innovation may not be acting in their long-term interests.

6
1. Introduction A number of academic and policy studies, as well as trade associations and politicians1 in the
United Kingdom (UK), have argued that if the UK moves faster than its main trading partners
to implement ambitious cuts in greenhouse emissions, some UK production activities could
relocate2 to other countries, reducing economic output and causing job losses in some
industries. Competitiveness3 concerns have been raised about the UK carbon price floor
(Ares, 2013) and the UK Carbon Reduction Commitment (Grubb & Neuhoff, 2012) for
example, as these are unilateral policies which affect the energy cost borne by UK firms only.
An extension of this argument is that if the UK applies climate change policies that are more
ambitious than its major trading partners then the effectiveness of these policies at reducing
emissions is undermined as the emissions simply relocate elsewhere (often referred to as
carbon leakage), making no difference to the overall stock of emissions in the atmosphere.
There are many theoretical and empirical studies that have sought to determine the level at
which carbon pricing policies are likely to cause carbon leakage (See Bassi and Zenghelis,
2014). This paper uses official data to identify the competitiveness impact of a uniform £20
per tonne carbon price on UK firms (effectively a carbon tax). It analyses the effect of the tax
on each business sector (based on UK Standard Industrial Classification codes) and their
value chain by applying a simple analytical procedure to the latest National Accounts data for
the UK.
1 For example the position on climate policy and energy prices of EEF, The manufacturers’ organisation (EEF, 2013) and Chancellor George Osborne’s statement in his 2011 speech to the Conservative Party that the UK should cut its carbon emission no faster than its EU trading partners so as not to put the UK ‘out of business’ (Osborne, 2011). 2 The term ‘relocation’, sometimes also referred to as ‘carbon leakage’ is used broadly to capture any behavioural response to the application of a UK policy which may prompt emissions generating activity to decline in the UK and increase outside the UK border. It may take the form of plant closing in one location and opening in another, or simply incremental investment taking place in one location when, in a counterfactual world without the policy application, it would have taken place elsewhere. In the short run, it may not require changes in investment at all. ‘Relocation’ may simply be the product of altered utilisation of existing plant, where capacity is more intensively utilised in locations where costs are lower. 3 ‘Competitiveness’ at the national, rather than the individual firm or sector, level means ‘relative national economic performance’. UK competitiveness depends on many factors including strong market institutions, deep capacity for innovation, good infrastructure, and stable governance and regulation (Audretsch, et al., 2010) (Porter, 1998). Another key factor is the cost of inputs including energy in the UK relative to other countries, and insofar as climate policy is concerned, the cost of GHG emissions that is effectively embodied in fossil fuels.

7
This analysis is based on Input-Output tables which identify the transaction linkages between
all the sectors in the UK economy and demand categories for final output (such as domestic
demand in the form of consumption or investment and foreign demand in the form of net
exports). The tables show sales of products and primary inputs to production sectors (which
are listed in Appendix C and cover activities as diverse as shipbuilding to catering, mining to
computer programming) and ultimately to final demand. Final demand categories are split
between purchases by households, government, capital formation (i.e. investment), stocks,
and exports of outputs produced by each sector in the economy. Intermediate consumption
shows the flows of spending between production sectors on intermediate inputs, for example
the inputs of steel into car production or construction. These do not count as final output (such
as cars or offices) as they constitute inputs into another sector’s production process.
The Input-Output framework allows us to estimate input cost increases for different industries
that would result from implementing a uniform carbon price and combines these with a
measure of how internationally traded each industry actually is (i.e. its ‘trade openness’). The
ideal measure of vulnerability to changing prices is the extent to which they have a real
impact on exports and imports. As this is not directly observable, instead an evaluation of the
vulnerability is made on the basis of ‘trade openness’. This informs us which industries are
most likely to relocate as a result of a carbon price. Input-Output analysis is structural and
static and therefore gives a ‘top-end’ estimate of the impact of a carbon price on
competitiveness. In practice, the behavioural response of firms would mitigate the magnitude
of the competitiveness impact considerably through input substitution, production process
changes, and technology adoption. This would generate resource costs to businesses (and the
economy), for example as they invest in carbon saving technologies, but these costs would be
lower than the payment of either a carbon tax or the purchase of emissions permits. The latter
are, for the most part4, not real resource or whole-economy costs but instead generate a rent to
the public sector. Because these revenues are available for recycling back to the economy,
governments can offset the costs of a carbon taxes by introducing tax reductions in other areas
(e.g. labour and capital) and, by doing so, further offset the whole-economy impact.
It is important to be clear what Input-Otput analysis does and does not do. It does trace the
potential cost impacts of a hypothetical carbon price of £20 per tonne of carbon being
4 Only the distortionary impact of changes in consumer and producer surplus would constitute a true resource cost.

8
introduced uniformly across all 106 SIC sectors in proportion to the degree of direct and
indirect carbon in each sector’s supply chain. But there is no behavioural analysis of industry
responses in terms of changes in inputs, outputs, technologies and location of firms. The
paper does not attempt to define the level at which the carbon price would push a sector to
relocate. We merely note that globally tradable carbon-intensive sectors like steel are likely to
be impacted more than less competitive domestic sectors like electricity.
There is no cut-off as to what carbon price is tolerable and what rate is not, for each sector,
and no attempt is made to identify this. But the analysis does highlight the fact that
the impacts are linear; doubling the price rate imparts a doubling of the cost impact for all
sectors and the economy as a whole. Readers are then invited to apply their own prices and
use the results presented to assess the impacts on particular sectors for various prices.
The policy environment has of course changed significantly since 2011 (for example with the
introduction of the carbon price floor) but, unless the structure of the economy has changed,
the absolute impact of carbon price will not change from year to year (for example because of
changes in the price of fossil fuels). This is because the cost impact of carbon pricing is a
function of the carbon intensity of the fossil fuels, so provided the structure of the economy
has not changed, the impact of fossil fuel pricing will remain unchanged irrespective of
changes in fossil fuel prices. The Input-Output tables are merely the latest assessment of the
structure of the economy that we have.
Our main finding is to re-affirm that the negative impact of further carbon pricing beyond
what already applied in 2011 would be minimal for the great majority of the 106 industries
that make up the UK economy. To illustrate this, we apply a £20 per tonne carbon price
uniformly across the economy. Because the coefficients of the Input-Output matrix are fixed
(that is, each sectors’ input of goods and services from another sectors is taken as given and
fixed), the Input-Output impacts of applied cost changes are linear. Users are encouraged to
scale-up and scale-down the results, to reflect the impact of alternate prices.
Out of these 106 industries, 94 would see their input costs increase by less than one per cent.
These 94 industries accounted for 96 per cent of whole economy Gross Value Added in 2011.
Of the remainder, the biggest part is accounted for by electricity and gas distribution, which is
not heavily traded internationally allowing for significant cost pass-through to consumers.

9
Four such industries: the manufacture of coke and refined petroleum products; electric power
generation, transmission and distribution; manufacture of gas distribution of gaseous fuels
through mains, steam and aircon supply; mining of coal and lignite, would see their input
costs increase by more than five per cent. But these too are not heavily traded overseas.
However, our analysis also flags up some industries that may be vulnerable to relocation
pressure due not only to the high input cost increases they would experience, but also their
trade openness, which limits their ability to pass on costs. These are discussed in Section 3
(see Appendix C for the full list of sectors).
The use of a uniform £20 carbon price is somewhat arbitrary and illustrative; it does not
reflect a particular policy. It can be thought of as a uniform tightening of the complex policy
landscape that was already in place in 2011. A £20 per tonne carbon price was chosen partly
because it is divisible by ten, which makes the arithmetic easy for readers keen to assess the
impact of alternative carbon prices at the whole economy level(some of these are outlined in
section 2.2).. It is also close to the current level of the carbon price floor As well as looking at
the impact of a £20 per tonne carbon price the analysis also shows the impact of higher rates
consistent with DECC projections for 2030. These are detailed in section 2.2.
The findings are consistent with prior Input-Output research on the competitiveness impact
of greenhouse gas mitigation policy in Canada, the US and the UK. Bataille et al. (2009)
investigated the impact on the Canadian economy of a CAN $100 per ton carbon price5
designed to achieve a 20 per cent greenhouse gas reduction by 2020. They found that
industrial minerals (cement and lime production) would experience the biggest output decline
while Canadian coal, oil and gas exports and imports would drop significantly. Over the long
term, labour-intensive manufacturing and service sector activities would displace some
capital- and energy-intensive activities.
In the case of the US, Aldy and Pizer (2009) looked at the impact of a US$ 15 per ton carbon
price6 on the US economy using energy price data for 400 industries, from 1986 to 1994.
They found that industries with relatively high energy costs would see the largest declines in
output. These industries included iron and steel (2.7 per cent), aluminium (2 per cent),
cement (1.6 per cent), bulk glass (3.4 per cent) and paper (3.3 per cent). For the
5 Around Can $367/tCO2e reflecting the greater mass of CO2 relative to carbon. 6 Around $55/tCO2e reflecting the greater mass of CO2 relative to carbon.

10
manufacturing sector as a whole they found the negative impacts on international
competitiveness to be relatively small. Dechezleprêtre et al., (2014) survey the empirical
literature on the impact of climate policies on productivity, employment and firm location.
Our analysis bares direct comparison with a similar study, conducted in 2006 using
comparable National Accounts data from 2003. This allows us to explore how the likely
competitiveness impacts of unilateral climate policy in the UK have changed over time.
Chapter 11 the Stern Review (2006), applied a carbon price of US$ 30/tCO2e to the UK
National Accounts data for that year.
In what follows, Section 2 identifies the industries that rely most heavily on fossil fuel inputs
and would therefore be most exposed to the impact of a carbon price. From there it estimates
the impact of a uniform, hypothetical carbon price on the cost of the inputs used by these and
all other industries. In the third part of Section 2 we compare the magnitude of the impact of
a carbon price on the whole economy to the magnitude of the impact induced by long run
changes in the oil price. Section 3 identifies the industries that are both heavily
internationally traded and which are also likely to bear significant new costs from a carbon
price – these being industries most vulnerable to relocation. Section 4 describes how the
economic impact of a carbon price has changed over the period 2003, which was the data year
used in the Stern Review, to 2011, which is the data year used here. The paper concludes by
recommending ways that UK climate policy can be implemented so as not to be incompatible
with greater UK competitiveness.
2. Distribution of costs and implications for cost competitiveness
The Input-Output tables from the UK National Accounts (officially referred to as the
‘Combined Use’ or ‘Supply and Use’ tables) give an authoritative statistical snapshot of the
value of all production and consumption activities in the UK across 106 industries (Standard
Industrial Classifications (SIC)). The Input-Output tables show the value of goods and
services produced and consumed by each industry, as a square matrix. The tables bring
together components of gross value added (GVA), industry inputs and outputs, product supply
and demand, and the composition of uses and resources for the whole UK economy. They are
constructed to show a balanced and complete picture of the flows of products in the economy
and to illustrate the relationship between producers and consumers of goods and services:

11
who buys what from whom and who sells what to whom. When the purchaser is a final
consumer (of a consumption or investment good or service), then no further selling occurs
and the transaction is listed as final demand. This data forms the statistical basis for
calculating gross domestic product (GDP) by balancing data for production with that for
expenditure and income. Appendix D gives an example of the matrix structure and content of
the Input-Output tables.
This analysis uses the latest Input-Output tables based on 2011 data. It imposes a hypothetical
additional carbon price of £20 per tonne across all sectors and explores the impact on
individual industries as a result of higher input costs. The analysis shows that relatively dirty
industries like petroleum refining whose input mix embodies a lot of fossil fuels, would be
more affected by a carbon price, all else equal, than relatively clean industries like computer
programming that rely on fossil fuel inputs hardly at all.7
2.1. Which industries rely most heavily on fossil fuels?
In order to assess the impact of a hypothetical carbon price on firms, it is essential to
understand how its cost would be transmitted across the economy. To do this, this analysis
first distinguishes between primary and secondary energy producing industries. Primary
energy producing industries include coal and lignite mining (SIC 05) and petroleum and
natural gas extraction (SIC 06 & 07). Secondary energy producing industries include electric
power generation (SIC 35.1), gas supply and distribution (SIC 35.2 – 35.3), and coke and
refined petroleum products (SIC 19). These are considered ‘secondary’ energy producers
because they derive their inputs primarily from primary energy producers.
The Input-Output tables show that the value of ‘total output’ by turnover for the UK as a
whole in 2011, across all 106 industries, was £2,797 billion. This figure is the sum of all
intermediate consumption plus the value added by the industries themselves. In other words,
this turnover measure goes up when there is more buying and selling across sectors even if
production or Gross Value Added (GVA) remains unchanged. Correspondingly, it is a
measure of composite price effects reflecting both output and turnover. By comparison GVA,
7 Another advantage of the Input-Output tables is that they conform to the standard accounting framework of the European System of Accounts. This ensures that UK imports and exports to/from the UK’s trading partners are reflected in domestic production and consumption figures.

12
which corresponds closely with GDP (the difference being the small gap between taxes minus
subsidies on products), measures the sum-total of actual output only and totalled £1,361
billion.8
The data shows the two primary energy producers account for 1.4 per cent of this (£40
billion) while the secondary energy producers account for an additional 4.4 per cent (£124
billion). To put this into perspective, the construction industry (SIC 41-43) accounted for 7.4
per cent of all UK output while financial services (SIC 64) accounted for 4.9 per cent. This
means that primary and secondary energy producing industries together account for a
relatively small proportion of total UK economic output by turnover – about 5.8 per cent
combined.
Some industries rely more heavily on primary and secondary energy producers for their inputs
than others. The data shows, for example, that in 2011 the electric power generation industry
(SIC 35.1 – a secondary energy producer) consumed goods and services (inputs) worth £58.2
billion. This was the industry’s total intermediate consumption before it added any value
itself by combining the goods and services in particular ways. £3.1 billion of this was
purchased from the coal and lignite industry (4.4 per cent),9 £18.3 billion from petroleum and
natural gas extraction (26 per cent), £0.6 billion from coke and refined petroleum products (1
per cent), and £7.8 billion from gas supply and distribution (11.2 per cent). By contrast,
electric power generation’s purchases from more knowledge-intensive industries such as
computer programming and consultancy (SIC 62) are relatively small, at £0.4 billion.
8 Gross Value Added (GVA) is the sum of total production which also equals compensation of employees (gross wages and salaries) plus gross operating surplus plus mixed income. Adding gross value added to total intermediate consumption gives total output at basic prices. The relationship between GVA, which measures the value of all new productive activity in the economy and ‘total output’ which measures turnover depends on the number of transactions across production boundaries. If for any given production there is more intermediary selling and buying between production sectors then the gap between GVA and ‘total output’ will widen. 9 This is the case even though a considerably higher proportion of electricity in the UK is produced from burning coal (up to 40 per cent). The difference is that the analysis here disaggregates electricity production across the total value of different inputs whereas statements about the mix of fuel types electricity is derived from are based on the relative quantities of inputs. Because coal is relatively inexpensive per unit of energy (about half the price of the next cheapest fuel, gas, as shown in the first table below), it accounts for a small proportion of UK electricity output relative to other fuels in value terms but a larger proportion in quantity terms. For comparison, the benchmark study using 2003 data showed that about five per cent of the value of all inputs consumed by electric power generation came from the coal industry, very similar to the four per cent figure in the 2011 data.

13
The extent of reliance of each industry on primary and secondary energy producers was
calculated for all 106 industries. Figure 1 shows the nine UK industries that rely most heavily
on primary energy producers, that is, industries that mainly produce coal, oil, and/or gas.
Figure 1: Share of input costs from primary energy inputs by industry
(per cent)
Note: Primary energy inputs include coal, oil and gas. An industry is more exposed to the cost increase from a potential carbon tax if a large proportion of the inputs it consumes are fossil fuels. Exposure is measured as the proportion of the inputs an industry consumes that come from primary energy producing industries (coal, oil and gas), as captured in the National Accounts. Out of the 106 industries in the UK, coke and refined petroleum products is the most exposed industry, sourcing 71.1 per cent of the value of all the inputs it consumes from direct energy producers.
The industries with the highest fossil fuel input reliance are secondary energy producers
themselves, namely the coke and refined petroleum industry at 71.1 per cent, gas supply and
distribution at 49.5 per cent, and electric power at 30.5 per cent. When we expand the
analysis in Figure 1 to include reliance on primary and secondary energy producing
industries, a larger number of industries show significant input cost increases. This is shown
in figure 2, which displays the overall fossil fuel reliance broken down across primary and
secondary energy inputs (industries). Coke and refined petroleum products, the industries
most exposed to energy costs above, are shown to depend mainly on primary energy inputs.
Adding secondary energy inputs reinforces the message in the figure above that refined

14
petroleum products, electric power, and gas are the industries most reliant on fossil fuels and
therefore most exposed to input cost increases from a carbon price.
Figure 2: Share of input costs from primary and secondary energy inputs by industry
(per cent)
Note: UK industries most reliant on primary and secondary energy producing industries. Per cents indicate the proportion of the value of all inputs consumed by the industry that come from fossil fuels (fossil fuel-producing industries).
Figure 3 separates out electricity, from other secondary sources which include coke, refined
petroleum and gas products. It can be seen that with the exception of the electricity sector
itself (which uses large amounts of electricity for power plant auxiliaries such as pumps and
motors and loses electricity in transmission and distribution), carbon costs from electricity
form a relatively small, if not trivial, part of any total cost increase in the key affected sectors.
This has a bearing on polices such as the carbon floor price which target the electricity sector
disproportionately.
15
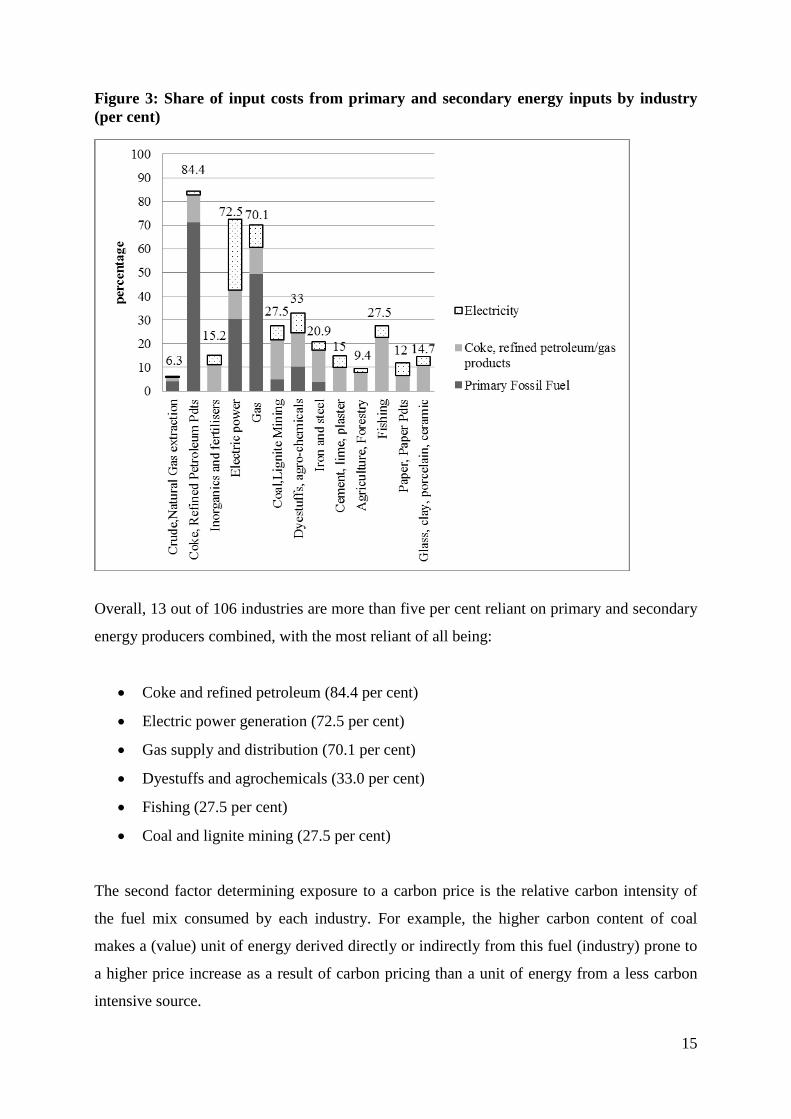
Figure 3: Share of input costs from primary and secondary energy inputs by industry (per cent)
Overall, 13 out of 106 industries are more than five per cent reliant on primary and secondary
energy producers combined, with the most reliant of all being:
• Coke and refined petroleum (84.4 per cent)
• Electric power generation (72.5 per cent)
• Gas supply and distribution (70.1 per cent)
• Dyestuffs and agrochemicals (33.0 per cent)
• Fishing (27.5 per cent)
• Coal and lignite mining (27.5 per cent)
The second factor determining exposure to a carbon price is the relative carbon intensity of
the fuel mix consumed by each industry. For example, the higher carbon content of coal
makes a (value) unit of energy derived directly or indirectly from this fuel (industry) prone to
a higher price increase as a result of carbon pricing than a unit of energy from a less carbon
intensive source.

16
Another source of emissions for some sectors is industrial processes. The production process
is the principal determinant of the carbon intensity of many products. Carbon content varies
from firm to firm and location to location as a result of heat and non-heat related processes.
This analysis captures heat related processes, but does not attempt to capture non-heat (i.e.
non-fossil fuel related) processes emissions from UK sectors.10 Houser et al. (2008) note that:
“For most carbon-intensive intermediate products like steel, aluminium, chemicals,
and cement, this is a daunting task, given the enormous variety of production
processes employed and fuels used. The amount of carbon “embedded” in a ton of
steel varies greatly both by country and by individual firm.”
Sectoral output at the 3-digit SIC level is not homogenous and will vary by composition.11
Sato et al. (2014) note:
“Standard Industrial Classification is the standard reporting format for industry data.
Data is readily available at high resolution disaggregation and can thus enable detailed
evidence-based cross-sectoral analysis. The number of manufacturing classes increase
from 23 at 2-digit resolution, to 101 at 3-digit resolution and 239 at 4-digit resolution.
SIC definitions are end-product driven, however, and often do not capture distinctions
between manufacturing processes and carbon intensities, for example that between
BOF and EAF processes in steel. For sectors where differentiation between processes is
key to competitiveness and leakage impacts, explicitly looking at examination of the
production or value chain is required. In addition, some sectors are covered under
different Classification (SIC) codes (e.g. Mineral Wool is defined under 26.14 for Glass
Wool and 26.82 for Rock Wool).”
10 Houser et al. state that: “In steel, for example, the two main production processes create similar products but with very different carbon footprints. Integrated mills use coal-fired blast furnaces to melt iron ore into pig iron, which is then turned into liquid steel in a coal-fired basic oxygen furnace. Mini mills melt recycled steel scrap, rather than melting virgin iron ore, into liquid steel in an electric arc furnace. By avoiding the use of blast and basic oxygen furnaces, mini mills emit less than one third as much CO2 in the production of a ton of steel, even if the electricity consumed in the process is generated from coal. In paper production, process choice also significantly affects the embedded carbon in the final product. Mechanical pulping requires large quantities of purchased electricity while chemical pulping relies on energy self-generated from biomass.” 11 For example, the 3-digit SIC sectors covers 24.1-3Manufacture of cement, lime, plaster and articles of concrete, cement and plaster and 25.1-3 Manufacture of basic iron and steel. These are fairly broad. The former include a broad range of cement, lime, plaster concrete, tiles, bricks, posts, boards, sheets, ready mixes, mortars, and vases. The latter include basic iron and steel and of ferro-alloys, tubes, pipes, steel fittings, trip, bars, strip, wires and welded materials.

17
2.2. The impact of a hypothetical carbon price
There is no single carbon price that applies or is likely to apply to UK firms over the coming
decade. A number of overlapping carbon pricing instruments apply to different sectors
depending on their size and sector. In the use of carbon prices for appraisal assessment,
DECC assumes prices for tradable sectors covered by the European Union Emissions Trading
System (EU ETS) rise from a present £4 per tonne of carbon to £5 in 2020, and then rise
progressively in real terms to finally converge with the shadow price used to asses non-
tradable sectors of £78 per tonne of carbon in 2030.12
There is little prospect of carbon prices for most tradable sectors rising to these levels in the
near term. The current price of emissions allowances in the EU ETS, which applies to
intensive users of coal and gas, is nearer £4.13 However, electricity is currently priced at a
much higher level, highlighting the wide divergence of carbon pricing in the UK (and also
providing a perverse disincentive towards electrification). For illustrative purposes we apply a
£20 carbon price increase uniformly on top of the 2011 Input-Output accounts, which already
embed a variety of actual or implicit carbon prices.
Although the base year is 4 years ago, little has changed in the structure of the UK economy
or the carbon content of fossil fuels. This means that the 2011 base can therefore be used to
assess the impact of policies in 2015. Because neither the carbon content of fossil fuels nor
the structure UK of industry has changed significantly over the intervening years, the study
forms a good proxy for policies proposed or applied today (subject to a small general price
inflation adjustment).
This method therefore allows analysts to assess how a hypothetical carbon price would impact
on the input costs of different industries where all sectors fully pass on costs, taking the
carbon content of different fuels into account. As noted, the impact of changing input prices
on output prices is linear in this framework, so the results can be appropriately factored
12 See Supporting Tables for DECC-HMT Supplementary Appraisal Guidance (2014). https://www.gov.uk/government/uploads/system/uploads/attachment_data/file/360323/20141001_Supporting_Tables_for_DECC-HMT_Supplementary_Appraisal_Guidance.xlsx 13 See Advani et al. (2013) ‘Energy use policies and carbon pricing in the UK’ IFS Report R84http://www.ifs.org.uk/comms/r84.pdf

18
up/down for different carbon input costs. A £20 per tonne carbon price is a round multiple
that can be used to assess the impact of other prices, for example the implied impact of a £60
per tonne carbon price can be estimated by tripling the base numbers presented here.14
A £20 per tonne carbon price is also approximately equal to the UK carbon price floor (CPF)
(£18 per tonne). The carbon price floor applies to electricity generators only, but, as its cost
can be easily passed on to electricity consumers, it can affect all sectors indirectly. The CPF
was introduced in 2013 and was meant to increase gradually to reach £30 per tonne by 2020
(in 2009 prices). But, as the EU ETS carbon prices turned out to be substantially lower than
expected when the CPF was introduced, the UK government recently revised the CFP
downwards, for fear that this could damage the competitiveness of UK firms and raise energy
bills. The CFP was therefore capped at £18 per tonne up to 2020. We examine the likely
impact of such measures in section 2.4.
Finally, in Phase III of the EU ETS (2013-2020) the Commission uses an assumed carbon
price of €30 per tonne (around £25) to assess whether sectors will be eligible for free
allowances. In 2011 prices this corresponds to around £20. A carbon price of £20 per tonne
also closely matches the US$30 per tonne carbon price used in the Stern Review for the
purpose of examining 2003 Input-Output data, making for easy comparison through time.
By the same token, it is also possible to assess the likely effect of a more ambitious carbon
price. DECC estimates that by 2030 the shadow price of carbon to be used for all value-for-
money calculations and appraisals, as per the Green Book, should reach around £78 per tonne
(in 2014 values which represents £73 per tonne in 2011 prices) for both EU ETS and non-EU
ETS sectors. We show how such a price might have affected UK sectors and the economy as
a whole were it applied in 2011 by multiplying the benchmark £20 per tonne carbon price
input by 3.65.
2.3. Input-Output methodology
The basic methodology works as follows. To capture the carbon intensity of the energy mix
this analysis calculates a set of price increases which correspond with the introduction of a
uniform £20 per tonne carbon price, reflecting the carbon content of each primary fuel: coal,
14

19
oil, and gas.15 These are presented in Table 1. The price of coal increases by 62.7 per cent, oil
by 11 per cent and gas by 17.7 per cent.16
Table 1: Fuel price increase due to carbon price (2011)
Carbon content of
fuel
(kg CO2/kWh)
Fuel price without
carbon price
(£/kWh)
Fuel price with
carbon price
(£/kWh)
Price increase
(per cent)
Coal 0.313 0.010 0.017 62.7
Oil 0.268 0.048 0.053 11.1
Gas 0.184 0.021 0.025 17.7
Note: the increase in the unit price of fossil fuels is that which would result from imposing a carbon price of £20/tCO2e.
Applying the fuel price increases resulting from the £20 carbon price17 to the price of primary
fossil fuel inputs simulates how the effect of a uniform carbon price would be born across
industries in terms of input price increases. It also shows the increase on the final product
price. As in the Stern Review (2006), the implicit assumption of using a fixed Input-Output
methodology is that primary energy producers pass on the entire cost increase associated with
the carbon price i.e. their profit margins do not change and they do not change their behaviour
to optimise their input costs in response to changes in relative prices. It is also assumed that
secondary energy producers and all other industries that use any primary fossil fuel inputs at
all pass on the entire cost increase that they bear to final goods prices. Again, this trace-
15 The multiplier is calculated in two stages. First the new fuel price reflecting a carbon price is calculated as: Fuel price with carbon price = initial unit price + (carbon content of fuel * cost per unit of carbon). Numerically for coal then: £0.010 per kWh + (0.313 kg CO2 per kWh * £0.020 per kg carbon) = £0.016 per kWh. Data for fuel carbon content come from Department of Energy and Climate Change (2013) and Carbon Trust (2013) and are given in Table 1. Second, this is expressed as per cent change from the initial price and calculated as: [(fuel price with carbon price) / (fuel price without carbon price) – 1] * 100 = per cent price increase. Numerically for coal then: [(0.0165/0.0104) - 1] * 100 = 62.7 per cent. 16 The price increase is higher for coal than for gas because there is more carbon in coal relative to its price than there is in gas. The proportionate increase is higher for gas than oil, despite the lower carbon content in the former, reflecting the higher price for oil per kWh which is the most sought after and versatile transport fuel. 17 The National Accounts capture the value of all output by industry type but not specific product type. In order to apply the carbon price multipliers we made two assumptions about the relationship between industries and products. First, for coal and lignite (SIC 05) we assume that all output is coal, and apply the carbon price multiplier for coal directly. Second, for crude petroleum and natural gas (SIC 06 & 07), the data only come in this aggregate form without the possibility to disaggregate into industry/fuel product types. For that reason we assume that all inputs flowing from this industry to electric power generation (SIC 35.1) and to manufacture and distribution of gas (SIC 35.2-35.3) are comprised only of gas, and therefore apply the gas multiplier. This is a reasonable assumption given that the amount of oil used in electricity generation in the UK in 2011 was 1 per cent compared to 34.4 per cent for gas (DUKES, 2013).

20
through process assumes no behaviour change or input substitution. This is a pure
arithmetical analysis for a single year and the analytical framework is therefore static.
2.4. Input-Output analysis findings
The introduction a uniform £20 per tonne carbon price without behavioural adjustment results
in a whole-economy production cost increase of marginally less than 1 per cent (0.9 per cent).
Approximately 0.2 percentage points of this comes from coal, 0.3 percentage points from oil,
and 0.5 percentage points from gas. We also calculate how this whole economy production
cost increases eventually feeds through to final consumer prices. The overall impact on final
consumer prices is to increase them by 0.9 per cent.18
Table 2: Impact of £20 carbon price on overall production costs and consumer prices
Whole economy cost
(per cent change)
Consumer price change
(per cent change)
Coal 0.2 0.1
Oil 0.3 0.3
Gas 0.5 0.5
Total 0.9 0.9
Note: Overall impact from imposing a carbon price of £20/tCO2e on whole economy production costs and final consumer prices, as per cent change.
Different industries bear different proportions of the 0.9 per cent whole economy production
cost increase. The figure below shows that the £20 per tonne carbon price induces the largest
product price changes in coke and refined petroleum products, and in electricity generation.
These are the same secondary energy industries that were shown above to depend heavily on
primary energy inputs.
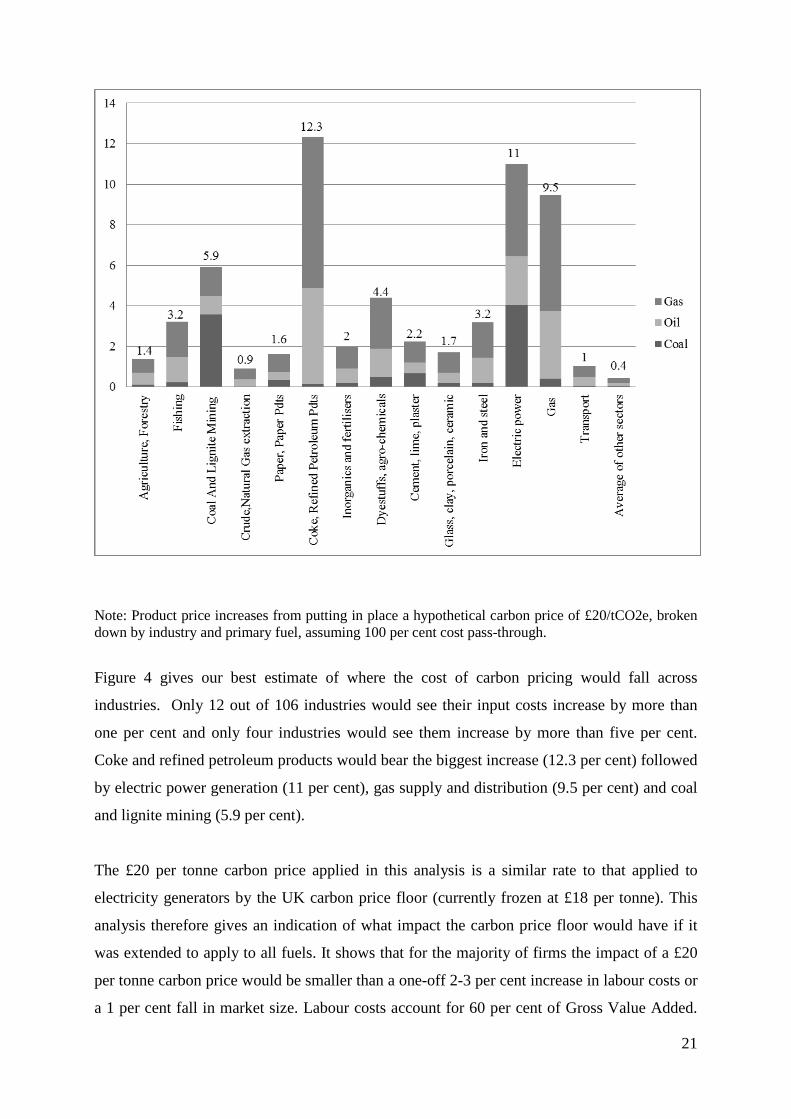
Figure 4: Product price increase due to £20 carbon price, by industry
(per cent)
18 The whole economy cost and the consumer price change are calculated using the same multipliers. To estimate the impact on consumer prices, Household Final Consumption Expenditure, released as a part of the ONS Input-Output tables, is used. The key difference between the two is the inclusion in the latter of gross operating surplus and gross mixed income, which measure the surplus accruing from processes of production before deducting any explicit or implicit interest charges, land rent or other property incomes payable on the financial assets, land or other tangible non-produced assets required to carry on the production. It corresponds to the capital factor income share. It is calculated as a balancing item in the generation of income account of the national accounts.
21
Note: Product price increases from putting in place a hypothetical carbon price of £20/tCO2e, broken down by industry and primary fuel, assuming 100 per cent cost pass-through.
Figure 4 gives our best estimate of where the cost of carbon pricing would fall across
industries. Only 12 out of 106 industries would see their input costs increase by more than
one per cent and only four industries would see them increase by more than five per cent.
Coke and refined petroleum products would bear the biggest increase (12.3 per cent) followed
by electric power generation (11 per cent), gas supply and distribution (9.5 per cent) and coal
and lignite mining (5.9 per cent).
The £20 per tonne carbon price applied in this analysis is a similar rate to that applied to
electricity generators by the UK carbon price floor (currently frozen at £18 per tonne). This
analysis therefore gives an indication of what impact the carbon price floor would have if it
was extended to apply to all fuels. It shows that for the majority of firms the impact of a £20
per tonne carbon price would be smaller than a one-off 2-3 per cent increase in labour costs or
a 1 per cent fall in market size. Labour costs account for 60 per cent of Gross Value Added.

22
Whole economy producer and consumer prices would be expected to rise by just under 1 per
cent (see table 4). The effect of the frozen carbon price floor, applied across the whole
economy, is likely to amount to less than a 0.25 per cent increase in the level of consumer
prices or producer costs. The impact on specific sectors is examined in section 3.
By applying the £20 carbon price to electricity inputs only it is possible to use the Input-
Output methodology to explore the impact of the Carbon Price Floor in its current form.
Doing so shows that the impact on almost all sectors, except mining and electricity itself, is
minimal. This reflects the fact that electricity forms a relatively small part in the energy cost
of the most carbon-intensive sectors (see figure 3) All other key sectors would see product
price increases of below 1 per cent, with most seeing increases below 0.5 per cent. Even non-
ferrous metals and metal casting (SIC 24.4-5) which includes the electricity-intensive
aluminium sector (as well as copper, aluminium, lead, zinc, and precious metals and the
casting of all metals) would see price increases of under 0.5 per cent, if the carbon cost is
applied only to electricity. Indeed this sector classification shows very similar characteristics
in response to carbon pricing as iron and steel, reflecting the fact that the aluminium sector
comprises around a tenth of the output of this this category and a mere 0.01 per cent of UK
GVA.19 The conclusion is that the economic impact of the carbon price floor—as currently
applied—on UK industry is likely to be minimal, even if the rate were allowed to double or
triple over the next few years. Figure 5 restates figure 4 but separates out the proportion of
each sector’s price increase that is transmitted via the electricity sector.
Significantly increasing the carbon price imposed has a marked effect on the results. If an
illustrative carbon price equivalent to £73 per tonne, consistent with the DECC shadow price
of carbon that by 2030 should reach around £78 per tonne (in 2014 values which represents
£73 per tonne in 2011 prices), were applied to both EU ETS and non-EU ETS sectors, then
whole economy costs would be expected to jump by a lot more – 3.25 per cent compared to
no carbon pricing and close to 3 per cent compared with carbon prices applied on EU ETS
sectors today. Electricity costs would rise by 43 per cent, iron and steel costs by 13 per cent
and cement costs by 9 per cent. On its own, this would likely have a significant impact on the
location decisions of tradable carbon intensive sectors and on UK efficiency.
19 See http://www.ons.gov.uk/ons/guide-method/method-quality/specific/gss-methodology-series/gss-methodology-series--32--gross-domestic-product-output-approach--gva----revised.pdf

23
Figure 5: Product price increase due to £20 carbon price, by industry
(per cent)
These estimates are upper-end and likely to overstate what would be the actual cost increase
born by industries and consumers for two reasons.
1. In practice, the change in relative prices would provide a signal to consumers and
producers to shift towards less carbon intensive activities and products, exploiting new
technologies, processes and behaviours to limit the cost impact. Firms and industries
will have an array of substitution opportunities they can employ to limit emissions and
avoid the new costs associated with a carbon price. These include investing in more
energy efficient, lower carbon or renewable energy inputs. Such activities would
reduce the final costs to the firm, industry and economy as a whole. Moreover, by
providing incentives to improve energy efficiency and productivity, such measures
can help make energy intensive forms more resilient to future energy price shocks.20
20 See Dechezlepretre and Sato (2014).

24
Consumers would also be able to buffer themselves from cost increases by investing
in energy efficient products or by shifting to less carbon-intensive goods and services.
The results presented here assume no substitution or behavioural change at any level
because the input-output coefficients are fixed.
2. Exploiting such substitution options will entail a real additional resource cost to the
economy, for example to pay for investment in new low carbon technologies.
However, the costs borne by producing industries and/or consumers in the payment of
a carbon tax or purchase of carbon credits are not actually lost to the economy as a
whole. The extra cost in fact forms a pool of revenues which are available to be
redistributed back into the economy, reducing costs elsewhere. The revenues from
carbon pricing instead represent a transfer from the users and producers of carbon
intensive goods and services to the government (in the case of a carbon tax, or fully
auctioned permits, in the case of a carbon traded scheme). These revenues can then be
ploughed back into the economy, reducing costs elsewhere. The net effect on GDP,
which measures the value of all goods and services produced, will depend on how the
whole economy’s factors of production, labour and capital are redeployed in response
to changed relative prices to produce goods and services. There is an extensive
literature on the likely net cost of introducing carbon pricing once revenues are
recycled, with some studies claiming that the net effect on GDP could be positive
yielding a so-called ‘double dividend’ of environmental benefits and increased
economic inefficiency via the opportunity to reduce other distortionary taxes.21
3. On the other hand, for specific sectors, the omission of non-heat process related
emissions is likely to understate the likely impact of extensively applied carbon
pricing. However, because this affects only a few sectors, and because for even these
sectors the bulk of emissions result from fossil fuel use, which is picked up by this
study, the impact at the whole economy level is likely to be negligible.
2.5. Carbon price impact in the context of long-run oil price changes
21 For a full discussion see, for example, Bovenberg and De Mooij (1994); Bovenberg and Goulder (1997) or Goulder (2013 and 2014) or Parry (2014).

25
To put the put the magnitude of the 0.86 per cent increase in final consumer prices into
perspective its worth comparing it changes to consumer prices caused by historical variations
in the oil spot price. Oil prices rose from around US$ 35 per barrel in 2003 to around US$
110 per barrel in 2011. A higher oil price feeds through into higher industry input costs, and
ultimately to higher final consumer prices. The impact of the oil price increase on final
consumer prices can be seen as a proxy for the impact of a carbon price. Alternatively, it can
be used to gauge the magnitude of the recent fall in the oil price, in terms of equivalent costs
that would have prevailed under different levels of the carbon price.
Table 3: Carbon price impact, expressed as equivalent oil price increase*
Brent spot prices, US$
/ barrel
Equivalent carbon cost
(£ / tonne CO2)
Consumer price impact
(per cent change)
Base: 111 0 0
120 4.2 0.23
140 13.8 0.74
160 23.4 1.25
180 33.1 1.77
200 42.7 2.28
*Based on input-output analysis of a rise in the price of crude petroleum (gas and coal prices unchanged) using
2011 prices.
The table above shows that the estimated overall consumer price impact from a £20 per tonne
carbon price of 0.9 per cent is comparable to the impact of a US$ 35 oil price increase. The
oil price rose by over twice this much between 2003 and 2011. Every US$ 20 increase in the
oil price (relative to any baseline) corresponds to about 0.44 per cent increase in whole
economy costs.
Stated differently, applying a £20 per tonne carbon price in the economic environment of
2011 (where the oil price was US$111 per barrel on average) would have roughly the same
final consumer price impact as did the ‘natural’ increase in the oil price between September
2010 and May 2011, though of course a credible carbon price might be seen as a more
permanent and certain increase in costs than an oil price rise, potentially having a more
powerful impact on relocation decisions. However, unlike an increase in the oil price which
mostly reflects a transfer of rent to non-UK oil exporters, the revenues raised by the increased

26
costs are available for recycling back into the economy, reducing costs elsewhere as discussed
above. On the other hand, the oil price would affect all firms equally, while carbon prices, if
set unilaterally, affect only domestic firms. This will limit the overall economic impact of the
price rise, but potentially put domestic firms at a competitive disadvantage.
Figure 6: Carbon price and oil price change impact on whole economy costs
Note: Europe Brent spot crude, real prices. The upper two dashed lines depict the oil price rise that would have the equivalent cost impact as the two indicative carbon prices, relative to the 2011 average oil price (US Energy Information Agency, 2014).
3. Carbon mitigation policies and industrial location It should be noted that the location of carbon-intensive industries is driven by numerous
factors beyond carbon cost. Key among these are labour costs, access to markets, access to
materials, access to suitably skilled labour, the presence of suitable legal and fiscal
jurisdictions, and so on. Moreover, tight environmental legislation can often induce efficiency
improvements that enhance international competitiveness in tradable sectors. These factors
are all examined in detail in Bassi and Zenghelis 2014. This paper looks only at first round
cost competitiveness in a world of full cost pass-through.
In practice, the ability to pass on carbon costs to UK consumers as well as the propensity of
carbon-intensive industries to ‘relocate’ production abroad in order to forgo the additional
cost of carbon pricing will depend on the extent to which an industry’s output is traded

27
competitively across borders. If the output is not traded across borders, then the presence of
differential carbon pricing regimes in other countries will have little impact on output or
location of the firm as cheaper imports are not a competitive threat. Of course, a high carbon
price for non-traded carbon intensive sectors may reduce domestic output as consumers
substitute to low carbon alternatives, but they will not have the opportunity to shift to
imported versions of the same product if the product is not traded. As a proxy for relocation
sensitivity and the elasticity of demand for imports and exports, it is possible to calculate a
measure of each industry’s ‘trade openness’ based on the export and import intensity of its
final demand. The index is calculated for each industry i as:
Trade opennesss 𝑖𝑖 = ��𝑇𝑇𝑇𝑇𝑇𝑇𝑇𝑇𝑇𝑇 𝑒𝑒𝑒𝑒𝑒𝑒𝑇𝑇𝑒𝑒𝑇𝑇𝑒𝑒𝑖𝑖𝐹𝐹𝐹𝐹𝐹𝐹𝑇𝑇𝑇𝑇 𝑑𝑑𝑒𝑒𝑑𝑑𝑇𝑇𝐹𝐹𝑑𝑑
∗ 100� + �𝑇𝑇𝑇𝑇𝑇𝑇𝑇𝑇𝑇𝑇 𝐹𝐹𝑑𝑑𝑒𝑒𝑇𝑇𝑒𝑒𝑇𝑇𝑒𝑒𝑖𝑖𝐹𝐹𝐹𝐹𝐹𝐹𝑇𝑇𝑇𝑇 𝑒𝑒𝑠𝑠𝑒𝑒𝑒𝑒𝑇𝑇𝑠𝑠
∗ 100��
Calculated values can theoretically range from 0 to 200. Higher values indicate more heavily
traded industries. Values are given for all 106 industries in Appendix C.22 The mean trade
openness value across all industries is 31.7. The maximum value is 106, for mining and
quarrying (SIC 08). Other highly internationally traded industries include manufacture of
other chemical products (SIC 20.5) and manufacture of air and spacecraft and related
machinery (SIC 30.3).
First, it is important to note that the UK is part of a regional trading block also applying
ambitious climate policies, such that a large part of UK international trade is with EU
Member States that are subject to similar rates of carbon pricing. The latest estimates show
that approximately 54 per cent of UK trade as a whole, in 2012, was with EU countries.23
This serves to mitigate the impacts on relocation of the scenarios illustrated above, compared
with one where the UK acted unilaterally.
The Stern Review, which used Input-Output data from 2003, found that the trade openness of
several affected industries falls considerably when ‘trade’ is restricted to non-EU countries.
For example, trade intensity fell seven-fold in the cement industry when restricted to non-EU
countries because cement is heavy and expensive to transport across long distances. Trade
22 This index was used in the Stern Review (2006). Appendix C also gives information about each industry’s carbon intensity, energy inputs as a per cent of total costs, compensation as a share of total cost, and per cent contribution to total UK output. 23 Office for National Statistics (2013) Detailed data on the geographic destination/origin of trade by individual industry is not currently published by the ONS.

28
intensity in agricultural produce dropped by a factor of five and in plastics, iron and steel, and
land-transport fell by two-thirds. We have not been able to replicate this aspect of the Stern
Review benchmark study due to a discontinuation of the data. In any case, policy-makers
should see as particularly vulnerable the UK industries that are heavily involved in the 46 per
cent of UK trade with countries beyond the EU.
With this in mind, the data show that in terms of the primary and secondary energy industries
that would be most affected by carbon pricing, the trade openness of coal and lignite mining
(SIC 05) is 74, petroleum and natural gas extraction (SIC 06 &07) is 77, electric power
generation (SIC 35.1) is 1.2, gas supply and distribution (SIC 35.2 - 35.3) is 0.2, and coke and
refined petroleum (SIC 19) is 50.
Figure 7: Industry trade openness versus carbon price-induced cost increase
Note: The Y axis is the estimated change in the cost of inputs for each industry due to a £20/tCO2e price. The X axis is the trade openness of each industry. The trade openness value for the average of all industries is plotted. While the great majority of industries do not present significant competitiveness concerns, those of that may require policy maker attention are those that are both highly traded and which will bear a large input cost increase.

29
There is no evidence that climate change policies which impose either an explicit (e.g. the EU
ETS) or implicit carbon price (e.g. the Climate Change Levy or CRC energy efficiency) on
UK firms have led to relocation to date. Nevertheless, as the carbon price rises over the
coming decade the risk of relocation will increase. Policy-makers should seek reduce the risk
of relocation by focusing on the small number of industries that are both heavily
internationally traded and whose input costs are likely to rise significantly. These sectors are
unlikely to be able to pass costs on to consumers without losing significant market share, thus
are vulnerable to a significant reduction in profits as a result of carbon pricing policies. In the
figure above these are shown to be manufacture of coke and refined petroleum products (SIC
19), mining of coal and lignite (SIC 05), manufacture of iron and steel (SIC 24.1-24.3), and
manufacture of dyestuffs and agro-chemicals (SIC 20C). In the longer term, competitiveness
may be enhanced to the degree that tradable sectors in countries with ambitious policies
which are rolled out worldwide, become more efficient and productive and are able to thrive
in global markets (as has been the case with the European and Asian car producers, which
produced more efficient vehicles in markets with higher fuel costs than their more cosseted
US competitors).
Although the price increase that corresponds with a uniform £20 per tonne carbon price for
these sectors is generally below 5 per cent of turnover costs (comparable to annual
fluctuations in exchange rates), it must be born in mind that a rise in the carbon price toward
the DECC shadow price of carbon of £73 per tonne by 2030, which they use for evaluative
purposes, could see a tripling of the impact, with price rises of 10 to15 per cent. This would
potentially render many producers uncompetitive if they are unable to decarbonise their
activities significantly over the intervening period, with the price of iron and steel being
driven up by 13 per cent and cement by 9 per cent.
This could potentially wipe out margins in these sectors, especially if additional carbon
emitted as part of the non-heat related industrial process is costed. Gross margins in the global
steel industry have recently varied around 10 per cent with Earnings Before Interest, Taxes,
Depreciation and Amortization (EBITDA) at around 5 per cent (figures were higher during
the global boom prior to 2008 but zero or negative during the downturn in 2009). Ultimately,
the likely impact on firm location choices needs to be determined empirically. However,
carbon price differentials at such high levels go beyond current experience and it seems wise
to anticipate that an illustrative carbon price of £73 per tonne, if expected to endure and in the

30
absence of strong compensation, would significantly erode competitiveness in sensitive
sectors and likely prompt carbon production and emissions to relocate abroad. A more
sophisticated analysis of competitive pressure would of course look at behavioural responses
in terms of substitution possibilities and cost pass-through, but this comparison provides only
a first approximation of the possible impact.
4. Comparison to study using 2003 data
By comparing the results in this study with the results of a similar analysis conducted as part
of the Stern Review (2006) it is possible to see how the likely competitiveness impact of a
hypothetical carbon price has changed over time.
Although there have been notable changes in how various economic activities are classified
into industries in the eight years between studies, we are still able to report broad comparisons
as in Table 4. On the whole the economic impact of a carbon price for most sectors is
estimated to be similar in 2011 and 2003, with the notable exceptions of cement, refined
petroleum products and gas distribution (the latter being affected by a higher base price for
the commodities in question in 2011 compared with 2003, making the proportionate increase
from absolute carbon costing smaller). Although electricity has become less carbon intensive,
some sectors such as steel and agriculture appear to have increased their carbon intensity.
Despite these differences, the overall UK economy effects remain broadly unchanged.
Table 4: Estimated carbon price impact: 2003 versus 2011
Impact, per cent change
2003 2011
Production cost change for individual sectors
Agriculture, forestry 1.2 1.5
Fishing 3.7 3.4
Refined petroleum products* 20.4 13.1
Chemicals* 1.7 -
Cement* 7.8 2.3
Iron and steel 2.3 3.4
Fertilisers* 4.0 2.1
Electricity 14.0 11.7

31
Gas distribution 22.1 10.1
Transport* 1.5 1.1
Agriculture, forestry 1.2 1.5
Whole economy production cost 1.1 0.9
Consumer prices 0.8 0.9
Note: asterisks denote industries where activity boundaries changed over the period and were grouped here to be as comparable as possible across periods.
5. Imported emissions
It is worth noting that this study only assesses the impact of domestically produced carbon
emissions, rather than emissions produced elsewhere to produce consumer goods imported
into the UK. It complements existing studies which have used Input-Output data to develop
comprehensive models for estimating the greenhouse gas emissions embedded in trade or the
‘carbon footprint’. Many of these studies find that the UK’s consumption-based emissions,
overall, have been going up and therefore contributing to a net increase in global emissions
(The Energy and Climate Change Committee, 2012). Druckman et al. (2008) contrast the
results of the production-based and consumption-based accounts of UK emissions for 1990
and 2004. They find an eight per cent increase in total UK consumption-based emissions
accompanied by a shift in the trade balance of embedded emissions towards imports, as the
UK's carbon trade balance (the excess of consumed over produced emissions) has risen from
1 per cent in 1990 to 8 per cent in 2004. Similarly Wiedmann et al. (2010) use a multi-region
Input–Output model for the UK to create a time series of the UK national carbon footprint
from 1994 to 2004. They find that net carbon dioxide emissions embedded in UK imports
increased from 4.3 per cent of producer emissions in 1992 to a maximum of 20 per cent in
2002.
The trade balance for embedded carbon dioxide emissions shows an increased deficit in the
balance of emissions embedded in trade. This is due to a strong increase of 60 per cent for
emissions embedded in imports whereas export-related emissions have only risen by 28 per
cent. Additionally Turner et al. (2011) find consumption-based, as against production-based,
accounting methods identify a significantly higher level of carbon dioxide emissions. This
study focuses only on the carbon price impact across production sectors at the national level,
which tend to be those sectors which have primary energy inputs and consequently significant
carbon emissions. Although the UK’s net propensity to import carbon has increased, the

32
number of ‘vulnerable’ sectors with incentives to ‘relocate’ production abroad in order to
forgo the additional cost of carbon pricing appears to have remained broadly unchanged.
6. Key findings and policy recommendations
The key finding of this study is that a carbon price of £20 per tonne , implemented uniformly
in the UK, would have a relatively small impact on the input costs faced by the large majority
of UK industries. 94 of the 106 total industries that make up the UK economy would see their
input costs increase by less than 1 per cent. We estimate the price increase for the whole
economy (all industries combined) to amount to 0.9 per cent. However, the order of
magnitude would more than triple if a price differential corresponding with DECC’s estimates
of the shadow carbon price by 2030 were to be applied, raising UK costs by around 3 per cent
and imparting a strong competitive disadvantage to carbon-intensive tradable industries.
In reality this impact would likely be still smaller than these estimates suggest because our
analysis has not allowed for any of the input substitution, innovation, production method
change, or new investment behaviour that industries would exhibit to avoid the cost of carbon
pricing. Moreover, the revenues from carbon pricing are assumed to be lost, rather than
recycled back into the economy for example through cuts in other taxes on inputs to
production.
The more progressively phased the carbon pricing regime is, the lower the impact is likely to
be as firms have time to adjust by investing in new equipment, re-tooling and re-skilling
workers and changing supply lines. However, an early strong signal would still be necessary
to convince investors of the need to develop low carbon energy efficient technologies (see
Aghion et al., 2014). Our estimates are therefore upper-bound and are likely to overstate the
true competitiveness impact of a carbon price at this rate.
We also find that industries which are heavily reliant on fossil fuel inputs, for example
primary and secondary energy producing industries would see their input costs increase by
more than 5 per cent on the application of a £20 carbon price (Figure 4). However, most of
these industries are not exposed to international trade. Combining cost increase estimates with
information about the trade openness of each industry reveals a small number of industries

33
accounting for around 2 per cent of GDP where competitiveness concerns may be
substantiated. Because they face international competition, the ability of these industries to
pass on cost increases to consumers is limited. They should therefore be the focus of policy-
makers interested in managing the competitiveness impacts of policies that price carbon. This
is especially true for sectors which trade outside the EU, where the differential in implicit and
explicit carbon pricing is likely to be highest. The sectors include:
• Manufacture of coke and refined petroleum products (SIC 19)
• Mining of coal and lignite (SIC 05)
• Manufacture of iron and steel (SIC 24.1-24.3)
• Manufacture of dyestuffs and agro-chemicals (SIC 20C).
• Cement (SIC 23.5)
• Other metals (SIC 24.5)
There is no precise cut-off in terms of what price change is large enough to induce firm
closure or relocation. In addition to the list above, sectors such as fertilisers, chemicals and
ceramics are also vulnerable to competitive pressures under these criteria. The cost
implications of pricing carbon emitted as part of the non-heat related industrial process may
further squeeze specific firms in these industrial categories. Policy support will therefore
likely be required for those sectors which are both carbon intensive and exposed to
international, and in particular, non-EU trade.
Electricity is not a significant cost component to carbon intensive tradable sectors at the 106
industry SIC classification level. This analysis therefore finds that the economic impact of the
carbon price floor—as currently applied—on UK industry is likely to be minimal, even if the
rate were allowed to double or triple over the next few years. However, the shadow price of
other policies such as recent renewable obligations may be higher. Overall, there is scope for
rationalising and levelling the UK policy landscape so that all sectors face a similar carbon
price (Advani et al., 2013), while increasing the average price level to send a strong signal to
consumers, producers, investors and innovators, without fear of undermining competitiveness.
UK policy-makers should continue to design greenhouse gas mitigation policy to allow
maximum scope for within-industry and economy-wide structural change, innovation and
low-carbon capital investment. Allowing for a flexible response by all industry will permit

34
maximum adaptation to a pollution-constrained marketplace and minimise the whole-
economy cost of doing so. This means using pricing instruments to cost greenhouse gas
emissions at the margin so that the cost of emitting is the same in all places and across all
production and consumption activities. It also allows scope for efficiency-enhancing recycling
of extra public revenues, for example through lower labour taxes or support for R&D.24
UK policy-makers should continue to develop supplementary policies to facilitate the
adjustment of the handful of industries that would face a significant cost increase as a result of
carbon pricing and which are heavily internationally traded. They might, for instance,
consider developing a trade adjustment policy for carbon pricing similar to the trade
adjustment policy the US and other countries use to facilitate labour market adjustments. For
example, the Trade Adjustment Assistance program in the US offers assistance to the
workers, firms, farmers and communities that are most affected by trade-related structural
change in key industries, through worker retraining and relocation assistance.25
The US policy recognises that trade-induced change in the structure of the labour market is
inevitable and ongoing. Japan also provides a good example of actively managing structural
change in industries that are in decline. From 1987, the government provided long-term
support to ease the decline of what it called “structurally depressed” industries, which
included textiles and ship-building. This support reallocated resources both within and outside
the depressed industries; provided financial assistance for firms to adjust; and mitigated
negative impacts on the labour force. The correct policy response is not to resist this change
but to identify vulnerable sectors and buffer labour market participants against its sharpest
effects.26 Countries and firms that resist enduring change and innovation may not be acting in
their long-term interests.27
Finally, as outlined in Bassi and Zenghelis (2014), UK policy makers should be more
proactive about offsetting the risk of relocation and decline in exposed industries as they
restructure away from fossil fuel inputs. In the absence of a global carbon price or (as a
24 See Bowen 2011 25 See Hornbeck (2013) and Baicker, and Rehavi (2004) 26 Peck, M.J., Levin, R.C., A. Goto (1987). Picking losers: public policy toward declining industries in Japan. Journal of Japanese Studies, 13(1). 79–123. Available at: http://www.jstor.org/discover/10.2307/132587?uid=3738032&uid=2134&uid=2&uid=70&uid=4&sid=21104582751683 27 Combes and Zenghelis, 2014.

35
second best option) border tax adjustments, short-term policies will be needed to level the
playing field for those UK industries most vulnerable to rising carbon prices. These can take
the form of lump sum transfers such as free emissions permits. Discounts on carbon pricing
would weaken the signal to reduce carbon emissions efficiently. However, Bassi and
Zenghelis note that such lump sum payments may still allow for relocation of production as
producers opt to ‘take the money and run’. To prevent this, the level of compensation should
be proportional to the level of domestic output and might take the form of compensation
through reductions in corporate or labour taxes.
7. References
Advani, A., Bassi, S., Bowen, A. Fankhauser S., Johnson P., Leicester A., Stoye G. (2013),
Energy use policies and carbon pricing in the UK. IFS and CCCEP Report. [pdf] Available
http://www.ifs.org.uk/comms/r84.pdf
Aghion, P., Hepburn, C., Teytelboym, A., and Zenghelis, D., (2014). Path-dependency,
innovation and the economics of climate change. New Climate Economy contributing paper.
Global Reporting Initiative, Amsterdam. Available at:
http://www.lse.ac.uk/GranthamInstitute/publication/path-dependence-innovation-and-the-
economics-of-climate-change/.
Aldy, J. E. & Pizer , W. A., (2009). The Competitiveness Impacts of Climate Change
Mitigation Policies, s.l.: Pew Center on Global Climate Change.
Ares, E, (2013). Carbon Price Floor. House of Commons Library Standard Note
SN/SC/5927. Science and Environment Section.
Audretsch, D., Hulsbeck, M. & Lehmann, E. E., (2010). Regional competitiveness, university
spillovers and entrepreneurial activity. Small Business Economics, 39(3), pp. 587-601.
Baicker, K. and Marit Rehavi, M., (2004). Policy Watch: Trade Adjustment Assistance. The
Journal of Economic Perspectives, Vol. 18, No. 2 (Spring), pp.239-255

36
Bassi, S., Dechezleprêtre, A., and Fankhauser, S., (2013). Impacts of climate change policies
on the UK business sector. Grantham Research Institute for Climate Change and the
Environment and Centre for Climate Change Economics and Policy, London School of
Economics and Political Science
Bassi, S., and Zenghelis, D., (2014) Burden or opportunity? How UK emission reduction
policies affect the competitiveness of businesses. Policy paper, June. Centre for Climate
Change Economics and Policy, Grantham Research Institute on Climate Change and the
Environment
Bataille, C., Dachis, B. & Rivers, N., (2009). Pricing Greenhouse Gas Emissions: The Impact
on Canada’s Competitiveness: C.D. How Institute Commentary on Economic Growth and
Innovation.
Bowen, A. (2011). The case for carbon pricing. Policy brief. London: Grantham Research
Institute on Climate Change and the Environment and Centre for Climate Change Economics
and Policy, London School of Economics and Political Science.
Bovenberg, A. L., and. De Mooij, R.A., (1994), Environmental levies and distortionary
taxation, The American Economic Review, 1085-1089.
Bovenberg, A. L. &. Goulder L. H., (1997). Costs of Environmentally Motivated Taxes in the
Presence of Other Taxes: General Equilibrium Analyses, National Tax Journal, Vol. 50, no. 1.
Carbon Trust (2013). Conversion Factors. [online]
Available at: http://www.carbontrust.com/media/18223/ctl153_conversion_factors.pdf
Combes, B., and Zenghelis, D., (2014) 'Tough Love' MacroPlus Comment, Llewellyn
Consulting, October. Available at: http://www.llewellyn-consulting.com/#!macroplus/c6zx
Department of Energy and Climate Change (2013). Prices of fuel by Manufacturing Sector.
[online] Available at: https://www.gov.uk/government/statistical-data-sets/prices-of-fuels-
purchased-by-manufacturing-industry

37
Dechezleprêtre, A and Sato, M., (2014). The competitiveness impacts of green policies.
Grantham Research Institute and GGGI Policy Brief. [online] Available at:
http://www.lse.ac.uk/GranthamInstitute/publication/the-impacts-of-environmental-
regulations-on-competitiveness/
Druckman, A., Bradley, P., Papathanasopoulou, E., & Jackson, T., (2008). Measuring
progress towards carbon reduction in the UK. Ecological Economics, 66(4), 594–604.
DUKES (2013). Chapter 5: Electricity. [online]
Available at: https://www.gov.uk/government/publications/electricity-chapter-5-digest-of-
united-kingdom-energy-statistics-dukes
EEF (2013). Climate change policy making UK energy prices uncompetitive. [online]
Available at: http://www.eef.org.uk/releases/uk/2011/Climate-change-policy-making-UK-
energy-prices-uncompetitive-.htm
Grubb, M. & Neuhoff, K., (2012). Emissions trading and competitiveness: allocations,
incentives and industrial competitiveness under the EU Emissions Trading Scheme. London:
Earthscan.
Goulder, L. H., (2013), Climate change policy’s interactions with the tax system, Energy
Economics 40, S1-S11.
Goulder, L. H. (2014), Climate-Change Policy’s Interactions with the Tax system,
Presentation for “Closing the Carbon Price Gap” Workshop, Berlin, Germany, May 22-23,
2014. [online] Available at: http://www.mcc-
berlin.net/fileadmin/data/presentations/Public_Finance_Workshop/Day_1/Session_1/Goulder
__Lawrence_-_Climate-Change_Policy_s_Interactions_with_the_Tax_System.pdf
Hornbeck, J. F., (2013). Trade Adjustment Assistance (TAA) and its Role in U.S. Trade
Policy, Congressional Research Service (January 9).R41922 .

38
Houser, T., Bradley, R., Childs, B., Werksman, J., & Heilmayr, R., (2008). Leveling the
carbon playing field: International competition and US climate policy design. Washington,
DC: Peterson Institute for International Economics & World Resources Institute.
Office for National Statistics, (2014). GDP deflators: March 2014 (Quarterly National
Accounts). [online] Available at: https://www.gov.uk/government/publications/gdp-deflators-
at-market-prices-and-money-gdp-march-2014-quarterly-national-accounts.
[Accessed 30 June 2014].
Office for National Statistics, (2013). The Pink Book 2013, Part 3: Geographical Breakdown.
[online] Available at: http://www.ons.gov.uk/ons/dcp171776_320035.pdf.
Osborne, G., (2011). Speech to Conservative Party Conference, Manchester. [online]
Available at: http://www.newstatesman.com/uk-politics/2011/10/britain-british-world-
business
Parry, I. Veung, C., and Heine, D., (2014), How Much Carbon Pricing in Countries’ Own
Interests? The Critical Role of Co-Benefits. Contributing paper to the Global Commission on
the Economy and Climate. Washington DC: IMF.
Porter, M. E., (1998). The Competitive Advantage of Nations. New York: Free Press.
Sato, M., Neuhoff, K., Graichen, V., Schumacher, K., & Matthes, F. (2014). Sectors under
scrutiny: Evaluation of indicators to assess the risk of carbon leakage in the UK and Germany.
Environmental and Resource Economics, 60(1), pp.99–124.
Stern Review (2006). Stern Review: The economics of climate change. London: HM treasury.
Turner, K., Yamano, N., Drukman, A., Ha, S., De Fance, J., McIntyre, S., & Munday, M.
(2011). An input-output carbon accounting too with carbon footprints estimates for the UK
and Scotland. Fraser of Allander economic commentary Special Edition: Energy and
Pollution.

39
UK Energy and Climate Change Select Committee twelfth report (2012): Consumption-based
emissions reporting. House of Commons twelfth report of session 2010-12. Available from:
http://www. publications.parliament.uk/pa/cm201012/cmselect/cmenergy/1646/164602.htm.
US Energy Information Agency (2014). Europe Brent Spot Price. [online]
Available at: http://www.eia.gov/dnav/pet/hist/LeafHandler.ashx?n=PET&s=RBRTE&f=M
Weber, C. L. & Peters, G. P., (2009). Climate change policy and international trade: Policy
considerations in the US. Energy Policy, Volume 37, pp. 432-440.
Wiedmann, T., Wood, R., Minx, J. C., Lenzen, M., Guan, D., & Harris, R., (2010). A carbon footprint time series of the UK – Results from a multi-regional input-output model. Economic Systems Research, 22(1), 19–42.
World Bank (2014). World Bank Data: United Kingdom. [online] Available at:
http://data.worldbank.org/country/united-kingdom

40
Appendix A: Minor explanations for differences between 2011 and 2003 estimates
• Industry classifications changed over time with different production activities being
subsumed under different headings. We had to group various industries in 2003 and in
2011 to make the basis for estimation comparable, and this accounts for a small amount of
the variation in the estimates themselves. For example, the fertilizers industry played an
important role in 2003 in transmitting the carbon price shock to the whole economy and
final consumer price changes. In the 2011 data this type of activity is grouped into
another industry, inorganic chemicals, and therefore carries different importance in
transmitting the carbon price shock in the 2011 study.
• The reference study used fertilisers in the estimation of the carbon price multiplier but that
industry was not used in the current study because its fossil fuel input reliance was
negligible in 2011.
• The reference study weighted output from electricity generation for oil by .05 and for gas
by .95. The current study assumes input from crude petroleum and natural gas into
electricity and gas manufacturing (SIC 35.1, 35.2-3) is constituted entirely by gas. This is
not unreasonable considering the share of oil used in electricity generation is minimal. In
2011, the share of oil used in electricity generation by power producers in the UK was
only 1 per cent compared to gas which was 34.3 per cent (DUKES, 2013). Other inputs
include renewables, nuclear etc. We further assumed that all other sectors (barring
electricity and gas manufacture) use only crude petroleum inputs. Under these simplifying
assumptions, the value of final demand for gas and oil at the whole economy level turns
out to be more or less equal; thus the whole economy price pass-through from increased
carbon prices applied to oil and gas turns out to be almost identical.

41
Appendix B: Derivation of carbon price multiplier
Fossil Fuel
Carbon content Fossil Fuel price
New FF price incl Carbon
Price Increase
kgCO2/KWh £/kWh £/kWh per cent
Estimated for 2011
Coal 0.33 0.010 0.017 62.73 Oil 0.27 0.048 0.053 11.06 Gas 0.19 0.021 0.025 17.74
Estimated for 2003
Coal 0.30 0.005 0.011 116.20 Oil 0.24 0.015 0.020 30.50 Gas 0.19 0.008 0.012 45.30
Note: the figures for the carbon content of fuels are slightly different across periods due to the different data sources used. These differences are not substantial and do not substantially affect the estimated change in impact across studies. The 2011 figures come from the Carbon Trust and the 2003 figures from www.gov.uk/statistics.

42
Appendix C: Key statistics for all UK industries, ranked by carbon intensity
SIC Industry (product) Production cost increase from carbon
intensity ( per cent
change at £20/tCO2e)
Energy as per cent of
total costs*
Compensation of employees as per cent of total
costs
Trade openness
score
Per cent total UK
output
19 Manufacture of coke and refined petroleum products 12.3
84.4 8.2 49.9 1.1
35.1 Electric power generation, transmission and distribution 11.0
72.5 6.4 1.2 2.5
35.2-3 Manufacture of gas; distribution of gaseous fuels through mains; steam and aircon supply 9.5
70.1 10.0 0.2 0.8
05 Mining of coal and lignite 5.9
27.5 27.0 73.8 0.0
20C Manufacture of dyestuffs, agro-chemicals - 20.12/20 4.4
33.0 15.7 76.9 0.1
24.4-5 Manufacture of other basic metals and casting 3.3
16.8 10.6 90.1 0.4
03 Fishing and aquaculture 3.2
27.5 6.9 55.5 0.0
24.1-3 Manufacture of basic iron and steel 3.2
20.9 13.6 67.9 0.3
23.5-6 Manufacture of cement, lime, plaster and articles of concrete, cement and plaster 2.2
15.0 19.0 6.6 0.3
20A Manufacture of industrial gases, inorganics and fertilisers (inorganic chemicals) - 20.11/13/15 2.0
15.2 14.7 60.8 0.1
51 Air Transport 1.9
15.7 21.9 53.2 0.6
23OTHER Manufacture of glass, refractory, clay, porcelain, ceramic, stone products - 23.1-4/7-9 1.7
14.7 25.2 37.9 0.2
17 Manufacture of paper and paper products 1.6
12.0 22.1 36.0 0.4
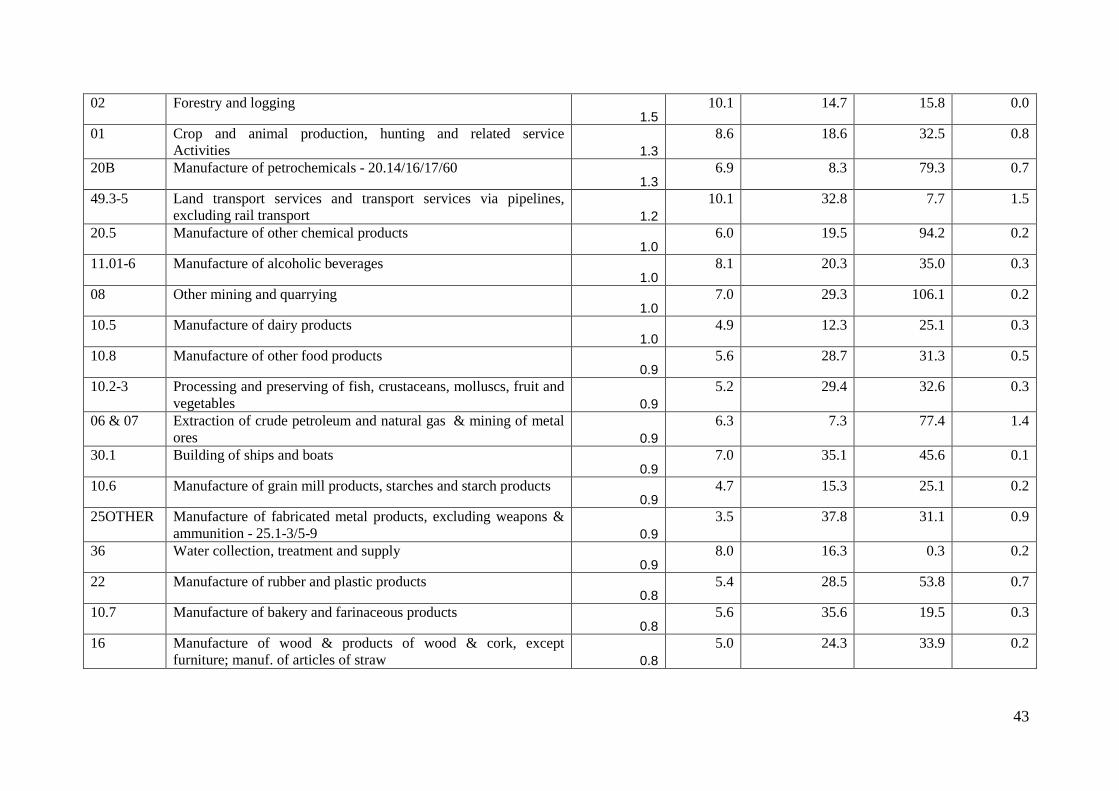
43
02 Forestry and logging 1.5
10.1 14.7 15.8 0.0
01 Crop and animal production, hunting and related service Activities 1.3
8.6 18.6 32.5 0.8
20B Manufacture of petrochemicals - 20.14/16/17/60 1.3
6.9 8.3 79.3 0.7
49.3-5 Land transport services and transport services via pipelines, excluding rail transport 1.2
10.1 32.8 7.7 1.5
20.5 Manufacture of other chemical products 1.0
6.0 19.5 94.2 0.2
11.01-6 Manufacture of alcoholic beverages 1.0
8.1 20.3 35.0 0.3
08 Other mining and quarrying 1.0
7.0 29.3 106.1 0.2
10.5 Manufacture of dairy products 1.0
4.9 12.3 25.1 0.3
10.8 Manufacture of other food products 0.9
5.6 28.7 31.3 0.5
10.2-3 Processing and preserving of fish, crustaceans, molluscs, fruit and vegetables 0.9
5.2 29.4 32.6 0.3
06 & 07 Extraction of crude petroleum and natural gas & mining of metal ores 0.9
6.3 7.3 77.4 1.4
30.1 Building of ships and boats 0.9
7.0 35.1 45.6 0.1
10.6 Manufacture of grain mill products, starches and starch products 0.9
4.7 15.3 25.1 0.2
25OTHER Manufacture of fabricated metal products, excluding weapons & ammunition - 25.1-3/5-9 0.9
3.5 37.8 31.1 0.9
36 Water collection, treatment and supply 0.9
8.0 16.3 0.3 0.2
22 Manufacture of rubber and plastic products 0.8
5.4 28.5 53.8 0.7
10.7 Manufacture of bakery and farinaceous products 0.8
5.6 35.6 19.5 0.3
16 Manufacture of wood & products of wood & cork, except furniture; manuf. of articles of straw 0.8
5.0 24.3 33.9 0.2
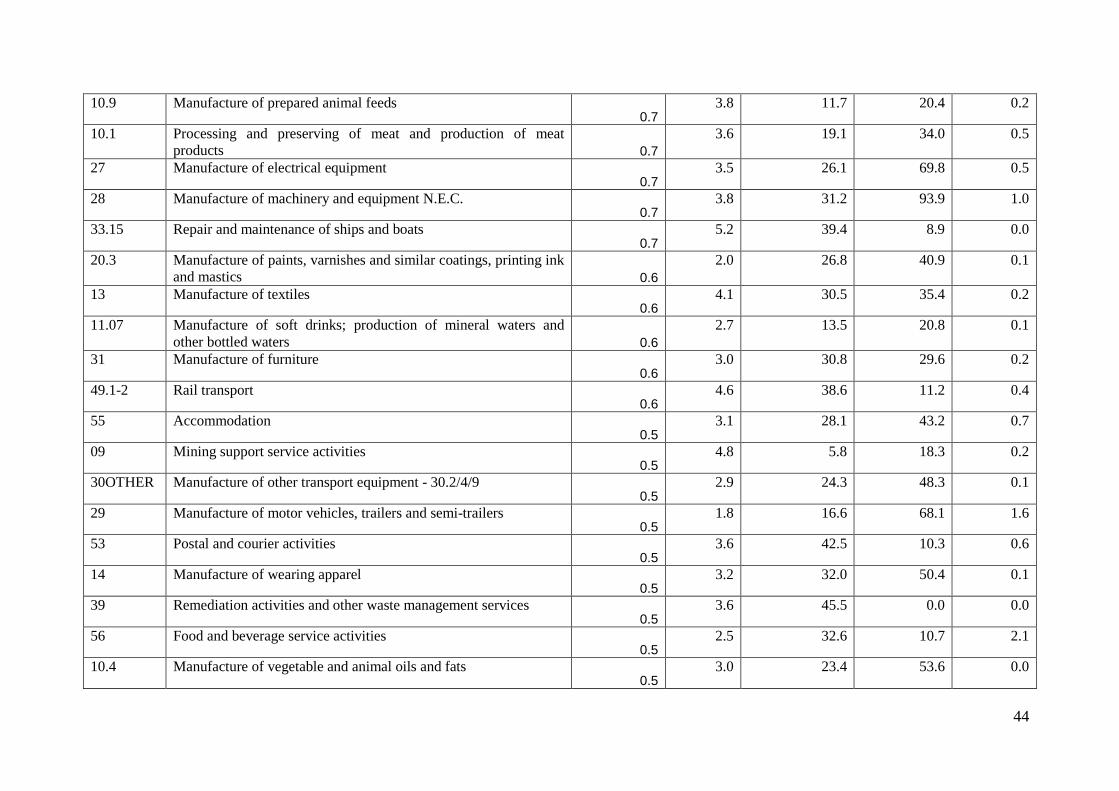
44
10.9 Manufacture of prepared animal feeds 0.7
3.8 11.7 20.4 0.2
10.1 Processing and preserving of meat and production of meat products 0.7
3.6 19.1 34.0 0.5
27 Manufacture of electrical equipment 0.7
3.5 26.1 69.8 0.5
28 Manufacture of machinery and equipment N.E.C. 0.7
3.8 31.2 93.9 1.0
33.15 Repair and maintenance of ships and boats 0.7
5.2 39.4 8.9 0.0
20.3 Manufacture of paints, varnishes and similar coatings, printing ink and mastics 0.6
2.0 26.8 40.9 0.1
13 Manufacture of textiles 0.6
4.1 30.5 35.4 0.2
11.07 Manufacture of soft drinks; production of mineral waters and other bottled waters 0.6
2.7 13.5 20.8 0.1
31 Manufacture of furniture 0.6
3.0 30.8 29.6 0.2
49.1-2 Rail transport 0.6
4.6 38.6 11.2 0.4
55 Accommodation 0.5
3.1 28.1 43.2 0.7
09 Mining support service activities 0.5
4.8 5.8 18.3 0.2
30OTHER Manufacture of other transport equipment - 30.2/4/9 0.5
2.9 24.3 48.3 0.1
29 Manufacture of motor vehicles, trailers and semi-trailers 0.5
1.8 16.6 68.1 1.6
53 Postal and courier activities 0.5
3.6 42.5 10.3 0.6
14 Manufacture of wearing apparel 0.5
3.2 32.0 50.4 0.1
39 Remediation activities and other waste management services 0.5
3.6 45.5 0.0 0.0
56 Food and beverage service activities 0.5
2.5 32.6 10.7 2.1
10.4 Manufacture of vegetable and animal oils and fats 0.5
3.0 23.4 53.6 0.0

45
50 Water Transport 0.5
3.1 23.6 65.4 0.5
18 Printing and reproduction of recorded media 0.5
2.0 30.4 0.7 0.4
46 Wholesale trade, except of motor vehicles and motorcycles 0.4
2.7 32.4 103.7 3.8
20.4 Manufacture of soap & detergents, cleaning & polishing, perfumes & toilet preparations 0.4
1.9 20.6 34.9 0.2
12 Manufacture of tobacco products 0.4
1.2 15.3 10.0 0.1
30.3 Manufacture of air and spacecraft and related machinery 0.4
1.9 21.6 105.3 0.7
25.4 Manufacture of weapons and ammunition 0.4
2.2 27.0 21.1 0.1
32 Other manufacturing 0.4
1.9 28.7 48.7 0.3
72 Scientific research and development 0.4
2.7 58.9 60.5 0.3
15 Manufacture of leather and related products 0.4
2.1 19.3 61.1 0.0
33OTHER Rest of repair; installation - 33.11-14/17/19/20 0.4
1.9 28.3 0.0 0.3
47 Retail Trade, except of motor vehicles and motorcycles 0.4
2.7 37.6 0.0 4.7
91 Libraries, archives, museums and other cultural activities 0.4
2.8 51.4 14.2 0.1
45 Wholesale and retail trade and repair of motor vehicles and motorcycles 0.3
2.0 39.5 0.8 1.6
93 Sports activities and amusement and recreation activities 0.3
2.2 29.7 6.9 0.5
26 Manufacture of computer, electronic and optical products 0.3
1.6 28.9 76.5 0.7
61 Telecommunications 0.3
2.0 27.2 17.8 1.7
84 Public administration and defence; compulsory social security 0.3
2.0 41.4 0.9 5.1
41, 42 & 43
Construction 0.3
0.9 21.7 1.2 7.4

46
77 Rental and leasing activities 0.2
1.8 32.5 8.4 0.7
90 Creative, arts and entertainment activities 0.2
1.8 33.0 70.2 0.2
87 & 88 Residential care & social work activities 0.2
1.3 36.7 0.0 2.3
52 Warehousing and support activities for transportation 0.2
1.2 32.8 13.4 1.4
37 Sewerage 0.2
1.6 25.1 0.0 0.2
38 Waste collection, treatment and disposal activities; materials recovery 0.2
0.8 21.4 41.7 0.7
66 Activities auxiliary to financial services and insurance activities 0.2
1.5 44.9 65.8 1.1
73 Advertising and market research 0.2
1.3 30.4 23.1 0.6
85 Education 0.2
1.5 67.7 2.7 4.2
33.16 Repair and maintenance of aircraft and spacecraft 0.2
1.0 27.0 18.3 0.1
58 Publishing activities 0.2
0.9 35.7 25.2 0.7
81 Services to buildings and landscape activities 0.2
1.1 26.7 1.5 0.5
21 Manufacture of basic pharmaceutical products and pharmaceutical preparations 0.2
1.3 23.7 81.9 0.8
71 Architectural and engineering activities; technical testing and analysis 0.2
1.2 41.2 18.7 1.5
86 Human health activities 0.2
1.2 42.9 1.5 5.1
96 Other personal service activities 0.2
1.2 27.6 1.9 0.5
79 Travel agency, tour operator and other reservation service and related activities 0.2
1.0 36.5 1.8 0.5
63 Information service activities 0.2
1.2 45.7 19.5 0.3
75 Veterinary activities 0.2
1.1 47.3 0.0 0.1

47
64 Financial service activities, except insurance and pension funding 0.2
0.9 28.2 29.8 4.9
59 & 60 Motion picture, video & TV programme production, sound recording & music publishing activities & programming and broadcasting activities 0.2
0.9 20.8 23.9 0.9
62 Computer programming, consultancy and related activities 0.2
1.1 45.1 12.9 2.0
78 Employment activities 0.2
1.0 34.7 14.2 1.0
74 Other professional, scientific and technical activities 0.2
1.0 35.8 66.0 0.5
94 Activities of membership organisations 0.2
1.0 51.3 0.0 0.4
95 Repair of computers and personal and household goods 0.1
1.0 51.8 28.2 0.1
80 Security and investigation activities 0.1
0.8 30.8 1.5 0.2
82 Office administrative, office support and other business support activities 0.1
0.8 32.7 68.2 1.1
92 Gambling and betting activities 0.1
0.8 21.3 5.0 0.5
69.2 Accounting, bookkeeping and auditing activities; tax consultancy 0.1
0.9 44.5 9.6 0.7
65.1-2 & 65.3
Insurance and reinsurance, except compulsory social security & Pension funding 0.1
0.5 11.3 24.9 2.4
70 Activities of head offices; management consultancy activities 0.1
0.5 34.6 11.9 1.1
68.2IMP Owner-occupiers' housing 0.1
0.7 0.0 0.0 5.2
69.1 Legal activities 0.1
0.5 31.7 14.9 1.0
68.1-2 Buying and selling, renting and operating of own or leased real estate, excluding imputed rent 0.1
0.2 10.9 1.7 2.2
68.3 Real estate activities on a fee or contract basis 0.0
0.1 29.6 1.8 0.3
97 Activities of households as employers of domestic personnel 0.0
0.0 93.5 0.7 0.2

48
Appendix D: Example of Input-Output data structure and content

49
Table 5: Industries’ intermediate consumption, 2011 (the ‘Combined Use’ or input-output matrix)
Industries' intermediate consumption £ million
SIC
01 02 03 … 95 96 97
Product
Agriculture Forestry Fishing … Computer repairs
Personal services
Domestic services
Total intermediate
demand 01 Agriculture 3166 101 0 … 0 0 0 16600 02 Forestry 0 442 0 … 0 0 0 711 03 Fishing 0 0 111 … 0 0 0 924 … … … … … … … … … 95 Computer repairs 1 0 0 … 31 12 0 2579 96 Other personal services 0 1 23 … 1 285 0 3691 97 Domestic services 0 0 0 … 0 0 0 0
Total intermediate consumption at purchasers' prices 14838 1067 962
… 1248 6231 0 1436183
Taxes less subsidies on production -2783 2 16 … 33 246 0 19489 Compensation of employees 4376 201 94 … 1817 4124 5558 820157
Gross operating surplus and mixed income 7142 96 294
… 413 4331 385 521279
Gross valued added at basic prices 8735 299 404 … 2263 8701 5943 1360925 Total output at basic prices 23573 1366 1366 … 3511 14932 5943 2797108