the condition of georgia's coastal waters: … summary.pdf · the condition of georgia's...
TRANSCRIPT

The Condition of Georgia's Coastal Waters Executive Summary
Sheldon and Alber 2010 ES-1
Executive Summary Georgia coastal waters are home to commercially and recreationally important species such as fish, shrimp, crabs and oysters as well as the smaller organisms on which they feed. They are also important areas for nutrient cycling and the treatment of waste and runoff. The condition of our coastal waters affects fishing and shellfishing as well as other human uses of the coast, such as boating and swimming. The Coastal Resources Division (CRD) of the Georgia Dept. of Natural Resources (GA DNR) collects water quality data in support of a variety of programs. These programs measure different water quality and resource parameters in order to meet diverse goals, and data from them had not previously been integrated or analyzed in a common framework. The data also had not been evaluated with the goal of identifying those measurements that might be useful indicators of the status of Georgia coastal waters. This project was designed to compile coastal water quality data collected by GA DNR CRD into an integrated database and to identify an appropriate suite of indicator parameters for Georgia waters.
The technical report that follows consists of seven main sections. Section 1 provides a background on water quality; Section 2 is a summary of the CRD data sets and a description of the database; Section 3 presents maps of the CRD data along with an analysis of temporal and spatial trends; Section 4 describes correlations among the measured parameters; Section 5 provides the rationale and criteria for the indicators that have been developed for Georgia coastal waters; Section 6 provides initial information on the status of Georgia waters with respect to these indicators; and Section 7 provides recommendations for improving the CRD monitoring programs in the future. Each of these sections is summarized below.
Section 1: Introduction Increasing nutrient input is a prime concern for coastal systems worldwide. Excess inputs of nitrogen and phosphorus can lead to eutrophication, which is the accelerated production of organic matter and the potential development of areas of low dissolved oxygen concentration (hypoxia). The consequences of hypoxia can include death of benthic organisms, fish kills, reduced growth and reproduction, physiologic stress, forced migration, reduction of spawning grounds and nursery habitats, increased vulnerability to predation, and disruption of life cycles. Other symptoms of eutrophication include the stimulation of nuisance and toxic algal blooms, increases in turbidity, losses of submerged aquatic vegetation, and changes in the food web.
There have been several national-level efforts to assess the status of U.S. coastal waters. The National Estuarine Eutrophication Assessments (NEEA, NOAA) found that approximately two-thirds of the U.S. estuaries for which data were available exhibited moderate to high expressions of eutrophic conditions, with most estuaries being highly influenced by human-related activities. Georgia estuaries included in these studies rated low to moderate in eutrophic conditions, but the criteria were not always appropriate (e.g. the status of sea grass is irrelevant because sea grasses are not found in Georgia waters). The National Coastal Condition Reports (NCCR, led by U.S. EPA) have consistently rated water quality in continental U.S. estuaries as “fair” overall, while the southeast as a whole has been rated on the high side of “fair”. Assessments for individual states are not generally provided, but a report by GA DNR CRD using data collected for the U.S. EPA National Coastal Assessment program classified 80% of Georgia estuarine waters as having “fair” water quality, 18% as “poor”, and only 1% as “good” based on the NCCR indicators.
Two pathways to eutrophication have been suggested to exist in Georgia waters. In the classic pathway, nutrients stimulate phytoplankton growth. As this material gets consumed or dies, it sinks to the bottom where it is decomposed by microbes. The decomposition process uses up oxygen via respiration; hence, enhanced decomposition can result in a reduction of the oxygen concentrations in bottom water. In the alternate pathway, excess nutrients stimulate microbial respiration directly, resulting in low dissolved oxygen throughout a well-mixed water column.

Executive Summary The Condition of Georgia's Coastal Waters
ES-2 Sheldon and Alber 2010
One of the goals of this project was to identify a suite of water quality indicators for use by GA DNR CRD that are relevant to Georgia habitats, are sensitive to change, are well-correlated with status, and are readily measured. This evaluation will also inform efforts to establish numeric nutrient water quality standards for Georgia waters, as required by the U.S. EPA.
Section 2: Water Quality Data Used in This Report Data collected by four GA DNR CRD water quality monitoring programs (Shellfish Sanitation, Sounds, Rivers, and Beaches) were analyzed in this report. These programs have been in existence for varying amounts of time, have sampled in different locations, and have measured different water parameters, including physical characteristics (temperature, salinity, specific conductance, pH, turbidity), dissolved oxygen, nutrients (ammonia, nitrite, nitrate, orthophosphate, total dissolved phosphorus, silicate) and fecal bacteria (fecal coliforms, Enterococcus).
Data from all four programs were compiled into a common SQL Server database. The database tables and schema were designed with a goal of flexible querying across all four sampling programs while retaining as much detail as possible about the program affiliation, the identification of the analytical laboratory, and the methodology associated with each observation. The database can be readily updated to incorporate additional water quality observations.
The database currently includes records from January 1998 through April 2009 and represents 185 sites (Figure 1) and 15,941 sampling events. A summary of the data that were provided for the database is in Figure 2.
Section 3: Descriptive Statistics and Trends
Descriptive Statistics Each parameter was evaluated in terms of the annual minimum, maximum, and a measure of central tendency. Geometric means were used for fecal coliforms and enterococci whereas medians were used for all other parameters. Criteria were established to ensure that only sites and years with an adequate number of appropriately-distributed observations were included in the analysis. This section of the technical report contains data range maps and discussions of data characteristics for all 14 parameters measured by CRD. A sitewise annual median value represents the mid-point of all the observations at a particular site in a particular year. An annual spatial median value represents the mid-point of the sitewise median values for a given year, which provides information on the typical value over all sampling sites for that year (although these results are somewhat affected by sampling sites being introduced or discontinued during the study period (see Figure 2)).
Figure 1. Sites monitored by four water quality monitoring programs conducted by GA DNR CRD.

The Condition of Georgia's Coastal Waters Executive Summary
Sheldon and Alber 2010 ES-3
Parameterfecal coliformsalinity, temperaturesalinity, temperaturesalinity, temperaturesalinity, temperatureDO, spec. conductanceDO, spec. conductanceDO, spec. conductanceDO, spec. conductanceNH3, NO2, NO3, PO4, SiO2
NH3, NO2, NO3, PO4, SiO2NH3, NO2, NO3, PO4, SiO2
TDPTDPTDPpHpHpHpHenterococcusturbidity
Droughts
Program: Shellfish Sound River Beach
2001200019991998 2005200420032002 09200820072006
Figure 2. Sampling periods included in the database for most sites monitored by GA DNR CRD as part of the Shellfish (blue), Sound (green), River (yellow), and Beach (red) water quality monitoring programs. DO=dissolved oxygen, NH3=ammonia-nitrogen, NO2=nitrite-nitrogen, NO3=nitrate-nitrogen, PO4=orthophosphate-phosphorus, TDP=total dissolved phosphorus, SiO2=dissolved silicate.
Table 1. Lowest and highest annual coastwide median values of each parameter over the study period. Fecal coliforms are measured only at Shellfish sites; enterococci and turbidity are measured only at Beach sites. See Figure 2 for the sampling period of each parameter.
Parameter Units Min Annual Median
Max Annual Median
water temperature °C 20.7 23.4 salinity PSU 21.7 30.5 specific conductance mS cm-1 33.7 46.9 pH 7.6 7.7 dissolved oxygen mg L-1 4.5 6.8 turbidity NTU 35 55 silicate mg SiO2 L-1 3 4 ammonia µg N L-1 33 40 nitrite µg N L-1 4 5 nitrate µg N L-1 5 33 dissolved inorganic nitrogen µg N L-1 54 109 orthophosphate µg P L-1 24 37 total dissolved phosphorus µg P L-1 28 48 fecal coliform MPN 100mL-1 3 11 enterococci CFU 100mL-1 5 8

Executive Summary The Condition of Georgia's Coastal Waters
ES-4 Sheldon and Alber 2010
Table 1 summarizes the minimum and maximum of the annual spatial median values for each parameter in the database, thus providing an indication of the range of typical values observed coastwide over all years. Annual spatial median temperatures ranged from 20.7 °C in 2005 to 23.4 °C in 2002 (the end of a drought). Salinities were higher during the drought (1998-2002) with a peak spatial median of 30.5 in 2000, and decreased considerably after the heavy rains in 2003 (spatial median 21.7). Specific conductance, which is used to calculate salinity, showed the same pattern. Dissolved oxygen was also lowest in 2003 (spatial median 4.5 mg L-1), but it was highest in 2006 (6.8 mg L-1). The spatial medians of all the other parameters were fairly consistent from year to year. In the cases of nutrients, turbidity, and fecal bacteria, observed values were low at most sites most of the time with occasional spikes, which results in low median values.
Spatial Patterns Some parameters maintained consistent spatial patterns that were related to habitat characteristics. Salinities observed across the sampling sites ranged from near 0 in the freshwater portions of rivers to near oceanic salinity (>30) in the lower estuaries and beaches. pH also varied widely, with low values in the blackwater river sites (often <6.5) and highest values at beach sites (near 8). Dissolved oxygen also tended to be consistently lower in blackwater systems, although low values were sometimes found in other habitat types as well. Silicate and nitrate concentrations tended to be higher in river sites, whereas orthophosphate and total dissolved phosphorus were higher in some sounds. Enterococci and turbidity concentrations (measured only at beach sites) were consistently higher at some St. Simons and Jekyll Island beaches. Temperature showed little spatial variation at any given time, while ammonia, nitrite, and fecal coliforms were low at most sites most of the time.
Seasonal Variability A number of parameters exhibited significant variability over annual cycles. Temperature showed strong annual seasonality, as would be expected (high in summer and low in winter). Salinity had a mild and inconsistent seasonal cycle with lower values in October – April due to increased runoff. Dissolved oxygen had a pronounced seasonal cycle, with lowest concentrations in summer. All nutrients exhibited seasonal trends, but the patterns were inconsistent from year to year.
Temporal Trends After seasonality was accounted for, most sites did not show significant changes over time for most parameters, and sites that did show changes for a given parameter were not necessarily the same as those that were significant for other factors. However, there was evidence for some shorter-term trends that appear to be linked to patterns of freshwater input. These could be divided into two time periods during which sites exhibited similar directions and rates of change in parameter values: an early period (generally 2000-2006) and a later period (generally 2004-2009). During the early period, salinity and temperature decreased significantly at several sites; many sites showed decreases in nitrate with a few also showing decreases in other forms of nitrogen (ammonia and nitrite); and many sites showed significant increases in dissolved oxygen. These changes occurred over a period in which the weather shifted from a severe drought (which extended from 1998-2002) to several wet years (particularly 2003 and 2005), and some of the observed trends (e.g. increasing rainfall, decreasing salinity, and decreasing temperature) are consistent with these events.
Observations in 2004-2009 were limited to beach stations and so fewer sites and fewer parameters were included in the analysis (e.g. no nutrients were measured). Over this latter period there were significant increases in salinity, turbidity, and pH, and decreases in dissolved oxygen and Enterococcus concentrations. (Again, these changes were not necessarily at the same sites.) The observed changes in Enterococcus abundances may be due to changes in processing laboratories. Other changes may again be related to the weather during this period, which followed the opposite pattern of the early period as it began with wetter years and ended in a drought (2006-2009).
The Condition of Georgia's Coastal Waters Executive Summary
Sheldon and Alber 2010 ES-5
These trends are not necessarily indicative of long-term patterns. The length of most of the datasets included in this analysis (approx. 7 y) is close to the length of known climatological cycles such as ENSO. In addition, the weather during this period was extreme relative to historical records, with severe droughts in 1998-2002 and 2006-2009 and extremely wet weather in 2003 and, to a lesser extent, 2005. It will therefore take additional years of data before interannual variability can be separated from any underlying, longer-term trends.
Section 4: Correlations among Parameters Correlations among all parameters in the database were investigated, generally with linear regression techniques. Data were evaluated to determine whether there were correlations across all programs as well as by individual site types (e.g. Shellfish vs. River/Sound sites). The analysis first evaluated expected correlations among parameters. Departures from these expectations can help to diagnose potential instrumentation and methodological problems, or to indicate when biological processes may be changing concentrations from what would be predicted based on strictly physical or chemical processes. The second portion of the analysis was a broader exploration of various combinations of parameters that could be used to describe coastwide patterns. This involved analyses of nutrients, salinity and temperature; factors that may interact with dissolved oxygen; and other parameters, such as pH and fecal coliform. This section also includes a summary of earlier analyses of the relationship between enterococcus and environmental parameters.
Methodological Problems The analysis of expected relationships pointed to two errors that suggest methodological problems. First, salinity is calculated from conductivity and temperature; therefore, the relationship between salinity and specific conductance (conductivity normalized to 25 °C) should be well defined. Frequent disagreements of more than 0.4 PSU between salinity calculated from specific conductance and reported salinity indicate a potential problem with the instruments used to measure these parameters. Second, although orthophosphate is a component of total dissolved phosphorus, reported concentrations of orthophosphate were often greater than total dissolved phosphorus. This indicates a problem in one or both methods.
pH and Salinity pH varies with salinity along the length of an estuary. In Georgia estuaries, pH had a log-linear relationship with salinity, with different relationships for different estuary types. Blackwater systems, represented by the Satilla River, St. Andrew Sound, St. Marys River, and Cumberland Sound, have low pH in low-salinity waters. Alkaline blackwater systems, represented by the Ogeechee River and Ossabaw Sound, are influenced by both blackwater and carbonate-rich water, and the low-salinity areas of these systems have slightly higher pH than blackwater systems. Alluvial and tidewater systems (all other sites) have near-neutral pH in low-salinity waters.
Dissolved Oxygen Saturation The amount of oxygen that will dissolve in water (the saturation level) varies in a predictable way in response to changes in temperature, pressure and salinity. Changes that deviate from this expected concentration may be attributed to biological or chemical processes, such as photosynthesis and respiration. Dissolved oxygen concentrations were generally undersaturated, which implies that respiration is probably drawing the oxygen down at most stations. Oxygen was farther below saturation at warmer temperatures, suggesting that this biological activity is increased at warmer temperatures. The most undersaturated observations were primarily at River sites, whereas supersaturated observations tended to occur at beach sites where entrainment of air in breaking waves is likely. Dissolved oxygen is known to change in predictable ways to both temperature and salinity, which can be accounted for by calculating percent oxygen saturation. A comparison of percent saturation with DO concentration showed that concentrations are generally undersaturated, which means they are lower than would be expected due

Executive Summary The Condition of Georgia's Coastal Waters
ES-6 Sheldon and Alber 2010
to temperature and salinity alone. This is likely a consequence of biological activity. Decreased saturation was also observed at warmer temperatures, which again supports the notion that this may be due to biological activity. Undersaturated values were primarily at river sites, whereas supersaturated observations tended to occur at beach sites.
Nutrients, Salinity, and Temperature The individual components of dissolved inorganic nitrogen (ammonia, nitrite, and nitrate) were not well-correlated with each other, and the only notable correlation among concurrent measurements of nitrogen, phosphorus, and silicates was between silicate and nitrate. This general lack of correspondence suggests that the nutrients are being produced, interconverted, or consumed by independent processes rather than a balanced delivery of all components through one process such as streamflow. The exceptions, nitrate and silicate, are both highest at river sites and probably are being delivered by streamflow.
Temperature and salinity were correlated, with higher salinities during the hottest summers and lower salinities during cooler (and rainier) times. Temperature, salinity, or both were often weakly correlated with dissolved nutrient concentrations. Silicate and nitrate, as noted above, decreased with increasing salinity, while orthophosphate and total dissolved phosphorus increased slightly with salinity and temperature. Nitrite concentrations peak in mid-salinity waters, which is unusual and suggests that patterns of nitrogen dynamics in Georgia estuaries may be different from what is observed in most other places. Temperature was positively related to both ammonia and nitrite concentrations at all site types, suggesting increased production in warmer water. However, some temperature relationships were different between shellfish and river/sound sites. At shellfish sites, silicate and nitrate were lower at lower temperatures, which may be attributable to uptake by benthic diatoms in shellfish beds in winter. At river/sound sites, silicate was higher at lower temperatures, and nitrate showed no trend with temperature.
Dissolved Oxygen, Salinity, and Nutrients Temporal patterns in nutrients and dissolved oxygen appear to be linked to patterns of freshwater input. Nutrient concentrations generally rose in late 2002 as the drought broke, then fell in 2003 (a wet year), at which time there was a pronounced decline in dissolved oxygen to <4 mg L-1 for many sites. However, correlations between dissolved oxygen and the different nutrients did not yield consistent relationships, and a detailed analysis of a subset of sites with consistent sampling timeframes did not reveal evidence for strong lagged relationships between times of lower salinities or higher nutrients and subsequent low dissolved oxygen. This may be due to the short timeframe of the data: it would be necessary to study multiple episodes of drought followed by wet years to establish such a pattern. Moreover, the best (albeit weak) relationships between ammonia, orthophosphate, and total dissolved phosphorus and subsequent dissolved oxygen involved lags of 11 months, which is much longer than would be expected from water column processes.
pH Low pH observations (<6) corresponded to slightly elevated nitrite concentrations and decreases in both dissolved oxygen and nitrate. These observations are all upstream samples in the blackwater streams and suggest a difference in nitrogen dynamics in blackwater vs. neutral-pH streams.
Bacterial Parameters The only notable correlations with fecal coliform abundance at shellfish sites were a slight negative correlation with salinity, which corroborates the idea that fecal coliforms in estuarine waters are usually derived from watershed sources, and a slight positive correlation with ammonia, which probably indicates a common source in runoff. A more detailed study of Enterococcus abundance and environmental factors was confounded by a change in processing labs that occurred in 2006 at the beginning of a drought, making interpretation of results difficult. Nevertheless, connections with freshwater delivery conditions were fairly consistent across all beach sites, indicating tendencies toward higher Enterococcus

The Condition of Georgia's Coastal Waters Executive Summary
Sheldon and Alber 2010 ES-7
abundances with recent rainfall, higher streamflow, and higher Palmer Z Drought Index. This was supported by negative correlations with salinity at about half the sites. Further evaluation of this mechanism may be fruitful once more samples from normal and wet years are processed using the current lab. These analyses showed that tidal parameters are also important. Enterococcus abundances tended to be higher on ebb tides and on high spring tides. This suggests that a program that samples without regard to tide stage may miss events that may be important for public health.
Section 5: Recommended Indicators of Estuarine Water Quality in Georgia Ideal water quality indicators are parameters that are sensitive to change, are well-correlated with status, and are readily measured. The suite of seven indicators proposed in this report includes some new recommended parameters as well as several that are already being measured. Taken together, they are intended to help classify and understand the causes of water quality degradation in Georgia. At this time, the suite does not include measurements made to evaluate human uses of water bodies (i.e. for recreation, fishing, and shellfishing) because those indicators, which are aimed at protecting human health, are generally mandated separately by State and federal agencies.
Several recent national and regional studies were taken into consideration when selecting these water quality indicators, including the National Estuarine Eutrophication Assessments (NEEA, NOAA), the National Coastal Condition Reports (NCCR, EPA), the South Carolina Estuarine and Coastal Assessment Program (SCECAP), and the recommendations of the Nutrients Workgroup of the National Water Quality Monitoring Council. The U.S. EPA guidelines for developing numeric nutrient criteria were also considered. They suggest the measurement of total nitrogen, total phosphorus, chlorophyll a, and transparency, with the addition of dissolved oxygen in systems that have already experienced hypoxia. While there may be some latitude in the choice of indicators used in individual states, the use of indicators preferred by the U.S. EPA would facilitate regional and national comparisons.
The seven recommended indicators of water quality for Georgia estuaries are pH, dissolved oxygen, total dissolved nitrogen, total dissolved phosphorus, chlorophyll a, transparency, and biochemical oxygen demand (BOD), along with some basic ancillary data (water temperature, salinity, specific conductance). pH and dissolved oxygen may be considered “immediate” indicators of poor water quality in that they may indicate that a stressful and potentially lethal condition is already in progress. Furthermore, a single episode of hypoxia/anoxia or pH outside the normal range may do lasting damage to the biotic community. The remaining indicators are “early warning” indicators of potentially poor water quality that should be measured in order to anticipate problems and make appropriate management decisions. These indicators, which cover the progression of eutrophication from nutrient over-enrichment to algal overgrowth (if present) to enhanced microbial respiration and hypoxia, will help to ensure that problems will not be missed entirely due to limited sampling frequencies. While most of these tend to lead to problems only if they are chronically outside the desirable range, there could be circumstances where an individual extreme episode could lead to lasting damage. Specific recommendations for the criteria to be used for each of the seven indicators are summarized in Table 2.
This section discusses the rationale for choosing each water quality indicator, the considerations for developing evaluation criteria, and recommendations for classifying observations as good, fair, and poor.
pH The pH criteria were based on an examination of the relationships between pH and salinity for three types of estuaries: blackwater, alkaline blackwater, and alluvial and tidewater (see above). Deviations of greater than 0.5 or 1 unit from these relationships are considered fair or poor, respectively, based on literature reports suggesting that decreases from normal pH of 0.5 units or less appear to be tolerated well by most organisms, whereas a decrease of 0.5-1 units or more can result in stress responses and more serious deleterious effects. Both the annual minimum and the annual median values should be compared to these

Executive Summary The Condition of Georgia's Coastal Waters
ES-8 Sheldon and Alber 2010
criteria in order to assess both acute episodic and chronic conditions. These criteria may be refined as new information becomes available.
Dissolved Oxygen Low dissolved oxygen concentrations can result in reduced growth of organisms, disruption of life cycles, migration to avoid poor conditions, and even death. Dissolved oxygen is used as an indicator in most water quality studies and is suggested by EPA as an additional primary response variable in systems that have already experienced hypoxia. An EPA study derived a value of 2.3 mg L-1 as the limit of survival of juvenile and adult fish, crustaceans, and bivalves in coastal waters of the Virginian province, and 4.8 mg L-1 as the chronic protective value for growth. These are close to the criteria of 2 and 5 mg L-1 used to define the “fair/poor” and “good/fair” boundaries in the NEEA and NCCR reports. However, the present study revealed some confusion in the literature over the units used to describe oxygen concentrations; the criterion for hypoxia of 2 mL O2 L-1 (as originally defined) is actually equivalent to approximately 2.85 mg O2 L-1. The criteria proposed here take these observations into account by suggesting slightly higher criteria than were used in the other studies: 3 and 5.5 mg L-1 as the “fair/poor” and “good/fair” boundaries. These criteria align with those identified in literature reviews as being protective of most taxonomic groups, and they reflect the fact that CRD samples surface waters during the day whereas lowest dissolved oxygen tends to occur in bottom waters and early in the day. Both the annual minimum and the annual median values should be used to assess both acute episodic and chronic conditions.
Table 2. Proposed indicators, criteria, metrics, and ancillary data for assessing the general quality of Georgia coastal and estuarine waters. TBD = to be determined.
Indicator Units Good Fair Poor Metric pH: 3 system types: Alluvial & Tidewater Blackwater Alkaline Blackwater
pH unit deviation from established relationship between pH and salinity for system type
<0.5 0.5 - 1 >1 Annual minimumAnnual median
Dissolved oxygen (surface, daytime) mg L-1 >5.5 3 – 5.5 <3 Annual minimum
Annual median Total dissolved nitrogen mg L-1 <0.1 0.1 - 1.0 >1.0 Annual median
Total dissolved phosphorus mg L-1 <0.01 0.01 - 0.1 >0.1 Annual median
Chlorophyll a µg L-1 <5 5 - 20 >20 Annual maximumAnnual median
Transparency A: % transmission at 1mB: Secchi depth (m)
A: >10 B: >0.5or TBD
A: 5 - 10 B: 0.3 - 0.5or TBD
A: <5 B: <0.3 or TBD
Annual median
Biochemical oxygen demand mg L-1 TBD TBD TBD Annual median
Ancillary Data Salinity PSU Specific Conductance mS cm-1 Temperature °C

The Condition of Georgia's Coastal Waters Executive Summary
Sheldon and Alber 2010 ES-9
Nitrogen and Phosphorus Virtually all coastal water quality studies recommend measuring at least some fractions of both the nitrogen and phosphorus pools. Inorganic nutrients can cause eutrophication through stimulation of algal blooms, but studies in Georgia have shown that organic nutrients can directly stimulate bacteria. Measurements of total nitrogen and total phosphorus (dissolved + particulate) are recommended by both the U.S. EPA and the National Water Quality Monitoring Council, whereas two recent panels have recommended measuring total dissolved nitrogen and total dissolved phosphorus. This report suggests that total dissolved nitrogen and phosphorus are the single most important components of the nitrogen and phosphorus pools to measure, but it also recommends collecting data on particulate fractions and calculating total nitrogen and phosphorus for comparison with national standards. Analysis of the dissolved inorganic vs. dissolved organic fractions would also aid in interpretation of potential causes of eutrophication, so limited collection or archiving of samples for these analyses is also suggested. Until more localized criteria can be developed, the report recommends using the NEEA criteria for total dissolved nitrogen and total dissolved phosphorus in Georgia coastal waters (Table 2). Since chronically high nutrients are generally the larger concern, the annual median values should be evaluated against the criteria as general indicators of water quality.
Chlorophyll a Excess algal biomass (indicated by high chlorophyll concentrations) is the most obvious symptom of classic eutrophication, and it frequently leads to other problems. Chlorophyll a is on the EPA list of core parameters and was used in every national and regional survey of water quality that was examined. Although it is not currently measured by CRD, it will likely be required for compliance with national programs, and the addition of chlorophyll is highly recommended. Furthermore, if a harmful algal bloom is suspected, additional sampling and analysis should be undertaken to identify the causal organism. The NEEA criteria of 5 and 20 µg L-1 are currently recommended to evaluate chlorophyll data until a more detailed analysis of Georgia data can be undertaken. The annual median is recommended for comparison against these criteria as an indicator of chronic problems, but the annual maximum value should also be evaluated since it is possible that a single bloom could cause symptoms severe enough to cause lasting damage.
Transparency It is usually desirable to measure some aspect of water clarity as an indicator of light availability for photosynthesis by phytoplankton. Water clarity can be measured in several ways: CRD and SCECAP currently measure turbidity, whereas most national studies have measured transparency. There are no general relationships between turbidity and measurements of transparency so it is hard to compare turbidity observations with transparency criteria established in the national reports. Given that some measure of water clarity will likely be required by national standards, the report recommends switching to a measure of transparency such as % transmission of photosynthetically active radiation or Secchi depth. If CRD does make this switch, the report recommends that they continue to measure nephelometric turbidity along with the new method at all sites for at least several months in order to establish correlations that are relevant for Georgia coastal waters. The recommended criteria for light transmission are those established by the NCCR for states that do not expect to support submerged aquatic vegetation, as these were developed for the naturally high turbidity of southeastern U.S. estuaries. These are expressed as % light transmission but have also been converted to Secchi depth using standard relationships. The annual median values are recommended to be compared against these criteria as general indicators of water quality.
Biochemical Oxygen Demand While not included in many indicator suites, the addition of biochemical oxygen demand would be uniquely useful in Georgia because of the potential for non-photosynthetic pathways to eutrophication.

Executive Summary The Condition of Georgia's Coastal Waters
ES-10 Sheldon and Alber 2010
This parameter provides information on the potential for microbial respiration to break down the organic material present in the water, which can lead to low dissolved oxygen and is a suggested cause of hypoxia in coastal Georgia waters. Although there is well-developed guidance in wastewater management applications for permissible loads of oxygen-consuming substances to receiving waters, there are no clear guidelines or standards for concentrations in coastal waters. The report suggests that an analysis be undertaken to relate the biochemical oxygen demand during a 5-day incubation to subsequent observations of dissolved oxygen minima in the estuaries to use as guidance for establishing criteria for this parameter. Once again, comparisons of annual median values with criteria are recommended as general indicators of water quality.
Ancillary Data Measurements of salinity, specific conductance, and temperature are also required for interpreting the other parameters. Salinity is a general descriptor of coastal habitats, and it is also a reflection of freshwater input to the site. Salinity can also interfere with some analyses and therefore must be measured as part of a correction factor. Specific conductance is generally redundant with salinity as environmental data, but it should be included as part of the data collection because it is part of the instrument readout (no additional effort), and the relationship between salinity and specific conductance can be a good check on instrument calibration. Temperature is likewise an important habitat characteristic, an index of seasonality, and an important moderator of the rates of estuarine processes. It is also part of the normal instrument readout and a necessary factor, along with conductivity, in the calculation of salinity. These parameters are not generally evaluated as being “good” or “poor” unless they are well outside their normal ranges of variability, and they are not generally regulated.
Section 6: Water Quality Status of Georgia Estuaries and Coastal Waters Insofar as possible, the water quality data collected by GA DNR CRD were used to assess the status of Georgia estuaries and coastal waters according to the criteria recommended in the Indicators section. The report includes assessments of the status of pH, dissolved oxygen, and total dissolved phosphorus. Nitrogen status was assessed using dissolved inorganic nitrogen compared to criteria derived assuming that dissolved inorganic nitrogen is a constant fraction of total dissolved nitrogen. There were no data to assess chlorophyll a and biochemical oxygen demand, and the turbidity data collected by CRD are not directly relatable to the recommended transparency criteria.
Status evaluations are based on calendar years using criteria to ensure sufficient sampling frequency and distribution. The discussion below focuses primarily on 2003 and 2006. 2003, which was characterized by high rainfall after a drought, was the first year when there were enough observations for most parameters to classify their status. 2006 is the most recent year with data available from all programs. However, the report includes annual status maps of each parameter for all years when data were sufficient.
pH pH status was assessed using ΔpH, the deviation from the expected pH according to the relationships developed based on sample salinity and estuary type (see Indicators section). Data were sufficient for pH characterization of sites in the River, Shellfish and Sound programs from 2004 through 2006, and for the Beach program from 2005 through 2008. pH status based on annual median pH deviations was good at all sites in all years except for two sites in 2006 (Figure 3). In contrast, annual minimum pH deviations often ranged into the fair and poor categories. During 2004 ten sites, mostly in the Ogeechee and St. Marys rivers, were classified as poor in terms of their minimum pH. pH conditions were generally better coastwide in 2006, with no sites classified as poor (Figure 3).

The Condition of Georgia's Coastal Waters Executive Summary
Sheldon and Alber 2010 ES-11
Dissolved Oxygen Sufficient data for dissolved oxygen were available to characterize the status of sites in the River, Shellfish and Sound programs from 2000 to 2006 and for the Beach program from 2004 to 2008. Annual median dissolved oxygen was generally good to fair, with no sites having poor annual median dissolved oxygen in any year. Median dissolved oxygen was markedly poorer coastwide in 2003 than in other years, with only 13 sites (out of 125) classified as good (Figure 4). These were mostly in Altamaha and Doboy sounds. Median dissolved oxygen was considerably better in 2006 than in other years, with all but three sites classified as good (and these three sites had dissolved oxygen concentrations at the upper end of the fair range). Annual minimum dissolved oxygen was generally fair to poor. Sites classified as poor were not consistently concentrated in specific locations, but rather occurred sporadically along the coast. Minimum dissolved oxygen was markedly poorer in 2003 than in other years, with 65% (81 of 125) of the
Figure 3. Annual minimum and median pH deviation status at sites sampled by GA DNR CRD during 2004 and 2006 for programs noted on maps.

Executive Summary The Condition of Georgia's Coastal Waters
ES-12 Sheldon and Alber 2010
sites classified as poor and the remaining 35% classified as fair (Figure 4). These proportions improved in later years, with 12% of sites classified as poor and 87% classified as fair in 2006.
Dissolved Inorganic Nitrogen as a Proxy Nitrogen Indicator The indicator criteria were developed to evaluate total dissolved nitrogen as the most important nitrogen fraction for overall water quality; however, CRD has so far collected only dissolved inorganic nitrogen measurements. In order to have at least a rough estimate of the nitrogen status of Georgia coastal waters, dissolved inorganic nitrogen concentrations were evaluated for this report. Based on a review of the relevant scientific literature, it was assumed that dissolved inorganic nitrogen is approximately 25% of total dissolved nitrogen in Georgia coastal waters; therefore, dissolved inorganic nitrogen was compared to criteria representing 25% of the recommended total dissolved nitrogen criteria. This meant that values less than 0.025 and 0.25 mg N L-1 were classified as “good” and “fair”, respectively. Dissolved inorganic
Figure 4. Annual minimum and median dissolved oxygen status at sites sampled by GA DNR CRD during 2003 and 2006 for programs noted on maps.
The Condition of Georgia's Coastal Waters Executive Summary
Sheldon and Alber 2010 ES-13
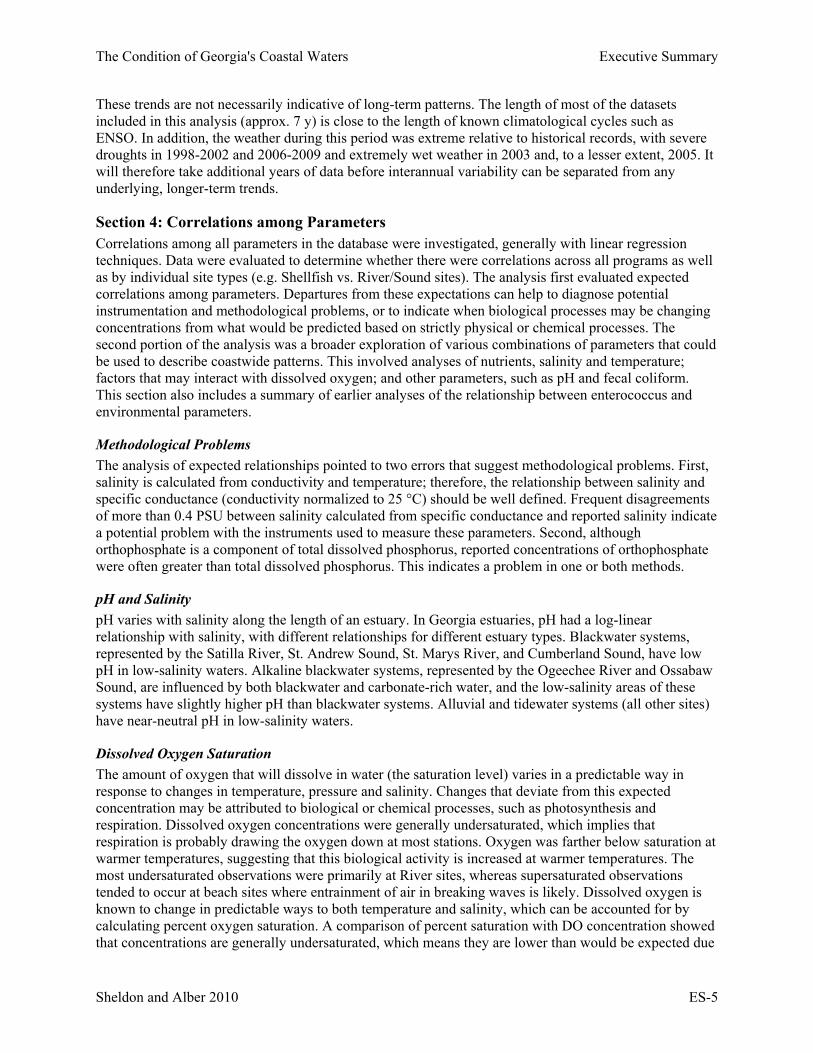
nitrogen data for the Shellfish and Sound programs were available from 2002 to 2006, and for the River program from 2003 to 2006. (Nutrients are not measured at the Beach sites.) An average of 92% of sites from the three programs were classified as fair between 2003 and 2006. Sites classified as poor were located in the Altamaha River (Figure 5). Only a few sites sporadically showed good annual status.
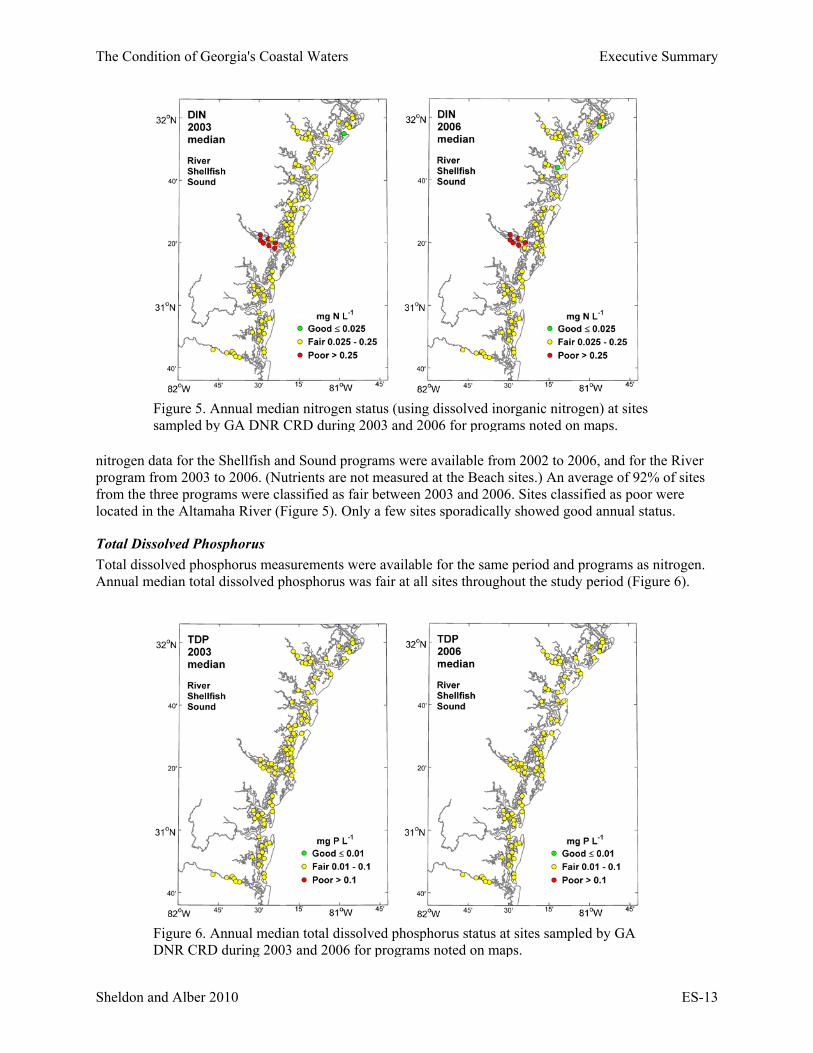
Total Dissolved Phosphorus Total dissolved phosphorus measurements were available for the same period and programs as nitrogen. Annual median total dissolved phosphorus was fair at all sites throughout the study period (Figure 6).
Figure 5. Annual median nitrogen status (using dissolved inorganic nitrogen) at sites sampled by GA DNR CRD during 2003 and 2006 for programs noted on maps.
Figure 6. Annual median total dissolved phosphorus status at sites sampled by GA DNR CRD during 2003 and 2006 for programs noted on maps.

Executive Summary The Condition of Georgia's Coastal Waters
ES-14 Sheldon and Alber 2010
Multiple Criteria Another way to evaluate status is to examine individual sites to determine if a site ranked as poor in more than one category or year. In 2003 annual minimum dissolved oxygen was classified as poor at 81 sites. Of these only sites in the Altamaha River were also classified as poor in terms of dissolved inorganic nitrogen. In 2004 there were two sites in the St. Marys River that were classified as poor in terms of both their annual minimum pH and dissolved oxygen, and one site in the Altamaha River classified as poor for minimum pH and median dissolved inorganic nitrogen. This was similar to 2005, when two sites in the St. Marys River and one in St. Andrew Sound were classified as poor in terms of minimum pH and dissolved oxygen (note that only one of the St. Marys sites had also shown two poor measurements in 2004). In 2006 no sites were classified as poor in more than one category. This suggests that poor water quality was sporadic, with no locations standing out in particular.
The differences in numbers of poor status sites between years can also be evaluated. 2003 had numerous sites classified as poor in terms of minimum dissolved oxygen, with most other observations (median dissolved oxygen, dissolved inorganic nitrogen, and total dissolved phosphorus) classified as fair. This improved in 2004, with minimum dissolved oxygen improving to fair and median dissolved oxygen improving to good at most sites. 2005 and 2006 were similar to 2004 in terms of dissolved oxygen, but there was improvement in pH. These results will need to be extended to be able to say anything definitive about long-term trends, but they suggest that water quality was poorer in 2003 compared to later years.
Section 7: Recommendations Continued monitoring of water quality in estuarine and coastal waters is vitally important to understand coastal processes, their relationships to important coastal resources, and the potential effects of development. The Indicators section contains the main recommendations for water quality indicators to be used in Georgia estuaries, but this section summarizes recommendations for parameters to be measured, sampling strategy, quality control procedures, and studies that are needed to refine and localize the criteria proposed here.
Parameters • Continue measuring dissolved oxygen, pH, and ancillary data (salinity, specific conductance, and
water temperature)
• Measure total nitrogen and total phosphorus using dissolved and particulate fractions
• Measure dissolved inorganic nitrogen and phosphorus at selected sites
• Add chlorophyll a as an indicator
• Add 5-day biochemical oxygen demand as an indicator
• Measure transparency instead of turbidity
Sampling Strategy • Collect samples monthly
• Continue River and Sound programs, and add sites in the lower Savannah and Satilla Rivers
• Continue monitoring at selected Shellfish sites
• Continue monitoring at Beach sites
• Continue with a fixed-site sampling approach
• Monitor over the long term

The Condition of Georgia's Coastal Waters Executive Summary
Sheldon and Alber 2010 ES-15
Quality Control • Review protocols as necessary
• Log instrument use to aid quality control
• Institute consistent procedures for missing or non-detectable data
• Ensure data continuity when protocols are altered
• Compare turbidity with light transmission
Studies Needed • Develop improved criteria for pH
• Examine the effects of low dissolved oxygen on native fauna
• Collect data necessary to evaluate causal relationships for eutrophication
• Investigate nitrite dynamics in Georgia coastal waters
• Compare 5- and 20-day biochemical oxygen demand as an indication of the relative availability of organic matter