the conduits european project and its … · pierre schmitz aed-dg - european and international...
TRANSCRIPT

THE CONDUITS EUROPEAN PROJECTAND ITS
DECISION SUPPORT TOOL WITHKEY PERFORMANCE INDICATORS FOR ITS IN URBAN ENVIRONMENT
Pierre SCHMITZAED-DG - European and International relations
Niv EDENTechnion - Israel Institute of Technology

www.conduits.eu
Cities needs for the best ITS choice Neutral assessment of ITS in urban environment Ratio cost/benefit of an ITS investment Assess the usefulness of an ITS as a whole Identify the limits of an ITS
Decision Support Tool (DST) for traffic managers and decision makers
Allow comparison between different ITS solutions
Control/assessment of a ITS implementation
Possibility of sharing results between cities
www.conduits.eu
Solution: KPIs with specific requirements Key Performance Indicators (KPIs) easy to use and
communicate to decision makers and public No or light extra work for the users Clarity for the political decision makers and the public
Adapted to cities individuality Geographical scale :
o sections, roads, zones, network, … Adaptability :
o Ability to use all kind of urban data that are relevant to quantify a performance
o Weighting possibilities

www.conduits.eu
CONDUITS goal and objectives
Goal of the CONDUITS project To establish a coherent set of Key Performance Indicators (KPIs) for ITS used for urban traffic management
Main objectives To define a set of Key Performance Indicators for identifying best practices and best technologies To test these KPIs through real applications in Paris, Rome, Tel‐Aviv, Munich and Ingolstadt

www.conduits.eu
The CONDUITS Indicators

www.conduits.eu
Test in Paris – Bus priority (1)
Priority on lines 26, 91, 96 Implementation in 2006 Anticipated average travel time savings about
30s per trip, allowing 1 bus less for each line

www.conduits.eu
Traffic efficiency: Mobility index
minutes/km, weighted for public and private transport
Traffic safety: Accidents index
casualties per million vehicles, severity weighted
Test in Paris – Bus priority (2)

www.conduits.eu
Test in Paris – Bus priority (3)
Traffic efficiency: Mobility index Separately for public and private transport
Combined, with wPT = 0.7 and wPV = 0.3
min/kmPublic transport mobility Private transport mobility
Before After Before AfterLine 26 4.46 4.25 4.46 4.65Line 91 4.63 4.33 5.25 5.05Line 96 5.03 4.67 2.71 3.02TOTAL 4.71 4.42 4.21 4.26
min/kmIMOB
Before After
Line 26 4.46 4.37
Line 91 4.82 4.54
Line 96 4.33 4.17
TOTAL 4.56 4.37

www.conduits.eu
Test in Rome ‐ General assessmentSeveral techniques and technologies, including ITS, are used for traffic management in the entire Greater Rome area
Supplied data: Travel times for public transport and private cars between all zones of the city and lengths of these routes Occurrences of congestions and their average duration on certain key routes of the urban road network during one year

www.conduits.eu
Test Tel‐Aviv – New signal strategiesRecurrent Congestion during the Afternoon / Evening peak hours (~ 45 h/link/month) Deployment of new traffic
management strategies

www.conduits.eu
Test in Munich – Safety assessment Installation of two
feedback signs during a test period
Measuring speeds at two urban streets (speed limit 50 and 30km/h) in both driving directions
Flashing messages:Slow down!Thank you!

www.conduits.eu
Congestion of the main axes during peak hours with traffic management by static green waves
New adaptive greenwaves management
Test of 2 kinds of algorithms for optimising green waves : Hillclimbing algorithm Genetic algorithm
Test in Ingolstadt – Safety assessment

www.conduits.eu
Continuation of the CONDUITS project End of the CONDUITS project in May 2011 Kapsch financial support for the design of a “friendly”
DST using some CONDUITS KPIs Choice of the Pollution KPI Brussels proposal : design of a pollution KPI calculation
module using files generated in a traditional way by VISSIM simulations
Case study : effect on pollution of real simulations done for a bus line priority system recently implemented

www.conduits.eu
Priority bus line 49 Many intersections with traffic lights
4 VISSIM simulations Morning and evening peak hours Situation before and after implementation
Brussels case study

www.conduits.eu
Expected results of the bus priority Short‐term Increase average speed of the buses Increase average speed of the private vehicles displacement parallel to the line Reduction average speed of vehicles crossing the line
Medium‐term Change of route choices for private car drivers Reduction of time losses in the implementation area
Long‐term Demand shift towards public transport reduces private car rides
www.conduits.eu
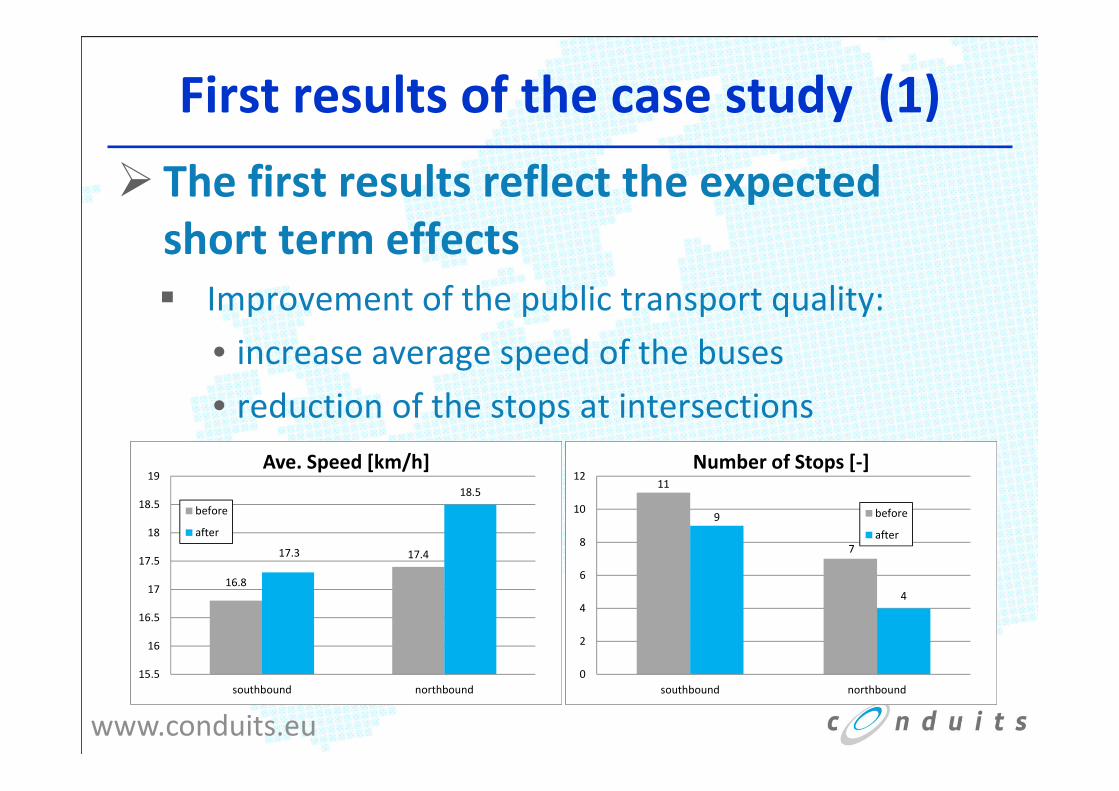
The first results reflect the expected short term effects Improvement of the public transport quality:
• increase average speed of the buses• reduction of the stops at intersections
16.8
17.417.3
18.5
15.5
16
16.5
17
17.5
18
18.5
19
southbound northbound
Ave. Speed [km/h]
before
after
11
7
9
4
0
2
4
6
8
10
12
southbound northbound
Number of Stops [‐]
before
after
First results of the case study (1)

www.conduits.eu
First results of the case study (2)
but… increase in pollution
… what is (hopefully) normal !

www.conduits.eu
First results of the case study (3)Sensitivity analysis with a pragmatic methodologyThe given demand levels of the relevant flows are progressively reduced in increments of 1% and the KPI values are recalculated for each scenario.
- ~1,5 %
- ~3,5 %
Sensitivity analysis of the single pollutants

www.conduits.eu
Advantages of these Indicators Same methodology for all the indicators Calculation running with all kinds of data Easy weighting of the parametersAutomatic calculation before, during and after the implementation of an ITS by using the VISSIM files as they are provided
Allow sharing results got in other cities for similar ITS and the possibility to create a common DB with real measurements

www.conduits.eu
Actual limits of these Indicators It will be necessary to wait a few years
before having “before and after” data based on real measurements
Require a cost/benefit analysis to complete the set of KPIs needed to cover the overall sustainability assessment of an ITS
KPIs comparison between cities still needs an agreement on common weighting

www.conduits.eu
Future developments ! Pollution module assessment in other
interested cities : Zurich, Stuttgart, Perugia,… New Kapsch sponsoring : Traffic efficiency
module to be applied to the same VISSIM files and to be tested in Brussels
Further step : Road safety prediction module Proposal for the design of an integrated
sustainability module using CONDUITS KPIs for multimodal trips with VISUM macrosimulationtool in a new European FP7 project
