the conformational changes coupling atp hydrolysis and
TRANSCRIPT

HAL Id: hal-02322585https://hal.archives-ouvertes.fr/hal-02322585
Submitted on 21 Oct 2019
HAL is a multi-disciplinary open accessarchive for the deposit and dissemination of sci-entific research documents, whether they are pub-lished or not. The documents may come fromteaching and research institutions in France orabroad, or from public or private research centers.
L’archive ouverte pluridisciplinaire HAL, estdestinée au dépôt et à la diffusion de documentsscientifiques de niveau recherche, publiés ou non,émanant des établissements d’enseignement et derecherche français ou étrangers, des laboratoirespublics ou privés.
The conformational changes coupling ATP hydrolysisand translocation in a bacterial DnaB helicase
Thomas Wiegand, Riccardo Cadalbert, Denis Lacabanne, Joanna Timmins,Laurent Terradot, Anja Böckmann, Beat Meier
To cite this version:Thomas Wiegand, Riccardo Cadalbert, Denis Lacabanne, Joanna Timmins, Laurent Terradot, et al..The conformational changes coupling ATP hydrolysis and translocation in a bacterial DnaB helicase.Nature Communications, Nature Publishing Group, 2019, 10 (1), pp.31. �10.1038/s41467-018-07968-3�. �hal-02322585�

ARTICLE
The conformational changes coupling ATPhydrolysis and translocation in a bacterialDnaB helicaseThomas Wiegand1, Riccardo Cadalbert1, Denis Lacabanne 1,2, Joanna Timmins 3, Laurent Terradot 2,
Anja Böckmann 2 & Beat H. Meier 1
DnaB helicases are motor proteins that couple ATP-hydrolysis to the loading of the protein
onto DNA at the replication fork and to translocation along DNA to separate double-stranded
DNA into single strands during replication. Using a network of conformational states,
arrested by nucleotide mimics, we herein characterize the reaction coordinates for ATP
hydrolysis, DNA loading and DNA translocation using solid-state NMR spectroscopy. AMP-
PCP is used as pre-hydrolytic, ADP:AlF4− as transition state, and ADP as post-hydrolytic
ATP mimic. 31P and 13C NMR spectra reveal conformational and dynamic responses to ATP
hydrolysis and the resulting DNA loading and translocation with single amino-acid resolution.
This allows us to identify residues guiding the DNA translocation process and to explain the
high binding affinities for DNA observed for ADP:AlF4−, which turns out to be optimally
preconfigured to bind DNA.
https://doi.org/10.1038/s41467-018-07968-3 OPEN
1 Physical Chemistry, ETH Zurich, 8093 Zurich, Switzerland. 2Molecular Microbiology and Structural Biochemistry, Labex Ecofect, UMR 5086 CNRS/Université de Lyon, 69367 Lyon, France. 3 Univ. Grenoble Alpes, CNRS, CEA, CNRS, IBS, F-38000 Grenoble, France. Correspondence and requests formaterials should be addressed to A.Böc. (email: [email protected]) or to B.H.M. (email: [email protected])
NATURE COMMUNICATIONS | (2019) 10:31 | https://doi.org/10.1038/s41467-018-07968-3 |www.nature.com/naturecommunications 1
1234
5678
90():,;
Helicases are involved in many aspects of nucleic-acidmetabolism. Here we are interested in their function aspart of the replisome, catalyzing the unwinding of double-
stranded DNA and separation into two single-stranded inter-mediates (ssDNA) each of which is then complemented by apolymerase yielding identical copies of the genetic material1–3.The helicase loads (with or without loader proteins) at thereplication fork and translocates along the DNA opening furthernucleotide pairs. It can be looked at as a molecular machinefuelled by ATP which is hydrolyzed to ADP and inorganicphosphate (Pi) in the nucleotide binding domain (NBD). TheNBD is the heart of the motor part driving the translocationthrough the contacts of the DNA-binding domains with ssDNA.This cycle is coupled to the process of DNA loading and thedirectional translocation of the DNA4.
The bacterial helicase from Helicobacter pylori (Hp) belongs tosuperfamily 4 (SF4) helicases5–7 and consists of two domains: TheC-terminal domain (CTD) hosts the molecular motor, as well asbinds and transports the ssDNA; and the N-terminal domain(NTD) binds to the DnaG primase8,9. Crystal structures of bac-terial replicative helicases (belonging to SF4) in complex withssDNA were obtained from Bacillus stearothermophilus(BstDnaB)10 and Geobacillus kaustophilus HTA426 (GkDnaC)11.In the structure of BstDnaB bound to five molecules of GDP-AlF4−, a spiral staircase conformation was observed suggesting ahand-over-hand DNA translocation mechanism in which thesubunits move along the DNA during translocation driven by asequential ATP hydrolysis mechanism10, in contrast to a con-certed model in which ATP hydrolysis occurs simultaneously inall subunits6. A similar mechanism but based on an almost flatsix-fold helicase structure was proposed for the E1 and Rhohelicases (belonging to SF3 and SF5, respectively): the DNA-binding loops of the helicase move during translocation andtransport ssDNA through the inner channel of the multimer.4,12
For GkDnaC, a flat, pseudo 6-fold symmetric structure was alsoobserved in presence of DNA, but with three independent DNA
stretches bound within the central channel of the hexamericprotein11.
The helicase-DNA interactions must be coupled to the stateof the NBD that is running through the ATP hydrolysis cycle.At least in vitro, the loading of HpDnaB onto ssDNA alsoseems catalyzed by the same motor domain7. The motor domainsof helicases are composed of three characteristic structural motifsthat are responsible for binding the nucleotide predominantlyvia hydrogen bonds (see Supplementary Figure 1): the WalkerA (phosphate-binding loop, residues 203A-210T for HpDnaB)and Walker B motifs (coordinates Mg2+ cofactor, residues 309I-316Q), as well as the arginine finger (R-finger, binds to theγ-phosphate, residues 445N-451G) connecting two adjacentDnaB monomers.13
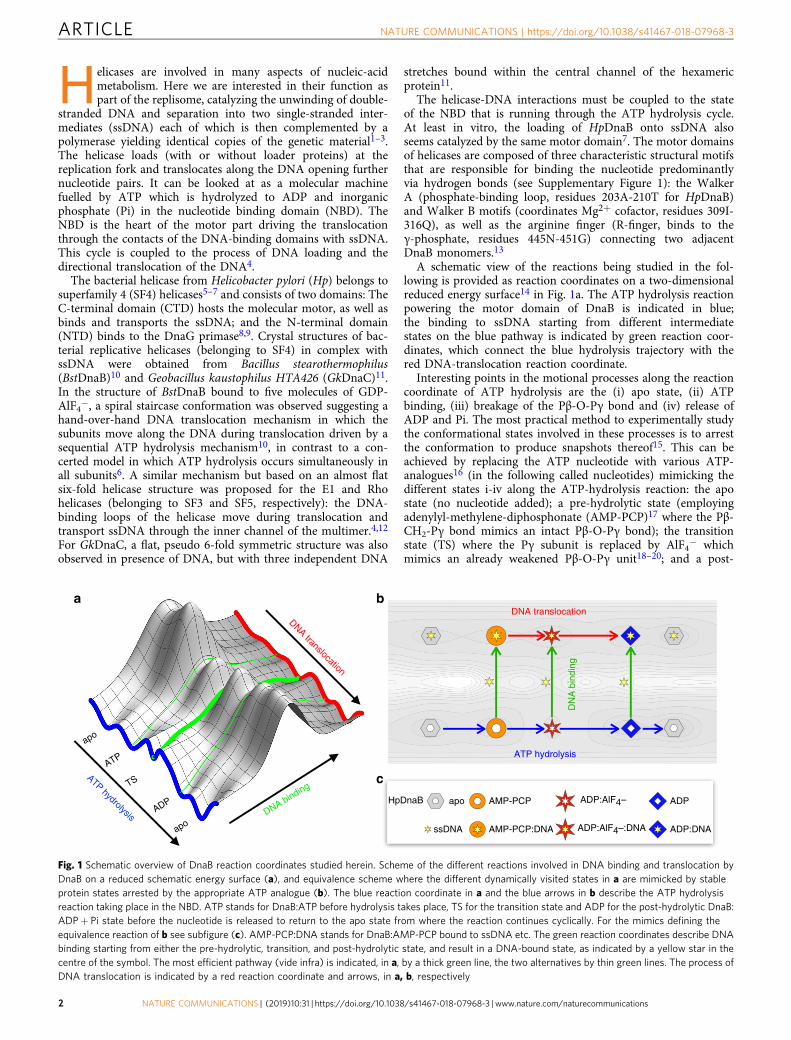
A schematic view of the reactions being studied in the fol-lowing is provided as reaction coordinates on a two-dimensionalreduced energy surface14 in Fig. 1a. The ATP hydrolysis reactionpowering the motor domain of DnaB is indicated in blue;the binding to ssDNA starting from different intermediatestates on the blue pathway is indicated by green reaction coor-dinates, which connect the blue hydrolysis trajectory with thered DNA-translocation reaction coordinate.
Interesting points in the motional processes along the reactioncoordinate of ATP hydrolysis are the (i) apo state, (ii) ATPbinding, (iii) breakage of the Pβ-O-Pγ bond and (iv) release ofADP and Pi. The most practical method to experimentally studythe conformational states involved in these processes is to arrestthe conformation to produce snapshots thereof15. This can beachieved by replacing the ATP nucleotide with various ATP-analogues16 (in the following called nucleotides) mimicking thedifferent states i-iv along the ATP-hydrolysis reaction: the apostate (no nucleotide added); a pre-hydrolytic state (employingadenylyl-methylene-diphosphonate (AMP-PCP)17 where the Pβ-CH2-Pγ bond mimics an intact Pβ-O-Pγ bond); the transitionstate (TS) where the Pγ subunit is replaced by AlF4− whichmimics an already weakened Pβ-O-Pγ unit18–20; and a post-
HpDnaB apo ADPADP:AlF4–
AMP-PCP:DNA ADP:DNAADP:AlF4–:DNAssDNA
AMP-PCP
ATP hydrolysis
DNA translocation
DN
A b
indi
ng
b
c
DNA translocation
DNA bindingATP hydrolysis
ATP
TS
ADP
apo
apo
a
Fig. 1 Schematic overview of DnaB reaction coordinates studied herein. Scheme of the different reactions involved in DNA binding and translocation byDnaB on a reduced schematic energy surface (a), and equivalence scheme where the different dynamically visited states in a are mimicked by stableprotein states arrested by the appropriate ATP analogue (b). The blue reaction coordinate in a and the blue arrows in b describe the ATP hydrolysisreaction taking place in the NBD. ATP stands for DnaB:ATP before hydrolysis takes place, TS for the transition state and ADP for the post-hydrolytic DnaB:ADP+ Pi state before the nucleotide is released to return to the apo state from where the reaction continues cyclically. For the mimics defining theequivalence reaction of b see subfigure (c). AMP-PCP:DNA stands for DnaB:AMP-PCP bound to ssDNA etc. The green reaction coordinates describe DNAbinding starting from either the pre-hydrolytic, transition, and post-hydrolytic state, and result in a DNA-bound state, as indicated by a yellow star in thecentre of the symbol. The most efficient pathway (vide infra) is indicated, in a, by a thick green line, the two alternatives by thin green lines. The process ofDNA translocation is indicated by a red reaction coordinate and arrows, in a, b, respectively
ARTICLE NATURE COMMUNICATIONS | https://doi.org/10.1038/s41467-018-07968-3
2 NATURE COMMUNICATIONS | (2019) 10:31 | https://doi.org/10.1038/s41467-018-07968-3 | www.nature.com/naturecommunications

hydrolytic state in which the Pβ-O-Pγ bond is broken (ADP hasbeen generated), before the apo state is reached again (see alsoSupplementary Figure 1). The pre-hydrolytic state proved themost difficult to mimic. Two alternative compounds to AMP-PCP, i.e. AMP-PNP and ATPγS were tested, but both (the firstonly in presence of DNA21) were hydrolyzed during samplepreparation (rotor filling).
Although the nucleotides used are chemically different fromATP, the DnaB:nucleotide complexes are assumed to representthe local minima on the ATP hydrolysis reaction coordinatelabelled as apo, ATP, TS, ADP in Fig. 1a. Note the notation wherewe leave away the DnaB specification and use ATP instead ofDnaB:ATP throughout the article. As an approximation to thefugitive states on the reaction coordinate of the hydrolysis reac-tion, we can now experimentally study the equivalence scheme ofFig. 1b where every symbol represents a stable compound withconformation and chemical properties similar to the equivalentelusive local minima points in Fig. 1a.
We here show, using nucleotides mimicking different stages ofATP-hydrolysis, that binding and hydrolysis of ATP lead tosignificant structural and, maybe even more importantly,dynamic changes for a significant, contiguous portion of DnaB.These changes are highly correlated with the location of theresidues in the 3D structure, and define the transduction path-ways linking ATP hydrolysis (the source of free energy) to ssDNAbinding and translocation. Our study shows that most efficientDNA binding proceeds via the transition state which preparesthe conformation of the protein for DNA binding. The movementof the protein along DNA occurs via few non-covalent contactswith residues in the DNA-binding loop of the helicase, andespecially 357R and 373K could be involved in pulling the DNAthrough the inner pore, as reflected by the conformationalvariation during the DNA translocation process.
ResultsATP hydrolysis reaction cycle. In the first part of this study, wecharacterize the conformational events along the equivalencescheme for the ATP hydrolysis reaction (blue arrows in Fig. 1b,for the nomenclature of the studied complexes see Fig. 1c). Thefour DnaB states investigated can be regarded as representingfour consecutive states in the ATP hydrolysis cycle, as shown inthe sketch in the upper left corner of Fig. 2.
Phosphorus-31 NMR allows to characterize nucleotide binding;31P spectra of the bound nucleotides AMP-PCP and ADP:AlF4−,as well as of ADP are shown in the first column in Fig. 2. Thesespectra were obtained with the cross-polarization (CP) techniquethat only shows species showing the long rotational correlationtimes typical for the protein immobilized by sedimentation, andnot molecules in the supernatant fraction which show fasttumbling. The nucleotides are thus indeed bound to the protein.For all three states, the expected number of 31P resonances (3 forAMP-PCP, 2 otherwise) is observed, indicating the structuralequivalence of all 6 monomers of the hexamer. The 31Presonances are the narrowest for ADP:AlF4−, indicating higheststructural order and homogeneity, while for AMP-PCP, a slightbroadening of the Pα and Pβ resonances is observed indicatingsmall variations of the electronic environment of the 31P spins orin the conformation of each nucleotide (vide infra). Addition ofATP to the apo form yields the ADP spectrum, implying thatATP is hydrolyzed to ADP and Pi is released on the timescale ofsample preparation and only the ADP-bound state can thus beinvestigated (see Supplementary Figure 2).
Carbon-13 detected NMR spectra probe conformational anddynamic features of a protein state. The second column of Fig. 2shows a respective region from 13C-13C 20 ms dipolar assisted
rotational resonance (DARR)22,23 NMR spectra for the differentnucleotide-bound states (for larger spectral windows see Supple-mentary Figure 3). DARR is a robust and reliable experiment thatallows to obtain a correlation spectrum showing crosspeaksbetween close-by and, at 20 ms mixing, typically neighbouring13C nuclei (peaks that for example show in one dimension the Cαand in the second dimension the Cβ chemical shift of the sameamino acid). It provides valuable spectral fingerprints, typically inthe Cα/Cβ chemical-shift region, where one signal is observed peramino acid that can be used to follow conformational changes forevery amino acid. Alanine signals, as they are the only amino-acidtype which correlates a CH with a CH3 group in the Cα/Cβregion, are generally well-isolated, and are often used torepresentatively illustrate spectral changes. In Fig. 2, each alanineextract of a DARR spectrum is overlaid on the previous one in thecycle. The amino acid type and number as obtained fromsequential assignments are indicated on the spectra, and identifythe signals in terms of the Cα/Cβ atoms of the amino-acid theycorrelate in the two dimensions. Sequential assignment wereobtained beforehand using 3D spectra which show much-reducedoverlap when compared to 2D spectra, and extracts thereof areshown for the apo state in ref. 21,24 and for the ADP:AlF4− andADP:AlF4−:DNA complex in Supplementary Figures 4–6.Sequential assignments in NMR are obtained by using comple-mentary sets of 3D spectra which correlate backbone atoms in aninter-residue manner, and allow to sequentially walk, i.e. connect,the backbone and Cβ atom resonances of the protein. Experi-ments for connecting side-chain resonances to the backbonecomplete the assignment process. Results are described inthe Source Data file (for a detailed description of the assignmentstrategy see ref. 25,26 and for assignment details of all proteincomplexes studied herein Supplementary Table 1 and the SourceData file. The assignments for the apo state were extendedcompared to those described in ref. 21). For the other compounds,the majority of the resonances could be assigned in a 3Dspectrum by comparison with the two assigned compounds. In allcases, nucleotide binding is accompanied by chemical-shiftchanges (chemical-shift perturbations, CSP)27, to a single newposition (see Supplementary Figure 7), indicating efficientcomplex formation involving virtually all molecules in thesample, and the quasi-equivalence of all 6 NBDs.
Graphs of the site-specific 13C Cα-Cβ CSPs occurring in theCTDs between the two states obtained from 3D NCACB andNCACX spectra are shown in the third column. The overallstrongest CSPs were observed for the AMP-PCP to ADP:AlF4−
step, the smallest CSPs for the apo to AMP-PCP step. Asexpected, some of the CSPs appear within the nucleotide-bindingmotifs (indicated by green background stripes in Fig. 2, thirdcolumn). Interestingly, however, many CSPs occur outside ofthese motifs and particularly near the DNA-binding loops(residues 316Q-330Q and 355L-383D as putatively identifiedfrom the structural model of the apo protein7 as the loopspointing to the interior of the protein, magenta stripes). Someresonances, including those in the loops of the NBD motifs, (seeSupplementary Tables 2 and 3) appear or disappear in thedifferent steps, and are indicated by pink and steel blue markersrespectively in Fig. 2 on top of the CSPs (3rd column). Whenresidues become observable in DARR spectra this either indicateslarge chemical-shift changes which prevent tracing the new to theoriginal resonance, or residues reducing their dynamics and thusnewly appearing in the NMR spectra. Indeed, MAS-NMR spectraare particularly sensitive to dynamics with correlation timesaround 1 µs that interfere with sample spinning and protondecoupling and lead to signal loss even for a small motionalamplitude. While CSPs are indicative of conformational changes,appearing/disappearing resonances thus associate with dynamic
NATURE COMMUNICATIONS | https://doi.org/10.1038/s41467-018-07968-3 ARTICLE
NATURE COMMUNICATIONS | (2019) 10:31 | https://doi.org/10.1038/s41467-018-07968-3 |www.nature.com/naturecommunications 3

changes, and we equate appearing resonances with a stiffening ofthe corresponding residues. The large number of de novo peaksobserved here, many well resolved in the 3D spectra21,24 cannotbe exclusively explained by large shifts, as this would involve anequal number of disappearing residues, which is not the case. Itshould be noted that these investigations were made in 3D spectra
(see Supplementary Figures 4−6) which show much less overlapthan the 2D spectra of Fig. 2. It is highly unlikely that alldisappearing peaks move to hide under peaks from other residueswithout leaving a clue. In particular, many of them belong toresidues in loop regions (e.g., the Walker motifs or the DNA-binding loops) and can thus be found in characteristic and not
84A
203A
310A
134A
443A
411K
35L
104A
24A
88A
228A
87A
52A
438A 449A
351A
1819202122232425
49
50
51
52
53
54
55
56
� 1(13
C)/
ppm
�2(13C) /ppm
1819202122232425
�2(13C) /ppm
49
50
51
52
53
54
55
56
� 1(13
C)/
ppm
20 10 0 –10 –20
a
b
c
d
13C
CS
P/p
pm13
C C
SP
/ppm
13C
CS
P/p
pm13
C C
SP
/ppm
Residue number
Wal
ker
A
Wal
ker
B
R–f
inge
r
DN
A b
indi
ng lo
ops
20
Pγ
Pβ
Pβ
Pα
Pα
Pβ
Pα
10 0 –10 –20
�2(31P) /ppm
�2(31P) /ppm
�2(31P) /ppm
20 10 0 –10 –20 1819202122232425�2(
13C) /ppm
49
50
51
52
53
54
55
56
� 1(13
C)/
ppm
1819202122232425
49
50
51
52
53
54
55
56
� 1(13
C)/
ppm
�2(13C) /ppm
ADP AMP–PCP
ADP:AlF4–
apo
Residue number
Residue number
Residue number
DN
A b
indi
ng lo
ops
200 250 300 350 400 450
0.0
0.2
0.4
0.6
0.8
1.0
1.2
1.4
1.6
200 250 300 350 400 450
0.0
0.2
0.4
0.6
0.8
1.0
1.2
1.4
1.6
200 250 300 350 400 450
0.0
0.2
0.4
0.6
0.8
1.0
1.2
1.4
1.6
200 250 300 350 400 450
0.0
0.2
0.4
0.6
0.8
1.0
1.2
1.4
1.6
Fig. 2 ATP hydrolysis equivalence scheme in the motor domain in the absence of DNA. Conformational changes in DnaB during the ATP hydrolysis cycle asshown in a, leftmost panel (see also Fig. 1b). Left column: 31P spectra of the three ATP analogues of a. +Denotes a minor contribution of the ADP complexshown in d. Second column: spectral fingerprints from the alanine Cα/Cβ region of 13C-13C 20ms DARR correlation spectra, compared to the ones of theprevious step in the cycle (grey: apo, orange: AMP-PCP, red: ADP:AlF4−, blue: ADP). The spectrum of apo DnaB is taken from reference24. Third column:
13C Cα-Cβ CSPs (calculated according to CSP ¼ffiffiffiffiffiffiffiffiffiffiffiffiffiffiffiffiffiffiffiffiffiffiffiffiffiffiffiffiffiffiffiffiffiffiffiffiffiffiffiffiffiffiffiffiffiffiffiffiffiffiffiffiffiffi
12 Δδ 13Cαð Þ2þΔδ 13Cβð Þ2� �
r
) comparing again with the spectrum from the previous step. The dashed line
represents a threshold above which we classify the CSPs as indicative for structural changes. The error bars (identical for all residues) are estimated to 0.1ppm from the differences in the experimental spectra. The last column shows the 13C CSPs plotted on a model based on the X-ray structure of HpDnaBcomplexed with ADP:Mg2+ (residues 174–488 are shown, pdb 4ZC0, no electron density was observed for ADP:Mg2+ 7) (green: CSP < 0.2 ppm, orange:CSP≥ 0.2 ppm, grey: unassigned). Newly appearing or disappearing signals are marked by pink or steel blue spheres, respectively, on the structure andtheir residue numbers are indicated by pink or steel blue bars on top of the CSP plots in the third column (for detailed residue numbers see SupplementaryTables 2 and 3). Known structural motifs are highlighted in the third column in green (Walker motifs and R-finger) and purple (DNA-binding motifs). Allsource data for the chemical-shift values of columns 1 and 3 are listed in the Source Data file
ARTICLE NATURE COMMUNICATIONS | https://doi.org/10.1038/s41467-018-07968-3
4 NATURE COMMUNICATIONS | (2019) 10:31 | https://doi.org/10.1038/s41467-018-07968-3 | www.nature.com/naturecommunications

very crowded spectral regions. Stiffening of the correspondingamino acids is thus the most likely explanation for the largenumber of newly appearing resonances in the ADP:AlF4− stateand this state is clearly the one showing the highest rigidity.
The residues involved in the structural and dynamic rearran-gements during the hydrolysis cycle are indicated on the HpDnaBX-ray structure (only the CTD is shown) in column four of Fig. 2:residues with significant CSPs (≥0.2 ppm) are plotted in orange,those with minor CSPs (<0.2 ppm) in green, residues newlyappearing in pink and disappearing ones in steel blue. One cansee that not only residues near the nucleotide-binding site locatedat the interface between two DnaB monomers, but also onesfurther away are affected by the changes. This is most extreme forthe NTD, not shown in the structural representation (Fig. 2, 4thcolumn), of which all resonances that are seen in the apospectrum surprisingly disappear when AMP-PCP and ADP arebound, but not for ADP:AlF4− (Fig. 2, 2nd column). We attributethis highly interesting effect, currently subject to further studies,to changes in the dynamics of the NTD upon AMP-PCP andADP binding.
Single-stranded DNA binding. To characterize the changesupon DNA binding, we added DNA to the different DnaB:nucleotide complexes representing the ATP-hydrolysis equiva-lence reaction. The binding of DNA to DnaB (three green arrowsin Fig. 1b), results in the formation of ternary DNA-boundcomplexes referred to as AMP-PCP:DNA, ADP:AlF4−:DNA andADP:DNA. We use a ssDNA substrate consisting of 20 thyminenucleotides, (dT)20, which efficiently binds to nucleotide-boundDnaB7,21.
Fluorescence anisotropy profiles of the different bindingreactions of DnaB to the DNA are shown in SupplementaryFigure 8a and reveal that in presence of ADP:AlF4−, ssDNAdisplays the smallest dissociation constant Kd (Table 1, data inSupplementary Table 4), whereas in presence of ADP, DNAshows the poorest binding to DnaB. With either AMP-PCP orATP, Kd values were in-between these extremes. The apo formwas not investigated as it does not bind ssDNA21.
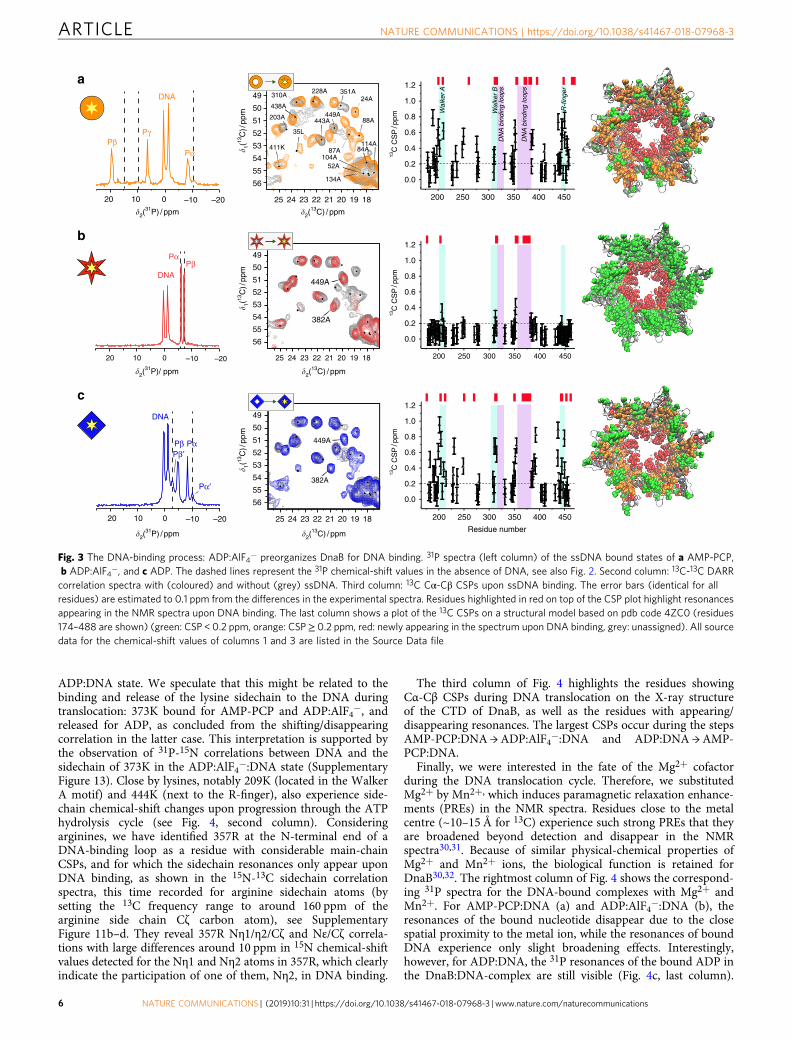
The left column of Fig. 3 shows 31P spectra of the threecomplexes. In all cases, two 31P resonance-lines in a 1:1 intensityratio with different 31P chemical-shift values assigned to (dT)20are observed (see Supplementary Table 5), indicating that twothymine nucleotides bind per DnaB monomer in two slightlydifferent 31P environments. The 31P resonances of the nucleotideremain visible after ssDNA binding, showing that the nucleotideremains bound. In all three cases, only one set of resonances forthe bound nucleotide is observed, confirming the equivalence ofall monomers in the oligomeric assembly. A second weak pair ofresonances, Pα’ and Pβ’, belonging to DnaB:ADP without DNA(Fig. 3c; for the assignment see Supplementary Figure 8b–d) isseen in the ADP:DNA sample. We thus observe substoichio-metric DNA binding in the presence of ADP as expected from thelower binding affinity (Table 1 and Supplementary Figure 8a).The 31P nucleotide Pα and Pβ chemical shifts of AMP-PCPand ADP change substantially upon ssDNA binding (see dashedlines in Fig. 3, Supplementary Figure 9 for 31P CSPs and for
AMP-PCP 31P-31P 2D spectra), while the 31P CSPs are very smallfor ADP:AlF4−.
Analysis of the chemical shifts from 13C-13C 20 ms DARRspectra in Fig. 3 (second column) indicates that the spectra ofAMP-PCP, ADP:AlF4−, and ADP all change upon ssDNAbinding (for larger spectral regions see Supplementary Figure 10),but to varying extents. Of interest here are the changes occurringin the CTD, for which the 13C Cα-Cβ CSPs upon ssDNA bindingare plotted in the third column of Fig. 3. We also note thedisappearance (ADP:AlF4−) or reappearance (AMP-PCP andADP) of NTD signals upon DNA binding, indicating that thedynamics of the NTD is affected by both nucleotide and ssDNAbinding within the CTD.
CSPs and appearing/disappearing residues are shown in thethird column of Fig. 3. In the presence of AMP-PCP and ADP,many resonances show significant CSPs ≥ 0.2 ppm, which con-centrate near the NBD motifs (Walker A and B and R-finger),and close to the DNA-binding loops. In addition, residues mainlyin these regions newly appear in the spectrum upon binding (redbars on top of the CSP plots in Fig. 3). In the presence of ADP:AlF4−, the chemical shifts remain rather constant, and the fewappearing residues are mainly located in the DNA-binding loops.
The rightmost column in Fig. 3 displays the changes on thestructure of the DnaB-CTD. For AMP-PCP (Fig. 3a) and ADP(Fig. 3c), conformational changes are distributed over the proteinstructure indicating extensive rearrangements upon ssDNAbinding. On the contrary, in presence of ADP:AlF4−, the proteinconformation shows little changes around the nucleotide bindingsite upon DNA binding (Fig. 3b) suggesting that ADP:AlF4−preorganizes the helicase into a state highly apt for ssDNAbinding. This shows the tight coupling between the motordomain and the DNA-binding loops. Interestingly, in allnucleotide-bound states a major change observed upon DNAbinding is the appearance of residues located in or near the DNA-binding loops (red residues in the rightmost column in Fig. 3).These residues line the central channel of DnaB through whichthe ssDNA passes. This indicates that this part of the proteinstiffens upon DNA binding.
DNA translocation. The comparison of the three DNA-boundstates allows to deduce information about the putative DNAtranslocation process (red reaction coordinate in Fig. 1). Figure 4(first column) summarizes the 13C Cα-Cβ CSPs between adjacentstates of the DNA translocation cycle for residues located in orclose to the DNA-binding loop II (residues 355–383) (see Sup-plementary Figure 11a; for complete sequence-specific CSPs seeSupplementary Figure 12 and Source Data file). The majority ofresidues in this loop are assigned in all three DNA-bound statesand several show significant CSPs upon DNA binding.
Positively charged amino-acid residues are central inprotein–DNA interactions28. The only lysine in the H4 motif ofthe DNA-binding loop (371D-382A)29, 373K, as also determinedby homology with DNA-bound BstDnaB10, experiences large 13CCα-Cβ CSPs in the processes ADP:DNA →AMP-PCP:DNA andADP:AlF4−:DNA →ADP:DNA (Fig. 4 and S9), which might berelated to changes in sidechain–DNA interactions. Therefore, werecorded 15N-13C 2D spectra of lysine sidechains (through settingthe 13C frequency to the range of lysine side chain Cε carbonatoms, which resonate around 40 ppm) revealing peaks correlat-ing Nζ and Cε atoms, and which should in case of interaction besensitive to DNA binding, for the different compounds along thetranslocation pathway (Fig. 4, second column). For AMP-PCP:DNA and ADP:AlF4−:DNA the Nζ/Cε correlation peak of 373Kis nearly at the same position, but it is shifting to an unresolvedregion or, more likely, is disappearing due to flexibility for the
Table 1 ADP:AlF4− is the best binder for DNA
AMP-PCP:DNA
ADP:AlF4−:DNA
ADP:DNA ATP:DNA
Kd/ nM 58 ± 14 0.83 ± 0.03 5100 ± 500 14 ± 3
Overview of dissociation constants for the ssDNA bound complexes for the different nucleotidebound states along the motor cycle. The fit parameters are given in Supplementary Table 4
NATURE COMMUNICATIONS | https://doi.org/10.1038/s41467-018-07968-3 ARTICLE
NATURE COMMUNICATIONS | (2019) 10:31 | https://doi.org/10.1038/s41467-018-07968-3 |www.nature.com/naturecommunications 5
ADP:DNA state. We speculate that this might be related to thebinding and release of the lysine sidechain to the DNA duringtranslocation: 373K bound for AMP-PCP and ADP:AlF4−, andreleased for ADP, as concluded from the shifting/disappearingcorrelation in the latter case. This interpretation is supported bythe observation of 31P-15N correlations between DNA and thesidechain of 373K in the ADP:AlF4−:DNA state (SupplementaryFigure 13). Close by lysines, notably 209K (located in the WalkerA motif) and 444K (next to the R-finger), also experience side-chain chemical-shift changes upon progression through the ATPhydrolysis cycle (see Fig. 4, second column). Consideringarginines, we have identified 357R at the N-terminal end of aDNA-binding loop as a residue with considerable main-chainCSPs, and for which the sidechain resonances only appear uponDNA binding, as shown in the 15N-13C sidechain correlationspectra, this time recorded for arginine sidechain atoms (bysetting the 13C frequency range to around 160 ppm of thearginine side chain Cζ carbon atom), see SupplementaryFigure 11b–d. They reveal 357R Nη1/η2/Cζ and Nε/Cζ correla-tions with large differences around 10 ppm in 15N chemical-shiftvalues detected for the Nη1 and Nη2 atoms in 357R, which clearlyindicate the participation of one of them, Nη2, in DNA binding.
The third column of Fig. 4 highlights the residues showingCα-Cβ CSPs during DNA translocation on the X-ray structureof the CTD of DnaB, as well as the residues with appearing/disappearing resonances. The largest CSPs occur during the stepsAMP-PCP:DNA →ADP:AlF4−:DNA and ADP:DNA →AMP-PCP:DNA.
Finally, we were interested in the fate of the Mg2+ cofactorduring the DNA translocation cycle. Therefore, we substitutedMg2+ by Mn2+, which induces paramagnetic relaxation enhance-ments (PREs) in the NMR spectra. Residues close to the metalcentre (~10–15 Å for 13C) experience such strong PREs that theyare broadened beyond detection and disappear in the NMRspectra30,31. Because of similar physical-chemical properties ofMg2+ and Mn2+ ions, the biological function is retained forDnaB30,32. The rightmost column of Fig. 4 shows the correspond-ing 31P spectra for the DNA-bound complexes with Mg2+ andMn2+. For AMP-PCP:DNA (a) and ADP:AlF4−:DNA (b), theresonances of the bound nucleotide disappear due to the closespatial proximity to the metal ion, while the resonances of boundDNA experience only slight broadening effects. Interestingly,however, for ADP:DNA, the 31P resonances of the bound ADP inthe DnaB:DNA-complex are still visible (Fig. 4c, last column).
310A
84A
203A
134A
443A
411K
35L
104A
114A
24A
88A
228A
87A
52A
438A 449A
351A49
50
51
52
53
54
55
56
1819202122232425
� 1(13
C)/
ppm
�2(13C) / ppm
� 1(13
C)/
ppm
49
50
51
52
53
54
55
56
1819202122232425
�2(13C) / ppm
20 10 0 –10 –20
�2(31P) / ppm
1819202122232425
49
50
51
52
53
54
55
56
� 1(13
C)/
ppm
�2(13C) / ppm
DNA
Pβ′Pβ Pα
Pα′
a
b
c
Wal
ker A
Wal
ker
B
R-f
inge
r
DN
A b
indi
ng lo
ops
20 10 0 –10 –20
PβPγ
DNA
Pα
�2(31P) / ppm
20 10 0 –10 –20
�2(31P)/ ppm
DNA
PαPβ
382A
449A
449A
382A
DN
A b
indi
ng lo
ops
Residue number
200 250 300 350 400 450
0.0
0.2
0.4
0.6
0.8
1.0
1.2
200 250 300 350 400 450
0.0
0.2
0.4
0.6
0.8
1.0
1.2
13C
CS
P/p
pm13
C C
SP
/ppm
13C
CS
P/p
pm
200 250 300 350 400 450
0.0
0.2
0.4
0.6
0.8
1.0
1.2
Fig. 3 The DNA-binding process: ADP:AlF4− preorganizes DnaB for DNA binding. 31P spectra (left column) of the ssDNA bound states of a AMP-PCP,b ADP:AlF4−, and c ADP. The dashed lines represent the 31P chemical-shift values in the absence of DNA, see also Fig. 2. Second column: 13C-13C DARRcorrelation spectra with (coloured) and without (grey) ssDNA. Third column: 13C Cα-Cβ CSPs upon ssDNA binding. The error bars (identical for allresidues) are estimated to 0.1 ppm from the differences in the experimental spectra. Residues highlighted in red on top of the CSP plot highlight resonancesappearing in the NMR spectra upon DNA binding. The last column shows a plot of the 13C CSPs on a structural model based on pdb code 4ZC0 (residues174–488 are shown) (green: CSP < 0.2 ppm, orange: CSP≥ 0.2 ppm, red: newly appearing in the spectrum upon DNA binding, grey: unassigned). All sourcedata for the chemical-shift values of columns 1 and 3 are listed in the Source Data file
ARTICLE NATURE COMMUNICATIONS | https://doi.org/10.1038/s41467-018-07968-3
6 NATURE COMMUNICATIONS | (2019) 10:31 | https://doi.org/10.1038/s41467-018-07968-3 | www.nature.com/naturecommunications

Similar effects are seen in the carbon spectra (SupplementaryFigure 14). This means that the metal ion is not present in thisstate. The strong 13C CSPs in the Walker B motif during DNAtranslocation for the steps ADP:AlF4−:DNA →ADP:DNA andADP:DNA →AMP-PCP:DNA (see Supplementary Figure 12) canthus be explained by the metal ion release and uptakerespectively, which clearly changes the local electronic distribu-tion for residues located in the Walker B motif coordinatingthe metal ion cofactor. Interestingly, in the absence of DNA, theMn2+ is not expelled in the corresponding step.
DiscussionThe use of ATP mimics has allowed us to characterize thesequence of arrested states appearing along the reaction coordi-nates indicated in Fig. 1a. Experimentally we have been able toproduce and characterize seven of the eight mimics of Fig. 1b,only apo:DNA could not be prepared as the apo protein does notbind ssDNA21. From them, we could extract information aboutthe structural and dynamic changes occurring during the ninereactions indicated by arrows in Fig. 1b. The assumption that theseven protein complexes forming the nodes of the network are a
good substitute for the elusive states appearing on the reactioncoordinate is difficult to verify quantitatively as there is presentlyno method to characterize these elusive states experimentally;consequently, if we possibly do not investigate exactly the rightstates, we investigate the closest to right possible currently. Thisstatement holds particularly for AMP-PCP for which it remainsunclear to what extent the absence of a partial negative charge atthe bridging methylene group influences its chemical properties.And indeed, the significant and coordinated changes that areobserved in conformations (monitored by CSPs) and dynamics(leading to disappearing/appearing peaks) clearly couple theaction at the nucleotide binding sites and DNA-binding loops.This indicates that this approximation clearly catches the majorfeatures of action of these motor proteins.
It is remarkable that DnaB binds ssDNA in the presence ofADP:AlF4− more than an order of magnitude better than in thepresence of ATP or its non-hydrolysable analogue AMP-PCP,and even several orders of magnitude better than ADP (Table 1).Concomitant with this, the most important change in the NMRspectra between all states of the ATP-hydrolysis cycle is inducedwhen ADP:AlF4− is bound to the protein. There are not onlynumerous conformational changes, but importantly many
�2(13C) /ppm
� 1(15
N)/
ppm
209K
444K
373K
384042
30
32
34
36
�2(13C) /ppm
� 1(15
N)/
ppm
209K
384042
30
32
34
36
a
�2(13C) /ppm
� 1(15
N)/
ppm
209K373K
384042
30
32
34
36
b
c
�2(31P)/ppm
20 10 0 –10 –20
20 10 0 –10 –20
�2(31P)/ppm
�2(31P)/ppm
20 10 0 –10 –20
Mn2+
Mg2+
Mg2+
Mn2+
Mn2+
Mg2+
PβPγ
DNA
Pα
DNA
DNA
DNAPβPα
DNA
DNA
Pβ′Pβ
Pα′
Pα
Pβ Pα
Residue number
DNA binding loop
373K
382A
373K
382A
13C
CS
P/p
pm13
C C
SP
/ppm
13C
CS
P/p
pm
373K
382A
Residue number
Residue number
354Q
378I
383D
384I
387F
393I
392Y
352L
378I 383D387F
392Y
393I
380Q
379E
354Q
352L380Q
393I
390R
357R
357R
350 360 370 380 390
0.0
0.2
0.4
0.6
0.8
350 360 370 380 390
0.0
0.2
0.4
0.6
0.8
350 360 370 380 390
0.0
0.2
0.4
0.6
0.8
353V
Fig. 4 NMR allows to identify specific residues involved in DNA translocation. The first column shows the 13C Cα-Cβ CSPs for the indicated steps of theDNA translocation process (residues 344–393 are shown), the DNA-binding loop is highlighted in purple. The error bars (identical for all residues)are estimated to 0.1 ppm from the differences in the experimental spectra. 15N, 13C correlation spectra (second column) for the lysine sidechains of theDNA-bound states for the three ATP-analogues as indicated. The third column shows a plot of the residues shown in the first column and experiencingCSPs > 0.2 ppm (orange) on a structural model based on pdb accession code 4ZC0. Red and steel blue colours indicate appearing and disappearingresidues, respectively (see Supplementary Table 6 for a list). Residues with CSP < 0.2 ppm are not coloured. Right column: 31P spectra of the DNA-boundcomplexes using Mg2+ and Mn2+ as metal ion cofactors indicating if the metal is bound (extinction of the ATP-analogue resonances for Mn2+), or not(no change upon metal substitution). All source data for the chemical-shift values of columns 1 and 3 are listed in the Source Data file
NATURE COMMUNICATIONS | https://doi.org/10.1038/s41467-018-07968-3 ARTICLE
NATURE COMMUNICATIONS | (2019) 10:31 | https://doi.org/10.1038/s41467-018-07968-3 |www.nature.com/naturecommunications 7

residues stiffen in the presence of ADP:AlF4− which were flexiblein the previous step of the ATP hydrolysis reaction, in the pre-sence of AMP-PCP. Figure 5 gives a detailed view of the CTD of asingle DnaB monomer. The first row reports on changes betweenthe AMP-PCP and ADP:AlF4− bound states, and shows, in red,the residues that stiffen, in orange those which change con-formation, and in green those remaining constant. In the post-hydrolytic state (Fig. 2d), many of these stiffened residues become
flexible again. These residues are mainly located around the NBDincluding the R-finger, as well as the Walker A and B motifs, andcontact the DNA-binding loops via the Walker B motif and viathe R-finger. The latter couples the ATP binding site to a DNA-binding loop of the adjacent monomer. The changes in theR-finger are emphasized in Supplementary Figure 15a, where onecan see that 447N and 448G are stiffening upon binding of ADP:AlF4−, and that all remaining residues in the R-finger undergo
444K
446R
209K
357R 446K
209K
373K
444K
373K
ADP
DNA-binding
R-finger
Walker B
Walker A
a
DNA binding rigidifies the DNA binding loops
The AlF4-bound state preconfigures a state apt for DNA binding
Appearing signal(rigidification)
b
c
Shifting signal (conformational change)
Unaffected signal
Disappearing signal(flexibilisation)
Legend
Coupling of nucleotide binding and DNA translocation through a network of residues
Fig. 5 Site-specifically identified conformational change. a Details of conformational changes during ATP hydrolysis between the pre-hydrolytic state usingAMP-PCP and the transition state mimicked by ADP:AlF4−, the left subpanel shows only the changing residues (see Legend box), the right subpanel inaddition the unaffected residues; b changes upon DNA binding to the ADP:AlF4−bound state; and c changes during DNA translocation (ADP:DNA→AMP-PCP:DNA→ADP:AlF4−:DNA→ADP:DNA). The changes occurring at each arrow are shown in the three panels of c. The molecular structure shownrepresents a model in which the ADP is added based on homology with the AaDnaB:ADP X-ray structure (pdb accession code 4NMN)45
ARTICLE NATURE COMMUNICATIONS | https://doi.org/10.1038/s41467-018-07968-3
8 NATURE COMMUNICATIONS | (2019) 10:31 | https://doi.org/10.1038/s41467-018-07968-3 | www.nature.com/naturecommunications

conformational changes in this step (in orange, SupplementaryFigure 15a), including the highly conserved 446R. This residue isin close contact (3.2 Å in the model) with 382A that is part of theDNA-binding loop. The remainder of the assigned residues forma largely contiguous region not impacted by this hydrolysis step(green in Fig. 5b). Interestingly, the changes within a samemonomer run through the central half-beta barrel, as displayed inSupplementary Figure 15b. This relatively rigid structural elementmight indeed be well-suited to perform the structural couplingbetween the motor unit and the DNA-binding loops. It isremarkable that dynamic effects play an essential role in this step,indicating a rather complex realization of the transmission ele-ment. The striking changes in the dynamics of the NTD uponnucleotide binding to the CTD give insight into the dynamicbehaviour of this part of the protein located remotely from ATPand DNA-binding sites and are presently further investigated.
Fluorescence anisotropy measurements reveal that the presenceof ADP:AlF4− results in the strongest binding affinities of DNAto DnaB:nucleotide. While binding affinities are purely thermo-dynamic quantities, relating to the Gibbs free energy differencebetween bound and unbound state, the NMR data contributeinformation on the reaction mechanism: structural changesrequired for DNA binding are largely already prepared in theADP:AlF4−-bound transition state analogue prior to DNAbinding, so that the major change observed upon ssDNA binding(Fig. 5b, left) is the stiffening of the residues lining the centralchannel in the DnaB hexamer, and in particular the DNA-binding loops, while the bulk of the protein remains invariant(Fig. 5b, right). Arginine 357 (Fig. 3 and SupplementaryFigure 11) at the beginning of the binding loop II interacts withDNA in all complexes (Fig. 4, left column) and is flexible in thestructures without DNA. Likewise, the last part of the Walker Bmotif (315L-316Q) only appears upon DNA binding.
During the translocation steps, significant main chain CSPs areobserved (Fig. 4). For this cycle, it is interesting to look in moredetail at the lysine and arginine residues which are the pre-ferential interacting residues with DNA10,33,34. Figure 5c paintsthe changes identified in Fig. 4 and Supplementary Figure 12 on aDnaB monomer: residues showing CSPs are drawn in orange,appearing residues in red, and disappearing residues in blue. 357Rand 373K are both located in the binding loop II. Remarkably,even their backbone resonances show significant CSPs (Fig. 4).They both show conformational differences along the transportcycle (in its backbone as well as side chain resonances, Fig. 5c).373K shows significant conformational changes in particular forthe ADP:DNA →AMP-PCP:DNA and ADP:AlF4−:DNA →ADP:DNA steps. 357R instead experiences significant changes duringthe steps AMP-PCP:DNA →ADP:AlF4−:DNA and ADP:AlF4−:DNA →ADP:DNA (Fig. 5c). Note that 357R and 373K inHpDnaB correspond to 365R and 381R in BstDnaB which are inclose spatial proximity to the DNA within the crystal structure ofthe BstDnaB–DNA complex10. These two residues, located at thebeginning and end of loop II, are actually in close neighbourhoodwhen considering a dimer. 444K is also changing its chemicalshift considerably during the translocation cycle and is locatedclose to the DNA-binding loop. 209K is at the end of the WalkerA motif and sensitive to the changes in the ATP pocket occurringin the AMP-PCP:DNA →ADP:AlF4−:DNA step (Fig. 5c) as a partof a band of residues shown in red that rigidify in the transition-state conformation. We hypothesize that they are involved intransmitting the motor state to the DNA-binding loops.
Interestingly, our data indicate for all complexes studied acomplete occupation of all six NBDs and a conformationalequivalence of them. NMR chemical-shifts are highly sensitive tothe local environments35 and no resonance-splitting was observedneither in 13C- nor in 31P-detected spectra. Whenever a
resonance changes its position in the spectrum, it entirely shifts toits new position indicating that all monomers in the hexamericassembly behave similarly. This contrasts with the findings forBstDnaB:DNA for which a non-complete occupation of NBDsand a spiral staircase conformation was reported10. HpDnaB thusadopts under the experimental conditions used herein (e.g., an18-fold excess of nucleotide compared to a DnaB monomer) asymmetric conformation with thus likely rather flat geometry inall complexes investigated. Whether the motor in vivo acts in aconcerted or sequential manner during ATP hydrolysis cannot bejudged from our data. However, they clearly indicate that sym-metric DnaB structures can in principle be adopted by DnaB inpresence of different nucleotide analogues. This is reminiscent ofDNA-bound Rho4 or E112 helicases in which the hexamericassembly adopts a flat conformation, but a spiral conformation isobserved for the DNA-binding loops contacting the DNA. Ourdata are clearly consistent with such a model for HpDnaB.
Finally, we observe the release of the metal ion (Mg2+) in thelast step of DNA translocation (ADP:AlF4−:DNA →ADP:DNA),an event not described before to the best of our knowledge. Thisrelease does not happen in the cycle without DNA.
Our results highlight the important opportunity created bysimple sedimentation36–38 to produce complex preparations,allowing to sample a variety of points on reaction coordinates.This opens a new avenue for the investigation of reaction path-ways not only of different classes of ATP-fuelled motor proteins,but also to follow other classes of proteins through their func-tional cycles.
MethodsSample preparation. AMP-PCP, ADP and ATP were purchased from Sigma-Aldrich and (dT)20 from Microsynth.
Expression and purification of HpDnaB. The protein was cloned into the vectorpACYC-duet1 (using the forward primer 5’-agtcatatggatcatttaaagcatttgcag-3’ con-taining a NdeI restriction site and reverse primer 5’-atactcgagttcaagttgtaactatatca-taatcc-3’ containing a XhoI site)7, and expressed in the E. coli strain BL21 Star(DE3) (One Shot® BL21 Star™ (DE3) Chemically Competent E. coli, Invitrogen™).The overexpression was performed in M9 minimal medium39 using 13C-enrichedglucose 2 g L−1 (Cambridge Isotope Laboratories, Inc. CLM-1396-PK) and 15N-enriched ammonium chloride 2 g L−1 (Sigma-Aldrich® 299251) as sole carbonand nitrogen sources. The cells were lysed by a microfluidization process. 13C-15Nlabelled HpDnaB was purified by heparin-agarose affinity chromatography using a5 mL HiTrap Heparin HP column (GE Healthcare Life Sciences) followed by anionexchange chromatography using a 5 mL HiTrap Q HP column (GE HealthcareLife Sciences). The purified protein was concentrated up to 30 mgmL−1 bycentrifugation in buffer A (2.5 mM sodium phosphate, pH 7.5, 130 mM NaCl).For more details see ref. 37.
Preparation of HpDnaB:ADP complexes. 0.3 mM HpDnaB in buffer A was mixedwith 5 mM MgCl2 * 6H2O and consecutively 5 mM ADP or ATP (~ 17-fold molarexcess of nucleotide compared to an HpDnaB monomer) and incubated for 2 hat 4 °C. The protein solution was sedimented36–38 in the MAS-NMR rotor (16 hat 4 °C at 210,000 × g) using home-build tools40.
Preparation of the HpDnaB:AMP-PCP complex. 0.3 mM HpDnaB in bufferA was mixed with 5 mM MgCl2 * 6H2O and consecutively 15 mM AMP-PCP(~ 50-fold molar excess of AMP-PCP compared to an HpDnaB monomer) andincubated for 2 h at 4 °C. The protein solution was sedimented36–38 in theMAS-NMR rotor (16 h at 4 °C at 210,000 × g) using home-build tools40.
Preparation of the HpDnaB:ADP:AlF4− complex. 0.3 mM HpDnaB in bufferA was mixed with 5 mM MgCl2 * 6H2O and consecutively 6 mM of an NH4AlF4solution (prepared by incubating 1M AlCl3 solution with a 5-fold excess of 1 MNH4F solution (compared to AlCl3) for 5 min. in H2O) and 5 mM ADP andincubated for 2 h at 4 °C. The protein solution was sedimented36–38 in the MAS-NMR rotor (16 h at 4 °C at 210,000 × g) using home-build tools40.
Preparation of HpDnaB:nucleotide:DNA complexes. The HpDnaB:nucleotidecomplexes were prepared as described above (in all cases 5 mM of nucleotide wasused). 0.5 mM (for ATP) and 1 mM (ATP, AMP-PCP, ADP:AlF4− and ADP) of
NATURE COMMUNICATIONS | https://doi.org/10.1038/s41467-018-07968-3 ARTICLE
NATURE COMMUNICATIONS | (2019) 10:31 | https://doi.org/10.1038/s41467-018-07968-3 |www.nature.com/naturecommunications 9

(dT)20 was added to the complexes and reacted for 30 min at r.t. The proteinsolution was sedimented in the MAS-NMR rotor (16 h at 4 °C at 210,000 × g).
Preparation of HpDnaB:nucleotide: DNA complexes with Mn2+. The complexescontaining Mn2+ instead of Mg2+ were prepared as described above, but instead ofMgCl2, MnCl2 was used in a lower concentration (~1.5 mM corresponding to onlya five-fold excess compared to a DnaB monomer). The lower concentration wasused to avoid sizeable unspecific binding of Mn2+ to the protein, e.g. to negativelycharged residues30.
Fluorescence anisotropy measurements. Equilibrium fluorescence anisotropyDNA-binding assays were performed on a Clariostar (BMG Labtech) microplatereader, fitted with polarization filters to measure fluorescence anisotropy. 0–8 µMDnaB (dodecamer) were titrated into 1 nM 5’-FAM labelled (dT)20 (MWG Euro-fins) in binding buffer composed of 20 mM Hepes pH 7.5, 5 mM MgCl2, 50 mMpotassium acetate and 5% (v/v) glycerol and supplemented with 0.2 mg/ml BSAand 0.5 mM nucleotide (ATP, ADP, AMP-PCP or ADP:AlF4− prepared in 50 mMTris pH 8.0). After subtracting the polarization values obtained for DNA alone, themean data from three independent experiments were fitted to a standard bindingequation Y ¼ Bmax � Xh=ðKd þ XhÞ assuming a single binding site with Hillslope (h) using GraphPad Prism6, where Y is the difference between the anisotropyof completely bound and completely free oligo, X is the DnaB concentration andKd is the equilibrium dissociation constant. The fits for ATP, AMP-PCP and ADP:AlF4− were very good with R2 values all above 0.99. For the ADP data, sincethe binding curves did not reach saturation, fitting of the data was achieved byconstraining the Bmax value to 250, which is the value obtained for the other fits.
Solid-state NMR experiments. 13C detected solid-state NMR spectra wereacquired at 20.0 T static magnetic field strength using a 3.2 mm Bruker Biospin E-free probe41. The MAS frequency was set to 17.0 kHz. The 2D and 3D spectra wereprocessed with the software TOPSPIN (version 3.5, Bruker Biospin) with a shifted(2.5–3.0) squared cosine apodization function and automated baseline correctionin the indirect and direct dimensions. The sample temperature was set to 278 K40.All spectra were analysed with the software CcpNmr42–44 and referenced to 4,4−dimethyl-4-silapentane-1-sulfonic acid (DSS). The assignments of HpDnaB aretaken from reference 21 and extended in this work (see Source Data file). 31P-detected experiments were acquired at 11.74 T in a Bruker 3.2 mm probe usingspinning frequencies of 12.0–17.0 kHz. The spectra were referenced to 85% H3PO4.All experimental details are provided in the Source Data file.
Reporting summary. Further information on experimental design is available inthe Nature Research Reporting Summary linked to this article.
Data availabilityData supporting the findings of this manuscript are available from the corre-sponding authors upon reasonable request. The following PDB structures wereused in this study: 4ZC0 and 4NMN. The source data underlying Figs. 2, 3 and 4and Supplementary Figs S7, S8a, S9a and S12 as well as the chemical-shift valuesfor apo DnaB and DnaB:ADP:AlF4−:ssDNA and all experimental NMR parametersare provided as a Source Data file.
Received: 18 June 2018 Accepted: 10 December 2018
References1. Lohman, T. M. & Bjornson, K. P. Mechanisms of helicase-catalyzed DNA
unwinding. Annu. Rev. Biochem. 65, 169–214 (1996).2. Matson, .SW. & Kaiser-Rogers, .KA . DNA helicases. Annu. Rev. Biochem. 59,
289–329 (1990).3. Patel, S. S. & Picha, K. M. Structure and function of hexameric helicases.
Annu. Rev. Biochem. 69, 651–697 (2000).4. Thomsen, N. D. & Berger, J. M. Running in reverse: the structural basis for
translocation polarity in hexameric helicases. Cell 139, 523–534 (2009).5. Caruthers, J. M. & McKay, D. B. Helicase structure and mechanism. Curr.
Opin. Struct. Biol. 12, 123–133 (2002).6. Singleton, M. R., Dillingham, M. S. & Wigley, D. B. Structure and mechanism
of helicases and nucleic acid translocases. Annu. Rev. Biochem. 76, 23–50(2007).
7. Bazin, A., Cherrier, M. V., Gutsche, I., Timmins, J. & Terradot, L. Structureand primase-mediated activation of a bacterial dodecameric replicativehelicase. Nucleic Acids Res. 43, 8564–8576 (2015).
8. Corn, J. E. & Berger, J. M. Regulation of bacterial priming and daughter strandsynthesis through helicase-primase interactions. Nucleic Acids Res. 34,4082–4088 (2006).
9. Bailey, S., Eliason, W. K. & Steitz, T. A. Structure of hexameric DnaBhelicase and its complex with a domain of DnaG primase. Science 318,459–463 (2007).
10. Itsathitphaisarn, O. et al. The hexameric helicase DnaB adopts a nonplanarconformation during translocation. Cell 151, 267–277 (2012).
11. Lo, Y.-H. et al. The crystal structure of a replicative hexameric helicase DnaCand its complex with single-stranded DNA. Nucleic Acids Res. 37, 804–814(2009).
12. Enemark, E. J. & Joshua-Tor, L. Mechanism of DNA translocation in areplicative hexameric helicase. Nature 442, 270–275 (2006).
13. Walker, J. E., Saraste, M., Runswick, M. J. & Gay, N. J. Distantly relatedsequences in the alpha- and beta-subunits of ATP synthase, myosin, kinasesand other ATP-requiring enzymes and a common nucleotide binding fold.EMBO J. 1, 945–951 (1982).
14. Dean, A. R., Shayantani, M. & Arieh, W. The physics and physical chemistryof molecular machines. Chemphyschem 17, 1719–1741 (2016).
15. Kaur, H. et al. Coupled ATPase-adenylate kinase activity in ABC transporters.Nat. Commun. 7, 13864 (2016).
16. Bagshaw, C. R. ATP analogues at a glance. J. Cell. Sci. 114, 459–460(2001).
17. Myers, T. C., Nakamura, K. & Flesher, J. W. Phosphonic acid analogs ofnucleoside phosphates. I. The synthesis of 5″-adenylylmethylenediphosphonate, a phosphonic acid analog of ATP. J. Am. Chem. Soc.85, 3292–3295 (1963).
18. Fisher, A. J. et al. X-ray structures of the myosin motor domain ofdictyostelium discoideum complexed with MgADP·BeFx and MgADP·AlF4.Biochemistry 34, 8960–8972 (1995).
19. Menz, R. I., Walker, J. E. & Leslie, A. G. W. Structure of bovine mitochondrialF1-ATPase with nucleotide bound to all three catalytic sites: implicationsfor the mechanism of rotary catalysis. Cell 106, 331–341 (2001).
20. Sondek, J., Lambright, D. G., Noel, J. P., Hamm, H. E. & Sigler, P. B.GTPase mechanism of Gproteins from the 1.7-Å crystal structure oftransducin α-GDP-AIF-4. Nature 372, 276 (1994).
21. Wiegand, T. et al. Monitoring ssDNA binding to the DnaB helicase fromHelicobacter pylori by solid-state NMR spectroscopy. Angew. Chem. Int. Ed.55, 14164–14168 (2016).
22. Takegoshi, K., Nakamura, S. & Terao, T. 13C–1H dipolar-assisted rotationalresonance in magic-angle spinning NMR. Chem. Phys. Lett. 344, 631–637(2001).
23. Takegoshi, K., Nakamura, S. & Terao, T. 13C–13C polarization transfer byresonant interference recoupling under magic-angle spinning in solid-stateNMR. Chem. Phys. Lett. 307, 295–302 (1999).
24. Wiegand, T. et al. Variability and conservation of structural domains individe-and-conquer approaches. J. Biomol. NMR 65, 79–86 (2016).
25. Schuetz, A. et al. Protocols for the sequential solid-state NMR Spectroscopicassignment of a uniformly labeled 25 kDa protein: HET-s (1-227).Chembiochem 11, 1543–1551 (2010).
26. Higman, V. A. Solid-state MAS NMR resonance assignment methods forproteins. Prog. Nucl. Magn. Reson. Spectrosc. 106-107, 37–65 (2018).
27. Williamson, M. P. Using chemical shift perturbation to characterise ligandbinding. Prog. Nucl. Magn. Reson. Spectrosc. 73, 1–16 (2013).
28. Hoffman, M. M. et al. AANT: The amino acid–nucleotide interactiondatabase. Nucleic Acids Res. 32, D174–D181 (2004).
29. Stelter, M. et al. Architecture of a dodecameric bacterial replicative helicase.Structure 20, 554 (2012).
30. Wiegand, T. et al. Solid-state NMR and EPR Spectroscopy of Mn2+-Substituted ATP-Fueled Protein Engines. Angew. Chem. Int. Ed. 56,3369–3373 (2017).
31. Tamaki, H. et al. Structure determination of uniformly 13C, 15N labeledprotein using qualitative distance restraints from MAS solid-state 13C-NMRobserved paramagnetic relaxation enhancement. J. Biomol. NMR 64, 87–101(2016).
32. Soni, R. K., Mehra, P., Choudhury, N. R., Mukhopadhyay, G. & Dhar, S. K.Functional characterization of Helicobacter pylori DnaB helicase. Nucleic AcidsRes. 31, 6828–6840 (2003).
33. Esadze, A. et al. Changes in conformational dynamics of basic sidechains upon protein–DNA association. Nucleic Acids Res. 44, 6961–6970(2016).
34. Frigyes, D., Alber, F., Pongor, S. & Carloni, P. Arginine–phosphate salt bridgesin protein–DNA complexes: a Car–Parrinello study. J. Mol. Struct.:THEOCHEM 574, 39–45 (2001).
35. Lauriane, L. et al. Localizing conformational hinges by NMR: Where dohepatitis B Virus core proteins adapt for capsid assembly? Chemphyschem 19,1336–1340 (2018).
36. Bertini, I. et al. Solid-state NMR of proteins sedimented by ultracentrifugation.Proc. Natl. Acad. Sci. 108, 10396–10399 (2011).
37. Gardiennet, C. et al. A sedimented sample of a 59 kDa dodecameric helicaseyields high-resolution solid-state NMR spectra. Angew. Chem. Int. Ed. 51,7855–7858 (2012).
ARTICLE NATURE COMMUNICATIONS | https://doi.org/10.1038/s41467-018-07968-3
10 NATURE COMMUNICATIONS | (2019) 10:31 | https://doi.org/10.1038/s41467-018-07968-3 | www.nature.com/naturecommunications

38. Gardiennet, C. et al. Solid-state NMR chemical-shift perturbations indicatedomain reorientation of the DnaG primase in the primosome of Helicobacterpylori. J. Biomol. NMR 64, 189–195 (2016).
39. Studier, F. W. Protein production by auto-induction in high-density shakingcultures. Protein Expr. Purif. 41, 207–234 (2005).
40. Böckmann, A. et al. Characterization of different water pools in solid-stateNMR protein samples. J. Biomol. NMR 45, 319–327 (2009).
41. Gor’kov, P. L. et al. Low-E probe for 19F–1H NMR of dilute biological solids.J. Magn. Reson. 189, 182–189 (2007).
42. Fogh, R. et al. The CCPN project: an interim report on a data model for theNMR community. Nat. Struct. Mol. Biol. 9, 416–418 (2002).
43. Vranken, W. F. et al. The CCPN data model for NMR spectroscopy:Development of a software pipeline. Protein.: Struct., Funct., Bioinforma. 59,687–696 (2005).
44. Stevens, T. et al. A software framework for analysing solid-state MAS NMRdata. J. Biomol. NMR 51, 437–447 (2011).
45. Strycharska, M. S. et al. Nucleotide and partner-protein control of bacterialreplicative helicase structure and function. Mol. Cell 52, 844–854 (2013).
AcknowledgementsThis work was supported by the Swiss National Science Foundation (Grant200020_159707 and 200020_178792), the French ANR (ANR-14-CE09-0024B), theLABEX ECOFECT (ANR-11-LABX-0048) within the Université de Lyon programInvestissements d’Avenir (ANR-11-IDEX-0007), and the ETH Career SEED-69 16-1.This project has received funding from the European Research Council (ERC) under theEuropean Union’s Horizon 2020 research and innovation programme (grant agreementn° 741863, FASTER).
Author contributionsT.W. collected the NMR data, J.T. performed and analysed the fluorescence anisotropymeasurements, R.C. prepared the samples. T.W., D.L., A.B. and B.H.M analysed data,T.W., D.L., J.T., L.T, A.B. and B.H.M. interpreted. T.W., A.B. and B.H.M. designed
research, A.B. and B.H.M. were the primary investigators. T.W., A.B. and B.H.M.wrote the paper which was edited and approved by all authors.
Additional informationSupplementary Information accompanies this paper at https://doi.org/10.1038/s41467-018-07968-3.
Competing interests: The authors declare no competing interests.
Reprints and permission information is available online at http://npg.nature.com/reprintsandpermissions/
Journal peer review information: Nature Communications thanks the anonymousreviewers for their contribution to the peer review of this work. Peer reviewer reports areavailable.
Publisher’s note: Springer Nature remains neutral with regard to jurisdictional claims inpublished maps and institutional affiliations.
Open Access This article is licensed under a Creative CommonsAttribution 4.0 International License, which permits use, sharing,
adaptation, distribution and reproduction in any medium or format, as long as you giveappropriate credit to the original author(s) and the source, provide a link to the CreativeCommons license, and indicate if changes were made. The images or other third partymaterial in this article are included in the article’s Creative Commons license, unlessindicated otherwise in a credit line to the material. If material is not included in thearticle’s Creative Commons license and your intended use is not permitted by statutoryregulation or exceeds the permitted use, you will need to obtain permission directly fromthe copyright holder. To view a copy of this license, visit http://creativecommons.org/licenses/by/4.0/.
© The Author(s) 2019
NATURE COMMUNICATIONS | https://doi.org/10.1038/s41467-018-07968-3 ARTICLE
NATURE COMMUNICATIONS | (2019) 10:31 | https://doi.org/10.1038/s41467-018-07968-3 |www.nature.com/naturecommunications 11