the confusing link between regime type and happinessadutt/activities/documents/... · the confusing...
TRANSCRIPT

The Confusing Link between Regime Type and Happiness
Tom W. Rice
Matthew Cherry
Charlotte Ridge
University of Iowa
This paper is in early draft form. It was prepared for the “New Directions in the Study of Happiness: United States and International Perspectives” conference held at Notre Dame University, October 22-24, 2006. Contact person: Tom Rice, Department of Political Science, University of Iowa, Iowa City, Iowa 52241 [email protected]

2
Abstract
In a recent study, Radcliffe (2001) provides substantial empirical support for a powerful
and controversial thesis: people tend to be happier under social democratic welfare
regimes. Our research expands on his tests buy making relatively minor additions to his
data. The results reopen the question of the relationship between regime type and
happiness. Depending on the variables in play, it is possible to generate many
conclusions. Some models support the thesis that social democratic welfare regimes lead
to happiness, other models show no relationship, and still other models show that rightist
regimes lead to more happiness. Moreover, through some creative analyses we find
evidence that the causal arrow between regime type and happiness may actual run from
happiness to regime type, not the other way around. At this juncture, it is simply not
possible to say with certainty what the relationship is between regime type and happiness
– or even if there is a relationship.

3
The Confusing Link between Regime Type and Happiness
In a recent study, Radcliffe (2001) provides substantial empirical support for a powerful
and controversial thesis: people tend to be happier under social democratic welfare
regimes. To Leftists, this thesis is obvious; of course people are happier when they have
social programs to protect them against the harsh realities of the market place. To
Rightists, the thesis is flatly wrong; welfare undermines personal responsibility and
breeds dependency, ultimately leaving people unhappy. Clearly, this is an important and
ideologically charged thesis. Not only does it claim that life is better under one ideology
than another, it is making the claim with respect to human happiness, perhaps the most
meaningful measure of a good society.
Given the significance of the thesis, it is especially important to test it thoroughly.
If it is supported with a variety of empirical analyses, then Leftists would appear to be
correct and the case for expansive social programs would be greatly enhanced. If,
however, further tests find no relationship between social democratic welfare regimes and
happiness, then neither ideology can lay claim to producing happy societies. And, if the
tests tend to show that happiness is actually linked to unrestrained free market regimes,
then the Rightist may well be correct.
In this study we begin the process of expanding the tests beyond Radcliffe’s
(2001) work. We do so by making relatively small changes to his models. Starting with
the same data, we modify a few variables and add a few others. In proceeding this way,

4
we are certainly biasing our analysis in favor of supporting his thesis; after all, we are
using much of the same data. What we find is some support for his thesis, but also some
support for very different causal relationships between happiness, regime type, and a host
of other variables. These results should cause us to view with great caution the thesis that
social democratic welfare regimes lead to happiness.
Possible Causal Connections between Happiness and Regime Type
At the core of the thesis that social democratic welfare regimes lead to happiness is the
notion that the “economic insecurity and personal loss of autonomy that accompany
market economies” cause unhappiness (Radcliffe 2001: 941). Social democratic welfare
regimes help minimize this unhappiness by putting in place programs, such as
unemployment and disability benefits, that protect people against the worst effects of
market economies. In one way or another, this position is expressed in the work of Marx,
Polanyi (1944), Lindblom (1977), Lane (1978), and many others. Put in terms of a
simple model, the position can be expressed as:
Regime type → Happiness (Hypothesis 1) Under this model, social democratic welfare regimes lead to more happiness than other
forms of democratic regimes.
One competing view, sometimes called comparison theory, contends that relative
economic well-being determines happiness (Easterlin 1974). People who are well off
economically compared to others around them will be happier than people who are not as
well off. The key to the theory is that people are presumed to compare themselves to
others in their immediate geographic and social sphere. If correct, this means that

5
aggregate happiness levels should be very similar across societies with different regime
types because every society has people above and below the prevailing economic norm.
This position can be expressed as:
Regime type ≠ Happiness (Hypothesis 2)
Another competing view, often called cultural theory, maintains that countries
have different aggregate happiness levels because of lasting cultural differences
(Inglehart 1990, Inkeles 1997, Rice and Steele 2004). One version of cultural theory
leaves room for regime type and other “short-term” forces to influence happiness around
the edges, but it maintains that happiness is primarily the function of deeply held cultural
norms. Given the dominant position of culture in this version, it is best expressed as:
Culture → Happiness (Hypothesis 3)
A second version of the cultural theory contends that culture influences not only
happiness, but many of the “short-term” forces correlated with happiness, including
regime type. According to this view, any relationship between regime type and
happiness is spurious because both of these factors are determined in large part by
culture. Put another way, once culture is brought into consideration the influence of
regime type on happiness should disappear. This version can be expressed in a three part
hypothesis as:
Culture → Happiness
Culture → Regime Type
Regime type ≠ Happiness (Hypothesis 4)
Yet another alternative formulation for the relationship between regime type and
happiness holds that the causal arrow between the two runs from happiness to regime

6
type, not the other way around. The rationale for reversing the causal arrow rests on the
assumption that happy people are less insular and more open to sharing personal
resources to help others. With respect to regimes types, it means that happy people
should be more willing to support social programs and social democratic welfare
regimes, everything else being equal. This position can be expressed as:
Happiness → Regime type (Hypothesis 5)
Analysis: Aggregate Data
We take as our starting point Radcliff’s (2001) aggregate models. For a
dependent variable, he uses happiness scores for 15 industrial democracies derived from
the 1990 wave of the World Values Survey (WVS). Each country’s score is calculated
using responses to the question: “All things considered, how satisfied are you with your
life now?” Response categories ranged from 1 (dissatisfied) to 10 (satisfied), and country
level means ranged from 6.53 (Japan) to 8.16 (Denmark).
Regime type is operationalized three ways. “Regime attributes” measures the
extent to which governments shield citizens against market dependence. Devised by
Esping-Andersen (1990), it consists of three variables that gauge “how much a national
system embodies elements of his three ideal types of welfare regime: Liberal,
Conservative, and Socialist” (Radcliff 2001: 942). All three variables are used in the
analysis, but the key hypothesis for our purposes is that happiness should be positively
related to the socialist score. Secondarily, the liberal score may be negatively correlated
with happiness because this regime type is most associated with market economies.
According to Radcliff (2001), it is not obvious how the conservative score should be

7
related to happiness. The second regime type, labeled “decommodification,” is an index
that assesses the degree to which citizens “can uphold a socially acceptable standard of
living independent of market participation,” and it, too, was created by Esping-Andersen
(1990: 37). Information about the scope of pensions, income maintenance, and
unemployment benefits was used to calculate the index. Higher scores indicate greater
decommodification, so happiness should be positively related to this variable. The third
regime type variable is “party control” and it is measured as the “cumulative portion of
leftist cabinet seats less the cumulative portion of rightist seats” from 1950 to 1990, using
data from Huber, Ragin, and Stephens (1997) (Radcliff 2001: 942). The party control
variable should be positively related to happiness. In the forthcoming individual-level
analysis we follow Radcliff’s (2001) lead and also consider a center variable that
measures the portion of seats held by center and right parties combined.
Three control variables are added to the models. To asses the impact of economic
conditions on happiness, the average unemployment rate from 1955 to 1990 (from Hall
and Franzese 1998) and the 1990 real per-capita GDP (from the Penn World Table, 5.6)
are included as independent variables. Good economic conditions should lead to more
happiness, so the unemployment rate should be negatively correlated with happiness and
the GDP should be positively correlated with happiness. The influence of culture is
gauged using a ten-point index that measures the extent to which a national culture is
individualistic. Previous work on happiness has found that people in individualistic
cultures tend to be happier than people in collectivist cultures (Diener, Diener, and
Diener 1995; Schyns 1998; Veenhoven 1997). Higher scores on the index indicate more
individualistic cultures, so happiness should be positively correlated with the index.

8
Our first task was to replicate Radcliff’s three aggregate-level regression models,
one for each of the three regime type variables. This was easy to do using the original
version of the 1990 WVS, but we got very different models using the most recent version
of the 1990 WVS data. Upon close inspection we found that the original happiness data
contained a serious data coding error for Austria that was corrected in later versions. In
short, all of the “most satisfied” responses, which should have been coded as a 10, were
mistakenly coded as a 1, indicating extreme dissatisfaction. All of the other scores were
bumped up one level, so respondents who chose a 2 were actually scored a 3, respondents
who chose a 3 were actually scored a 4, and so on. This is plainly evident in the Austrian
frequency distributions for the uncorrected and corrected data that are presented in table
1. To give a sense of the size of the error, consider that in original WVS data 23.6% of
Austrian respondents are coded as a 1 and that once the data are corrected only .4% fall in
this category. The percentage of respondents in the other countries who chose the 1
category never tops 2.2% (Italy), placing the Austrian score of 23.6% way out of line.
The mean Austrian happiness score increases from 6.51 (lowest of the 15 nations) to 7.87
(fifth highest) when it is recalculated using the corrected data.
(Table 1 about here)
Updating Radcliff’s (2001) aggregate regression models with the mean Austrian
happiness score from the corrected WVS data produces noticeably different results.
Table 2 shows the three models using the original and corrected Austrian mean. The
greatest difference is in the first model, regime attributes. With the corrected Austrian
score in the data, the socialist, liberal, and GDP measures are no longer significant and
the R-square falls from .83 to .28. In the decommodification model, the inclusion of the

9
corrected Austrian score weakens the significance of decommodification and
unemployment, and raises the cultural variable, individualism, to significance. The R-
square drops slightly, from .52 to .42. The corrected Austrian score changes the party
control model very little. Left dominance is slightly more significant, GDP is no longer
significant, and unemployment is slightly less significant. Looked at in total, the models
with the corrected Austrian happiness score weaken the case for hypothesis 1: the regime
attribute variables no longer influence happiness and the influence of decommodification
on happiness is less.
(Table 2 about here)
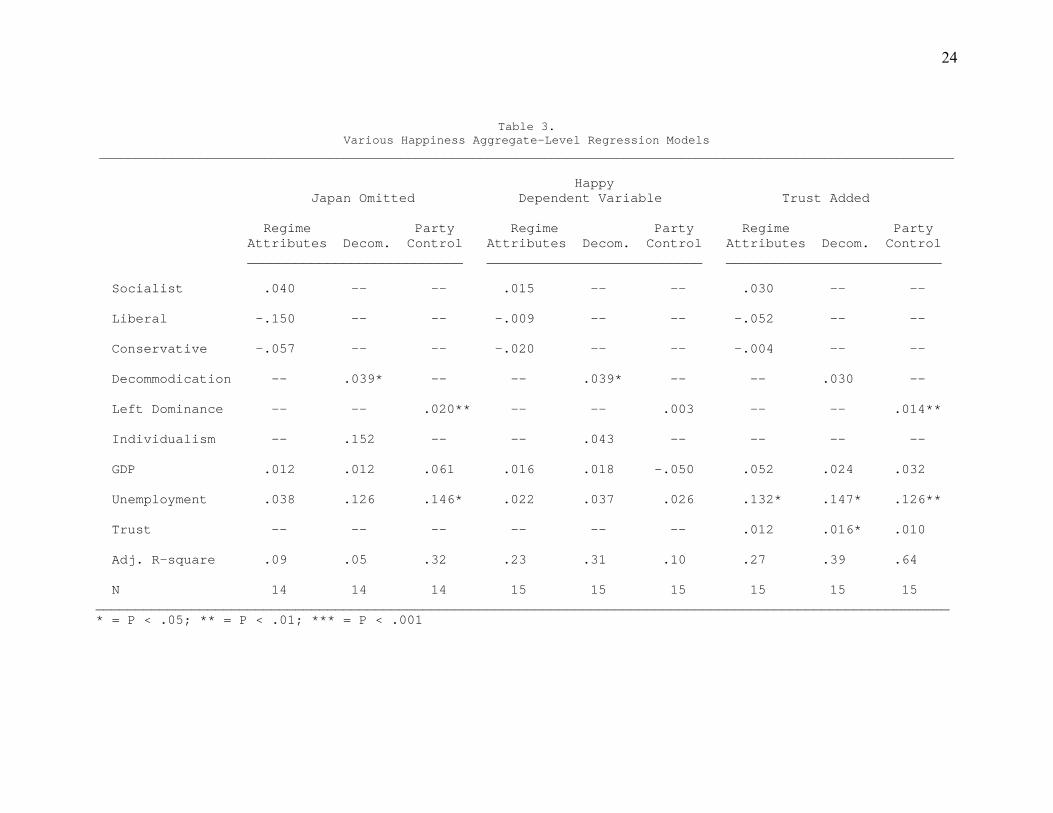
The salient changes to the models in table 2 suggest that the results are sensitive
to minor alterations in the data. We further test this possibility by making two additional
changes to the data. First, we drop Japan from the analysis and rerun the models. Japan
is an outlier in many ways: it is the only non-western nation, it has the lowest happiness
score, and it has the lowest individualism score. The first three columns in table 3 show
that the R-squares of the models dropped substantially with Japan omitted. Moreover,
the regime attribute variables fail to reach significance.
(Table 3 about here)
For our second test of the sensitivity of the models we replaced the dependent
variable with a variable that uses data from another common happiness question that was
asked in the 1990 WVS. This query reads: “Taking all things together, would you say
you are very happy, quite happy, not very happy, or not at all happy.” Some researchers
consider the life satisfaction question to be a marginally better measure of happiness, but
many studies have shown the two to be highly correlated, suggesting substituting country

10
means on the happiness question for country means on the life satisfaction question
should yield similar results. Before calculating the mean country score on the happiness
question we coded the “not at all happy” responses as a 1, the “not very happy” responses
as a 2, the “quite happy” responses as a 3, and the “very happy” responses as a 4. With
this coding scheme, the relationship between the mean country-level happiness scores
and the social democratic welfare variables should be positive if leftist regimes lead to
happiness. This is not what we find. The middle three columns in table 3 show that the
regime attribute and the left dominance variables fail to reach significance, and the
decommodification variable barely reaches significance. All of the other control
variables are insignificant. Here again, we have weak evidence at best that regime type
leads to happiness.
Next we test for the influence of culture on happiness. Radcliff limits his
consideration of culture to individualism in part because the literature has found a strong
link between individualism and happiness. Culture, however, has many dimensions, and
there is growing evidence that one of these dimensions, social capital, is a cause of
happiness (Putnam 2000; Helliwell 2003). Social capital is defined as “the features of
social organizations, such as trust, norms, and networks that can improve the efficiency
of society by facilitating coordinated action” (Putnam 1993:167). In aggregate-level
studies using survey data it is most commonly operationalized using the question:
“Generally speaking, would you say that most people can be trusted or that you can’t be
too careful in dealing with people?” This query is included in the 1990 WVS and we use
Inglehart’s (1997: 359) country-level variable created from these data that measures the

11
percentage of people in each nation who said that “most people can be trust.” If social
capital causes happiness then trust should be positively related to happiness.
By entering our country-level measure of trust into the three regime type
equations we are testing both hypotheses 3 and 4. If trust is significant along with the
various leftist measures, then this would be evidence in favor of hypothesis 3: culture
does influence happiness (but there is room for other variables to influence happiness
too). If only culture is significant, then this would be evidence in support of hypothesis
4: culture influences both happiness and regime type, leaving the link between regime
type and happiness spurious. The last three columns in table 3 display the results. In the
regime attributes model, only unemployment is significant. In the decommodification
model, trust and unemployment are significant. And in the party control model, left
dominance and unemployment are significant. These results seriously weaken the case
for the causal link from regime type to happiness. Left dominance is the only social
democratic welfare variable that remains significant after controlling for trust. The social
welfare variables in the political attributes and decommodification models are
insignificant and these are the variables that most directly measure the specific programs
designed to protect citizens from market hardships. The results also provide very little
evidence that social capital is related to happiness.
One reason that the social democratic welfare and trust variables perform so
poorly may be that they are highly interrelated. This is, indeed, often the case. For
example, the correlation coefficient between the socialist variable in the regime attributes
model and trust is .66 (p < .01). What this suggests is that culture, measured by trust, is
influencing regime type. It is possible, of course, that the causality runs the other way.

12
However, culture, by its very nature, changes slowly, often taking generations for
substantial alterations. Social democratic welfare regimes are relatively new institutions,
making it unlikely that they have had the time to significantly influence culture.
We can test this notion by creatively using data from the General Social Survey
(GSS). This study has sampled the opinions of Americans almost annually for over 30
years and most of the surveys have included the trust question. The GSS also includes a
question that asks respondents where their ancestors from. We created county-level
mean trust scores for GSS respondents who claim that their ancestors are from any of the
15 nations in Radcliff’s study. So, for example, we separated out of the GSS all of the
respondents who claim to be of French descent and calculated their mean trust score.
Before deriving the mean trust scores for the descendants from each of these nations we
purged the GSS data of all respondents who were not born in the United States, thus
leaving only respondents who were raised in this country.
Table 4 displays the simple bivariate correlations between the GSS trust variable
and the regime type variables. Surprisingly, they are almost all significant. For example,
the correlation between the GSS trust variable and the socialist variable is .66, exactly the
same as the correlation between the WVS trust variable and the socialist variable. This
correlation means that the trustfulness of the ancestors of people who emigrated from the
nations in the study to America is positively correlated with the contemporary socialist
score for the home countries: more trust is associated with a more socialist regime. The
other significant correlations suggest that more trust is associated with higher
decommodification and left dominance scores, and lower liberal scores. If we assume
that culture is slow to change, then the GSS trust scores may still be in part the product of

13
Old World trust levels that predate the rise of the social democratic welfare regimes, thus
implying that culture, measured by trust, is a key determinant of regime type. Indeed, it
is hard to imagine that the results could mean anything else.
(Table 4 about here)
The technique of using the GSS data to estimate culture scores many generations
removed from the contemporary cultures in our 15 nations can also be used to estimate
past happiness levels. This allows us to test hypothesis 5, that happiness causes regime
type, not the other way around. The GSS includes a happiness question that reads:
“Taken all together, how would you say things are these days – would you say that you
are very happy, pretty happy, or not too happy?” We coded respondents who said “very
happy” as a 3, those who said “pretty happy” as a 2, and those who said “not too happy”
as a 1, and then calculated a mean happiness score for the respondents with ancestors
from each of our 15 nations (the GSS happiness mean for all of the respondents in our
sample was used as the U.S. happiness score). These means all fall between 2.18 and
2.30, except for the mean of the Belgian descendents, which is 2.42. The standard
deviation of the Belgian mean is 3.00, making it a clear outlier. Part of the reason for this
may be that only 39 GSS respondents were of Belgian descent, the smallest of any of the
ethnic groups. With such a small sample size the estimates could easily be compromised.
Because of it outlier status and small sample size, Belgium is omitted from this analysis.
If regime type influences happiness (hypothesis 1), then the GSS mean happiness
scores should be unrelated to the social democratic welfare variables. After all, the GSS
respondents are all Americans, so the GSS means should have nothing to do with the
regimes in the other nations. If, however, there is a statistical link between the GSS

14
means and the social democratic welfare variables, the relationship would suggest that
happiness influences regime type (hypothesis 5). How else could we explain the
correlation? Previous research has established a strong link between the GSS happiness
scores and contemporary happiness scores from the WVS, implying that baseline levels
of societal happiness persist over time (Rice and Steele 2004). Thus, the GSS happiness
scores can serve as proxy happiness scores for the societal happiness levels of the
populations in our sample nations before the rise of social democratic welfare regimes. If
these scores are correlated with the regime variable it would be powerful evidence that
happiness influences regime type.
Table 5 reports the simple bivariate correlations between the GSS ancestral
happiness means and the regime variables. Three of the five correlations are significant.
The significant correlation of .72 between the socialist regime attributes and the GSS
happiness variable indicates that the happiness of American ancestral groups is positively
related with the extent to which the countries in our sample exhibit social democratic
welfare regime characteristics; put more simply, happy American ancestral groups are
associated with leftist programs in other nations. The significant negative coefficient for
the link between conservative regime attributes and the GSS means implies that unhappy
American ancestral groups are associated with conservative programs in other nations.
And, the significant positive coefficient for the link between decommodification and the
GSS means indicates that happy American ancestral groups are associated with countries
that protect citizens against the worst of market economies. The coefficients for the other
two variables, liberal regime attributes and left dominance, are insignificant, but they are

15
in the direction that hints that happy American ancestral groups are associated with less
liberal regimes and more leftist regimes.
Taken as a whole, the correlations provide very suggestive evidence that
happiness influences regime type. Given these results, it is certainly plausible that
happiness encourages compassionate social welfare regimes. At the very least, the results
cast serious doubt on the direction of the causal arrow between regime type and
happiness. It may be that regime type has some influence on happiness, but it also looks
like happiness significantly influences regime type too. Until the relative influence of
these causal orders can be sorted out, we should be cautious in attributing the positive
link between regime type and happiness primarily to the effect of regime on happiness.
Our analyses of the aggregate data suggest that the causal connection between
regime type and happiness is not obvious. In some models there is a statistically
significant link between happiness and regime type, but in many other models the
correlation disappears. Moreover, there is reason to suspect that any causal arrow that
runs between regime type and happiness may actually point from happiness to regime
type, and no the other way around. One of the reasons that we can arrive at differing
conclusions with the aggregate data is probably the small sample size. In the next
section, we move to a limited reexamination of Radcliff’s (2001) individual level
analysis.
Analysis: Individual-Level Data
Radcliff (2001) uses the WVS 1990 individual-level data, supplemented with
appropriate aggregate level variables, to further test for a connection between regime type

16
and happiness. In short, the individual-level responses to the life satisfaction question for
the 15 nations serve as the dependent variable and a whole host of relevant independent
variables, including the regime type variables from the aggregate-level analysis, are
entered as independent variables in regression equations. The regime variables are
formed by attaching to every individual in the WVS survey his or her nations’ regime
scores. This technique is also used to attach to the individuals their nations’
individualism score, GDP, and unemployment rate.
We were quite successful in replicating Radcliff’s individual-level models using
the old (and incorrect) Austrian data. The individual coefficients were slightly different,
but they were not off enough to affect their level of significance. The reason for the
imperfect replication of the models may have to do with some complicated recoding of
certain independent variables or it could be that we had a slightly different early release
of the 1990 WVS data. In any event, data differences would appear to be small because
the regression equations are very similar.
The first models that we present use the most current version of the 1990 WVS
data that include the corrected Austrian data. Table 6 reports the results (“core data”
columns) and they are very similar to Radcliff’s (2001) original models. In particular, the
regime variable coefficients are almost identical: socialist and liberal are significant in the
expected direction in the regime attribute model; decommodification is significant in the
expected direction in that model, and left dominance is significant in the expected
direction in the party control model. Most of the independent variables also behave as
expected. When we experimented with omitting Japan the regime variables remained
significant, although they were weakened a bit (models not shown). These analyses are

17
good news for the thesis that social democratic welfare governments lead to happiness.
The individual-level models, with their larger sample sizes, seem to give some stability to
the regime type variables.
(table 6 about here)
For a further test of the individual-level relationship between regime type and
happiness we include in the models four control variables for social capital. The first is
the individual-level responses to the trust question. The second is a summary tally of the
voluntary group memberships of each respondent. Along with trust, voluntary
membership is a common measure of social capital (Putnam 1993, 2000). The WVS
includes a list of 15 types of voluntary groups (e.g., church, youth, service, etc.) and
respondents are asked: “Please look carefully at the following list of voluntary
organizations and activities and say which if any do you belong to.” We simply summed
the number of “belong” answers by respondent to create an individual-level interval scale
of total group membership. We also calculated the mean trust level for each of the 15
nations and the mean total group membership level for each of the nations and attached
these scores to the respondents. This means that each respondent has four social capital
scores: his or her own trust level; his or her own group membership total; his or her
national mean trust level; and his or her national mean total group membership.
Table 6 displays the individual-level regime type regression equations with the
social capital variables included (the second column under each of the three regime
types). Adding the social capital variables significantly weakens the influence of many
of the regime type variables. A comparison of the regime attributes models in the table
show that with the social capital variables included the liberal variable fails to reach

18
significance, the socialist variable is less significant, and the conservative variable
reaches significance in the positive direction, meaning conservative regimes lead to
greater happiness. The decommodification models show that the effects of
decommodification drop significantly when the social capital variables are added (in
terms of t-values, the decommodification variable drops from 7.60 to 2.34). In the party
control models the effect of left dominance remains strong (but the t-values fall from 9.33
to 5.21). These models make clear that including the social capital variables seriously
erodes the relationship between regime type and happiness. The models also make clear
that social capital is closely related to happiness. Individual-level trust is the second most
significant variable in all of the models, behind only the measure of satisfaction with
home life. And, many of the other social capital variables are also significant.
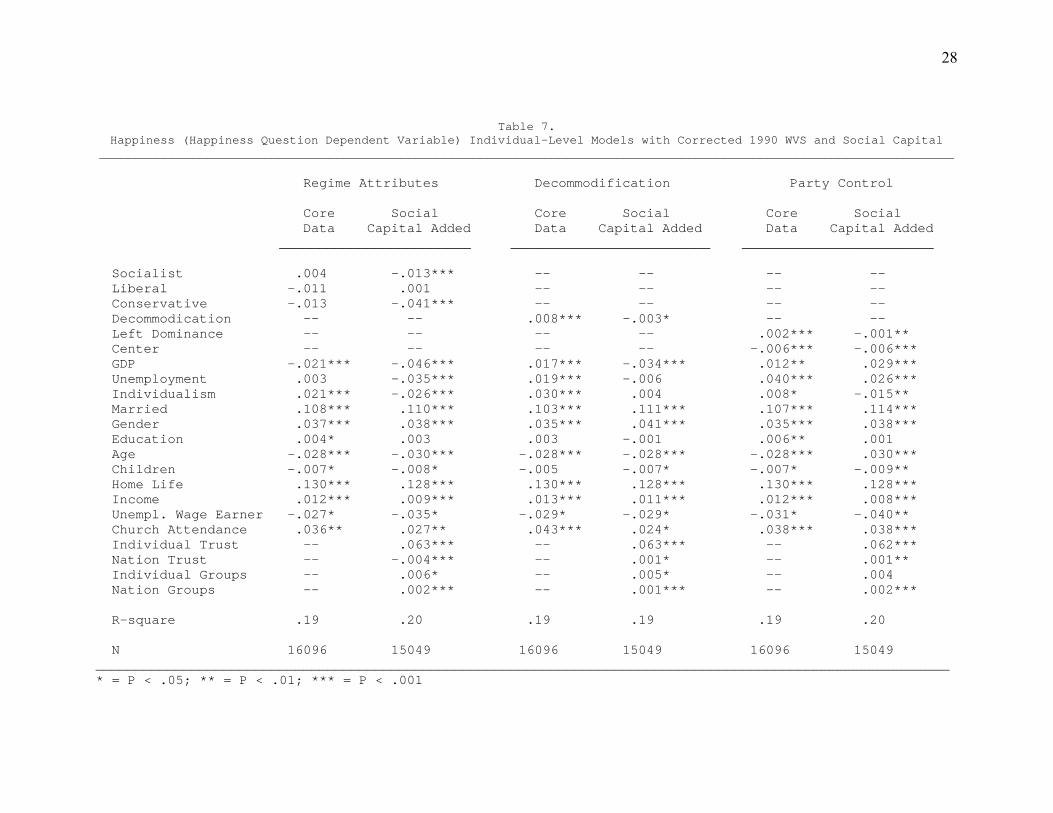
Next, we change the individual-level dependent variable from the life satisfaction
question to the happiness question. As noted earlier, these two measures of well-being
have different strengths, but both are commonly employed in the literature. Two
regression equations for each of the different regime type measures are presented in table
7, one without the social capital controls and one with the social capital controls.
Looking first at the models without social capital controls we see that the effect of regime
type varies somewhat from the models with the life satisfaction as the dependent variable
(from table 6). First, the R-squares are much lower, falling from around .33, to around
.19. The individual coefficients for some of the regime variables are quite different too.
In the regime attributes model the socialist variable is not significant and the conservative
variable is very significant (the liberal variable remains significant). The
decommodification variable remains significant in its model. And, the center variable

19
becomes highly significant in the party control model (left dominance remains
significant). Clearly, substituting the happiness question for the life satisfaction question
changes the coefficients of many of the regime variables significantly, and weakens
somewhat the case for the thesis that social democratic welfare regimes lead to happiness.
(table 7 about here)
To finish our analysis, we add the four social capital variables to the models that
use the happiness question as the dependent variable. These regression equations are
presented in table 7. Here we see some very different results for the regime type
variables. In the regime attributes model, the socialist coefficient is significant and
negative, indicating that people in social democratic welfare regimes are less happy than
in other regimes. The liberal coefficient is not significant and the conservative
coefficient is significant and negative. In the decommodification model, the
decommodification variable is significant and negative, indicating that people in nations
with programs to protect against economic hardships are less happy than people in other
nations. And, in the party control model, the left dominance variable is significant and
negative, indicating that people in nations controlled by parties on the left are less happy
than people in other nations. The center variable is also significant and negative. These
results provide consistent evidence that social democratic welfare regimes are associated
with less happiness, not more.
In sum, how do the individual-level findings speak to the five proposed
hypothesis about the relationship between regime type and happiness? The message is
very different depending on how happiness is measured. If the dependent variable is life
satisfaction it looks like social democratic welfare regimes are often associated with

20
higher happiness levels, supporting hypothesis 1. The significance of the regime
variables is weakened when cultural variables, measured as social capital, are entered in
the models. The social capital variables are generally significant. This provides some
evidence for hypothesis 3 that contends that there is room for both culture and regime
type to influence happiness. Before concluding, however, that social democratic welfare
regimes lead to happiness, we need to remember that there is substantial evidence from
the aggregate-level analysis that the causality flows the other way, from happiness to
regime type. We are not able to get any leverage on this matter with the individual-level
data, so we are left with the conclusion that once we control for culture there is a modest
link between regime type and happiness but we do not know for sure which variable is
causing the other. The link supports hypothesis 1, but it also supports hypothesis 5.
If the dependent variable is the happiness question, then the conclusions are much
different and much less friendly to the thesis that social democratic welfare regimes lead
to happiness. Without the social capital control variables, the link between regime type
and happiness is generally weak, but present. However, once we control for social
capital the conclusion seems to be that people are actually less happy under social
democratic welfare regimes than other regimes. This means that hypothesis 1, which
holds that social democratic welfare regimes should lead to happiness, is not supported.
The social capital variables are generally significant, so we seem to have a version of
hypothesis 4. Under this version, controlling for culture alters the effect of the regime
variables, but instead of rendering them insignificant, the culture variables cause the
significant relationship between social democratic welfare regimes and happiness to
change to a significant relationship between rightist regimes and happiness. Of course, it

21
must be remembered that part of any relationship between regime type and happiness
could be the result of happiness causing regime type. In this case that would mean that
happy people elect rightist regimes.
Discussion
The results of our research serve to reopen the question of the relationship
between regime type and happiness. Depending on the variables in play, it is possible to
generate support for any of the five alternative hypotheses. So mixed are the results, that
it is not possible to say that any one of the hypotheses overshadows the others. The two
clearest findings are that culture, in the form of social capital, is an important correlate of
happiness and that the relationship between regime type and happiness is often changed
considerably when social capital is included in the equation. Generally speaking, when
social capital was added to the regression models the link between social democratic
welfare regimes and happiness was weakened, often to the point of insignificance. And,
in some cases, the inclusion of culture actually reversed the link between social
democratic welfare regimes and happiness, leaving the variables measuring these regimes
negatively correlated with happiness.
The results are not what the leftists – or rightists – want to hear. At this juncture,
it is simply not possible to say with certainty what the relationship is between regime
type and happiness – or even if there is a relationship. And, given how confusing our
results are it may be a while before the causal nexus between these two factors is
untangled.

22
Table 1. 1990 WVS Austrian Life Satisfaction Frequencies
_________________________________________________________________
Satisfaction Scale Original Data Corrected Data 1 (Dissatisfied) 344 23.6% 6 0.4% 2 6 0.4 4 0.3 3 4 0.3 30 2.1 4 30 2.1 29 2.0 5 29 2.0 116 8.0 6 116 8.0 105 7.2 7 105 7.2 215 14.8 8 215 14.8 375 25.7 9 375 21.7 233 16.0 10 (Satisfied) 233 16.0 344 23.6 1457 100.0% 1457 100.0% _________________________________________________________________

Table 2. Happiness (Life Satisfaction) Aggregate-Level Regression Models with Original and Corrected 1990 WVS Data
_______________________________________________________________________________________________________________________
Regime Attributes Decommodification Party Control Original Corrected Original Corrected Original Corrected Data Data Data Data Data Data _____________________ _____________________ _____________________ Socialist .109** .056 -- -- -- -- Liberal -.046* -.059 -- -- -- -- Conservative .034 -.032 -- -- -- -- Decommodication -- -- .056** .041* -- -- Left Dominance -- -- -- -- .017** .018*** Individualism -- -- .086 .168* -- -- GDP .087* .059 .084 .018 .098* .056 Unemployment .211*** .131* .243*** .133* .191*** .132** Adj. R-square .83 .28 .52 .42 .58 .59 N 15 15 15 15 15 15 ___________________________________________________________________________________________________________ * = P < .05; ** = P < .01; *** = P < .001
24
Table 3. Various Happiness Aggregate-Level Regression Models
_______________________________________________________________________________________________________________________
Happy Japan Omitted Dependent Variable Trust Added Regime Party Regime Party Regime Party Attributes Decom. Control Attributes Decom. Control Attributes Decom. Control ___________________________ ___________________________ ___________________________ Socialist .040 -- -- .015 -- -- .030 -- -- Liberal -.150 -- -- -.009 -- -- -.052 -- -- Conservative -.057 -- -- -.020 -- -- -.004 -- -- Decommodication -- .039* -- -- .039* -- -- .030 -- Left Dominance -- -- .020** -- -- .003 -- -- .014** Individualism -- .152 -- -- .043 -- -- -- -- GDP .012 .012 .061 .016 .018 -.050 .052 .024 .032 Unemployment .038 .126 .146* .022 .037 .026 .132* .147* .126** Trust -- -- -- -- -- -- .012 .016* .010 Adj. R-square .09 .05 .32 .23 .31 .10 .27 .39 .64 N 14 14 14 15 15 15 15 15 15 ___________________________________________________________________________________________________________ * = P < .05; ** = P < .01; *** = P < .001

Table 4. Correlations Between GSS Trust and Regime Type Variables
_______________________________________________________________________ Regime Variables GSS Trust Socialist .66** Liberal -.66** Conservative -.10 Decommodification .64* Left Dominance .54* _______________________________________________________________________ N = 15 for all correlations

26
Table 5. Correlations Between GSS Happiness and Regime Type Variables
_______________________________________________________________________ Regime Variables GSS Happiness Socialist .72** Liberal -.31 Conservative -.66** Decommodification .45* Left Dominance .33 _______________________________________________________________________ N = 14 for all correlations

Table 6. Happiness (Life Satisfaction Dependent Variable) Individual-Level Models with Corrected 1990 WVS and Social Capital
_______________________________________________________________________________________________________________________ Regime Attributes Decommodification Party Control Core Social Core Social Core Social Data Capital Added Data Capital Added Data Capital Added ________________________ _________________________ ________________________ Socialist .017** -.017* -- -- -- -- Liberal -.027** -.008 -- -- -- -- Conservative -.008 .023** -- -- -- -- Decommodication -- -- .020** .009** -- -- Left Dominance -- -- -- -- .009*** .006*** Center -- -- -- -- .000 .001 GDP .008 -.002 .004 -.002 .002 .007 Unemployment .010 -.001 .030** .008 .015 .005 Individualism .048** .040** .060** .035** .035** .028* Married -.060* -.065* -.067* -.066* -.059* -.063* Gender .052* .059* .046* .054* .053* .058* Education .014** -.006 .010* -.005 .006 -.008 Age -.023** -.019* -.024** -.022* -.023** -.021* Children -.011 -.015 -.009 -.015 -.009 -.014 Home Life .561*** .551*** .561*** .551*** .557*** .548*** Income .047*** .044*** .049*** .041*** .050*** .044*** Unempl. Wage Earner -.177*** -.183*** -.183*** -.193*** -.179*** -.189*** Church Attendance .144*** .102** .162*** .136*** .138*** .122*** Individual Trust -- .293*** -- .293*** -- .293*** Nation Trust -- .009*** -- .004** -- .002* Individual Groups -- .020* -- .019* -- .023** Nation Groups -- .001** -- .001* -- .000 R-square .33 .34 .33 .33 .33 .34 N 16467 15357 16467 15357 16467 15357 ___________________________________________________________________________________________________________ * = P < .05; ** = P < .01; *** = P < .001
28
Table 7. Happiness (Happiness Question Dependent Variable) Individual-Level Models with Corrected 1990 WVS and Social Capital
_______________________________________________________________________________________________________________________ Regime Attributes Decommodification Party Control Core Social Core Social Core Social Data Capital Added Data Capital Added Data Capital Added ________________________ _________________________ ________________________ Socialist .004 -.013*** -- -- -- -- Liberal -.011 .001 -- -- -- -- Conservative -.013 -.041*** -- -- -- -- Decommodication -- -- .008*** -.003* -- -- Left Dominance -- -- -- -- .002*** -.001** Center -- -- -- -- -.006*** -.006*** GDP -.021*** -.046*** .017*** -.034*** .012** .029*** Unemployment .003 -.035*** .019*** -.006 .040*** .026*** Individualism .021*** -.026*** .030*** .004 .008* -.015** Married .108*** .110*** .103*** .111*** .107*** .114*** Gender .037*** .038*** .035*** .041*** .035*** .038*** Education .004* .003 .003 -.001 .006** .001 Age -.028*** -.030*** -.028*** -.028*** -.028*** .030*** Children -.007* -.008* -.005 -.007* -.007* -.009** Home Life .130*** .128*** .130*** .128*** .130*** .128*** Income .012*** .009*** .013*** .011*** .012*** .008*** Unempl. Wage Earner -.027* -.035* -.029* -.029* -.031* -.040** Church Attendance .036** .027** .043*** .024* .038*** .038*** Individual Trust -- .063*** -- .063*** -- .062*** Nation Trust -- -.004*** -- .001* -- .001** Individual Groups -- .006* -- .005* -- .004 Nation Groups -- .002*** -- .001*** -- .002*** R-square .19 .20 .19 .19 .19 .20 N 16096 15049 16096 15049 16096 15049 ___________________________________________________________________________________________________________ * = P < .05; ** = P < .01; *** = P < .001

References
Diener, Ed, Marissa Diener, and Carol Deiner. 1995. “Factors Predicting the Subjective
Well-Being of Nations.” Journal of Personality and Social Psychology 69: 851-864.
Esping-Andersen, Gøsta. 1990. The Three Worlds of Welfare Capitalism. Princeton,
NJ: Princeton University Press. Hall, Peter and Robert Franzese. 1998. “Mixed Signals: Central Bank Independence,
Coordinated Wage Bargaining, and European Monetary Union.” International Organization 52: 505-535.
Helliwell, John. 2003. “How’s Life?: Combining Individual and National Variables to
Explain Subjective Well-Being.” Economic Modeling 20: 331-360. Huber, Evelyne, Charles Ragin, and John D. Stephens. 1997. Comparative Welfare
States Dataset. Northwestern University and University of North Carolina. http://www.unc.edu/~jdsteph (accessed April 10, 1998).
Inglehart, Ronald. 1990. Culture Shift in Advanced Industrial Society. Princeton, NJ:
Princeton University Press. Inglehart, Ronald. 1997. Modernization and Postmodernization. Princeton, NJ:
Princeton University Press. Inkeles, Alex. 1997. National Character. New Brunswick, NJ: Transaction. Lane, Robert. 1978. “Autonomy, Felicity, Futility.” The Journal of Politics 40: 1-24. Lindblom, Charles. 1977. Politics and Markets. New York: Basic Books. Polanyi, Karl. 1944. The Great Transformation. New York: Rinehart. Putnam, Robert. 1993. Making Democracy Work. Princeton, NJ: Princeton University
Press. Putnam, Robert. 2000. Bowling Alone. New York: Simon & Schuster. Radcliff, Benjamin. 2001. “Politics, Markets, and Life Satisfaction: The Political Economy of Human Happiness,” American Political Science Review 95: 939- 952.

30
Rice, Tom and Brent Steele. 2004. “Subjective Well-Being and Culture Across Time and Space.” Journal of Cross-Cultural Psychology 35: 633-647.
Schyns, P. 1998. “Crossnational Differences in Happiness: Economic and Cultural
Factors Explored.” Social Indicators 43: 3-26. Veenhoven, Ruut. 1997. “Quality of Life in Individualistic Society.” In The Gift of
Society, ed. Mart-Jan DeJong and Anton Zijderveld. Nijker, the Netherlands: Enzo Press. Pp. 149-170.