the connecticut department of energy and … statement of adoption in accordance with section...
TRANSCRIPT

1
The Connecticut Department of Energy and Environmental Protection is an Affirmative Action and Equal Opportunity Employer that is committed to complying with the Americans with
Disabilities Act. To request an accommodation contact us at 860-418-5910 or [email protected].

2
Contents
Statement of Adoption ..................................................................................................................................... 3
Introduction ............................................................................................................................................................... 4
Vision: Up the Hierarchy ................................................................................................................................... 6
What is 60 Percent Diversion? ......................................................................................................................... 7
Integrating Climate, Energy, Air Quality, and Materials Management Planning ........................................... 8
Highlights of 2006 SWMP Implementation ..................................................................................................... 9
Development of the 2016 CMMS .................................................................................................................. 10 a. Waste Characterizations and Forecasts .................................................................. 10 b. Stakeholder Input and Recommendations ............................................................. 11
Leading Challenges ......................................................................................................................................... 12
Opportunities to Increase Diversion .............................................................................................................. 13 a. Develop New Product Stewardship Programs ....................................................... 13 b. Reduce the Generation and Toxicity of Waste ....................................................... 16 c. Promote Reuse ........................................................................................................ 16
d. Improve Collection and Processing Systems for Traditional Recyclables ............... 17 e. Increase Source Separation and Composting/Conversion of Food Scraps
and Organics ................................................................................................................. 19 f. Increase Recycling and Reuse of Construction & Demolition Materials
and Oversized MSW ............................................................................................... 20 g. Embrace Technological Approaches to Diversion................................................... 22
Actions to Maintain System Capacity ............................................................................................................. 23
Other Wastes .................................................................................................................................................. 28
Measuring CMMS Outcomes ......................................................................................................................... 31
Materials Management by the Numbers (2016) ........................................................................................... 34
CMMS Actions & Implementation.................................................................................................................. 48 Goal 1: Improve the performance of municipal recycling programs and reduce waste,
including increasing participation and compliance with mandatory recycling provisions ........................................................................................................................ 48
Goal 2: Develop and improve recycling and waste conversion technologies .................... 52 Goal 3: Encourage corporations that design, produce, and market products to share
responsibility for stewarding those materials in an environmentally sustainable manner…………………………………………………………………………………………………………….54

3
Statement of Adoption
In accordance with Section 22a-241a of the Connecticut General Statutes (CGS), the Department of Energy and Environmental Protection (DEEP) has updated the State Solid Waste Management Plan adopted pursuant to CGS § 22a-228 to include a strategy for diverting, through source reduction, reuse and recycling, not less than sixty percent of the solid waste generated in the state after January 1, 2024. In accordance with CGS § 22a-228 and the regulations adopted thereunder, notice of this revision was provided on March 8, 2016. The effective date of this State Solid Waste Management Plan, herein referred to as the Comprehensive Materials Management Strategy, shall be July 19, 2016.
Robert J. Klee Commissioner Department of Energy and Environmental Protection

4
Introduction
This Comprehensive Materials Management Strategy (“CMMS” or “Strategy”) is an update to the State Solid Waste Management Plan (“Plan”). This Strategy is focused on meeting Connecticut’s goal of achieving 60 percent diversion of solid waste from disposal by 2024. This target received the unanimous support of the Connecticut General Assembly in 2014 with the passage of An Act Concerning Connecticut’s Recycling and Materials Management Strategy (P.A. 14-94). Consistent with this goal, this Strategy also seeks to closely align materials management policy and planning with the state’s climate action priorities, including greenhouse gas mitigation through waste reduction and diversion from landfill, and ensuring that clean energy and greenhouse gas mitigation priorities are at the forefront of the transition to next-generation materials management technologies.
To reach 60 percent diversion, this Strategy provides the actions needed to reach three fundamental goals:
I. Improve the performance of municipal recycling programs and reduce waste, including increasing participation and compliance with mandatory recycling provisions.
II. Develop and improve recycling and waste conversion technologies.
III. Encourage corporations that design, produce, and market products to share responsibility for stewarding those materials in an environmentally sustainable manner.
The Role of this Strategy
The CMMS serves dual roles as both a strategic plan outlining the steps we must take together to meet the state’s diversion goal, and as an expression of the state’s materials management policies, including examples of how the Department of Energy and Environmental Protection (“DEEP”), within its existing regulatory role and authority, will strive to support the continuous improvement of the statewide materials management system. As we are in an era of diminishing resources at both the state and local level, this Strategy is intended to sharpen our collective focus on the highest-impact actions, as well as to highlight areas for shared effort and partnership.
The CMMS serves as the updated State Solid Waste Management Plan called for by Section 22a- 241a of the Connecticut General Statutes (CGS). In addition to providing a roadmap to achieve the state’s diversion goal, this Strategy addresses:
The modernization of solid waste / materials management infrastructure throughout the state
The management of organic materials in the waste stream
The reuse and recycling of construction and demolition materials
The development of intermediate processing centers (e.g. recycling facilities or materials recovery facilities)

5
Recommendations for the development and implementation of municipal or regional recycling programs
Options for local compliance of municipalities with recycling requirements.
According to CGS Section 22a-229, any action taken by a person, municipality, or regional authority that is governed by CGS Chapter 446d shall be consistent with this Strategy. Actions presented in this Strategy are rooted in existing statutes and regulations.
To best fulfill its role as both a strategy and expression of policy, this Strategy, more so than past plans, should be seen and treated as a living document, subject to update as frequently as changes to the waste stream, economy, and available technologies dictate.
Plan Adoption, Amendments, and Variances
The process for Plan adoption, amendment, and granting of variances is guided by the Regulations of Connecticut State Agencies (“Regulations”) Section 22a-228-1. Because this Strategy represents a comprehensive revision to the 2006 State Solid Waste Management Plan, the process for Plan adoption was followed. Subsequent changes, if they are not comprehensive in nature, should follow the process for Plan amendment described by the Regulation.
The revision process included public notice, public hearings, and a 45-day comment period. In addition, Public Act 14-94 required that a draft of this Strategy be presented to the Environment Committee of the Connecticut General Assembly. The Committee held a hearing on this Strategy. After considering all comments received and making changes to the draft based upon those comments, the Commissioner adopted this Plan by his signature on July 19, 2016.
Section 22a-228-1(b) of the Regulations anticipated that amendments will be developed by the Commissioner or at the request of municipalities and integrated into the Plan every two years as needed. The Regulations provide the process by which amendments to the Plan are made, including public notice and comment and the option for a public hearing. Consistent with the Regulations, DEEP will review the CMMS periodically, solicit input from municipalities and other stakeholders, and make amendments as needed.
Under Section 22a-228-1(c) of the Regulations, municipalities may apply to the Commissioner for temporary variances if unable to join in the implementation of any part of this Strategy.

6
Vision: Up the Hierarchy
The order of priority for managing solid waste is referred to as the “solid waste hierarchy” and is codified in CGS Section 22a-228(b). The Hierarchy favors source reduction and reuse, recycling, and composting, with remaining materials managed for energy recovery, and disposal in landfill as a last resort.
Figure 1 EPA Waste Management Hierarchy (Consistent with CT’s adopted Hierarchy)
This Strategy envisions moving up the Hierarchy, maintaining greatest preference for source reduction, reuse, recycling, and composting, while concurrently focusing on the development of state-of-the-art and emerging waste conversion technologies, including, but not limited to anaerobic digestion, gasification, plasma arc gasification, pyrolysis, and hydrolysis/fermentation (waste-to-ethanol).
With this dual focus, this Strategy seeks both to promote best practices in reduction, reuse, recycling, and composting, and to diversify Connecticut’s materials management technologies beyond the current reliance on combustion-based waste-to-energy.
Moving up the Hierarchy will conserve natural resources, reduce toxins in the environment, generate clean energy, boost industries associated with material management, and mitigate the emission of greenhouse gases (GHGs) associated with the management of waste, virgin material extraction, and product manufacture.
Achieving this vision will take shared and sustained commitment of all system participants:
State and local governments and regional planning organizations must work together to plan, implement, and evaluate waste reduction and recycling programs.
State and local governments and regional planning organizations must partner with the private sector to develop and improve recycling and waste conversion infrastructure.
Residents and businesses must comply with mandatory recycling provisions and strive to utilize best practices for sustainable materials management.

7
Collectors must strive to provide services that enable residents and businesses to maximize the amount and quality of materials collected for recycling.
Processing facilities must strive to increase both the quantity and quality of materials recovered for markets.
Businesses responsible for the design, production, and sale of products must share responsibility for lifecycle management.
What is 60 Percent Diversion?
The Strategy considers diversion to include:
(a) Reduction in annual generation of MSW from FY2005 baseline1
(b) MSW recovered annually for reuse, recycling, and composting
(c) MSW managed annually by newly developed waste conversion processes2
To achieve 60 percent diversion of MSW by the year 2024, Connecticut must divert at least 2.3 million tons from annual disposal (using FY2005 3.8 million tons in MSW generation as baseline). Since 2005, Connecticut has reduced annual generation of MSW by approximately 200,000 tons, to a total of 3.6 million tons, leaving 2.1 million tons to be diverted.
This can be achieved under the following conditions:
I. A reduction in annual MSW generation by 360,000 tons (10 percent of 3.6 million tons)
II. The reuse, recycling, and composting of 1.46 million tons of materials (45 percent of remaining 3.24 million tons)
III. The use of newly developed waste conversion processes, including anaerobic digestion, to manage at least 300,000 tons that would otherwise be disposed via traditional waste- to-energy or landfill.
If these conditions are met, approximately 1.48 million tons of MSW will remain to be disposed via traditional waste-to-energy or landfill.
To fully achieve the state’s diversion goal, Connecticut must also significantly increase the diversion of Construction and Demolition (C&D) waste.
1 The 2005 baseline is selected to fully account for progress made since the adoption of the 2006 Solid Waste Management Plan, which established a goal of 58 percent diversion by 2024.
2 Residual materials from MSW conversion processes that are ultimately disposed via traditional waste-to-energy, incineration, or landfill should not count towards the total managed by waste conversion for the purpose of calculating diversion.

8
Integrating Climate, Energy, Air Quality, and Materials Management Planning
Materials management policy intersects with climate, energy, and air quality policy and planning, as well as water quality, Long Island Sound conservation, and soil remediation programs. DEEP seeks to ensure that actions taken to advance climate change mitigation, renewable energy, and other environmental priorities will complement and advance materials management priorities.
Connecticut has a state statutory mandate to reduce GHG emissions to 80 percent below 2001 levels by 2050.3 In the state’s 2012 Greenhouse Gas Inventory, waste accounts for 0.6 percent or 2.2 million metric tons of GHG. Materials management planning that fully accounts for the GHG and air quality impacts of various management options will contribute to meeting this target. Accounting for GHG impacts will also have the co-benefit of reducing air pollutant impacts.
According to the 2009 EPA report Opportunities to Reduce Greenhouse Gas Emissions through Materials and Land Management Practices,4 approximately 42 percent of U.S. GHG emissions are associated with the energy used to produce, process, transport, and dispose of food and goods. Waste minimization through source reduction is clearly a preferred approach when considering GHG and air emissions. Reuse and recycling, by reducing the extraction of raw materials, is the next favored option. Reducing materials waste also reduces energy waste, both upstream and downstream in the life cycle of material goods.
As Connecticut seeks to transform its technologies for materials management consistent with this Strategy, DEEP will ensure that GHG and air and water quality impacts of various options are considered in the formation of the state’s technology preferences and performance standards for existing and new facilities. In addition, as part of the upcoming 2016 Comprehensive Energy Strategy (2016 CES), DEEP will carefully study how incentives for renewable energy production may be used to promote technologies that recover energy from waste. Different approaches may be needed to spur investment in new Anaerobic Digestion facilities, and to support the continued operation of existing waste-to-energy facilities in the State. The inclusion of Anaerobic Digestion as a Class I renewable resource in the state’s Renewable Portfolio Standards, as well as access to state procurement programs, has spurred the development of new Anaerobic Digestion facilities. Similar approaches could be considered for other new waste conversion technologies. The GHG mitigation benefits of existing waste-to-energy technology as an alternative to landfilling also should be considered.
3 Public Act 04-252 adopted GHG emissions reduction targets established by the Conference of New England Governors. For an overview of Connecticut laws and executive orders on climate, see http://www.ct.gov/deep/cwp/view.asp?a=4423&q=530290.
4 Report available online at: https://www3.epa.gov/region9/climatechange/pdfs/ghg-land-materials- management.pdf

9
Highlights of 2006 SWMP Implementation
Connecticut’s 2006 Solid Waste Management Plan5 set out an ambitious long-range vision to transform the materials management system into one that considers every phase of the product lifecycle, and to reduce generation and toxicity of trash. While much progress is still needed, Connecticut has utilized the vision and strategies set forth in 2006 to meet significant milestones.
Over the last decade, the state has shown leadership in creating the policies and infrastructure to manage materials sustainably. Of particular note, Connecticut set the stage for expanding our processing capacity for food scraps and potential for reducing waste burned at the resources recovery facilities with a first-in-the-nation mandate for commercial organics recycling.6 This landmark legislation has already encouraged developers to apply for permits for food residual recycling facilities by guaranteeing feedstock. In addition, P.A. 14-94 set forth a process for the state to pursue creative and environmentally sustainable diversion solutions to reshape infrastructure.7
Consistent with the 2006 Plan, Connecticut strengthened recycling market signals by adding materials to the list of designated recyclables and to the beverage container deposit law. In 2010, Public Act 10-87 strengthened mandatory recycling in Connecticut with new requirements for municipalities, collectors, and generators.8 In 2015, to fulfill the call for increased recycling education and outreach statewide, the state launched the RecycleCT Foundation, a state- chartered nonprofit organization combining public and private resources to promote recycling, reuse, composting, and other sustainable materials management practices.9 Additionally, for the first time in over a decade, the State offered grants to municipalities and schools for waste reduction, reuse, and recycling.
In carrying out the vision set forth in the 2006 Plan, Connecticut has become a national leader in creating collective responsibility for the management of key products. Over the last eight years Connecticut has passed producer responsibility legislation and has implemented programs for electronics, paint and mattresses. These programs relieve some cost to taxpayers and improve the sustainable management of included products and materials.
5 Connecticut Department of Energy and Environmental Protection, “State Solid Waste Management Plan (2006).” Available at: http://www.ct.gov/deep/cwp/view.asp?a=2718&q=325482&deepNav_GID=1646%20#Current 6 See CGS 22a- 226e 7 See information on Connecticut’s commercial organics law and associated resources at: http://www.ct.gov/deep/cwp/view.asp?a=2718&q=552676&deepNav_GID=1645 8 See discussion of Public Act 10-87 at: http://www.ct.gov/deep/cwp/view.asp?a=2714&q=466122 9 See information on the RecycleCT Foundation at: http://www.recyclect.org

10
Development of the 2016 CMMS
To provide the foundation for action, this Strategy relies on a comprehensive analysis of Connecticut’s ever-evolving materials management system. In particular, this Strategy relies on studies of the composition of waste and recycling streams, forecasts of changes in generation and composition over the course of the planning horizon, an analysis of gaps and opportunities as seen through the eyes of diverse stakeholders, and recommendations from national experts. Finally, DEEP reviewed its practices in data collection and analysis and established a set of key indicators that will be used to gauge system performance and program delivery at the state and local levels. The success of this Strategy will rely in large part on the effective use of data to benchmark system performance and measure the effectiveness of individual programs.
a. Waste Characterizations and Forecasts DEEP conducted two in-depth waste characterization studies in 2015, one that focused on disposed MSW and residential curbside single-stream recyclables (mix of glass, metal, paper, and plastic containers, and other paper), and one that focused on Construction and Demolition (C&D) Waste, and to a limited extent, oversized MSW.
The MSW study, conducted by Mid-Atlantic Solid Waste Associates, with subcontractors DSM Environmental and Cascadia Consulting Group, provides a reliable statewide composition profile for disposed MSW based on extensive waste sorts conducted in spring and fall 2015 at five waste-to-energy facilities and one transfer station throughout the state.10 By replicating the methodology of a 2010 MSW composition study,11 the 2015 composition study provides a valid comparison that can be used to identify significant changes in the MSW stream over the past five years, including a decrease in the presence of designated recyclables in disposed MSW, and an increase (both in tonnage and as a percentage of the MSW stream) in disposed organic waste, particularly food scraps. In addition, the study provides waste profiles by key commercial sectors and population densities, and a profile of curbside recycling focused on identifying the most common contaminants, with an eye toward a forthcoming education campaign aimed at cleaning up the curbside recycling stream.
The C&D study, conducted by Green Seal Environmental, provides an estimated statewide profile from loads of mixed C&D waste and oversized MSW delivered and sampled at four volume
10 Connecticut Department of Energy and Environmental Protection, “2015 Statewide Waste Characterization Study,” Available at: http://www.ct.gov/deep/lib/deep/waste_management_and_disposal/Solid_Waste_Management_Plan/CMMS_Final _2015_MSW_Characterization_Study.pdf
11 Connecticut Department of Energy and Environmental Protection, “Connecticut State-wide Solid Waste Composition and Characterization Study, Final Report (2010)” Available at: http://www.ct.gov/deep/lib/deep/waste_management_and_disposal/solid_waste/wastecharstudy/ctcompositionch arstudymay2010.pdf

11
reduction facilities in 2015.12 In addition, the study provides detailed analysis of the flow and final destinations for disposed C&D waste, and areas of opportunity for increased diversion.
Key results from both studies are summarized later in this Strategy.
b. Stakeholder Input and Recommendations In planning activities leading to the development of this Strategy, DEEP received assistance from Skumatz Economic Research Associates, Boisson Consulting, and Cascadia Consulting Group. DEEP staff participated in meetings throughout the state with key stakeholders, including municipal officials, environmental advocates, industry representatives, regional waste groups, and others. This Strategy also integrates many of the recommendations of the 2010 Legislative Program Review and Investigations Committee study Municipal Solid Waste Management Services in Connecticut,13 as well as the reports from the 2012 Modernizing Recycling Working Group14 and the 2013 Resources Recovery Task Force.15
12 Connecticut Department of Energy and Environmental Protection, “Construction and Demolition Waste Characterization and Market Analysis,” Available at: http://www.ct.gov/deep/lib/deep/waste_management_and_disposal/Solid_Waste_Management_Plan/CMMS_Final
_2016_Construction_&_Demolition_Waste_Characterization_Study.pdf 13 Legislative Program Review and Investigations Committee, “Municipal Solid Waste Management Services in Connecticut (2010).” Available at: https://www.cga.ct.gov/2009/pridata/Studies/PDF/MSW_Services_Final_Report.pdf 14 Modernizing Recycling Working Group, “Recycling 2.0: Better Economics, Better Environment.” Available at: http://www.ct.gov/deep/lib/deep/waste_management_and_disposal/solid_waste/transforming_matls_mgmt/gov_r ecycling_work_group/report_dec_27_2012.pdf 15 Resources Recovery Task Force, “Resources Recovery Task Force Final Report.” Available at: http://www.ct.gov/deep/lib/deep/waste_management_and_disposal/solid_waste/transforming_matls_mgmt/resou rces_recovery_task_force/rrtf_final_report.pdf

12
Leading Challenges
Through stakeholder surveys, listening sessions, and meetings with system participants throughout Connecticut, broad consensus emerged about some of the leading challenges that threaten the state’s current materials management system and progress towards the state’s goal of 60 percent diversion by 2024. These include the following:
Gaps in Enforcement of Mandatory Recycling Statutes Stakeholders identified gaps in enforcement of existing recycling statutes and ordinances at the state and local level as a leading challenge. It was commonly acknowledged that the root cause of the lack of enforcement is the lack of resources committed to enforcement programs. Local governments vary widely in enforcing recycling requirements for residents and businesses. A more robust program of state-led enforcement is seen as the most effective remedy to this widespread shortcoming.
Volatility in Markets for Recovered Materials Declines in the market values of polyethylene terephthalate (“PET”), fiber, metal and other materials recovered through recycling was cited as a challenge faced by collectors and materials recovery facilities (“MRFs”). Volatility is commonplace in commodity prices but markets have been particularly impacted, beginning in 2012, by China’s so-called “green fence” standards for the import of recovered materials. Current market conditions have led recyclers to emphasize that recycling isn’t “free,” and that generators can expect to pay more for processing of recyclables in the future. The situation has underscored the need to eliminate contamination from the recycling stream to decrease processing costs and increase the value of recovered materials.
Lack of Access to Recycling Collection in Public Places, Workplaces, and Residential Buildings Residents who are committed to recycling expressed frustration with the lack of readily accessible collection points, including in places open to the public (e.g., shopping malls, convenience stores, parks and government buildings). In addition, many tenants in multi-unit residential buildings report a lack of recycling collection for their community.
Lacking Public Awareness / Lagging Adoption of Reduction, Reuse, and Recycling Practices While a lack of access to recycling collection remains a barrier for some residents, others who could easily recycle have not integrated the practice into their daily lives. Furthermore, our consumption-based economy tends to encourage a “throw-away society” that is inconsistent with sustainable consumer choices, waste reduction, and reuse. Stakeholders recommended a sustained campaign of education and outreach to attempt to influence consumer behavior. Increased standardization of recycling collection across the state and the provision of clear

13
information on what can be recycled in single-stream are key elements of this outreach campaign.
The Cost of Recycling Collection Municipal officials and others raised concerns about the cost of mandatory recycling. Despite avoided costs of disposal, the cost of collection programs can burden municipal governments. In addition, municipalities that market recovered materials from transfer stations have been impacted by declining commodity values in recent years.
Uncertain Future for Existing Resource Recovery Facilities The Materials Innovation and Recycling Authority (MIRA), the state’s quasi-public agency for resource recovery and recycling, as well as private-sector owners of RRFs warned that the expiration of long-term contracts for waste disposal, decreased revenue from energy sales, and maintenance costs threaten their economic sustainability.
Time Required for Permitting Stakeholders identified statutory and regulatory provisions and practices that can act as barriers to innovation in material management technology and infrastructure. Another frequently mentioned concern was the time and resources needed to obtain environmental permits, beneficial use determinations (“BUDs”), and approval for solid waste demonstration projects.
Opportunities to Increase Diversion
This section introduces key areas for action. Actions and timetable for implementation are further detailed in the final section of this Strategy.
a. Develop New Product Stewardship Programs, Including a Focus on Consumer Packaging
Product stewardship is the act of minimizing the health, safety, environmental, and social impacts of a product and its packaging, while maximizing the economic benefits, throughout all lifecycle stages. The producer of the product has the greatest ability to minimize adverse impacts, but other stakeholders, such as suppliers, retailers, and consumers, also play a role. Stewardship can be either voluntary or required by law.
Extended Producer Responsibility, or EPR, is a mandatory type of product stewardship that includes, at a minimum, the requirement that the producer’s responsibility for its product extends to post-consumer management of that product and its packaging. There are two related features of EPR policy: (1) shifting financial and management responsibility, with government

14
oversight, upstream to the producer and away from the public sector; and (2) providing incentives to producers to incorporate environmental considerations into the design of their products and packaging.
By shifting the costs of materials management from taxpayer-funded government programs to manufacturers and consumers, EPR programs provide for equitable alternative funding sources, which are needed to expand and sustain product end-of-life management programs without depleting scarce government resources. However, EPR does not simply shift costs from the public sector to the private sector; it seeks to minimize costs through economies of scale, product design, and other market forces.
Well-designed EPR systems provide a direct financial incentive for producers to reduce material use and increase recyclability of their products and packaging through design change. When manufacturers are financially responsible for the collection, transportation, and proper recycling of these products, companies have a natural incentive to design their products and packaging to minimize the costs of end-of-life management and maximize the value of the material once collected. As manufacturers take these factors into account, another goal of EPR is for companies to reduce the use of toxic materials.16
Product Stewardship Programs in Connecticut
Electronics: In 2007, Connecticut became one of the first states to pass a law requiring manufacturers of computers, monitors and televisions to finance the transportation and recycling of their products. The program began in February 2011 and now Connecticut municipalities can recycle residential electronics appropriately and at no cost to the taxpayer. In addition, as of January 1, 2011, covered electronic devices (CEDs) were banned from disposal. To date, municipalities have saved over $2 million in avoided e- waste tip fees for the 50 million pounds collected.
Paint: Through 2011 legislation, paint manufacturers assumed the costs of managing unwanted residential latex and oil-based paints. In the summer of 2011, the Department established a stakeholder group to work with the industry to develop the program plan. As a result of this process, PaintCare Inc., the non-profit organization established to implement this program, submitted a plan to the Department on March 1, 2013, and the program was launched July 1, 2013. As a result of the program, 99 percent of Connecticut residents now have access to an authorized free paint drop-off location within fifteen miles of their residence.
16 This overview of EPR is adapted from a briefing document provided to the 2012 Governor’s Modernizing Recycling Working Group prepared by the Product Stewardship Institute. Available online at: http://www.ct.gov/deep/lib/deep/waste_management_and_disposal/solid_waste/transforming_matls_mgmt/gov_r ecycling_work_group/appendix_h.pdf
15
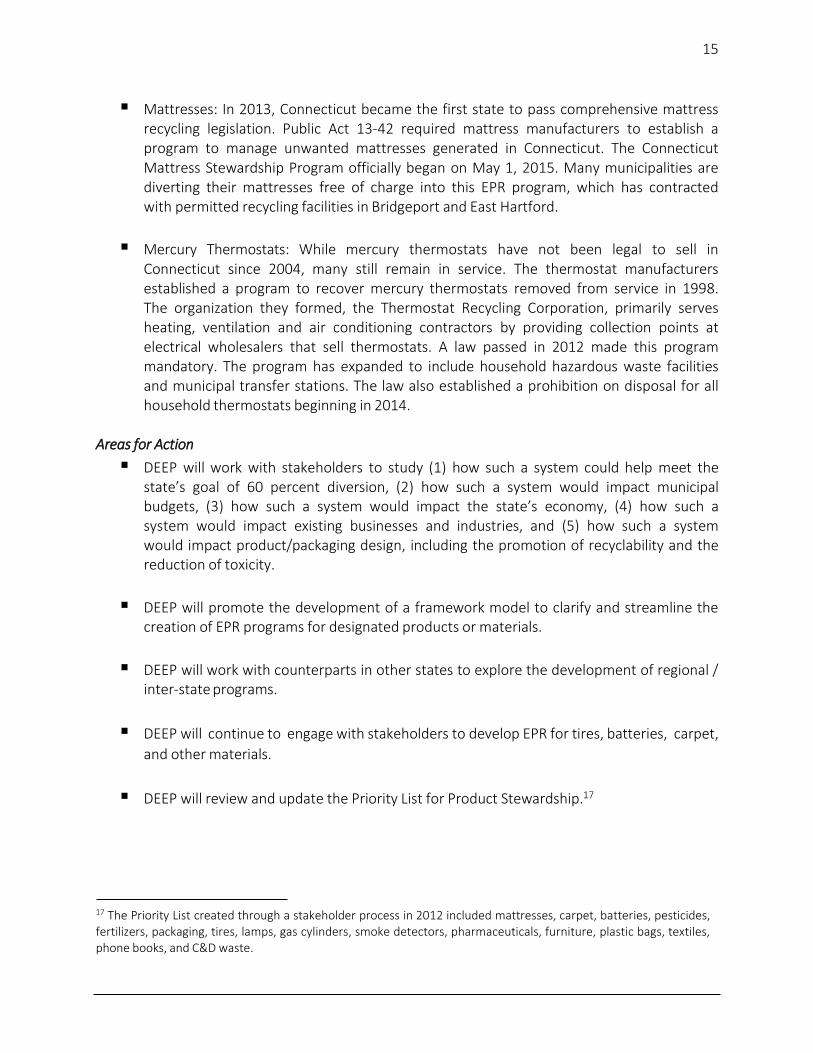
Mattresses: In 2013, Connecticut became the first state to pass comprehensive mattress recycling legislation. Public Act 13-42 required mattress manufacturers to establish a program to manage unwanted mattresses generated in Connecticut. The Connecticut Mattress Stewardship Program officially began on May 1, 2015. Many municipalities are diverting their mattresses free of charge into this EPR program, which has contracted with permitted recycling facilities in Bridgeport and East Hartford.
Mercury Thermostats: While mercury thermostats have not been legal to sell in Connecticut since 2004, many still remain in service. The thermostat manufacturers established a program to recover mercury thermostats removed from service in 1998. The organization they formed, the Thermostat Recycling Corporation, primarily serves heating, ventilation and air conditioning contractors by providing collection points at electrical wholesalers that sell thermostats. A law passed in 2012 made this program mandatory. The program has expanded to include household hazardous waste facilities and municipal transfer stations. The law also established a prohibition on disposal for all household thermostats beginning in 2014.
Areas for Action
DEEP will work with stakeholders to study (1) how such a system could help meet the state’s goal of 60 percent diversion, (2) how such a system would impact municipal budgets, (3) how such a system would impact the state’s economy, (4) how such a system would impact existing businesses and industries, and (5) how such a system would impact product/packaging design, including the promotion of recyclability and the reduction of toxicity.
DEEP will promote the development of a framework model to clarify and streamline the
creation of EPR programs for designated products or materials.
DEEP will work with counterparts in other states to explore the development of regional /
inter-state programs.
DEEP will continue to engage with stakeholders to develop EPR for tires, batteries, carpet,
and other materials.
DEEP will review and update the Priority List for Product Stewardship.17
17 The Priority List created through a stakeholder process in 2012 included mattresses, carpet, batteries, pesticides, fertilizers, packaging, tires, lamps, gas cylinders, smoke detectors, pharmaceuticals, furniture, plastic bags, textiles, phone books, and C&D waste.

16
b. Reduce the Generation and Toxicity of Waste
While economic factors are the primary drivers of changes in waste generation, Connecticut can achieve meaningful reduction in waste generation, as well as increased recycling, through the widespread implementation of unit-based pricing structures that reward consumers for reducing waste. Despite having been recognized for its high potential impact since the 1980s, only a handful of towns in Connecticut have implemented effective pricing structures. DEEP will continue to promote this proven approach.
One barrier to the reduction of waste is the presence of “put-or-pay” clauses in contracts between facilities and municipalities. These contract provisions bind municipalities to deliver a minimum quantity of waste, or pay the difference. DEEP views these clauses to be categorically contrary to the state’s policy to promote waste reduction, except when they are necessary to finance the development of a facility.
In addition to reducing waste generation, source reduction also seeks to reduce climate impacts and toxicity of waste through redesign of products and packaging and changes in purchasing and other practices.
Areas for Action
DEEP will review contracts for the presence of “put-or-pay” clauses and ensure that no such clauses are enforced beyond the retirement of bonds or other debt issued to finance facility construction.
DEEP will build on the success of early measures to eliminate toxic and problematic materials from the waste stream through approaches that may include compliance assurance, technical assistance, surcharges, regulations, disposal bans and/or extended producer responsibility (EPR) programs.
DEEP will explore approaches to provide more effective collection and management of household hazardous waste.
Connecticut will increase the number of municipalities that enact effective unit-based pricing approaches, and will make adoption of unit-based pricing a key indicator of municipal recycling system performance (and compliance with statutory recycling performance goals).
c. Promote Reuse
Reuse involves extending the life of a product, packaging, or resource. The broad spectrum of reuse-related activities includes everything from the creative reuse of materials by artists and artisans, to retreading of tires, to building deconstruction practices that preserve reusable building materials, to repairing durable goods such as electronics, appliances, bicycles and automobiles. Reuse is a force in the wider economy, with businesses such as ZipCar, Savers and various consignment markets, and nonprofits such as Goodwill Industries, Salvation Army, and

17
Habitat for Humanity facilitating reuse on a mass scale. The exchange of reused goods is facilitated by websites like Craigslist and Freecycle.
At the present time, there are few programs at the state level that directly promote reuse. At the local level, reuse initiatives supported by municipalities often take the form of “swap areas” at transfer stations, and in some cases, tool libraries or other sharing initiatives.
Areas for Action
DEEP, in possible partnership with the RecycleCT Foundation, will identify opportunities to leverage the successes of local and private-sector programs by providing recognition, grants, and other support for reuse initiatives.
DEEP will promote the proper handling of reusable C&D materials, including deconstruction as a strategy to preserve the reusability of building materials.
d. Improve Collection and Processing Systems for Traditional Recyclables
There continues to be significant opportunity to increase recovery of traditional recyclables. According to the 2015 MSW characterization study, over 410,000 tons of recyclable material remains in the Connecticut disposal stream, or 17.5 percent of all disposed MSW (excluding the remainder/composite portion of each category along with other hard-to-recycle portions). This includes: over 267,000 tons of recyclable paper; 60,000 tons of recyclable plastic packaging (excluding expanded polystyrene and film); 44,000 tons of recyclable metals (excluding compressed fuel tanks); and 39,000 tons of recyclable glass containers.
There is generally sufficient capacity at Connecticut materials recovery facilities (MRFs), including seven facilities with a combined capacity of over 4,000 TPD. There is, however, a growing need for MRFs to invest in automated sorting and other technologies to address the evolving material stream, shifts in end-market demand and material quality requirements, and contamination in single stream collection — and to maximize collection of traditional and new materials. Assisting MRFs in addressing these challenges can boost diversion in coming years.
While there are well-founded concerns regarding global demand, pricing and quality requirements for recyclables, demand is expected to remain sufficient to absorb Connecticut’s supply of most grades of paper, metals and plastics for the foreseeable future. Since Connecticut is not positioned to influence global markets for these materials, boosting end-use demand is a lower priority than strengthening collection and processing systems.
Mixed Waste Recovery
Connecticut’s focus on separation of recyclables at the source as the primary and preferred driver for recycling has historically discouraged DEEP from considering, much less promoting, the development of mixed MSW sorting lines to recover recyclable materials. However, advances in

18
sorting technology and interest within the state’s recycling industry have caused DEEP to reconsider this position. While mixed waste sorting should never be seen as an adequate substitute for source-separation, nor should it justify a failure by collectors to provide for separate collection for recyclables, DEEP anticipates the development of processes - and permitted facilities - that can glean additional recyclable materials from “post-recycled” MSW (where source-separation has occurred but recyclables remain in the waste stream).
Glass
Glass presents particular challenges to the single-stream recycling system, because it generally commands a low value when contaminated by other materials in the collection and sorting process. Even so, there continues to be strong demand for high-quality, color sorted glass at regional glass container facilities with at least 48,900 tons of glass from Connecticut’s bottle bill program flowing to such markets, comprising 73 percent of all glass collected in that program.18 Some Connecticut glass from both curbside and bottle bill sources flows to alternative uses such as construction fill. Establishing in-state beneficiation capacity to clean and process mixed glass to meet manufacturer specifications is critical to building market demand for recycled glass. In addition, consideration should be given to separate collection of glass or expansion of bottle redemption to include glass wine and liquor containers.
Areas for Action Connecticut will take steps to ensure the continuous improvement in recycling programs,
as well as promote greater and more effective participation by residents through increased outreach and enforcement.
While source-separation of recyclables is required under state statute and remains the preferred driver for recycling, DEEP anticipates and the development and permitting of mixed waste sorting lines to recover additional recyclable materials from “post-recycled” MSW.
DEEP will increase enforcement of mandatory recycling provisions, with state-led enforcement targeting commercial generators and multi-unit residential dwellings.
DEEP will support programs that provide technical assistance and compliance assurance and share best management practices for waste reduction, reuse and composting/recycling programs for different business sectors.
Connecticut will increase outreach and education, including via the RecycleCT Foundation, to promote effective public participation in recycling. Main areas of focus
18 “Material Flow Analysis for Containers Subject to the CT Beverage Container Deposit and Redemption Law.” Prepared by Danny Macri, Masters in Environmental Management Candidate Yale University, January 2015.

19
are increasing participation and decreasing the contamination of single-stream recycling collection.
DEEP will pursue approaches to reduce the amount of glass collected in single stream and provide other more effective options for recycling glass containers.
e. Increase Source Separation and Composting/Conversion of Food Scraps and Organics
Organics provide the largest opportunity to increase Connecticut waste diversion. According to the 2015 waste composition study, over 926,000 tons of readily compostable organics were disposed, or nearly 40 percent of total MSW disposal. This includes over: 519,000 tons of food waste; 56,000 tons of yard waste (e.g., branches and stumps, prunings and trimmings); 100,000 tons of leaves and grass; and 249,000 tons of compostable paper (e.g., uncoated paper cups and plates, paper food cartons, napkins and paper towels).
Food waste is generated at every stage of the supply chain. When food is wasted, we are also wasting the fresh water, chemicals, energy, and land used to produce food. Opportunities exist to reduce food wasted by businesses and households as well as work with businesses and farms to recover more food for humans and animals.
The top growth priorities for organics are to strengthen and expand both the collection system (from both residential and commercial generators) and to expand processing capacity at new and existing compost facilities, and at new anaerobic digestion (AD) facilities. The Connecticut collection system for organics is much less developed than for recyclables, at both the residential and commercial levels. While grass, leaves and other yard waste are widely collected, significant quantities remain in the disposal stream.
There are 118 active leaf composting facilities in Connecticut, with a combined throughput of over 775,000 cubic yards per year of incoming feedstock.19 These include 86 municipal facilities, 17 private facilities, and seven farm-based facilities. Ten of the facilities are identified as accepting grass. Municipal operations tend only to accept leaves generated by that town, and may also provide small quantities of finished compost to residents for free or at a nominal charge. There are also several private leaf composting facilities which have been established in response to the demand for purchasing finished compost and for places to recycle leaves.
In 2016, DEEP was working with the developers of four proposed AD facilities that, once operational, would have a combined capacity of 1,600 TPD. The state also hosts two volume reduction composting facilities with combined capacity of 195,365 tons per year and one small- scale composting facility with a capacity of 5,000 cubic yards per year.
19See http://www.ct.gov/deep/cwp/view.asp?a=2718&q=325374&depNav_GID=1645

20
The availability of attractive renewable power contracts could be essential for new AD facilities to be viable, especially given their relatively high capital costs. Subsidization of other Class I renewable energy generation sources such as solar has increased the disparity in capital costs between AD and solar. Clean energy procurements currently underway as part of implementation of P.A. 15-107 include AD facilities as eligible Class I energy resources. Connecticut will need to ensure that potential barriers to development, such as permitting timeframes and pre-development costs, are not preventing participation in incentives.
Areas for Action
Connecticut will promote the donation and recovery of edible food for human and/or animal consumption.
Connecticut will focus on the effective implementation of the state’s law mandating
source separation and recycling of food scraps by large generators (CGS Sec. 22a-226e). This includes a program of outreach to affected generators, technical assistance for compliance, and enforcement.
DEEP will continually evaluate and make improvements to permitting standards and practices to promote innovation in organics management. This includes the establishment of clear guidelines for the management and use of residual digestates of anaerobic processes, and priority processing of permit applications for facilities that will manage organics.
DEEP, in possible partnership with the RecycleCT Foundation, will offer grants for educational programs that encourage food waste reduction, engage in food recovery, provide home composting education, and support community composting initiatives.
f. Increase Recycling and Reuse of Construction & Demolition Materials and Oversized MSW
The 2015 MSW characterization study estimated that over 276,000 tons of C&D materials were disposed in the MSW stream, or nearly 12 percent of all disposed MSW. This includes over 132,000 tons of treated wood, 39,000 tons of untreated wood, 29,000 tons of carpet, 13,000 tons of gypsum/wall board and 6,000 tons of asphalt roofing. Over 40,000 tons was counted as "remainder/composite C&D" materials. The 2015 C&D composition study analyzed flows of C&D materials (not defined as MSW) to Connecticut volume reduction facilities estimated disposal of an additional 1.04 million tons, with over: 38 percent being wood, 10 percent asphalt shingles; six percent gypsum/wallboard and 30 percent "other" (including a variety of oversized MSW).
The top priority diversion opportunities vary somewhat for each C&D material type, but they span all stages including collection, processing and end-use/consumer demand. A large portion of C&D waste flows through 32 volume reduction plants (VRPs), with a combined permitted

21
capacity of over 130,000 tons per day. These sites handle construction and demolition materials including wood (clean, mixed and treated), cardboard, asphalt roofing shingles, gypsum wallboard, asphalt shingles, asphalt, brick and concrete (ABC), metals, plastic and a variety of bulky items from household demolition or remodel projects. While VRPs may accept asphalt, brick and concrete, most of this material is processed by aggregate facilities, which do not require a permit, so data is not available.
Unlike MSW, which is currently managed by waste-to-energy facilities, the end destination for C&D and oversize MSW is primarily landfills, with 80 percent being sent to destinations out-of- state. This represents a failure of the state’s policy to promote recycling and ensure sufficient in- state capacity for disposal of these materials.
Areas for Action
Connecticut will implement policies to increase source separation at construction/job sites. These policies may include the statutory designation of certain materials for mandatory source-separation, and/or the establishment of a building/demolition permit deposit system (to be adopted on a voluntary basis by municipalities) which provides a financial incentive to recycle materials generated at the building or demolition site.
DEEP will continue to work with collectors and volume reduction facility owners to optimize processes to recover recyclable materials such as cardboard, metals, wood, plastics, and asphalt shingles for end markets.
DEEP will reassess permit conditions requiring the phase-in to 40 percent recycling of non-designated recyclables at volume reduction facilities, with the goal of establishing ambitious but achievable improvements in the recycling of both designated and non- designated items.
The state (DEEP and/or MIRA) will study the flow, recycling, and disposal of oversized MSW which accounts for as much as 30 percent of the incoming stream at volume reduction facilities. The goal of this study will be to determine opportunities and incentives to increase reuse and recycling, as well as the potential to develop new options for in-state disposal.
DEEP, in partnership with the RecycleCT Foundation, will offer grants for educational programs that encourage waste reduction, reuse and recycling at construction job sites, or develop innovative programs or pilot projects to divert oversized MSW for reuse or recycling.

22
g. Embrace Technological Approaches to Diversion
The state faces a likelihood of significant shortfalls of in-state disposal capacity in the coming years with the retirement of existing waste-to-energy facilities. The state’s 60 percent diversion goal, while calling first for source reduction and increased recycling, also prompts the state to consider a role for waste conversion technologies in diverting materials from landfill and traditional combustion plants. Examples of waste conversion technologies include, but are not limited to, anaerobic digestion, gasification, plasma arc gasification, pyrolysis, and hydrolysis/fermentation (waste-to-ethanol).
In addition to waste conversion technologies, eco-industrial parks can be part of a comprehensive approach to diversion. Eco-industrial parks can co-locate multiple recycling / conversion processes with end users of recovered materials, such as mixed waste processing facilities to recover materials from post-recycled MSW, and glass beneficiation facilities.
The Role of Quasi-Public Agencies in Infrastructure Modernization The development of new materials management infrastructure will require a coordinated state program combining investment, incentives, and siting assistance.
Just as the Connecticut Resources Recovery Authority (“CRRA”) developed the state’s fleet of recycling facilities and energy recovery plants in place of landfill disposal capacity, the Materials Innovation and Recycling Authority (“MIRA,” CRRA’s successor), has the potential to help facilitate a statewide transition to the next generation of materials management infrastructure. However, significant structural challenges may prevent MIRA from assuming this role, including organizational resources focused on operating existing facilities rather than developing/promoting new ones, and the possibility that a change in the status of MIRA’s Connecticut Solid Waste System Project facilities (either closure or transfer to a third-party developer) could significantly reduce the organization’s operating revenues.
DEEP will act as a partner for the MIRA Board of Directors and staff, strengthening existing ties between the two agencies and communicating frequently about matters of shared concern. DEEP will also consider how to encourage municipalities to demonstrate their commitment to regional action in order to provide the necessary certainty in planning and implementing regional or statewide infrastructure investments. In turn, MIRA will provide its vision for future infrastructure development and an assessment of its capability to help lead this transition.
Either as an alternative or to augment MIRA’s role, legislative action may be needed to create a new office, agency, or authority to serve as a catalyst for public-private partnerships to develop new materials management infrastructure.
Areas for Action
Connecticut will consider the benefits of waste conversion technologies as part of a diversified portfolio of material management options in the state, and will: a) consider

23
GHG and air pollution emissions in determining technology preferences and develop related performance standards and permit language, b) remove unnecessary regulatory barriers to the issuance of permits to implement these technologies, c) leverage private investment with public funds when possible to support the development of such facilities in the state.
Connecticut will establish a coordinated state program combining investment, incentives, and siting assistance and clarify the roles of various state agencies and MIRA in relation to material management infrastructure development.
Connecticut will conduct a concept study to determine the potential to develop new eco- industrial parks.
Actions to Maintain System Capacity
The Goal of Capacity to Match Generation
Connecticut should have sufficient in-state capacity for recycling, processing and disposal to manage waste generated within the state. Self-sufficiency in managing solid waste represents good public policy for Connecticut for many reasons, including decreasing the carbon footprint of waste, controlling costs, and avoiding risks associated with exporting solid waste.
Connecticut must develop and maintain sufficient capacity to manage its share of the environmental impact of the materials generated within the state. Failure to maintain sufficient capacity effectively transfers the burden for management of Connecticut’s waste materials to our neighbors.
Sufficient Capacity Stabilizes Costs
Sufficient supply of in-state processing capacity to meet demand stabilizes costs to the benefit of municipalities and businesses. While there are compelling environmental reasons for maintaining a self-sufficient waste system, the state must also consider the strong economic and budgetary implications of a shortfall of in-state capacity. In 2015, disruptions to the market caused by the closure of Covanta’s Wallingford RRF, combined with extended shutdowns at other facilities, drove tipping fees for non-contracted “spot market” waste to exceed $100/ton, over twice the typical rate. Municipalities and other customers should plan for much higher costs in years to come as the result of a breakdown of the in-state disposal market associated with insufficient capacity. Conversely, reasonable excess capacity, though it may result in the import of feedstock from neighboring states, leads to a healthier market with prices more favorable to customers.
24
MSW Generation Forecast
Long-term forecasts for MSW generation are not always reliable because economic drivers of waste generation are difficult to predict. For example, the 2006 Solid Waste Management Plan predicted sustained increases in MSW generation (from 3.7 million in FY2003 to 5.23 million tons by 2024), based on an assumption of sustained economic growth. However, the 2008-2009 economic recession contributed to a decrease in waste generation. In addition, significant changes to packaging design (“light weighting”), decreased generation of printed paper, and other trends in the waste stream may not have been fully accounted for. Therefore, this Strategy relies on new projections made with the benefit of the context that the intervening decade has provided.
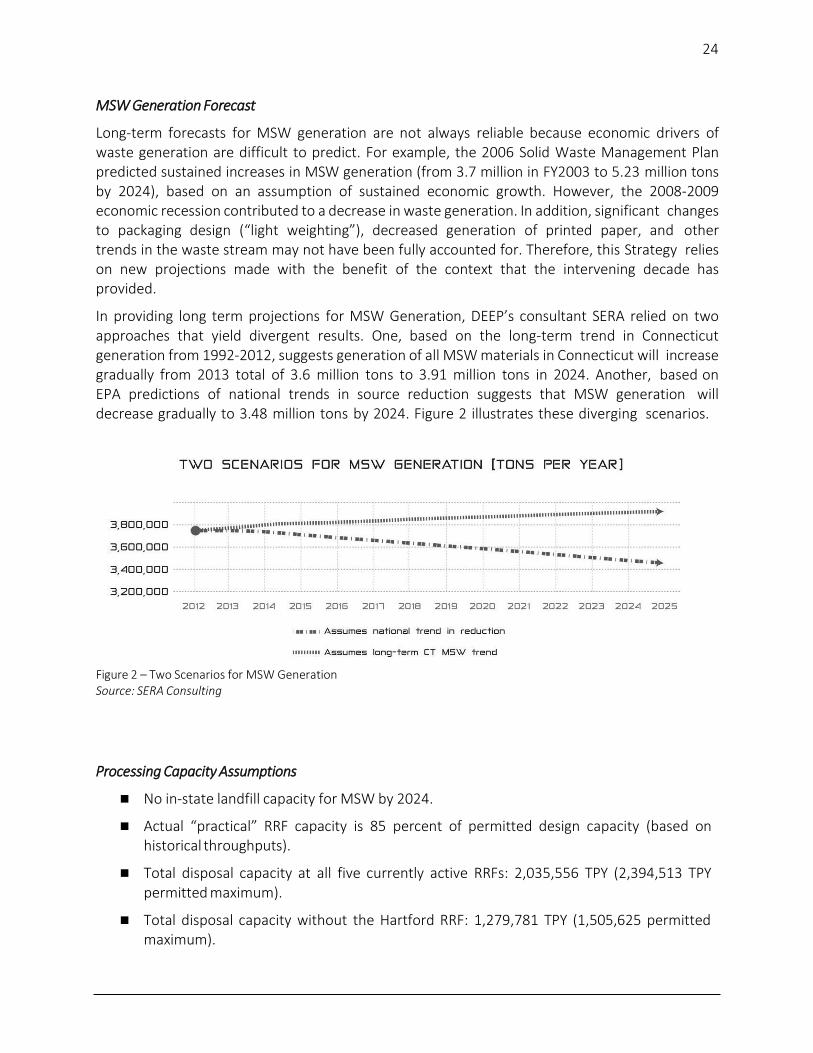
In providing long term projections for MSW Generation, DEEP’s consultant SERA relied on two approaches that yield divergent results. One, based on the long-term trend in Connecticut generation from 1992-2012, suggests generation of all MSW materials in Connecticut will increase gradually from 2013 total of 3.6 million tons to 3.91 million tons in 2024. Another, based on EPA predictions of national trends in source reduction suggests that MSW generation will decrease gradually to 3.48 million tons by 2024. Figure 2 illustrates these diverging scenarios.
Figure 2 – Two Scenarios for MSW Generation Source: SERA Consulting
Processing Capacity Assumptions
No in-state landfill capacity for MSW by 2024.
Actual “practical” RRF capacity is 85 percent of permitted design capacity (based on historical throughputs).
Total disposal capacity at all five currently active RRFs: 2,035,556 TPY (2,394,513 TPY permitted maximum).
Total disposal capacity without the Hartford RRF: 1,279,781 TPY (1,505,625 permitted maximum).

25
If Connecticut is successful in achieving the goal of 60 percent diversion from disposal, the associated 10 percent reduction in MSW generation from FY2013 levels (3.6 million tons) will mean that 3.24 million tons of MSW materials will need to be managed. A recycling rate of 45 percent, as projected will be necessary to achieve the goal, leaves 1.78 million tons of post-recycled MSW to be managed. According to this Strategy, at least 300,000 tons of MSW materials should be managed by new waste conversion technologies, leaving 1.48 million tons remaining to be disposed via traditional waste-to- energy or landfill.
If Connecticut is not successful in achieving its goal of 60 percent diversion from disposal, As much as 3.91 million tons of MSW materials will need to be managed (according to the “constant tons per capita” model illustrated by Figure 15), with 1.36 million tons diverted (at the current 35 percent diversion rate), leaving 2.54 million tons remaining to be disposed via traditional waste-to-energy or landfill.
MSW Capacity Scenarios (Year 2024)
I. If Connecticut is successful in achieving the 60 percent diversion goal and maintains the capacity of the five currently active RRFs, at least 300,000 TPY in new waste conversion capacity is called for to meet the diversion goal, and no additional disposal or conversion capacity will be needed.
II. If Connecticut is successful in achieving the 60 percent diversion goal but loses net disposal capacity equivalent to the Hartford RRF, approximately 200,000 TPY of additional disposal capacity will be necessary (assuming that 300,000 TPY in additional waste conversion capacity is also developed).
III. If Connecticut is not successful in meeting the diversion goal but instead maintains 35 percent diversion and maintains the capacity of the five currently active RRFs, an additional 505,000 TPY of disposal or conversion capacity may be necessary.
IV. If Connecticut is not successful in meeting the diversion goal but instead maintains 35 percent diversion and loses net disposal capacity equivalent to the Hartford RRF, an additional 1.2 million TPY of disposal or conversion capacity may be necessary.
Discussion
Only if Connecticut is successful in achieving its diversion goal will it avoid a significant disposal capacity shortfall. In these scenarios (I and II), it is assumed that the state will develop at least 300,000 TPY of new in-state waste conversion capacity. The four AD facilities currently in development in 2016 may provide an estimated 200,000 TPY toward this target.
If Connecticut falls short of the diversion goal, and/or loses existing capacity, the state will face a dire capacity gap that could result in nearly one third of the state’s MSW being sent out of state to landfills.

26
Defining RRF Capacity for the Determination of Need Process
The Determination of Need process set forth by CGS 22a-208d was noted in 2010 findings by the Legislative Program and Review Committee to stifle the state’s ability to develop new RRF capacity in a time of transition. Because facilities typically take five years or longer to develop, the state should allow the development of some “excess” capacity in anticipation of future plant closures. For this and other reasons, this Strategy recommends that the Determination of Need process be substantially streamlined.
Pending clarification or streamlining of the Determination of Need process, this Strategy seeks to clarify, in accordance with CGS Sections 22a-208d and 22a-208d(i), how DEEP may consider the question should it receive an application. While the official determination must be made in response to an application, the guidance contained in this Strategy should indicate the state’s receptivity to the development of new RRF capacity in this period of a shortfall in disposal capacity. As stated elsewhere throughout this Strategy, it is preferred that such capacity take the form of waste conversion technologies as opposed to combustion-based waste-to-energy.
The formula used to determine allowable capacity (unless otherwise determined by the Commissioner) is the total amount of MSW disposed in the most recent fiscal year for which data is kept, minus active RRF capacity at time of application (at 85% usage), plus the capacity of the smallest active RRF at time of application (to hedge against future facility closures).
For example, in 2016, this formula would be applied as follows:
MSW disposed: 2,413,833 Tons-
Total current (2016) active RRF capacity (85%): 2,035,556 Tons
378,277 Tons
378,277 tons + 166,294 (85% Lisbon RRF permitted capacity) = 544,571 TPY in new RRF capacity would not be considered excessive.
Maintaining Existing Waste-to-Energy Capacity
While this Strategy prioritizes the actions needed to develop new infrastructure, it is also important to ensure that existing waste-to-energy infrastructure remains operational for as long as it is needed. Existing waste-to-energy facilities currently receive revenues from a range of sources, including the region’s wholesale energy and capacity markets and/or municipal power purchase agreements; Class II RECs (which are generally oversupplied); and tipping fees paid by municipalities to use the facility. Facilities may be experiencing shortfalls in revenue as a result of recent low wholesale market prices and expiring power purchase agreements. Some operators have raised concerns that these trends will result in the retirement of facilities in the State that are needed to support the capacity needs as defined by this Strategy. DEEP will be examining this issue as part of the upcoming 2016 Comprehensive Energy Strategy (2016 CES). Specifically, the 2016 CES will seek to confirm (1) whether any additional ratepayer support (in addition to that provided through Class II RECs) is necessary to avoid premature retirements of

27
needed waste-to-energy facilities in the state, and (2) in the event that additional ratepayer support is needed, what would be the best mechanism to provide such support (e.g., changes to the Renewable Portfolio Standard, power purchase agreements, etc.).
In the spirit of harmonizing materials management priorities with renewable energy and climate change goals, it is appropriate to evaluate the GHG benefits of waste-to-energy as compared with other disposal options. Solutions should be tied to initiatives that further the state’s diversion goal and promote the development of cleaner waste conversion technologies.
MRFs and Intermediate Processing Needs
The state enjoys a relatively high concentration of Material Recovery Facilities (MRFs, otherwise called Intermediate Processing Centers) that is sufficient to meet demand for MSW-derived recyclable materials, even with expected increases in the collection of recyclable materials under this Strategy. However, the state could benefit from advanced sorting lines and other improvements at existing and new facilities.
The state lacks sufficient secondary processors to receive and further refine the materials coming from MRFs. Among the actions of this Strategy to spur investment, focus should be put on the development of these processing facilities and market drivers to increase demand, including through State procurements.
C&D Processing
The state currently lacks sufficient infrastructure (facilities, equipment, and sorting lines) needed to recover recyclable C&D materials and oversized MSW. The highest-performing volume reduction facilities for recycling (those with sorting lines) recycle less than 20 percent of incoming material.20 Substantial investment in new infrastructure is required if the state is to achieve 60 percent diversion of these materials and to develop the market drivers to increase demand.
In addition, the vast majority of these materials are disposed out-of-state in landfills. This Strategy specifically calls for further study of all C&D management options, with an emphasis on promoting greater source separation of recyclable materials at construction job sites.
20 Excludes clean fill, tonnages of which are not reported to DEEP.

28
21 See http://www.ct.gov/deep/lib/deep/waste_management_and_disposal/solid_waste/street_sweepings.pdf
Other Wastes
While this Strategy focuses primarily on MSW and C&D wastes, Connecticut administers programs for special wastes and other hard to manage wastes. This section summarizes current management of these materials.
Tires
Connecticut residents generate an estimated 3.3 million scrap tires annually. Until 2013, virtually all of those tires and many from neighboring states were incinerated for energy value in a plant in Sterling, Connecticut. That plant became inactive in the fall of 2013. After the plant ceased operations, many of the tires generated in Connecticut were sent to pulp mills in Maine to be burned for fuel. However, the closure of pulp mills and an oversupply of tires has raised concern about the viability of this disposal option.
Household Hazardous Waste (HHW)
HHW is generally defined as a household waste that is toxic, flammable, reactive or corrosive. Common HHW includes oil-based paints, thinners, pool chemicals, pesticides, mercury thermometers and devices, and gasoline. Since the first collection in 1984 in Ridgefield, Connecticut, HHW programs have grown dramatically. Collections are available for nearly every resident, and on average, over 30,000 state residents participate in HHW collections each year. Currently there are 5 permanent HHW facilities and many regionally organized collection day programs.
Dredged Materials
Dredged materials refer to material removed from both inland and marine waters. The potential volume of marine dredged materials is much more significant than the volume of inland waters dredged materials. Marine dredged materials result from dredging operations to deepen harbors and navigation channels and anchorages. Approximately 1.1 million tons of dredge material is generated in Connecticut each year from dredging operations in Long Island Sound. Connecticut does not have a facility designed to treat dredged materials with the goal of reusing the material.
Street Sweepings & Catch Basing Cleanings
In 2007, DEEP updated a guidance document on the management, reuse, and disposal of street sweepings and catch basin clean-outs.21 Street sweepings disposal options include disposal in a solid waste disposal facility, typically a landfill. Street sweepings and catch basin cleanings may be so polluted that they cannot be safely reused. All municipalities are encouraged to develop a

29
management plan for collecting street sweepings and catch basin cleanings, for safely storing such materials, for reusing such materials locally in a manner that does not pose a risk to public health or a risk to wetland and water quality and, if necessary, for disposing of the material.
Catch basin cleanings are usually wetter, have a higher organic content, and generally have higher levels of pollutants than street sweepings. Catch basin cleanings are also more likely to have been affected by spills and polluted runoff than street sweepings. The catch basin cleanings (solids) may be dried and disposed in a sanitary landfill or used as landfill cover. As in the case of street sweepings, there is very limited in-state opportunity for their use as landfill cover. Shifts by the CT Department of Transportation (DOT) and many municipalities away from sand/salt mixtures to other formulations without sand for road anti-icing and deicing has significantly reduced the amount of street sweeps and catch basin cleaning grit in recent years.
Sewage Sludge
Sewage sludge is generated by the 111 wastewater treatment plants located in Connecticut. Most sewage sludge is de-watered on-site resulting in the generation of approximately 118,000 dry tons de-watered cake per year. Sewage sludge is handled by incineration, composted on-site, or is shipped out-of-state for disposal. At this time, state regulations do not allow for beneficial reuse of ash residue that results from sludge incineration. Limited amounts of sewage sludge is processed and pelletized into soil amendments that may meet agricultural and public health standards. Recent changes to federal air quality and phosphorous regulations have necessitated upgrades to some facilities, and there is some concern over whether some facilities may close rather than invest in the necessary upgrades.
Contaminated Soils
Contaminated soils are typically generated as a result of fuel and chemical spills, leaking oil tanks, and by both remediation and construction activities at properties with historical contamination. Contaminants may include any substance that has the potential to pollute air or water. Owners of property containing contaminated soils generally retain a private contractor to clean up the site. Soil contamination varies in degree and is typically handled through one or more of the following options available to responsible parties in Connecticut for managing contaminated soils: deliver it to an out-of-state facility; reuse it as cover material at landfills undergoing; dispose of it at a limited number of in-state landfills; deliver it to an in-state treatment facility; or reuse it in accordance with the state’s Remediation Standard Regulations.
Animal Mortalities
Animal mortalities are typically handled by the CT Department of Transportation (DOT) or municipal road crews and are generally managed by dragging the animal off the road for natural decay and/or burying it. In some states, animal mortalities are routinely composted with other organics. This is not a common practice in Connecticut other than at poultry farms. Routine poultry mortalities can be managed through RRFs utilizing special waste authorizations,
30
however, large-scale animal or poultry mortalities from illness (such as avian influenza) may not be managed solely through RRFs and may necessitate large scale composting. The CT Department of Agriculture, in coordination with DEEP and the U.S. Department of Agriculture, is currently updating the 2010 “Avian Influenza Response Plan.” The 2016 “Avian Influenza Monitoring & Response Plan” will further detail disposal of mortalities through RRFs and/or composting.
Land Clearing Debris
Currently, in Connecticut, land clearing debris is managed as follows: (1) chipped or ground and then used for mulch or as a component in compost by municipalities and private recycling facilities; (2) milled for lumber or processed into firewood, though generally land clearing debris is unsuitable for either product; (3) left on site to decay; (4) burned legally on-site pursuant to CGS Section 22a-174(f); (5) chipped and sent for use in boiler-fuel applications; (6) buried in in- state bulky waste landfills; and (7) burned at in-state RRFs.
Radiopharmaceutical Contaminated MSW
Physicians and veterinarians prescribe the use radioactive chemicals such as iodine-131 and technecium-99m for diagnosis and treatment of medical conditions in patients and animals. These substances use short-lived radioactive isotopes which means that they will naturally decay away (and no longer emit radiation) within a few hours or days depending on the substances used. This can result in some MSW (diapers, kitty litter, colostomy bags, etc.) that may temporarily emit low levels of radiation when disposed of by residences.
Water filtration and radon mitigation systems can also concentrate some naturally occurring material that will also emit low levels of radiation until the material naturally decays away. This material will not be radioactive when stored for 30 days after which it can disposed of as MSW.
Some consumer products such as self-luminous devices and “positive-ion” energy bands contain radioactive material that requires them to be disposed of as radioactive waste and not as MSW.
RRFs, scrap metal facilities, and some transfer facilities use incoming radiation detectors to detect this material and remove it from the processing stream until evaluated. These detectors are not required by statute, regulation or permit, but function to prevent contamination of the facilities.

31
Measuring CMMS Outcomes
DEEP collects extensive data on the materials management system on an ongoing basis, and publishes an annual report of key indicators and numerous other reports for both internal and external use. This Strategy calls for enhanced use of data to drive meaningful planning and program evaluation, as well as increased transparency to make data available for regional and local planners and the public.
Statewide Performance Indicators
The following key indicators are used to measure state-wide performance:
Statewide diversion will be estimated by the amount of materials, by weight, which are reused, recycled, composted or otherwise converted to higher uses. Materials that are combusted (including for energy recovery) or landfilled (including use as alternative daily cover) are considered to be disposed.
DEEP is in the process of refining a methodology to account for source-reduction in calculating statewide diversion. For the purposes of this Strategy, reduction from FY2005 total MSW generation is counted towards the state‘s diversion goal.
The FY2013 statewide MSW diversion rate is estimated to be 35 percent. The state’s goal is to increase the statewide diversion rate to at least 60 percent by 2024 through source reduction, reuse, recycling, composting, and conversion. To track progress toward this goal, DEEP will publish revised estimates of the statewide diversion rates annually. To clearly illustrate the performance of distinct parts of the waste system, DEEP will provide separate estimates for MSW and C&D diversion.
Waste disposal will be measured by the average Connecticut per-capita tonnage of residential MSW landfilled or combusted; tonnage of non-residential MSW landfilled or incinerated (with or without energy production); and tonnage of C&D waste landfilled or incinerated (with or without energy production). These indicators will be tracked and reported separately from statewide diversion rates because they offer particular insight into the performance of initiatives aimed at waste reduction (including unit-based pricing) and reuse, which is difficult to accurately account for using other measures. This metric is most suited to comparing across states, as it does not involve varying definitions that can confound and recycling rate comparisons.
Waste composition will be measured through sampling conducted every three to five years. These studies provide meaningful data on the actual characteristics and composition of waste. Of particular relevance to planning and program evaluation is the

32
nature and amount of recyclable materials found in disposed waste. This data, in combination with other metrics, can be used to assess the effectiveness of curbside recycling programs, food scrap diversion programs, C&D recycling, reuse, and other key priorities of this Strategy. DEEP will conduct these studies at regular intervals, and will consider targeted studies at individual facilities, municipalities, or points of generation.
Statewide recycling performance will be measured by the tons and types of material marketed (recycled), and as a separate indicator of facility performance, the amount of residue generated by facilities processing source separated recyclables.
The following indicators should also be considered for integration into DEEP’s data program:
Greenhouse gas emissions and other air quality and environmental impacts of waste transport, processing, and disposal.
The quality of materials marketed by Connecticut recycling processing facilities, as determined by marketability / value.
Costs per ton (to municipal budgets and customers) for recycling, composting, and disposal.
Local Performance Indicators
The following key indicators are used to evaluate local system performance:
Recycling will be measured by estimating the amount of bottle, cans, and paper collected, based on municipal collection, recycling facility, and transfer station data, as applicable, as well as hauler reports. Municipalities may take credit for any materials collected through their municipal programs.
Disposal will be measured by average per-capita residential disposal rate for MSW and the tonnage of non-residential MSW disposed.
In addition to recycling and disposal measures, there are a number of qualitative indicators for system performance. These will be reported on annual municipal reports to DEEP. These include:
Do all collectors register with municipality as required? Do all residents have convenient access to collection points for all designated
recyclables?
Is free e-waste collection provided?
Are recycling bins provided in public spaces? If curbside collection is provided, are recycling bins the same size (or larger) than
trash bins?
33
Improvements to DEEP’s Data and Analytics Program
In order to more reliably measure and utilize the key indicators outlined above, DEEP will make the following improvements to its data collection and analytics program:
DEEP will develop an online reporting system for collectors, facilities, and municipalities. At present, various entities report data on a combination of paper and electronic forms, necessitating considerable time and effort on the part of reporters as well as manual data input and management by DEEP staff. Sustaining an effective data program requires the implementation of online reporting as soon as possible.
DEEP will collect data on residential MSW disposal as a subset of overall disposal. This will require greater accuracy in reporting by both collectors and receiving facilities but will provide much greater insight into the performance of both residential and commercial collection programs.
DEEP will provide an annual materials management scorecard providing key indicators on the status of the materials management system.
DEEP will more fully integrate analytics throughout its planning and program evaluation activities.

34
Materials Management by the Numbers (2016)
a. MSW Diversion, Disposal, Recycling, and Composition
The following MSW figures are based on FY2013 data reported to DEEP by Connecticut municipalities and by Connecticut permitted solid waste facilities.22
MSW includes regular trash and recyclable materials generated by residential, commercial, and industrial sources, excluding that which contains significant quantities of hazardous wastes, land-clearing debris, building and road construction and demolition structural debris, biomedical waste, and sewage sludge.23
Trends in MSW Generation
Statewide trends in generation can be understood by looking at per-capita generation over time. The per-capita generation rate has declined slightly since a high of 1 ton per person per year in 2004 as seen in Figure 3.
Statewide MSW Diversion
Statewide MSW diversion achieved through recycling or composting at Connecticut permitted, registered, or authorized solid waste facilities remains a reliable indicator of overall waste system performance. Diversion of other types of waste (e.g. C&D waste, some types of special waste, etc.) is not as easily tracked since data is not as complete or accurate as the MSW data.
22Connecticut Department of Energy and Environmental Protection, “Estimates of Connecticut Municipal Solid Waste (MSW) Generated, Disposed, and Recycled FY2013.” Available at: http://www.ct.gov/deep/lib/deep/reduce_reuse_recycle/Data/Average_State_MSW_Statistics_FY2013.pdf
23 Since the 2006 Solid Waste Management Plan, DEEP has changed its methodology for calculating MSW estimates. Most significantly, the 2013 MSW statistics include an estimate of Connecticut bottle bill material recycled. Also, calculations now include more complete estimates of scrap metal recycled by Connecticut scrap metal processors (the scrap metal estimate excludes C&D scrap metal, and automobile scrap metal).

35
Figure 3 Per Capita CT MSW Generated Source: DEEP annual waste data
For this Strategy, an attempt was made to track and include more complete statewide MSW recycling data than in the past. The FY2013 MSW recycling data was calculated as follows:
FY2013 Percent Statewide MSW Diversion =
FY2013 Tons MSW Materials Diverted or Recovered / FY2013 Tons MSW Generated
FY2013 Tons MSW Diverted or Recovered (through recycling and composting) includes the following:
MSW recyclables marketed by permitted, registered, or authorized recycling or composting facilities;
Connecticut-generated scrap metal marketed by scrap metal processors. Automobile and C&D scrap was excluded from this estimate.
Bottles and cans recycled through the bottle deposit system (based on a one- time study of Connecticut bottle bill material flow for FY2013);
Scrap metal recovered from RRF ash (although this data has been available historically, it was never included in the MSW recycling stats), most RRFs and the one ash-landfill in Connecticut have made substantial investment in technology to recover both ferrous and non-ferrous metals;
Additional material reported recycled by municipalities (e.g. organics, textiles, e-waste)
FY2013 Tons of MSW Materials Generated includes the following:
MSW diverted or recovered through recycling and composting (i.e., all of the items above);

36
MSW disposed of in landfills;
MSW incinerated with or without any energy production;
MSW converted to a fuel.
Statewide diversion (FY2013) is estimated to be 35 percent.
Statewide MSW Disposed
Statewide MSW disposal is measured by disposal method (e.g., landfill, WTE), tonnage disposed, and by per-capita disposal rate (pounds/person/year).
Approximately 87 percent of MSW disposed in FY2013 (2.3 million tons) was disposed in-state (just under 2.1 million tons). The vast majority of this in-state disposed MSW, just under 2.1 million tons, was managed in the state’s then six (now five) active MSW resources recovery facilities, generating electricity as a by-product.
In FY2013, a remaining 282,992 tons was reported as being sent out-of-state.
Using consistent methodology to calculate per capita MSW disposal rates, those rates have decreased from 1,532 pounds/person/year in 2004 to 1,300 pounds/person/year in FY2013. Figure 4 provides a sense of the historical trends since 1992, although data is not available for every year.
Figure 4 Per Capita MSW Disposed in Various Years Since 1992 Source: DEEP annual waste data

37
Figure 5 MSW Destinations (2013) Source: DEEP annual waste data
MSW Recycling and Composting
Approximately 1.25 million tons were estimated recycled and composted (not including an estimated 29,000 tons of material home composted and grasscycled) in FY2013, with paper and containers (traditional curbside materials plus bottle bill) representing about 40 percent of the total material estimated recycled or composted. Figure 6 shows the materials reported recycled in Connecticut.
Legally designated (mandated) recyclables are: glass and metal food containers plastics #1 and #2 scrap metal high grade white and colored office paper newspapers magazines boxboard corrugated cardboard organics from large sources, phased in as capacity becomes available waste oil leaves lead acid storage (motor vehicle) and Ni-Cd rechargeable batteries

38
Statewide Transition to Single-Stream Recycling
The vast majority of residential (and some non-residential) bottles, cans, paper, and beverage cartons are now recovered in Connecticut through “single stream” collection systems. These systems, sometimes called “zero sort” systems, allows certain empty food and beverage containers made of glass, metal, paper, or plastic — and paper products such as newspaper, magazines, cardboard, and boxboard — to be collected together in one container for sorting at a recycling processing facility such as a Materials Recovery Facility (MRF). This represents a significant shift since 2006, when the preceding State Solid Waste Management Plan was published, and it is a shift that demands significant attention to both its benefits and its challenges. The transition to single stream collection statewide was swift and driven largely by collection cost savings and increased amounts of recyclables collected (due in large part to the larger containers and expanded list of recyclables that usually accompany a transition to single stream collection and concurrent education campaigns). Unintended consequences of the transition — such as increased contamination and decreased quality of some of the material collected for recycling, and increased costs to some manufacturers and paper mills which use the recycled material as a feedstock to make a new product — have resulted in the need to optimize the system for better performance. Optimization includes improvements to local collection programs and the minimization of contamination.
Figure 6 Tons Reported Recycled (2013)Source: DEEP annual waste data

39
Contamination in Single-Stream Recycling
As is the case in most single-stream collection systems, the quality and market value of recycled materials collected in Connecticut are negatively impacted by contamination.
Although it is a designated recyclable material, glass, which constitutes over 17.4 percent of residential single-stream recyclables (by weight) entering facilities, is problematic when collected as part of the single-stream mix. According to the 2015 Waste Composition Study, 46 percent of all glass entering a MRF is broken in the process of collection and transportation. Broken glass wears on sorting equipment and can diminish the quality and end-market value of other recovered materials. The glass itself is highly contaminated by other materials in the collection and sorting process, and less than 40 percent of glass collected in single-stream is ultimately recycled. Most MRFs in Connecticut pay to have glass hauled away for disposal, in some cases at a cost of more than $20/ton.
Other materials considered to be contaminants include plastic bags and film plastic, shredded paper, C&D materials, wood, electronics, bulky items, textiles, diapers, sanitary products, and other organic wastes.
The 2015 Waste Composition Study also determined that the presence of bagged materials made up almost 3 percent of the materials entering recycling facilities from single-stream collection. Bagged materials contained roughly half waste and half recyclables, on average.
While levels of contamination are generally found to be higher in single-stream recycling collection systems than in dual stream (collecting paper separately from bottles and cans) or multi-stream source-separated collection systems (collecting one type of material separately e.g., cardboard), it is important to recognize that despite this challenge, single-stream collection systems generally yield greater overall quantities of recyclable materials, and can significantly decrease collection costs. Thus, this Strategy seeks to optimize single-stream recycling collection through increased education and standardization of collected materials, as well as promoting increased source-separation where doing so yields best results, such as expanding opportunities for the separate collection of glass.
Resources Recovery (Waste-to-Energy)
Connecticut’s primary MSW disposal management approach is energy recovery through five active MSW resources recovery facilities (RRFs, often referred to as waste-to-energy facilities). This system is challenged by market conditions that recently led to the closure of Connecticut’s smallest-capacity RRF (Covanta Wallingford) and may continue to threaten system capacity in the years to come. At the time of the development of this Strategy, it is estimated that Connecticut already faces a shortfall of in-state disposal capacity.

40
Figure 7 Connecticut Resources Recovery Facilities (2011-2014 annual avg.)
In FY2013, the state’s (then six) resources recovery facilities burned 2.2 million tons of MSW (2.1 tons from Connecticut). Together, the five currently active facilities have a combined maximum permitted design capacity of approximately 2.4 million tons per year, however, because RRFs typically operate at about 85 percent of design capacity, the operational capacity is likely just over 2 million tons per year. In FY2013, approximately 87 percent of all post-recycled Connecticut MSW disposed was burned in these facilities. This remains the highest reliance on in-state resources recovery capacity of any state.
The expiration of both long-term solid waste contracts and favorable power purchase agreements challenges Connecticut’s reliance on existing resources recovery infrastructure.
In 2012, Governor Dannel P. Malloy’s Modernizing Recycling Working Group called for a state policy that would “promote an environmentally beneficial infrastructure that balances the need for both stability and responsiveness under market conditions and includes a diversity of systems and facilities to collect, process, and recover material and energy value, and to support the development of stronger markets for recovered commodities.”
In 2013, the state’s Resources Recovery Task Force found that the infrastructure necessary to move the state towards its materials management goals was early in its development, and called for regulatory changes that could accelerate the transition from combustion-based waste-to- energy to newer technologies. The Task Force further noted that the closure of the state’s largest waste-to-energy facilities, whether because of maintenance costs or other economic factors, “has the potential to create a surplus of waste that could not be accommodated by the remaining plants, which are operating near capacity. This is would lead to an increase in the disposal of waste in out-of-state landfills, and could create a non-competitive environment with increased costs for municipalities.”
In 2014, the Covanta Wallingford RRF transitioned away from combusting waste, eliminating approximately 150,000 tons/year in disposal capacity. Covanta cited market conditions for its decision to discontinue combusting waste at the facility.

41
In 2015, an extended unscheduled shutdown of the Connecticut Waste System (Mid-CT) RRF at the same time as scheduled maintenance of other RRFs resulting in tens of thousands of tons of MSW being transferred out-of-state for disposal. Market conditions and the added cost to transport waste out-of-state prompted Covanta to increase commercial tipping fees at its Wallingford transfer station by nearly 30 percent, imposing unexpected and unwelcome cost increases on collectors and customers. The shutdown also increased queue times at tipping areas, causing delays to the normal operation of collectors and increasing overtime and other costs.
The owner of the Connecticut Waste System RRF, the Materials Innovation and Recycling Authority (MIRA), has warned that similar events are increasingly likely as aging equipment fails and must be replaced. MIRA officials have raised concerns about the practicality of maintaining and/or upgrading the facility.
Through a Request for Proposals (RFP) issued November 6, 2015, the state began a process to explore options for the redevelopment of the Connecticut Waste System RRF. However, any future redevelopment will take at least 3-5 years to complete, and may not replace the entire 888,888 TPY capacity of the current facility. This outcome has the strong likelihood of further disrupting current market patterns, raising costs for municipalities and other customers and leading to a vast increase in the amount of waste sent out of state to landfill. As discussed throughout this Strategy, this looming capacity shortfall can only be effectively addressed by swift action leading to the development of new facilities elsewhere in the state.
MSW Landfilling
Connecticut is the U.S. state closest to eliminating the landfilling of MSW within its borders. This distinction should not obscure the fact that the state sends significant (though still comparatively small) quantities of MSW, as well as the vast majority of its disposed C&D waste, to out-of-state landfills.
In FY2013, only 21,000 tons of the total amount of Connecticut-generated MSW was landfilled in the state, all of it at the Windsor-Bloomfield Sanitary Landfill, the state’s sole active MSW landfill. This is a significant decrease from 2006 levels, when the now-closed Hartford landfill accepted an additional 100,000 tons/year of MSW. The Hartford Landfill ceased ash landfilling and residue landfilling operations in 2008 and officially completed closure in 2015.
While in Connecticut, the prospect of future development of new landfill capacity for MSW disposal was once considered unlikely, the potential for escalating costs associated with out-of- state disposal could change the calculous for cities and towns until new facilities are permitted and operational within Connecticut. State law and Connecticut’s long-standing vision to move up the materials management hierarchy discourages that course of action, calling instead for increased source reduction, reuse, recycling, and investment in recycling and modern waste conversion infrastructure. Given that better alternatives exist, this Strategy rejects the development of new in-state landfill capacity for MSW disposal.

42
MSW Composition
In 2010 and 2015, DEEP conducted statewide waste composition studies to characterize the composition of MSW. To ensure the studies could be used for comparative purposes and to study trends, the field data collection methodology was identical in both years, though the 2015 Waste Composition Study was more comprehensive, including a composition analysis of recyclables collected in single stream recycling.
Between 2010 and 2015, significant changes in composition were noted. Most significant was a decrease in the prevalence of designated recyclables in the disposed MSW stream, a positive indicator that suggests the increased collection of designated recyclables. An apparent increase in the prevalence of food waste underscores the need to accelerate the development of organics management infrastructure. Figure 8 provides an overview of the 2015 composition of MSW.
Figure 8 2015 MSW Composition Source: 2015 Waste Characterization Study
Composition Comparison, 2010-2015
The most noteworthy change in the waste stream since 2010 is the heightened fraction of food waste remaining in disposed wastes, along with relatively lower incidence of most other materials. The percentage of plastics sampled in the waste stream also decreased from 14.7 percent in 2010 to 11.8 percent in 2015. Other organics (including yard trimmings) and metals did have a lower incidence in the waste stream. Lastly, electronic waste, items targeted by extended producer responsibility (EPR) programs implemented by the state in 2011, were observed at lower percentages in 2015 (0.5 percent) than in 2010 (2.1 percent).

43
Figure 9 compares the composition in 2015 with the same results from the 2010 Study.
Figure 9 2010-2015 MSW Comparison Source: 2015 Waste Characterization Study
Recoverable Materials in Disposed MSW
Even with a significantly increased capture of potentially recoverable recyclables (e.g., recyclable fibers, containers, plastics, and compostable organics) in the waste stream at facilities, 44.5 percent of materials are not currently recoverable through the curbside or on-site recycling system. This underscores the need for a holistic approach to diversion, including the promotion of source-reduction and reuse, optimization of recycling collection systems, the development of new markets for materials diversion, and an embrace of new processes for converting non- recyclable waste into energy or materials of value.
Figure 10 shows the breakdown of potentially recoverable materials within the disposed MSW stream. It indicates that the fraction of targeted curbside recyclables – dry fiber and plastic, metal and glass containers – remaining in the waste stream is a significant but comparatively smaller than the fraction of compostable organics, which include food wastes, yard wastes, and some compostable papers. It is important to note although some materials are not collected in single-stream, they may in fact be recyclable and are sometimes collected separately.
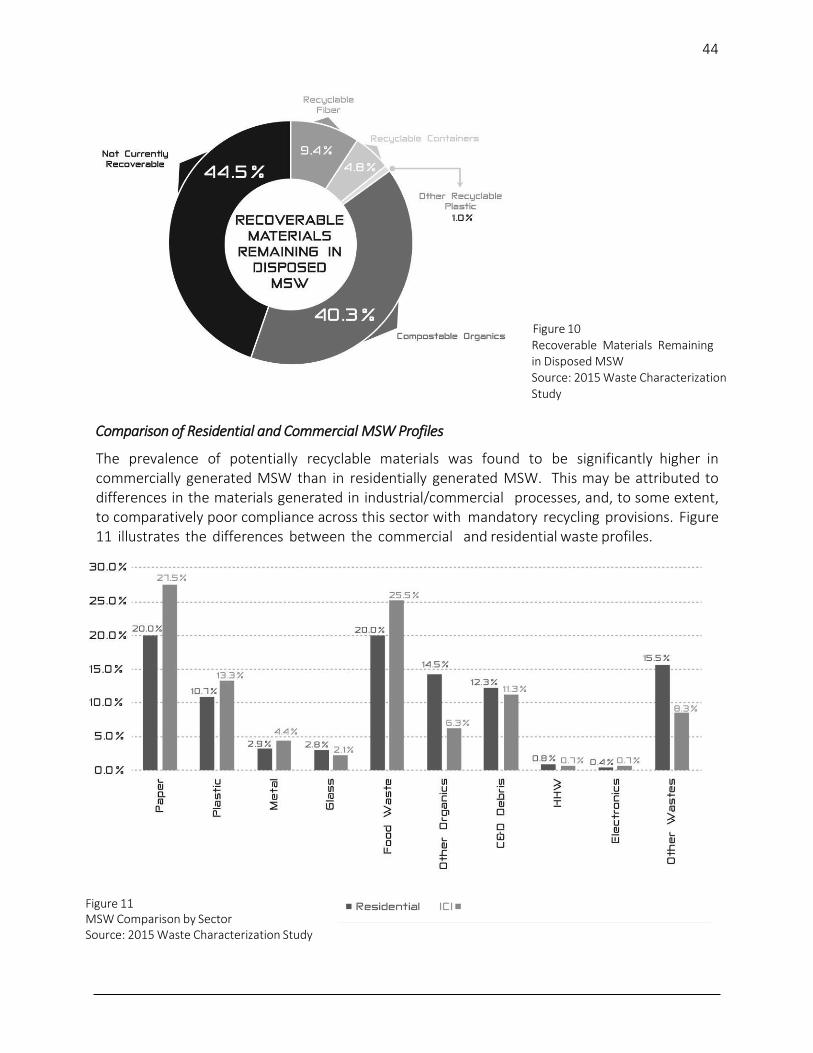
44
Figure 10 Recoverable Materials Remaining in Disposed MSW Source: 2015 Waste Characterization Study
Comparison of Residential and Commercial MSW Profiles
The prevalence of potentially recyclable materials was found to be significantly higher in commercially generated MSW than in residentially generated MSW. This may be attributed to differences in the materials generated in industrial/commercial processes, and, to some extent, to comparatively poor compliance across this sector with mandatory recycling provisions. Figure 11 illustrates the differences between the commercial and residential waste profiles.
Figure 11 MSW Comparison by Sector Source: 2015 Waste Characterization Study

45
b. C&D Waste / Oversized MSW
Connecticut statutes define bulky waste as demolition waste (other than clean fill) and land clearing debris. However, in practice, oversized MSW wastes such as mattresses, furniture, and carpet are commonly handled along with construction and demolition wastes, and consequently in this Strategy are termed “C&D waste/oversized MSW.”
Generation
Based on 2013 data reported to DEEP by Volume Reduction Facilities (VRFs) and Recycling Facilities, Connecticut generated approximately 1,041,643 tons of C&D waste. This figure includes a significant amount of oversized MSW which is managed along with C&D waste. Almost all of the C&D waste originated from within the state, with only approximately 48,000 tons of C&D materials being identified as imported from other states. The 1,041,643 tons generated translates into approximately 0.29 tons per capita per year.
Composition/Characterization
Green Seal performed a series of quantitative estimations of the different components of “typical” materials entering VRFs in Connecticut. Inbound loads were observed for a total of eight days at four different VRFs to obtain data on the typical percentages of the major inbound material makeup.
A summary of the average composition data generated from the analysis is provided in the Figure 12 below.
Figure 12 C&D Composition, 2015 Source: 2015 C&D Characterization Study

46
Figure 13 below applies the percentages obtained from the quantitative estimations to the baseline C&D Generation estimate of 1,041,643 tons in 2013.
Figure 13 – 2015 Quantitative Estimations Applied to 2013 Connecticut C&D Generation Source: 2015 C&D Characterization Study
Disposal of C&D
Connecticut relies heavily on out-of-state disposal for C&D waste. Approximately 82 percent of C&D waste is disposed of out-of-state. Of C&D waste disposed within Connecticut, 60 percent were disposed at RRFs. The Manchester Sanitary Landfill received the majority of the remainder of the tonnage with approximately 50,631 tons or 31.9 percent, with the remaining tonnage going to several small outlets, including for usage as landfill cover.
Based on 2013 Connecticut facility data reports, interviews with VRFs, and when possible, verification with adjacent states’ solid waste agencies, Figure 14 provides a summary of the disposal of C&D materials generated within Connecticut.

47
Figure 14 – 2013 Connecticut VRF Outbound Disposal to Receiving States Source: 2015 C&D Characterization Study
Diversion of C&D
Based on 2013 facility data reports and interviews with VRFs and Recycling Facilities, Figure 15 provides a summary of recycling of C&D materials in Connecticut. Given the estimated generation of 1,041,643 tons of C&D materials in 2013, with 71,181 tons reported recycled, Connecticut VRFs achieved a C&D recycling rate of approximately 7 percent. It should be noted that this recycling rate does not include an unknown quantity of materials (asphalt, brick and concrete, metals, and in some cases clean wood, gypsum, cardboard, and plastics) that are diverted at the source of generation and sent to non-reporting destinations. Because of this limitation, further study is needed to determine the overall diversion of C&D and oversized MSW.
Figure 15 – 2013 C&D Recycling in Connecticut Source: 2015 C&D Characterization Study

48
CMMS Actions & Implementation
The following Action Plan is founded on the three goals of this Strategy and presents the actions required to achieve each goal. Together, the three goals are central to achieving 60 percent diversion of materials from disposal by 2024.
Goal 1: Improve the performance of municipal recycling programs and reduce waste, including increasing participation and compliance with mandatory recycling provisions.
To achieve 60 percent diversion, Connecticut must boost statewide recycling rates
from the current 35 percent to 45 percent over eight years. This will require
significant steps by the state and municipalities to improve recycling collection
systems, including both compliance with existing statutory requirements and the
implementation of new best management practices.
Objective 1.1: All municipalities achieve full compliance with existing statutory requirements.
DEEP will seek to assure compliance with statutes while allowing reasonable time for the implementation of necessary programs. State statute requires that every municipality make provision for the separation, collection, processing and marketing of items generated within its borders (CGS Sec. 22a-220 subsection (f)), and requires the following with respect to recycling:
a) All residents, institutions, and businesses have access to public or private collection programs, either curbside or at a local or regional drop-off location (transfer station or other), for all materials designated for recycling as required by CGS Sec. 22a-241j. Target Date: On or before 12/31/2017
b) Every municipality has designated a municipal or regional agent as required by CGS 22a-220 (i). Target Date: On or before 12/31/2017
c) Every municipality reports on their recycling programs to DEEP as required by CGS Sec. 22a-220 (h). Target Date: On or before 12/31/2017
d) All private collectors are registered with every municipality (or duly designated
regional authority) in which they operate, and report annually using the form prescribed by DEEP as required by CGS Sec. 22a-220a (d)(1). Target Date: On or before 12/31/2017
49
e) Every municipality and state agency has provided for collection of recyclables alongside collection of trash in public spaces as required by CGS Sec. 22a- 241k, or such upgrade is in progress. Target Date: On or before 12/31/2017
Objective 1.2: Every municipality demonstrates progress in planning and program implementation necessary to achieve the statutory diversion goal.
CGS Section 22a-241a requires that this Strategy provide the options for compliance of municipalities with recycling requirements in furtherance of the state-wide goal of 60 percent diversion from disposal. Adoption of all of the following recommended actions demonstrates sufficient progress towards the statewide diversion goal:
a) Every municipality has developed a plan or program for residential and commercial recycling outreach and enforcement of local ordinances established in accordance Sec. 22a-220 (f), and updated ordinances as needed to be consistent with CGS Sec. 22a-241b and RCSA 22a-241b. Target Date: On or before 12/31/2018
b) Every municipality (or duly designated regional authority) has implemented waste reduction initiatives designed to reduce total MSW disposed by at least 10 percent from a 2014 baseline by the year 2024. This may include the implementation of unit-based-pricing systems.24 This is consistent with the waste reduction goal established in CGS Sec. 22a-220 (f) and this Strategy, which calls for a statewide reduction in MSW of 10 percent by 2024 to meet the statutory goal of diverting 60 percent of materials from disposal. Target Date: On or before 12/31/2018
c) Every curbside collection program provides residents sufficient opportunity to recycle accepted materials at the rate they are generated. This could include the provision of recycling carts that are of equal or greater size as those for trash (assuming biweekly recycling collection), and/or the provision of weekly recycling collection. This is consistent with the municipal recycling goal established in Sec. 22a-220 (f) and this Strategy, which calls for a statewide recycling rate of 45 percent by 2024 to meet the statutory goal of diverting 60 percent of materials from disposal. Target Date: On or before 12/31/2018
24 If residential trash collection is provided as a public service, unit-based pricing makes the cost of trash pickup visible to residents and offers a savings sufficient to incentivize waste reduction. If residential trash collection is available as a private service, the municipality may by ordinance, contract, or through its collector registration program to require appropriate differentials in pricing depending on cart size, prohibit volume-based discounts in pricing of curbside service, or establish other standards to ensure that residents have incentives to reduce the disposal of waste.

50
Objective 1.3: Improve the quality and availability of data and the use of metrics to evaluate the performance of state, regional, and local recycling programs.
a) Ensuring the accurate reporting by solid waste facilities of town of origin of
waste, as required by 22a-220 (b). Target Date: On or before 7/1/2017
b) Collection of data to allow accurate estimation of residentially generated versus commercially generated materials. Target Date: On or before 7/1/2017
c) Enhanced reporting by collectors, including the reporting of information useful to municipalities in estimating or verifying total tonnages of disposed and recycled materials. Target Date: On or before 12/31/2017
d) Accelerated migration of DEEP reporting forms to an online environment and
other measures to streamline reporting. Target Date: On or before 12/31/2017
e) The timely publication by DEEP of an annual materials management scorecard to provide insight on progress towards diversion goals. Target Date: On or before 12/31/2017
f) Increased availability of data collected by DEEP for analysis by regional and
local planners and other interested parties. Target Date: On or before 12/31/2017
Objective 1.4: Accelerate progress on organics reduction and diversion for composting, recycling, and energy recovery.
Organics management provides the largest opportunity to increase Connecticut’s waste diversion. The following actions are needed to meet this objective:
a) Connecticut will promote the donation and recovery of edible food for human and/or animal consumption. Target Date: Ongoing
b) Connecticut will focus on the effective implementation of the state’s law mandating source separation and recycling of food scraps by large generators (CGS Sec. 22a-226e). This includes a program of outreach to generators, technical assistance for compliance, and enforcement. Target Date: Ongoing
c) DEEP will continually evaluate and make improvements to permitting standards and practices to promote innovation in organics management. This includes the establishment of clear guidelines for the management and use of

51
residual digestates of anaerobic processes, and priority processing of permit applications for facilities that will manage organics. Target Date: Ongoing
d) DEEP, in possible partnership with the RecycleCT Foundation, will offer grants for educational programs that encourage food waste reduction, engage in food recovery, provide home composting education, and support community composting initiatives. Target Date: On or before 7/1/17
Objective 1.5: Promote source separation and best management practices of recyclable C&D and
Oversized MSW materials.
Both voluntary and mandatory programs for the source separation and management of materials will be considered. The following actions are needed to meet this objective:
a) DEEP will reevaluate permit standards for diversion of recyclable materials at volume reduction facilities. Target Date: On or before 7/1/17
b) DEEP will develop and implement an initiative to increase source separation of designated recyclables at job sites. Target Date: On or before 12/31/17
c) Connecticut will consider designating new materials for recycling, depending on the status of markets of those materials. Target Date: Ongoing
d) Connecticut will promote deconstruction and reuse of C&D materials. Target Date: Ongoing
e) DEEP will study opportunities for diversion of oversized MSW as well as increasing in-state disposal options for these materials. Target Date: Ongoing
Objective 1.6: Improve collection and processing systems for “single-stream” recyclables.
a) DEEP will increase enforcement of mandatory recycling provisions, with state- led programs of technical assistance, compliance assurance, and enforcement for commercial generators and multi-unit residential dwellings. Target Date: Ongoing
b) DEEP will study and provide options to policymakers for the identification /
creation of funding sources for state and local programs related to recycling and sustainable materials management. Target Date: 1/1/2017
c) Connecticut will increase outreach and education, including via the RecycleCT Foundation, to promote effective public participation in recycling. Main areas

52
of focus are increasing participation and decreasing the contamination of single-stream recycling collection. Target Date: 1/1/2017
d) DEEP will pursue approaches to increase the effective recycling of glass. Target Date: Ongoing
e) Source-separation of designated (mandatory) recyclables is required under statute and remains the preferred driver for recycling. Where source separation has occurred but designated and other recyclable materials remain in the MSW or other solid waste streams, DEEP allows for the development of processes - and permitted facilities - that can glean additional recyclable materials from MSW or other solid waste. Where present, processes that sort MSW or other types of solid waste to recover designated recyclables are not an adequate substitute for compliance with source-separation requirements and cannot justify any failure by collectors or generators to provide for and perform source separation of designated recyclables as required by law. Target Date: Ongoing
Goal 2: Develop and improve recycling and waste conversion technologies. Achieving 60 percent diversion will require at least 10 percent of materials to be diverted using technological processes that are not yet fully developed in the state, and the state must also maintain sufficient disposal capacity for materials that are not diverted.
Objective 2.1: Break down barriers to innovation.
The State will evaluate and work to remedy regulatory factors that serve to burden or discourage the development of new facilities. While maintaining a focus on the protection of the environment as the first priority, the state will seek to eliminate barriers to the development of new recycling, waste conversion, and disposal facilities that are needed to maintain sufficient in-state capacity and increase the diversion of materials by recycling and waste conversion. The following actions will be implemented to meet this objective:
a) The State will define a new category of waste conversion technologies, distinct from resources recovery and recycling. These technologies will not be subject to the Determination of Need process. Target Date: Ongoing
b) The State will revise the Determination of Need process to allow for the development of excess disposal capacity in the state. Target Date: Ongoing
c) The State will refine existing and develop new preferences, performance standards, and permitting language specific to conversion technologies,
53
including anaerobic digestion, gasification, and technologies that convert waste to fuel or other chemical byproducts. Target Date: Ongoing
d) DEEP will continue to refine its internal processes to ensure timely decisions for new and modified permits while maintaining environmental standards. Target Date: Ongoing
e) In an open and transparent process, DEEP will refine and develop new performance standards for recycling and volume reduction facilities and integrate those standards into permit language. Target Date: Ongoing
f) DEEP will develop a policy to promote the retention of needed Waste-to- Energy capacity while promoting innovation. Target Date: Ongoing
Objective 2.2: Promote development of new infrastructure in partnership with host communities.
a) The State will study and/or inventory potential sites for waste facilities. Target Date: 12/31/17
b) The State will develop a concept study for potential facility development, including an eco-industrial parks. Target Date: 12/31/17
c) DEEP will study and provide options to policymakers for the identification / creation of funding sources for programs related to the development of new infrastructure. Target Date: 1/1/17
d) The State will develop the capacity, either at DEEP, MIRA, Green Bank, or in a new entity, to help match municipal partners with project developers and align state incentive programs to catalyze development of new infrastructure. Target Date: 12/31/17
Objective 2.3: Leverage intersections between renewable energy, climate, and materials management goals.
a) DEEP will carefully study how incentives for renewable energy production may be used to promote technologies that recover energy from waste. Target Date: Ongoing
b) DEEP will explore opportunities to prioritize permitting for Class I resources to
enable improved access to time-limited financial incentives (e.g., Virtual Net Metering). Target Date: Ongoing
c) DEEP will engage municipalities in achieving sustainability goals as part of statewide coordination of sustainability actions to assist municipalities to

54
articulate greenhouse gas emissions metrics attributed to solid waste diversion from disposal. Target Date: Ongoing
d) DEEP will work with the Connecticut Green Bank to explore opportunities for pre-development financing customized for anaerobic digestion facilities and other waste conversion technologies. Target Date: Ongoing
Goal 3: Encourage corporations that design, produce, and market products to share responsibility for stewarding those materials in an environmentally sustainable manner.
Objective 3.1: Study the feasibility of an EPR system for consumer packaging.
DEEP will work with stakeholders to study (1) how such a system could help meet the state’s goal of 60 percent diversion, (2) how such a system would impact municipal budgets, (3) how such a system would impact the state’s economy, (4) how such a system would impact existing businesses and industries, and (5) how such a system would impact product/packaging design, including the promotion of recyclability and the reduction of toxicity. Target Date: Ongoing
Objective 3.2: Pursue a framework approach to EPR program implementation.
DEEP will promote the development of a framework model to clarify and streamline the creation of EPR programs for designated products or materials. Target Date: Ongoing
Objective 3.3: Promote regional approaches to EPR / stewardship policies and programs.
DEEP will work with counterparts in other states to explore the development of regional / inter-state programs. Target Date: Ongoing
Objective 3.4: Update the State’s priority list of product categories or materials for consideration for EPR / stewardship programs.
DEEP will revisit the list of materials developed in 2012 and update as needed, using a process that includes input from stakeholders. DEEP will then pursue the development of voluntary or mandatory programs to address those materials. Target Date: Ongoing
-END-