the conservation value of residential landscapes for
TRANSCRIPT
University of Massachusetts Amherst University of Massachusetts Amherst
ScholarWorks@UMass Amherst ScholarWorks@UMass Amherst
Open Access Dissertations
9-2011
The Conservation Value of Residential Landscapes for Native Bird The Conservation Value of Residential Landscapes for Native Bird
Communities: Patterns, Processes, and Management Implications Communities: Patterns, Processes, and Management Implications
Susannah Beth Lerman University of Massachusetts Amherst, [email protected]
Follow this and additional works at: https://scholarworks.umass.edu/open_access_dissertations
Part of the Biology Commons
Recommended Citation Recommended Citation Lerman, Susannah Beth, "The Conservation Value of Residential Landscapes for Native Bird Communities: Patterns, Processes, and Management Implications" (2011). Open Access Dissertations. 464. https://scholarworks.umass.edu/open_access_dissertations/464
This Open Access Dissertation is brought to you for free and open access by ScholarWorks@UMass Amherst. It has been accepted for inclusion in Open Access Dissertations by an authorized administrator of ScholarWorks@UMass Amherst. For more information, please contact [email protected].
THE CONSERVATION VALUE OF RESIDENTIAL LANDSCAPES FOR NATIVE BIRD COMMUNITIES: PATTERNS, PROCESSES, AND
MANAGEMENT IMPLICATIONS
A Dissertation Presented
by
SUSANNAH B. LERMAN
Submitted to the Graduate School of the University of Massachusetts Amherst in partial fulfillment
of the requirements for the degree of
DOCTOR OF PHILOSOPHY
September 2011
Program in Organismic and Evolutionary Biology

© Copyright by Susannah B. Lerman 2011
All Rights Reserved
THE CONSERVATION VALUE OF RESIDENTIAL LANDSCAPES FOR NATIVE BIRD COMMUNITIES: PATTERNS, PROCESSES, AND
MANAGEMENT IMPLICATIONS
A Dissertation Presented
by
SUSANNAH B. LERMAN
Approved as to style and content by: _______________________________________ Paige S. Warren, Chair _______________________________________ Stephen DeStefano, Member _______________________________________ Elizabeth Jakob, Member _______________________________________ Kevin McGarigal, Member
____________________________________ Elizabeth R. Dumont, Program Director Organismic and Evolutionary Biology

DEDICATION
To my husband James, for sharing his passion for birds with me, and to my son Matan, for letting me share my passion for birds with him.
v
ACKNOWLEDGMENTS
I am extremely grateful to the numerous people who advised, guided, and
supported me throughout the entire Dissertation process. I want to thank my advisor,
Paige Warren for inviting me to work with her, and believing in my abilities to excel as a
graduate student. She has been a wonderful mentor and friend and I am honored to be a
part of the Warren Lab. I am also extremely grateful for my husband, James Smith, for
being my biggest supporter and encourager during the many years I’ve been in graduate
school. My running partner, Colleen Sculley, has been and continues to be a great
sounding board for my research questions and career advice, especially during our long
runs. I am thankful for my graduate student community, especially, Kara Belinski, Alix
Contosta, Sandy Haire, Dana Moseley, Laura Parfrey, Sharlene Santana, and Jenn
Seavey. They all provided constant friendship, encouragement, and critical eyes for all
things dissertation and beyond. Christofer Bang was my labmate while in AZ and
provided opportunities for intellectual discussions while in the midst of field work, and
also accompanied me on many hikes in the Sonoran desert. The members of my
Dissertation committee, Steve DeStefano, Beth Jacob, and Kevin McGarigal, all provided
unique perspectives, timely advice and fruitful discussions which greatly enhanced my
manuscripts and the shaping of my scientific views. I am delighted that a chance meeting
with Eyal Shochat at the Beer Sheva sewage farm translated into a career as an urban
ecologist. He has advised and encouraged me throughout the years and have enjoyed our
many ecological discussion over the years. The OEB program manager, Penny Jaques,
was integral to the ‘behind the scenes’ running of my graduate career and ensured all the
administrative tasks were completed. My mom, Naomi Lerman, provided five star field
vi
accommodations, complete with laundry service, gourmet meals and babysitting. She has
been a tremendous supporter of me and my work and I am incredibly grateful for her
involvement.
I am indebted to the many people who helped with the smooth running of my
field seasons in Phoenix. In particular, Stevan Earl, field project manager at CAP LTER
was instrumental in organizing equipment, schedules, and field techs. I can’t thank him
enough for all his assistance and constant encouragement. Marcia Nation, project
manager at CAP LTER assisted with many logistics throughout my field seasons. I thank
Monica Elser for inviting me to participate in the Ecology Explorers project with CAP
LTER. This opportunity for outreach with high school students was a highlight of my
involvement with CAP. Corrina Gries and Wayne Porter provided technical advice and
helped with data management. Kelly Turner introduced me to how social science fits
within my research and am thankful for her influence on my ecological thought. Raul
Aguilar, Phil Tarant and Rich Paulson were instrumental in setting up my cameras for the
seed tray experiments. They spent countless hours troubleshooting the equipment and
taught me how to configure all the cameras and computers to work with minimal trouble.
Jesse McClure helped with modeling foraging efficiency. Hilary Gan was an extremely
reliable field technician and I am forever indebted to her for the running of the seed tray
experiments. Conducting research in private homes required the support of many
homeowners and I am grateful for the unlimited access to their yards over the years.
Additional people streaming through the Warren Lab have provided great advice
and discussion. In particular, I have enjoyed the many lab meetings (both formal and
informal) with Noah Charney. Mark Bellis, Michael Strohbach, Rachel Levine and Janice
vii
Zepko have been great lab mates and I have gained so much from interacting with them.
Lauren Lynch was integral to the foraging chapter and I am grateful for her dedication to
the video analysis.
And finally, my research would not have been possible without the financial
support from a number of fellowships and grants. During my final year, I was supported
with a Robert and Patricia Switzer Foundation Environmental Fellowship. My field
research in Phoenix was supported by the National Science Foundation under Grant No.
DEB-0423704, Central Arizona-Phoenix Long-Term Ecological Research (CAP LTER).
This included two summer research grants and two research assistantships. Linda
Williams and the Global Institute of Sustainability at Arizona State University provided
institutional support for all my field seasons. Travel grants from The Ecological Society
of America and The Wildlife Society greatly enhanced my research through the
interaction with other scientists working within my field. I received summer support and
research assistantships from the McIntire-Stennis Fund, U.S. Department of Agriculture.
And finally, I thank the University of Massachusetts – Amherst and OEB for providing
travel funds and teaching assistantships.
viii
ABSTRACT
THE CONSERVATION VALUE OF RESIDENTIAL LANDSCAPES FOR NATIVE BIRD COMMUNITIES: PATTERNS, PROCESSES, AND MANAGEMENT
IMPLICATIONS
SEPTEMBER 2011
SUSANNAH B. LERMAN, B.A., UNIVERSITY OF DELAWARE
M.S., ANTIOCH UNIVERSITY, NEW ENGLAND
Ph.D., UNIVERSITY OF MASSACHUSETTS AMHERST
Directed by: Professor Paige S. Warren
Urbanization, as it transforms natural biotic systems into human-dominated
landscapes, is recognized as one of the greatest threats to biodiversity throughout the
world. Furthermore, urban dwellers are becoming increasingly disconnected with the
natural world. Here I investigate whether residential landscape designs that mimic the
natural environment can provide habitat for native birds. First I uncover some of the
patterns of bird distribution in residential yards by incorporating habitat features,
urbanization measurements and socioeconomic factors with bird monitoring data into a
multivariate analysis. The results indicate that native birds associate with neighborhoods
with native plants and shrubs, neighborhoods closer to desert tracts, and higher income
neighborhoods. Very few bird species associate with low income and predominantly
Hispanic neighborhoods. Additional analyses based on social survey data demonstrate
that residents notice the varying levels of bird variety in their neighborhood. Second, I
address whether perceived habitat quality differs between residential landscape designs
by testing foraging decisions at artificial food patches. Birds foraging in yards landscaped
ix
with native plants consume fewer resources than birds foraging in exotic landscaped
yards. This suggests that alternative food sources are more available in the native
landscaped yards, indicating better quality habitat. Third, I investigate the relationship
between native bird diversity and neighborhoods with a Homeowner Association (HOA).
Neighborhoods with an HOA have higher native bird diversity, perhaps due to an active
and enforceable landscape maintenance plan. I suggest an HOA adapt features from the
Sustainable Sites Initiative to further improve habitat conditions for native birds and other
wildlife. Results from the Dissertation support the implementation of native landscaping
in residential yards to help reverse the loss of urban biodiversity. Consequentially, these
landscapes will provide positive opportunities for urban dwellers to reconnect with the
natural world.
x
TABLE OF CONTENTS
Page ACKNOWLEDGMENTS ...................................................................................................v
ABSTRACT ..................................................................................................................... viii
LIST OF TABLES ........................................................................................................... xiii
LIST OF FIGURES ......................................................................................................... xiv
CHAPTER
1. INTRODUCTION ...................................................................................................1
2. THE CONSERVATION VALUE OF RESIDENTIAL YARDS: LINKING BIRDS AND PEOPLE ...........................................................................6
2.1 Introduction ........................................................................................................6
2.2 Materials and Methods .....................................................................................10
2.2.1 Study area..........................................................................................10
2.2.2 Study design ......................................................................................10
2.2.3 Bird surveys ......................................................................................11
2.2.4 Habitat description ............................................................................12
2.2.5 Socioeconomic variables ..................................................................14
2.2.6 Urban gradient variables ...................................................................14
2.2.7 Phoenix Area Social Survey (PASS) ................................................15
2.2.8 Statistical analysis .............................................................................16
2.3 Results ..............................................................................................................19
2.3.1 Habitat and landscape planting variables ..........................................19
2.3.2 The ordinations .................................................................................20
2.3.3 Social survey results (PASS) ............................................................22
2.4 Discussion ........................................................................................................22
2.4.1 Landscape plantings and the urban gradient .....................................23
2.4.2. Socioeconomics and bird communities ...........................................25
2.4.3 Residents’ perception of diversity ....................................................28
2.4.4 Implications.......................................................................................28
xi
3. COUNTING PECKS HELPS EXPLAIN URBAN BIRD COMMUNITY STRUCTURE: FORAGING EXPERIMENTS IN RESIDENTIAL YARDS ..................................................................................................................39
3.1 Introduction ......................................................................................................39
3.1.1 Optimal foraging theory and giving up densities ..............................43
3.2 Materials and Methods .....................................................................................44
3.2.1 Study area..........................................................................................44
3.2.2 Seed trays ..........................................................................................45
3.2.3 Assessing the perceived risk of predation .........................................45
3.2.4 Video recording and analysis ............................................................46
3.2.5 The GUD-Peck model.......................................................................47
3.2.6 Calculating rate of consumption .......................................................49
3.2.7 Perceived predation risk ....................................................................49
3.2.8 Bird community ................................................................................50
3.2.9 Landscape design differences ...........................................................51
3.3 Results ..............................................................................................................52
3.4 Discussion ........................................................................................................54
3.4.1 Yard design .......................................................................................54
3.4.2 Bird densities ....................................................................................55
3.4.3 Bird community ................................................................................56
3.4.4 Species differences............................................................................57
3.4.5 Predation ...........................................................................................59
3.4.6 Making GUD better ..........................................................................60
3.5 Conclusion .......................................................................................................60
4. HOMEOWNER ASSOCIATIONS AS A VEHICLE FOR PROMOTING
URBAN BIODIVERSISTY ..................................................................................68
4.1 Introduction ......................................................................................................68
4.1.1 Homeowner Associations .................................................................71
4.1.2 Management and Regulation of HOAs .............................................72
4.2 Materials and Methods .....................................................................................73
4.2.1 Study site ...........................................................................................73
4.2.2 Bird, Plant and Arthropod Surveys ...................................................74
4.2.3 Statistical Analysis ............................................................................74
4.3 Results ..................................................................................................76
xii
4.4 Discussion ........................................................................................................77
4.4.1 Socio-ecology and landscape management ......................................77
4.4.2 Ecological theory and landscape management .................................78
4.5 Management implications: retrofitting HOAs .................................................81
4.5.1 Sustainable Sites Initiative ................................................................81
4.6 Conclusion .......................................................................................................84
BIBLIOGRAPHY ..............................................................................................................90
xiii
LIST OF TABLES
Table Page
Table 2.1: Independent variables used for the three RDAs (habitat, urban gradient, socioeconomic variables). ........................................................ 30
Table 2.2: Bird list .................................................................................................... 31
Table 3.1: Arrival and residency time for all species visiting artificial food
patches..................................................................................................... 62
xiv
LIST OF FIGURES
Figure Page
Figure 2.1: Bird monitoring locations ....................................................................... 33
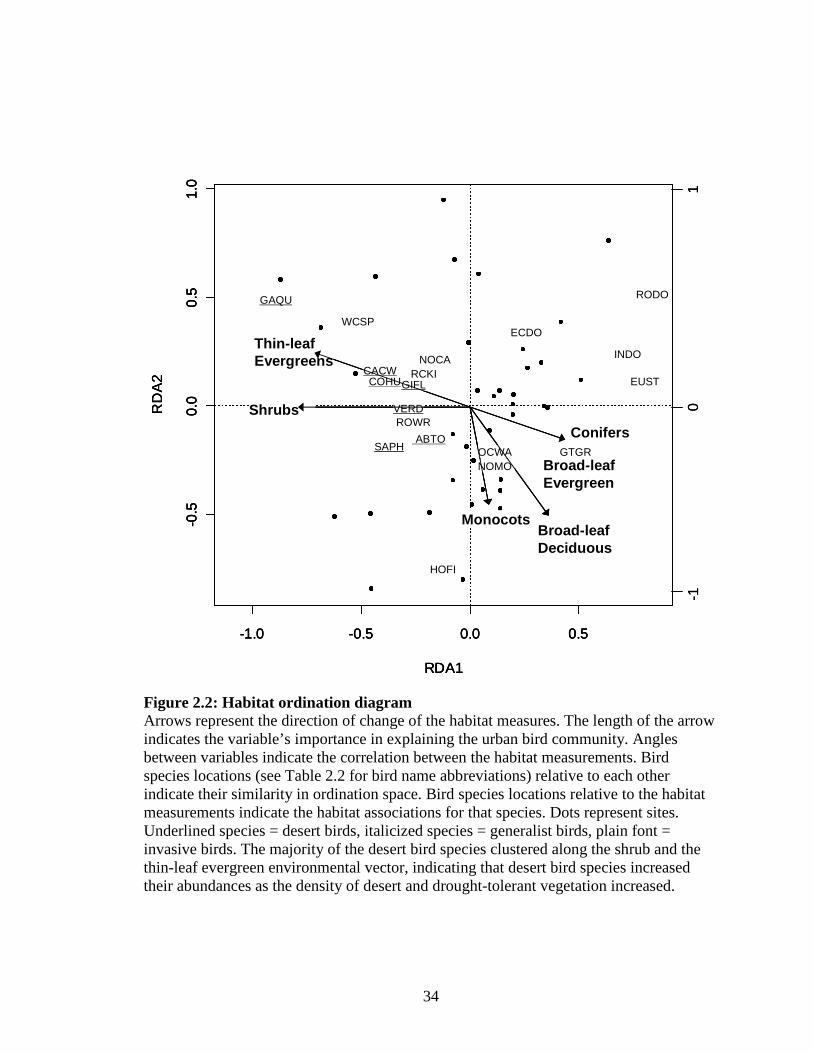
Figure 2.2: Habitat ordination diagram ..................................................................... 34
Figure 2.3: Socioeconomic ordination diagram ........................................................ 35
Figure 2.4: Urban gradient measurements ordination diagram ................................ 36
Figure 2.5 a, b: Desert vegetation and native birds................................................... 37
Figure 2.6: Resident satisfaction ............................................................................... 38
Figure 3.1 The GUD-Peck model ............................................................................. 63
Figure 3.2: Mean giving up densities (GUD) for each species visiting seed trays for mesic and xeric yards ............................................................... 64
Figure 3.3: Comparison of giving up densities (GUD) between mesic and xeric yards ............................................................................................... 65
Figure 3.4: Interaction between bird density, yard type and giving up densities (GUD) ..................................................................................................... 66
Figure 3.5: Foraging efficiency for four common seed tray birds. ........................... 67
Figure 4.1: Locations of Homeowner Association neighborhoods .......................... 85
Figure 4.2: Diversity relationships and Homeowner Association neighborhoods ......................................................................................... 86
Figure 4.3: Covenant Conditions and Restrictions (CCR) for landscaping practices in HOA neighborhoods, Phoenix, AZ. .................................... 87
Figure 4.4: Covenants, Conditions and Restrictions and Sustainable Sites Initiative features .................................................................................... 88
Figure 4.5: To prune or not to prune ......................................................................... 89
1
CHAPTER 1
INTRODUCTION
Urbanization profoundly transforms ecosystems and impacts the goods and
services that they provide. Already, more than half of all Americans live in cities and the
transformation to urban lands is expected to accelerate in the coming years: by 2050,
80% of all Americans and more than half the world population will live in urban and
suburban areas (United Nations Population Fund 2007). And the city’s footprint extends
far beyond the city limit, encompassing 100 – 300 times the land of the city (Grimm et al.
2008). One of the most prominent physical features of urbanization is the loss and
alteration of wildlife habitat. This is recognized as one of the leading causes of
biodiversity loss on a global scale (Czech et al. 2000). Urbanization also degrades and
depletes natural resources that help support human populations. An additional
consequence of the loss of urban biodiversity is the continual disconnect between people
and nature (Turner et al. 2004, Miller 2005). According to the Kaiser Family Foundation,
on a non-school day, kids spend on average 7.5 hours in front of a screen. And according
to Richard Louv, author of Last Child in the Woods, and other environmental psychology
studies, this has profound effects on attention span, quality of life, and well-being.
Ecologists have primarily focused on pristine wilderness areas, and the sub
discipline of urban ecology is relatively new within the field of ecology. But as our cities
continue to spill into the wildlands, ecologists have increasingly become interested in
how wildlife responds to urbanization, and how people respond to urban nature. The
majority of urban biodiversity studies have used a gradient approach, modeled after
2
Whitaker’s (1967) vegetation gradient analyses. Urban ecologists divide the urban
landscape into segments based on land-use and urbanization intensity, and study animal
populations. Downtown and city-centers are located at the most urbanized end of the
gradient, followed by residential land-uses and suburbs, then rural and ex-urban, low
density housing, followed by the wildlands, wilderness areas, and pre-urbanization
conditions at the opposite end of the gradient. In general, species richness and evenness
decline while biomass and density increase towards the urban end of the gradient (Blair
1996; Chace and Walsh 2006; Shochat et al. 2010). This pattern is evident in a wide
range of taxa including fish, arthropods, and birds (Paul and Meyer 2001; Faeth et al.
2005; Chace and Walsh 2006). Furthermore, biological communities become
increasingly homogenized whereby a few species dominate the urban landscape while
many specialist species disappear (Marzluff 2001; McKinney 2006). In essence, our
cities are losing their uniqueness regarding animal communities.
Residential landscapes represent a large percentage of urban land cover (Cannon
1999; Martin et al. 2003; Chamberlain et al. 2004). Managing these landscapes for native
birds and other wildlife could potentially improve urban biodiversity (Miller and Hobbs
2002; Cannon et al. 2005; Warren et al. 2008). Residential landscape designs vary in
vegetation composition and configuration whereby some designs might include novel and
foreign vegetation, while others mimic the wildlands being replaced. In his book Win-
Win Ecology, Rosenzweig (2003) introduced the emerging practice of Reconciliation
Ecology. This field includes the “science of inventing, establishing and maintaining new
habitats to conserve species diversity in places where people live, work or play” (p. 7).
Urbanites have their primary interactions with nature in their front and back yards, and
3
thus these landscapes present opportunities for people to reconnect with the natural
world. Furthermore, birds represent a model system to study urbanization due to their
ubiquitous nature, ease in monitoring and use as a bioindicator (Bock 1997). Birds have
been the focus of a high proportion of urban ecological studies and general patterns have
emerged (Emlen 1974; Beissinger and Osborne 1982; Marzluff 2001; Chace and Walsh
2006).
The broad goal of my dissertation research is to consider the conservation value
of residential yards by determining whether landscaping with native plants has the
potential to alleviate urbanization pressures on avian biodiversity, how landscape features
influence native bird patterns and processes, how humans interact with the urban
landscape, and solutions on managing residential yards for wildlife. Determining when
and where bird habitats are compatible with priorities of humans is an essential piece that
is currently missing from our knowledge of urban ecology (Chamberlain et al. 2004).
Reconciling the needs of humans and wildlife stands to improve quality of life for city
dwellers and simultaneously benefit the conservation of natural communities. In this
Dissertation, I address the following questions:
(1) Do native plants and vegetation structure support native birds in residential yards?
What is the relationship between the bird community and socioeconomic factors, habitat
composition, and an urbanization gradient? How do these factors influence bird
distribution in residential landscapes? How do humans indirectly associate with native
diversity?
4
(2) How do birds perceive different residential landscape designs? Do birds that
specialize in urban areas exhibit any behavioral advantages that enable them to exploit
the urban environment?
(3) Can Homeowner Associations act as a vehicle for conservation initiatives to help
improve native biodiversity in the suburbs? What effective tools and programs can
conservation biologists use to instigate large-scale habitat improvement efforts?
In order to answer the first question, I use a multivariate approach to identify the
factors having the greatest influence on urban bird community patterns. I explore the
relationships among habitat features, the degree of urbanization and socioeconomic
factors with the bird community in residential yards. Socioeconomic factors have largely
been ignored in urban ecology studies, and thus have not addressed human wildlife
interactions within urban environments. To address the second question, I conduct
foraging experiments within different landscape designs in residential yards. I test how
birds perceive the habitat quality in residential yards by measuring foraging decisions at
artificial food patches. To answer the third question, I compare bird diversity between
neighborhoods with and without a Homeowner Association, link landscape maintenance
practices with the bird community, and recommend neighborhoods adapt a more
sustainable maintenance regime to help improve urban diversity at the neighborhood
scale. My dissertation research is one of the first to address the patterns and processes of
bird distribution in residential yards, and thus provides scientific information to support
the implementation of native landscaping designs. Yards that mimic the natural
environment being replaced provide mini refugia for some native birds, might be

5
disadvantageous for some pest species, and the Homeowner Association might provide a
mode of governance to improve habitat conditions for native birds.
6
CHAPTER 2
THE CONSERVATION VALUE OF RESIDENTIAL YARDS: LINKING BIRDS
AND PEOPLE
2.1 Introduction
As our world becomes increasingly urbanized, understanding how to conserve
biodiversity while creating landscapes compatible with humans is one of the century’s
greatest conservation challenges. It is estimated that by 2050 more than 80% of the world
population will live in urbanized areas (UNFPA 2007). A consequence of this mass
migration to and expansion of cities is the loss of wildlife habitat and the creation of new
plant communities (Whitney and Adams 1980), with profound implications for local and
regional biodiversity (Smith et al. 2005, Shochat et al. 2006, Burghardt et al. 2009).
Furthermore, there is a growing disconnect between people and nature with the loss of
biodiversity in urban and suburban landscapes (Turner et al. 2004, Miller 2005).
However, within urban areas, there is tremendous variation in both the composition and
configuration of the vegetation ranging from landscapes dominated by novel and foreign
vegetation with little or no shrubbery (Reichard and White 2001) to landscapes that
include key features of the natural wildlands being replaced, including a mixture of native
plants and complex, multi-layered vegetation structure. In light of the projected urban
growth, we need to fully understand if landscape designs that resemble the wildlands can
provide suitable habitat for native species, thus alleviating some of the detrimental
impacts of urbanization on native biodiversity. In addition, we need to more fully address
7
urban biodiversity in the context of human socioeconomic factors, and explore ways to
enhance human wildlife experiences.
Using an urban gradient approach, previous urban bird studies have characterized
the urban core as having lower diversity but higher densities compared with wildlands
(e.g. Emlen 1974, Beissinger & Osborne 1982, Mills et al. 1989, Blair 1996, Marzluff
2001, Donnely and Marzluff 2004, Chace and Walsh 2006, Croci et al. 2008). The
patterns emerging from these studies suggest that people living close to the urban core
will experience lower biodiversity. The amount and type of diversity leads to varying
levels of positive human-nature interactions (Fuller et al. 2007). For example, people
interacting in areas with high levels of native diversity tend to have a stronger connection
to a sense of place and sense of belonging (Horowitz et al. 2001). In Sheffield, UK,
researchers found a positive relationship between psychological well-being and species
richness in urban open spaces (Fuller et al. 2007). To improve their access to
biodiversity, people could move closer to rural areas characterized with higher diversity.
However, for many urbanites this is not a viable option. Alternatively, people can
improve local conditions for native biodiversity in private yards, gardens, and common
spaces (Turner et al. 2004, Troy et al. 2007).
Residential yards and gardens represent a large percentage of urban land cover
(Cannon 1999, Martin et al. 2003, Chamberlain et al. 2004), and if managed collectively,
homeowners could provide habitat connectivity throughout urban areas (Rudd et al.
2002). In the UK, residential yards contain twice as much land as nature reserves
(Chamberlain et al. 2004), and consist of 23% of the urban land area (Gaston et al. 2005).
In Tucson, AZ, as much as 50% of high density residential neighborhoods consisted of
8
pervious surfaces (non-pavement; Germaine et al. 1998), indicating the potential for
improving urban and suburban areas by providing vegetation for wildlife habitat. A few
studies have investigated vegetative diversity within residential yards, and they suggest
certain landscaping features improve native bird diversity. For example, in Hobart,
Australia, yards with native plants had significantly more native birds than yards
landscaped with exotic plants, though native birds did use gardens with some exotic trees
and shrubs (Daniels and Kirkpatrick 2006). Burghardt et al. (2009) paired twelve
residential yards in suburban Pennsylvania, USA (half landscaped with native plants and
the other half with exotic plants) to investigate urban food webs and found that yards
landscaped with native vegetation held the greatest numbers of butterfly larvae and
insectivorous birds. Understanding how the vegetation variation within residential yards
relates to urban bird distribution has important conservation consequences. If we can
identify particular landscape designs that support native bird communities while
discouraging synanthropic species, we may be able to improve the quality and quantity of
habitat for species that often decline with urbanization (Warren et al. 2008).
Although the traditional urban gradient approach provides valuable information
on urban bird patterns, many of these studies do not capture ecologically relevant
variation in human socioeconomic characteristics beyond population density nor do they
consider how the landscaped vegetation and socioeconomic factors can vary considerably
at similar levels of urbanization, and in areas classified as having the same land use
(Kinzig et al. 2005). Supplementing urban gradient studies with vegetation structure
measurements will inform us if certain landscape plantings can improve urban diversity
throughout the urban gradient. Supplementing gradient studies with socioeconomic
9
variables within the same position on an urbanization gradient will inform us if access to
biodiversity differs amongst socioeconomic groups. Empirical studies have found strong
correlations between income levels and plant diversity (e.g. Hope et al. 2003, Kinzig et
al. 2005, Smith et al. 2005, Kirkpatrick et al. 2007) and bird diversity (e.g. Kinzig et al.
2005, Melles 2005, Loss et al. 2009). Since humans are the primary driving force behind
alterations to urban habitat, it becomes vital to include human variables in urban
ecological studies (Adams 1935).
To my knowledge, this is the first study to address the impacts of human
manipulation of urban habitat by testing the efficacy of native landscaping in residential
yards for attracting native bird communities while also integrating urban gradient
measurements and socioeconomic factors into a multivariate analysis. My novel,
integrative and interdisciplinary approach allows me to highlight the relative importance
of features that often are ignored in urban bird ecology studies, and how these features
are related to one another. I have two main study objectives. First, I explore the strengths
of these environmental and socio-ecological associations with an urban bird community
in residential yards. Within this framework I test whether the variation in the existing bird
diversity accords with human residents’ perceptions of local bird diversity. Second, I
calculate the total variance of the bird community explained by landscape plantings,
urban gradient measurements and socioeconomic factors, and explore the relative
importance of how these three features contribute to the patterns explaining urban bird
communities.
10
2.2 Materials and Methods
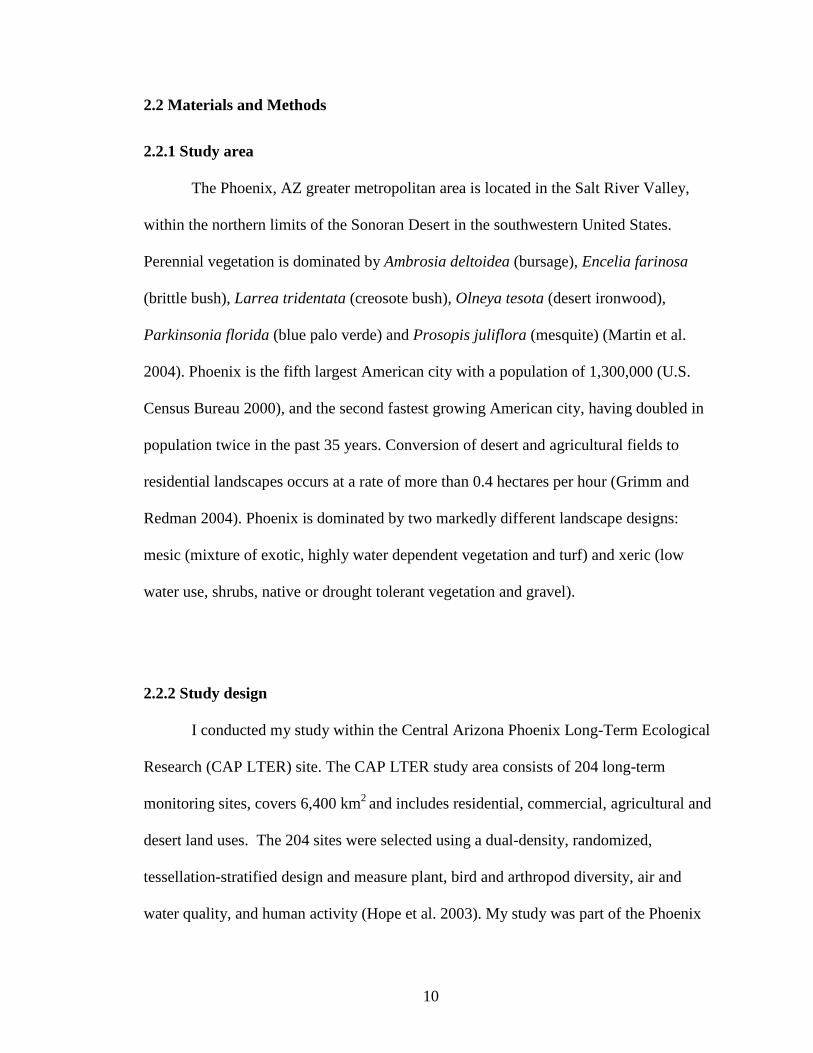
2.2.1 Study area
The Phoenix, AZ greater metropolitan area is located in the Salt River Valley,
within the northern limits of the Sonoran Desert in the southwestern United States.
Perennial vegetation is dominated by Ambrosia deltoidea (bursage), Encelia farinosa
(brittle bush), Larrea tridentata (creosote bush), Olneya tesota (desert ironwood),
Parkinsonia florida (blue palo verde) and Prosopis juliflora (mesquite) (Martin et al.
2004). Phoenix is the fifth largest American city with a population of 1,300,000 (U.S.
Census Bureau 2000), and the second fastest growing American city, having doubled in
population twice in the past 35 years. Conversion of desert and agricultural fields to
residential landscapes occurs at a rate of more than 0.4 hectares per hour (Grimm and
Redman 2004). Phoenix is dominated by two markedly different landscape designs:
mesic (mixture of exotic, highly water dependent vegetation and turf) and xeric (low
water use, shrubs, native or drought tolerant vegetation and gravel).
2.2.2 Study design
I conducted my study within the Central Arizona Phoenix Long-Term Ecological
Research (CAP LTER) site. The CAP LTER study area consists of 204 long-term
monitoring sites, covers 6,400 km2 and includes residential, commercial, agricultural and
desert land uses. The 204 sites were selected using a dual-density, randomized,
tessellation-stratified design and measure plant, bird and arthropod diversity, air and
water quality, and human activity (Hope et al. 2003). My study was part of the Phoenix
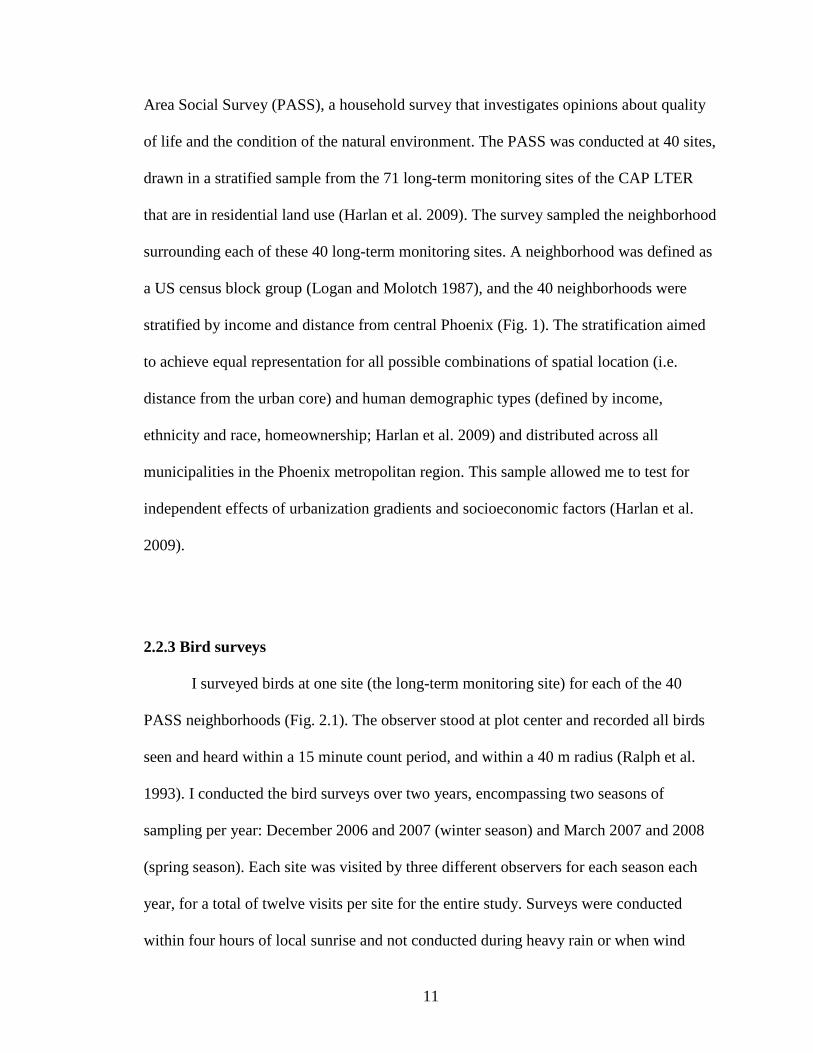
11
Area Social Survey (PASS), a household survey that investigates opinions about quality
of life and the condition of the natural environment. The PASS was conducted at 40 sites,
drawn in a stratified sample from the 71 long-term monitoring sites of the CAP LTER
that are in residential land use (Harlan et al. 2009). The survey sampled the neighborhood
surrounding each of these 40 long-term monitoring sites. A neighborhood was defined as
a US census block group (Logan and Molotch 1987), and the 40 neighborhoods were
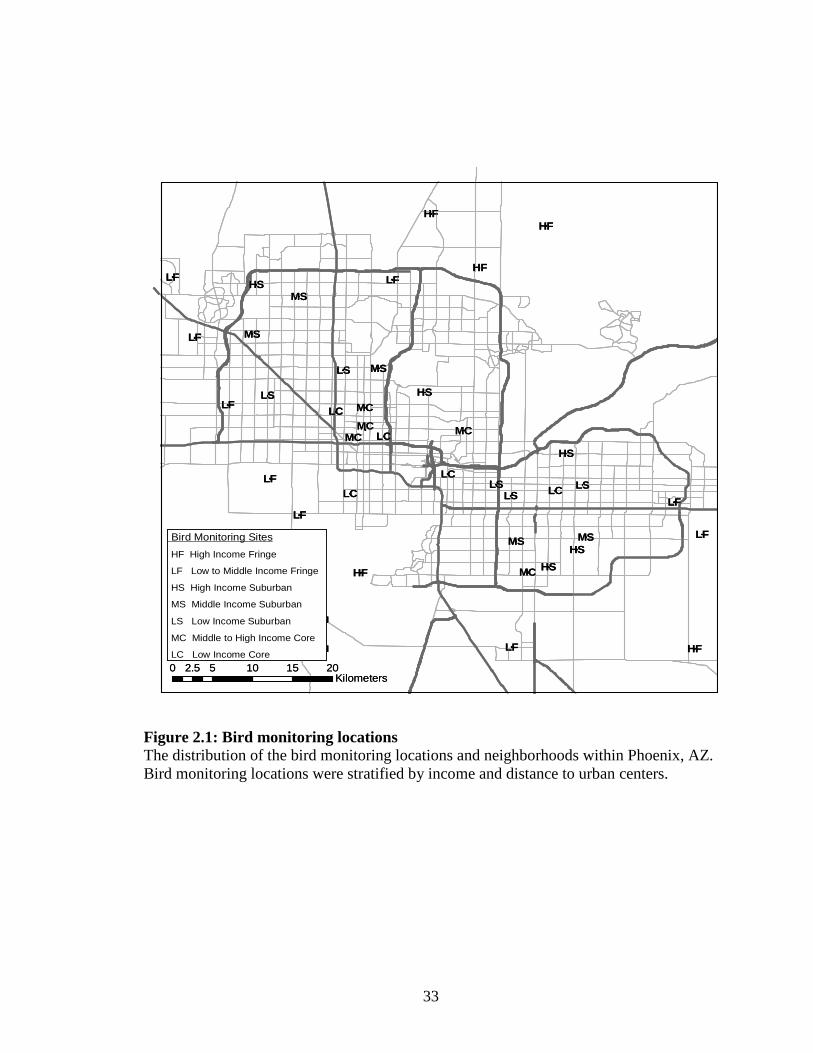
stratified by income and distance from central Phoenix (Fig. 1). The stratification aimed
to achieve equal representation for all possible combinations of spatial location (i.e.
distance from the urban core) and human demographic types (defined by income,
ethnicity and race, homeownership; Harlan et al. 2009) and distributed across all
municipalities in the Phoenix metropolitan region. This sample allowed me to test for
independent effects of urbanization gradients and socioeconomic factors (Harlan et al.
2009).
2.2.3 Bird surveys
I surveyed birds at one site (the long-term monitoring site) for each of the 40
PASS neighborhoods (Fig. 2.1). The observer stood at plot center and recorded all birds
seen and heard within a 15 minute count period, and within a 40 m radius (Ralph et al.
1993). I conducted the bird surveys over two years, encompassing two seasons of
sampling per year: December 2006 and 2007 (winter season) and March 2007 and 2008
(spring season). Each site was visited by three different observers for each season each
year, for a total of twelve visits per site for the entire study. Surveys were conducted
within four hours of local sunrise and not conducted during heavy rain or when wind
12
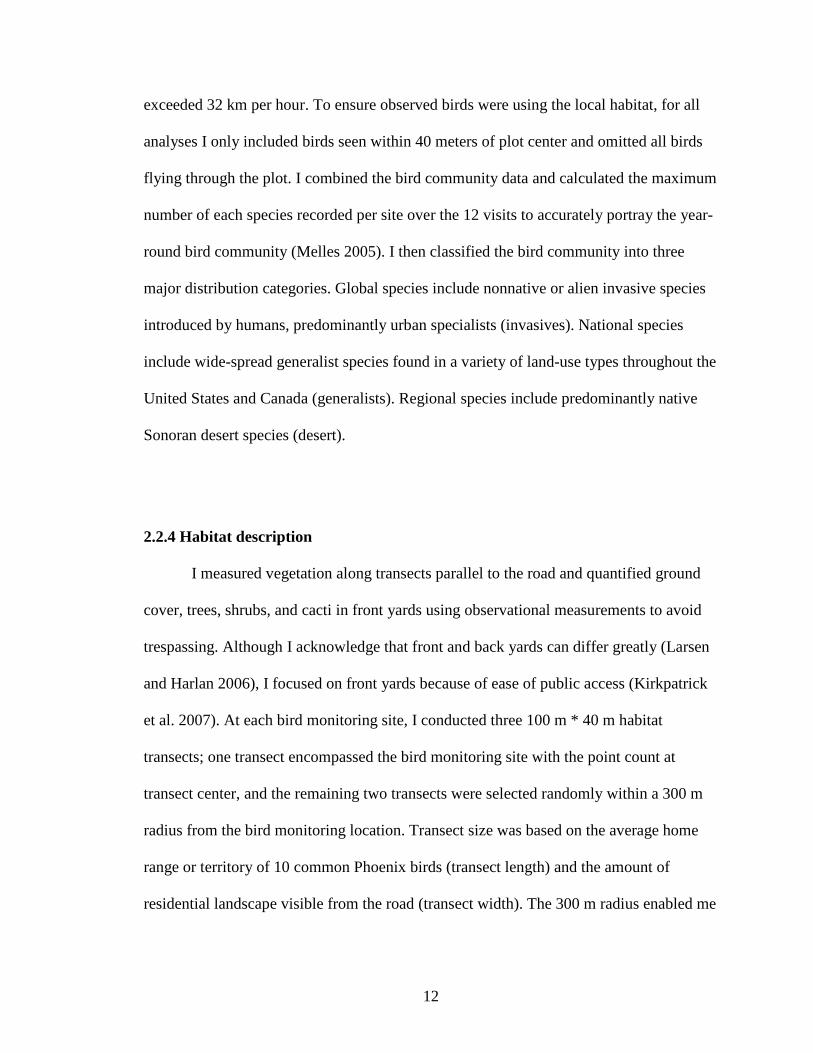
exceeded 32 km per hour. To ensure observed birds were using the local habitat, for all
analyses I only included birds seen within 40 meters of plot center and omitted all birds
flying through the plot. I combined the bird community data and calculated the maximum
number of each species recorded per site over the 12 visits to accurately portray the year-
round bird community (Melles 2005). I then classified the bird community into three
major distribution categories. Global species include nonnative or alien invasive species
introduced by humans, predominantly urban specialists (invasives). National species
include wide-spread generalist species found in a variety of land-use types throughout the
United States and Canada (generalists). Regional species include predominantly native
Sonoran desert species (desert).
2.2.4 Habitat description
I measured vegetation along transects parallel to the road and quantified ground
cover, trees, shrubs, and cacti in front yards using observational measurements to avoid
trespassing. Although I acknowledge that front and back yards can differ greatly (Larsen
and Harlan 2006), I focused on front yards because of ease of public access (Kirkpatrick
et al. 2007). At each bird monitoring site, I conducted three 100 m * 40 m habitat
transects; one transect encompassed the bird monitoring site with the point count at
transect center, and the remaining two transects were selected randomly within a 300 m
radius from the bird monitoring location. Transect size was based on the average home
range or territory of 10 common Phoenix birds (transect length) and the amount of
residential landscape visible from the road (transect width). The 300 m radius enabled me
13
to determine the similarity of the vegetation at a scale potentially used for the birds
documented at the bird monitoring site (Germaine et al. 1998).
I measured key vegetation features generally thought to be important for urban
desert birds. In particular, these features are representative of the characteristics of the
mesic and xeric landscapes in Phoenix, AZ (Martin et al. 2003, Walker et al. 2009). For
each transect I calculated the percent of the yards with crushed gravel as a ground cover
(xeric) or turf ground cover (mesic). I classified the trees using two methods. First, I
categorized the trees into five different leaf structures: conifers, broad-leaf evergreen,
broad-leaf deciduous, monocots, and thin-leaf evergreen (Emlen 1974, Germaine et al.
1998). Thin-leaf evergreen trees are predominantly native or drought tolerant trees typical
of xeric designs, while trees in the other categories are generally water-dependent exotic
trees typical of mesic designs. I then binned the trees into three height classes (0 – 10 m,
10 – 20 m, > 20 m). Native and drought tolerant trees are predominantly < 10 m while the
taller trees (e.g. monocots and conifers) tend to be exotic. I counted the total number of
shrubs in two height classes (< 1 m and > 1 m) and cacti taller than 1.5 m. The monocots,
the majority of the broad-leafed evergreens, and the cacti are fruit-bearing species, and
potentially provide important food sources for both desert and synanthropic birds. Since
there were no significant differences between the three transects (Oneway ANOVA,
blocking by site), I pooled data across transects for each site and calculated mean
abundance for each measured variable.
14
2.2.5 Socioeconomic variables
I used the census block group as the unit to describe the neighborhoods. The
demographic characteristics within a census block group are assumed to be relatively
homogenous (Jenerette et al. 2007) and have a population between 600 and 3,000 people
with a target size of 1,500 (U.S. Census Bureau 2000). To represent ethnicity,
socioeconomic status, and lifestyle stages of the residents from each neighborhood
(Grove et al. 2006), I included the following socioeconomic variables from the 2000 U.S.
Census: percent Hispanic, median household income, highest education degree obtained,
percent owner occupation, and percent of residents age 0 - 18, 19 - 64, and 65 and older.
2.2.6 Urban gradient variables
Urban gradient measurements are surrogates for fragmentation; degree of and
time since urban development. I included urban gradient features I hypothesized to
influence bird diversity (Kinzig et al. 2005). I measured the amount of impervious
surface, vegetation, and soil around each bird monitoring location, the distance from the
bird monitoring location to desert tracts, and the age of the neighborhood, along an urban
gradient. I used remotely sensed measures of impervious surface, vegetation, and soil
obtained from Quickbird (DigitalGlobe, Longmont, CO) images using Imagine Software
(Imagine Software Inc., NY, NY). The image resolution was 28.5 m. Estimates of percent
impervious surface, percent bare soil, and percent vegetation around each bird monitoring
station were estimated as the mean percent cover per cell for a 2 km x 2 km window (71
15
* 71 pixels), roughly encompassing a 1 km radius around the bird monitoring center
point. I measured distance to desert tracts using ArcMap 9.2 geographic information
system (Environmental Systems Research Institute, Redlands, California). To classify
desert land-use, I used a Landsat Enhanced Thematic Mapper land classification raster
that used ERDAS Imagine Software (ERDAS Inc., Atlanta, GA) for analyses. This Land
Use Land Cover classification model has 12 land-use categories, overall Kappa statistic
of 0.81, and an overall accuracy of 83%. At each bird monitoring center point, I
calculated the distance to the nearest desert tract of at least 3.2 ha. The size of 3.2 ha
reflects the average territory of the desert birds found within my study site and is similar
to the continuous desert tracts used by Germaine et al. (1998) in Tucson, AZ. In addition,
I calculated desert tracts of 42 ha following Donnelly and Marzluff’s (2004) study
showing that forest sizes greater than 42 ha in Seattle, Washington retained most of the
native forest specialist birds. Results from my statistical analyses using the two methods
were similar. I used the median age of housing structures within each neighborhood from
the 2000 US Census, which is a surrogate for time since the initial urban development.
2.2.7 Phoenix Area Social Survey (PASS)
The Institute for Social Science Research at Arizona State University
administered the PASS from April through September 2006. The survey team contacted
40 households within each of the 40 PASS neighborhoods and continued contacting these
households until 20 households responded and agreed to participate in the survey. The
response rate was 51% and the study included 808 respondents. Surveys were taken on
16
the Internet, phone and in person interviews. Of the 111 questions in the survey, 14
addressed the level of satisfaction a resident felt regarding the quality of their
neighborhood. For my study, I focused on two of the survey questions on biodiversity
issues. Survey respondents were asked to rate the variety of birds in their existing
neighborhood (satisfaction with bird variety in the neighborhood) and the variety of birds
in their ideal neighborhood (desire for bird variety in the neighborhood). Ratings ranged
from highly satisfied / desirable to highly unsatisfied / undesirable (respectively). I
summarized ratings for each neighborhood by calculating the percent of respondents who
rated their actual and ideal bird variety as either “highly” or “moderately” satisfactory or
desirable (respectively).
2.2.8 Statistical analysis
For the analyses, I omitted one neighborhood / bird monitoring site because only a
small percentage of the area in that neighborhood was residential. I assessed the
relationships between the three subsets of environmental variables (habitat,
socioeconomic and urban gradient) and the bird community within each neighborhood
using Redundancy Analysis (RDA). This multivariate ordination relates the bird
community data to the environmental data, and depicts the patterns of variation within the
bird community that can be explained by the environmental constraints (ter Braak 1986).
I used RDA rather than Canonical Correspondence Analysis based on a preliminary
assessment of the data: bird abundances demonstrated a linear response rather than
unimodal response to the environmental gradients (gradient length < 2 standard
17
deviations, ter Braak 1986). I reduced the number of bird species in the analysis by only
including species recorded at 10% or more of the monitoring locations. Multivariate
analyses benefit from deleting rare species since species with few records are often not
accurately placed in ecological space (McCune and Grace 2002), but I included all
species for analyses involving total species richness (see below). Since RDAs depend on
redundancy within the dataset to summarize patterns in the community in the least
number of dimensions (McGarigal et al. 2000), I conducted a global assessment of
redundancy and redundancy for individual species within the data. I plotted the rank
order distribution of pairwise species’ correlations, and individual species against the null
distribution obtained by randomly permuting the data. I omitted outliers to be sure a
single observation did not have disproportional leverage on the results. These outliers
consisted of extremely large flocks of a particular species (e.g., Mourning Dove),
elevating the maximum count recorded during one of the twelve visits at a site. I log
transformed and then standardized the species data using a row relativization CHORD /
NORMALIZE method to display the relative abundance profile for each site (Legendre
and Gallagher 2001). This relativization preserves the Euclidean distances embedded in
an RDA (Legendre and Gallagher 2001). The CHORD distance performed well when
compared with other distance metrics. For the habitat, urban gradient and socioeconomic
matrices I checked for multicollinearity among the variables. I computed a partial RDA
for paired variables with correlations > 0.7 and retained the variable with the largest
marginal effect based on the constrained eigenvalue (McGarigal et al. 2000). I list the
final variable selection in Table 2.1.
18
For the three RDAs (habitat, urban gradient and socioeconomics), I calculated the
proportion of the total inertia (or variance) of the species data explained by the
environmental constraints. I tested the significance of the ordinations using Monte Carlo
global permutation tests of significance (200 permutations) on the whole model, each
axis and each independent variable (Hope 1968). I calculated the Standardized Canonical
Coefficients. This calculation defines the variable’s weight based on the linear
combination that was used to constrain the ordination (McGarigal et al. 2000). I also
calculated the interset correlation coefficients. These represent the correlations between
species-derived sample scores and the independent variables, i.e. species scores in
environmental space (McGarigal et al. 2000). Then I calculated the goodness of fit for
individual species to ask how effective the ordination was at representing each species.
This diagnostic feature reports the proportion of variance explained by the canonical axes
for each species. I generated a triplot for each RDA to graphically display the bird
community patterns and how they relate to the independent variables. To simplify the
display, only bird species with a goodness of fit greater than 0.1 are shown in the triplot.
In addition to separate RDAs for each subset of environmental variables, I also
decomposed the variance of the bird community that could be explained independently
and jointly by each of the variable subsets using Variance Partitioning. This allowed me
to examine the total variance explained by all three variable subsets, the variance that is
unique to the socioeconomic variables, and the variance that is shared among the
variables while controlling for their confoundedness (Borcard et al. 1992).
To test whether the native vegetation variables (number of shrubs and number of
thin-leaf evergreen trees) predicted total native bird diversity at a site, I conducted linear
19
regression analyses. Using a linear regression, I also tested whether residents’ satisfaction
with diversity or desire for diversity were predicted by actual native species richness.
Since satisfaction could be influenced by an overall increased environmental or bird
knowledge (Boxall and McFarlane 1995), I tested the importance of covariates of the
native bird diversity richness by including income and education level from the US
Census data in a multiple linear regression model. I checked for normality of the data and
transformed when necessary. All analyses were conducted using R (R Development Core
Team 2008) with the vegan package (Oksanen et al. 2009).
2.3 Results
I detected 64 bird species during the study. Species richness of sites ranged from
12 to 34 with an average of 19 species (± 4.5 species), and total bird abundance at sites
ranged from 31 - 145 (mean = 72.3 ± 27.99 SD). I recorded six invasive species, 37
generalist species, and 21 desert species (Table 2.1).
2.3.1 Habitat and landscape planting variables
Transects contained 1 - 17 yards each (mean = 7.9, SD = 2.67). Vegetation
composition differed between the two dominant landscape designs (mesic and xeric;
Table 2.2). Based on the 100 m transects of residential streets, xeric neighborhoods had
on average three times as many shrubs as mesic neighborhoods (27.6 shrubs in xeric
compared with 9.8 shrubs in mesic). Tree density and composition also differed;
20
mesquite (Prosopis sp), palo verde (Parkinsonia sp) and other desert trees dominated
xeric transects with an average of 8.9 trees compared with 1.9 trees in mesic. Conifers
(e.g. Afghan pine Pinus eldarica), monocots, (e.g. Mexican fan palms Washingtonia
robusta) and citrus trees dominated mesic transects (5.9, 6.9 and 6.7 trees per mesic
transect respectively compared with 2, 5.8 and 4.5 in xeric transects). Transects were
relatively homogenous. In transects that had at least 50% of the yards classified as a
mesic ground cover (turf), 72% of the yards were mesic. In transects that had at least 50%
of the yards classified as a xeric ground cover (crushed gravel), 80% of the yards were
xeric.
2.3.2 The ordinations
The bird community in Phoenix was disproportionately influenced by the three
variable subsets. The habitat RDA explained 28.8% of the variation (constrained inertia),
the urban gradient RDA explained 16.1 % of the variation, and the socioeconomic RDA
explained 22.1% of the variation. All three ordinations were significant: the proportion of
variation in the bird community as explained by the habitat, urban gradient, and
socioeconomic variables was greater than expected by chance (MonteCarlo Permutation
Test / ANOVA, F = 2.146, 32, P < 0.005, F = 2.243, 35, P < 0.005, and F = 1.875, 33, P =
0.01, respectively). For each of the three ordinations, only the first axis was significant
(ANOVA, F = 5.58, P < 0.005, F = 4.66, P < 0.005, and F = 5.58, P < 0.005,
respectively) and therefore, I only interpret the first axes on all three triplots (McCune
and Grace 2002). Based on the Variance Partitioning Analysis, collectively, the three
variable subsets explained 48% of the variation in the bird abundance data, with each
21
subset having similar explanatory proportions as the RDA. The shared variation between
all three subsets was 13.2%, indicating that each subset provided unique information on
the factors relating with the bird community patterns. The habitat variables shared about
7% of the variation with urban gradient measurements and the socioeconomic variables.
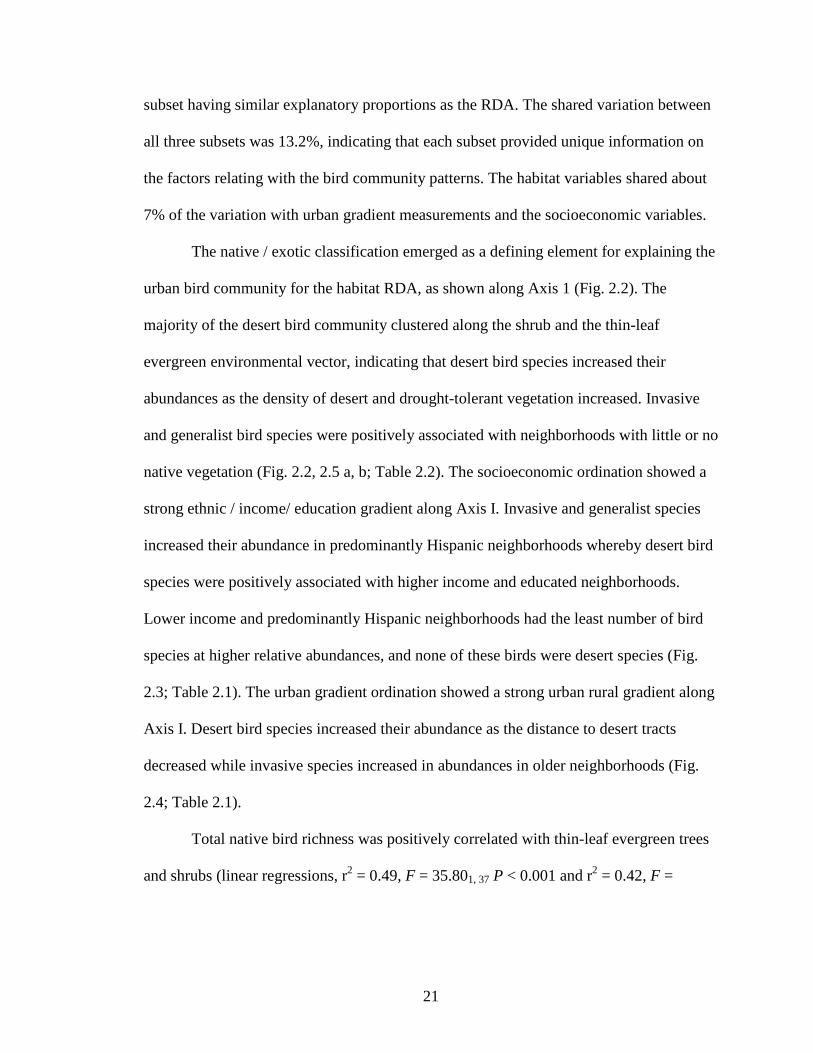
The native / exotic classification emerged as a defining element for explaining the
urban bird community for the habitat RDA, as shown along Axis 1 (Fig. 2.2). The
majority of the desert bird community clustered along the shrub and the thin-leaf
evergreen environmental vector, indicating that desert bird species increased their
abundances as the density of desert and drought-tolerant vegetation increased. Invasive
and generalist bird species were positively associated with neighborhoods with little or no
native vegetation (Fig. 2.2, 2.5 a, b; Table 2.2). The socioeconomic ordination showed a
strong ethnic / income/ education gradient along Axis I. Invasive and generalist species
increased their abundance in predominantly Hispanic neighborhoods whereby desert bird
species were positively associated with higher income and educated neighborhoods.
Lower income and predominantly Hispanic neighborhoods had the least number of bird
species at higher relative abundances, and none of these birds were desert species (Fig.
2.3; Table 2.1). The urban gradient ordination showed a strong urban rural gradient along
Axis I. Desert bird species increased their abundance as the distance to desert tracts
decreased while invasive species increased in abundances in older neighborhoods (Fig.
2.4; Table 2.1).
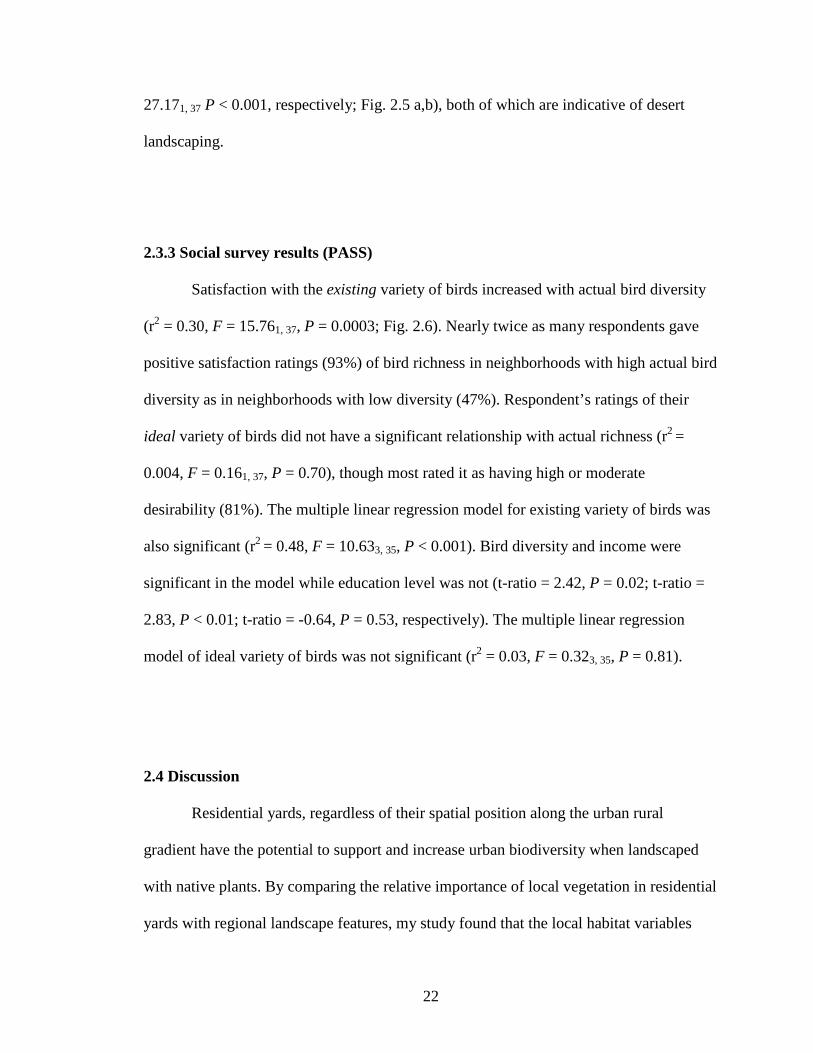
Total native bird richness was positively correlated with thin-leaf evergreen trees
and shrubs (linear regressions, r2 = 0.49, F = 35.801, 37 P < 0.001 and r2 = 0.42, F =
22
27.171, 37 P < 0.001, respectively; Fig. 2.5 a,b), both of which are indicative of desert
landscaping.
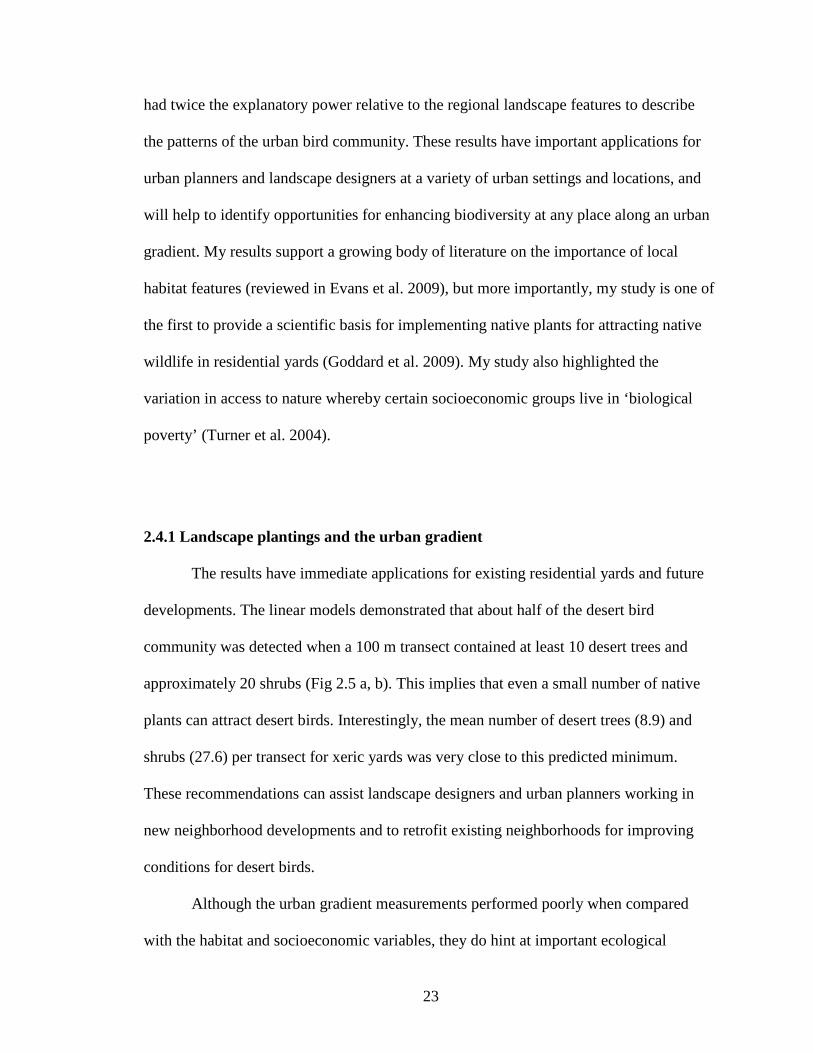
2.3.3 Social survey results (PASS)
Satisfaction with the existing variety of birds increased with actual bird diversity
(r2 = 0.30, F = 15.761, 37, P = 0.0003; Fig. 2.6). Nearly twice as many respondents gave
positive satisfaction ratings (93%) of bird richness in neighborhoods with high actual bird
diversity as in neighborhoods with low diversity (47%). Respondent’s ratings of their
ideal variety of birds did not have a significant relationship with actual richness (r2 =
0.004, F = 0.161, 37, P = 0.70), though most rated it as having high or moderate
desirability (81%). The multiple linear regression model for existing variety of birds was
also significant (r2 = 0.48, F = 10.633, 35, P < 0.001). Bird diversity and income were
significant in the model while education level was not (t-ratio = 2.42, P = 0.02; t-ratio =
2.83, P < 0.01; t-ratio = -0.64, P = 0.53, respectively). The multiple linear regression
model of ideal variety of birds was not significant (r2 = 0.03, F = 0.323, 35, P = 0.81).
2.4 Discussion
Residential yards, regardless of their spatial position along the urban rural
gradient have the potential to support and increase urban biodiversity when landscaped
with native plants. By comparing the relative importance of local vegetation in residential
yards with regional landscape features, my study found that the local habitat variables
23
had twice the explanatory power relative to the regional landscape features to describe
the patterns of the urban bird community. These results have important applications for
urban planners and landscape designers at a variety of urban settings and locations, and
will help to identify opportunities for enhancing biodiversity at any place along an urban
gradient. My results support a growing body of literature on the importance of local
habitat features (reviewed in Evans et al. 2009), but more importantly, my study is one of
the first to provide a scientific basis for implementing native plants for attracting native
wildlife in residential yards (Goddard et al. 2009). My study also highlighted the
variation in access to nature whereby certain socioeconomic groups live in ‘biological
poverty’ (Turner et al. 2004).
2.4.1 Landscape plantings and the urban gradient
The results have immediate applications for existing residential yards and future
developments. The linear models demonstrated that about half of the desert bird
community was detected when a 100 m transect contained at least 10 desert trees and
approximately 20 shrubs (Fig 2.5 a, b). This implies that even a small number of native
plants can attract desert birds. Interestingly, the mean number of desert trees (8.9) and
shrubs (27.6) per transect for xeric yards was very close to this predicted minimum.
These recommendations can assist landscape designers and urban planners working in
new neighborhood developments and to retrofit existing neighborhoods for improving
conditions for desert birds.
Although the urban gradient measurements performed poorly when compared
with the habitat and socioeconomic variables, they do hint at important ecological
24
features necessary for attracting desert birds to arid cities. I found a mean distance of 3.8
km between the neighborhoods (point count location) and desert patches. This suggests
that pockets of desert habitat exist throughout Phoenix and are not restricted to areas
closer to the edge of the city. These desert patches might serve as population sources,
allowing the desert bird community to disperse throughout Phoenix. However, this study
only addressed distribution patterns and abundances, and did not test for survival,
reproductive success, or other fitness measurements. The urban gradient measurements
describe some of the physical components of the landscape, and address factors that
might hinder or assist with the colonization of desert birds within urban areas. By
exploring the vegetation variation within the gradient, I found that the inclusion of native
yard plantings might explain why native birds persist throughout the city.
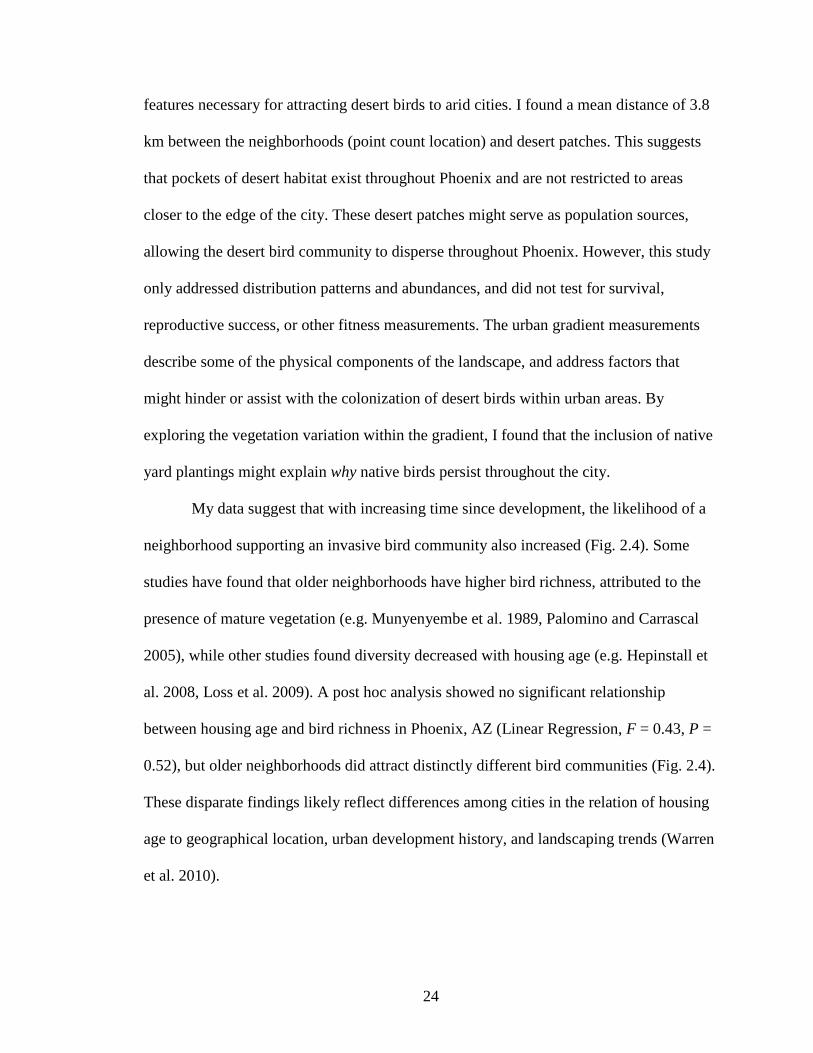
My data suggest that with increasing time since development, the likelihood of a
neighborhood supporting an invasive bird community also increased (Fig. 2.4). Some
studies have found that older neighborhoods have higher bird richness, attributed to the
presence of mature vegetation (e.g. Munyenyembe et al. 1989, Palomino and Carrascal
2005), while other studies found diversity decreased with housing age (e.g. Hepinstall et
al. 2008, Loss et al. 2009). A post hoc analysis showed no significant relationship
between housing age and bird richness in Phoenix, AZ (Linear Regression, F = 0.43, P =
0.52), but older neighborhoods did attract distinctly different bird communities (Fig. 2.4).
These disparate findings likely reflect differences among cities in the relation of housing
age to geographical location, urban development history, and landscaping trends (Warren
et al. 2010).
25
In Phoenix, changing landscaping practices over time may help explain the
complex relationship of housing age to the bird communities. Before air conditioners,
Phoenicians mitigated the extreme summer temperatures with mesic landscaping,
characterized by large shade trees, turf, and flood irrigation. This landscape design
created a cooling effect and greatly reduced temperatures in residential areas (Folkner
1958). Once air conditioners became a common household commodity, the popularity of
xeric landscaping designs grew, and urbanites embraced a more desert-like landscape
with drought-tolerant trees, cacti and shrubs, and replaced the lawn with crushed gravel
(McPherson and Haip 1989, Martin 2001, Larsen and Harlan 2006). Thus, older
neighborhoods are more likely to be mesicscaped than new ones, conditions likely to
support a greater abundance of invasive bird species (Fig. 2.4).
2.4.2. Socioeconomics and bird communities
By including socioeconomic variables, I explored the patterns of human wildlife
interactions, specifically addressing how different socioeconomic groups indirectly
associate with an urban bird community. The socioeconomic RDA revealed strong
environmental inequities; predominantly Hispanic and lower income neighborhoods had
few to no desert birds (Fig. 2.3). These results are in accord with previous findings from
Phoenix, AZ and Vancouver, British Columbia where plant and bird diversity increased
with socioeconomic status (Hope et al. 2003, Kinzig et al. 2005, Melles 2005, Walker et
al. 2009). However, they differ from a study in Chicago, which found an inverse
relationship between income and bird richness (Loss et al. 2009). My study differs from
these previous studies in its exclusive focus on residential yards, a difference which may
26
account in part for the differences between patterns found in Phoenix and those in
Chicago.
Additional mechanisms must be invoked to account for the unique information
provided by the socioeconomic variables and their association with the bird communities.
Some possible factors include bird feeding and urban noise. The presence of bird feeders
have strong influences on residential yard bird communities and have been linked to
socioeconomic factors (Lepczyck 2004, Fuller et al. 2008, Lepczyck et al. in press).
Americans spend about $30 billion per year on seed and feeders (US Department of the
Interior 2002). However, Lepczyck et al. (in press) did not find a significant relationship
between income and propensity to feed birds in a survey comparing residents in southeast
Michigan and Phoenix, AZ. They did, however, find a relationship between the types of
food provided and income level in Phoenix. Higher income residents were more likely to
have thistle and hummingbird feeders, perhaps due to the higher cost of these food
sources. By contrast, the lower income neighborhoods might be limited to one or two
commercial food sources and these feeding stations might provide resources for pest and
exotic species (Daniels & Kirkpatrick 2006). This specialization of certain feeder foods
and the economic costs might help explain higher levels of bird diversity in higher
income neighborhoods. Future studies that test how different bird feeder foods interrelate
with the bird community will help disentangle these relationships. Urban and suburban
areas are also characterized by having elevated noise levels; however, there is a great
amount of variation within these areas (Warren et al. 2006). For example, areas closer to
urban center and in lower income neighborhoods tend to have higher noise levels
(Warren et al. 2006). The elevated noise might be a limiting factor (i.e. the inability to
27
communicate with conspecifics) for birds with lower frequencies or the inability to shift
frequencies (Slabbekoorn and Peet 2003), though I did not test for this biological trait.
My study identified which socioeconomic groups were experiencing sub-par
levels of biodiversity and also identified some specific habitat features for inclusion in
neighborhood improvement activities. Planting more native vegetation could help
improve native biodiversity in Hispanic and lower income neighborhoods. When
incorporating planting efforts in different socioeconomic neighborhoods, we must
account for the variation within the human population. Landscaping choices are often
influenced by socioeconomic and cultural factors such as landowner’s ethnicity,
education and income (Kaplan and Talbot 1988, Kent 1993, Larsen and Harlan 2006)
rather than biophysical determinants of soil, elevation and climate (Whitney and Adams
1980, Walker et al. 2009). These differences help explain the interplay between
socioeconomic factors and the vegetation in residential yards. For example, residents in
higher income neighborhoods might actively landscape according to their preferences and
not limited by economic constraints (Larsen and Harlan 2006). Some studies have
suggested that residents in lower income neighborhoods prefer a simpler, low
maintenance landscape, with fewer trees and shrubs (Seddon 1997, Kirkpatrick et al.
2007). These landscaping decisions yield a mosaic of different landscape designs across
the city, and help explain some of the variation in urban bird communities. Furthermore,
the lower income and ethnic neighborhoods have larger percentages of renters. Because
of the ephemeral nature of renters, they are less likely to invest in long-term landscape
improvements at their current residence. These socioeconomic landscaping patterns
represent a challenge for landscape planners whose goal is to incorporate native plantings
28
in residential neighborhoods. Wildlife agencies and conservation organizations need to
identify creative ways to educate urban residents on the importance of their landscaping
decisions while being sensitive to cultural traditions and economic conditions.
2.4.3 Residents’ perception of diversity
The strength of the relationship between bird species composition and
socioeconomic variables raises another question: do the residents in these neighborhoods
notice the differences in biodiversity? Addressing these perceptions of biodiversity
allowed us to investigate human wildlife interactions at a finer scale. Results from the
PASS study suggested that people noticed varying levels of bird diversity in their yards,
as indicated by how their varying levels of satisfaction correlated with actual diversity.
As a caveat to these results, the level of satisfaction with bird diversity may reflect the
resident’s overall satisfaction of their neighborhood. All the neighborhood satisfaction
variables (e.g. positive interactions with neighbors, housing value, and proximity to
nature) in the PASS study were positively correlated with each other (S. Harlan, personal
communication), and with income level. Even so, the results suggest neighborhoods that
appeal to people also support higher biodiversity.
2.4.4 Implications
The discrepancies in biodiversity amongst neighborhoods are a serious concern
for urban planners and conservation scientists because they could lead to an “extinction
of experience” (Pyle 1978). As the biota in predominantly lower income, and (in my
29
study) Hispanic neighborhoods become increasingly homogenized (McKinney 2006),
urban dwellers may lose their sense of wonder and amazement for nature, primarily from
lack of opportunities with native species in their yards (Pyle 1978, Turner et al. 2004,
Miller 2005).
For many urbanites, their primary interactions with nature occur in their front and
back yards (DeStefano and DeGraaf 2003). Providing opportunities for positive
experiences with the natural world leads to an increased sensitivity to ecological issues,
an ability to incorporate sound ecological initiatives into public policy, and ultimately the
ability and desire to conserve urban biodiversity (Hough 1995, Savard et al. 2000,
Rosenzweig 2003, Turner et al. 2004, Miller 2005). Attention to socioeconomic patterns
as well as local habitat features, urbanization intensity, and human environmental
preferences in describing studies and future plans is essential to more fully grasp the
complexity of human dominated ecosystems.
30
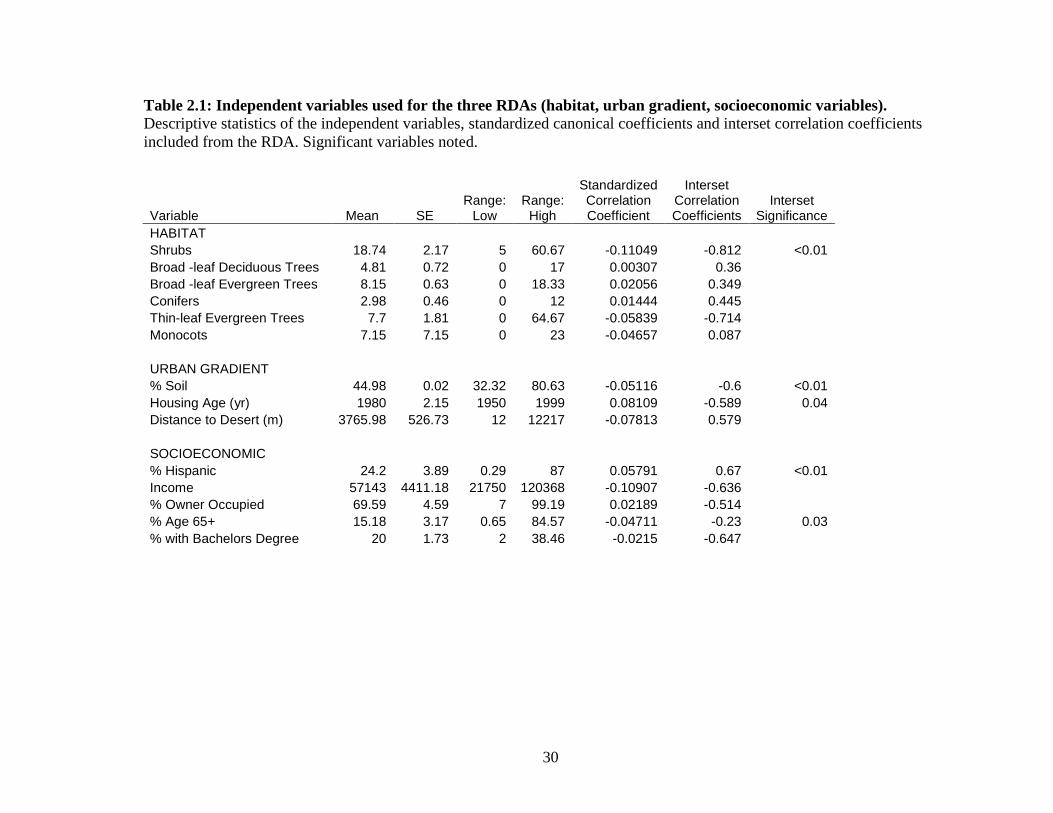
Table 2.1: Independent variables used for the three RDAs (habitat, urban gradient, socioeconomic variables). Descriptive statistics of the independent variables, standardized canonical coefficients and interset correlation coefficients included from the RDA. Significant variables noted.
Variable Mean SE Range:
Low Range:
High
Standardized Correlation Coefficient
Interset Correlation Coefficients
Interset Significance
HABITAT Shrubs 18.74 2.17 5 60.67 -0.11049 -0.812 <0.01 Broad -leaf Deciduous Trees 4.81 0.72 0 17 0.00307 0.36 Broad -leaf Evergreen Trees 8.15 0.63 0 18.33 0.02056 0.349 Conifers 2.98 0.46 0 12 0.01444 0.445 Thin-leaf Evergreen Trees 7.7 1.81 0 64.67 -0.05839 -0.714 Monocots 7.15 7.15 0 23 -0.04657 0.087 URBAN GRADIENT % Soil 44.98 0.02 32.32 80.63 -0.05116 -0.6 <0.01 Housing Age (yr) 1980 2.15 1950 1999 0.08109 -0.589 0.04 Distance to Desert (m) 3765.98 526.73 12 12217 -0.07813 0.579 SOCIOECONOMIC % Hispanic 24.2 3.89 0.29 87 0.05791 0.67 <0.01 Income 57143 4411.18 21750 120368 -0.10907 -0.636 % Owner Occupied 69.59 4.59 7 99.19 0.02189 -0.514 % Age 65+ 15.18 3.17 0.65 84.57 -0.04711 -0.23 0.03 % with Bachelors Degree 20 1.73 2 38.46 -0.0215 -0.647

31
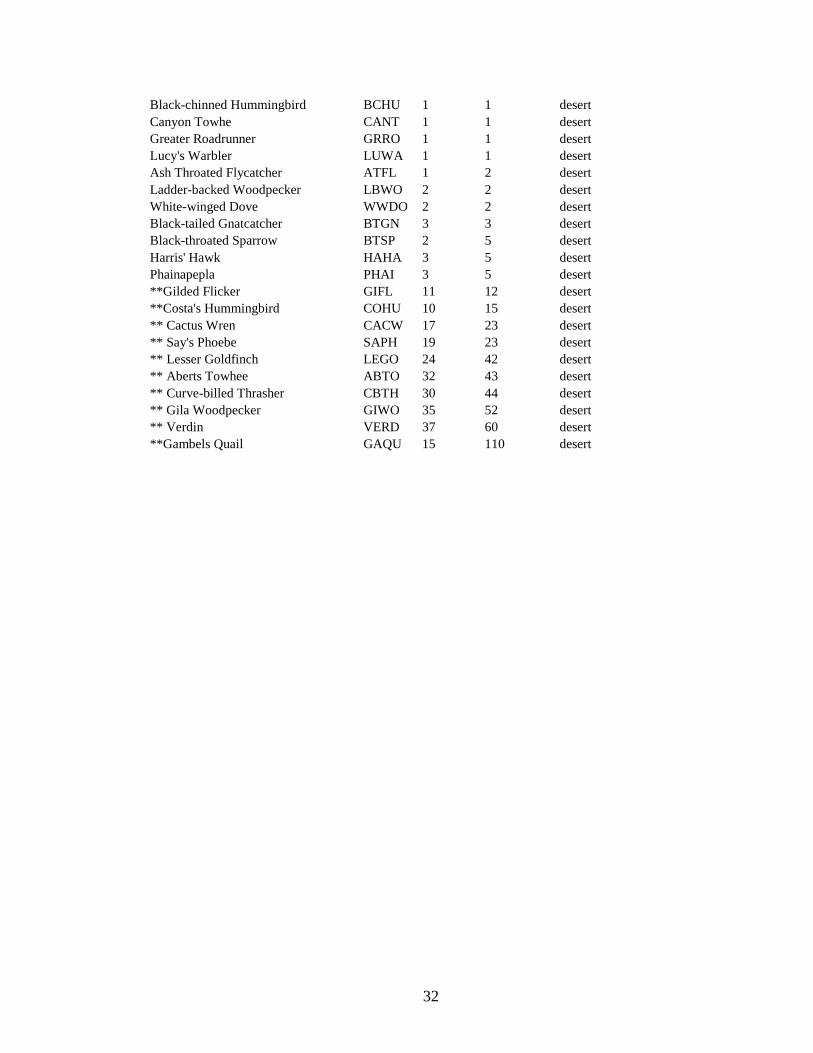
Table 2.2: Bird list Relative abundance (no. individuals / 40m radius) of all bird species in 39 Phoenix neighborhoods (n = 12 visits per site). Asterisks indicate species included in the RDA and variance partitioning analyses.
COMMON NAME Species Code
Number of Sites Abundance
Distribution Guild
Peach-faced Lovebird PFLB 2 3 invasive **Eurasian Collared Dove ECDO 12 29 invasive ** Inca Dove INDO 27 102 invasive ** European Starling EUST 28 218 invasive ** House Sparrow HOSP 39 292 invasive ** Rock Pigeon RODO 26 458 invasive Bewick's Wren BEWR 1 1 generalist Bronzed Cowbird BROC 1 1 generalist Common Ground Dove COGD 1 1 generalist Common Raven CORA 1 1 generalist Cooper's Hawk COHA 1 1 generalist Myrtle Warbler MYWA 1 1 generalist American Robin AMRO 1 2 generalist Lark Sparrow LASP 1 2 generalist Lincoln Sparrow LISP 1 2 generalist Vesper Sparrow VESP 1 2 generalist Northern Harrier NOHA 2 2 generalist Turkey Vulture TUVU 2 2 generalist Blue-grey Gnatcatcher BGGN 2 3 generalist Red-breasted Nuthatch RBNU 3 3 generalist Sharp-shinned Hawk SSHA 3 3 generalist **Northern Flicker NOFL 7 3 generalist Red-tailed Hawk RTHA 3 4 generalist **Northern Cardinal NOCA 4 5 generalist **American Kestrel AMKE 6 6 generalist **Rock Wren ROWR 6 6 generalist Brewer's Sparrow BRSP 3 9 generalist **Killdeer KILL 6 9 generalist **Brown-headed Cowbird BHCO 4 10 generalist **Ruby-crowned Kinglet RCKI 11 11 generalist Horned Lark HOLA 2 15 generalist **Orange-crowned Warbler OCWA 15 15 generalist **Red-winged Blackbird RWBL 7 16 generalist **Northern Rough-winged Swallow NRWS 10 16 generalist **Dark-eyed Junco DEJU 6 17 generalist Western Meadowlark WEME 1 35 generalist ** Northern Mockingbird NOMO 37 52 generalist ** Anna's Hummingbird ANHU 39 58 generalist ** White-crowned Sparrow WCSP 22 76 generalist ** Audubon's Warbler AUWA 35 79 generalist ** Great-tailed Grackle GTGR 37 184 generalist ** House Finch HOFI 38 282 generalist ** Mourning Dove MODO 39 325 generalist
32
Black-chinned Hummingbird BCHU 1 1 desert Canyon Towhe CANT 1 1 desert Greater Roadrunner GRRO 1 1 desert Lucy's Warbler LUWA 1 1 desert Ash Throated Flycatcher ATFL 1 2 desert Ladder-backed Woodpecker LBWO 2 2 desert White-winged Dove WWDO 2 2 desert Black-tailed Gnatcatcher BTGN 3 3 desert Black-throated Sparrow BTSP 2 5 desert Harris' Hawk HAHA 3 5 desert Phainapepla PHAI 3 5 desert **Gilded Flicker GIFL 11 12 desert **Costa's Hummingbird COHU 10 15 desert ** Cactus Wren CACW 17 23 desert ** Say's Phoebe SAPH 19 23 desert ** Lesser Goldfinch LEGO 24 42 desert ** Aberts Towhee ABTO 32 43 desert ** Curve-billed Thrasher CBTH 30 44 desert ** Gila Woodpecker GIWO 35 52 desert ** Verdin VERD 37 60 desert **Gambels Quail GAQU 15 110 desert
33
MC
LF
LF
HFLF
HF MC HS
HSMS MS LF
LFLSLC LC LSLS
LC
HS
LC MCMCLC MCLF
LS HS
LS MS
LF MS
MSHS LFLF
HF
HFHF
0 5 10 15 202.5Kilometers
±Bird Monitoring Sites
HF High Income Fringe
LF Low to Middle Income Fringe
HS High Income Suburban
MS Middle Income Suburban
LS Low Income Suburban
MC Middle to High Income Core
LC Low Income Core
Figure 2.1: Bird monitoring locations The distribution of the bird monitoring locations and neighborhoods within Phoenix, AZ. Bird monitoring locations were stratified by income and distance to urban centers.
34
-1.0 -0.5 0.0 0.5
-0.5
0.0
0.5
1.0
RDA1
RD
A2
GAQU
ABTOSAPH
COHU GIFL
VERD
CACW
OCWA
WCSP
RCKI NOCA
NOMO
ROWR
RODO
INDO
EUST
ECDO Thin-leafEvergreens
Shrubs
MonocotsBroad-leafDeciduous
Conifers
Broad-leafEvergreen
GTGR
HOFI
1-1
0
-1.0 -0.5 0.0 0.5
-0.5
0.0
0.5
1.0
RDA1
RD
A2
GAQU
ABTOSAPH
COHU GIFL
VERD
CACW
OCWA
WCSP
RCKI NOCA
NOMO
ROWR
RODO
INDO
EUST
ECDO Thin-leafEvergreens
Shrubs
MonocotsBroad-leafDeciduous
Conifers
Broad-leafEvergreen
GTGR
HOFI
-1.0 -0.5 0.0 0.5
-0.5
0.0
0.5
1.0
RDA1
RD
A2
GAQU
ABTOSAPH
COHU GIFL
VERD
CACW
OCWA
WCSP
RCKI NOCA
NOMO
ROWR
RODO
INDO
EUST
ECDO Thin-leafEvergreens
Shrubs
MonocotsBroad-leafDeciduous
Conifers
Broad-leafEvergreen
GTGR
HOFI
1-1
0
Figure 2.2: Habitat ordination diagram Arrows represent the direction of change of the habitat measures. The length of the arrow indicates the variable’s importance in explaining the urban bird community. Angles between variables indicate the correlation between the habitat measurements. Bird species locations (see Table 2.2 for bird name abbreviations) relative to each other indicate their similarity in ordination space. Bird species locations relative to the habitat measurements indicate the habitat associations for that species. Dots represent sites. Underlined species = desert birds, italicized species = generalist birds, plain font = invasive birds. The majority of the desert bird species clustered along the shrub and the thin-leaf evergreen environmental vector, indicating that desert bird species increased their abundances as the density of desert and drought-tolerant vegetation increased.
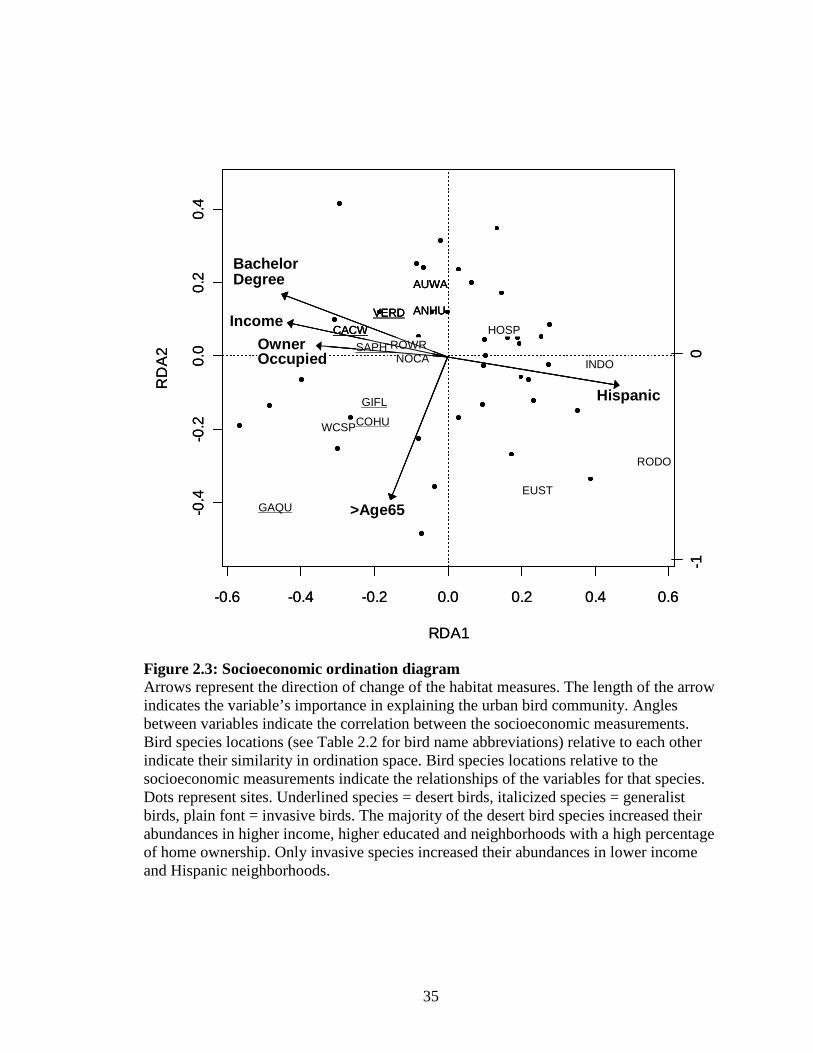
35
-0.6 -0.4 -0.2 0.0 0.2 0.4 0.6
-0.4
-0.2
0.0
0.2
0.4
RDA1
RD
A2
HOSP
ANHU
NOCA ROWR
AUWA
WCSP COHU
GIFL
SAPH
CACW
VERD
GAQU
INDO
RODO
EUST
>Age65
Hispanic
OwnerOccupied
Income
BachelorDegree
0-1
-0.6 -0.4 -0.2 0.0 0.2 0.4 0.6
-0.4
-0.2
0.0
0.2
0.4
RDA1
RD
A2
HOSP
ANHU
NOCA ROWR
AUWA
WCSP COHU
GIFL
SAPH
CACW
VERD
GAQU
INDO
RODO
EUST
>Age65
Hispanic
OwnerOccupied
Income
BachelorDegree
HOSP
ANHU
NOCA ROWR
AUWA
WCSP COHU
GIFL
SAPH
CACW
VERD
GAQU
INDO
RODO
EUST
>Age65
Hispanic
OwnerOccupied
Income
BachelorDegree
0-1
Figure 2.3: Socioeconomic ordination diagram Arrows represent the direction of change of the habitat measures. The length of the arrow indicates the variable’s importance in explaining the urban bird community. Angles between variables indicate the correlation between the socioeconomic measurements. Bird species locations (see Table 2.2 for bird name abbreviations) relative to each other indicate their similarity in ordination space. Bird species locations relative to the socioeconomic measurements indicate the relationships of the variables for that species. Dots represent sites. Underlined species = desert birds, italicized species = generalist birds, plain font = invasive birds. The majority of the desert bird species increased their abundances in higher income, higher educated and neighborhoods with a high percentage of home ownership. Only invasive species increased their abundances in lower income and Hispanic neighborhoods.
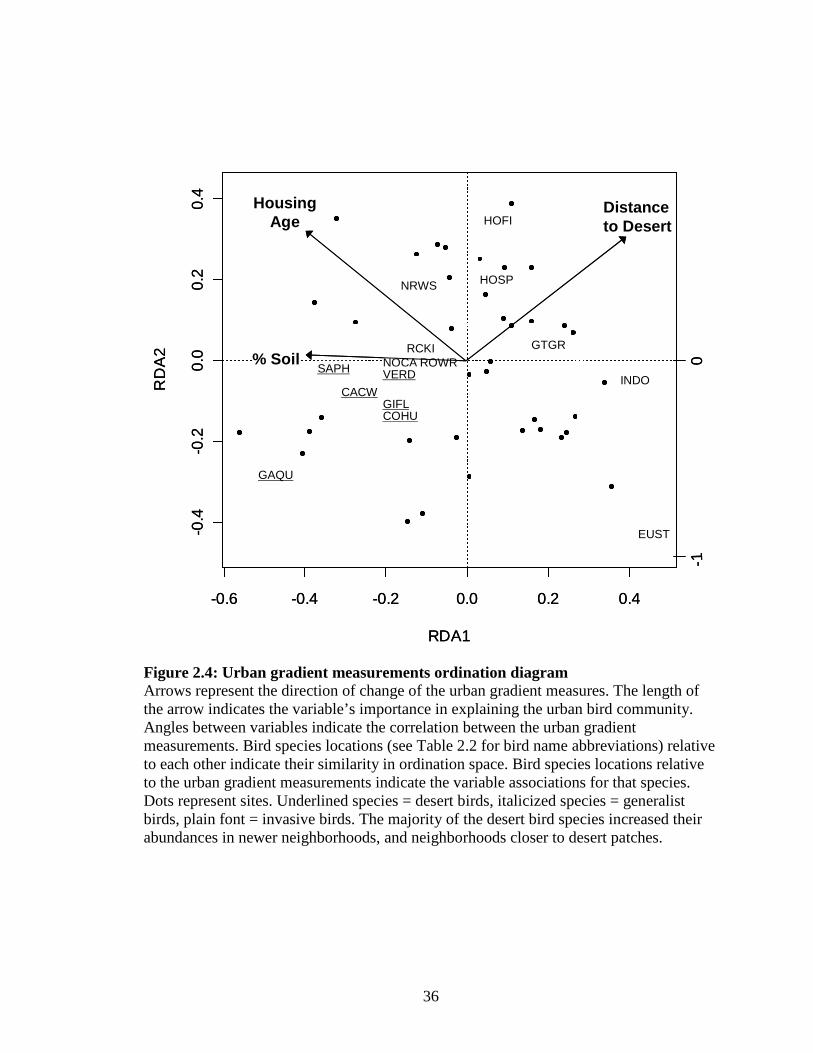
36
-0.6 -0.4 -0.2 0.0 0.2 0.4
-0.4
-0.2
0.0
0.2
0.4
RDA1
RD
A2
ROWRNOCARCKI
NRWS
GTGR
HOFI
GAQU
COHUGIFL
CACW
SAPH VERD
EUST
INDO
HOSP
Housing Age
% Soil
Distance to Desert
0-1
-0.6 -0.4 -0.2 0.0 0.2 0.4
-0.4
-0.2
0.0
0.2
0.4
RDA1
RD
A2
ROWRNOCARCKI
NRWS
GTGR
HOFI
GAQU
COHUGIFL
CACW
SAPH VERD
EUST
INDO
HOSP
Housing Age
% Soil
Distance to Desert
0-1
Figure 2.4: Urban gradient measurements ordination diagram Arrows represent the direction of change of the urban gradient measures. The length of the arrow indicates the variable’s importance in explaining the urban bird community. Angles between variables indicate the correlation between the urban gradient measurements. Bird species locations (see Table 2.2 for bird name abbreviations) relative to each other indicate their similarity in ordination space. Bird species locations relative to the urban gradient measurements indicate the variable associations for that species. Dots represent sites. Underlined species = desert birds, italicized species = generalist birds, plain font = invasive birds. The majority of the desert bird species increased their abundances in newer neighborhoods, and neighborhoods closer to desert patches.
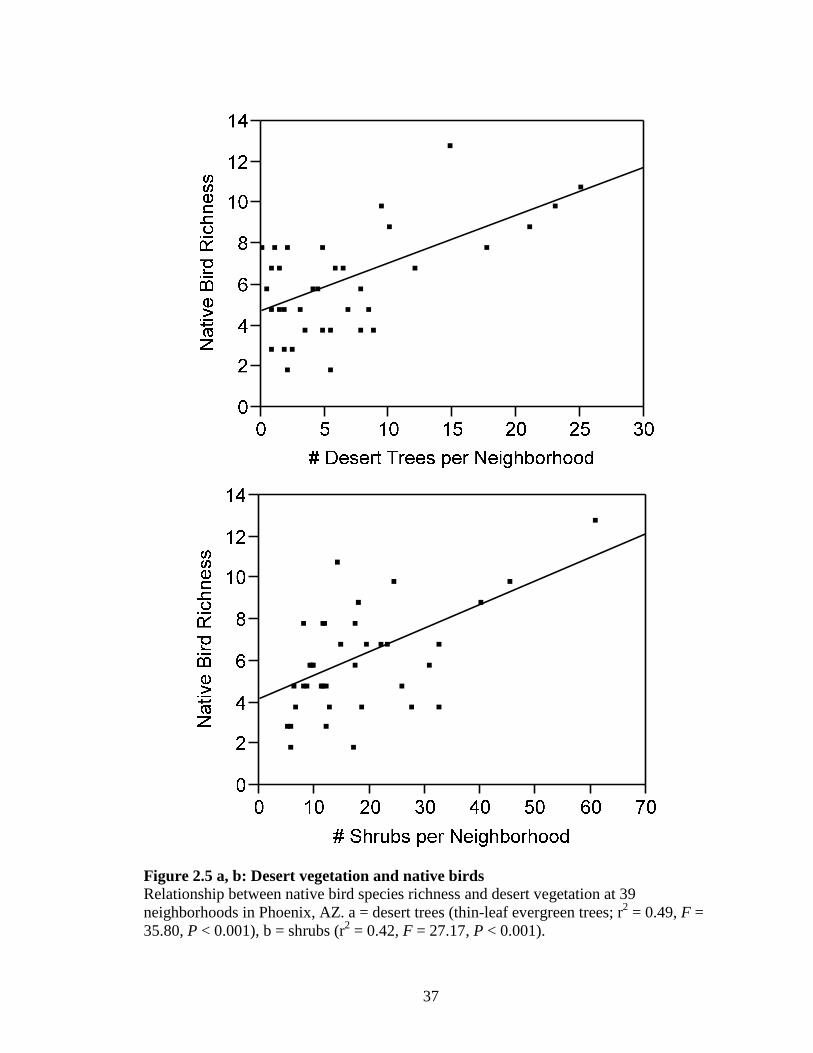
37
Figure 2.5 a, b: Desert vegetation and native birds Relationship between native bird species richness and desert vegetation at 39 neighborhoods in Phoenix, AZ. a = desert trees (thin-leaf evergreen trees; r2 = 0.49, F = 35.80, P < 0.001), b = shrubs (r2 = 0.42, F = 27.17, P < 0.001).
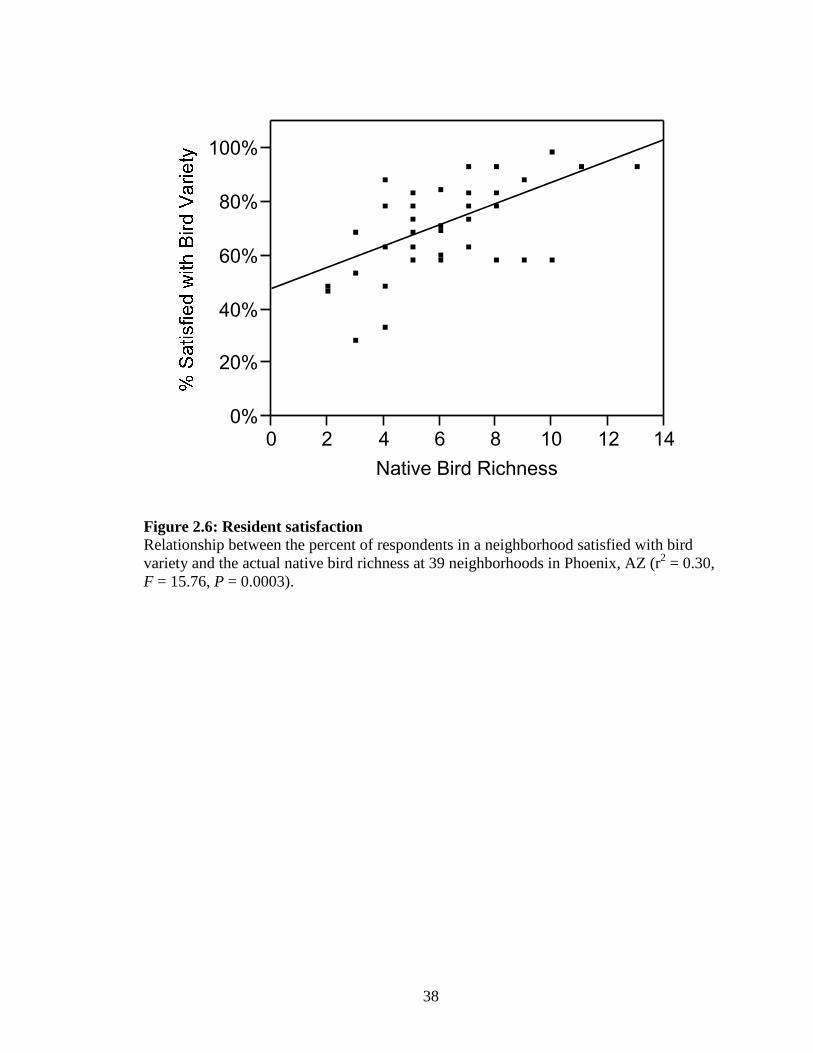
38
0%
20%
40%
60%
80%
100%
0 2 4 6 8 10 12 14
Native Bird Richness Figure 2.6: Resident satisfaction Relationship between the percent of respondents in a neighborhood satisfied with bird variety and the actual native bird richness at 39 neighborhoods in Phoenix, AZ (r2 = 0.30, F = 15.76, P = 0.0003).
39
CHAPTER 3
COUNTING PECKS HELPS EXPLAIN URBAN BIRD COMMUNITY
STRUCTURE: FORAGING EXPERIMENTS IN RESIDENTIAL YARDS
3.1 Introduction
Urbanization alters the composition and function of landscapes, rendering certain
areas unsuitable for native wildlife (McKinney 2002). Patterns emerging from urban
studies indicate that bird species richness and evenness decline while biomass and density
increase (Beissinger and Osborne 1982; Blair 1996; Marzluff 2001; Chace and Walsh
2006, Shochat et al. 2010). Recently, studies have shown that within urban areas,
landscape designs that mimic the wildlands being replaced (i.e. more native-like), are
more diverse compared with landscapes with exotic vegetation (i.e. more urban; Daniels
and Kirkpatrick 2006; Burghardt et al. 2009; Lerman and Warren 2011). These and other
studies highlight ways to reconcile human development with ecosystem function
(Goddard et al. 2010).
Understanding the processes that lead to changes in community composition and
structure requires more detailed studies of individuals and populations. Shochat et al.
(2004) compared individual foraging behavior between urban and desert bird
communities in central Arizona. They quantified the quitting point of foraging by
measuring the giving-up density (GUD: the density of resources remaining after foraging
stops; Brown 1988) for the final forager visiting artificial food patches. Because the
Sonoran desert greatly differs from the urban habitat in terms of productivity, structure
40
and function, this study provides an excellent reference for comparing urban and
wildlands habitats. They found that urban birds exhibited lower GUDs, than desert birds.
Shochat and colleagues (2004) suggested several drivers for these differences in GUDs
and tested them individually. Specifically, urban birds behaved as though predation was
reduced while desert birds behaved as though the cost of missed opportunities was higher
in the desert. The cost of digestion was also lower in the urban habitat, due to the
increased water availability in cities. Shochat et al. (2004) used their results at the
individual / species level to explain urban bird community structure, and suggested that a
few highly efficient foragers, dominated urban sites and possibly competitively excluded
subordinate and less efficient foragers access to food resources (Shochat et al. 2004;
Shochat et al. 2010).
For one analysis on competition, Shochat et al. (2004) focused exclusively on the
urban environment, comparing foraging decisions between two different landscape
designs (mesic: yards landscaped with exotic plants, more urban-like; xeric: yards
landscaped with native plants, more desert-like), and found that birds foraging in mesic
yards had lower GUDs, than birds foraging in xeric yards, but the sample sizes in this
study were too low to be conclusive. These preliminary results suggested that differences
in landscaping designs within urban areas may support differences in bird community
structure similar to those found at a broader scale between urban and desert habitats.
Understanding how bird behavior varies across the urban landscape may provide insights
on whether native landscaping in the city can support the same functions as native desert
environments. Here, I build upon the work of Shochat et al. (2004) by more rigorously
testing the differences in foraging behavior between mesic and xeric landscape designs,
41
and identifying some potential mechanisms for these differences. In addition, the Shochat
et al. (2004) study lacks definitive information on the density of foragers and species
identity. Furthermore, their index of efficiency does not accurately measure the rate of
seed consumption for each species.
Lerman and Warren (2011) found that xeric yards in Phoenix, AZ were mini
refugia for native birds, and many birds from the Sonoran desert bird community were
represented. Yet, it is unclear how urban features such as elevated resources from human
subsidies (e.g. exotic vegetation, refuse and bird feeders; Emlen 1974; Mennechez and
Cleurgeu 2001; Leston and Rodewald 2006) influence the bird community in xeric yards.
Furthermore, a number of studies have shown that for adult birds and squirrels, predation
pressure in urban settings is relaxed (Major et al. 1996; Bowers and Breland 1996;
Gering and Blair 1999; Shochat et al. 2004; Chiron and Julliard 2007). These distinct
urban features might lead to different foraging decisions by birds in xeric yards than in
native desert areas, despite the structural similarities of these two habitat types.
For my study, I tested whether the costs associated with foraging differed between
the mesic and xeric yards. I used seed trays as artificial food patches, and measured the
amount of seed left in the tray after 24 hours. This measurement represents the GUD of
the final forager visiting the tray. The logic is that the last species to visit a tray was able
to locate food items after other species quit and that the food remaining on the tray
represents the foraging decision this final forager (Brown 1988). If xeric yards function
more like the desert in terms of resource availability and foraging costs than the urban
environment (mesic yards), then I expected to see higher GUDs in xeric than mesic yards.
If however, the altered resources and predation risks of the urban environment yield
42
similar costs and benefits of foraging in xeric and mesic yards, I expected to see low
GUDs in both yard types.
One of the limitations of the GUD method is that the GUD only measures the
foraging decision of the last species foraging on the artificial food trays (Brown 1988).
As typically used, the method does not provide information about the decisions of other
species foraging on the tray prior to the last species. In addition, the method lacks the
capacity to assess the true effort expended by the forager and the actual resources
consumed, and thus the GUD only provides a rather imprecise index of efficiency. To
address these limitations, I developed an experimental and analytical method for
estimating the GUD for all species visiting each artificial food patch and thus increased
the data obtained from a single artificial food patch. I used video monitoring to quantify
the cumulative number of foraging pecks at the point when each species quit foraging on
each artificial food patch. I then calculated a GUD-to-peck relationship for the final
forager to develop a statistical model that would estimate all species’ GUD. In addition, I
was able to more accurately measure efficiency by estimating the rate of seed
consumption for each species. The enhanced GUD method enabled me to disentangle
some of the effects of the bird community composition, the density of competitors and
behavioral plasticity, and how these factors affected foraging decisions between two
different landscape designs. This method advances the method of measuring GUD, and
may be useful in future optimal foraging research.
43
3.1.1 Optimal foraging theory and giving up densities
Optimal foraging theory provides a useful framework for testing how animals
perceive habitat quality (Charnov 1976; Stephens and Krebs 1986). An animal behaving
optimally quits foraging a patch when the marginal profits (i.e. energy gains) equal the
marginal costs of foraging (e.g. predation risk, metabolic cost, and missed opportunity
costs; Brown 1988). An efficient forager can maximize energy gain by minimizing the
amount of time spent in a particular patch (Charnov 1976; Stephens and Krebs 1986;
Brown 1988). Using artificial and depletable food patches, I can manipulate resource-
consumer relationships, measure foraging decisions, and highlight some of the costs
associated with foraging. Specifically, as food becomes depleted, the forager experiences
diminishing returns; finding additional food items becomes increasingly difficult and the
benefits of foraging in the patch no longer outweigh the costs (Charnov 1976). The
quitting point or GUD provides a quantitative assessment on a forager’s perception of
foraging costs within the environment while also providing a measurement for efficiency
of the final forager (Charnov 1976; Brown 1988). A forager will quit a patch earlier in
higher quality environments due to greater abundances of alternative food resources
(Morris and Davidson 2000; Olsson et al. 2002; Stenberg and Persson 2006).
The GUD method hails from an established conceptual framework (Brown 1988),
is simple to execute, and yet robust in its ability to link energetic gain from foraging to
urban bird community structure. The GUD method rests upon a number of assumptions.
First, the method assumes the artificial patches mimic real food sources and that foragers
treat these patches as part of the natural environment (Kohlmann and Risenhoover 1996).
One of the strengths of the method includes the ability of the foragers to remain in their
44
natural environment with their natural competitors, resources, and alternative activities.
The GUD method also assumes an Ideal Free Distribution (Fretwell and Lucas 1969); it
assumes animals posses knowledge of available patches and have the freedom to move
from one patch to another. Many GUD studies have focused on birds due to their ability
to exploit novel food patches (e.g., bird feeders), and their mobility (Brown 1988; Olsson
et al. 1999; Oyugi and Brown 2003; Borgstrom et al. in press).
3.2 Materials and Methods
3.2.1 Study area
Nestled in the northern limits of the Sonoran desert, Phoenix, AZ is one of the
fastest growing cities in the US. I conducted the experiments in 20 residential yards
located in the greater Phoenix metropolitan area, ten of which were landscaped with a
mesic design (‘more urban’ - turf ground cover and exotic vegetation) and ten of which
were of xeric design (‘more desert’ - crushed gravel with drought-tolerant and / or native
vegetation). All experimental setups were located within 20 m of a residence. All
homeowners removed bird feeders before and during the experiments. I calculated the
distance to large desert patches from the 20 residential yards to ensure proximity did not
confound results regarding the bird community. I found no significant difference between
the mesic and xeric yard proximity to desert patches (ANOVA; F1,19 = 0.59, P = 0.45);
average distance between mesic yards and desert patches was 5.99 km (0.75 SE) and
mean distance for xeric yards was 4.98 km (1.07 SE). Experiments were conducted
between February and April 2010. Temperatures were relatively stable with an average
45
minimum temperature of 11.64 C (0.48 SE) and maximum temperature of 24.57 C (0.84
SE).Within Phoenix residential areas, the design types of individual yards generally
mimic those of their neighbors (Lerman and Warren 2011) suggesting that similar
foraging opportunities existed within close proximity of the focal yard. Housing density
and lot size within Phoenix, AZ are also relatively homogenous (Gammage 1999),
suggesting the amount of available habitat within close proximity of the focal residential
yards.
3.2.2 Seed trays
I mixed 20 g of millet seed with 3 kg of sifted sand in green plastic trays (36-cm
diameter) to simulate resource patches. Sites were baited with identical seed trays at least
24 h in advance, or as long as necessary to detect visitation. I placed two trays in each
yard, and each tray was placed on a stool (1 m tall) for a 24 h trial. After 24 h, each tray
was removed from the site and brought back to the lab for processing. I sifted the trays by
pouring the sand and seed mixture through a sifting screen twice. The remaining seeds
were separated from the empty hulls and any debris, and then weighed to calculate the
GUD to the nearest 0.01 g.
3.2.3 Assessing the perceived risk of predation
Perceived risk of predation influences foraging decisions: in general, foragers in
risky patches quit foraging earlier than foragers in safe patches (Brown 1988; Bowers and
Breland 1996; Lima and Bednekoff 1999; Shochat et al. 2004). Distance from cover has
46
been shown to correlate positively with perceived predation risk in habitats in which
aerial predators represented the primary threat (Brown 1988; Lima 1990; Kotler et al.
1994; Shochat et al. 2004). Alternatively, cover may hide predators such as cats, and
distance from cover may correlate negatively with perceived predation risk. Here, I tested
whether distance from cover influenced foraging efficiency. I placed one tray next to
large bushes and shrubs and one tray three meters away from vegetation. I assumed that
an individual forager’s choice to quit foraging at a tray reflected the optimal decision for
the relative amounts of risk and of food available in the two microhabitats at that time.
While foragers may not have ideal knowledge of food availability in the two
microhabitats, it was possible that foragers assessed whether a tray had been visited
previously and how vigorous it had been searched for food. At the beginning of each
trial, the sand in the trays was smooth and some seed was visible. Some indications of
prior visitation included foot prints, uneven sand surface, and no visible seed. Concurrent
measures of GUDs in the two microhabitats were necessary to avoid confounding daily
variation with differences in use of the microhabitats.
3.2.4 Video recording and analysis
I used Trendnet TV-IP110 network IP cameras with Active Webcam video
recording software (PY Software, version 11.5) on Lenovo G550 Laptop Computers to
record foraging behavior for the entire 24 h experiments for all trays. Cameras were
housed in plexiglass cases, secured to the stools and placed approximately 0.75 cm from
the seed tray. To facilitate data file management, I divided the 24 h recording time into
two 12 h files. Frame rates were set at 20 fps, with a maximum file size of 1100 MB.
47
Files were in WMV format, and optimized to automatically continue recording in a new
file when the maximum file size was reached.
I used JWatcher (http://www.jwatcher.ucla.edu/) version 1.0 with VLC media
play to score foraging behaviors from the videos. I focused on four events from the
videos: species identification for each tray, the total number of foraging pecks for each
species per tray, time spent foraging on the tray, and the minimum number of individuals
visiting each tray. To calculate the second two events, I logged every peck per species per
tray. I then calculated the total amount of time each species spent foraging on each tray.
Because the birds in my study were not marked, I could only calculate the minimum
number of individuals per tray as an estimate of density. For example, when a tray had
three female house sparrows on the tray at once, and then later, had two male and one
female house sparrows, I recorded a minimum of five individuals. Counting the pecks
allowed us to calculate the total number of pecks for each tray, the total number of pecks
for each species, and the cumulative number of pecks per tray when each species quit
foraging on each tray. Video monitoring also allowed me to confirm that only birds
visited the seed trays.
3.2.5 The GUD-Peck model
To make the GUD method more useful for evaluating multi-species visiting an
artificial food patch, I developed a GUD Peck model to calculate the GUD for every
species visiting a seed tray. First, I measured the GUD from the final forager for all trays
in the 20 yards. For two of the twenty yards, I conducted two additional foraging trials
because one tray was not visited during the first trial. I measured the GUD for every tray
48
that birds visited for each trial and used these data for calculating the model, yielding a
total sample size of 42 trays. For each final forager visiting each tray, I was able to
measure the GUD and count the total number of pecks per tray (GUD peck). I used these
data as the basis of the GUD Peck model to estimate the GUD for all other foragers (n =
72) visiting the 42 trays. I used a linear model with log transformed predictor variable
GUD pecks and response variable GUD (Fig. 3.1). The strength of the model was
relatively tight (R2 = 0.69). To test the accuracy of the model, I compared the observed
GUD values against the predicted GUD values (Pearson Correlation, r = 0.83). This
model assumed that number of individuals visiting the trays did not influence the GUD,
and that a peck was equal to seed acquisition. I recognize from the data, I could not be
certain how many seeds were consumed for each peck nor could I differentiate successful
from unsuccessful pecks. To account for these assumptions, I added two additional
independent variables to the model, first individually and then together: (1) the number of
individuals visiting the tray, and (2) the species identity. Here I assumed that pecking
success was relatively consistent for each species. Based on the R2 value, the best model
included number of individuals visiting the tray and species identity. To test the accuracy
of the model, I compared the observed GUD values against the predicted GUD values
based on the model (Pearson Correlation = 0.91). I then used the model to estimate the
GUD for the remaining 72 observations based on the cumulative number of pecks when
each species quit foraging each tray.
49
3.2.6 Calculating rate of consumption
I used the GUD-Peck model to more accurately calculate the foraging efficiency
for each species visiting the trays. An efficient forager maximizes energy gained (e.g.
grams of seed) by minimizing time spent foraging (e.g. occupancy time on artificial food
patch). I calculated the amount of seed consumed for each species based on the total
number of pecks per species per tray. I entered the total number of pecks into the GUD-
peck model. I then calculated the total amount of time each species spent pecking at each
tray. To calculate this, I summed all foraging bouts for each species. A foraging bout
began with the species’ first peck and ended when at least one minute passed without a
peck for the focal species. Since I did not include the time period prior to the first peck
(i.e. time between arrival on tray and first peck) or the time period after the last peck and
departure from the tray, the calculations represent the minimum residency time and likely
underestimate the actual residency time. However, I sub sampled 5% of the foraging
bouts to estimate the amount of time spent sitting on the tray prior and after pecking and
found this time to be nominal (began pecking within 5 seconds upon arrival, and departed
the tray within 10 seconds of final peck). The GUD-peck model performed poorly with
very few pecks (less than 40 pecks per tray). Based on the model, seed consumed for
these data was estimated as a negative amount, and therefore I omitted these data a priori
to better estimate the efficiency.
3.2.7 Perceived predation risk
The shrub species, density and configuration significantly differ between mesic
and xeric yards (Lerman and Warren 2011). Furthermore, the vegetation variation could
50
provide different refuges from predators and also impact a bird’s capacity to detect
predators (Whelan and Maina 2005). To test whether distance from cover influenced
foraging decisions, I conducted two separate paired-samples t-tests: one for all the
species foraging in mesic yards (n = 10) and one for all the species foraging in xeric
yards (n = 10). I compared the GUD (response variable) for each species for each yard,
from two different conditions: trays out in the open and trays close to bushes. The
number of species visiting each tray ranged between one and six. For the 10 mesic yards,
there were 26 paired observations and for the 10 xeric yards, there were 19 paired
observations. These pairs only include a species within each yard that visited both trays.
In other words, eight species in both the mesic and xeric yards did not visit either the
bush or open tray. I can not be certain if the lack of visitation was an active decision.
Therefore, I conducted an additional paired-samples t-tests for the 34 paired observations
from the mesic yards and the 27 paired observations for xeric yards (which includes the
trays not visited, and hence the GUD was 20 g) and obtained similar results. If cats posed
a predation risk and use bushes for shelter, then I expected the birds to deplete more
resources in the trays away from bushes (i.e. higher GUDs from the trays next to bushes).
If aerial predators posed a predation risk, then I expected the birds to deplete more
resources in the trays close to bushes (i.e. higher GUDs from the open trays).
3.2.8 Bird community
I tested whether the species visiting the seed trays differed between the two yard
types using a Multi-response Permutation Procedure (MRPP). This nonparametric
procedure tested the null hypothesis that two or more groups did not differ. MRPP
51
compared the observed intra-group average distance with the average distance expected
for all other combinations under the assumption of the null hypothesis (Mielke et al.
2001). I included minimum number of individuals per species per yard as the density
estimate. The coefficient of variation for the data were high (> 100) so I conducted a row
normalize standardization procedure to calculate the species profile within each yard. I
dropped species occurring at less than 5% of the sites since they were not sampled
sufficiently and the data could not reliably characterize their ecological pattern (McCune
and Grace 2002). The data had many zeroes (>30% per site) and therefore I used the Bray
Curtis distance measurement. Results were based on 999 permutations. I also performed
an analysis of group similarities (ANOSIM) and obtained similar results. I conducted
these analyses using R (2008) with the Vegan package (Oksanen et al. 2009).
3.2.9 Landscape design differences
To test whether foraging efficiency differed between the two yard types, I pooled
the GUDs for all species for each yard type and then conducted an analysis of variance
(ANOVA). The independent variable was yard type and the response variable was the
GUD. Using the pooled data, I then conducted an analysis of covariance (ANCOVA)
with GUD as the response, yard type as the factor, and bird density (minimum number of
individuals visiting a tray) as a covariate to address how bird densities might decrease the
GUD. Finally, I tested whether individual species altered their foraging behavior between
the two different yard types. I focused on the four species that had multiple observations
within mesic and xeric yards (i.e. visited both the mesic and xeric yards; Abert’s towhee
[Pipilo aberti), curve-billed thrasher [Toxostoma curvirostre], house finch [Carpodacus
52
mexicanus], and house sparrow [Passer domesticus]). Here I averaged the GUD for each
species for each yard type. Since sample sizes were small, I undertook a nonparametric
approach (Wilcoxon Test); GUD was the response variable and yard type was the
independent variable. In addition, I compared the foraging efficiency (as calculated by
the model; the response variable) between these four species within each yard design
(independent variable) using the Kruskal-Wallis Tests.
I used JMP 8 statistical software for all analyses except when noted otherwise,
and set the significance level at P = 0.05. I checked for normality of the data and
transformed when necessary.
3.3 Results
Fourteen bird species visited the seed trays. Eleven species were recorded in
mesic yards and ten species were recorded in xeric yards (Fig. 3.2). The majority of
species were recorded in both yard types with the exception of rock pigeon (Columba
livia), dark-eyed junco (Junco hyemalis), northern mockingbird (Mimus polyglottos)
orange-crowned warbler (Vermivora celata) (only in mesic yards); white-winged dove
(Zenaida asiatica), Gambel’s quail (Callipepla gambelii) and spotted towhee (Pipilo
maculates) (only in xeric yards). Curve-billed thrasher, Abert’s towhee, house sparrow,
and house finch were the most wide-spread species (15, 11, 10, and 8 yards respectively).
The GUDs for dark-eyed junco, northern mockingbird, orange-crowned warbler, and
spotted towhee were not estimated since these birds were never the final forager and
therefore I did not have an initial GUD-peck calculation to enter into the model. The bird
53
community did not differ significantly between the two yard types (MRPP, Chance
corrected within-group agreement A = 0.002013, P = 0.41).
The average time it took the birds to find the trays was 7.9 hours (SE = 0.76) with
some birds arriving within 5 minutes of the start of the experiments and others not
arriving until the experiments were almost complete (Table 3.1). Abert’s towhee, curve-
billed thrasher, house sparrow and white-crowned sparrow (Zonotrichia leucophrys) had
the earliest arrival times (Table 3.1). White-crowned sparrow, rock pigeon (Columba
livia), and Abert’s towhee spent the most time on the trays while northern mockingbird,
mourning doves and curve-billed thrashers spent the least amount of time foraging on the
trays (Table 3.1).
I found no evidence that distance from vegetation influenced foraging decisions
for either yard type (Paired t-test; mesic yards: t Ratio = -0.402,25, P = 0.69; xeric yards: t
Ratio = 0.562,18, P = 0.58). Therefore I pooled data from the bush and open trays and
calculated the mean GUD per species per yard for the remaining analyses. Birds foraging
in mesic yards consumed more seed (i.e. lower GUDs) than birds foraging in xeric yards
(ANOVA, F Ratio = 26.072,59, P < 0.0001, Fig. 3.3). When I accounted for bird density
(i.e. minimum number of individuals visiting a tray) as a covariate on the GUD, I failed
to find a significant difference between yard type, but bird density and the interaction of
yard type and bird density were all significant (ANCOVA, t Ratio = -0.94, P = 0.35; t
Ratio = -6.96, P < 0.0001; t Ratio = 2.99, P = 0.004, respectively, Fig. 3.4). Although the
majority of species that foraged in both yard types showed a trend of higher GUDs in
xeric yards, I only tested for differences for Abert’s towhee, curve-billed thrasher, house
finch, and house sparrow. All four species had higher GUDs in xeric yards (Wilcoxon
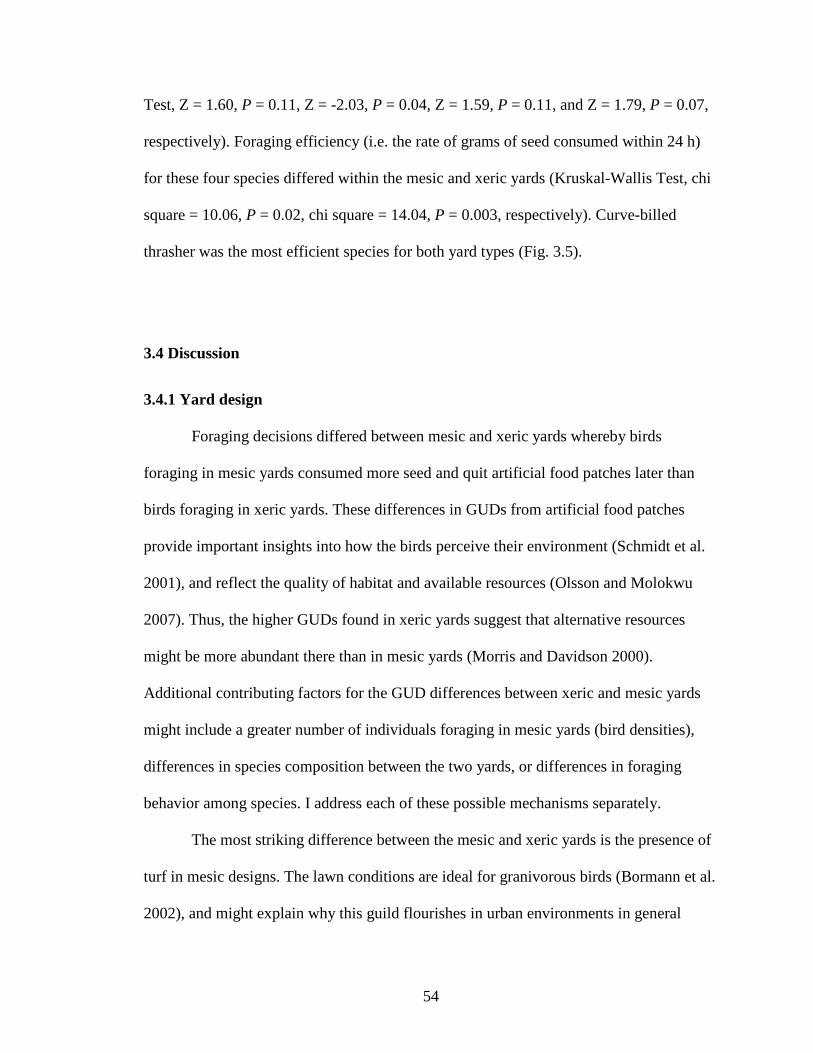
54
Test, Z = 1.60, P = 0.11, Z = -2.03, P = 0.04, Z = 1.59, P = 0.11, and Z = 1.79, P = 0.07,
respectively). Foraging efficiency (i.e. the rate of grams of seed consumed within 24 h)
for these four species differed within the mesic and xeric yards (Kruskal-Wallis Test, chi
square = 10.06, P = 0.02, chi square = 14.04, P = 0.003, respectively). Curve-billed
thrasher was the most efficient species for both yard types (Fig. 3.5).
3.4 Discussion
3.4.1 Yard design
Foraging decisions differed between mesic and xeric yards whereby birds
foraging in mesic yards consumed more seed and quit artificial food patches later than
birds foraging in xeric yards. These differences in GUDs from artificial food patches
provide important insights into how the birds perceive their environment (Schmidt et al.
2001), and reflect the quality of habitat and available resources (Olsson and Molokwu
2007). Thus, the higher GUDs found in xeric yards suggest that alternative resources
might be more abundant there than in mesic yards (Morris and Davidson 2000).
Additional contributing factors for the GUD differences between xeric and mesic yards
might include a greater number of individuals foraging in mesic yards (bird densities),
differences in species composition between the two yards, or differences in foraging
behavior among species. I address each of these possible mechanisms separately.
The most striking difference between the mesic and xeric yards is the presence of
turf in mesic designs. The lawn conditions are ideal for granivorous birds (Bormann et al.
2002), and might explain why this guild flourishes in urban environments in general
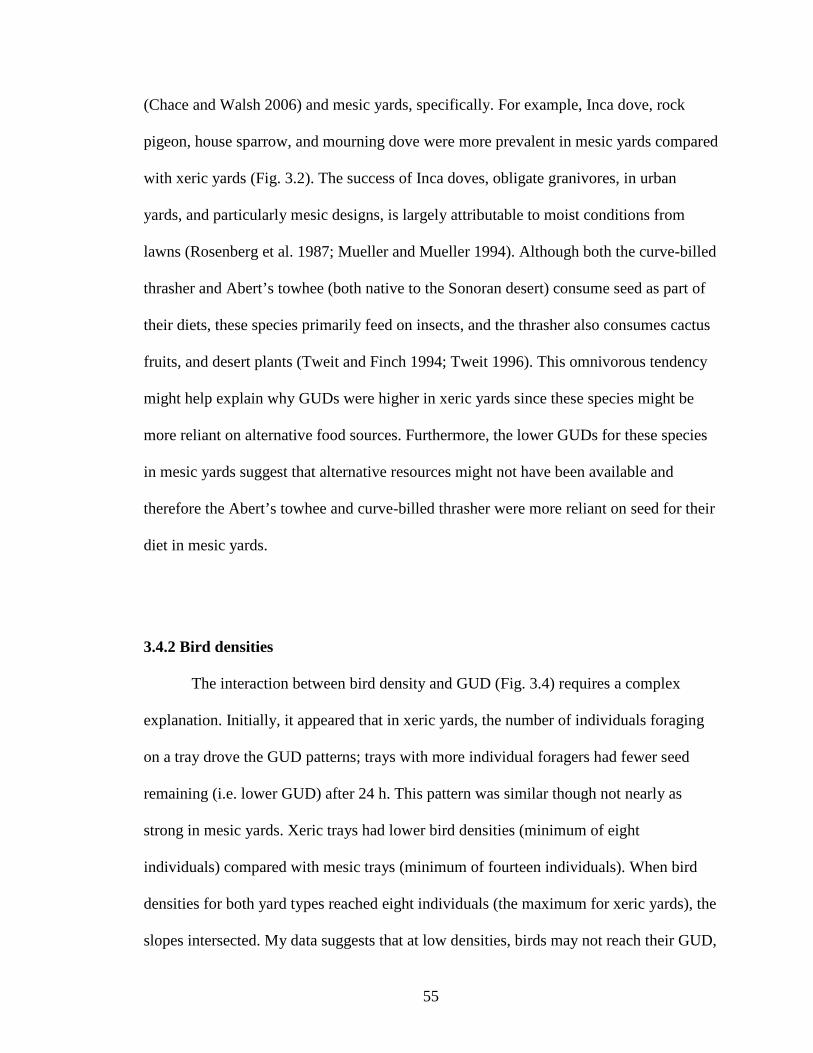
55
(Chace and Walsh 2006) and mesic yards, specifically. For example, Inca dove, rock
pigeon, house sparrow, and mourning dove were more prevalent in mesic yards compared
with xeric yards (Fig. 3.2). The success of Inca doves, obligate granivores, in urban
yards, and particularly mesic designs, is largely attributable to moist conditions from
lawns (Rosenberg et al. 1987; Mueller and Mueller 1994). Although both the curve-billed
thrasher and Abert’s towhee (both native to the Sonoran desert) consume seed as part of
their diets, these species primarily feed on insects, and the thrasher also consumes cactus
fruits, and desert plants (Tweit and Finch 1994; Tweit 1996). This omnivorous tendency
might help explain why GUDs were higher in xeric yards since these species might be
more reliant on alternative food sources. Furthermore, the lower GUDs for these species
in mesic yards suggest that alternative resources might not have been available and
therefore the Abert’s towhee and curve-billed thrasher were more reliant on seed for their
diet in mesic yards.
3.4.2 Bird densities
The interaction between bird density and GUD (Fig. 3.4) requires a complex
explanation. Initially, it appeared that in xeric yards, the number of individuals foraging
on a tray drove the GUD patterns; trays with more individual foragers had fewer seed
remaining (i.e. lower GUD) after 24 h. This pattern was similar though not nearly as
strong in mesic yards. Xeric trays had lower bird densities (minimum of eight
individuals) compared with mesic trays (minimum of fourteen individuals). When bird
densities for both yard types reached eight individuals (the maximum for xeric yards), the
slopes intersected. My data suggests that at low densities, birds may not reach their GUD,
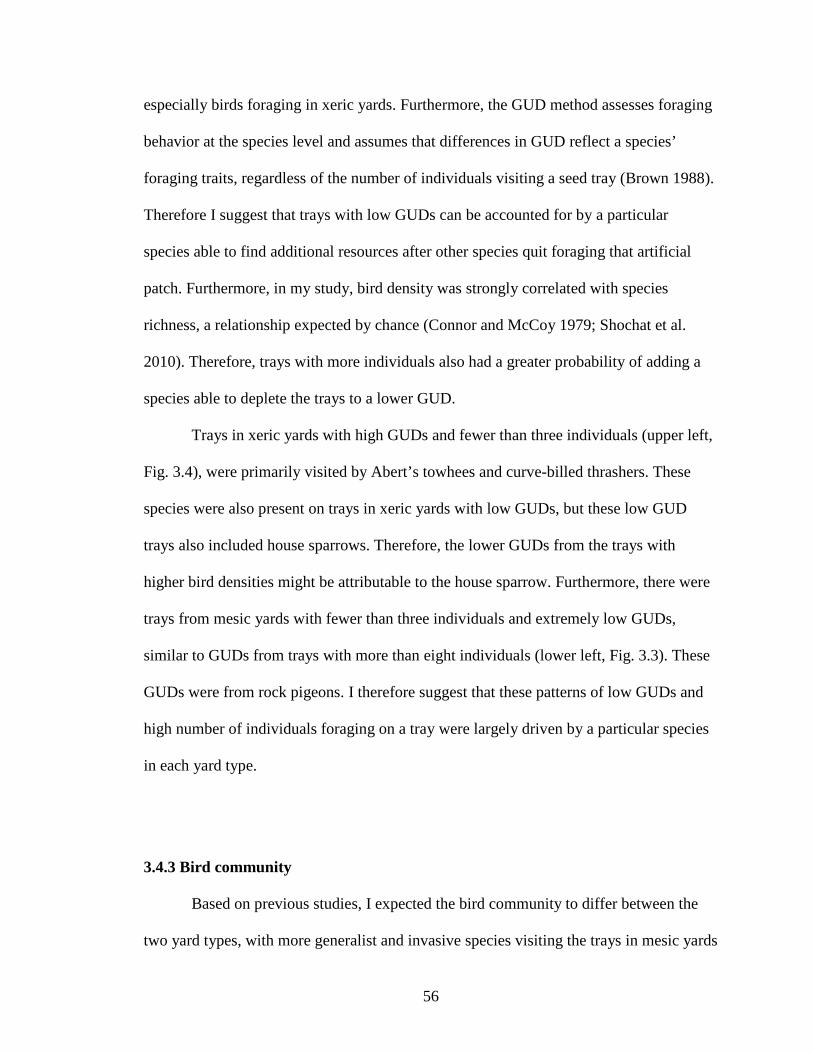
56
especially birds foraging in xeric yards. Furthermore, the GUD method assesses foraging
behavior at the species level and assumes that differences in GUD reflect a species’
foraging traits, regardless of the number of individuals visiting a seed tray (Brown 1988).
Therefore I suggest that trays with low GUDs can be accounted for by a particular
species able to find additional resources after other species quit foraging that artificial
patch. Furthermore, in my study, bird density was strongly correlated with species
richness, a relationship expected by chance (Connor and McCoy 1979; Shochat et al.
2010). Therefore, trays with more individuals also had a greater probability of adding a
species able to deplete the trays to a lower GUD.
Trays in xeric yards with high GUDs and fewer than three individuals (upper left,
Fig. 3.4), were primarily visited by Abert’s towhees and curve-billed thrashers. These
species were also present on trays in xeric yards with low GUDs, but these low GUD
trays also included house sparrows. Therefore, the lower GUDs from the trays with
higher bird densities might be attributable to the house sparrow. Furthermore, there were
trays from mesic yards with fewer than three individuals and extremely low GUDs,
similar to GUDs from trays with more than eight individuals (lower left, Fig. 3.3). These
GUDs were from rock pigeons. I therefore suggest that these patterns of low GUDs and
high number of individuals foraging on a tray were largely driven by a particular species
in each yard type.
3.4.3 Bird community
Based on previous studies, I expected the bird community to differ between the
two yard types, with more generalist and invasive species visiting the trays in mesic yards
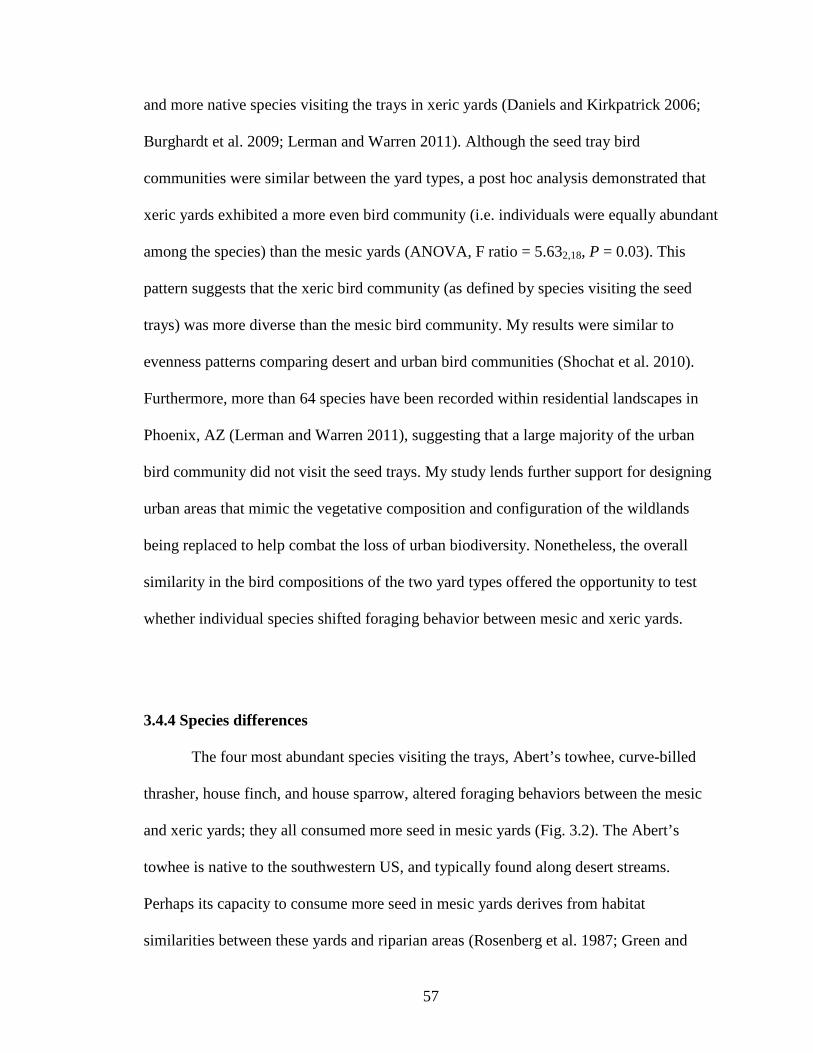
57
and more native species visiting the trays in xeric yards (Daniels and Kirkpatrick 2006;
Burghardt et al. 2009; Lerman and Warren 2011). Although the seed tray bird
communities were similar between the yard types, a post hoc analysis demonstrated that
xeric yards exhibited a more even bird community (i.e. individuals were equally abundant
among the species) than the mesic yards (ANOVA, F ratio = 5.632,18, P = 0.03). This
pattern suggests that the xeric bird community (as defined by species visiting the seed
trays) was more diverse than the mesic bird community. My results were similar to
evenness patterns comparing desert and urban bird communities (Shochat et al. 2010).
Furthermore, more than 64 species have been recorded within residential landscapes in
Phoenix, AZ (Lerman and Warren 2011), suggesting that a large majority of the urban
bird community did not visit the seed trays. My study lends further support for designing
urban areas that mimic the vegetative composition and configuration of the wildlands
being replaced to help combat the loss of urban biodiversity. Nonetheless, the overall
similarity in the bird compositions of the two yard types offered the opportunity to test
whether individual species shifted foraging behavior between mesic and xeric yards.
3.4.4 Species differences
The four most abundant species visiting the trays, Abert’s towhee, curve-billed
thrasher, house finch, and house sparrow, altered foraging behaviors between the mesic
and xeric yards; they all consumed more seed in mesic yards (Fig. 3.2). The Abert’s
towhee is native to the southwestern US, and typically found along desert streams.
Perhaps its capacity to consume more seed in mesic yards derives from habitat
similarities between these yards and riparian areas (Rosenberg et al. 1987; Green and
58
Baker 2002). The idea that an individual species alters foraging behavior between two
different environments suggests a degree of plasticity (Relyea 2001). In a meta-analysis
of bird invasions, Sol and colleagues (2002) tested whether behavioral flexibility aided in
the success of an invasion. They found that species with larger brains and innovative
foraging behavior were more successful invaders of novel environments. The ability for a
species to alter foraging behavior in mesic yards might explain why these species can
adapt to novel habitats (like the mesic yards). The results also suggest that species unable
to alter foraging behavior, might be less adapt at obtaining resources in novel habitats.
The GUD measures how species perceive varying risks associated with their
environment. Efficiency addresses how quickly a species can consume resources. If the
costs within a particular environment are high, then it is advantageous to be efficient. The
curve-billed thrasher’s ability to be more efficient than its competitors in mesic and xeric
yards might explain why this species was the most wide-spread forager in both yard
types. Perhaps the thrashers persist in mesic yards because they can successfully compete
with species more typical of cities (i.e. birds not native to the Sonoran desert) for
resources. In xeric yards, thrashers might be better adapted to mitigate the digestive costs
of the more arid landscape, as suggested by its higher efficiency rate. A post hoc analysis
test on the efficiency data (Tukey Test) revealed that the curve-billed thrasher was
significantly more efficient that Abert’s towhee, house finch, and house sparrow for both
yards. I therefore suggest that foraging efficiency might act as an additional urban filter
(Croci et al. 2008) whereby native birds unable to compete with more efficient foragers,
fail to persist in urban areas.
59
I recognize the difficulty of disentangling the effects of species differences and
bird densities on the GUD. Both of these factors influence foraging behavior, but how
these factors influence each other is not entirely clear. My study reveals some possible
mechanisms accounting for differences in GUDs for the two yard types: that individual
species have diverse foraging strategies, some species can alter foraging strategies, and
these strategies enable species to exploit different habitats that vary in habitat quality and
available resources. In addition, the increased densities of some species, such as doves
and sparrows, might lead to greater competition for resources, and hence, drive the
GUDs.
3.4.5 Predation
I found no evidence that birds perceived the bush tray as more risky than the open
tray, or vice versa. The lack of a difference in foraging decisions between the two trays
might also suggest that both trays were equally risky and the birds responded
accordingly. However, the risk was not so great that it deterred the birds from foraging
and therefore the data suggest the former. The lack of a perceived predation risk for either
yard type supports the growing evidence of relaxed predation on adult birds and
mammals in cities, regardless of landscape design (Bowers and Breland 1996; Sorace
2002; Shochat et al. 2004). As a caveat, I acknowledge that cats kill millions of birds
each year (Woods et al. 2003). However, my study suggests that perhaps certain bird
species might not perceive cats or aerial predators as a threat. Alternatively, species that
did not visit the seed trays might be more threatened by cats and other urban predators,
and cat presence might explain the absence of some bird species.
60
3.4.6 Making GUD better
My analytical approach allowed me to address how foraging decisions might be
influenced by all species visiting the seed trays, and not just the final forager as in
previous studies (e.g. Valone and Brown 1989; Shochat et al. 2004). I thus achieved
greater power in the interpretation by increasing the data points for each tray. The
information regarding when each individual species quits foraging on a seed tray, relative
to the other foragers, suggests how certain species might have a greater influence on the
GUD. With the video monitoring, I could accurately identify all species visiting the trays,
the proportion of seed each species consumed, and the identity of the final forager. With
this information, I gained a better understanding of how bird densities and species
identity interacted with the GUD. In a recent study, Kotler et al. (2011) attached passive
integrated transponder (PIT) tags to gerbils foraging at artificial food patches within an
enclosed environment. They were able to calculate time spent foraging for approximately
20% of the food patches. Although this method greatly advances the GUD method, it is
not applicable for wild populations. The video monitoring coupled with my GUD-peck
model can calculate modeling can be easily replicated in many field conditions.
3.5 Conclusion
My study is one of the first to use a mechanistic approach to assess the
effectiveness of particular residential landscape designs in supporting native bird
communities. The xeric yard types had a more even bird community and the higher
61
GUDs were indicative of a superior habitat compared with the mesic yard types.
Behavioral indicators such as foraging efficiency aid in conservation measures by
alerting land managers to superior habitats for native species (Buchholz 2007; Kotler et
al. 2007). Variation in landscape design is not unique to arid cities. Therefore, the
findings from my study and the methods used can easily be applied to other geographical
locations to determine whether the mechanisms driving urban bird patterns are similar,
and ultimately, begin addressing the loss of urban biodiversity on a global scale.
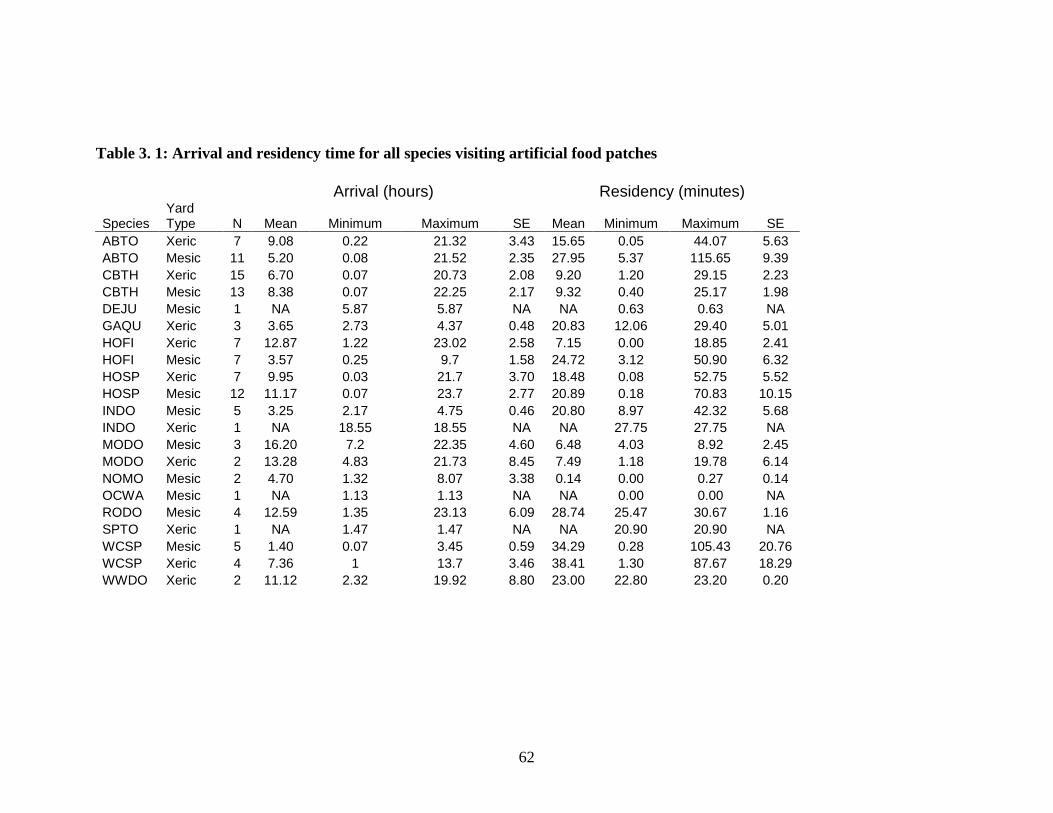
62
Table 3. 1: Arrival and residency time for all species visiting artificial food patches Arrival (hours) Residency (minutes)
Species Yard Type N Mean Minimum Maximum SE Mean Minimum Maximum SE
ABTO Xeric 7 9.08 0.22 21.32 3.43 15.65 0.05 44.07 5.63 ABTO Mesic 11 5.20 0.08 21.52 2.35 27.95 5.37 115.65 9.39 CBTH Xeric 15 6.70 0.07 20.73 2.08 9.20 1.20 29.15 2.23 CBTH Mesic 13 8.38 0.07 22.25 2.17 9.32 0.40 25.17 1.98 DEJU Mesic 1 NA 5.87 5.87 NA NA 0.63 0.63 NA GAQU Xeric 3 3.65 2.73 4.37 0.48 20.83 12.06 29.40 5.01 HOFI Xeric 7 12.87 1.22 23.02 2.58 7.15 0.00 18.85 2.41 HOFI Mesic 7 3.57 0.25 9.7 1.58 24.72 3.12 50.90 6.32 HOSP Xeric 7 9.95 0.03 21.7 3.70 18.48 0.08 52.75 5.52 HOSP Mesic 12 11.17 0.07 23.7 2.77 20.89 0.18 70.83 10.15 INDO Mesic 5 3.25 2.17 4.75 0.46 20.80 8.97 42.32 5.68 INDO Xeric 1 NA 18.55 18.55 NA NA 27.75 27.75 NA MODO Mesic 3 16.20 7.2 22.35 4.60 6.48 4.03 8.92 2.45 MODO Xeric 2 13.28 4.83 21.73 8.45 7.49 1.18 19.78 6.14 NOMO Mesic 2 4.70 1.32 8.07 3.38 0.14 0.00 0.27 0.14 OCWA Mesic 1 NA 1.13 1.13 NA NA 0.00 0.00 NA RODO Mesic 4 12.59 1.35 23.13 6.09 28.74 25.47 30.67 1.16 SPTO Xeric 1 NA 1.47 1.47 NA NA 20.90 20.90 NA WCSP Mesic 5 1.40 0.07 3.45 0.59 34.29 0.28 105.43 20.76 WCSP Xeric 4 7.36 1 13.7 3.46 38.41 1.30 87.67 18.29 WWDO Xeric 2 11.12 2.32 19.92 8.80 23.00 22.80 23.20 0.20
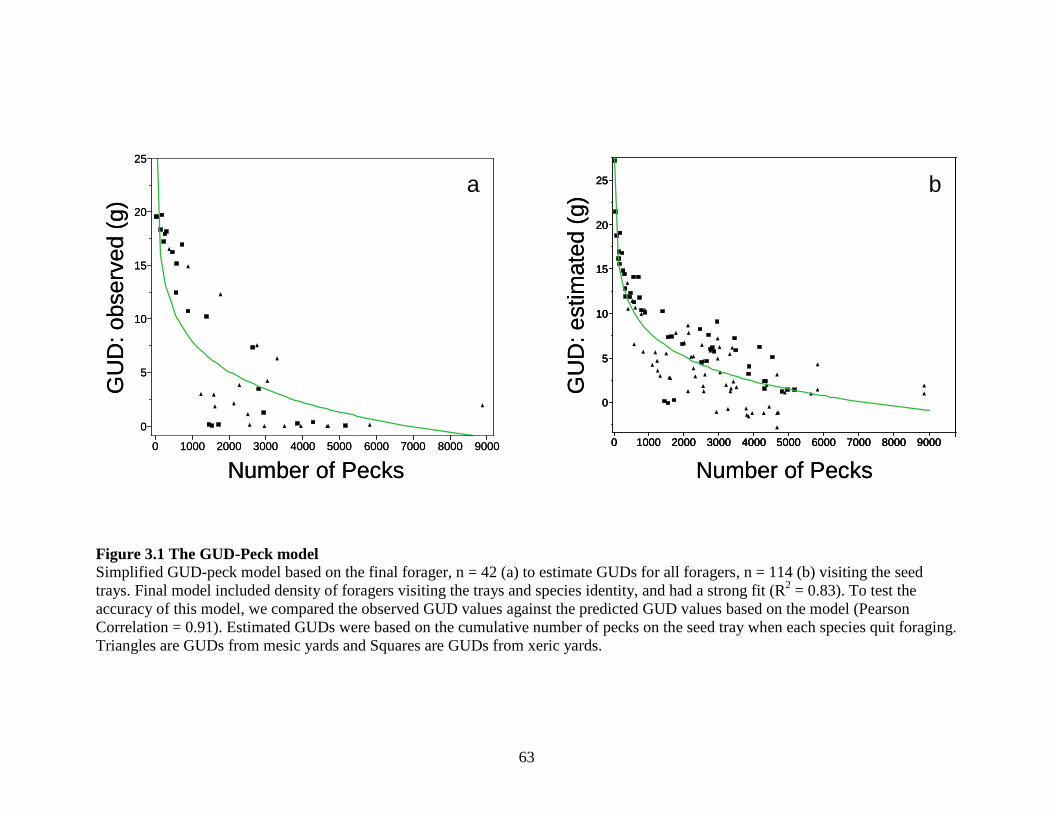
63
0
5
10
15
20
25
0 1000 2000 3000 4000 5000 6000 7000 8000 9000
GU
D: o
bser
ved
(g)
Number of Pecks
0
5
10
15
20
25
0 1000 2000 3000 4000 5000 6000 7000 8000 9000
GU
D: e
stim
ated
(g)
Number of Pecks
a b
0
5
10
15
20
25
0 1000 2000 3000 4000 5000 6000 7000 8000 9000
GU
D: o
bser
ved
(g)
Number of Pecks
0
5
10
15
20
25
0 1000 2000 3000 4000 5000 6000 7000 8000 9000
0
5
10
15
20
25
0 1000 2000 3000 4000 5000 6000 7000 8000 9000
GU
D: e
stim
ated
(g)
Number of Pecks
a b
Figure 3.1 The GUD-Peck model Simplified GUD-peck model based on the final forager, n = 42 (a) to estimate GUDs for all foragers, n = 114 (b) visiting the seed trays. Final model included density of foragers visiting the trays and species identity, and had a strong fit (R2 = 0.83). To test the accuracy of this model, we compared the observed GUD values against the predicted GUD values based on the model (Pearson Correlation = 0.91). Estimated GUDs were based on the cumulative number of pecks on the seed tray when each species quit foraging. Triangles are GUDs from mesic yards and Squares are GUDs from xeric yards.
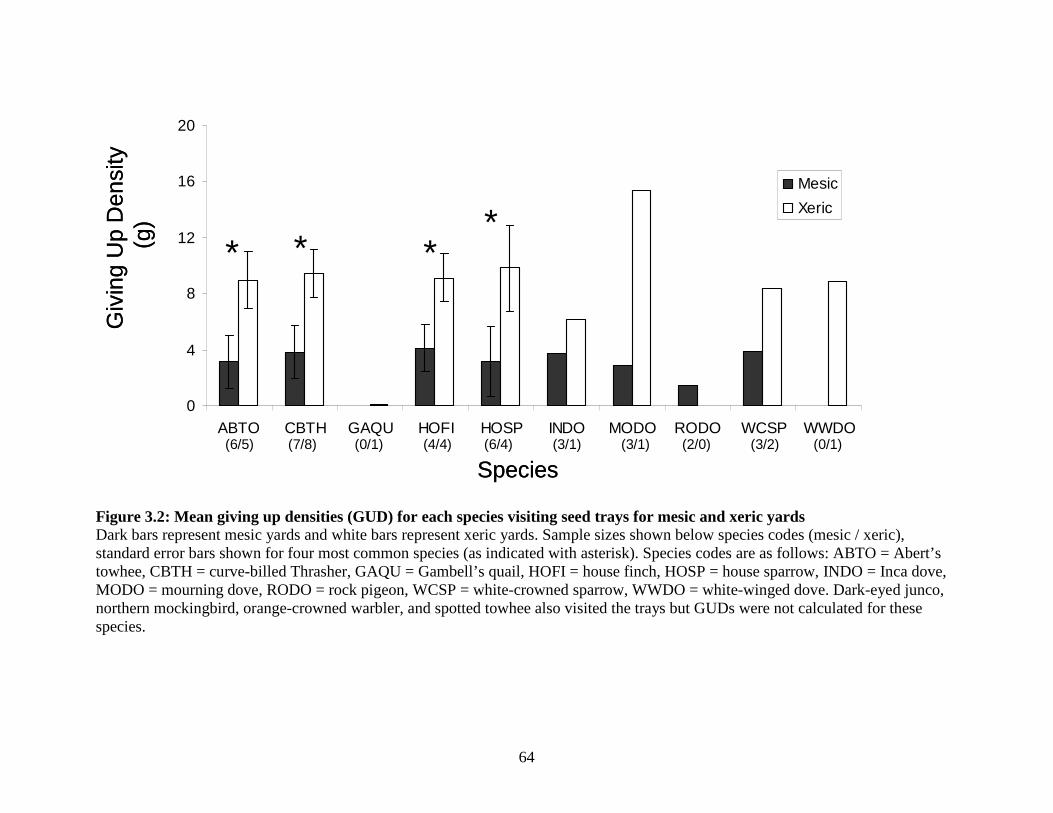
64
0
4
8
12
16
20
ABTO CBTH GAQU HOFI HOSP INDO MODO RODO WCSP WWDO
Mesic
Xeric
Giv
ing
Up
Den
sity
(g
)
Species
* **
*
(6/5) (7/8) (4/4) (6/4) (3/1) (3/1) (2/0) (3/2) (0/1)(0/1)
0
4
8
12
16
20
ABTO CBTH GAQU HOFI HOSP INDO MODO RODO WCSP WWDO
Mesic
Xeric
Giv
ing
Up
Den
sity
(g
)
Species
* **
*
(6/5) (7/8) (4/4) (6/4) (3/1) (3/1) (2/0) (3/2) (0/1)(0/1)
Figure 3.2: Mean giving up densities (GUD) for each species visiting seed trays for mesic and xeric yards Dark bars represent mesic yards and white bars represent xeric yards. Sample sizes shown below species codes (mesic / xeric), standard error bars shown for four most common species (as indicated with asterisk). Species codes are as follows: ABTO = Abert’s towhee, CBTH = curve-billed Thrasher, GAQU = Gambell’s quail, HOFI = house finch, HOSP = house sparrow, INDO = Inca dove, MODO = mourning dove, RODO = rock pigeon, WCSP = white-crowned sparrow, WWDO = white-winged dove. Dark-eyed junco, northern mockingbird, orange-crowned warbler, and spotted towhee also visited the trays but GUDs were not calculated for these species.
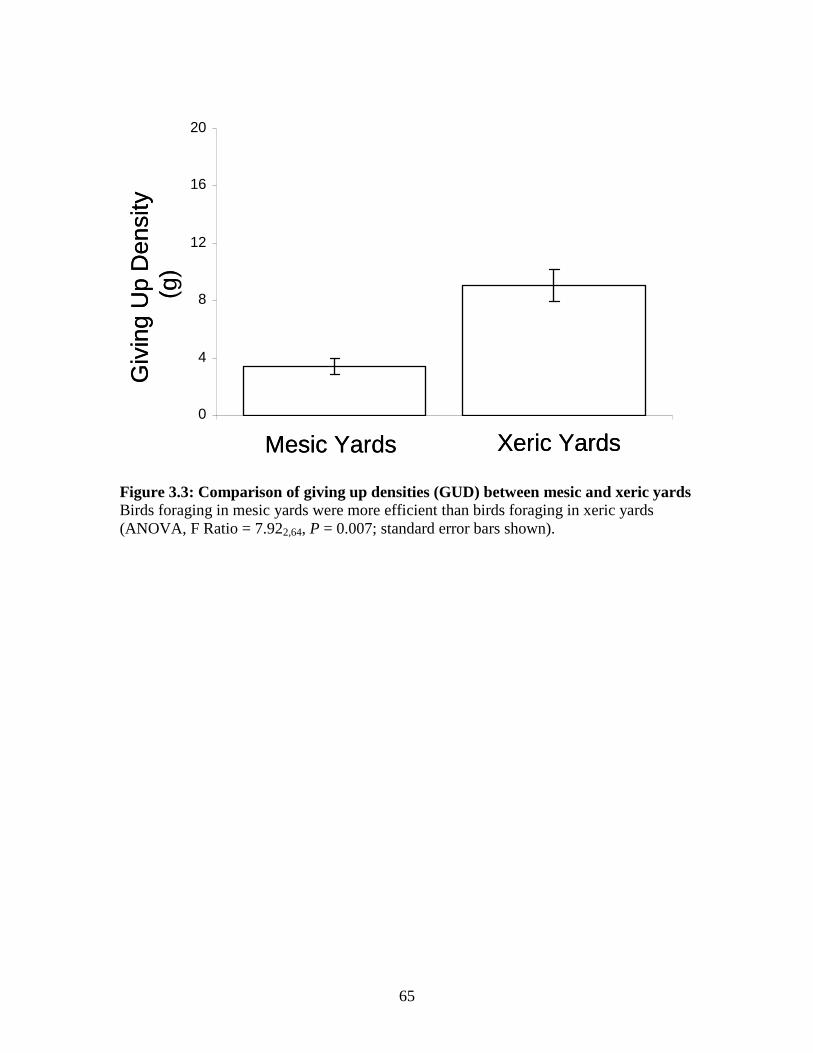
65
0
4
8
12
16
20
Mesic Yards Xeric Yards
Giv
ing
Up
Den
sity
(g
)
0
4
8
12
16
20
Mesic Yards Xeric Yards
Giv
ing
Up
Den
sity
(g
)
Figure 3.3: Comparison of giving up densities (GUD) between mesic and xeric yards Birds foraging in mesic yards were more efficient than birds foraging in xeric yards (ANOVA, F Ratio = 7.922,64, P = 0.007; standard error bars shown).
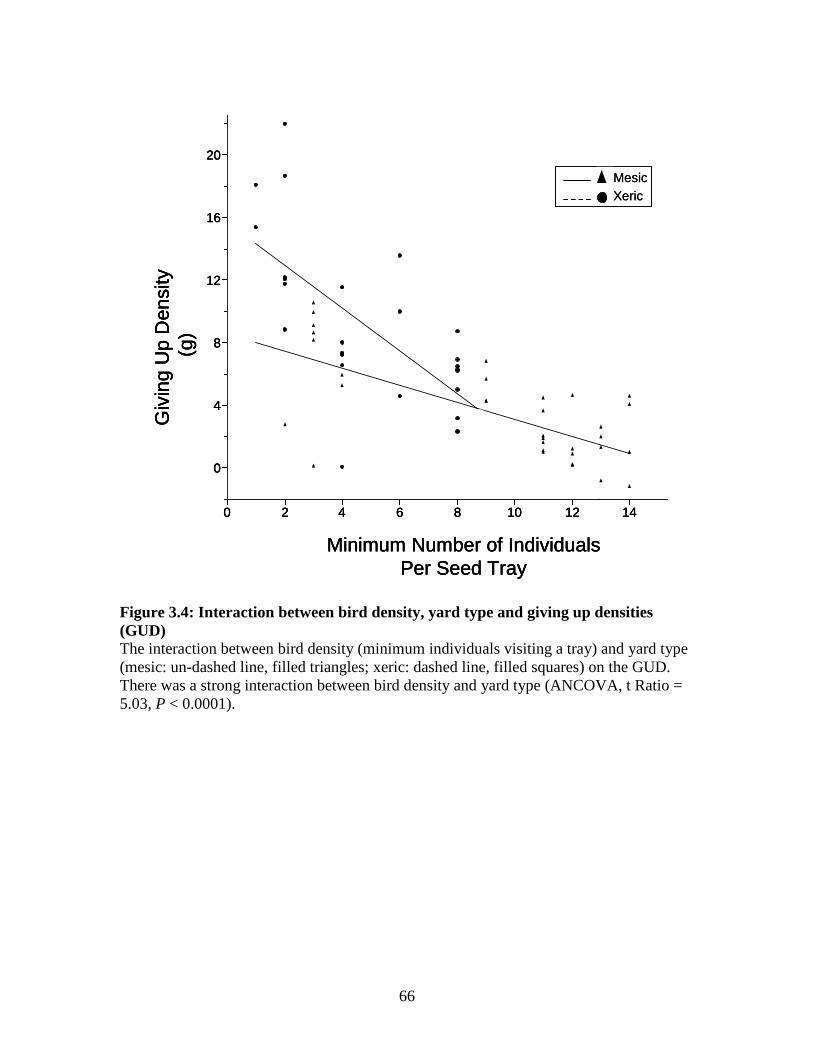
66
0
4
8
12
16
20
0 2 4 6 8 10 12 14
Minimum Number of IndividualsPer Seed Tray
Giv
ing
Up
Den
sity
(g
)MesicXeric
0
4
8
12
16
20
0 2 4 6 8 10 12 14
Minimum Number of IndividualsPer Seed Tray
Giv
ing
Up
Den
sity
(g
)MesicXeric
0
4
8
12
16
20
0 2 4 6 8 10 12 14
Minimum Number of IndividualsPer Seed Tray
Giv
ing
Up
Den
sity
(g
)MesicXericMesicXeric
Figure 3.4: Interaction between bird density, yard type and giving up densities (GUD) The interaction between bird density (minimum individuals visiting a tray) and yard type (mesic: un-dashed line, filled triangles; xeric: dashed line, filled squares) on the GUD. There was a strong interaction between bird density and yard type (ANCOVA, t Ratio = 5.03, P < 0.0001).
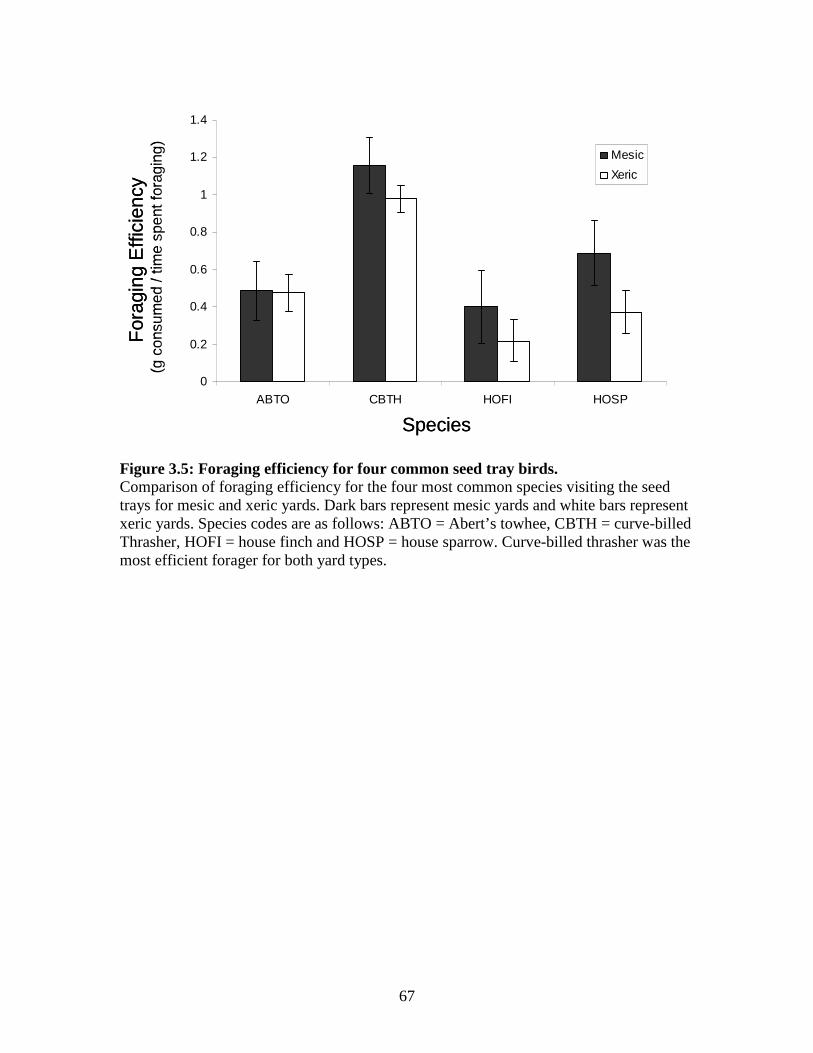
67
0
0.2
0.4
0.6
0.8
1
1.2
1.4
ABTO CBTH HOFI HOSP
Mesic
Xeric
For
agin
g E
ffici
ency
(g
con
sum
ed /
time
spen
t for
agin
g)
Species
0
0.2
0.4
0.6
0.8
1
1.2
1.4
ABTO CBTH HOFI HOSP
Mesic
Xeric
For
agin
g E
ffici
ency
(g
con
sum
ed /
time
spen
t for
agin
g)
Species
Figure 3.5: Foraging efficiency for four common seed tray birds. Comparison of foraging efficiency for the four most common species visiting the seed trays for mesic and xeric yards. Dark bars represent mesic yards and white bars represent xeric yards. Species codes are as follows: ABTO = Abert’s towhee, CBTH = curve-billed Thrasher, HOFI = house finch and HOSP = house sparrow. Curve-billed thrasher was the most efficient forager for both yard types.
68
CHAPTER 4 HOMEOWNER ASSOCIATIONS AS A VEHICLE FOR PROMOTING URBAN
BIODIVERSISTY
4.1 Introduction
In 2008, the United States became a suburban nation. More than half the
population lives in suburban and urban areas, and this number is expected to exceed 80%
by the year 2050 (United Nations Population Fund 2007). Suburbanization profoundly
transforms landscapes, converting relatively pristine rural lands into housing
developments to support this burgeoning suburban population. One of the consequences
of this process of suburbanization is the loss of essential wildlife habitat. This represents
one of the leading causes of biodiversity loss (Czech et al. 2000). Conservation
developments offer an innovative approach to reconcile this tension between new, ex-
urban development and biodiversity by identifying and protecting the ecological integrity
of a property, and by designating a significant portion (usually > 50%) of the property as
open space (Arendt 1996; Milder 2007; Pejchar et al. 2007). Properly executed
conservation developments require careful planning of biophysical design as well as the
creation of monitoring and management regimes. Given that 80% of new residential
development in the past ten years has occurred in rural lands (Pejchar et al. 2007),
conservation developments constitute a novel solution to rural to urban land conversions
in areas extremely sensitive to development.
69
But what is the potential to extend the principles of conservation development to
suburban and urban areas already developed? Retrofitting existing neighborhoods to
advance the conservation of urban biodiversity requires confronting several challenges.
For many of these neighborhoods, the amount of land designated as open space is
significantly less than the amount designated for yards and gardens. The patches of open
space that do exist may be too small or discontinuous to achieve biodiversity goals.
Given the scarcity of open space and the disproportionate area of private yards, the
strategies deployed in conservation developments do not consider yards to be a
conservation priority (Hostetler & Drake 2009), and therefore may require revision in
retrofitting existing developments.
Recently, the conservation value of yards and gardens has emerged as a priority in
research focused on residential landscapes in ecology, geography, and related disciplines
(Cooper et al. 2007; Goddard et al. 2010; Larson et al. 2009). While individual lots may
be small and fragmented patches, when managed collectively, yards and gardens may
contribute to urban biodiversity by providing habitat connectivity through cities (Rudd et
al. 2002).The approach humans use to manage yards and gardens is often at odds with
natural processes and ecological function (Nassauer 1995). For example, humans remove
or replace native plant communities with exotic trees, lawns, and impervious surfaces.
This in turns affects the animal communities, rendering some residential areas unsuitable
for native species (Burghardt et al. 2008; Lerman & Warren 2011). In addition to the
alteration of the vegetation, yards and gardens require a high level of maintenance and
exhibit orderliness and uniformity (Nassauer 1995; Franzese 2005). This mismatch
between management practices and natural ecological processes can be attributed to
70
management goals associated with residential land uses (i.e. aesthetics) that are distinct
from conservation priorities.
Homeowner Associations (HOA) present a unique opportunity for coordinated
management to promote urban biodiversity. With its legally enforceable rules and
regulations documented in Covenants Conditions and Restrictions (CCR) and additional
landscaping guidelines documents, HOAs constitute an emergent institutional actor
driving landscaping and management decisions. Typically, residential landscapes lack an
institutional mechanism operating at a relevant scale for cohesive management. Therefore
coordinated biodiversity management is not always feasible. However, communities with
HOA management may be more compatible since they typically govern multiple homes
within a master-planned community rather than an individual lot (McKenzie 1996),
although the landscaping rules and regulations could either hinder or improve conditions
for suburban biodiversity. For example, if an HOA neighborhood requires native plants
as part of the landscape palette, then this measure could improve conditions for native
birds (Lerman & Warren 2011).
In this study, I explore the potential of Homeowner Associations as a vehicle for
improving urban biodiversity. First, I describe HOA features, regulatory factors and the
management organization. Then I present research from Phoenix, AZ. Here I compared
bird, plant and arthropod diversity between neighborhoods with and without HOAs. I
evaluated common features in CCRs, and linked them to animal communities. I conclude
with recommendations on how HOA neighborhoods might further improve biodiversity
by retrofitting existing residential landscapes to enhance the available habitat.
71
4.1.1 Homeowner Associations
Homeowner Associations are “common interest organization[s] to which all the
owners of lots in a planned community…must belong” (AZ Brief 2010). The popularity
of HOAs is a recent phenomenon. In the 1960s, about 500 neighborhoods belonged to an
HOA. By 1999, this number increased to 231,000 (Community Associations Institute
1999). Currently, more than 60 million Americans belong to planned communities,
governed by an HOA. Many HOAs are located in the Sunbelt regions of the United States
(e.g. Arizona, California, Florida, and Nevada); virtually all new developments use
HOAs. This trend reflects attributes of the Sunbelt region such as large and relatively
inexpensive tracts of land and a pro-growth political climate (McKenzie 1996) and is
reinforced by local zoning codes (McKenzie 2003). Within the city of Phoenix, AZ, not
including the metropolitan area, nearly 1700 single-family residential subdivisions have
HOAs (V. K. T., unpublished data). HOA developments include condominiums, single,
and multi-family homes, gated and non-gated communities, and span socio-economic
classes (Ben-Joseph 2004). The HOA developments range in size from small clusters of
two or more houses to large, city-scale developments.
The proliferation of HOAs is largely driven by espoused mutual benefits for
developers to maintain the integrity of their developments for perpetuity, to decrease the
burden for local governments in the provisioning of services and amenities, and for
homeowners to protect values. Large-scale developers enjoy certain relaxed regulations
because of the privatization of these subdivisions, which often leads to innovative designs
(Ben-Joseph 2004). For example, cluster developments have higher housing densities,
smaller lots, and a more efficient utility layout. Therefore, more units are built and sold

72
on a parcel of land, benefiting the developer (McKenzie 1998). Furthermore, much of the
infrastructure (e.g. sewer, trash collection, streets) is provided by the HOA, thus relieving
funds from local governance (McKenzie 1998). The HOA has the capacity to protect
property value (Ben-Joseph 2004). LaCour and Malpezzi (2001) tracked housing values
in St. Louis, MO between 1979 and 1999. They found that all else being equal, homes
belonging to an HOA command significantly higher property values, as much as 17%
more. The HOAs enforce the CCR through fines to the homeowner for not adhering to
HOA guidelines. For example, when a homeowner adheres to landscaping aesthetics, it
can increase housing value by as much as 20% (Hardy et al. 2000), and curb appeal can
be a deciding factor for potential home buyers (Martin et al. 2003).
4.1.2 Management and Regulation of HOAs
HOAs are similar to municipal governments in their institutional structure and
functioning (McKenzie 1996) but distinct in their status as non-profit businesses and lack
of constitutional rights for members (McCabe 2005). A developer hires a lawyer and/or
management company to draft a CCR that lays out the rules and regulations for future
residents (McCabe 2005). The CCR calls for the creation of an HOA comprised of a
management company and board members elected from the community and in some
instances, the developer may retain influence by designating a percentage of the vote to
them (McKenzie 1996). Together, the management company and the board members are
responsible for property management and enforcing the CCRs by collecting dues and
fines. Yard maintenance may be outsourced to landscaping companies or the
responsibility of the homeowner, who must do so in accordance with the CCRs and
73
landscaping guidelines. Homeowners that do not comply are subject to fines and,
ultimately, eviction (McKenzie 1996). Currently, the only mechanism for regulating the
HOA is through litigation and with the exception of a few notable examples (e.g., the
Supreme Court decided that HOAs cannot restrict homeowner from installing solar
panels; Pike 2009) court decisions usually side with the HOA.
4.2 Materials and Methods
4.2.1 Study site
My study from Phoenix, AZ investigated the relationship between HOAs and
biodiversity, and was part of the Central Arizona-Phoenix Long-Term Ecological
Research (CAP LTER) project. I focused on 39 of the 204 long-term monitoring plots, all
located in residential land-uses. These sites also coincided with the Phoenix Area Social
Survey (PASS) neighborhoods within the CAP LTER study site (see Harlan et al. 2009;
Lerman & Warren 2011 for site selection details). Phoenix has experienced dramatic
land-use and land-cover change over the past 20 years as it has become one of the fastest
growing American cities (US Census 2000). During the housing boom of the 1990s and
early 2000s, desert and agricultural fields were converted to residential developments at
an approximate rate of 0.4 ha per hour (Grimm & Redman 2004). With the onslaught of
large housing developments, the popularity of planned communities governed by HOAs
also increased within the Phoenix metropolitan area (Martin et al. 2003).
74
4.2.2 Bird, Plant and Arthropod Surveys
At the long-term monitoring plots I surveyed birds (2006- 2008, n = 39), plant
communities (2005, n = 35), and vegetation-dwelling arthropods (2005, n = 34). Bird
surveys consisted of 15 minute point counts within a 40 m radius (see Lerman & Warren
2011 for bird survey details). The plant and arthropod surveys were conducted at the
same point but encompassed a 30 m radius. I identified every woody and non-woody
plant to the species level (see Walker et al. 2009 for plant survey details). Arthropods
were sampled from the dominant woody vegetation by shaking three branches in a sweep
net and collected in jars containing 70% ethanol. The arthropods were sorted to
morphologically similar groups, and identified to order or the lowest taxonomic level
(Hanula et al. 2009) to calculate a more accurate diversity index. I then calculated
Shannon diversity indices for the three groups (other diversity indices produced similar
results) for each monitoring location. To determine whether a monitoring site was located
in an HOA neighborhood, I used a map that identified housing developments throughout
the Phoenix metropolitan area (Maricopa County Assessor’s Office, 2008) with a
Geographic Information System (ArcMap 9.2; ESRI 2006). A housing development
received an HOA classification when a CCR was present (V. Turner, personal
communication). Roughly half of all monitoring sites belonged to an HOA (birds: n = 19,
plants: n = 18, arthropods: n = 17; Fig. 4.1).
4.2.3 Statistical Analysis
I used t-tests to compare the Shannon indices for native bird diversity, the plant
diversity, and arthropod diversity between neighborhoods with and without an HOA.
75
Since household income, housing age, and distance to wildlands influence urban
biodiversity (Hope et al. 2003; Melles 2005; Lerman & Warren 2011), I first tested
whether these factors differed between neighborhoods with and without an HOA.
For the HOA housing developments, I coded the landscape form and management
practices based on the CCR. I reviewed each HOA document and searched for the
components of CCRs that I predicted to have the greatest influence on biodiversity. These
variables included vegetation and pest management (application of pesticides, pruning,
and weed removal), plant species composition, water management, physical structures
(e.g. light posts, signs, trash cans), and nuisances (e.g. loud noises, livestock). I assigned
each variable a binary code: was the condition required or not required. Then, focusing
on the vegetation and pest management variables, I classified a development as either
requiring all, none, or half of the activities. I used the nonparametric multi-response
permutation procedures (MRPP) to test whether bird species composition differed
between these landscaping activity classifications. For this analysis, I standardized the
data and reduced the number of bird species in the analysis by only including species
recorded at 10% or more of the monitoring locations. Multivariate analyses benefit from
deleting rare species since species with few records are often not accurately placed in
ecological space (McCune & Grace 2002). I used the Bray Curtis distance measurement
and conducted 999 permutations. I conducted my analyses with JMP 8 statistical software
and R (2008) using the vegan package (Oksanen et al. 2009).
76
4.3 Results
Household income, housing age, and distance to wildlands did not differ between
neighborhood types (t-test: t = 1.051,37, P = 0.30; t = 0.881,37, P = 0.38; t = -0.961,37, P =
0.34, respectively). Neighborhoods belonging to a HOA had significantly greater plant
diversity than neighborhoods not belonging to a HOA (t-test: t = 2.481,32, P = 0.02, Fig.
4.2). Native bird diversity differed between the two groups of neighborhoods, and
showed a trend toward increased diversity in neighborhoods with HOAs (t-test: t =
1.931,37, p = 0.0617). When I excluded one neighborhood with extremely low native bird
diversity, the relationship became significant (t-test: t = 2.611,36, p = 0.01; Fig. 4.2). The
excluded neighborhood was recently developed from an agricultural field, suggesting that
land use legacy might have a disproportional influence on the bird composition; many of
the birds in this neighborhood were more typical of agricultural fields. Regardless, the
study strongly suggested a relationship between both plant and native bird diversity.
Arthropod diversity did not differ between the two neighborhood types (t-test: t =
0.121,31, P = 0.9; Fig. 4.2).
Management practices differed across neighborhoods (Fig. 4.3). Five
neighborhoods required weeding, pruning, pest removal and disease control; six
neighborhoods did not require these activities. The remaining eight neighborhoods
grouped weeding and pruning, and pest removal and disease control; some
neighborhoods required the former but not the latter, and vice versa. I found no obvious
patterns between the bird composition and the specific landscaping activities (MMRP,
Chance corrected within-group agreement A: 0.02203, delta = 0.4036, P = 0.15).
77
4.4 Discussion
An active and enforceable landscape management plan might explain why native
bird diversity was greater in neighborhoods with an HOA even though management
regimes varied between neighborhoods and these regimes did not appear to associate with
bird species composition. Here I present two possible, not mutually exclusive hypotheses,
one from a socio-ecological perspective and the other deriving from ecological theory, to
suggest how management might explain why bird diversity was elevated in HOA
neighborhoods.
4.4.1 Socio-ecology and landscape management
Institutional theory suggests that both social and biophysical factors influence
sustainable resource management in socio-ecological systems (Ostrom 2009). For
example, the HOA with its well-defined boundaries, property rights, and a focus on
landscaping practices, is in a sense, the resource system. The resource units are bird,
arthropod and plant diversity. The operational rules and sanctions for enforcement guided
by the CCR represent the governance system, and the users of the natural resource
include homeowners (Ostrom 2009). An HOA typically governs small, well-defined
clusters of properties, provides a credible source of governance and deploys operation
rules through the CCR. Furthermore, HOAs have the legal authority to sanction rules
through fines. Studies have demonstrated that forest management benefits from regular
monitoring and sanctioning of the rules (Coleman & Steed 2006). In a meta-study of
forestry practices, Pagdee et al. (2006) found a global trend that “effective enforcement”
significantly influenced successful community forestry. Homeowners belonging to an

78
HOA actively monitor neighborhood landscaping activities and ensure neighbors comply
with the CCR. This might lead to better landscape management, and possibly explains the
increased diversity in the HOA neighborhood. As a caveat, my study did not address
whether or not landscaping guidelines were enforced. I recommend future studies
compare CCR documents with existing landscaping practices to determine the level of
compliance for each HOA. Nevertheless, institutional theory provides an entry point to
explain the relationship between HOA governance and environmental outcomes.
4.4.2 Ecological theory and landscape management
Alternatively, the differences between neighborhoods with and without HOAs
may be due to differences in disturbance regimes. The Intermediate Disturbance
Hypothesis states that diversity peaks when a disturbance is neither too scarce or
frequent, or too mild or intense (Connell 1978). The process of urbanization has been
likened to a disturbance (McKinney 2006) and the disturbance intensity varies along an
urban rural gradient. For example, Marzluff (2005) found that in extremely urbanized
areas, synanthropic species (i.e. birds that benefit from and associate with humans),
dominated the Seattle, Washington bird community. However, at moderate levels of
urbanization, e.g. residential land uses with a proportion of the natural vegetation still
persisting, a mixture of native forest species mixed with the synanthropic species, and
thus, maximized diversity along this portion of the gradient. Because of the CCR, HOA
neighborhoods require active, predictable and consistent landscape maintenance. The
rapidity of human interventions in landscaping, e.g. weed removal, pruning and
replacement of diseased plants, provides disturbance at a very localized scale to the HOA
79
neighborhoods, and might have a strong link to the structuring of animal communities
(Faeth et al. 2010). Neighborhoods not belonging to an HOA might have active
management plans, including common landscaping practices found in HOA
neighborhoods, but the management has greater variability and lacks sanctions
for enforcement.
In addition to the above hypotheses, the increased plant diversity in HOA
neighborhoods might also contribute to the more diverse bird community.
Residents belonging to an HOA neighborhood are exposed to a wider variety of
plants and perhaps, prefer to include “one of everything” in their yards (Faeth et
al. 2010), thus contributing to the higher plant diversity in HOA neighborhoods. I
conducted a post hoc analysis to test how plant richness differed between the
two neighborhood types. HOA neighborhoods tended to have higher plant richness (t-
test, t = 1.921,33, P = 0.06). The richer plant communities might support greater numbers
of individual birds and species (Luck & Smallbone 2010).
My study failed to find a link between arthropod diversity and the presence of an
HOA. Most likely, the sampling design might have been too small scale (surveying
arthropods from one plant within a 30 m radius of the sampling location) to accurately
reflect the arthropod community throughout a neighborhood. Nonetheless, the inclusion
of these data provides additional insight regarding how other taxa respond to residential
developments. The results might also suggest the scheduling of landscaping activities
might not be associated with arthropod diversity. Perhaps HOA neighborhoods were no
better or worse than those in non HOA neighborhoods. For example, removing leaf litter,
regardless of frequency, could have detrimental effects for arthropods. While to my
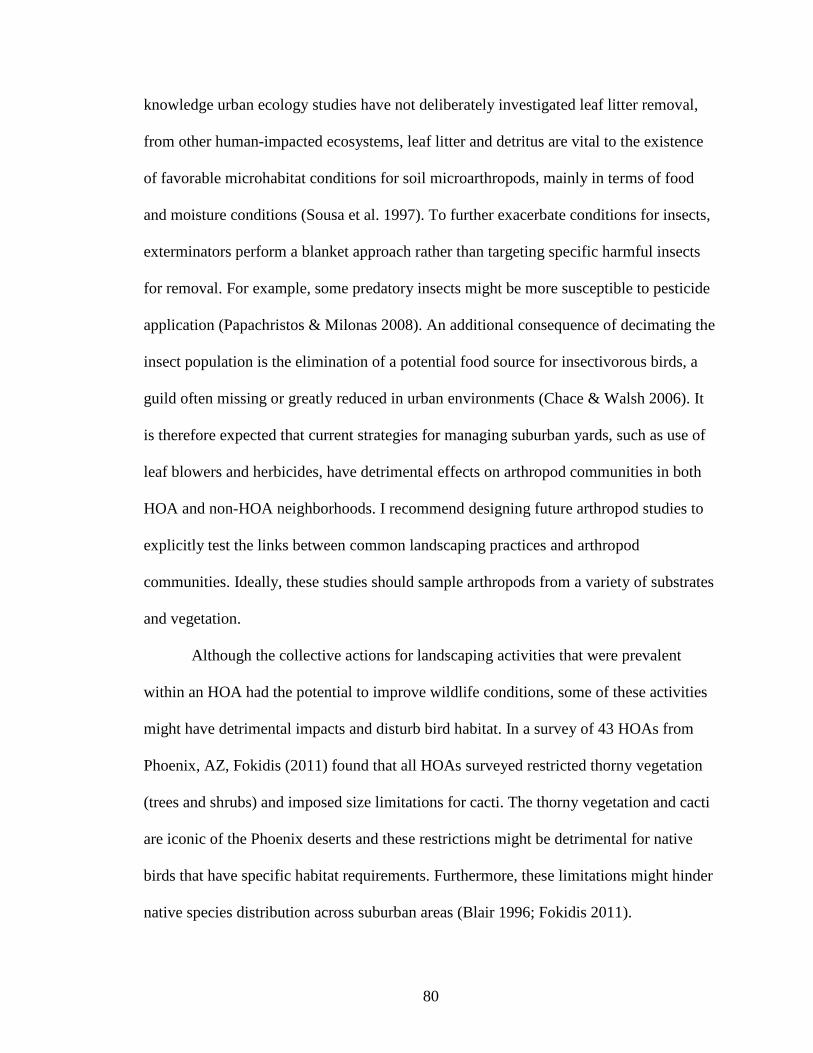
80
knowledge urban ecology studies have not deliberately investigated leaf litter removal,
from other human-impacted ecosystems, leaf litter and detritus are vital to the existence
of favorable microhabitat conditions for soil microarthropods, mainly in terms of food
and moisture conditions (Sousa et al. 1997). To further exacerbate conditions for insects,
exterminators perform a blanket approach rather than targeting specific harmful insects
for removal. For example, some predatory insects might be more susceptible to pesticide
application (Papachristos & Milonas 2008). An additional consequence of decimating the
insect population is the elimination of a potential food source for insectivorous birds, a
guild often missing or greatly reduced in urban environments (Chace & Walsh 2006). It
is therefore expected that current strategies for managing suburban yards, such as use of
leaf blowers and herbicides, have detrimental effects on arthropod communities in both
HOA and non-HOA neighborhoods. I recommend designing future arthropod studies to
explicitly test the links between common landscaping practices and arthropod
communities. Ideally, these studies should sample arthropods from a variety of substrates
and vegetation.
Although the collective actions for landscaping activities that were prevalent
within an HOA had the potential to improve wildlife conditions, some of these activities
might have detrimental impacts and disturb bird habitat. In a survey of 43 HOAs from
Phoenix, AZ, Fokidis (2011) found that all HOAs surveyed restricted thorny vegetation
(trees and shrubs) and imposed size limitations for cacti. The thorny vegetation and cacti
are iconic of the Phoenix deserts and these restrictions might be detrimental for native
birds that have specific habitat requirements. Furthermore, these limitations might hinder
native species distribution across suburban areas (Blair 1996; Fokidis 2011).
81
4.5 Management implications: retrofitting HOAs
The trend toward greater bird diversity in HOA neighborhoods suggests a
potential partner for conservation biologists and land managers. A conservation focus
aimed at residential developments could further maximize habitat conditions for native
wildlife and improve the conservation value of urban ecosystems. HOAs have an
institutional framework in place to assist with enforcement of landscaping activities at a
scale larger than individual parcels but smaller than a municipality. This scale is a better
match for bird conservation efforts (Warren et al. 2008) and other urban wildlife. In this
section, I propose that HOAs explore ways to further improve the environmental quality
of residential developments. Although my study is from an arid region, I present general
guidelines to help retrofit HOA neighborhoods by integrating ecological landscaping
features at a neighborhood scale from the Sustainable Sites Initiative (SSI; 2009). HOAs
provide regularity in landscape management (i.e. disturbance) and incorporating the SSI
may add some intentionality to the disturbance regime. In addition, HOAs may capitalize
on the institutional features advocated by Ostrom’s (2009) sustainable management
framework by incorporating SSI features.
4.5.1 Sustainable Sites Initiative
The Sustainable Sites Initiative is a certification system that aims to guide the
creation and implementation of sustainable landscapes. Modeled after the LEED green
building certification system, the SSI is based on a point system. The guidelines identify
82
specific sustainable landscape features from the design, construction and maintenance
phase that help promote ecosystem services. Many of these features can be implemented
in the post construction phase of a development and roughly half of all available points
are applicable for current neighborhoods belonging to an HOA. I highlight management
features shared by a CCR and the SSI (Fig. 4.4). Common features include maintenance
activities, plant species, and hydrology. I describe the goals, provide examples of specific
landscaping activities, and then identify some of the benefits for both people and
biodiversity in adapting the SSI.
Both the CCR and the SSI focus on landscaping activities and the CCR could
adapt the alternative landscaping methods of the SSI to improve conditions for wildlife.
The CCR describes specific landscape activities that must occur within a specified
timeframe, and is enforced through fines. Likewise, the SSI provides methods for
managing the yard and these alternative methods are awarded with points towards
sustainability status. For example, the current method of pruning shrubs and bushes in
Phoenix HOA neighborhoods radically alters the natural structure of the plant (Fig. 5). To
adhere with SSI guidelines the CCR could limit the amount of biomass trimmed per
maintenance session, leave the vegetation on site, and accrue points for SSI status.
Studies from coffee plantations in Latin America concluded that pruned coffee plants
supported lower bird diversity (Greenburg et al. 1997). The authors suggested that the
extensive pruning reduced plant size and flowering opportunities, which ultimately
reduced resources for nectarivores. In a study from Australia, Stagoll and colleagues
(2010) measured various habitat structures and linked these factors to woodland bird
communities. They found that the presence of leaf litter increased species richness by
83
more than 30%. The leaf litter provided essential substrates for ground foraging birds
partly due to the ability for leaf litter to support a rich arthropod community. Reducing
pruning and leaving vegetation on site also benefits the homeowner by presenting cost
and time savings for landscaping activities. Morris and Bagby (2008) compared natural
lawn and garden care with more traditional pesticide and fertilizer based practices in
Seattle, Washington. The study addressed the purchasing costs and disposal of pesticides
and fertilizers, irrigation costs, and runoff minimization. They concluded that a household
could save as much as $75 per year when the homeowner adopts a natural lawn care
practice. Although these practices do not directly mimic the SSI features, they suggest
ways that a HOA can cut costs by adapting more sustainable landscaping.
The institutional features of the SSI are comparable to those found in HOAs. The
HOA includes a document (CCR) for enforcing certain rules and restrictions for the way
a homeowner maintains their property. The homeowner must abide by the rules or suffer
fines and possible eviction. Ideally, this helps stabilize property values through yard
upkeep and maintenance. The detailed point system of the SSI clearly states the
requirements needed for SSI status. If the requirements are not met, or the upkeep lags,
then SSI status will be revoked. This ability to enforce sanctions (Ostrom & Nagendra
2006) might enable the SSI to promote greater levels of biodiversity in HOA
neighborhoods.
I recognize the many barriers associated with implementing such changes to
existing HOA neighborhoods. The CCR is a legally binding document. Changes and
alterations to the landscape guidelines requires voting by the HOA board, in some
instances could require a lawyer to draft a new CCR, and finally, the HOA might need to
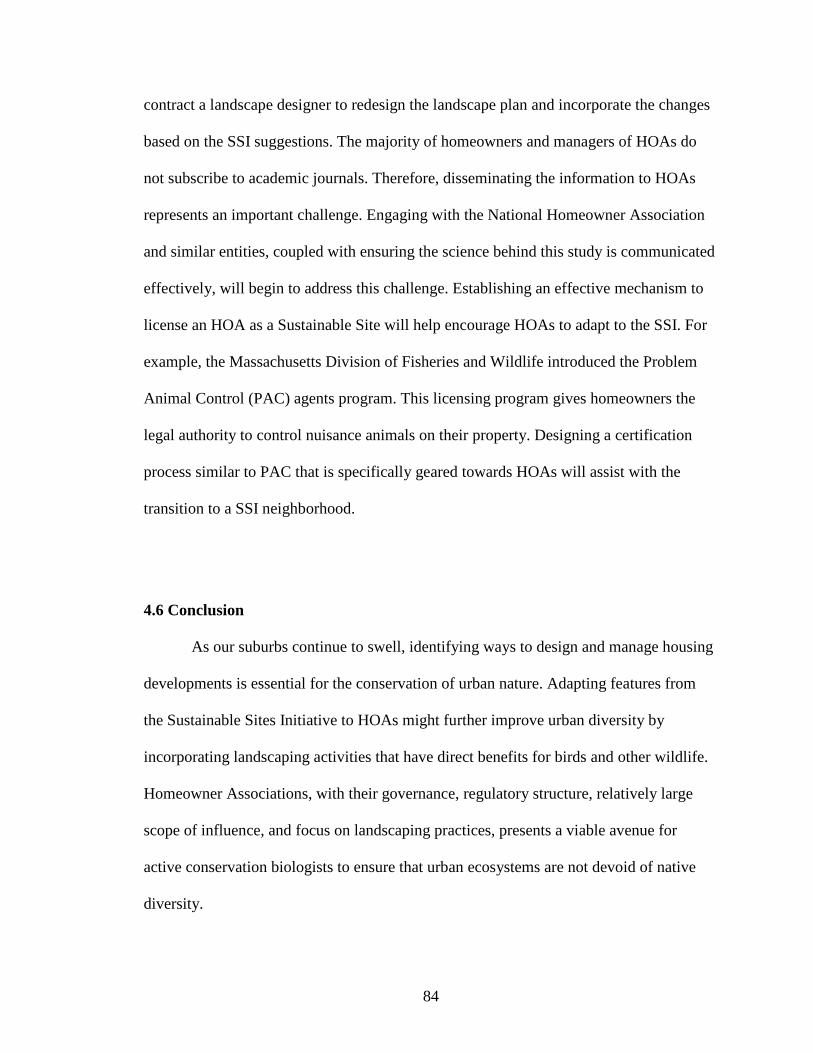
84
contract a landscape designer to redesign the landscape plan and incorporate the changes
based on the SSI suggestions. The majority of homeowners and managers of HOAs do
not subscribe to academic journals. Therefore, disseminating the information to HOAs
represents an important challenge. Engaging with the National Homeowner Association
and similar entities, coupled with ensuring the science behind this study is communicated
effectively, will begin to address this challenge. Establishing an effective mechanism to
license an HOA as a Sustainable Site will help encourage HOAs to adapt to the SSI. For
example, the Massachusetts Division of Fisheries and Wildlife introduced the Problem
Animal Control (PAC) agents program. This licensing program gives homeowners the
legal authority to control nuisance animals on their property. Designing a certification
process similar to PAC that is specifically geared towards HOAs will assist with the
transition to a SSI neighborhood.
4.6 Conclusion
As our suburbs continue to swell, identifying ways to design and manage housing
developments is essential for the conservation of urban nature. Adapting features from
the Sustainable Sites Initiative to HOAs might further improve urban diversity by
incorporating landscaping activities that have direct benefits for birds and other wildlife.
Homeowner Associations, with their governance, regulatory structure, relatively large
scope of influence, and focus on landscaping practices, presents a viable avenue for
active conservation biologists to ensure that urban ecosystems are not devoid of native
diversity.
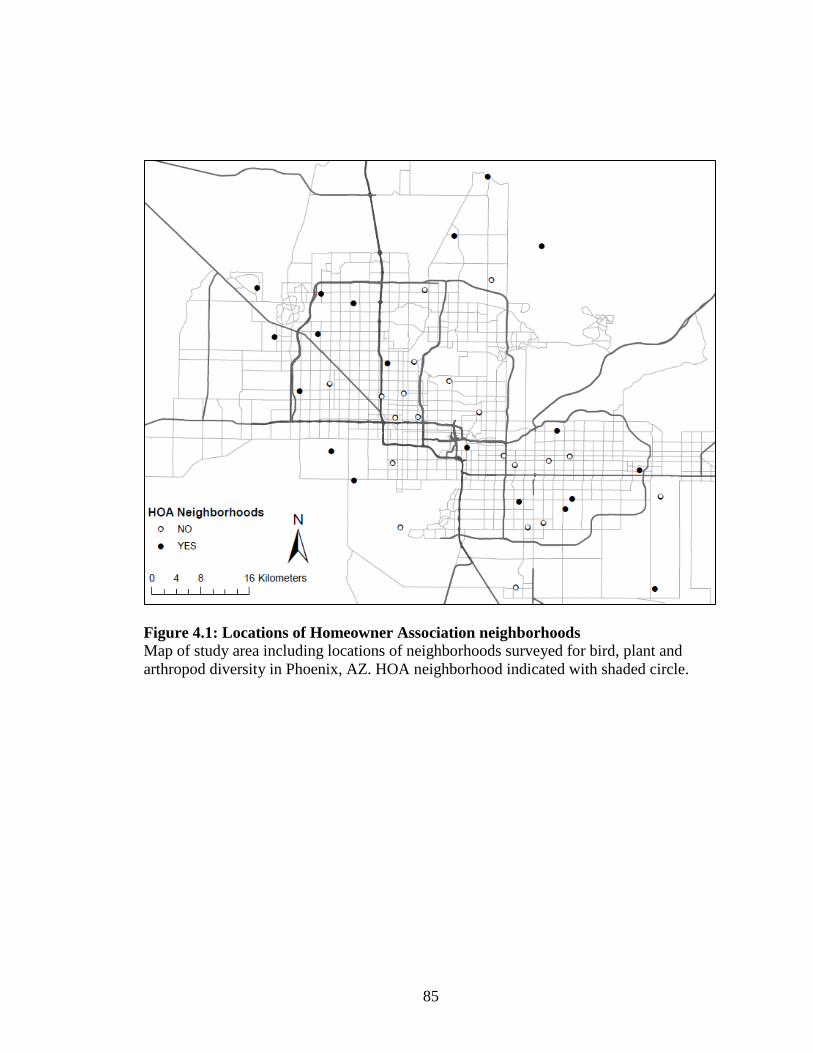
85
Figure 4.1: Locations of Homeowner Association neighborhoods Map of study area including locations of neighborhoods surveyed for bird, plant and arthropod diversity in Phoenix, AZ. HOA neighborhood indicated with shaded circle.
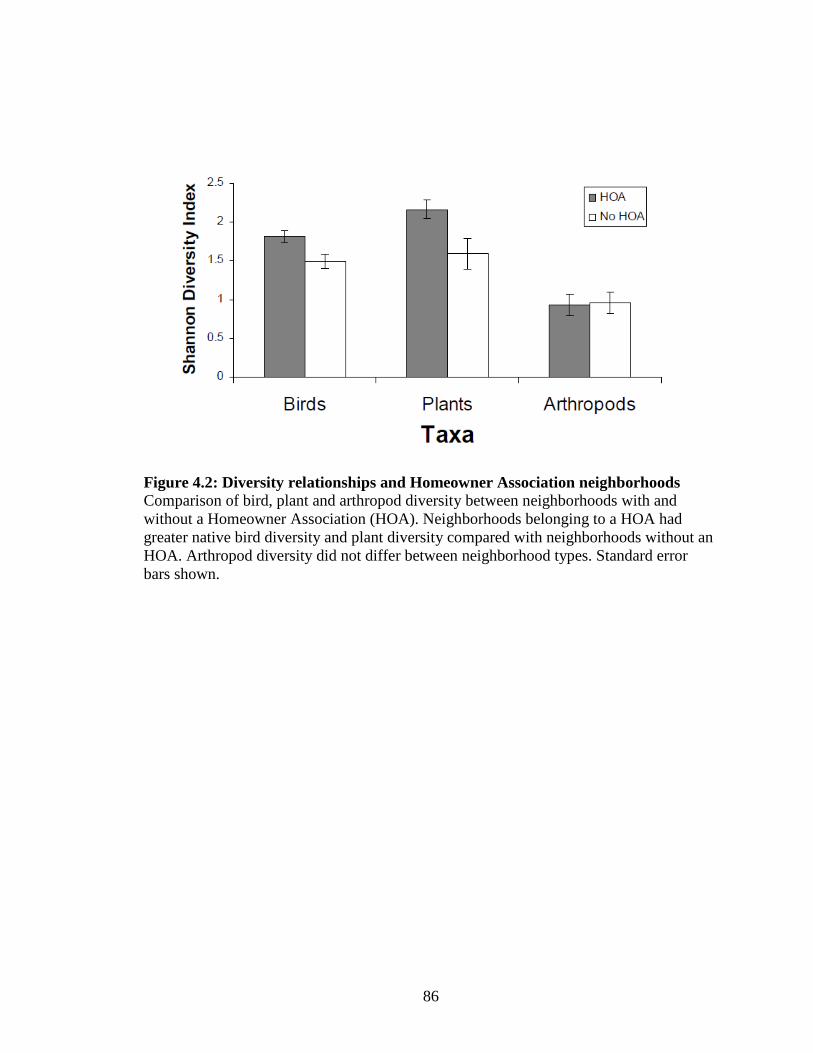
86
Figure 4.2: Diversity relationships and Homeowner Association neighborhoods Comparison of bird, plant and arthropod diversity between neighborhoods with and without a Homeowner Association (HOA). Neighborhoods belonging to a HOA had greater native bird diversity and plant diversity compared with neighborhoods without an HOA. Arthropod diversity did not differ between neighborhood types. Standard error bars shown.
87
Figure 4.3: Covenant Conditions and Restrictions (CCR) for landscaping practices in HOA neighborhoods, Phoenix, AZ.
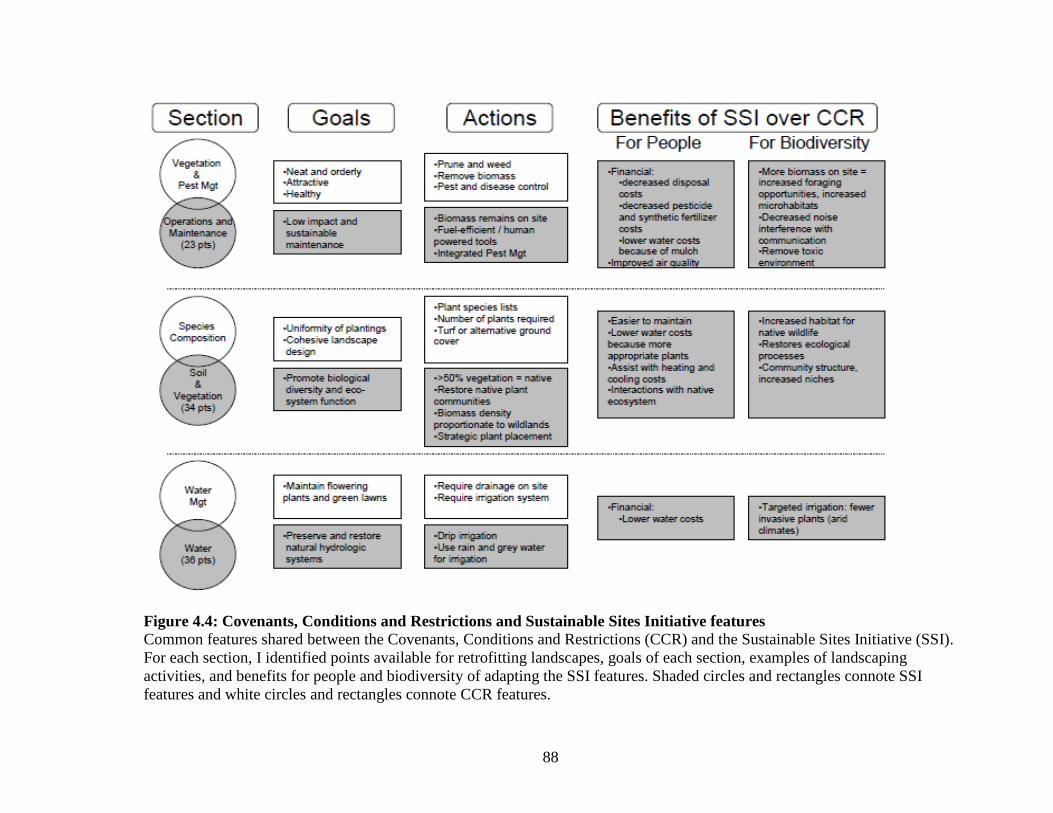
88
Figure 4.4: Covenants, Conditions and Restrictions and Sustainable Sites Initiative features Common features shared between the Covenants, Conditions and Restrictions (CCR) and the Sustainable Sites Initiative (SSI). For each section, I identified points available for retrofitting landscapes, goals of each section, examples of landscaping activities, and benefits for people and biodiversity of adapting the SSI features. Shaded circles and rectangles connote SSI features and white circles and rectangles connote CCR features.
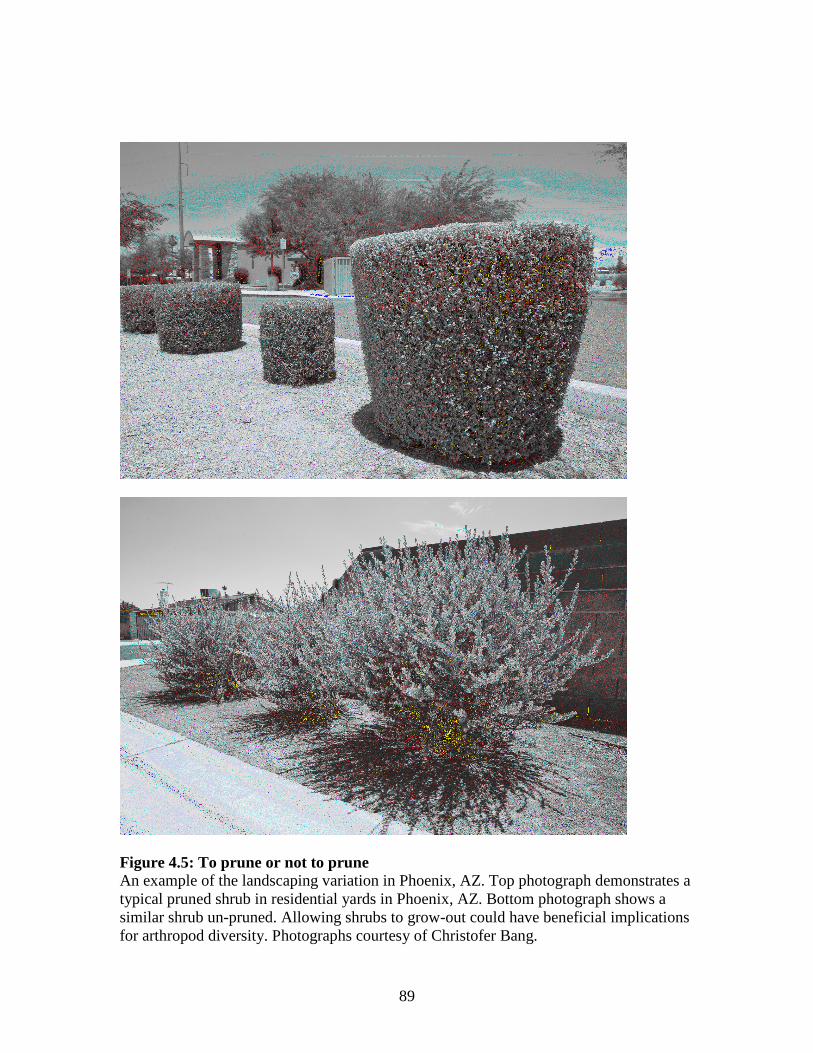
89
Figure 4.5: To prune or not to prune An example of the landscaping variation in Phoenix, AZ. Top photograph demonstrates a typical pruned shrub in residential yards in Phoenix, AZ. Bottom photograph shows a similar shrub un-pruned. Allowing shrubs to grow-out could have beneficial implications for arthropod diversity. Photographs courtesy of Christofer Bang.
90
BIBLIOGRAPHY
Adams, C. C. 1935. The Relation of General Ecology to Human Ecology. Ecology 16:316-335.
Arendt, R. 1996. Conservation design for subdivisions: a practical guide to creating open
space networks. Island Press. Arizona State Senate Issue Brief. 2010. Homeowners Association. Available from
http://www.azleg.state.az.us/briefs/Senate/HOMEOWNERS%20ASSOCIATIONS.pdf (accessed December 2010).
Beissinger, S. R. and D. R. Osborne. 1982. Effects of urbanization on avian community
organization. Condor 84:75-83. Ben-Joseph, E. 2004. Double standards, single goal: private communities and design
innovation. Journal of Urban Design 9:131-151. Blair, R. B. 1996. Land use and avian species diversity along an urban gradient.
Ecological Applications 6:506-519. Bolger, D. T., T. A. Scott, and J. T. Rotenberry. 1997. Breeding bird abundance in an
urbanizing landscape in coastal southern California. Conservation Biology 11:406-421.
Borcard, D., P. Legendre, and P. Drapeau. 1992. Partialling out the Spatial Component of
Ecological Variation. Ecology 73:1045-1055. Bormann, F. H., D. Balmori, and G. T. Geballe. 2001. Redesigning the American lawn: a
search for environmental harmony. Yale University Press Bowers, M.A., and B. Breland. 1996. Foraging of gray squirrels on an urban-rural
gradient: Use of the GUD to assess anthropogenic impact. Ecological Applications 6:1135-1142.
Boxall, P. C., and B. L. McFarlane. 1995. Analysis of Discrete, Dependent Variables in
Human Dimensions Research: Participation in Residential Wildlife Appreciation. Wildlife Society Bulletin 23:283-289.
Brown, J. S. 1988. Patch use as an indicator of habitat preference, predation risk, and
competition. Behavioral Ecology and Sociobiology 22:37-47. Buchholz, R. 2007. Behavioural biology: an effective and relevant conservation tool.
Trends in Ecology & Evolution 22:401-407.
91
Burghardt, K. T., D. W. Tallamy, and W. G. Shriver. 2009. Impact of Native Plants on Bird and Butterfly Biodiversity in Suburban Landscapes. Conservation Biology 23:219-224.
Cannon, A. 1999. The significance of private gardens for bird conservation. Bird
Conservation International 9:287-297. Chace, J. F., and J. J. Walsh. 2006. Urban effects on native avifauna: a review. Landscape
and Urban Planning 74:46-69. Chamberlain, D. E., A. R. Cannon, and M. P. Toms. 2004. Associations of garden birds
with gradients in garden habitat and local habitat. Ecography 27:589-600. Charnov, E. L. 1976. Optimal foraging theory: the marginal value theorem. Theoretical
Population Biology 9:129-136. Chiron, F., and R. Julliard. 2007. Responses of songbirds to magpie reduction in an urban
habitat. Journal of Wildlife Management 71:2624-2631. Coleman, E. A., and B. C. Steed. 2009. Monitoring and sanctioning in the commons: An
application to forestry. Ecological Economics 68:2106-2113. Community Associations Institute. 2009. Available from
http://www.caionline.org/about/press/Pages/nationalresearch.aspx (accessed December 2010).
Connell, J. H. 1978. Diversity in tropical rain forests and coral reefs – high diversity of
trees and corals is maintained only in a non-equilibrium state. Science 199:1302-1310.
Connor, E. F., and E. D. McCoy. 1979. Statistics and biology of the species-area
relationship. American Naturalist 113:791-833. Cooper, C.B., J. Dickinson, T. Phillips, and R. Bonney. 2007. Citizen science as a tool for
conservation in residential ecosystems. Ecology and Society 12. Croci, S., A. Butet, and P. Clergeau. 2008. Does urbanization filter birds on the basis of their biological traits? Condor 110:223-240.
Crooks, K. R., A. V. Suarez, and D. T. Bolger. 2004. Avian assemblages along a gradient
of urbanization in a highly fragmented landscape. Biological Conservation 115:451-462.
Czech, B., P.R. Krausman, and P.K. Devers. 2000. Economic associations among causes
of species endangerment in the United States. BioScience 50:593-601.
92
Daniels, G. D., and J. B. Kirkpatrick. 2006. Does variation in garden characteristics influence the conservation of birds in suburbia? Biological Conservation 133:326-335.
Department of Fish and Game. 2010. What is a Problem Animal Control Agent?
MassWildlife Massachusetts Division of Fisheries & Wildlife. Available from http://www.mass.gov/dfwele/dfw/wildlife/pac/pac_agent_process.htm (accessed May 2011).
DeStefano, S., and R. M. DeGraaf. 2003. Exploring the ecology of suburban wildlife.
Frontiers in Ecology and the Environment 1:95-101. Donnelly, R., and J. M. Marzluff. 2004. Importance of reserve size and landscape context
to urban bird conservation. Conservation Biology 18:733-745. Emlen, J. T. 1974. Urban bird community in Tucson, Arizona - derivation, structure,
regulation. Condor 76:184-197. ESRI. 2006. ArcMap 9.2. ESRI, Redlands, California, USA. Evans, K. L., S. E. Newson, and K. J. Gaston. 2009. Habitat influences on urban avian
assemblages. Ibis 151:19-39. Faeth, S. H., C. Bang, and S. Saari. 2011. Urban biodiversity: patterns and mechanisms.
Annals of the New York Academy of Sciences 1223:69-81. Fokidis, H.B. 2011. Homeowners associations: Friend or foe to native desert avifauna?
Conservation concerns and opportunities for research. Journal of Arid Environments 75:394-396.
Folkner J. S. 1958. Landscaping Arizona Homes. Tucson, AZ: University of Arizona,
Agriculture Experimental Station. Franzese, P. A. 2005. Privatization and Its Discontents: Common Interest Communities
and the Rise of Government for "the Nice". Urban Lawyer 37:335-357. Fretwell, S. D. and H. L. Lucas. 1969. On territorial behavior and other factors
influencing habitat distribution in birds. I. Theoretical development. Acta Biotheoretica 19:16-36.
Fuller, R.A., K.N. Irvine, P. Devine-Wright, P.H. Warren, and K.J. Gaston. 2007.
Psychological benefits of greenspace increase with biodiversity. Biology Letters 3:390-394.
93
Fuller, R. A., P. H. Warren, P. R. Armsworth, O. Barbosa, and K. J. Gaston. 2008. Garden bird feeding predicts the structure of urban avian assemblages. Diversity and Distributions 14:131-137.
Gammage, G. 1999. Phoenix in perspective: reflection on developing the desert.
Herberger Center for Design Excellence, Tempe, AZ, USA. Gaston, K. J., P. H. Warren, K. Thompson, and R. M. Smith. 2005. Urban domestic
gardens (IV): The extent of the resource and its associated features. Biodiversity and Conservation 14:3327-3349.
Germaine, S. S., S. S. Rosenstock, R. E. Schweinsburg, and W. S. Richardson. 1998.
Relationships among breeding birds, habitat, and residential development in Greater Tucson, Arizona. Ecological Applications 8:680-691.
Gering, J. C., and R. B. Blair. 1999. Predation on artificial bird nests along an urban
gradient: predatory risk or relaxation in urban environments? Ecography 22:532-541.
Goddard, M. A., A. J. Dougill, and T. G. Benton. 2010. Scaling up from gardens:
biodiversity conservation in urban environments. Trends in Ecology & Evolution 25:90-98.
Green, D. A., and M. G. Baker. 2003. Urbanization impacts on habitat and bird
communities in a Sonoran desert ecosystem. Landscape and Urban Planning 63:225-239.
Greenberg, R., P. Bichier, A. Cruz-Angon, and R. Reitsma. 1997. Bird populations in
shade and sun coffee plantations in central Guatemala. Conservation Biology 11:448-459.
Grimm, N. B., and C. L. Redman. 2004. Approaches to the study of urban ecosystems:
The case of central Arizona-Phoenix. Urban Ecosystems 7:199-213. Grimm, N. B., S. H. Faeth, N. E. Golubiewski, C. L. Redman, J. Wu, X. Bai, and J. M.
Briggs. 2008. Global change and the ecology of cities. Science 319:756. Grove, J. M., A. R. Troy, J. P. M. O'Neil-Dunne, W. R. Burch, M. L. Cadenasso, and S.
T. A. Pickett. 2006. Characterization of households and its implications for the vegetation of urban ecosystems. Ecosystems 9:578-597.
Hansen, A. J., R. L. Knight, J. M. Marzluff, S. Powell, K. Brown, P. H. Gude, and A.
Jones. 2005. Effects of exurban development on biodiversity: Patterns, mechanisms, and research needs. Ecological Applications 15:1893-1905.
94
Hanula, J. L., D. D. Wade, J. O'Brien, and S. C. Loeb. 2009. Ground-dwelling arthropod association with coarse woody debris following long-term dormant season prescribed burning in the longleaf pine flatwoods of north Florida. Florida Entomologist 92:229-242.
Hardy, J., B. K. Behe, S. S. Barton, T. J. Page, R. E. Schutzki, K. Muzii, R. T. Fernandez,
M. T. Haque, J. Brooker, C. R. Hall, and others. 2000. Consumers preferences for plant size, type of plant material and design sophistication in residential landscaping. Journal of Environmental Horticulture 18:224–229.
Harlan, S. L., S.T. Yabiku, L. Larsen, A.J. Brazel. 2009. Household water consumption
in an arid city: Affluence, affordance, and attitudes. Society and Natural Resources 22:691-709.
Hepinstall, J., M. Alberti, and J. Marzluff. 2008. Predicting land cover change and avian
community responses in rapidly urbanizing environments. Landscape Ecology 23:1257-1276.
Hope, A. C. A. 1968. A Simplified Monte Carlo Significance Test Procedure. Journal of
the Royal Statistical Society Series B-Statistical Methodology 30:582-&. Hope, D., C. Gries, W. X. Zhu, W. F. Fagan, C. L. Redman, N. B. Grimm, A. L. Nelson,
C. Martin, and A. Kinzig. 2003. Socioeconomics drive urban plant diversity. Proceedings of the National Academy of Sciences of the United States of America 100:8788-8792.
Horowitz, P., Lindsay M., O'Connor M. 2001. Biodiversity, endemism, sense of place,
and public health: Inter-relationships for Australian inland aquatic systems. Ecosystem Health 7:253-265
Hostetler, M., and D. Drake. 2009. Conservation subdivisions: A wildlife perspective.
Landscape and Urban Planning 90:95–101. Hough, M. 1995. Cities and natural process. Routledge London. Jenerette, G. D., S. L. Harlan, A. Brazel, N. Jones, L. Larsen, and W. L. Stefanov. 2007.
Regional relationships between surface temperature, vegetation, and human settlement in a rapidly urbanizing ecosystem. Landscape Ecology 22:353-365.
Kaplan, R., and J. F. Talbot. 1988. Ethnicity and preference for natural settings: a review
and recent findings. Landscape and Urban Planning 15:107-117. Kent, R. L. 1993. Attributes, features and reasons for enjoyment of scenic routes: a
comparison of experts, residents and citizens. Landscape Res. 18:92-102.
95
Kinzig, A., P. S. Warren, C. Martin, D. Hope, and M. Katti. 2005. The effects of human socioeconomic status and cultural charactersitics on urban patterns of biodiversity. Ecology and Society 10:23. [online] URL: http://www.ecologyandsociety.org/vol10/iss1/art23/.
Kirkpatrick, J. B., G. D. Daniels, and T. Zagorski. 2007. Explaining variation in front
gardens between suburbs of Hobart, Tasmania, Australia. Landscape and Urban Planning 79:314-322.
Kohlmann, S. G., and K. L. Risenhoover. 1996. Using artificial food patches to evaluate
habitat quality for granivorous birds: An application of foraging theory. Condor 98:854-857.
Kotler, B., J. Brown, S. Mukherjee, O. Berger-Tal, and A. Bouskila. 2010. Moonlight
avoidance in gerbils reveals a sophisticated interplay among time allocation, vigilance and state-dependent foraging. Proceedings of the Royal Society B-Biological Sciences 277:1469-1474.
Kotler, B. P., J. S. Brown, and W. A. Mitchell. 1994. The role of predation in shaping the
behavior, morphology and community organization of desert rodents. Australian Journal of Zoology 42:449-466.
Kotler, B. P., D W. Morris, and J. S. Brown. 2007. Behavioral indicators and
conservation: Wielding "the biologist's tricorder". Israel Journal of Ecology & Evolution 53:237-244.
LaCour-Little, M., and S. Malpezzi. 2001. Gated communities and property values.
American Real Estate and Urban Economic Association's Meeting, Washington, DC.
Larsen, L., and S. L. Harlan. 2006. Desert dreamscapes: Residential landscape preference
and behavior. Landscape and Urban Planning 78:85-100. Larson, K. L., D. Casagrande, S. L. Harlan, and S. T. Yabiku. 2009. Residents’ Yard
Choices and Rationales in a Desert City: Social Priorities, Ecological Impacts, and Decision Tradeoffs. Environmental Management 44:921-937.
Legendre, P., and E. D. Gallagher. 2001. Ecologically meaningful transformations for
ordination of species data. Oecologia 129:271-280. Lepczyk, C. A., A. G. Mertig, and J. G. Liu. 2004. Assessing landowner activities related
to birds across rural-to-urban landscapes. Environmental Management 33:110-125.
96
Lepczyk, C. A., P. S. Warren, L. Machabee, A. P. Kinzig, and A. G. Mertig. Who feeds the birds? An urban comparison between Phoenix, Arizona and Southeastern Michigan. Studies in Avian Biology. In press.
Lerman, S. B. and P. S. Warren. 2011. The conservation value of residential landscapes:
linking birds and people. Ecological Applications 21:1327-1339. Leston, L. F. V., and A. D. Rodewald. 2006. Are urban forests ecological traps for
understory birds? An examination using Northern cardinals. Biological Conservation 131:566-574.
Lima, S. L. 1990. Protective cover and the use of space – different strategies in finches.
Oikos 58:151-158. Lima, S. L., and P. A. Bednekoff. 1999. Temporal variation in danger drives antipredator
behavior: The predation risk allocation hypothesis. American Naturalist 153:649-659.
Logan J. and Molotch H. 1987. Urban fortunes: The urban economy of place. University
of California Press, Berkley. Loss, S. R., M. O. Ruiz, and J. D. Brawn. 2009. Relationships between avian diversity,
neighborhood age, income, and environmental characteristics of an urban landscape. Biological Conservation 142:2578-2585.
Louv, R. 2008. Last child in the woods: Saving our children from nature-deficit disorder.
Algonquin Books. Luck, G. W., and L. T. Smallbone. 2011. The impact of urbanization on taxonomic and
functional similarity among bird communities. Journal of Biogeography 38:894-906.
Major, R.E., G. Gowing, and C. E. Kendal. 1996. Nest predation in Australian urban
environments and the role of the pied currawong, Strepera graculina. Australian Journal of Ecology 21:399-409.
Martin, C. A. 2001. Landscape water use in Phoenix, Arizona. Desert Plants 17:26-31. Martin, C. A., K. A. Peterson, and L. B. Stabler. 2003. Residential landscaping in
Phoenix, Arizona, U.S.: practices and preferences relative to covenants, codes, and restrictions. Journal of Arboriculture 29:9-17.
Martin, C. A., P. S. Warren, and A. P. Kinzig. 2004. Neighborhood socioeconomic status
is a useful predictor of perennial landscape vegetation in residential neighborhoods and embedded small parks of Phoenix, AZ. Landscape and Urban Planning 69:355-368.
97
Marzluff, J. M. 2001. Worldwide urbanization and its effects on birds. Pages 19-38 in J.
M. Marzluff, R. Bowman, and R. Donnelly, editors. Avian ecology and conservation in an urbanizing world. Kluwer, Boston.
Marzluff, J. M. 2005. Island biogeography for an urbanizing world: how extinction and
colonization may determine biological diversity in human-dominated landscapes. Urban Ecosystems 8:157-177.McCune, B., and J. B. Grace. 2002. Analysis of Ecological Communities. MjM Software Design, Gleneden Beach, OR.
McCabe, B.C. 2005. The Rules are Different Here: An Institutional Comparison of Cities
and Homeowner Associations. Administration and Society 37:404-425. McCune, B., and J. B. Grace. 2002. Analysis of ecological communities. MjM Software
Design Gleneden Beach, OR. McGarigal, K., S. Cushman, and S. Stafford. 2000. Multivariate Statistics for Wildlife
and Ecology Research. Springer, New York, NY. McKenzie, E. 1996. Privatopia: Homeowner associations and the rise of residential
private government. Yale University Press, New Haven, CT. McKenzie, E. 1998. Homeowner associations and California politics; an exploratory
analysis. Urban Affairs Review 34:52-76. McKenzie, E. 2003. Common-interest housing in the communities of tomorrow. Housing
Policy Debate 14: 203-234. McKinney, M. L. 2002. Urbanization, biodiversity, and conservation. Bioscience 52:883-
890. McKinney, M. L. 2006. Urbanization as a major cause of biotic homogenization.
Biological Conservation 127:247-260. McPherson, E. G., and R. A. Haip. 1989. Emerging Desert Landscape in Tucson.
Geographical Review 79:435-449. Melles, S. 2005. Urban bird diversity as an indicator of human social diversity and
economic inequality in Vancouver, British Columbia. Urban Habitats 3:25-48. Mennechez, G. and P. Clergeau. 2001. Settlement of breeding European starlings in
urban areas: importance of lawns vs. anthropogenic wastes. Pages 275-288 in J. M. Marzluff, R. Bowman, and R. Donnelly, editors. Avian ecology and conservation in an urbanizing world. Kluwer, Boston.
98
Milder, J. C. 2007. A framework for understanding conservation development and its ecological implications. BioScience 57:757-768.
Miller, J. R. 2005. Biodiversity conservation and the extinction of experience. Trends in
Ecology & Evolution 20:430-434. Mills, G. S., J. B. Dunning, and J. M. Bates. 1989. Effects of urbanization on breeding
bird community structure in southwestern desert habitats. Condor 91:416-428. Morris, D. W. and D. L. Davidson. 2000. Optimally foraging mice match patch use with
habitat differences in fitness. Ecology 81:2061-2066. Morris, J., and J. Bagby. 2007. Measuring environmental value for Natural Lawn and
Garden Care practices. The International Journal of Life Cycle Assessment 13:226-234.
Mueller, A. and A. J. Mueller. 2004. Inca Dove (Columbina inca), The Birds of North
America Online (A. Poole, Ed.). Ithaca: Cornell Lab of Ornithology; Retrieved from the Birds of North America Online: http://bna.birds.cornell.edu/bna/species/028
Munyenyembe, F., J. Harris, J. Hone, and H. Nix. 1989. Determinants of bird populations
in an urban area. Australian Journal of Ecology 14:549-557. Nassauer, J. I. 1995. Messy ecosystems, orderly frames. Landscape Journal 14:161–170. Oksanen, J., R. Kindt, P. Legendre, B. O'Hara, G. L. Simpson, P. Solymos, M. H. H.
Stevens and H. Wagner. 2009. vegan: Community Ecology Package. R package version 1.15-4. http://CRAN.R-project.org/package=vegan
Olsson, O., U. Wiktander, N. M. A. Holmgren, and S. G. Nilsson. 1999. Gaining
ecological information about Bayesian foragers through their behaviour. II. A field test with woodpeckers. Oikos 87:264-276.
Olsson, O., J. S. Brown, and H. G. Smith. 2002. Long- and short-term state-dependent
foraging under predation risk: an indication of habitat quality. Animal Behaviour 63:981-989.
Olsson, O., and M. N. Molokwu. 2007. On the missed opportunity cost, GUD, and
estimating environmental quality. Israel Journal of Ecology & Evolution 53:263-278.
Ostrom, E., and H. Nagendra. 2006. Insights on linking forests, trees, and people from the
air, on the ground, and in the laboratory. Proceedings of the National Academy of Sciences of the United States of America 103:19224-19231.
99
Ostrom, E. 2009. A General Framework for Analyzing Sustainability of Social-Ecological Systems. Science 325:419-422.
Oyugi, J. O., and J. S. Brown. 2003. Giving-up densities and habitat preferences of
European starlings and American robins. The Condor 105:130. Pagdee, A., Y.S. Kim, and P.J. Daugherty. 2006. What makes community forest
management successful: A meta-study from community forests throughout the world. Society & Natural Resources 19:33-52.
Palomino, D., and L. M. Carrascal. 2005. Urban influence on birds at a regional scale: A
case study with the avifauna of northern Madrid province. Landscape and Urban Planning 77:276-290.
Papachristos, D. P., and P. G. Milonas. 2008. Adverse effects of soil applied insecticides
on the predatory coccinellid Hippodamia undecimnotata (Coleoptera: Coccinellidae). Biological Control 47:77-81.
Parker, G. E. 1978. Searching for mates. Pages 214-244 in J.R. Krebs and N.B. Davies,
editors. Behavioral ecology: an evolutionary approach. Sinauer, Sunderland, MA, USA.
Pejchar, L., P. M. Morgan, M. R. Caldwell, C. Palmer, and G. C. Daily. 2007. Evaluating
the potential for conservation development: biophysical, economic, and institutional perspectives. Conservation Biology 21:69-78.
Pike, M.A. 2009. Green building red-lighted by Homeowners’ Associations. William and
Mary Environmental Law and Policy Review 33:923-946. Poling, T. D., and S. E. Hayslette. 2006. Dietary overlap and foraging competition
between mourning doves and Eurasian collared-doves. Journal of Wildlife Management 70:998-1004.Pyle, R. M. 1978. The extinction of experience. Horticulture 56:64-67.
R Development Core Team. 2008. R: A language and environment for statistical
computing. R Foundation for Statistical Computing,Vienna, Austria. http://www.R-project.org
Ralph, C., G. R. Geupel, P. Pyle., T. E. Martin, and D. F. DeSante. 1993. Handbook of
field methods for monitoring landbirds. General Technical Report PSW-GTR-144. Albany, CA.
Reichard, S. H., and P. White. 2001. Horticulture as a pathway of invasive plant
introductions in the United States. BioScience 51:103-113.
100
Relyea, R. A. 2001. Morphological and behavioral plasticity of larval anurans in response to different predators. Ecology 82:523-540.
Rosenberg, K. V., S. B. Terrill, and G. H. Rosenberg. 1987. Value of Suburban Habitats
to Desert Riparian Birds. The Wilson Bulletin 99:642-654. Rosenzweig, M. L. 2003. Win-win Ecology: How the Earth's Species Can Survive in the
Midst of Human Enterprise. Oxford University Press, Oxford. Rudd, H., J. Vala, and V. Schaefer. 2002. Importance of backyard habitat in a
comprehensive biodiversity conservation strategy: A connectivity analysis of urban green spaces. Restoration Ecology 10:368-375.
Savard, J. P. L., P. Clergeau, and G. Mennechez. 2000. Biodiversity concepts and urban
ecosystems. Landscape and Urban Planning 48:131-142. Seddon, G. 1997. Landprints - Reflections on Place and Landscape. Cambridge
University Press, Cambridge. Schmidt, K. A. 1999. Foraging theory as a conceptual framework for studying nest
predation. Oikos 85:151-160. Shochat, E. 2004. Credit or debit? Resource input changes population dynamics of city-
slicker birds. Oikos 106:622-626. Shochat, E., S. B. Lerman, M. Katti, and D. B. Lewis. 2004. Linking optimal foraging
behavior to bird community structure in an urban-desert landscape: Field experiments with artificial food patches. American Naturalist 164:232-243.
Shochat, E., P. S. Warren, S. H. Faeth, N. E. McIntyre, and D. Hope. 2006. From patterns
to emerging processes in mechanistic urban ecology. Trends in Ecology & Evolution 21:186-191.
Shochat, E., S. B. Lerman, J. M. Anderies, P. S. Warren, S. H. Faeth, and C. H. Nilon.
2010. Invasion, Competition, and Biodiversity Loss in Urban Ecosystems. BioScience 60:199-208.
Slabbekoorn, H., and M. Peet. 2003. Birds sing at a higher pitch in urban noise - Great
tits hit the high notes to ensure that their mating calls are heard above the city's din. Nature 424:267-267.
Smith, R. M., K. J. Gaston, P. H. Warren, K. Thompson. 2005. Urban domestic gardens
(V): relationships between landcover composition, housing and landscape. Landscape Ecology 20:235-253.
101
Sol, D., S. Timmermans, and L. Lefebvre. 2002. Behavioural flexibility and invasion success in birds. Animal Behaviour 63:495-502.
Sorace, A. 2002. High density of bird and pest species in urban habitats and the role of
predator abundance. Ornis Fennica 79:60-71. Sousa, J. P., J. V. Vingada, H. Barrocas, and M. M. daGama. 1997. Effects of introduced
exotic tree species on Collembola communities: The importance of management techniques. Pedobiologia 41:145-153.
Stagoll, K., A.D. Manning, E. Knight, J. Fischer, and D.B. Lindenmayer. 2010. Using
bird-habitat relationships to inform urban planning. Landscape and Urban Planning 98:13-25.
Stenberg, M., and A. Persson. 2006. Patch use behaviour in benthic fish depends on their
long-term growth prospects. Oikos 112:332-341. Stephens, D.W. & J.R. Krebs .1986. Foraging Theory. Princeton University Press,
Princeton, NJ. Sustainable Sites Initiative. 2009. Guidelines and Performance Benchmarks. Available
from http://www.sustainablesites.org/report/Guidelines%20and%20Performance%20Benchmarks_2009.pdf (accessed July 2010).
ter Braak, C. J. F. 1986. Canonical Correspondence-Analysis - a New Eigenvector
Technique for Multivariate Direct Gradient Analysis. Ecology 67:1167-1179. Troy, A. R., J. M. Grove, J. P. O’Neil-Dunne, S. T. Pickett, and M. L. Cadenasso. 2007.
Predicting opportunities for greening and patterns of vegetation on private urban lands. Environmental Management 40:394–412.
Turner, W. R., T. Nakamura, and M. Dinetti. 2004. Global urbanization and the
separation of humans from nature. BioScience 54:585-590. Tweit, R. C. and D. M. Finch. 1994. Abert's Towhee (Melozone aberti), The Birds of
North America Online (A. Poole, Ed.). Ithaca: Cornell Lab of Ornithology; Retrieved from the Birds of North America Online: http://bna.birds.cornell.edu/bna/species/111
Tweit, R. C. 1996. Curve-billed Thrasher (Toxostoma curvirostre), The Birds of North
America Online (A. Poole, Ed.). Ithaca: Cornell Lab of Ornithology; Retrieved from the Birds of North America Online: http://bna.birds.cornell.edu/bna/species/235
102
UNFPA. 2007. UNFPA State of World Population 2007: Unleashing the Potential of Urban Growth. United Nations Population Fund.
U.S. Census Bureau. American Factfinder: 2000 Census of population and Housing,
Summary File http://factfinder.census.gov U.S. Department of the Interior, Fish and Wildlife Service, and U.S. Department of
Commerce, Bureau of the Census. 2002. 2001 National Survey of fishing, hunting, and wildlife-associated recreation.
Valone, T. S., and J. S. Brown. 1989. Measuring Patch Assessment Abilities of Desert
Granivores. Ecology 70:1800-1810. Walker, J.S., N.B. Grimm, J.M. Briggs, C. Gries, and L. Dugan. 2009. Effects of
urbanization on plant species diversity in central Arizona. Frontiers in Ecology and the Environment 7:465-470.
Warren, P., M. Katti, M. Ermann, and A. Brazel. 2006. Urban bioacoustics: it's not just
noise. Animal Behaviour 71:491-502. Warren, P. S., S. B. Lerman, and N. D. Charney. 2008. Plants of a feather: Spatial
autocorrelation of gardening practices in suburban neighborhoods. Biological Conservation 141:3-4.
Warren, P. S., S. Harlan, C. Boone, S. B. Lerman, E. Shochat, and A. P. Kinzig. 2010.
Urban ecology and social organization. Pages 172 - 201 in K. Gaston, editor. Urban Ecology, Ecological Reviews series. Cambridge University Press, Cambridge.
Whelan, C. J. and G. G. Maina. 2005. Effects of season, understorey vegetation density,
habitat edge and tree diameter on patch-use by bark-foraging birds. Functional Ecology 19:529-536.
Whittaker, R. H. 1967. Gradient analysis of vegetation. Biological Reviews 42:207–264. Whitney, G. G., and S. D. Adams. 1980. Man as a Maker of New Plant-Communities.
Journal of Applied Ecology 17:431-448. Woods, M., R. A. McDonald, and S. Harris. 2003. Predation of wildlife by domestic cats
Felis catus in Great Britain. Mammal Review 33:174-188. Ziv, Y., Z. Abramsky, B. P. Kotler, and A. Subach. 1993. Interference competition and
temporal and habitat partitioning in 2 gerbil species. Oikos 66:237-246.